A Simplified Water Accounting Procedure to Assess Climate Change Impact on Water Resources for Agriculture across Different European River Basins

 , , , , , , ,
Abstract
:1. Introduction
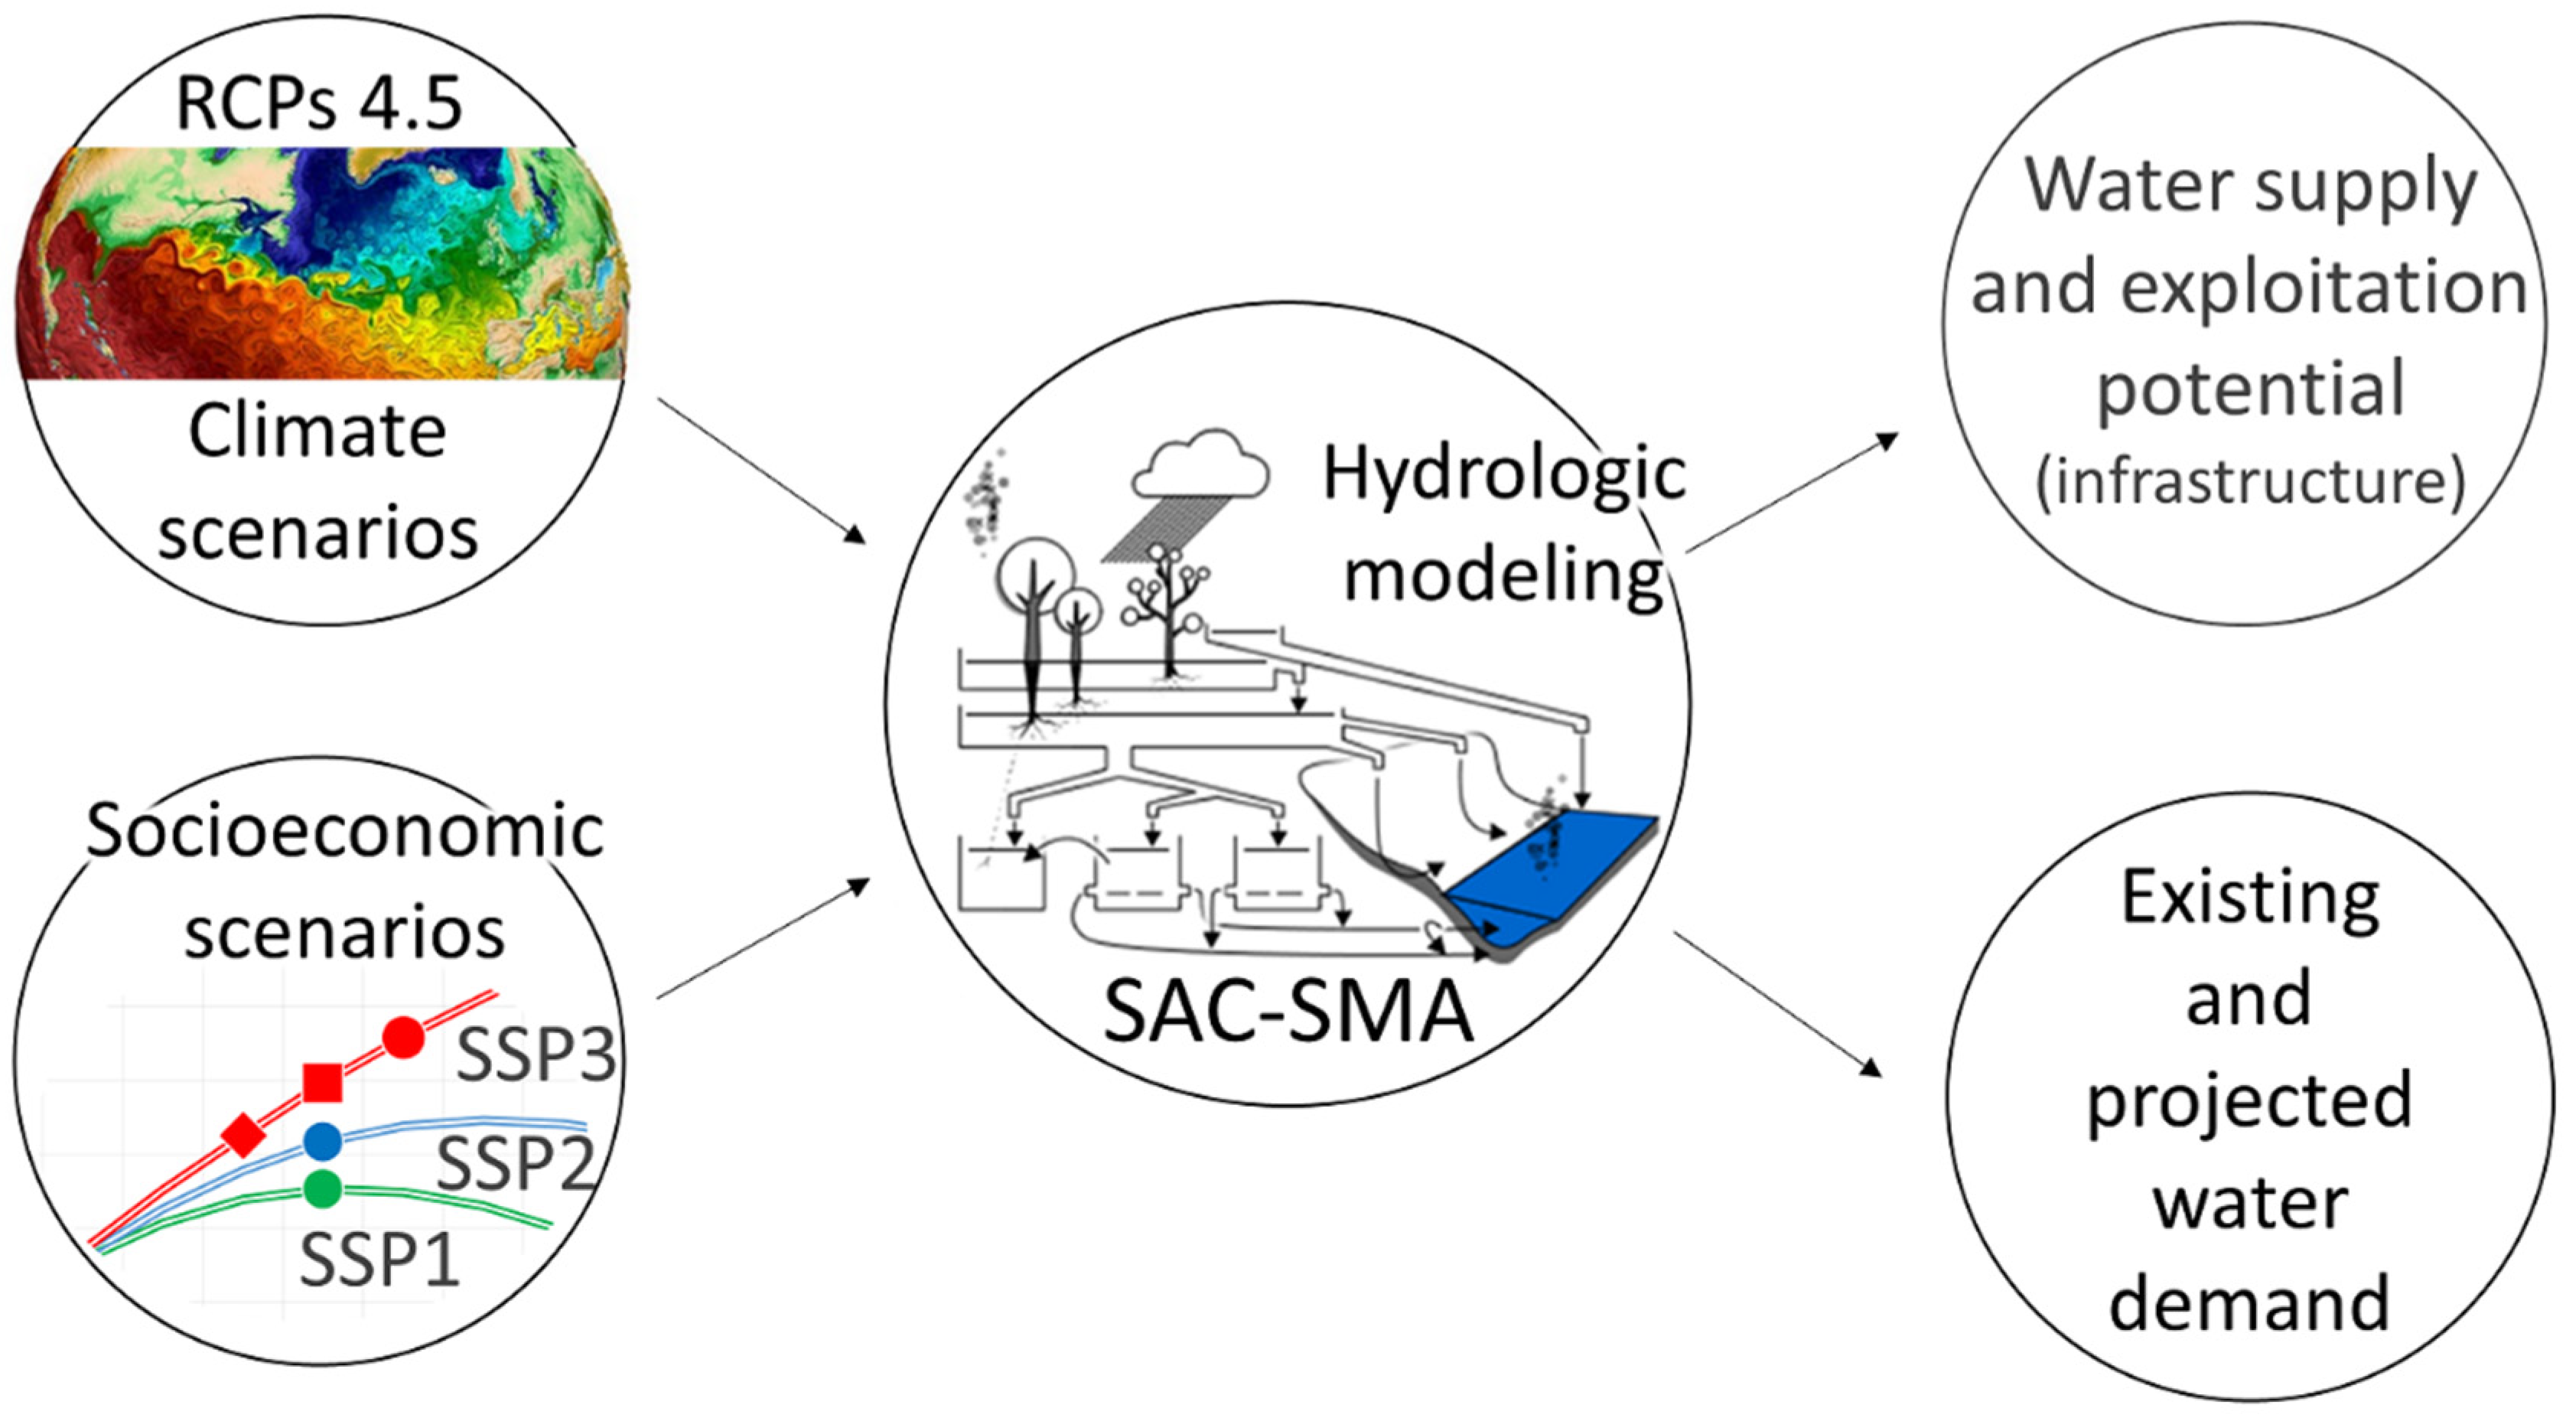
2. Materials and Methods
2.1. The Water Accounting Framework
- Protected natural area (PNA)
- Non-protected natural area (NNA)
- Rainfed cropland (RC)
- Irrigated cropland (IC)
- Other managed water use (industry, services, households) (OMW)
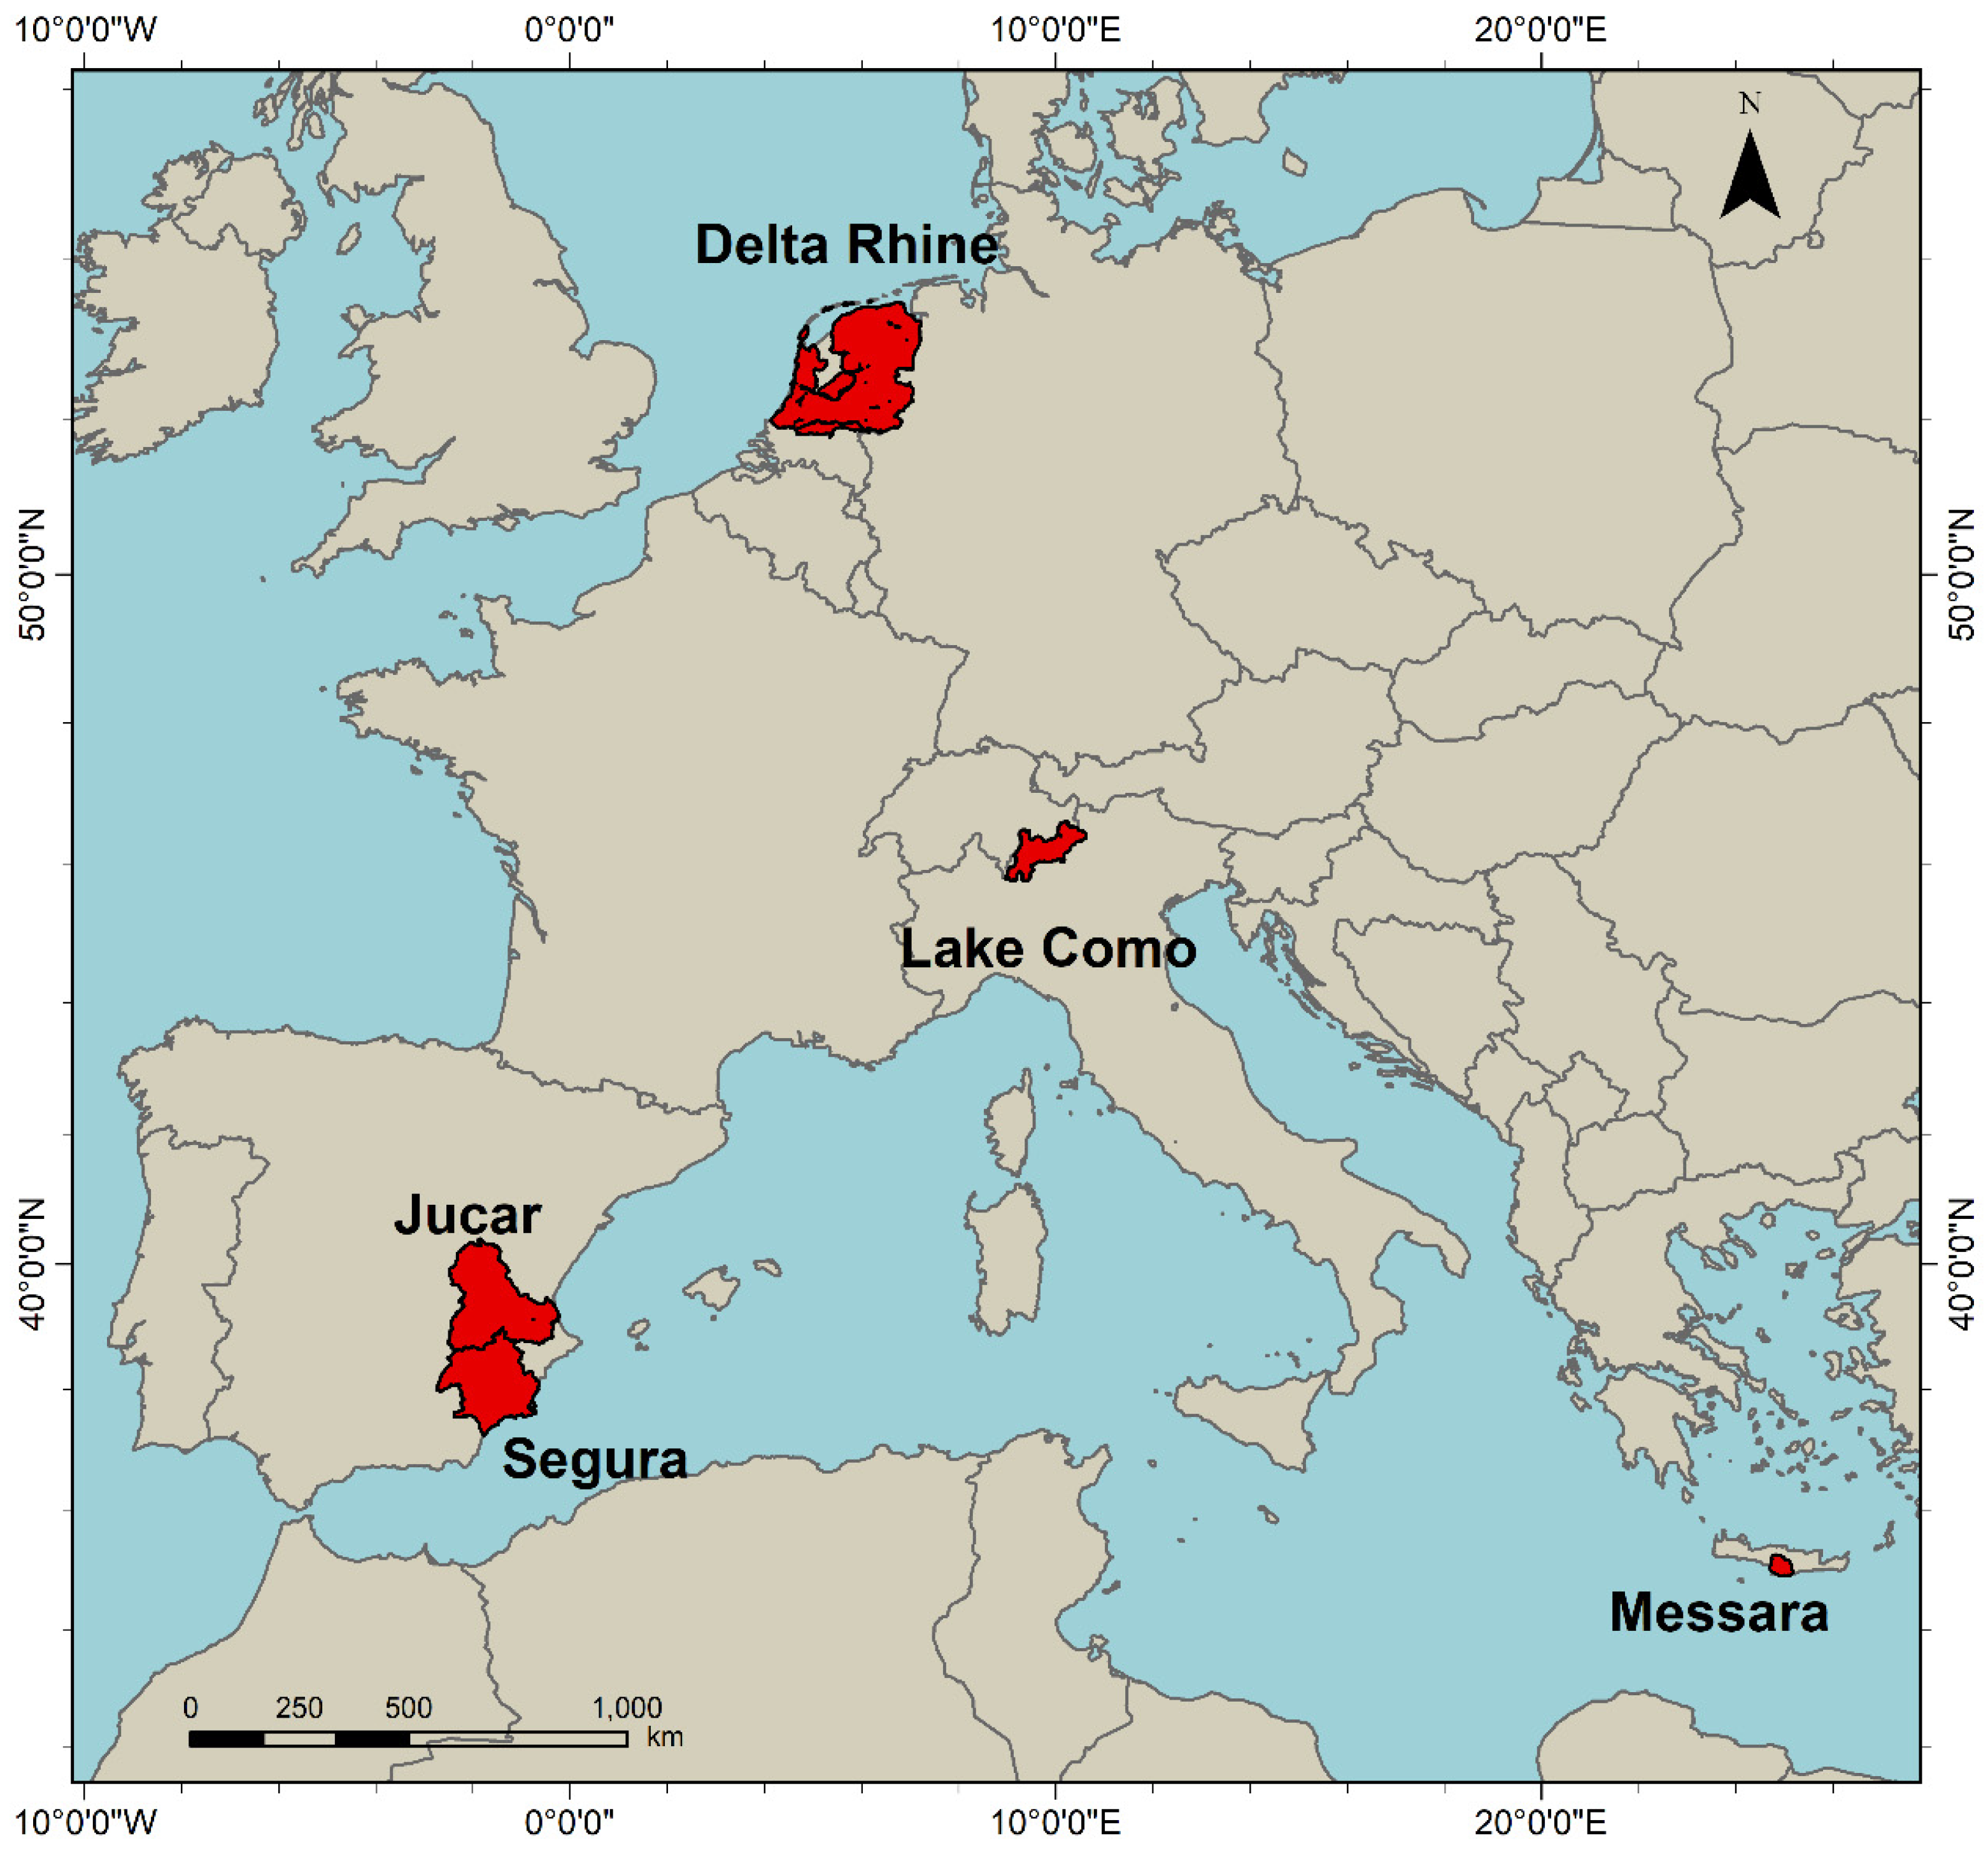
2.2. Case Study Approaches for Five River Basins
2.3. Future Horizons and Projections
- Historic baseline (BL): 1980–2015
- Near-future (NF): 2030–2060
- Far future (FF): 2080–2100
2.4. Indicators
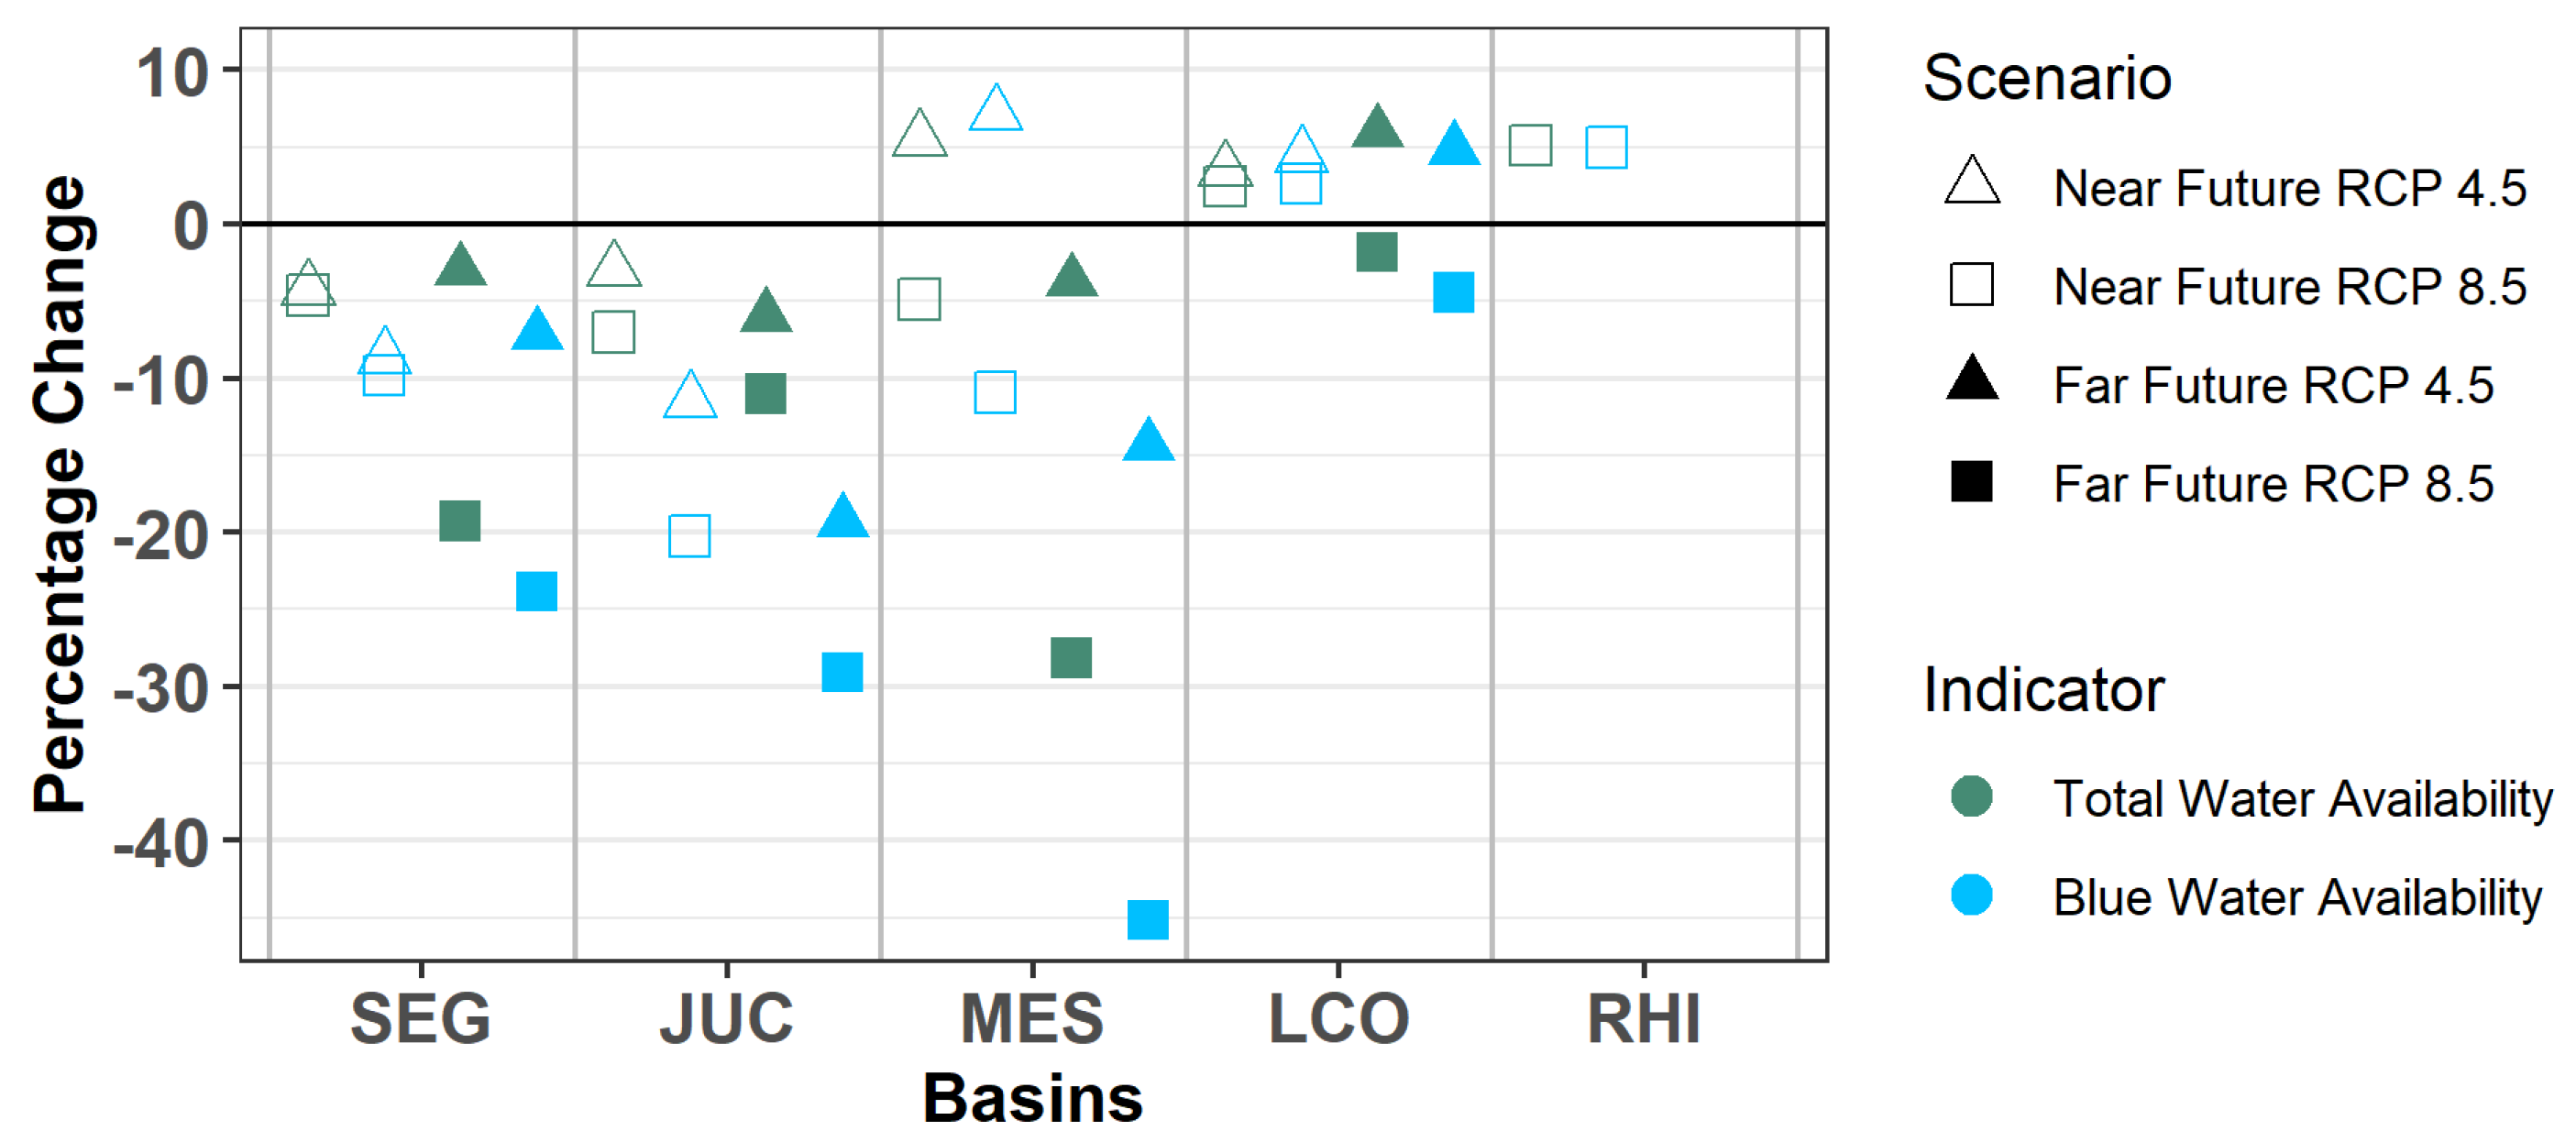
- Green water availability and blue water availability: Relative change compared to the baseline period.
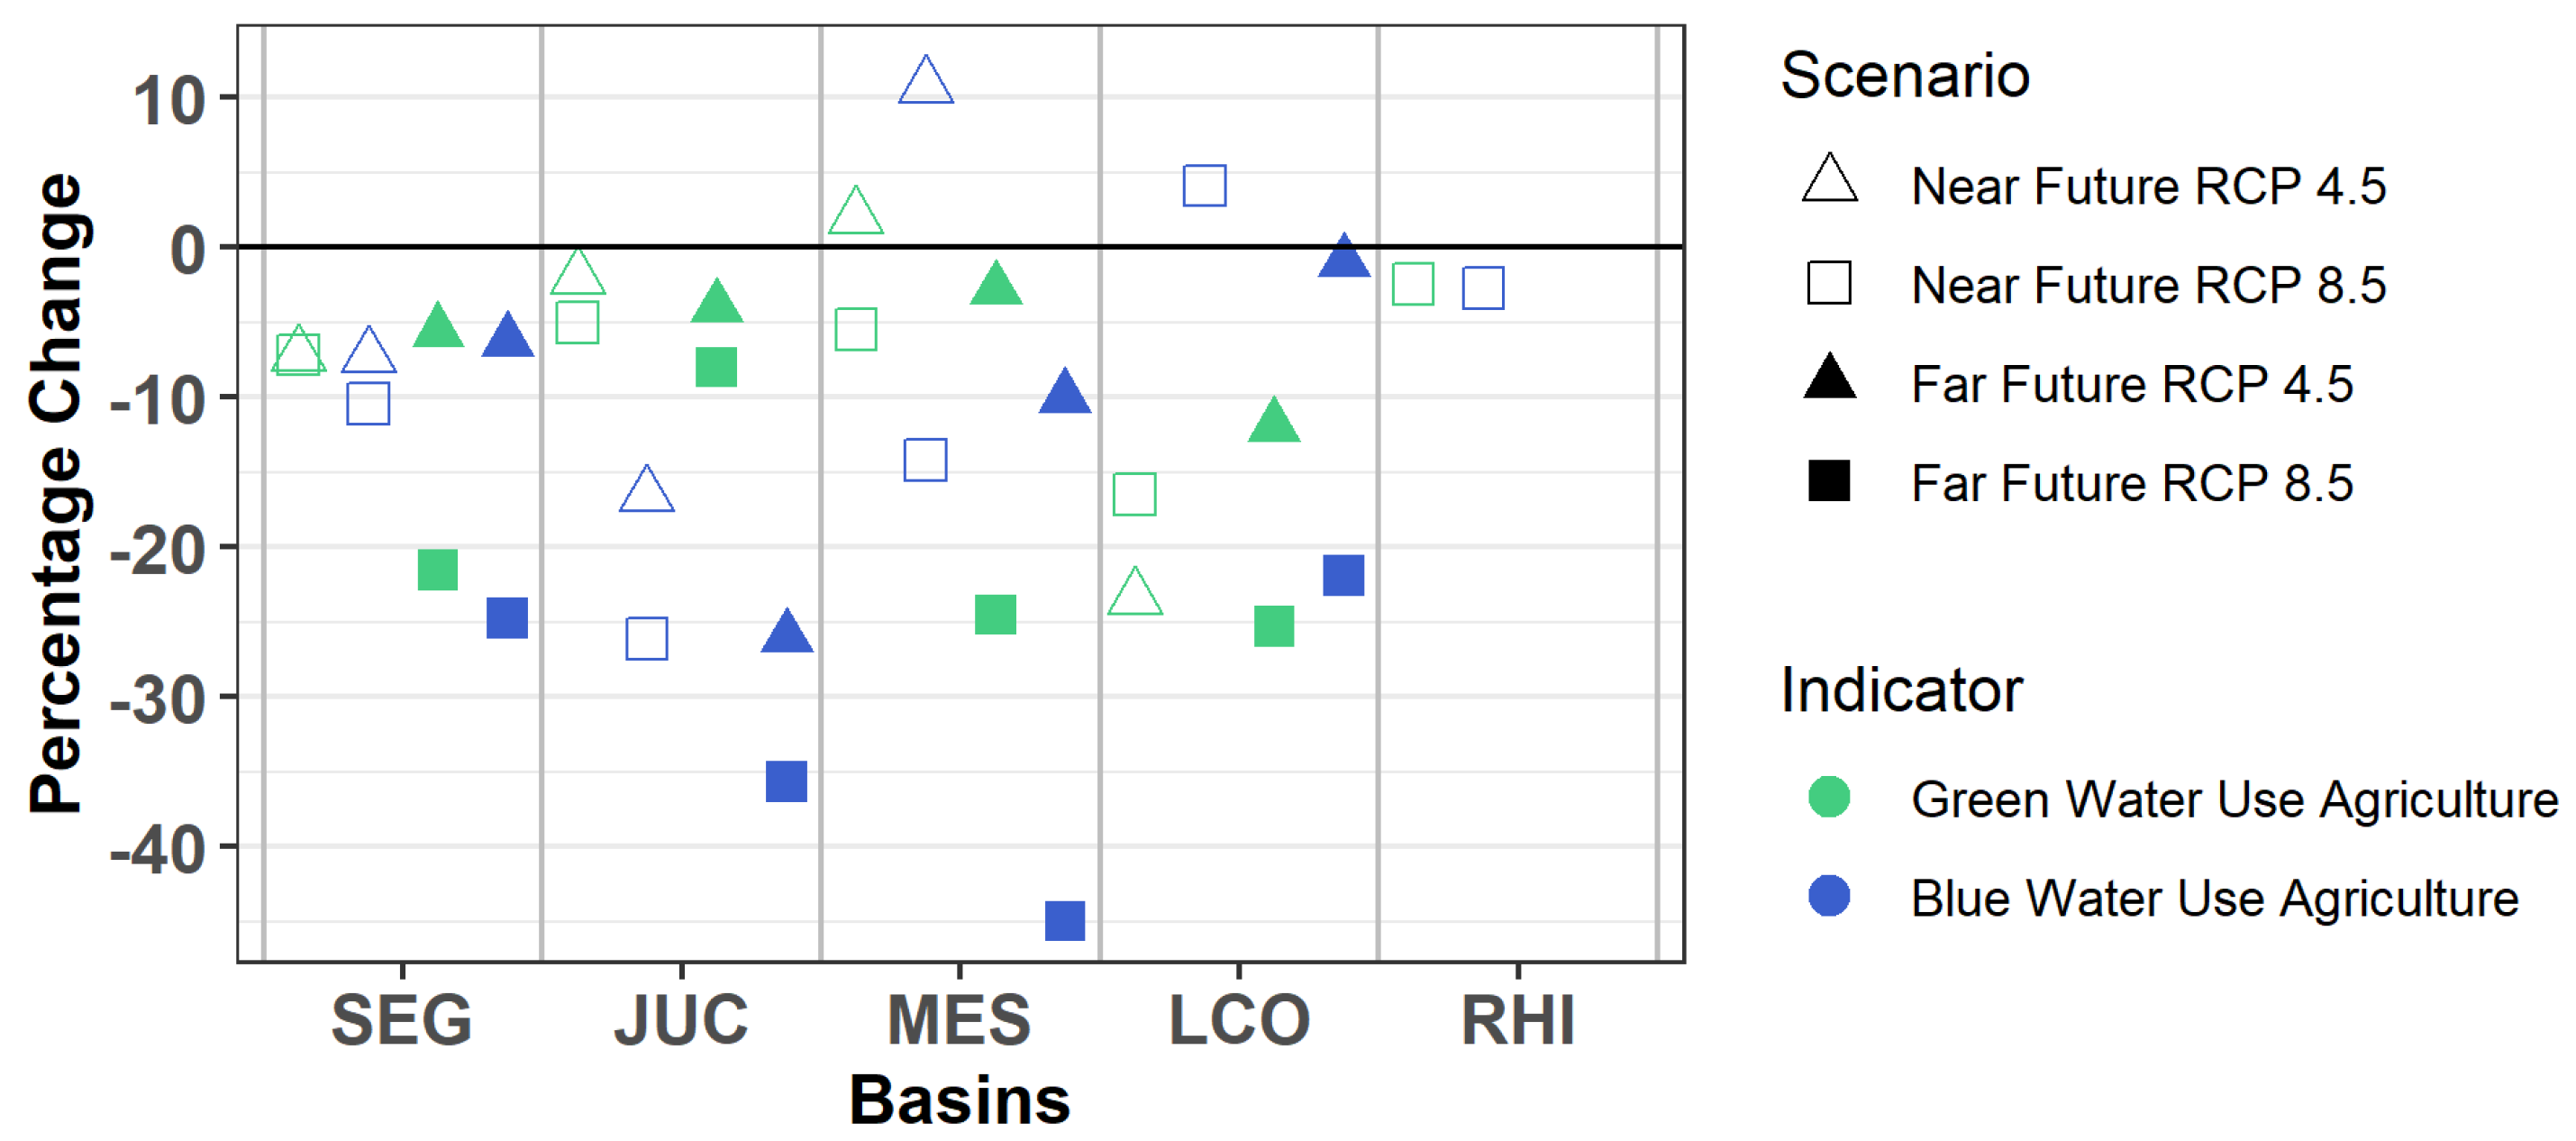
- Green water use for agriculture and blue water use for agriculture: Relative change compared to the baseline period.
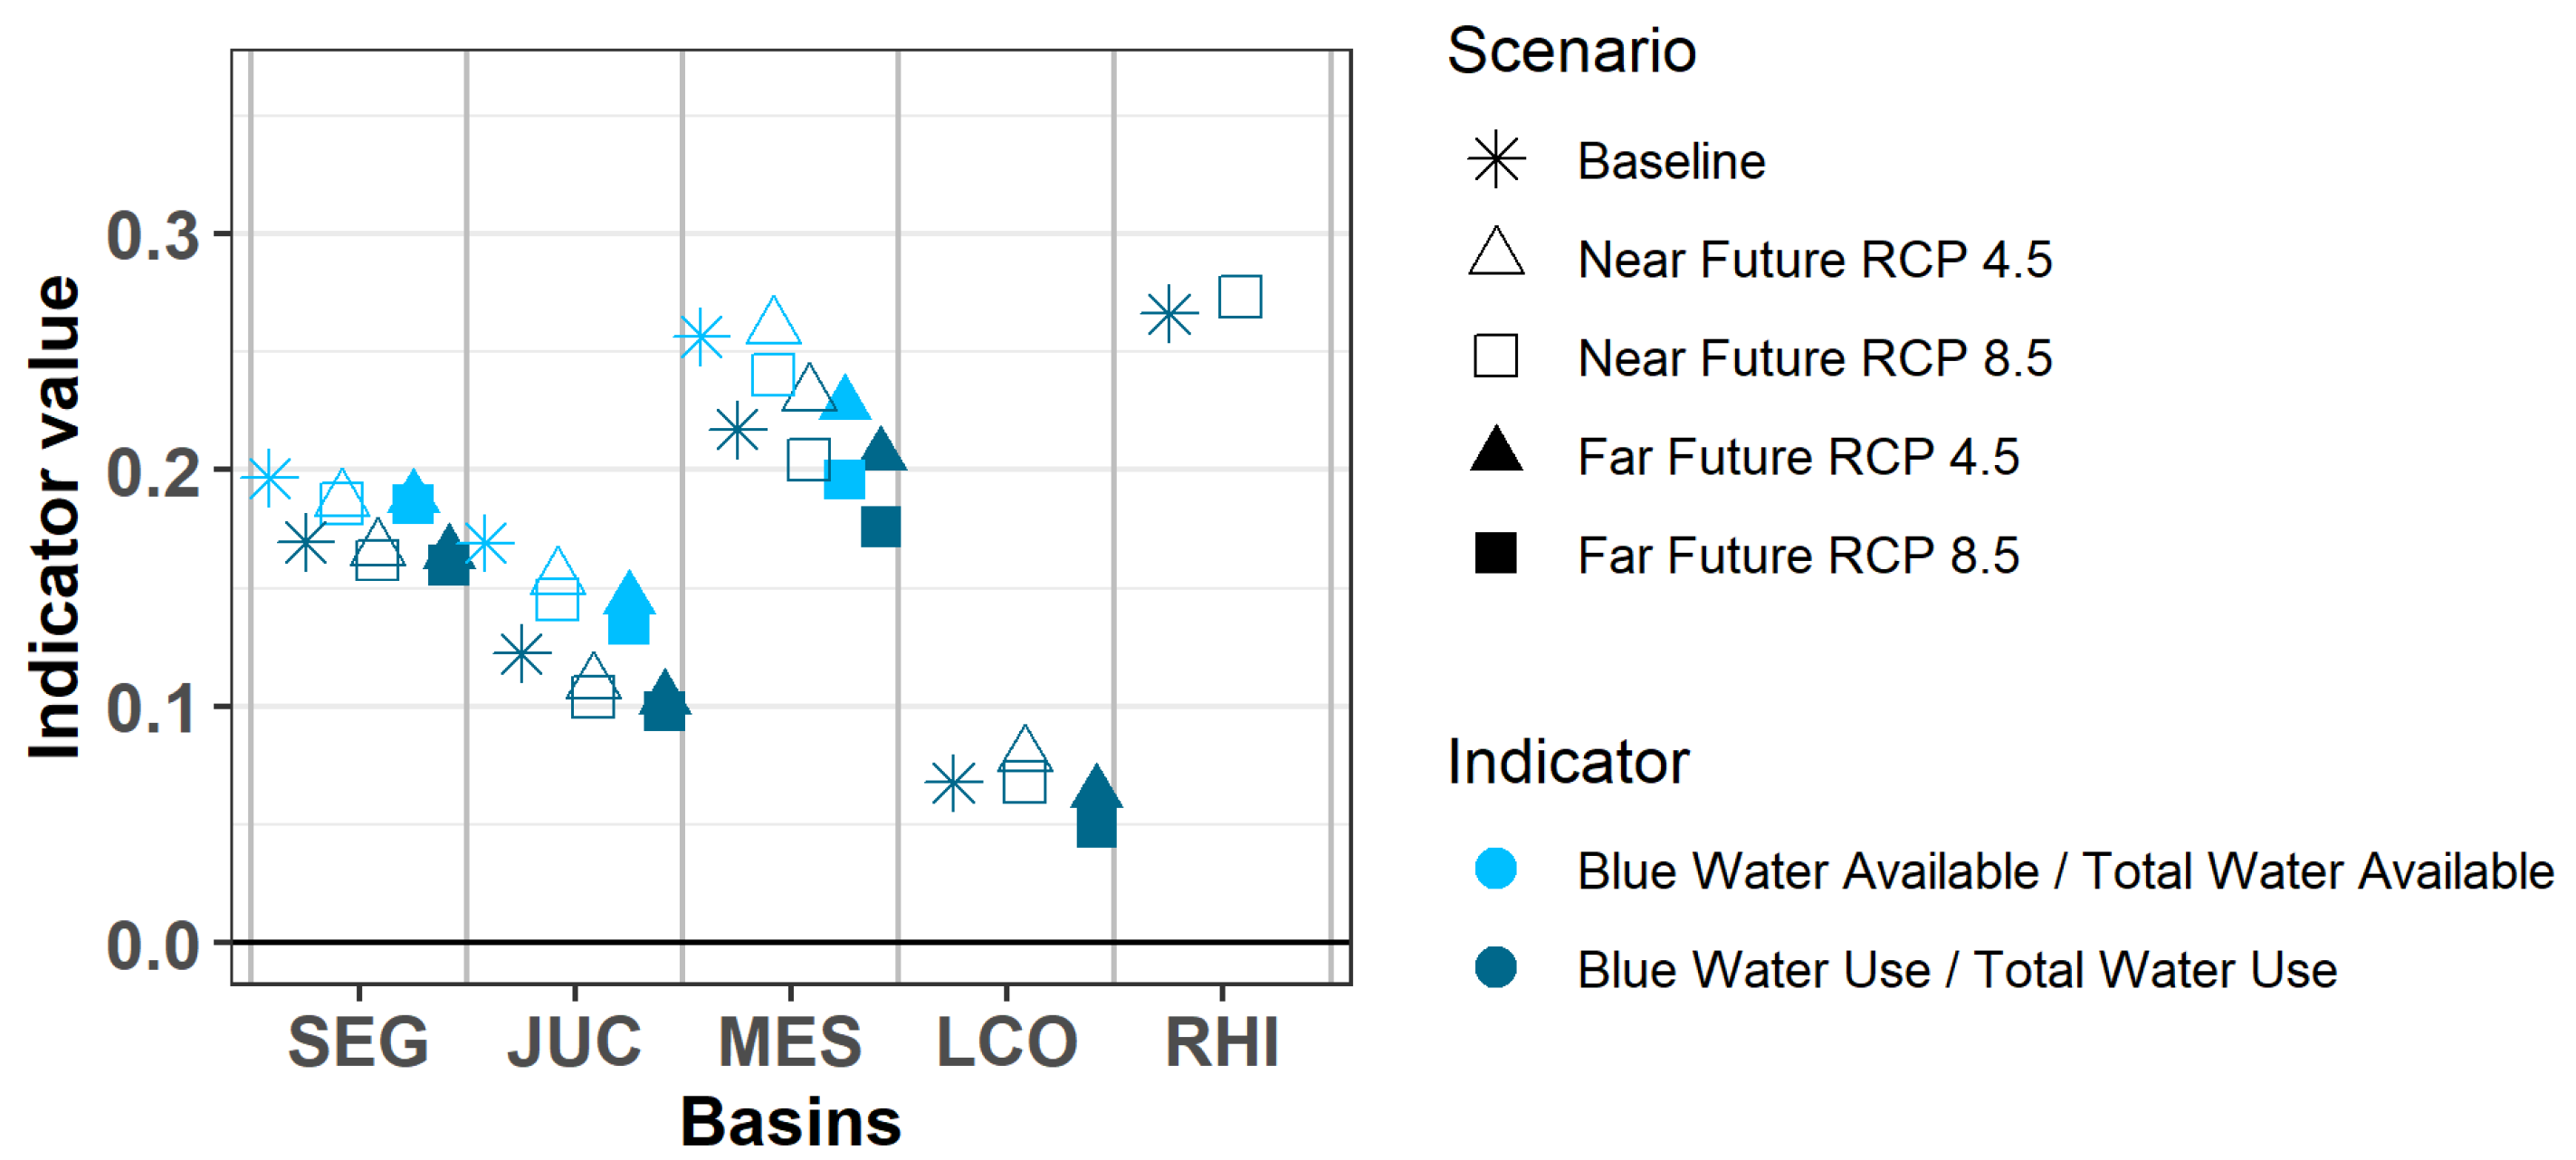
- Blue water dependency-indicators, expressed as blue water availability and use compared to total availability and use
- Water stress-indicators expressed as green and blue water use compared to water resource availability.
3. Results
3.1. Water Availability
3.2. Water Use for Agriculture
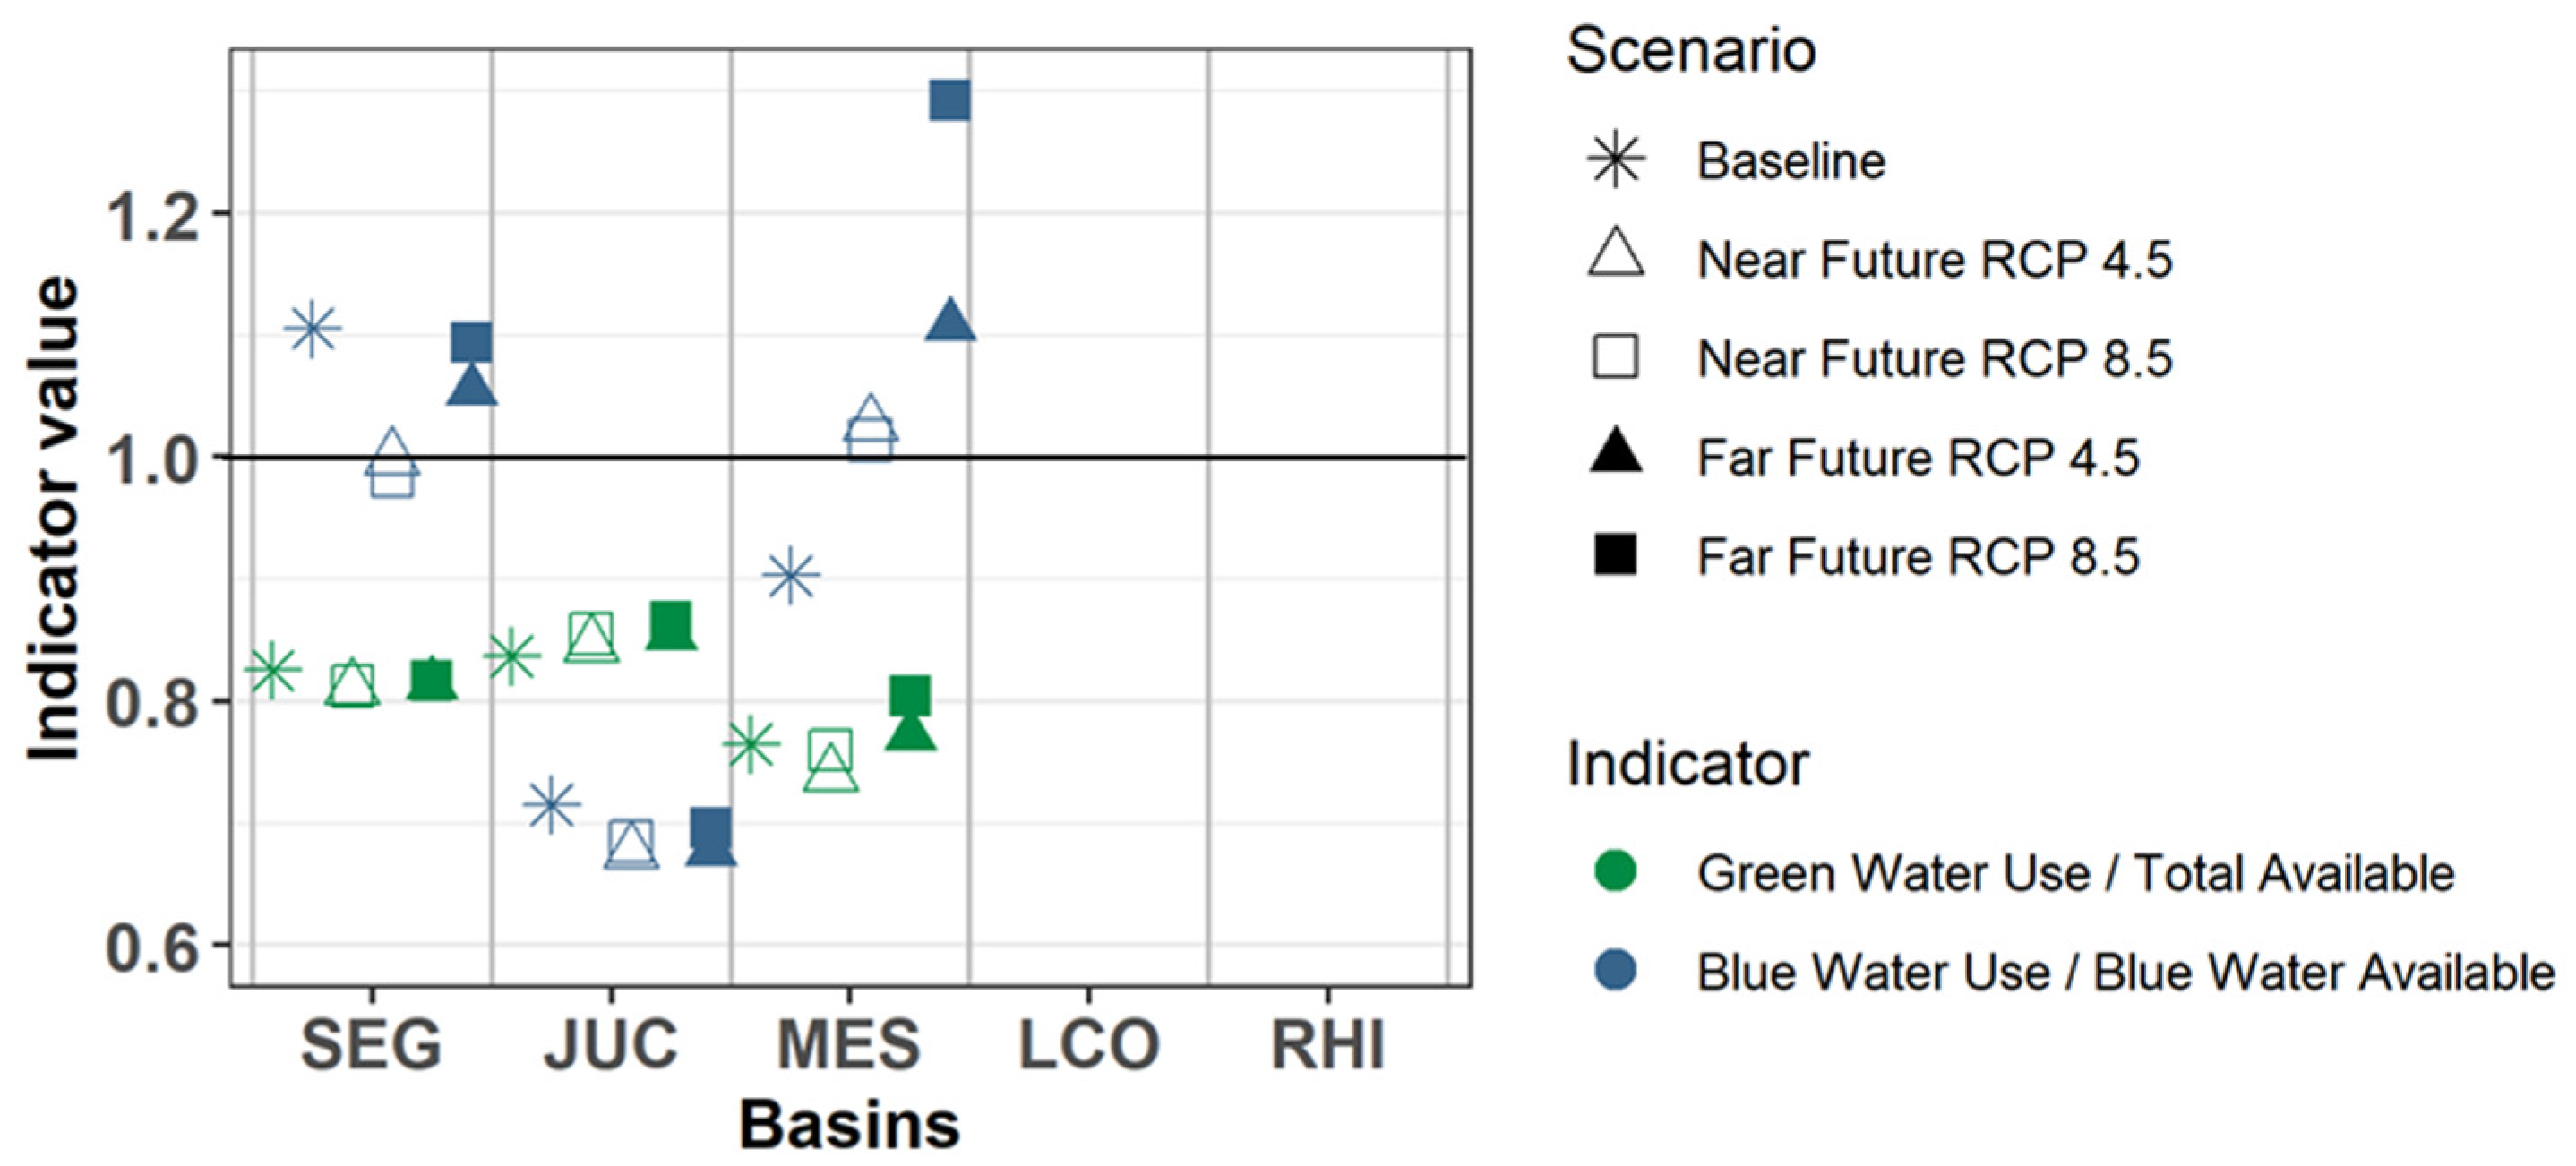
3.3. Blue Water Dependency
3.4. Water Stress
4. Discussion
5. Conclusions
Author Contributions
Funding
Conflicts of Interest
Appendix A. Description of the Resource Base Sheet Components

| Class | Variable | Description |
|---|---|---|
| INFLOW | Precipitation | Comprises all forms of precipitation |
| INFLOW | Interbasin transfer | Artificial water transfers from other basins |
| INFLOW | Upstream tributaries | Only relevant if the area covers the downstream portion of a basin, thus having inflow from upstream |
| INFLOW | Lateral groundwater inflow | Inflow from an aquifer transcending the boundaries of the river basin/study area |
| INFLOW | Desalination | Inflow through desalinated water |
| WITHDRAWALS | Total water withdrawal | Total water withdrawal for all economic activities |
| WITHDRAWALS | Agricultural water withdrawal | Total water withdrawal for agriculture |
| STORAGE | Surface storage change | Artificial reservoirs, lakes and soil water. Positive values indicate a net extraction of water |
| STORAGE | Subsurface storage change | Groundwater. Positive values indicate a net extraction of water |
| OUTFLOW | Green water ET: PNA | Evapotranspiration of green water |
| OUTFLOW | Green water ET: NNA | Evapotranspiration of green water |
| OUTFLOW | Green water ET: RC | Evapotranspiration of green water |
| OUTFLOW | Green water ET: IC | Evapotranspiration of green water |
| OUTFLOW | Green water ET: OMW | Evapotranspiration of green water |
| OUTFLOW | Blue water ET: PNA | Evapotranspiration of blue water |
| OUTFLOW | Blue water ET: NNA | Evapotranspiration of blue water |
| OUTFLOW | Blue water ET: RC | Evapotranspiration of blue water |
| OUTFLOW | Blue water ET: IC | Evapotranspiration of blue water |
| OUTFLOW | Blue water consumption: OMW | Consumptive use of blue water in industry, services, households |
| OUTFLOW | Utilizable outflow | Water that is utilizable for economic activities in the basin |
| OUTFLOW | Committed outflow | Flow committed to specific uses downstream, such as in-stream use for navigation |
| OUTFLOW | Environmental outflow | Environmental flow requirements to preserve downstream ecosystems and/or prevent saline water intrusion |
| OUTFLOW | Non-utilizable outflow | Water that cannot be utilized (again) within the basin. Includes non-recoverable return flows from withdrawals |
| OUTFLOW | Interbasin transfer | Artificial water transfers to other basins |
| OUTFLOW | Lateral groundwater outflow | Outflow through an aquifer transcending the boundary of the river basin; can be natural or artificial (due to groundwater pumping) |
Appendix B. Model Approach and Data Sources for Each River Basin
Appendix B.1. Segura River Basin, Spain
- (1)
- The hydrological model SPHY (Spatial Processes in Hydrology). The model was set-up for the baseline period 1981–2000 and was used for assessing evapotranspiration and runoff impacts. Results of these modeling efforts were summarized by Eekhout et al. [70].
- (2)
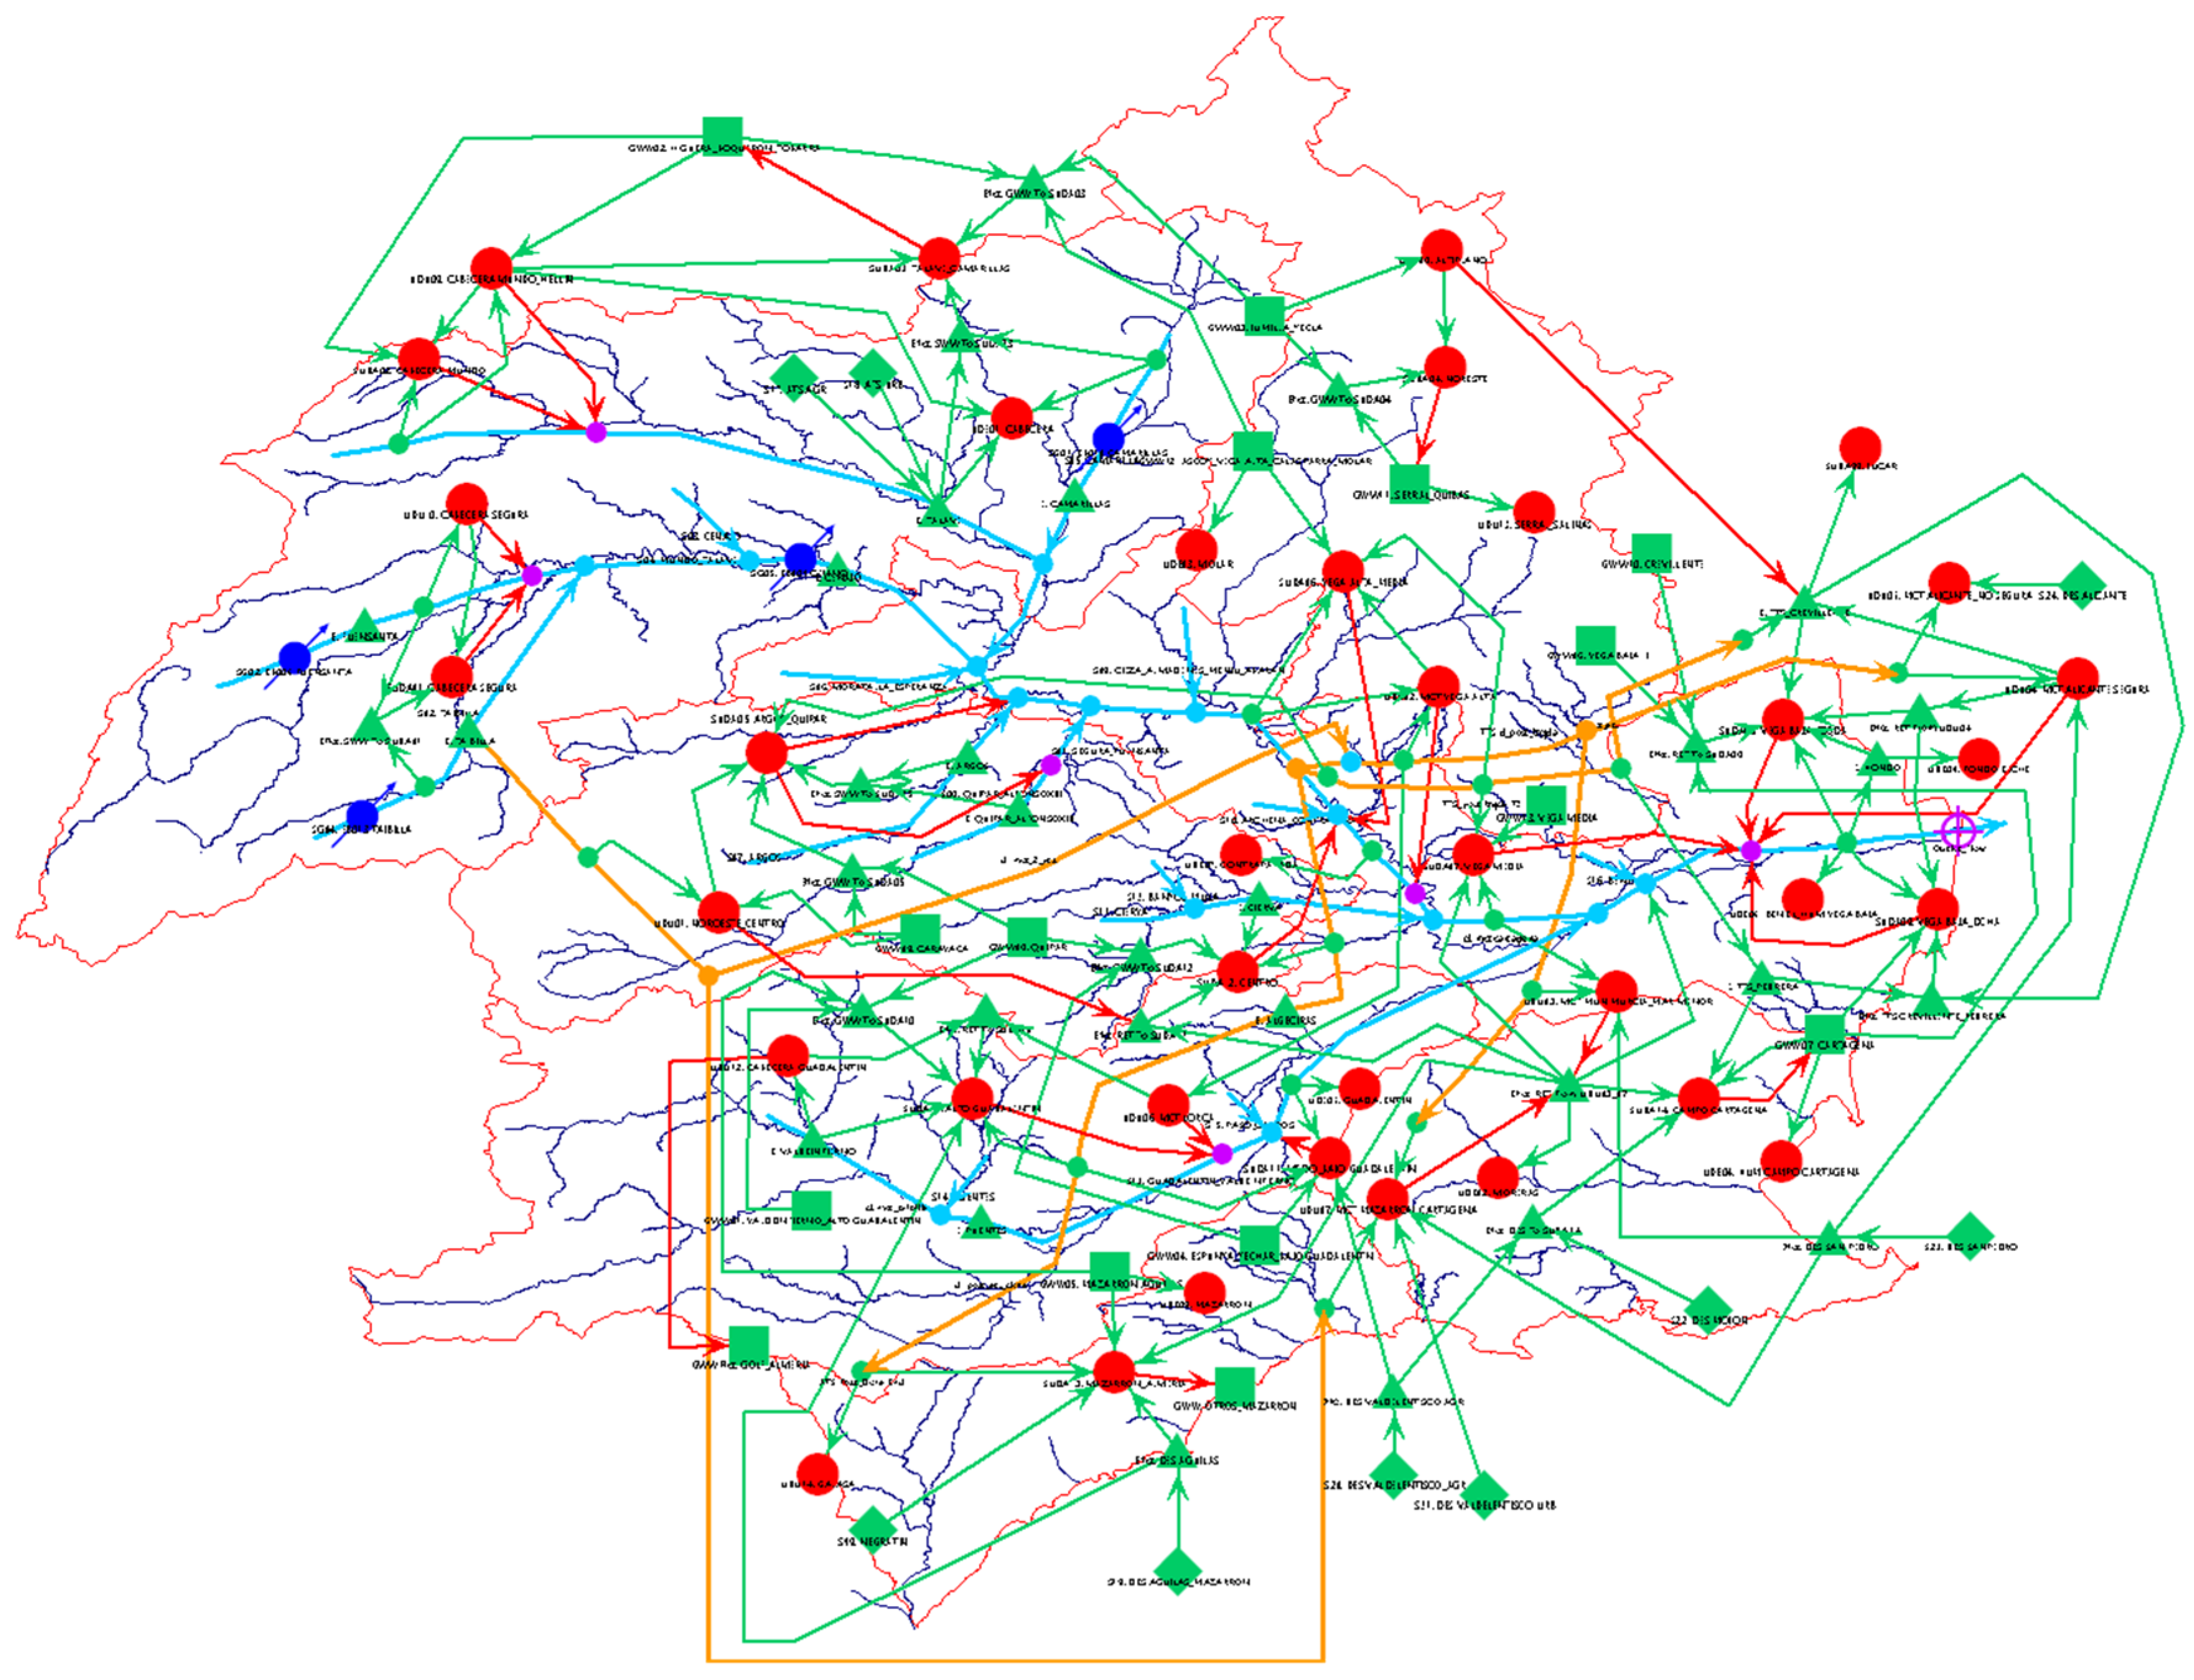
- A water resources system model using the WEAP (Water Resources and Evaluation Planning) software that developed for the Segura river basin (Figure A1), based on and in collaboration with the River Basin Authority.

- 1
- Precipitation: Based on the Spain02 dataset for baseline scenario, for future scenario based on nine Regional Climate Models (RCMs) for RCP4.5 and RCP8.5. Details in Eekhout et al. [70].
- 2
- Interbasin transfer: Tajo–Segura water transfer: Baseline based on past data from water authority; future, based on percentage changes due to climate change as assessed by Pellicer-Martínez and Martínez-Paz [71].
- 3
- Upstream tributaries: Not applicable.
- 4
- Lateral groundwater inflow: Not applicable.
- 5
- 6
- Total water withdrawal: Simulated by the WEAP model that was developed for the Segura river basin.
- 7
- Agricultural water withdrawal: Simulated by the WEAP model that was developed for the Segura river basin.
- 8
- Surface storage change: Storage change of soil water and surface water reservoirs, as simulated by the SPHY model and the WEAP model.
- 9
- Subsurface storage change. Groundwater storage difference between start and end of the simulation period in WEAP. For the future periods, groundwater over-exploitation was assumed to be zero, as is required by the European Water Framework Directive.
- 10
- Green water ET: PNA. Estimated by SPHY hydrological model.
- 11
- Green water ET: NNA. Estimated by SPHY hydrological model.
- 12
- Green water ET: RC. Estimated by SPHY hydrological model.
- 13
- Green water ET: IC. Estimated by SPHY hydrological model.
- 14
- Green water ET: OMW. Estimated by SPHY hydrological model.
- 15
- Blue water ET: PNA. Estimated by the water resources system WEAP model.
- 16
- Blue water ET: NNA. Estimated by the water resources system WEAP model.
- 17
- Blue water ET: RC. Estimated by the water resources system WEAP model.
- 18
- Blue water ET: IC. Estimated by the water resources system WEAP model.
- 19
- Blue water consumption: OMW. Estimated by the water resources system WEAP model.
- 20
- Utilizable outflow: Estimated by the water resources system WEAP model.
- 21
- Committed outflow: Estimated by the water resources system WEAP model.
- 22
- Environmental outflow: Extracted from Annex 1 of Drought Management Plan (PES) of the Segura river basin. During normal conditions: 1.0 m3/s, during drought conditions: 0.5 m3/s.
- 23
- Non-utilizable outflow: Estimated by the water resources system WEAP model
- 24
- Interbasin transfer: Estimated by the water resources system WEAP model
- 25
- Lateral groundwater outflow: According to river basin management plan: 1.3 hm3/year
Appendix B.2. Jucar River Basin, Spain
- (1)
- Data from the rainfall-runoff model PATRICAL [52] for the baseline period 1980–2012 are available in the Jucar River Basin Authority (CHJ) web (www.chj.es), coinciding with data used in the Jucar River Basin District Management Plan (JRBDMP) [74].
- (2)
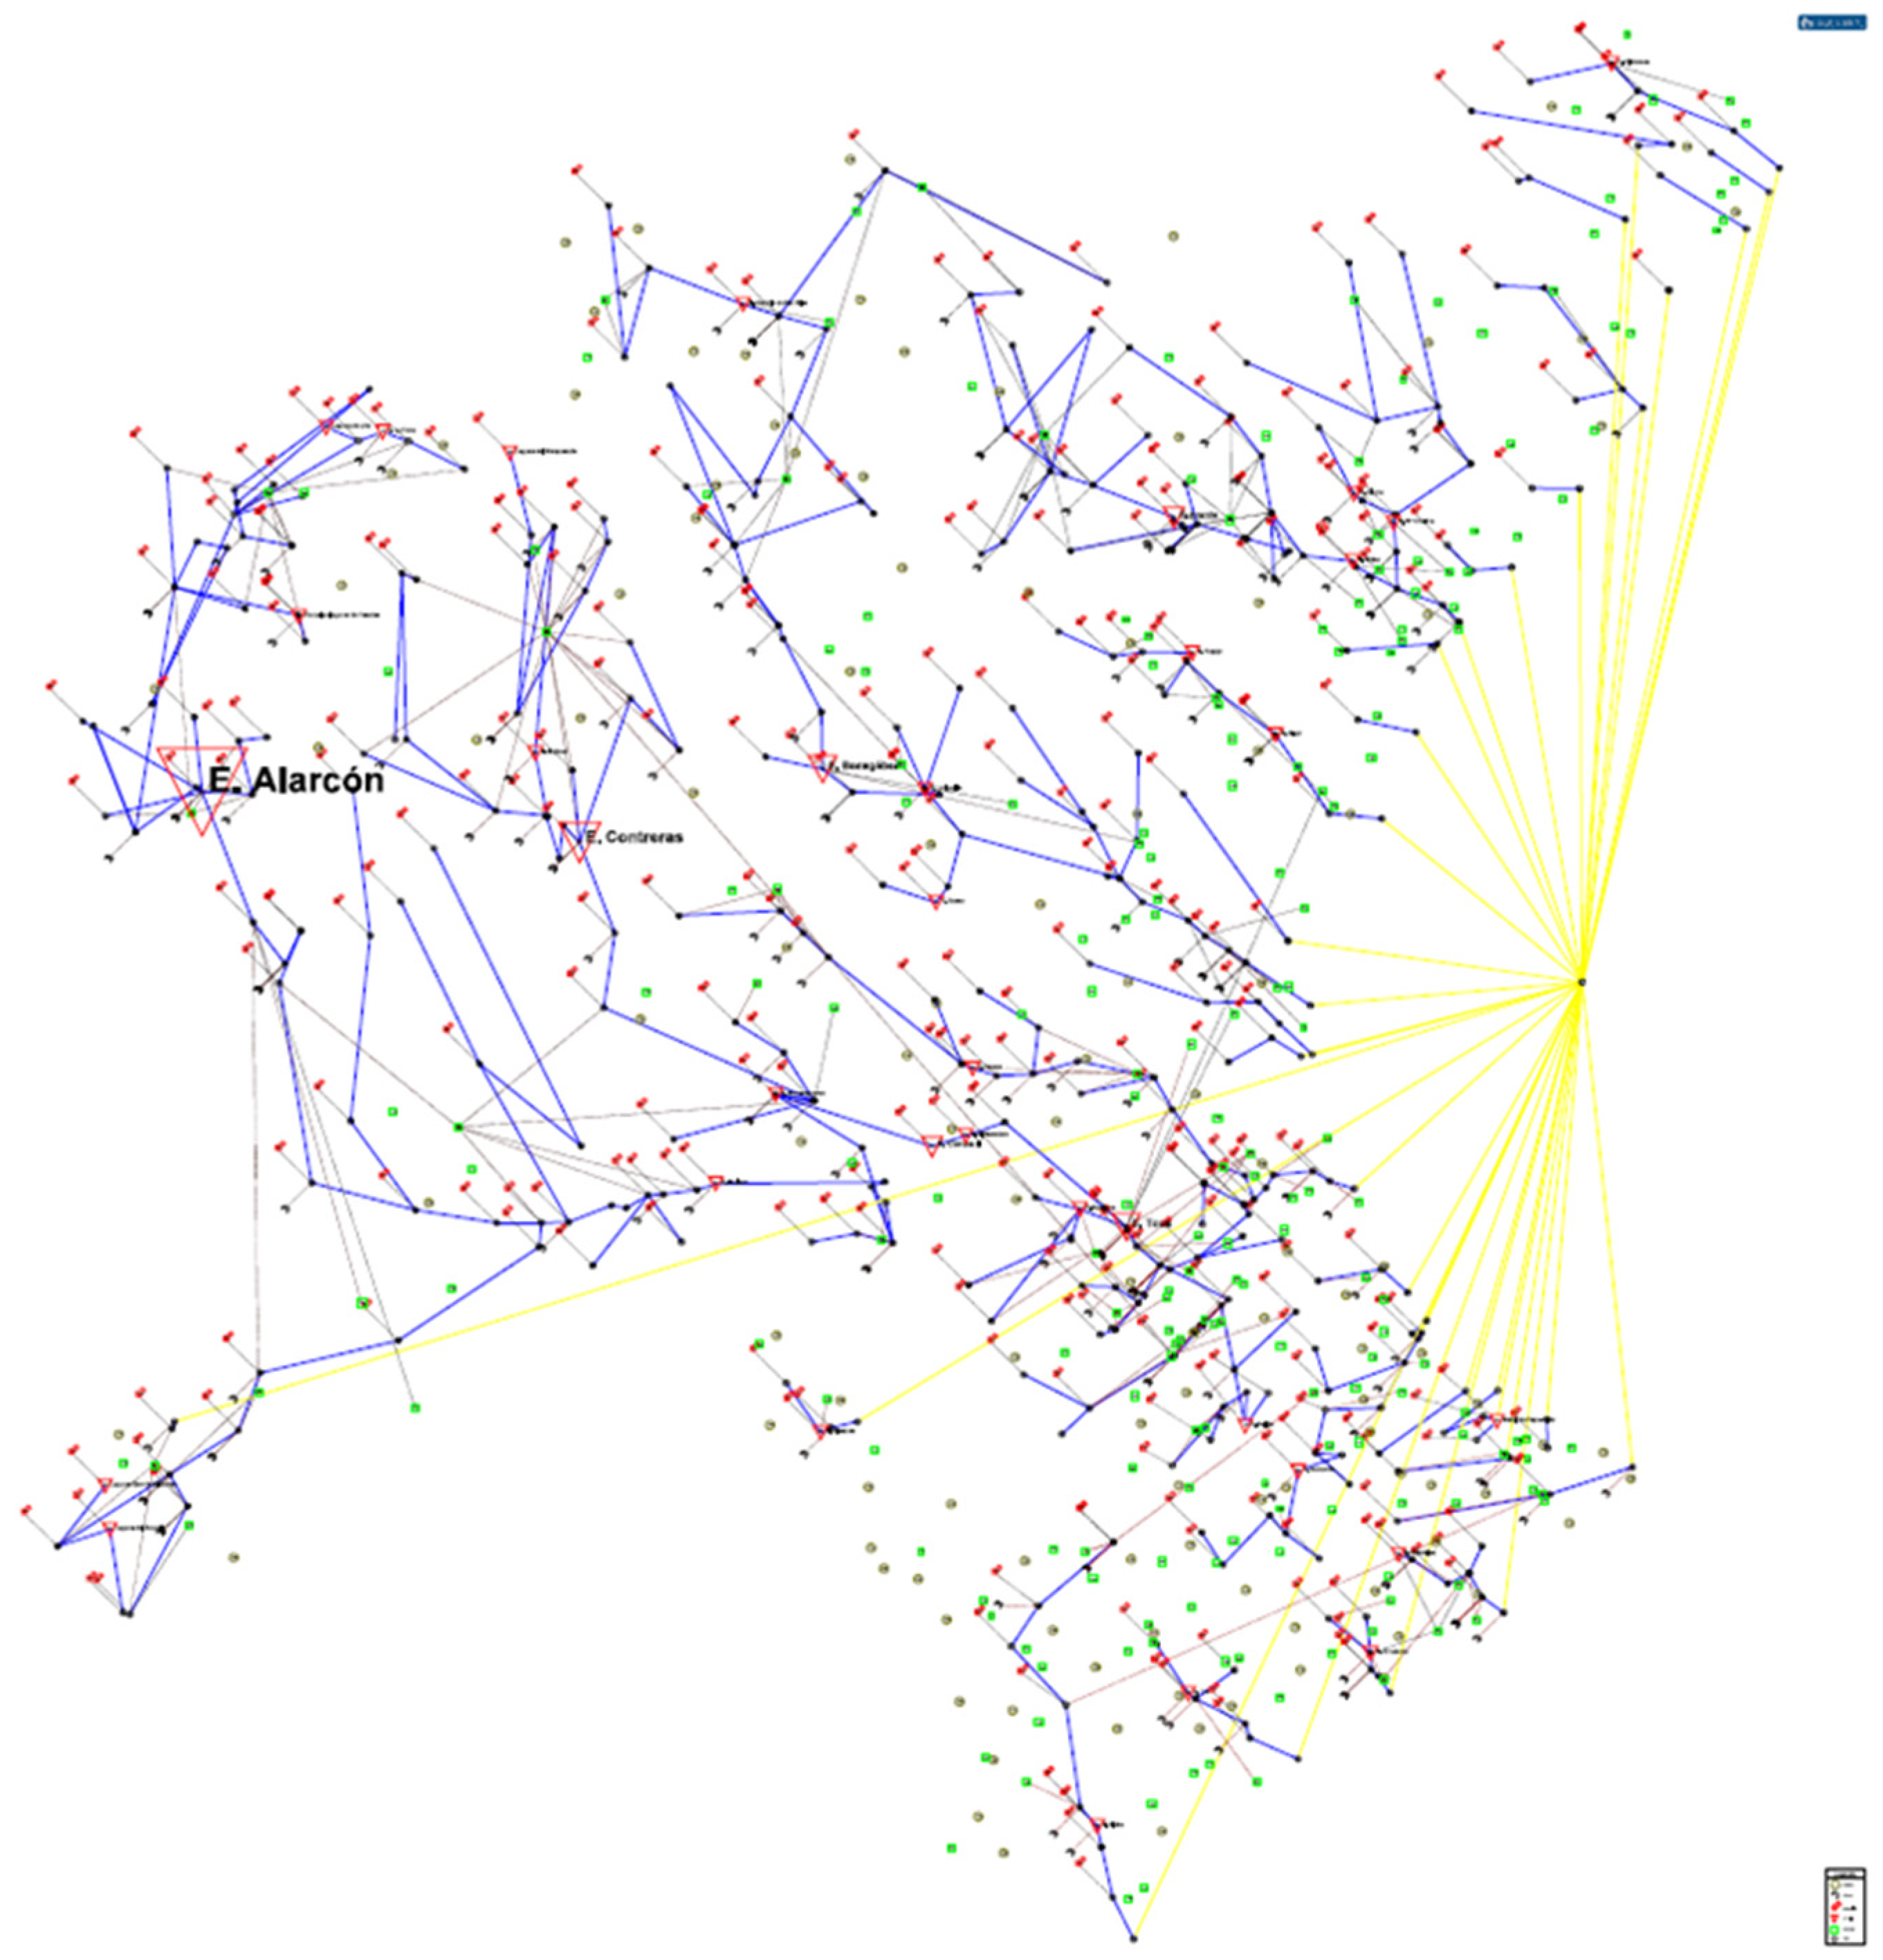
- SIMGES module from AQUATOOL Decision Support System Shell (DSSS) [75,76,77] see Figure A2. This module was used to build the water allocation or management model for all of Jucar District [78], a model which was calibrated using flows (in natural regime) from the CHJ for the period 1980–2012 and where all data referent to demands, operation rules, etc. coincide with those stated in the JRBDMP. Then, results from this model were filtered only for the Jucar River Basin in order to extract all data required in the water accounting sheets related to blue water, taking into account the relationships between this exploitation system and the others next to it.
- (3)
- Future scenarios are based on the changes in precipitation, evapotranspiration and flows coming from 12 RCMs belonging to RCPs 4.5 and 8.5 of the Fifth Assessment Report (AR5) of the Intergovernmental Panel of Climate Change (IPCC) for periods between 2010 and 2100. These changes are available in the Technical Report on the Assessment of the Impact of Climate Change on Water Resources and Droughts in Spain for the Ministry of Agriculture and Fisheries, Food and the Environment [79].
- 1
- Precipitation: Based on PATRICAL model data for the baseline scenario, which used data from Spain02 dataset. Future scenarios were based on 12 RCMs for RCPs 4.5 and 8.5 changes in precipitations [70].
- 2
- Interbasin transfer. Not applicable.
- 3
- Upstream tributaries. Not applicable.
- 4
- Lateral groundwater inflow: Simulated by the SIMGES model.
- 5
- Desalination. Not applicable.
- 6
- Total water withdrawal: Simulated by the SIMGES model.
- 7
- Agricultural water withdrawal: Simulated by the SIMGES model.
- 8
- Surface storage change: Simulated by the SIMGES model.
- 9
- Subsurface storage change: Simulated by the SIMGES model. For the future periods, the balance of surface and groundwater was assumed to be zero in order to avoid over-exploitation, as is required by the European Water Framework Directive.
- 10
- Green water ET: PNA. Estimated by data from PATRICAL model.
- 11
- Green water ET: NNA. Estimated by data from PATRICAL model.
- 12
- Green water ET: RC. Estimated by data from PATRICAL model.
- 13
- Green water ET: IC. Estimated by data from PATRICAL model.
- 14
- Green water ET: OMW. Not applicable.
- 15
- Blue water ET: PNA. Not applicable.
- 16
- Blue water ET: NNA. Not applicable.
- 17
- Blue water ET: RC. Not applicable.
- 18
- Blue water ET: IC. Estimated by the water resources system SIMGES model.
- 19
- Blue water consumption: OMW. Estimated by the water resources system SIMGES model.
- 20
- Utilizable outflow: Estimated by the water resources system SIMGES model.
- 21
- Committed outflow. Not applicable.
- 22
- Environmental outflow. 18 hm3/year, as stated in the JRBDMP.
- 23
- Non-utilizable outflow. Not applicable.
- 24
- Interbasin transfer. Not applicable in the baseline but considered for future periods in 20 hm3/year as is predicted in the JRBDMP.
- 25
- Lateral groundwater outflow. This was considered the groundwater flow to the sea that, according to the JRBDMP, is 27 hm3/year.

Appendix B.3. Messara River Basin, Greece

- (1)
- Precipitation: Estimated by from 14 ground stations, Thiessen weighted on the region. Projections of precipitation and temperature were obtained by the median future precipitation change signal model among five EURO CORDEX (Coordinated Downscaling Experiment - European Domain) models (RCP4.5 and RCP8.5). The data were downscaled and bias was corrected by using the observations to match the historical climatology of the area. Dry years were considered as the average of the lower 33rd percentile of years.
- (2)
- Interbasin transfers: Currently, there are no interbasin transfers. However the Koutsoulidis dam is planned to be supplementary and filled with water transferred from the nearby Platis basin. The preliminary technical report of the transfer infrastructure construction refers to 20 Mm3 per year, while a dry year the available transferable water will by approximately 10 Mm3. For the far future scenario of RCP85 dry year, we used the assumption of 5 Mm3 transfer availability.
- (3)
- Upstream tributaries: The study domain that we considered includes the entire watershed, hence there are no upstream tributaries contributing to the surface water resources.
- (4)
- Lateral groundwater inflow: According to the hydrogeological knowledge of the area, the watershed domain also roughly includes the hydrogeological domain.
- (5)
- Desalination: Currently, there are no desalination plants in the area, nor any plans for such. The water resources will be expanded in the near future by the aforementioned interbasin transfer (with regard to the SSP2—most probable water infrastructure).
- (6)
- Total water withdrawal: Includes: Agricultural water use (95.3%), domestic water use (4.0%), livestock (0.5%) and industrial use (0.2%) (numbers in parentheses indicate the current average annual consumptions).
- (7)
- Agricultural water withdrawal: Current agricultural water demand was estimated by the measurements of the local water management authorities that either own the water wells or manage the irrigation networks and dam water (local water infrastructure authorities, Local Organization of Land Reclamation and municipalities). For the future scenarios, an additional 5% increase in ET per degree of warming was considered. In the future scenario cases where the water does not meet the demand, we considered that the agricultural water was bounded to the water availability, considering availability priority to the other sectors.
- (8)
- Surface storage change: The currently available and the future Platis Dam consists of the available surface storage within the region of interest. In the average year, we considered no surface storage change to the water volume of those reservoirs. In the dry years, we considered an overexploitation equal to what these storages can hold as a backup in an average year.
- (9)
- Subsurface storage change: No groundwater storage change was considered in the average years, while an overexploitation of the dry years was estimated equal to the excess replenishment of the wet years.
- (10)
- Green water ET: PNA: Estimated by Sacramento hydrological model (SAC-SMA).
- (11)
- Green water ET: NNA: Estimated by Sacramento hydrological model (SAC-SMA).
- (12)
- Green water ET: RC: Estimated by Sacramento hydrological model (SAC-SMA).
- (13)
- Green water ET: IC: Estimated by Sacramento hydrological model (SAC-SMA).
- (14)
- Green water ET: OMW: No green water for other managed water uses was considered.
- (15)
- Blue water ET: PNA: No protected natural areas are irrigated in the study area.
- (16)
- Blue water ET: NNA: No non-protected natural areas are irrigated in the study area.
- (17)
- Blue water ET: RC: No rainfed areas are irrigated in the study area.
- (18)
- Blue water ET: IC: Equal to Agricultural water withdrawal.
- (19)
- Blue water consumption: OMW: Includes domestic, livestock and industrial water consumption. The baseline domestic water consumption was estimated from the measurements of the municipalities within the study region. An additional 10% increase in the domestic demand in the dry years was considered. In the future scenarios, a domestic demand increase of 20 Lt/day per °C warming was also added. Population projections for the future were considered according to the SSP2 scenario projections for Greece. Baseline industrial and livestock water use was estimated by measurements of the municipalities within the study region. Future livestock water use also considered the SSP2 development projections. Industrial water, mainly consumed in olive oil mills, is considered to be analog to the olives production which in turn is based on the irrigation water availability.
- (20)
- Utilizable outflow: The simulated surface outflow of the hydrological model.
- (21)
- Committed outflow: There is no commitment of flow downstream.
- (22)
- Environmental outflow: The major river of the case study area is intermittent.
- (23)
- Non-utilizable outflow: The simulated subsurface outflow of the hydrological model.
- (24)
- Interbasin transfer: There is no interbasin outflow transfers or any related plans.
Appendix B.4. Lake Como River Basin, Italy

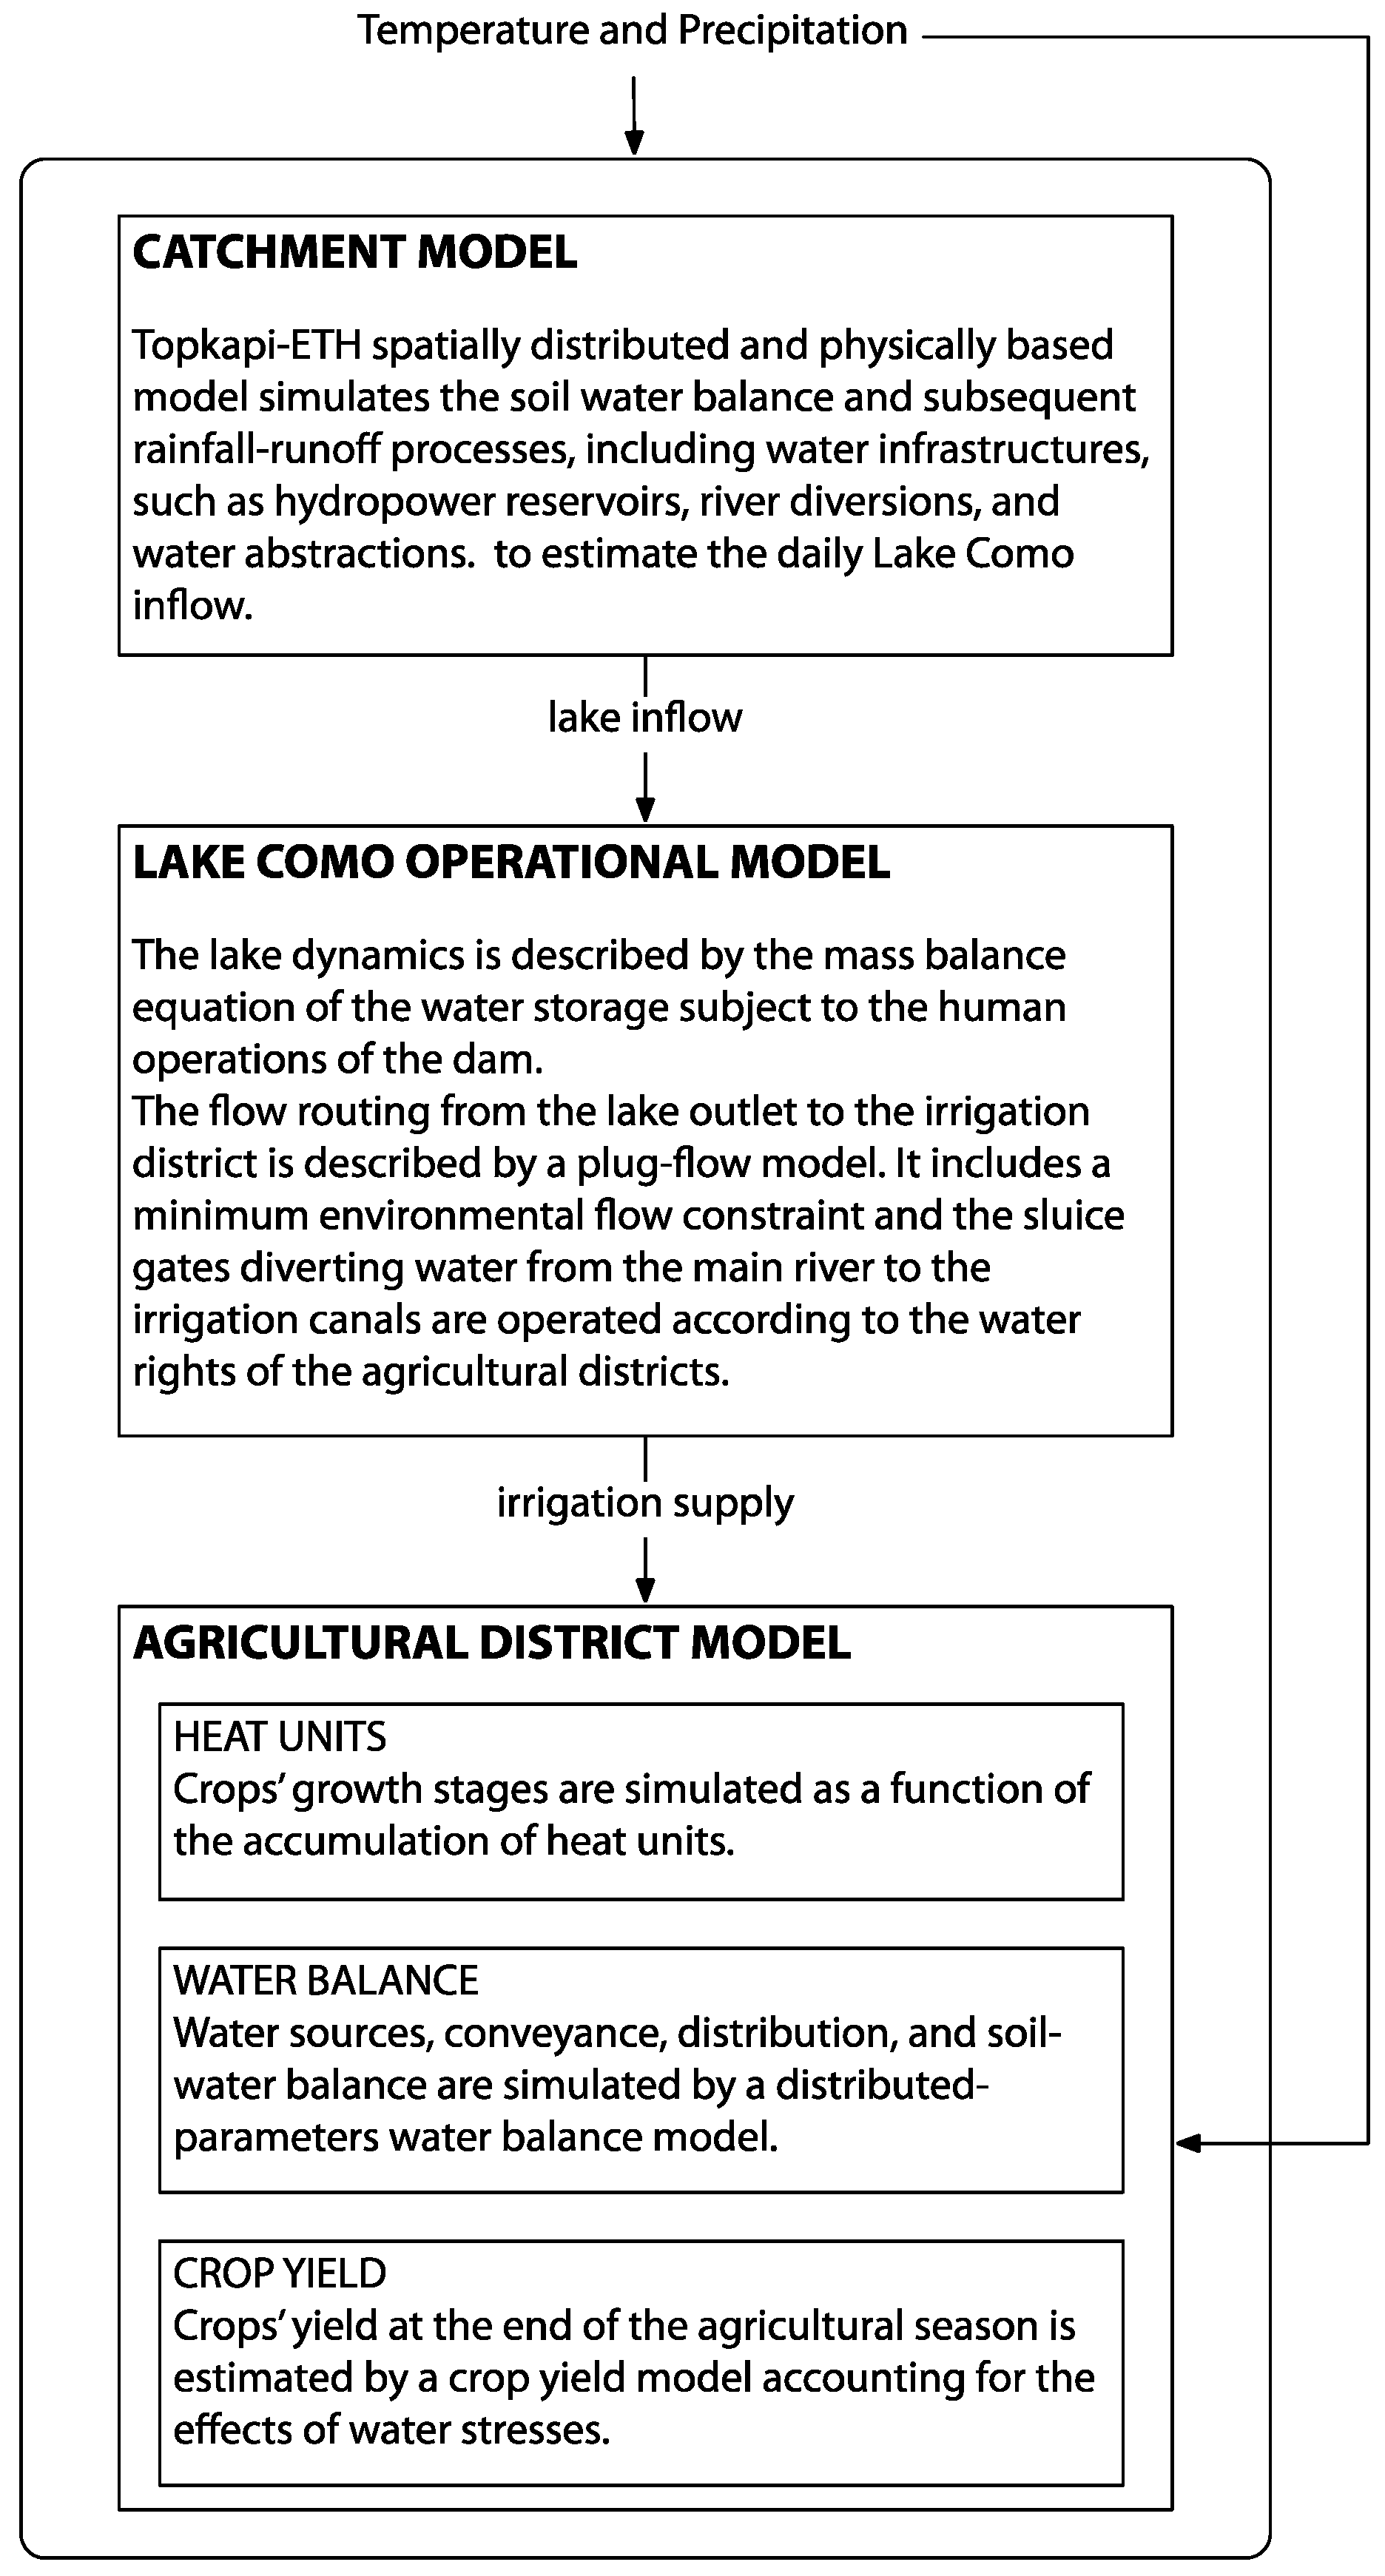
- Catchment model—the hydrological model used is Topkapi-ETH (TE), a spatially distributed and physically based model for the watershed of Lake Como. TE uses a regular grid to represent the topography and an advanced routing method to simulate flow accumulation. TE explicitly models water infrastructures, such as hydropower reservoirs, river diversions, and water abstractions. TE requires several inputs, including time series from geo-localized stations within the basin and spatial inputs for the entire basin (e.g., map such as land use, Digital Elevation Model, and soil type). In this analysis, we focused only on projecting the time series of precipitation (nine stations) and temperature (four stations), which are the most important drivers of the simulated hydrological processes, while the other spatial inputs were maintained equal to the historical observations. TE simulations were run with a daily time step over the control time horizon 1 January 1981–31 December 2004 and the future time horizon 1 January 2006–31 December 2100.
- Lake Como operational model—the lake dynamics is described by a mass-balance equation assuming a modelling and decision-making time step of 24 h, where the lake releases are determined by the lake operating policy. A minimum environmental flow (MEF) constraint on lake releases equal to 5 m3/s is imposed to protect the aquatic ecosystems in the Adda River downstream from the lake. According to the daily time step, the Adda River can be described by a plug-flow model to simulate the routing of the lake releases from the lake outlet to the intake of the irrigation canals. This diversion of the water from the Adda River into the irrigation canal is regulated by the water rights of the agricultural districts.
- Agricultural district model—the dynamic processes internal to the Muzza irrigation district, which is the largest district served solely by Lake Como release, are described by three distinct modules devoted to specific tasks: (1) A distributed-parameter water balance module (Facchi et al., 2004) simulating water sources, conveyance, distribution, and soil-crop water balance over a regular mesh of cells with a side length of 250 m. Each individual cell identifies a soil volume which is subdivided into two layers, where the upper one (evaporative layer) represents the upper 15 cm of the soil and the bottom one (transpirative layer) represents the root zone and has a time-varying depth, with the water percolating out of the bottom layer that constitutes the recharge to the groundwater system; (2) a heat unit module (Neitsch, 2011) simulating the sequence of growth stages (e.g., root length, basal coefficient, and leaf area index), including the sowing and harvesting dates, as a function of the temperature in terms of cumulated heat units; (3) a crop yield module that first estimates the maximum yield achievable in optimal conditions and, then reduces it to take into account the stresses due to insufficient water supply from rainfall and irrigation happened during the agricultural season, where the yield response to water stresses is estimated according to the empirical function proposed in the AquaCrop model (Steduto et al., 2009) and based on the approach proposed by the Food and Agriculture Organization (Doorenbos et al., 1979). Finally, the yield of the cultivated crops is used to estimate the farmers net profit, which also depends on the crop price and cost along with the subsidies derived from the EU’s Common Agricultural Policy (Gandolfi et al., 2014).
- (1)
- Precipitation: Estimated by nine ground stations in the upper basin and from three ground stations in the irrigation districts. Projections of precipitation and temperature were obtained by the global model ICHEC-EC-EARTH and regional model RCA4 for the scenario RCP4.5 and RCP8.5, which were provided by the EURO CORDEX project. The data were downscaled and bias-corrected using a time-varying quantile-quantile mapping method. The total precipitation was composed of both liquid precipitation and solid precipitation. We considered the 1995–2004 as the historical period, 2030–3050 as the near future period, and 2080–2100 as the far period.
- (2)
- Interbasin transfer: Not applicable.
- (3)
- Upstream tributaries: Not applicable.
- (4)
- Lateral groundwater inflow: Not applicable.
- (5)
- Desalination: Not applicable.
- (6)
- Total water withdrawal: Simulated by the Lake Como operational model. Since the irrigation district only involves agricultural activities, agricultural withdrawal is the same as total withdrawal.
- (7)
- Agricultural water withdrawal in the Muzza district: Simulated by the Lake Como operational model and the Agricultural District model.
- Agricultural water withdrawal in the other districts: Simulated by the Lake Como operational model and the Agricultural District model.
- (8)
- Surface storage change: Evaluated by TE as the annual storage variation of Lake Como and the alpine hydropower reservoirs.
- (9)
- Subsurface storage change: Not applicable. There is limited water abstraction from grounder water source for the irrigation districts because of the soil type and the difficulty to reach the deep groundwater source.
- (10)
- Green water ET: PNA. Not applicable.
- (11)
- Green water ET: NNA. Estimated by TE accounting for the green water in the alpine basin that is composed only by natural area.
- (12)
- Green water ET: RC. Not applicable.
- (13)
- Green water ET: IC. Estimated by the Agricultural Model accounting for the green water in the cultivated area of the Muzza irrigation district.
- (14)
- Green water ET: OMW. Not applicable.
- (15)
- Blue water ET: PNA. Not applicable.
- (16)
- Blue water ET: NNA. Not applicable.
- (17)
- Blue water ET: RC. Not applicable.
- (18)
- Blue water ET: IC. Estimated by the Lake Como operational model, accounting for the blue water diverted to the irrigation districts.
- (19)
- Blue water consumption: OMW. Not applicable.
- (20)
- Utilizable outflow: Estimated by the Lake Como operational model, representing the water that is not derived by the irrigation districts and that flows downstream.
- (21)
- Committed outflow: Not applicable.
- (22)
- Environmental outflow: It is generally equal to the MEF (5.0 m3/s) or exceptionally to the Lake Como release if the lake inflow is lower than 5.0 m3/s (the MEF constraint does not imply environmental flow augmentation)
- (23)
- Non-utilizable outflow: Not applicable.
- (24)
- Interbasin transfer: Not applicable.
- (25)
- Lateral groundwater outflow: Not applicable.
Appendix B.5. Rhine River Basin, The Netherlands
- (1)
- MOZART: The national regional surface water model
- (2)
- MetaSWAP: Model for the unsaturated zone.
- (3)
- DM: National water allocation model
- (4)
- QWAST: Quick Scan Water Allocation Tool
- (1)
- Precipitation: Precipitation in the current situation is based on water accounting estimates of National Bureu of Statistics (Graveland et al., 2017). The projections of precipitation were obtained from the KNMI scenarios (Van de Hurk et al., 2014), which are based on model projections with EC-Earth/RACMO. The precipitation estimates were derived from the MOZART model, a regional surface water model.
- (2)
- Interbasin transfer: Flow from Meuse to Waal through the Meuse-Waal channel derived from DM, the national water allocation model.
- (3)
- Upstream tributaries: Inflow from the Rhine at Lobith (main inflow from upstream tributaries) including other inflows from Germany.
- (4)
- Lateral groundwater inflow: Not applicable.
- (5)
- Desalination: Not applicable.
- (6)
- Total water withdrawal: Agriculture, drinking water and industrial water surface water withdrawals are derived from MOZART, the regional surface water model. Groundwater withdrawals for drinking water and industrial water were derived from CBS statistics and were added to obtain total water withdrawals.
- (7)
- Surface storage change: The annual storage variation in the Ijssel Lake. The water level is managed in such a way that storage will not change.
- (8)
- Subsurface storage change: In very dry years, the subsurface storage is lower in the higher parts of The Netherlands. In normal years, subsurface storage does not change, as the subsurface storage is refilled every year. Therefore, on average, there are no subsurface storage changes.
- (9)
- Green water ET: PNA. Approximately 600,000 hectares of land are assigned as protected natural area. Evaporation for nature is assessed with the MetaSWAP model, the national unsaturated soil model.
- (10)
- Green water ET: NNA. No differentiation could be made between non-protected natural areas and other areas, e.g., urban area. Therefore, green water for non-protected natural areas is not separately reported.
- (11)
- Green water ET: RC. Estimated by the MetaSWAP model for all farm land. Largest part of the farmland in The Netherlands is rainfed. Model results are multiplied by percentage of rainfed agricultural land.
- (12)
- Green water ET: IC. Approximately 12% of the agricultural land uses surface water irrigation. The total evapotranspiration obtained from the MetaSWAP model has been multiplied by the percentage of surface water irrigated land.
- (13)
- Green water ET: OMW. Total evapotranspiration minus total evapotranspiration from agricultural and protected natural area.
- (14)
- Blue water ET: PNA. Open water evaporation from Lake Ijssel and other protected lakes estimated by MOZART.
- (15)
- Blue water ET: NNA. Not applicable.
- (16)
- Blue water ET: RC. Not applicable.
- (17)
- Blue water ET: IC. Total evapotranspiration obtained from the MetaSWAP model multiplied by the surface area with groundwater irrigation.
- (18)
- Blue water consumption: OMW. Water consumption within economy derived from CBS (Graveland et al., 2017)
- (19)
- Utilizable outflow: Other flow than committed, environmental or non-utilizable outflow estimated with MOZART. Flows for inland water transport, flushing, the environment and water level management are hard to distinguish.
- (20)
- Committed outflow: Flow committed for drinking water and industrial uses estimated with MOZART.
- (21)
- Environmental outflow: Flow used for flushing the system in order to reduce salinity intrusion estimated with QWAST, the national quick scan water allocation tool.
- (22)
- Non-utilizable outflow: Outflow Ijssel Lake estimated with QWAST.
- (23)
- Interbasin transfer: Not applicable.
- (24)
- Lateral groundwater outflow: Not applicable.
Appendix C. Resource Base Sheets for Each River Basin
| Variable (Million m3/Year) | BL | NF45 | FF45 | NF85 | FF85 |
|---|---|---|---|---|---|
| Precipitation | 6620 | 6482 | 6583 | 6482 | 5463 |
| Interbasin transfer | 283 | 90 | 28 | 63 | 0 |
| Upstream tributaries | 0 | 0 | 0 | 0 | 0 |
| Lateral groundwater inflow | 0 | 0 | 0 | 0 | 0 |
| Desalination | 158 | 190 | 237 | 190 | 237 |
| Total water withdrawal | 1190 | 1203 | 1114 | 1200 | 994 |
| Agricultural water withdrawal | 1012 | 1026 | 940 | 1023 | 833 |
| Surface storage change | −30 | −16 | 11 | −11 | 13 |
| Subsurface storage change | 185 | 0 | 0 | 0 | 0 |
| Green water ET: PNA | 1726 | 1646 | 1642 | 1619 | 1363 |
| Green water ET: NNA | 1661 | 1546 | 1567 | 1536 | 1313 |
| Green water ET: RC | 573 | 534 | 540 | 528 | 448 |
| Green water ET: IC | 1660 | 1538 | 1568 | 1544 | 1305 |
| Green water ET: OMW | 116 | 107 | 109 | 108 | 91 |
| Blue water ET: PNA | 20 | 19 | 17 | 19 | 14 |
| Blue water ET: NNA | 24 | 23 | 21 | 23 | 18 |
| Blue water ET: RC | 0 | 0 | 0 | 0 | 0 |
| Blue water ET: IC | 948 | 991 | 965 | 1041 | 810 |
| Blue water consumption: OMW | 128 | 123 | 106 | 122 | 97 |
| Utilizable outflow | 21 | 21 | 21 | 21 | 21 |
| Committed outflow | 0 | 0 | 0 | 0 | 0 |
| Environmental outflow | 32 | 32 | 32 | 32 | 32 |
| Non-utilizable outflow | 67 | 36 | 9 | 29 | 3 |
| Interbasin transfer | 0 | 0 | 0 | 0 | 0 |
| Lateral groundwater outflow | 1 | 1 | 1 | 1 | 1 |
| Inflow−Outflow | 0 | 0 | 0 | 0 | 0 |
| Variable (Million m3/Year) | BL | NF45 | FF45 | NF85 | FF85 |
|---|---|---|---|---|---|
| Precipitation | 10,626 | 10,307 | 9988 | 9882 | 9457 |
| Interbasin transfer | 0 | 0 | 0 | 0 | 0 |
| Upstream tributaries | 0 | 0 | 0 | 0 | 0 |
| Lateral groundwater inflow | 1 | 1 | 1 | 1 | 1 |
| Desalination | 0 | 0 | 0 | 0 | 0 |
| Total water withdrawal | 1446 | 1446 | 1316 | 1298 | 1140 |
| Agricultural water withdrawal | 1329 | 1329 | 1199 | 1181 | 1023 |
| Surface storage change | −165 | 0 | 0 | 0 | 0 |
| Subsurface storage change | 335 | 0 | 0 | 0 | 0 |
| Green water ET: PNA | 84 | 82 | 81 | 80 | 77 |
| Green water ET: NNA | 5709 | 5606 | 5481 | 5424 | 5253 |
| Green water ET: RC | 1776 | 1741 | 1705 | 1687 | 1634 |
| Green water ET: IC | 1311 | 1285 | 1258 | 1245 | 1206 |
| Green water ET: OMW | 0 | 0 | 0 | 0 | 0 |
| Blue water ET: PNA | 0 | 0 | 0 | 0 | 0 |
| Blue water ET: NNA | 0 | 0 | 0 | 0 | 0 |
| Blue water ET: RC | 0 | 0 | 0 | 0 | 0 |
| Blue water ET: IC | 1329 | 1329 | 1199 | 1181 | 1023 |
| Blue water consumption: OMW | 117 | 117 | 117 | 117 | 117 |
| Utilizable outflow | 342 | 0 | 0 | 0 | 0 |
| Committed outflow | 0 | 0 | 0 | 0 | 0 |
| Environmental outflow | 18 | 18 | 18 | 18 | 18 |
| Non-utilizable outflow | 0 | 0 | 0 | 0 | 0 |
| Interbasin transfer | 0 | 20 | 20 | 20 | 20 |
| Lateral groundwater outflow | 110 | 110 | 110 | 110 | 110 |
| Inflow−Outflow | 0 | 0 | 0 | 0 | 0 |
| Variable (Million m3/Year) | BL | NF45 | FF45 | NF85 | FF85 |
|---|---|---|---|---|---|
| Precipitation | 441.5 | 445.7 | 405.1 | 399.9 | 297.1 |
| Interbasin transfer | 0.0 | 20.0 | 20.0 | 20.0 | 20.0 |
| Upstream tributaries | 0.0 | 0.0 | 0.0 | 0.0 | 0.0 |
| Lateral groundwater inflow | 0.0 | 0.0 | 0.0 | 0.0 | 0.0 |
| Desalination | 0.0 | 0.0 | 0.0 | 0.0 | 0.0 |
| Total water withdrawal | 93.7 | 103.9 | 85.2 | 81.9 | 54.4 |
| Agricultural water withdrawal | 89.5 | 99.0 | 80.5 | 76.8 | 49.3 |
| Surface storage change | 0.0 | 0.0 | 0.0 | 0.0 | 0.0 |
| Subsurface storage change | 9.4 | 0.0 | 0.0 | 0.0 | 0.0 |
| Green water ET: PNA | 29.4 | 29.9 | 28.5 | 27.7 | 22.2 |
| Green water ET: NNA | 60.4 | 61.7 | 58.7 | 57.1 | 45.6 |
| Green water ET: RC | 112.3 | 114.5 | 109.1 | 106.1 | 84.8 |
| Green water ET: IC | 135.6 | 138.3 | 131.8 | 128.2 | 102.4 |
| Green water ET: OMW | 0.0 | 0.0 | 0.0 | 0.0 | 0.0 |
| Blue water ET: PNA | 0.0 | 0.0 | 0.0 | 0.0 | 0.0 |
| Blue water ET: NNA | 0.0 | 0.0 | 0.0 | 0.0 | 0.0 |
| Blue water ET: RC | 0.0 | 0.0 | 0.0 | 0.0 | 0.0 |
| Blue water ET: IC | 89.5 | 99.0 | 80.5 | 76.8 | 49.3 |
| Blue water consumption: OMW | 4.3 | 4.9 | 4.7 | 5.2 | 5.1 |
| Utilizable outflow | 4.2 | 4.6 | 3.2 | 5.0 | 2.4 |
| Committed outflow | 0.0 | 0.0 | 0.0 | 0.0 | 0.0 |
| Environmental outflow | 0.0 | 0.0 | 0.0 | 0.0 | 0.0 |
| Non-utilizable outflow | 2.3 | 1.8 | 1.2 | 2.0 | 0.7 |
| Interbasin transfer | 0.0 | 0.0 | 0.0 | 0.0 | 0.0 |
| Lateral groundwater outflow | 0.0 | 0.0 | 0.0 | 0.0 | 0.0 |
| Inflow−Outflow | 0 | 0 | 0 | 0 | 0 |
| Variable (Million m3/Year) | BL | NF45 | FF45 | NF85 | FF85 |
|---|---|---|---|---|---|
| Precipitation | 7480 | 7739 | 7926 | 7662 | 7344 |
| Interbasin transfer | 0 | 0 | 0 | 0 | 0 |
| Upstream tributaries | 0 | 0 | 0 | 0 | 0 |
| Lateral groundwater inflow | 0 | 0 | 0 | 0 | 0 |
| Desalination | 0 | 0 | 0 | 0 | 0 |
| Total water withdrawal | 5055 | 5255 | 5161 | 5159 | 4706 |
| Agricultural water withdrawal | 5055 | 5255 | 5161 | 5159 | 4706 |
| Surface storage change | 62 | 119 | −5 | 91 | 40 |
| Subsurface storage change | 0 | 0 | 0 | 0 | 0 |
| Green water ET: PNA | 0 | 0 | 0 | 0 | 0 |
| Green water ET: NNA | 1031 | 1088 | 1110 | 1089 | 1182 |
| Green water ET: RC | 0 | 0 | 0 | 0 | 0 |
| Green water ET: IC | 96 | 74 | 85 | 81 | 72 |
| Green water ET: OMW | 0 | 0 | 0 | 0 | 0 |
| Blue water ET: PNA | 0 | 0 | 0 | 0 | 0 |
| Blue water ET: NNA | 0 | 0 | 0 | 0 | 0 |
| Blue water ET: RC | 0 | 0 | 0 | 0 | 0 |
| Blue water ET: IC | 82 | 100 | 81 | 85 | 64 |
| Blue water consumption: OMW | 0 | 0 | 0 | 0 | 0 |
| Utilizable outflow | 682 | 851 | 909 | 808 | 829 |
| Committed outflow | 0 | 0 | 0 | 0 | 0 |
| Environmental outflow | 158 | 158 | 158 | 158 | 158 |
| Non-utilizable outflow | 0 | 0 | 0 | 0 | 0 |
| Interbasin transfer | 0 | 0 | 0 | 0 | 0 |
| Lateral groundwater outflow | 3637 | 3843 | 3969 | 3800 | 3757 |
| Inflow−Outflow | 0 | 0 | 0 | 0 | 0 |
| Variable (Million m3/Year) | BL | NF45 | FF45 | NF85 | FF85 |
|---|---|---|---|---|---|
| Precipitation | 21,785 | 26,532 | |||
| Interbasin transfer | 50 | 55 | |||
| Upstream tributaries | 62,770 | 62,323 | |||
| Lateral groundwater inflow | 0 | 0 | |||
| Desalination | 0 | 0 | |||
| Total water withdrawal | 1726 | 1834 | |||
| Agricultural water withdrawal | 149 | 293 | |||
| Surface storage change | 0 | 0 | |||
| Subsurface storage change | 0 | 0 | |||
| Green water ET: PNA | 2592 | 2961 | |||
| Green water ET: NNA | 0 | 0 | |||
| Green water ET: RC | 6567 | 6407 | |||
| Green water ET: IC | 903 | 880 | |||
| Green water ET: OMW | 3567 | 4075 | |||
| Blue water ET: PNA | 3253 | 3716 | |||
| Blue water ET: NNA | 0 | 0 | |||
| Blue water ET: RC | 0 | 0 | |||
| Blue water ET: IC | 58 | 55 | |||
| Blue water consumption: OMW | 400 | 400 | |||
| Utilizable outflow | 1170 | 1300 | |||
| Committed outflow | 643 | 794 | |||
| Environmental outflow | 50,745 | 53,614 | |||
| Non-utilizable outflow | 14,708 | 14,708 | |||
| Interbasin transfer | 0 | 0 | |||
| Lateral groundwater outflow | 0 | 0 | |||
| Inflow−Outflow | 0 | 0 |
References
- Jacob, D.; Kotova, L.; Teichmann, C.; Sobolowski, S.P.; Vautard, R.; Donnelly, C.; Koutroulis, A.G.; Grillakis, M.G.; Tsanis, I.K.; Damm, A.; et al. Climate Impacts in Europe Under +1.5 °C Global Warming. Earth Future 2018, 6, 264–285. [Google Scholar] [CrossRef]
- Koutroulis, A.G.; Grillakis, M.G.; Daliakopoulos, I.N.; Tsanis, I.K.; Jacob, D. Cross sectoral impacts on water availability at +2 °C and +3 °C for east Mediterranean island states: The case of Crete. J. Hydrol. 2016, 532, 16–28. [Google Scholar] [CrossRef]
- Dezsi, S.; Mîndrescu, M.; Petrea, D.; Rai, P.K.; Hamann, A.; Nistor, M.-M. High-resolution projections of evapotranspiration and water availability for Europe under climate change. Int. J. Climatol. 2018, 38, 3832–3841. [Google Scholar] [CrossRef]
- Forzieri, G.; Feyen, L.; Russo, S.; Vousdoukas, M.; Alfieri, L.; Outten, S.; Migliavacca, M.; Bianchi, A.; Rojas, R.; Cid, A. Multi-hazard assessment in Europe under climate change. Clim. Chang. 2016, 137, 105–119. [Google Scholar] [CrossRef] [Green Version]
- Ruosteenoja, K.; Markkanen, T.; Venäläinen, A.; Räisänen, P.; Peltola, H. Seasonal soil moisture and drought occurrence in Europe in CMIP5 projections for the 21st century. Clim. Dyn. 2018, 50, 1177–1192. [Google Scholar] [CrossRef]
- Stahl, K.; Kohn, I.; Blauhut, V.; Urquijo, J.; De Stefano, L.; Acacio, V.; Dias, S.; Stagge, J.H.; Tallaksen, L.M.; Kampragou, E.; et al. Impacts of European drought events: Insights from an international database of text-based reports. Nat. Hazards Earth Syst. Sci. 2015, 3, 5453–5492. [Google Scholar] [CrossRef]
- Van Lanen, H.A.J.; Laaha, G.; Kingston, D.G.; Gauster, T.; Ionita, M.; Vidal, J.-P.; Vlnas, R.; Tallaksen, L.M.; Stahl, K.; Hannaford, J.; et al. Hydrology needed to manage droughts: The 2015 European case. Hydrol. Process. 2016, 30, 3097–3104. [Google Scholar] [CrossRef]
- Moore, F.C.; Lobell, D.B. Adaptation potential of European agriculture in response to climate change. Nat. Clim. Chang. 2014, 4, 610–614. [Google Scholar] [CrossRef]
- Iglesias, A.; Garrote, L. Adaptation strategies for agricultural water management under climate change in Europe. Agric. Water Manag. 2015, 155, 113–124. [Google Scholar] [CrossRef] [Green Version]
- Llop, M.; Ponce-Alifonso, X.; Llop, M.; Ponce-Alifonso, X. Water and Agriculture in a Mediterranean Region: The Search for a Sustainable Water Policy Strategy. Water 2016, 8, 66. [Google Scholar] [CrossRef]
- Escribano Francés, G.; Quevauviller, P.; San Martín González, E.; Vargas Amelin, E. Climate change policy and water resources in the EU and Spain. A closer look into the Water Framework Directive. Environ. Sci. Policy 2017, 69, 1–12. [Google Scholar] [CrossRef]
- Bos, M.G.; Nugteren, J. On irrigation efficiencies. In ILRI Publication 19; International Institute for Land Reclamation and Improvement (ILRI): Wageningen, The Netherlands, 1974. [Google Scholar]
- Bastiaanssen, W.G.M.; Steduto, P. The water productivity score (WPS) at global and regional level: Methodology and first results from remote sensing measurements of wheat, rice and maize. Sci. Total Environ. 2017, 575, 595–611. [Google Scholar] [CrossRef] [PubMed]
- Simons, G.W.H.; Bastiaanssen, W.G.M.; Immerzeel, W.W. Water reuse in river basins with multiple users: A literature review. J. Hydrol. 2015, 522, 558–571. [Google Scholar] [CrossRef]
- Lavrnić, S.; Zapater-Pereyra, M.; Mancini, M.L. Water Scarcity and Wastewater Reuse Standards in Southern Europe: Focus on Agriculture. Water Air Soil Pollut. 2017, 228, 251. [Google Scholar] [CrossRef]
- Ricart, S.; Rico, A.M. Assessing technical and social driving factors of water reuse in agriculture: A review on risks, regulation and the yuck factor. Agric. Water Manag. 2019, 217, 426–439. [Google Scholar] [CrossRef]
- Hoekstra, A.; Chapagain, A.; van Oel, P.; Hoekstra, A.Y.; Chapagain, A.K.; Van Oel, P.R. Advancing Water Footprint Assessment Research: Challenges in Monitoring Progress towards Sustainable Development Goal 6. Water 2017, 9, 438. [Google Scholar] [CrossRef]
- Bisselink, B.; Bernhard, J.; Gelati, E.; Adamovic, M.; Guenther, S.; Mentaschi, L.; De Roo, A. Impact of a Changing Climate, Land Use, and Water Usage on Europe’s Water Resources; Publications Office of the European Union: Luxembourg, Luxembourg, 2018; ISBN 9789279802874. [Google Scholar]
- Roudier, P.; Andersson, J.C.M.; Donnelly, C.; Feyen, L.; Greuell, W.; Ludwig, F. Projections of future floods and hydrological droughts in Europe under a +2 °C global warming. Clim. Chang. 2016, 135, 341–355. [Google Scholar] [CrossRef]
- Samaniego, L.; Thober, S.; Kumar, R.; Wanders, N.; Rakovec, O.; Pan, M.; Zink, M.; Sheffield, J.; Wood, E.F.; Marx, A. Anthropogenic warming exacerbates European soil moisture droughts. Nat. Clim. Chang. 2018, 8, 421–426. [Google Scholar] [CrossRef]
- Panagopoulos, Y.; Stefanidis, K.; Faneca Sanchez, M.; Sperna Weiland, F.; Van Beek, R.; Venohr, M.; Globevnik, L.; Mimikou, M.; Birk, S.; Panagopoulos, Y.; et al. Pan-European Calculation of Hydrologic Stress Metrics in Rivers: A First Assessment with Potential Connections to Ecological Status. Water 2019, 11, 703. [Google Scholar] [CrossRef]
- Macknick, J.; Newmark, R.; Heath, G.; Hallett, K.C. Operational water consumption and withdrawal factors for electricity generating technologies: A review of existing literature. Environ. Res. Lett. 2012, 7, 045802. [Google Scholar] [CrossRef]
- Koutroulis, A.G.; Papadimitriou, L.V.; Grillakis, M.G.; Tsanis, I.K.; Wyser, K.; Betts, R.A. Freshwater vulnerability under high end climate change. A pan-European assessment. Sci. Total Environ. 2018, 613, 271–286. [Google Scholar] [CrossRef] [PubMed]
- Lobanova, A.; Liersch, S.; Nunes, J.P.; Didovets, I.; Stagl, J.; Huang, S.; Koch, H.; del Rivas López, M.R.; Maule, C.F.; Hattermann, F.; et al. Hydrological impacts of moderate and high-end climate change across European river basins. J. Hydrol. Reg. Stud. 2018, 18, 15–30. [Google Scholar] [CrossRef]
- Beck, H.E.; Vergopolan, N.; Pan, M.; Levizzani, V.; van Dijk, A.I.J.M.; Weedon, G.P.; Brocca, L.; Pappenberger, F.; Huffman, G.J.; Wood, E.F. Global-scale evaluation of 22 precipitation datasets using gauge observations and hydrological modeling. Hydrol. Earth Syst. Sci. 2017, 21, 6201–6217. [Google Scholar] [CrossRef] [Green Version]
- Naz, B.S.; Kurtz, W.; Montzka, C.; Sharples, W.; Goergen, K.; Keune, J.; Gao, H.; Springer, A.; Hendricks Franssen, H.-J.; Kollet, S. Improving soil moisture and runoff simulations at 3 km over Europe using land surface data assimilation. Hydrol. Earth Syst. Sci. 2019, 23, 277–301. [Google Scholar] [CrossRef] [Green Version]
- Haro, D.; Solera, A.; Paredes, J. Methodology for drought risk assessment in within-year regulated reservoir systems. Application to the Orbigo River system (Spain). Water Resour. Manag. 2014, 28, 3801–3814. [Google Scholar]
- Zaniolo, M.; Giuliani, M.; Castelletti, A.F.; Pulido-Velazquez, M. Automatic design of basin-specific drought indexes for highly regulated water systems. Hydrol. Earth Syst. Sci. 2018, 22, 2409–2424. [Google Scholar] [CrossRef] [Green Version]
- Koutroulis, A.G.; Tsanis, I.K.; Daliakopoulos, I.N.; Jacob, D. Impact of climate change on water resources status: A case study for Crete Island, Greece. J. Hydrol. 2013, 479, 146–158. [Google Scholar] [CrossRef] [Green Version]
- Vargas-Amelin, E.; Pindado, P. The challenge of climate change in Spain: Water resources, agriculture and land. J. Hydrol. 2014, 518, 243–249. [Google Scholar] [CrossRef]
- Giuliani, M.; Li, Y.; Castelletti, A.; Gandolfi, C. A coupled human-natural systems analysis of irrigated agriculture under changing climate. Water Resour. Res. 2016, 52, 6928–6947. [Google Scholar] [CrossRef]
- Giuliani, M.; Castelletti, A. Is robustness really robust? How different definitions of robustness impact decision-making under climate change. Clim. Chang. 2016, 135, 409–424. [Google Scholar] [CrossRef]
- Grindlay, A.L.; Zamorano, M.; Rodríguez, M.I.; Molero, E.; Urrea, M.A. Implementation of the European Water Framework Directive: Integration of hydrological and regional planning at the Segura River Basin, southeast Spain. Land Use Policy 2011, 28, 242–256. [Google Scholar] [CrossRef]
- Quevauviller, P.; Barceló, D.; Beniston, M.; Djordjevic, S.; Harding, R.J.; Iglesias, A.; Ludwig, R.; Navarra, A.; Navarro Ortega, A.; Mark, O.; et al. Integration of research advances in modelling and monitoring in support of WFD river basin management planning in the context of climate change. Sci. Total Environ. 2012, 440, 167–177. [Google Scholar] [CrossRef] [PubMed] [Green Version]
- UNSD SEEA-Water: System of Environmental-Economic Accounting for Water; UNSD: New York, NY, USA, 2012.
- Edens, B.; Graveland, C. Experimental valuation of Dutch water resources according to SNA and SEEA. Water Resour. Econ. 2014, 7, 66–81. [Google Scholar] [CrossRef]
- Pedro-Monzonís, M.; Jiménez-Fernández, P.; Solera, A.; Jiménez-Gavilán, P. The use of AQUATOOL DSS applied to the System of Environmental-Economic Accounting for Water (SEEAW). J. Hydrol. 2016, 533, 1–14. [Google Scholar] [CrossRef]
- Gouveia, C.M.; Trigo, R.M.; Beguería, S.; Vicente-Serrano, S.M. Drought impacts on vegetation activity in the Mediterranean region: An assessment using remote sensing data and multi-scale drought indicators. Glob. Planet. Chang. 2017, 151, 15–27. [Google Scholar] [CrossRef]
- Borrego-marín, M.M.; Gutiérrez-martín, C.; Berbel, J. Water productivity under drought conditions estimated using SEEA-Water. Water 2016, 8, 138. [Google Scholar] [CrossRef]
- Contreras, S.; Hunink, J.E. Water Accounting at the Basin Scale: Water Use and Supply (2000–2010) in the Segura River Basin Using the SEEA Framework; FutureWater: Wageningen, The Netherlands, 2015. [Google Scholar]
- Gutiérrez-Martín, C.; Borrego-Marín, M.; Berbel, J.; Gutiérrez-Martín, C.; Borrego-Marín, M.M.; Berbel, J. The Economic Analysis of Water Use in the Water Framework Directive Based on the System of Environmental-Economic Accounting for Water: A Case Study of the Guadalquivir River Basin. Water 2017, 9, 180. [Google Scholar] [CrossRef]
- Dimova, G.; Tzanov, E.; Ninov, P.; Ribarova, I.; Kossida, M. Complementary Use of the WEAP Model to Underpin the Development of SEEAW Physical Water Use and Supply Tables. Procedia Eng. 2014, 70, 563–572. [Google Scholar] [CrossRef] [Green Version]
- Vardon, M.; Lenzen, M.; Peevor, S.; Creaser, M. Water accounting in Australia. Ecol. Econ. 2007, 61, 650–659. [Google Scholar] [CrossRef]
- Godfrey, J.M.; Chalmers, K. Water Accounting: International Approaches to Policy and Decision-Making; Edward Elgar Publishing: Cheltenham, UK, 2012. [Google Scholar]
- Pedro-Monzonís, M.; del Longo, M.; Solera, A.; Pecora, S.; Andreu, J. Water Accounting in the Po River Basin Applied to Climate Change Scenarios. Procedia Eng. 2016, 162, 246–253. [Google Scholar] [CrossRef] [Green Version]
- Momblanch, A.; Andreu, J.; Paredes-Arquiola, J.; Solera, A.; Pedro-Monzonís, M. Adapting water accounting for integrated water resource management. The Júcar Water Resource System (Spain). J. Hydrol. 2014, 519, 3369–3385. [Google Scholar] [CrossRef]
- Karimi, P.; Bastiaanssen, W.G.M.; Molden, D. Water Accounting Plus (WA+)—A water accounting procedure for complex river basins based on satellite measurements. Hydrol. Earth Syst. Sci. 2012, 9, 12879–12919. [Google Scholar] [CrossRef]
- Karimi, P.; Bastiaanssen, W.G.M.; Molden, D.; Cheema, M.J.M. Basin-wide water accounting based on remote sensing data: An application for the Indus Basin. Hydrol. Earth Syst. Sci. 2013, 17, 2473–2486. [Google Scholar] [CrossRef]
- Bastiaanssen, W.G.M.; Allen, R.G.; Droogers, P.; D’Urso, G.; Steduto, P. Twenty-five years modeling irrigated and drained soils: State of the art. Agric. Water Manag. 2007, 92, 111–125. [Google Scholar] [CrossRef]
- Molden, D. Accounting for Water Use and Productivity; Swim Paper; International Water Management Institute: Colombo, Sri Lanka, 1997. [Google Scholar]
- Falkenmark, M.; Rockström, J. The New Blue and Green Water Paradigm: Breaking New Ground for Water Resources Planning and Management. J. Water Resour. Plan. Manag. 2006, 132, 129–132. [Google Scholar] [CrossRef]
- Pérez-Martín, M. Modelo Distribuido de Simulación Del Ciclo Hidrológico Con Calidad de Aguas Integrado en Sistemas de Información Geográfica Para Grandes Cuencas. Aportación al Análisis de Presiones e Impactos de la Directiva Marco Europea Del Agua. Ph.D. Thesis, Universidad Politécnica de Valencia, Valencia, Spain, 2005. [Google Scholar]
- Falkenmark, M.; Berntell, A.; Jägerskog, A.; Lundqvist, J.; Matz, M.; Tropp, H. On the Verge of a New Water Scarcity: A Call for Good Governance and Human Ingenuity; Stockholm International Water Institute (SIWI): Stockholm, Sweden, 2007. [Google Scholar]
- Orth, R.; Destouni, G. Drought reduces blue-water fluxes more strongly than green-water fluxes in Europe. Nat. Commun. 2018, 9, 3602. [Google Scholar] [CrossRef] [PubMed]
- Van den Hurk, B.; Hirschi, M.; Schär, C.; Lenderink, G.; van Meijgaard, E.; van Ulden, A.; Rockel, B.; Hagemann, S.; Graham, P.; Kjellström, E.; et al. Soil Control on Runoff Response to Climate Change in Regional Climate Model Simulations. J. Clim. 2005, 18, 3536–3551. [Google Scholar] [CrossRef]
- Bergström, S.; Carlsson, B.; Gardelin, M.; Lindström, G.; Pettersson, A.; Rummukainen, M. Climate change impacts on runoff in Sweden-assessments by global climate models, dynamical downscaling and hydrological modelling. Clim. Res. 2001, 16, 101–112. [Google Scholar] [CrossRef] [Green Version]
- Arnell, N.W. The effect of climate change on hydrological regimes in Europe: A continental perspective. Glob. Environ. Chang. 1999, 9, 5–23. [Google Scholar] [CrossRef]
- Teuling, A.J.; Van Loon, A.F.; Seneviratne, S.I.; Lehner, I.; Aubinet, M.; Heinesch, B.; Bernhofer, C.; Grünwald, T.; Prasse, H.; Spank, U. Evapotranspiration amplifies European summer drought. Geophys. Res. Lett. 2013, 40, 2071–2075. [Google Scholar] [CrossRef]
- Destouni, G.; Prieto, C.; Destouni, G.; Prieto, C. Robust Assessment of Uncertain Freshwater Changes: The Case of Greece with Large Irrigation—And Climate-Driven Runoff Decrease. Water 2018, 10, 1645. [Google Scholar] [CrossRef]
- Suárez-Almiñana, S.; Pedro-Monzonís, M.; Paredes-Arquiola, J.; Andreu, J.; Solera, A. Linking Pan-European data to the local scale for decision making for global change and water scarcity within water resources planning and management. Sci. Total Environ. 2017, 603, 126–139. [Google Scholar] [CrossRef] [PubMed]
- Huang, Z.; Hejazi, M.; Tang, Q.; Vernon, C.R.; Liu, Y.; Chen, M.; Calvin, K. Global agricultural green and blue water consumption under future climate and land use changes. J. Hydrol. 2019, 574, 242–256. [Google Scholar] [CrossRef]
- Kahil, M.T.; Connor, J.D.; Albiac, J. Efficient water management policies for irrigation adaptation to climate change in Southern Europe. Ecol. Econ. 2015, 120, 226–233. [Google Scholar] [CrossRef] [Green Version]
- Velasco-Muñoz, J.F.; Aznar-Sánchez, J.A.; Belmonte-Ureña, L.J.; López-Serrano, M.J.; Velasco-Muñoz, J.F.; Aznar-Sánchez, J.A.; Belmonte-Ureña, L.J.; López-Serrano, M.J. Advances in Water Use Efficiency in Agriculture: A Bibliometric Analysis. Water 2018, 10, 377. [Google Scholar] [CrossRef]
- Berbel, J.; Mateos, L. Does investment in irrigation technology necessarily generate rebound effects? A simulation analysis based on an agro-economic model. Agric. Syst. 2014, 128, 25–34. [Google Scholar] [CrossRef]
- Faergemann, H. Update on Water Scarcity and Droughts Indicator Development; EC Expert Group Water Scarcity & Droughts; European Commission: Kopenhagen, Denmark, 2012. [Google Scholar]
- Pedro-Monzonís, M.; Ferrer, J.; Solera, A.; Estrela, T.; Paredes-Arquiola, J. Water Accounts and Water Stress Indexes in the European Context of Water Planning: The Jucar River Basin. Procedia Eng. 2014, 89, 1470–1477. [Google Scholar] [CrossRef] [Green Version]
- Vanham, D.; Hoekstra, A.Y.; Wada, Y.; Bouraoui, F.; de Roo, A.; Mekonnen, M.M.; van de Bund, W.J.; Batelaan, O.; Pavelic, P.; Bastiaanssen, W.G.M.; et al. Physical water scarcity metrics for monitoring progress towards SDG target 6.4: An evaluation of indicator 6.4.2 “Level of water stress”. Sci. Total Environ. 2018, 613, 218–232. [Google Scholar] [CrossRef] [PubMed]
- Liu, J.; Yang, H.; Gosling, S.N.; Kummu, M.; Flörke, M.; Pfister, S.; Hanasaki, N.; Wada, Y.; Zhang, X.; Zheng, C.; et al. Water scarcity assessments in the past, present, and future. Earth Future 2017, 5, 545–559. [Google Scholar] [CrossRef] [PubMed]
- Wada, Y.; van Beek, L.P.H.; Viviroli, D.; Dürr, H.H.; Weingartner, R.; Bierkens, M.F.P. Global monthly water stress: 2 Water demand and severity of water stress. Water Resour. Res. 2011, 47, W07518. [Google Scholar] [CrossRef]
- Eekhout, J.P.C.; Hunink, J.E.; Terink, W.; de Vente, J. Why increased extreme precipitation under climate change negatively affects water security. Hydrol. Earth Syst. Sci. 2018, 22, 5935–5946. [Google Scholar] [CrossRef] [Green Version]
- Pellicer-Martínez, F.; Martínez-Paz, J.M. Climate change effects on the hydrology of the headwaters of the Tagus River: Implications for the management of the Tagus–Segura transfer. Hydrol. Earth Syst. Sci. 2018, 22, 6473–6491. [Google Scholar] [CrossRef]
- Navarro, T. Water reuse and desalination in Spain—Challenges and opportunities. J. Water Reuse Desalin. 2018, 8, 153–168. [Google Scholar] [CrossRef]
- García-Rubio, M.A.; Guardiola, J. Desalination in Spain: A Growing Alternative for Water Supply. Int. J. Water Resour. Dev. 2012, 28, 171–186. [Google Scholar] [CrossRef]
- CHJ. Plan Hidrológico de la Demarcación Hidrográfica Del Júcar; Memoria; Confederación Hidrográfia del Júcar: Valencia, Spain, 2015; p. 852. [Google Scholar]
- Andreu, J.; Solera, S.; Capilla, J.; Ferrer, J. Modelo SIMGES Para Simulación de Cuencas; Manual de Usuario v3. 00; Universidad Politécnica Valencia: Valencia, Spain, 2007. [Google Scholar]
- Andreu, J.; Capilla, J.; Sanchís, E. AQUATOOL, a generalized decision-support system for water-resources planning and operational management. J. Hydrol. 1996, 177, 269–291. [Google Scholar] [CrossRef]
- Andreu, J.; Ferrer-Polo, J. Decision support system for drought planning and management in the Jucar river basin, Spain. In Proceedings of the 18th World IMACS/MODSIM Congress, Cairns, Australia, 13–17 July 2009; pp. 3223–3229. [Google Scholar]
- Pedro Monzonís, M. Assessment of Water Exploitation Indexes Based on Water Accounting. Ph.D. Thesis, Universitat Politecnica de Valencia, Valencia, Spain, 2016. [Google Scholar]
- CEDEX. Evaluación Del Impacto Del Cambio Climático en Los Recursos Hídricos y Sequías de España; CEDEX: Madrid, Spain, 2017. [Google Scholar]


| Inflows | Outflow | Others |
|---|---|---|
| Precipitation Interbasin transfer Upstream tributaries Lateral groundwater inflow Desalination | Green water evapotranspiration Blue water evapotranspiration Utilizable outflow Committed outflow Environmental outflow Non-utilizable outflow Interbasin transfer Lateral groundwater outflow | Total water withdrawal Agricultural water withdrawal Surface storage change Subsurface storage change |
| Abbreviation | Case Study Basin | Country | Climate (Köppen Classification) | Total Area (km2) | Agricultural Area (%) |
|---|---|---|---|---|---|
| SEG | Segura | ES | Semi-arid (BSk)/Mediterranean (Csa) | 18,870 | 45 |
| JUC | Jucar | ES | Semi-arid (BSk)/Mediterranean (Csa) | 22,187 | 35 |
| LCO | Lake Como | IT | Humid continental (Dfb) | 4500 | 31 |
| MES | Messara | GR | Mediterranean (Csa) | 400 | 63 |
| RHI | Delta Rhine (only NL) | NL | Temperate oceanic (Cfb) | 25,347 | 55 |
| ID | Horizon | Emission Scenario 1 | Name 1 |
|---|---|---|---|
| 1 | Baseline | BL | |
| 2 | Near Future | RCP4.5 | NF45 |
| 3 | Near Future | RCP8.5 | NF85 |
| 4 | Far Future | RCP4.5 | FF45 |
| 5 | Far Future | RCP8.5 | FF85 |
| Type | Name | Derived from |
|---|---|---|
| Water availability | Total Water Availability | Precipitation + Interbasin transfer + Upstream tributaries + Lateral groundwater inflow + Desalination |
| Blue Water Availability | Total water availability − Green water evapotranspiration | |
| Water use | Green Water Use Agriculture | Evapotranspiration from Rainfed Agriculture + Evapotranspiration (only green) from Irrigated Agriculture |
| Blue Water Use Agriculture | Evapotranspiration (only blue, originating from field external supplies) for Irrigated Agriculture | |
| Blue water dependency | Blue Water Available versus Total Water Available | Blue Water Available/Total Water Available |
| Blue Water Use versus Total Water Use | Blue Water Use (all sectors)/Total Water Use (green and blue) | |
| Water Stress | Green Water Use versus Total Water Available | Green Water Use (all land-uses)/Total Water Available |
| Blue Water Use versus Blue Water Available | Blue Water Use (all sectors)/Blue Water Available |
© 2019 by the authors. Licensee MDPI, Basel, Switzerland. This article is an open access article distributed under the terms and conditions of the Creative Commons Attribution (CC BY) license (http://creativecommons.org/licenses/by/4.0/).
Share and Cite
Hunink, J.; Simons, G.; Suárez-Almiñana, S.; Solera, A.; Andreu, J.; Giuliani, M.; Zamberletti, P.; Grillakis, M.; Koutroulis, A.; Tsanis, I.; et al. A Simplified Water Accounting Procedure to Assess Climate Change Impact on Water Resources for Agriculture across Different European River Basins. Water 2019, 11, 1976. https://doi.org/10.3390/w11101976
Hunink J, Simons G, Suárez-Almiñana S, Solera A, Andreu J, Giuliani M, Zamberletti P, Grillakis M, Koutroulis A, Tsanis I, et al. A Simplified Water Accounting Procedure to Assess Climate Change Impact on Water Resources for Agriculture across Different European River Basins. Water. 2019; 11(10):1976. https://doi.org/10.3390/w11101976
Chicago/Turabian StyleHunink, Johannes, Gijs Simons, Sara Suárez-Almiñana, Abel Solera, Joaquín Andreu, Matteo Giuliani, Patrizia Zamberletti, Manolis Grillakis, Aristeidis Koutroulis, Ioannis Tsanis, and et al. 2019. "A Simplified Water Accounting Procedure to Assess Climate Change Impact on Water Resources for Agriculture across Different European River Basins" Water 11, no. 10: 1976. https://doi.org/10.3390/w11101976