Drought Vulnerability Indices in Mexico


Instituto Mexicano de Tecnología del Agua, Paseo Cuauhnáhuac 8532, Col. Progreso, 62550 Jiutepec, Mexico
*
Author to whom correspondence should be addressed.
Water 2018, 10(11), 1671; https://doi.org/10.3390/w10111671
Submission received: 2 October 2018
/
Revised: 9 November 2018
/
Accepted: 13 November 2018
/
Published: 16 November 2018
(This article belongs to the Section Water Use and Scarcity)
Abstract
:Drought is one of the most harmful hydro climatic threats to society. Mexico has been historically affected by recurring and long-lasting droughts that have severely impacted society and the economy. Consequently, public programs and policies have been developed in order to reduce the country’s vulnerability to drought, hence the importance of identifying the spatial distribution and the dimension—even in relative terms only—of vulnerability in different regions from social, economic, and environmental perspectives. This article presents a method for obtaining indices and maps of vulnerability to drought in Mexico; indices and maps are based on a set of socioeconomic and environmental indicators that the method combines using an objective analytic procedure that identifies the most vulnerable states and municipalities from social, economic, and environmental perspectives, all of which converge in overall vulnerability to drought. The results obtained indicate that 38.9% of total Mexican population inhabits municipalities with high and very high degrees of overall vulnerability to drought. For this reason, it is necessary to continue implementing actions and preventive and mitigation strategies via public policies and social programs aimed at decreasing the country’s vulnerability to the occurrence of drought events. This is the only way to facilitate the necessary conditions to reduce the impact of drought and to decrease people’s vulnerability to this phenomenon.
1. Introduction
Drought is a natural aspect of climate; it is inevitable and recurs in every region of the world [1]. It is one of the most complex of natural phenomena, and one of the most harmful to world population [2]. Nevertheless, as a result of different criteria used by different authors and the complexity of the phenomenon, a universally accepted definition of drought is still unavailable. However, drought is generally accepted to be a natural phenomenon taking place when the precipitation registered over a period of time in a specific region is lower than normal, and the deficit is large and lasting enough to adversely affect human activity and ecosystems [3,4].
Specialized literature recognizes different types of drought, which are determined by the types of impact produced by the phenomenon. Drought is thus considered from meteorological, hydrological, agricultural, and socioeconomic points of view (e.g., [3,4,5,6]). Several methods have been developed to determine the characteristics of drought (frequency, duration, magnitude and severity) from the physical point of view. These methods allow the calculation of drought indices by processing different meteorological and hydrological variables (precipitation, temperature, evapotranspiration, runoffs, soil moisture, etc.). Some of these methods include: the Palmer Drought Severity Index (PDSI) [7]; Standardized Precipitation Index (SPI) [8]; Drought Recognition Index (DRI) [9]; Standardized Precipitation and Evapotranspiration Index (SPEI) [10]; Streamflow Drought Index (SDI) [11]; among others (there are several articles devoted specifically to collecting and analyzing drought indices, e.g., [5,6,12,13]). To solve the problems related to the indices derived using many of the common drought indices, such as skewness in both space and time, the use of coarse temporal scales, etc., new methods are being proposed such Standardized Non-Parametric Indices (SNPI) [14]. Whereas SPI makes use of precipitation only, others like SPEI and SNPI consider the difference between precipitation and potential evapotranspiration for a more considered representation of the water balance.
Besides its direct effects on forest and agricultural production, drought can disrupt water supply for human consumption, force populations to migrate, and in extreme cases it can result in famine and death for people and animals [15,16]. As opposed to other natural phenomena whose impacts are local and short-term, droughts involve large geographical areas, and their consequences can prevail for years in the form of adverse effects on the quality of life and development of affected populations [17].
Historically, Mexico has been affected by recurring droughts [16,18], and their frequency and severity have increased over the past years, very probably as a consequence of global climate change [19]. The country has registered several years of rainfall deficit over the past decades; consequently, frequent droughts have devastated large agricultural extensions and rural communities and have contributed to serious economic maladjustments at the regional and national levels, as was the case during the 2011–2012 drought, the most severe in 70 years, which affected more than 80% of the national territory [20].
In an attempt to address the situation, the Mexican federal government decided to put in place a drought public policy in 2013 [21,22], and created the Intersecretarial Commission for Drought and Flood Attention (CIASI, by its acronym in Spanish) to implement and follow up on said policy. The National Program Against Drought (PRONACOSE, by its acronym in Spanish) was implemented as a guideline for this public policy; the program is intended to enforce a series of preventive and mitigating measures to reduce the population’s vulnerability to drought [23], bearing in mind that the risk of disaster by drought depends not only on the degree of rainfall scarcity and the duration and geographical scope of the phenomenon, but also on conditions of vulnerability that increase the chance of disaster when drought takes place [24].
In this regard, it is important to find out the spatial distribution of vulnerability to drought in the country and to determine its dimension, even if only in relative terms. However, no method to do this is unanimously accepted, which opens the door for scientists to select and propose the most appropriate method in each case according to the specific study. For instance, in recent years many studies on vulnerability have been carried out in several countries of the world, all of which use different methods and concepts (e.g., [25,26,27,28,29,30,31,32,33,34,35,36,37]). Likewise, in Mexico different studies on vulnerability to drought have been conducted in some states and regions of the country (e.g., [38,39,40,41]), but none of them have used the same procedures or methods. Similarly, different methods were used in the formulation of the Drought Prevention and Mitigation Measures Programs (PMPMS, by its acronym in Spanish), which were created in 2013 as an integral part of PRONACOSE for each of the 26 Watershed Councils in the country, which made it impossible to reach a consensus and obtain a national vulnerability to drought map [42].
For its part, the National Water Commission (CONAGUA, by its acronym in Spanish) published a study presenting a spatial analysis of the regions of highest vulnerability to drought in Mexico [43]. This research reports on a quantitative analysis of vulnerability based on only five socioeconomic and environmental indicators examined at the “planning cell” level (i.e., group of municipalities within a same state and inside the limits of a hydrological sub-region), which is why the results obtained are “big scale” in the sense that only five planning cells are identified nationally as having very high vulnerability to drought, which is unrealistic given the wide diversity of municipalities in Mexico (even within the same state and planning cell). More recently, other authors have proposed a method to estimate drought vulnerability and risk in the Mexican hydrological-administrative regions (which encompass complete states) taking into account physical, economic, and social factors [44]; however, as was the case with the estimation by CONAGUA, their results are on a very big scale because the data they process is at a regional level and they only present charts, not national or regional drought vulnerability maps.
In this context, bearing in mind the contributions and limitations of previous proposals and the necessity of providing fine-scale elements for national level decision-making, the present study seeks to propose a method to determine maps and indices of social, economic, environmental, and overall vulnerability to drought in Mexico using relative indicators at the municipal scale. These maps and indices can be useful to officials responsible for making decisions and formulating public policies to identify investment priorities aimed at reducing vulnerability and to identify and propose effective risk management actions bearing in mind socioeconomic, social, and environmental aspects.
The paper is structured as follows. In Section 2, we describe the concept of vulnerability and its reference framework; Section 3 describes the methodology, which includes the sequential application of several steps for obtaining the drought vulnerability indices in Mexico; Section 4 includes the results and the discussion; and, finally, Section 5 summarises the main conclusions.
2. The Concept of Vulnerability and its Reference Framework
The concept of vulnerability has been explored by different disciplines such as anthropology, sociology, ecology, politics, earth science, and engineering [45,46,47,48,49]. Therefore, what researchers understand as vulnerability has been defined using different approaches and various background elements. However, vulnerability is generally accepted to be the frailty of an individual or system to some kind of threat, which can have a physical origin such as a drought, earthquake, or flood, or an anthropogenic origin such as an accident, devaluation, economic crisis, etc.
It is also important to bear in mind that vulnerability has a multifaceted and multidimensional nature [50,51,52], presents both spatial and temporal dynamics [50,53], and is always associated with a specific danger [52]. In this case, the relevant danger is the phenomenon of drought (understood in its widest sense, that is, a severe and lasting decrease of precipitation capable of causing serious hydrological imbalances and affecting human activities and ecosystems).
This study considers vulnerability to drought as the extent to which a system is susceptible to damage by drought and unable of coping with its adverse effects. Thus, vulnerability is linked with the potential impact of drought events and is used to evaluate the susceptibility of socioeconomic and environmental systems (represented by Mexican municipalities) to this natural phenomenon.
An important number of vulnerability evaluations have been conducted over the past years using various analyses and quantification approaches (e.g., [54,55,56]). However, the most widely used approaches are based on indicators, which express vulnerability using a series of indicators or composite indices representing the different aspects of vulnerability [57]. This perspective contributes to better understand the multidimensional nature of this variable, which is especially useful for decision-making processes aimed at reducing vulnerability.
Besides that, depending on the school of thought adopted by the authors of the aforementioned evaluations, vulnerability is generally explained based on different underlying components (resulting from a combination of indicators used to measure vulnerability), such as exposure-sensitivity-adaptive capacity [58,59], exposure-frailty-resilience [60], and risk-susceptibility-coping capacity [61], among others.
In the present study we have selected the model proposed by the Intergovernmental Panel on Climate Change (IPCC) [58,59], which explains vulnerability as a function of three components: exposure (E), sensitivity (S), and adaptive capacity (AC). Exposure refers to the presence of people; livelihoods; species or ecosystems; environmental functions, services and resources; infrastructure, or economic, social or cultural assets in places and environments that could be adversely affected. Sensitivity refers to the degree to which a system is affected, either negatively or positively, by climate-related stimuli. And adaptive capacity refers to the system’s ability to fit or adjust to climate change (including climate variability and extreme changes) in order to moderate potential damage, take advantage of positive consequences, or withstand the negative consequences [59]. Degree of exposure and sensitivity represent the potential impact (I) of the phenomenon (in other words, the expected amount of damage), and adaptive capacity is a measure of the extent to which the potential impact can be avoided; therefore, vulnerability equals potential impact minus adaptive capacity, as expressed by the following equation:
Based on Equation (1), exposure and sensitivity are directly related to vulnerability, while adaptive capacity helps to reduce it.
Given that vulnerability to drought is a complex phenomenon, it is useful to itemize it so that effective preparation and mitigation strategies and support programs can be designed. Therefore, it is important to bear in mind that, besides the possibility of separating vulnerability in the components described above, it is also possible to differentiate several types of vulnerability: physical, economic, social, political, institutional, educational, technical, etc. [62]. The present study analyzed four types of vulnerability: social, economic, environmental, and overall vulnerability to drought. The concepts proposed for the analysis of these types of vulnerability are described in the following paragraphs.
- ○
- Social vulnerability. This concept refers to the insecurity and defenselessness experienced by communities, families, and individuals when their life conditions are threatened by drought. Poverty, difficult access to health care, education, and housing services, among others, inhibit the capacity to prevent, mitigate, and promptly respond to a disaster situation due to hydrological deficit.
- ○
- Economic vulnerability. This refers to the insecurity and defenselessness of economic activities or production sectors in facing drought due to a lack of adequate infrastructure and technical assistance for production, difficulty to access credit and insurance, etc. The agricultural and stockbreeding sector is, without a doubt, the economic sector of highest vulnerability to drought because agriculture and stockbreeding are absolutely dependent on water to obtain profits. Therefore, the higher the dependence of a population on agriculture and stockbreeding the higher its economic vulnerability to drought.
- ○
- Environmental vulnerability. This concept is related to an intrinsic susceptibility of the environment or its natural resources to be negatively affected by the lack of water; all living beings need certain environmental conditions for their development, but when nature is deteriorated as a result of the destruction of environmental assets, ecosystems become highly vulnerable to hazards such as drought.
- ○
- Overall vulnerability. The three previously described types of vulnerability (social, economic, and environmental) converge in overall vulnerability, which encompasses socioeconomic and environmental factors.
Based on this reference framework, the present article reports on estimations of social, economic, environmental, and overall vulnerability indices for each municipality in Mexico and presents national vulnerability maps obtained using the method described in the next section.
3. Method
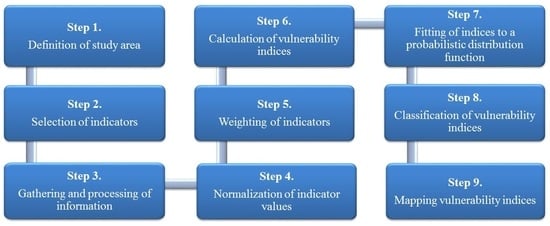
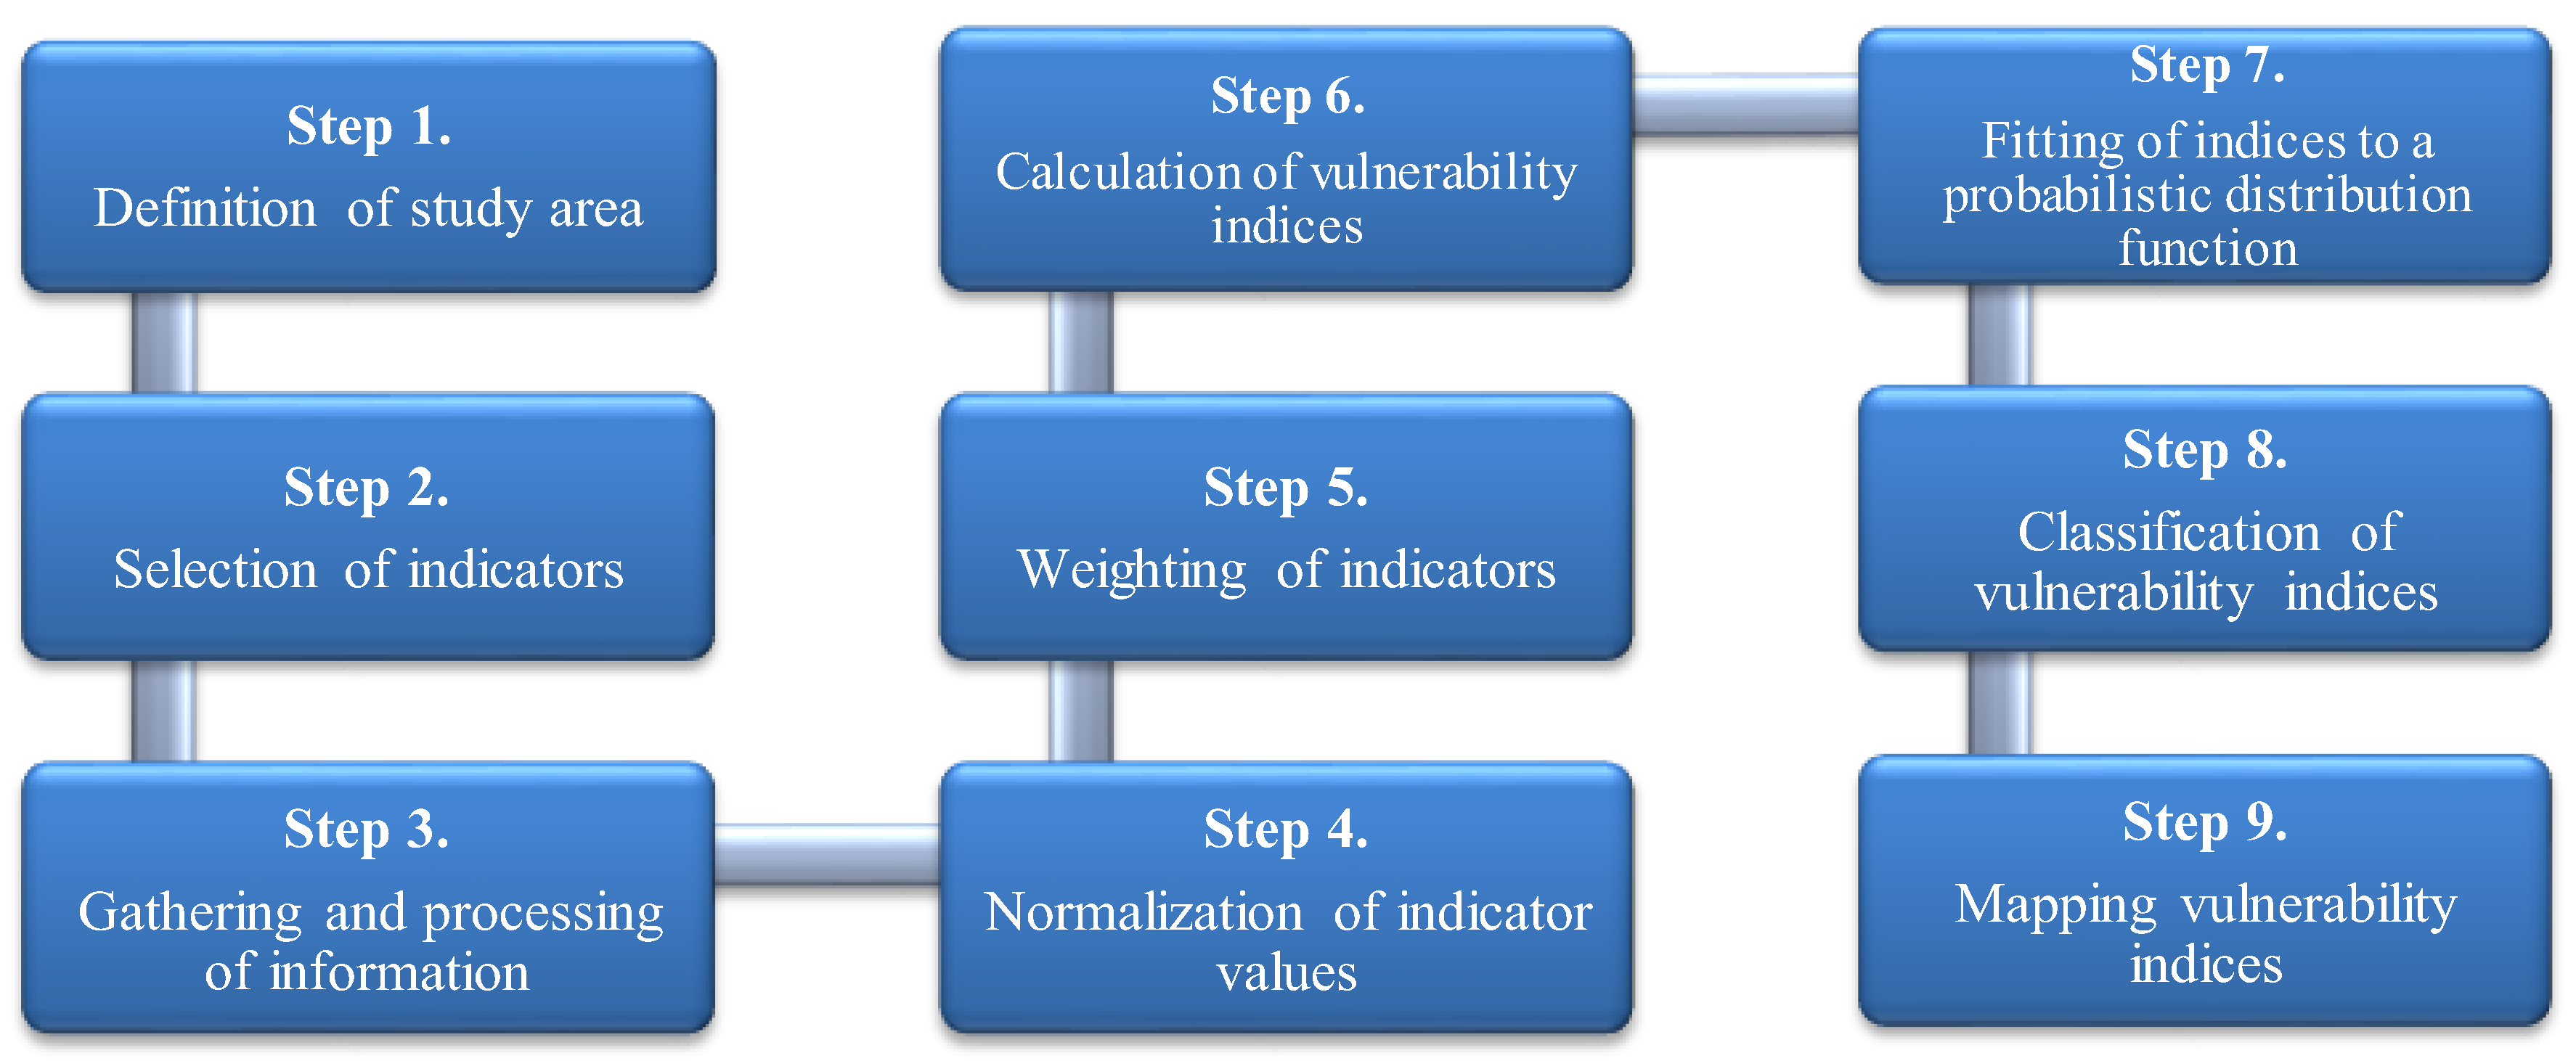
The method used in this study to construct drought vulnerability indices in Mexico is composed of the series of steps shown in Figure 1 and described in detail in the ensuing paragraphs.
3.1. Step 1. Limits and Description of Study Area
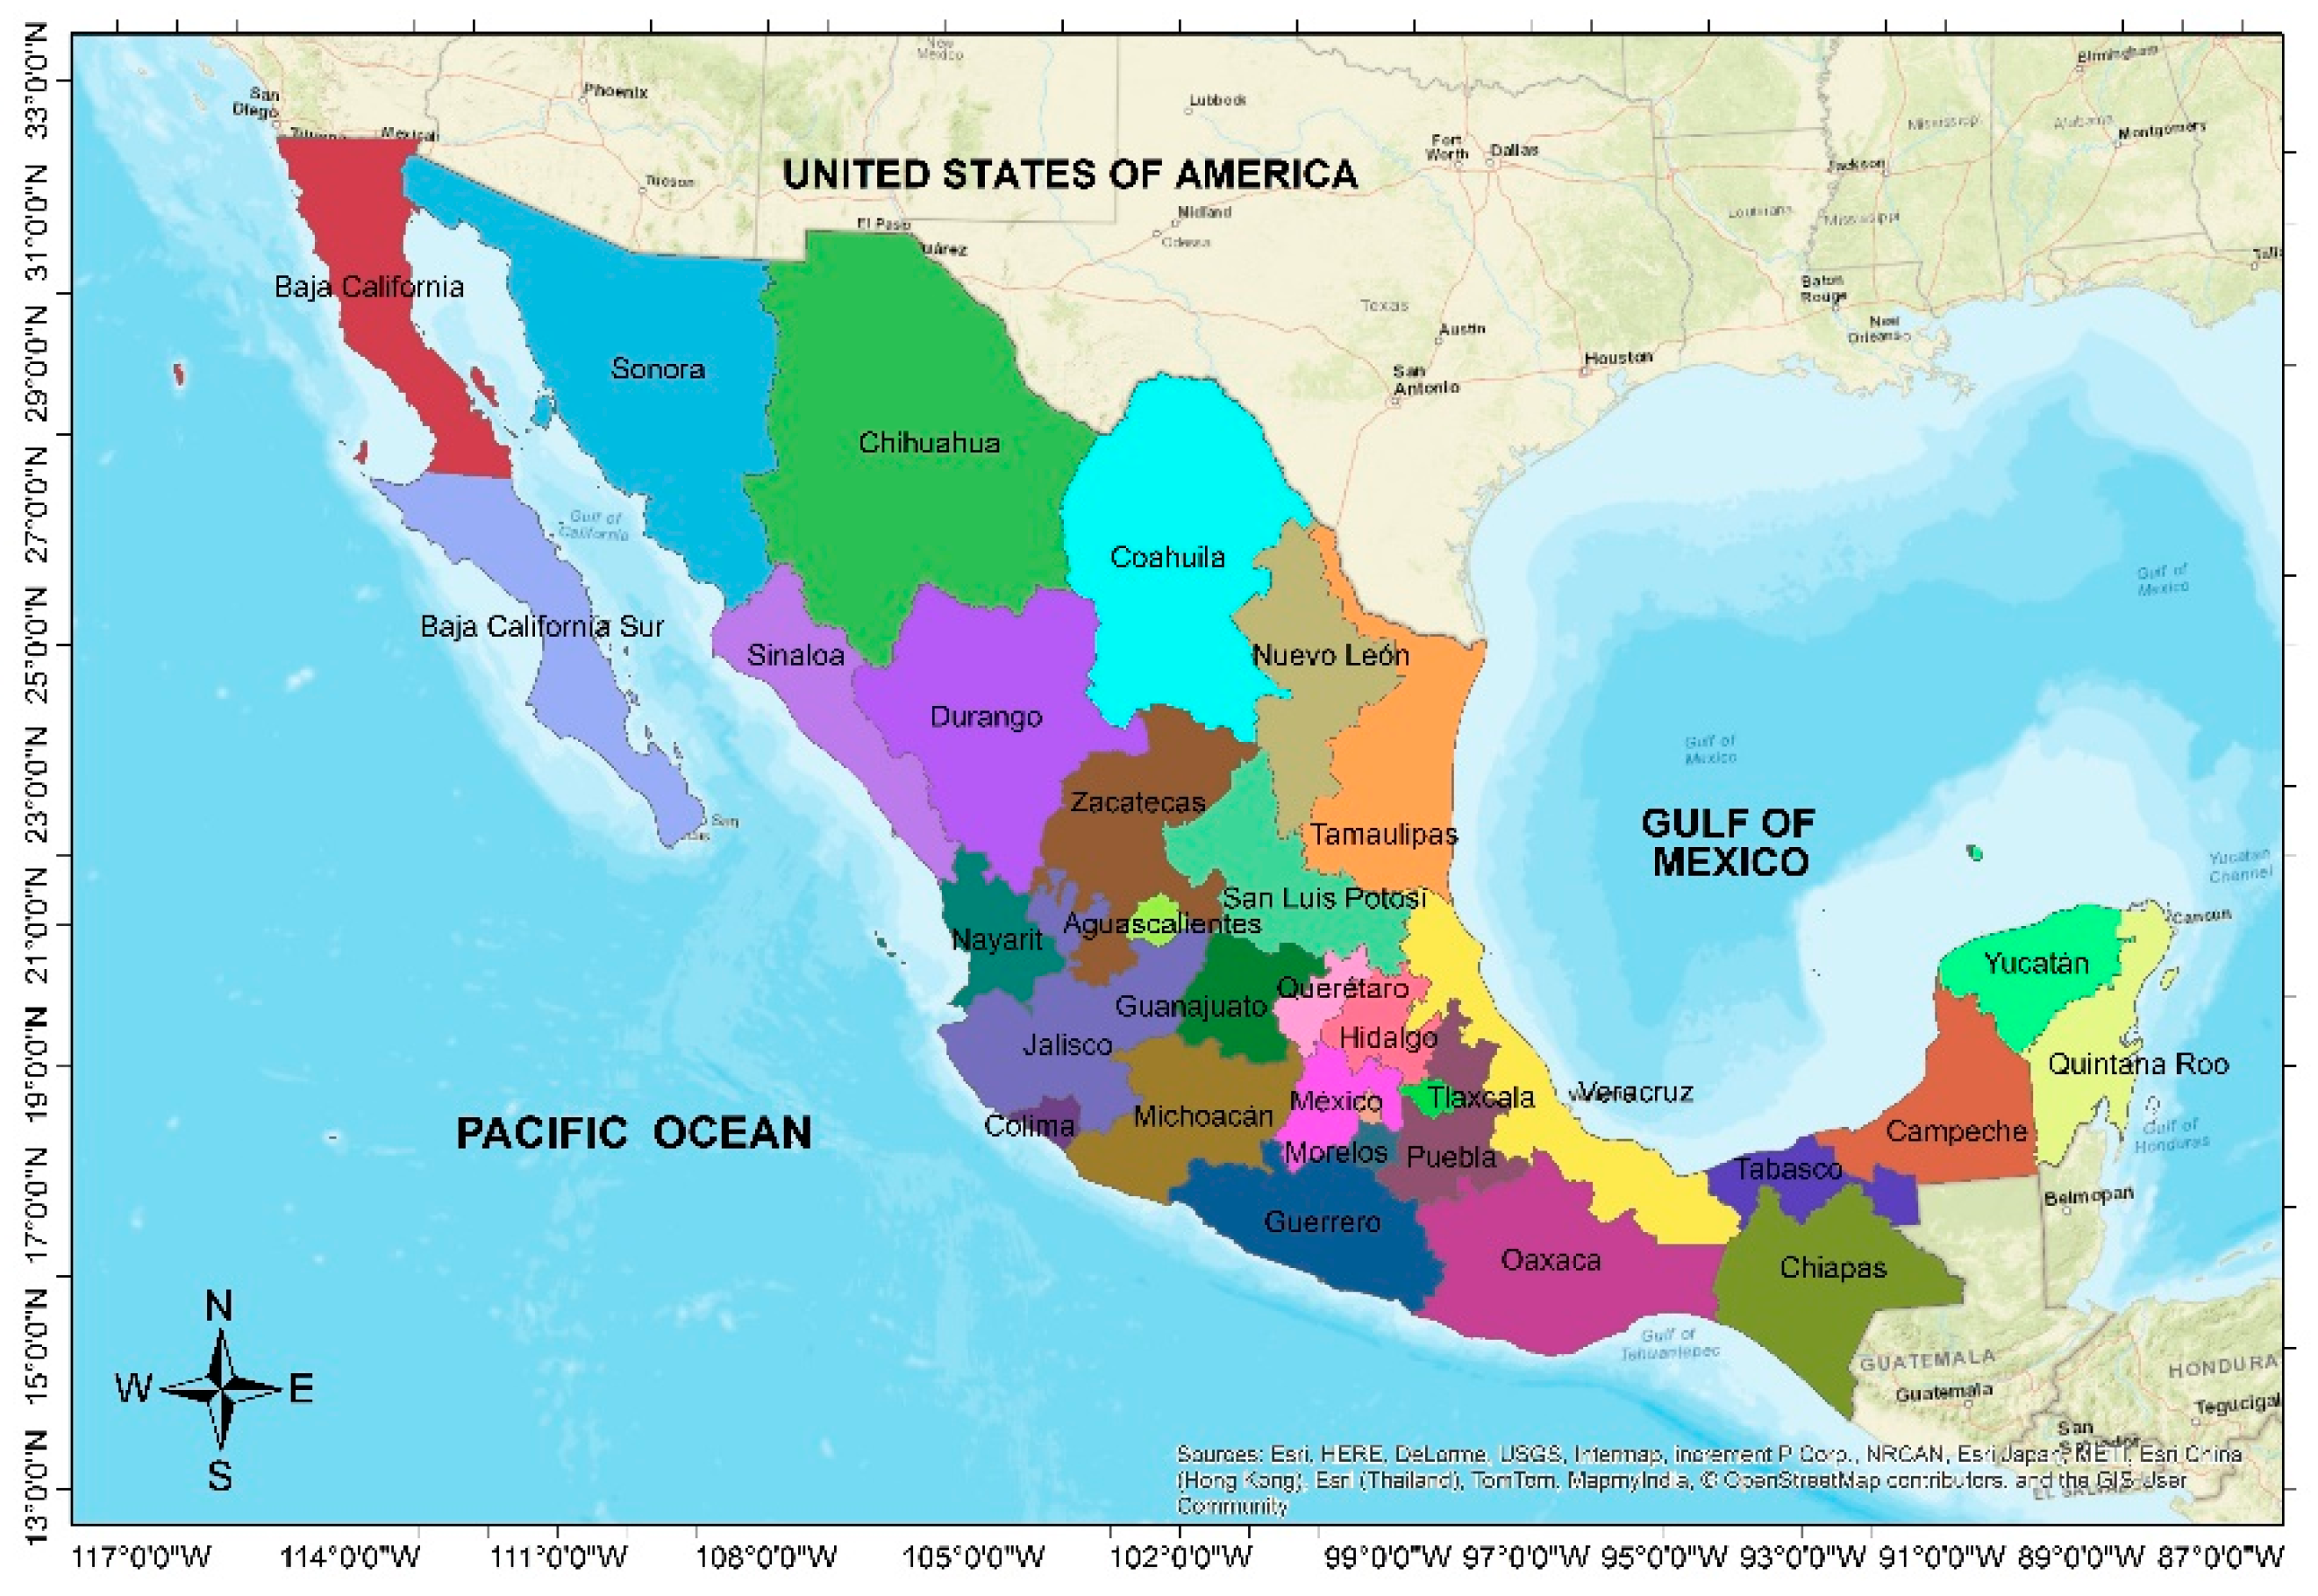
The study area consists of the Mexican Republic (Mexico) territory, which is located south of North America; it is bordered to the north by the United States of America and to the south by Belize and Guatemala, while the Gulf of Mexico and the Caribbean Sea lie to the east and the Pacific Ocean lies to the west (Figure 2). Mexico is composed of 32 federative entities, which are divided in 2456 municipalities. It is the fourteenth largest country in the world, totaling a surface close to 2 million square kilometers, and the eleventh most populated country, with a total population around 123.5 million inhabitants [63]. Appendix A presents a table with the distribution of the number of municipalities, territorial area, population, and population density per state.
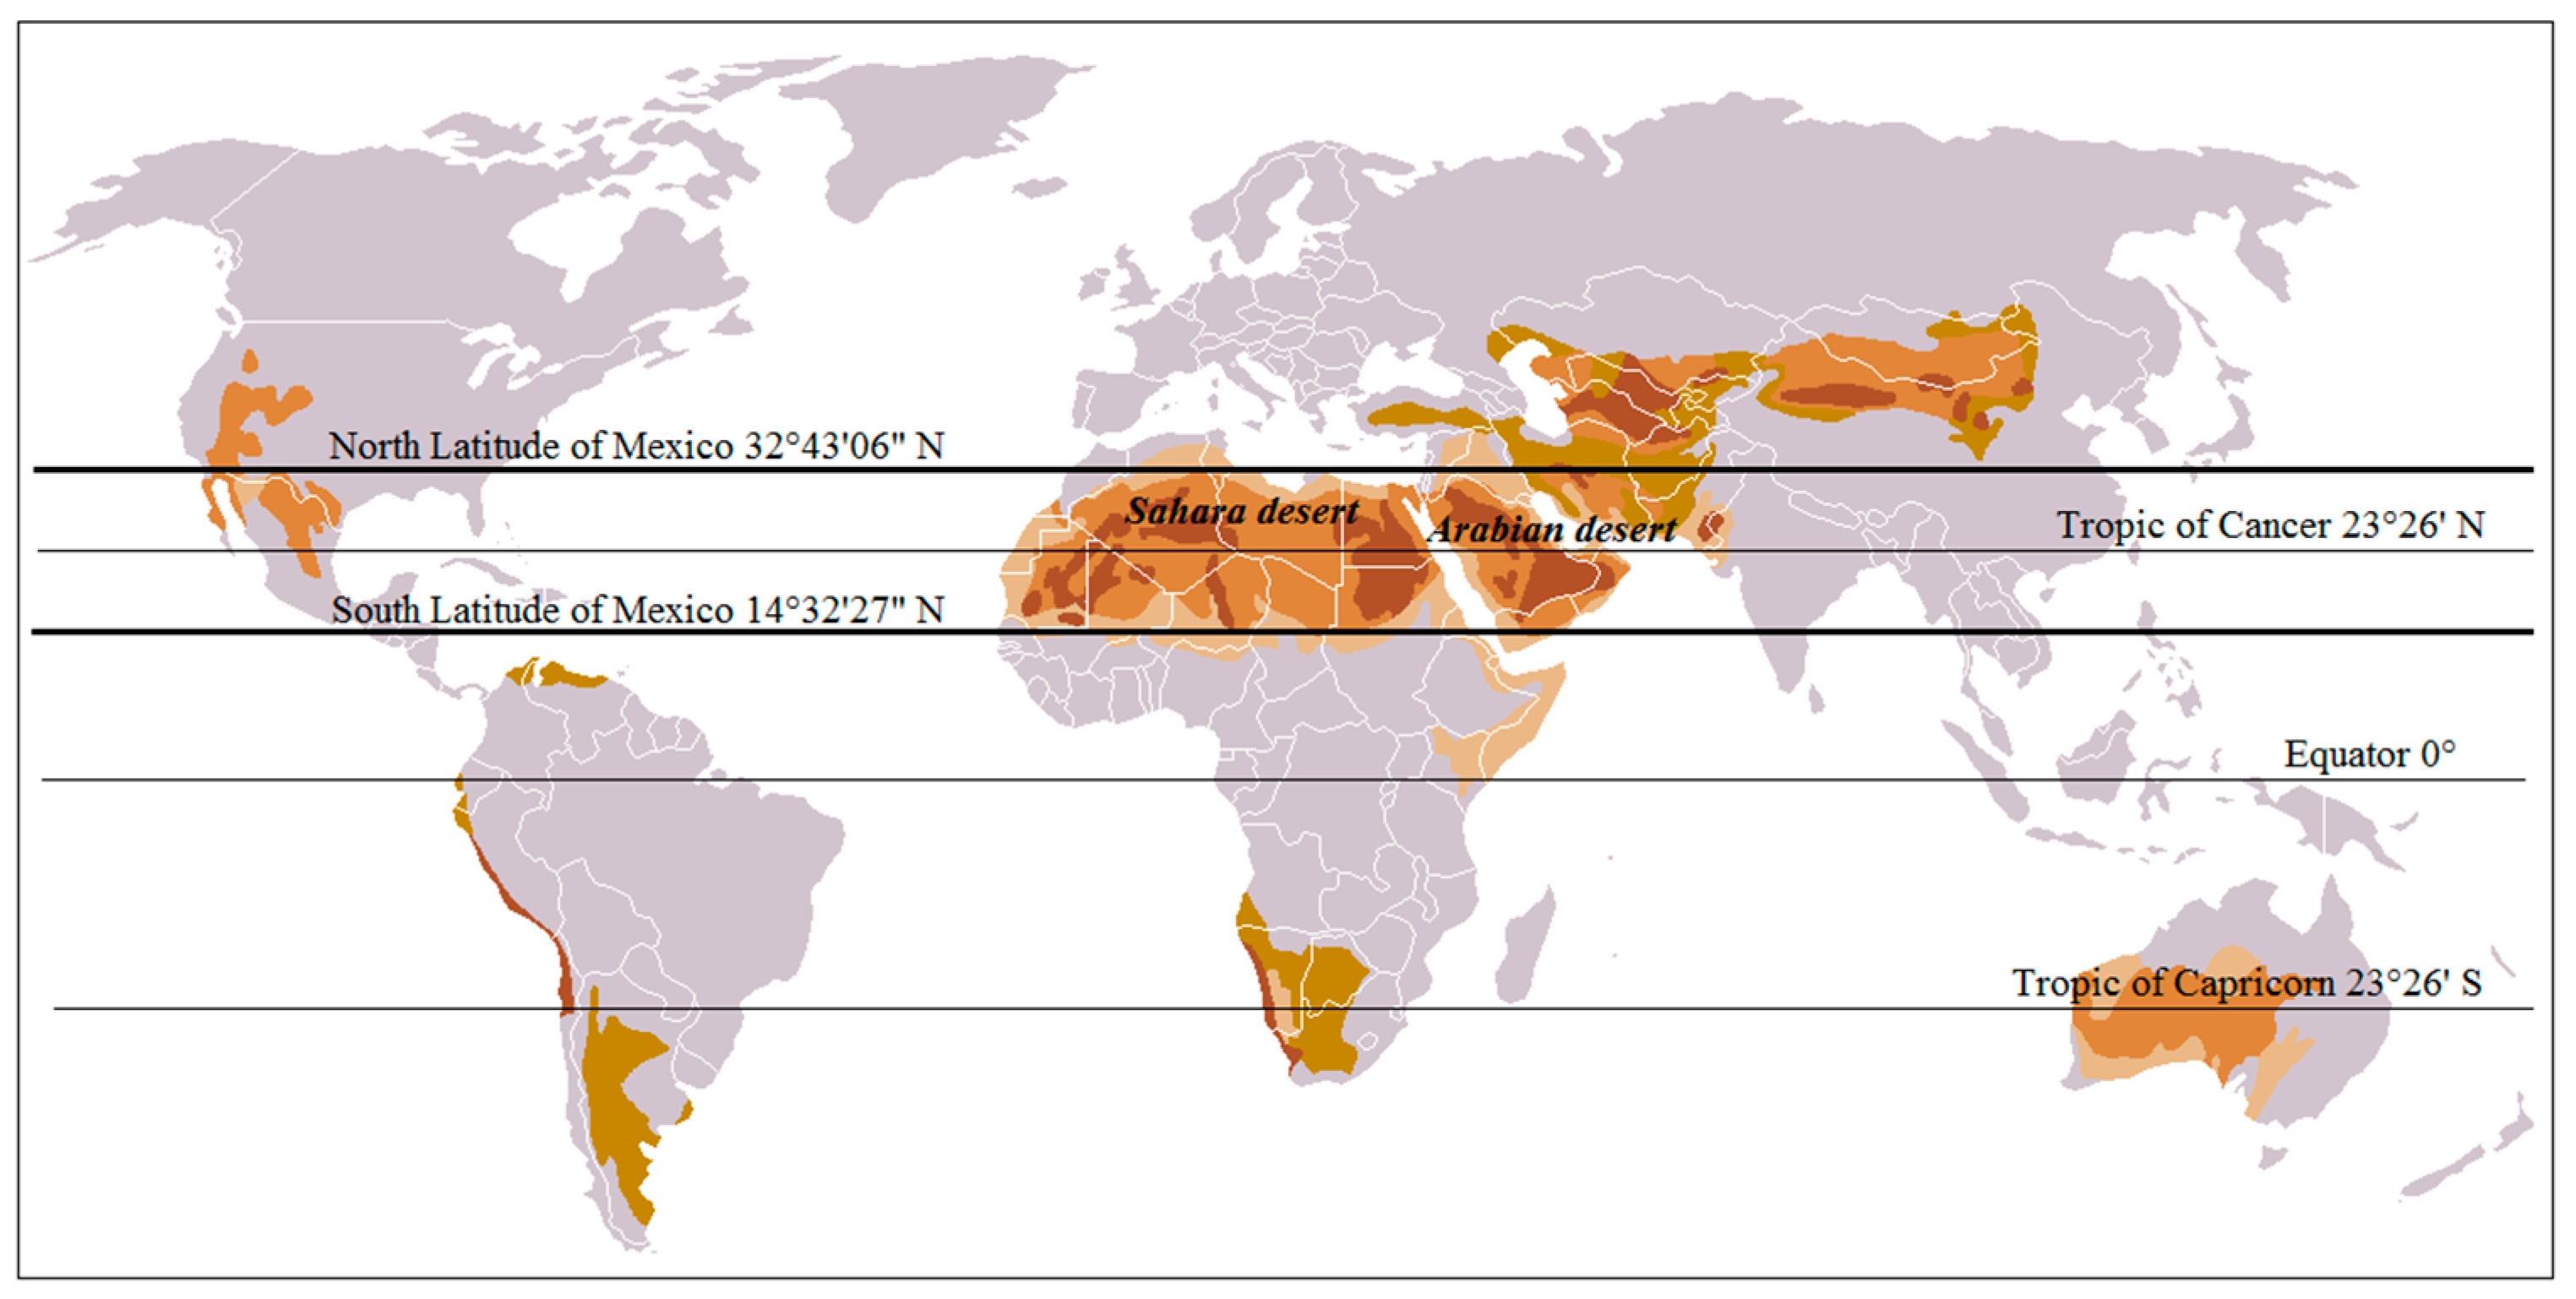
The Mexican territory is partly located within the northern band of large deserts in the world, whose existence is fundamentally due to the general circulation dynamics of the atmosphere and specific characteristics of Earth’s geomorphology, both of which produce two large high atmospheric pressure bands at latitudes close to 30° north and south; as a result, the country has arid and semiarid regions, especially in the north, at the same latitudes as the great African and Asian deserts (Figure 3). Additionally, due to the country’s orography, these zones are also located in the Central Mexican Plateau. Accordingly, 63% of the national territory is estimated to be more or less arid, and 41% of the national population inhabits these regions [64]. The hydrological deficit of arid and semiarid areas makes them even more sensitive to drought. This factor makes both the northern region and the central plateau suffer severe imbalances as a result of the phenomenon.
In addition, the El Niño Southern Oscillation (ENSO) phenomenon produces important effects on precipitation variability patterns. In general, it can be said that winter rain intensifies and summer intensity decreases in the years when ENSO takes place (for example the winters of 1982–83, 1986–87, 1991–92, y 1997–98). More or less the opposite occurs in the years when La Niña, the cold phase of ENSO, presents itself. During ENSO winters, the medium latitude jet stream moves toward the south, which causes a higher incidence of cold fronts and rain in northern and central Mexico. Rain decreases in most of Mexico during ENSO summers, which may lead to drought conditions. Oppositely, rainfall is registered as higher than normal in most of the country in La Niña years [65].
3.2. Step 2. Selection of Indicators
A vulnerability index formulation must be based on indicators reflecting relevant and guiding insights into the type of action that decision makers should undertake at the national level. Consequently, the selected indicators must be those of highest relevance based on data availability, personal judgment, or previous research [57].
According to the study conducted by the Inter-American Development Bank [59], the indicators most suited for measuring physical susceptibility or exposure to any kind of disaster are those reflecting the susceptibility of populations, assets, investments, production, means of sustenance, essential patrimony, and human activities; indicators of this kind are also those reflecting growth and population density rates. On the other hand, sensitivity or socioeconomic frailty are represented by indicators of poverty, human insecurity, dependence, illiteracy, social inequality, unemployment, inflation, debt, and environmental degradation; these indicators reflect relative weaknesses or deterioration conditions that aggravate the direct effects of dangerous phenomena, and even if these effects are not necessarily cumulative and could sometimes be considered redundant or correlated, they are especially important in the economic and social context. Finally, adaptive capacity can be represented by using numerous indicators associated with human development levels, human capital, economic redistribution, governance, financial protection, collective perception, preparation for crisis situations, and environmental protection; especially when disaggregated at the local level, this set of indicators could by itself identify and provide guidance to the actions to be promoted, strengthened, or prioritized to achieve highest security.
Based on what we have already described and studies on vulnerability to drought previously performed in Mexico [41,43], 27 socioeconomic and environmental indicators (Table 1) were selected, whose values were calculated from existing figures, indices, rates, or proportions obtained from municipal-level databases created by recognized national institutions such as the National Institute of Statistics and Geography (INEGI), the National Council for the Evaluation of Social Development Policy (CONEVAL), the Secretariat of Agriculture, Livestock, Rural Development, Fisheries and Food (SAGARPA), CONAGUA, the National Institution for Agricultural and Forestry Research (INIFAP), the National Population Council (CONAPO), the National Forestry Commission (CONAFOR), and the National Commission of Protected Natural Areas (CONANP). Based on the 27 selected indicators, a matrix was built with the indicators grouped according to three vulnerability components (exposure, sensitivity, and adaptive capacity) and the three types of vulnerability (socioeconomic, environmental, and overall), as shown in Table 1.
Additionally, Table 2, Table 3 and Table 4 present a succinct description of each of the selected indicators grouped by degree of exposure, sensitivity, and adaptive capacity, respectively.
Overall vulnerability to drought is calculated as a function of all the previously described indicators using the steps described below.
3.3. Step 3. Gathering and Processing of Information
This process consists of gathering the necessary information to determine the value of each indicator considered for analysis based on the formulas and information sources presented in Table 5, which also lists the main information sources identified to calculate or obtain the indicators. As can be seen in this table, the indicator information corresponds to different years (2015–2017), although the great majority of them come from 2017. This is due to the fact that the institutions that generate and publish the information used to generate these indicators do not do so with the same periodicity. Therefore, it would not be correct to say that the vulnerability indices calculated from these indicators correspond to a specific year, but it is feasible to affirm that, given that they have been obtained with the most recent information that exists, these indices can reflect the current drought vulnerability conditions of the Mexican municipalities.
3.4. Step 4. Normalization of Indicator Values
Given that indicators were expressed in different units of measurement and scales, their values were normalized so that all of them were expressed as dimensionless values between 0 and 1. To carry out this procedure, first we identified the indicator’s functional relationship with vulnerability to drought, as shown in Table 6. There are two possible types of functional relationships according to the indicator value: vulnerability may increase or decrease. In the first case, the relationship is direct and is indicated with symbol ↑; in the second case, the relationship is inverse, and is indicated with symbol ↓.
Once the indicators and their positive or negative impact on vulnerability to drought were identified, values were normalized using the method proposed by the United Nations Development Programme (UNDP) [66], using the following formulas:
If the indicator has a direct functional relationship (↑), the following expression is used:
If the indicator has an inverse functional relationship (↓), the following expression is used:
In both equations, Xi is the normalized value of variable xi, and xmin and xmax are the minimum and maximum values of dataset xi, respectively.
3.5. Step 5. Weighting of Indicators
After obtaining normalized indicator values, we calculated their weights using the method proposed by Iyengar and Sudarshan [67], which uses the following expression:
where: Wi is the normalized indicator weight i; σi is the standard deviation of the set of values for indicator i, and n is the number of selected indicators.
This weighting method prevents abnormally large variations in one or many indicators to overshadow the contribution of the rest of the indicators.
3.6. Step 6. Calculation of Vulnerability Indices
Vulnerability indices were calculated as per the following procedure. Firstly, social, economic, and environmental vulnerability indices (SVI, EVI, and EnVI, respectively) were calculated using this formula:
where: Xi is the normalized value of indicator i; Wi is the weight of normalized indicator i, and n is the number of indicators associated with each type of vulnerability.
Secondly, overall vulnerability indices (OVI) were calculated by integrating the previous three vulnerability indices assuming a weight Wi of 1/3 for each individual index:
3.7. Step 7. Fitting of Indices to a Probabilistic Distribution Function
The obtained vulnerability indices were classified into categories by fitting the indices to a beta probabilistic distribution following recommendations by Iyengar and Sudarshan [67], who assert the adequacy of this type of distribution for classification purposes, since it is generally skewed and it takes values within the interval (0,1). The beta function probability density is given by:
In which mean µ and variance σ2 of variable z are determined by:
The following equations are obtained when both expressions are algebraically simplified to find parameters a and b:
Using the previous two equations, parameters a (α) and b (β) were determined using an Excel® spreadsheet, which also allowed us to obtain the probability of occurrence of the vulnerability indices fitted to the beta probabilistic distribution. To check that the indices fitting to the beta distribution, the Pearson’s chi-square goodness-of-fit test (χ2) was applied with a significance level of 0.05 (α ≤ 0.05), obtaining acceptable results for all types of vulnerability indices (Table 7).
Figure 4 shows graphically the probability density functions obtained for the four types of vulnerability indices.
3.8. Step 8. Classification of Vulnerability Indices
Vulnerability indices (VIi) were classified according to their probability of occurrence, first by multiplying the obtained probability values so as to express them as percentages, and after that by determining five equally-sized percentile categories (20% each), which defined five degrees of vulnerability, as shown in Table 8.
3.9. Step 9. Mapping Vulnerability Indices
Vulnerability indices were mapped using ArcGis® software based on National Geostatistic Framework data [68]; the database allows for accurate reference of statistical information to its corresponding geographical locations, which in this case are municipalities.
3.10. Strengths and Limitations of the Method
Before presenting the results obtained, it is pertinent to mention the strengths and limitations of the method used in this investigation. Among the strengths, the following can be highlighted:
- (a)
- The proposed method is based on a theoretical framework of vulnerability recognized at an international level, and has been enriched in this work with the proposal to divide the vulnerability into four different types: social, economic, environmental and general.
- (b)
- The information that is used to obtain the indicators of each of the vulnerability components comes from official sources, so it is valid since the point of view of public policies to reduce vulnerability.
- (c)
- The proposed method is based on an easy-to-replicate analytical procedure. No specialized software is required to calculate the vulnerability indices, because a simple spreadsheet is enough.
- (d)
- In addition, the way of weighing each of the indicators is objective, since it is based on a statistical method that allows balancing the weight given to each of the indicators.
- (e)
- The method allows for the illustration of the results through maps that are easy to understand for decision makers and policy makers aimed at reducing vulnerability.
On the other hand, the limitations detected in the method and which, in turn, are sources of uncertainty are the following:
- (a)
- Although it is true that the information used to obtain vulnerability indicators comes from official sources, it may contain errors or biases that are not easily identifiable. In this work, quality control of the basic information was not carried out; for this it would be necessary to apply some statistical methods or tests on the data series to detect aberrant or out-of-range values.
- (b)
- The indicator values used in the analysis do not all correspond to the same year and are not updated with the same periodicity: some are updated every year (e.g., value of irrigated and rainfed agricultural production) and others every five years (e.g., percentage of population living in poverty). To obtain the vulnerability indices for a specific year, it would be necessary to make projections of the indicators that are not updated each year through a historical analysis of them.
- (c)
- There are many indicators that were not included in this work due to the lack of information at the municipal level, which could be useful for the analysis of social vulnerability to drought (for example: the proportion of households that have tanks for water storage, or the drinking water systems efficiency). Therefore, we have included some “general” indicators that can be used to assess social vulnerability in general, regardless of the type of risk to which it refers (among them are, for example: population in poverty or population without health care insurance). Although this could distort the results and divert attention of the causes of vulnerability to drought, we believe that it is very important to include these types of indicators because to a great extent they reflect the living conditions of the population that is susceptible to suffer the effects of natural phenomena, including drought.
4. Results and Discussion
This section presents and analyzes the results obtained for each type of vulnerability: social, economic, environmental, and global vulnerability to drought. Each analysis includes a corresponding vulnerability map and a table that summarizes municipalities according to their degree of vulnerability (very high, high, medium, low, and very low); the table also includes municipality surface and population. Additionally, as complementary information, Appendix B includes tables showing the number of municipalities with high and very high vulnerability degrees by state, and Table S1 (Supplementary Material) presents a list of municipalities by state with high and very high social, economic, environmental, and overall vulnerability to drought.
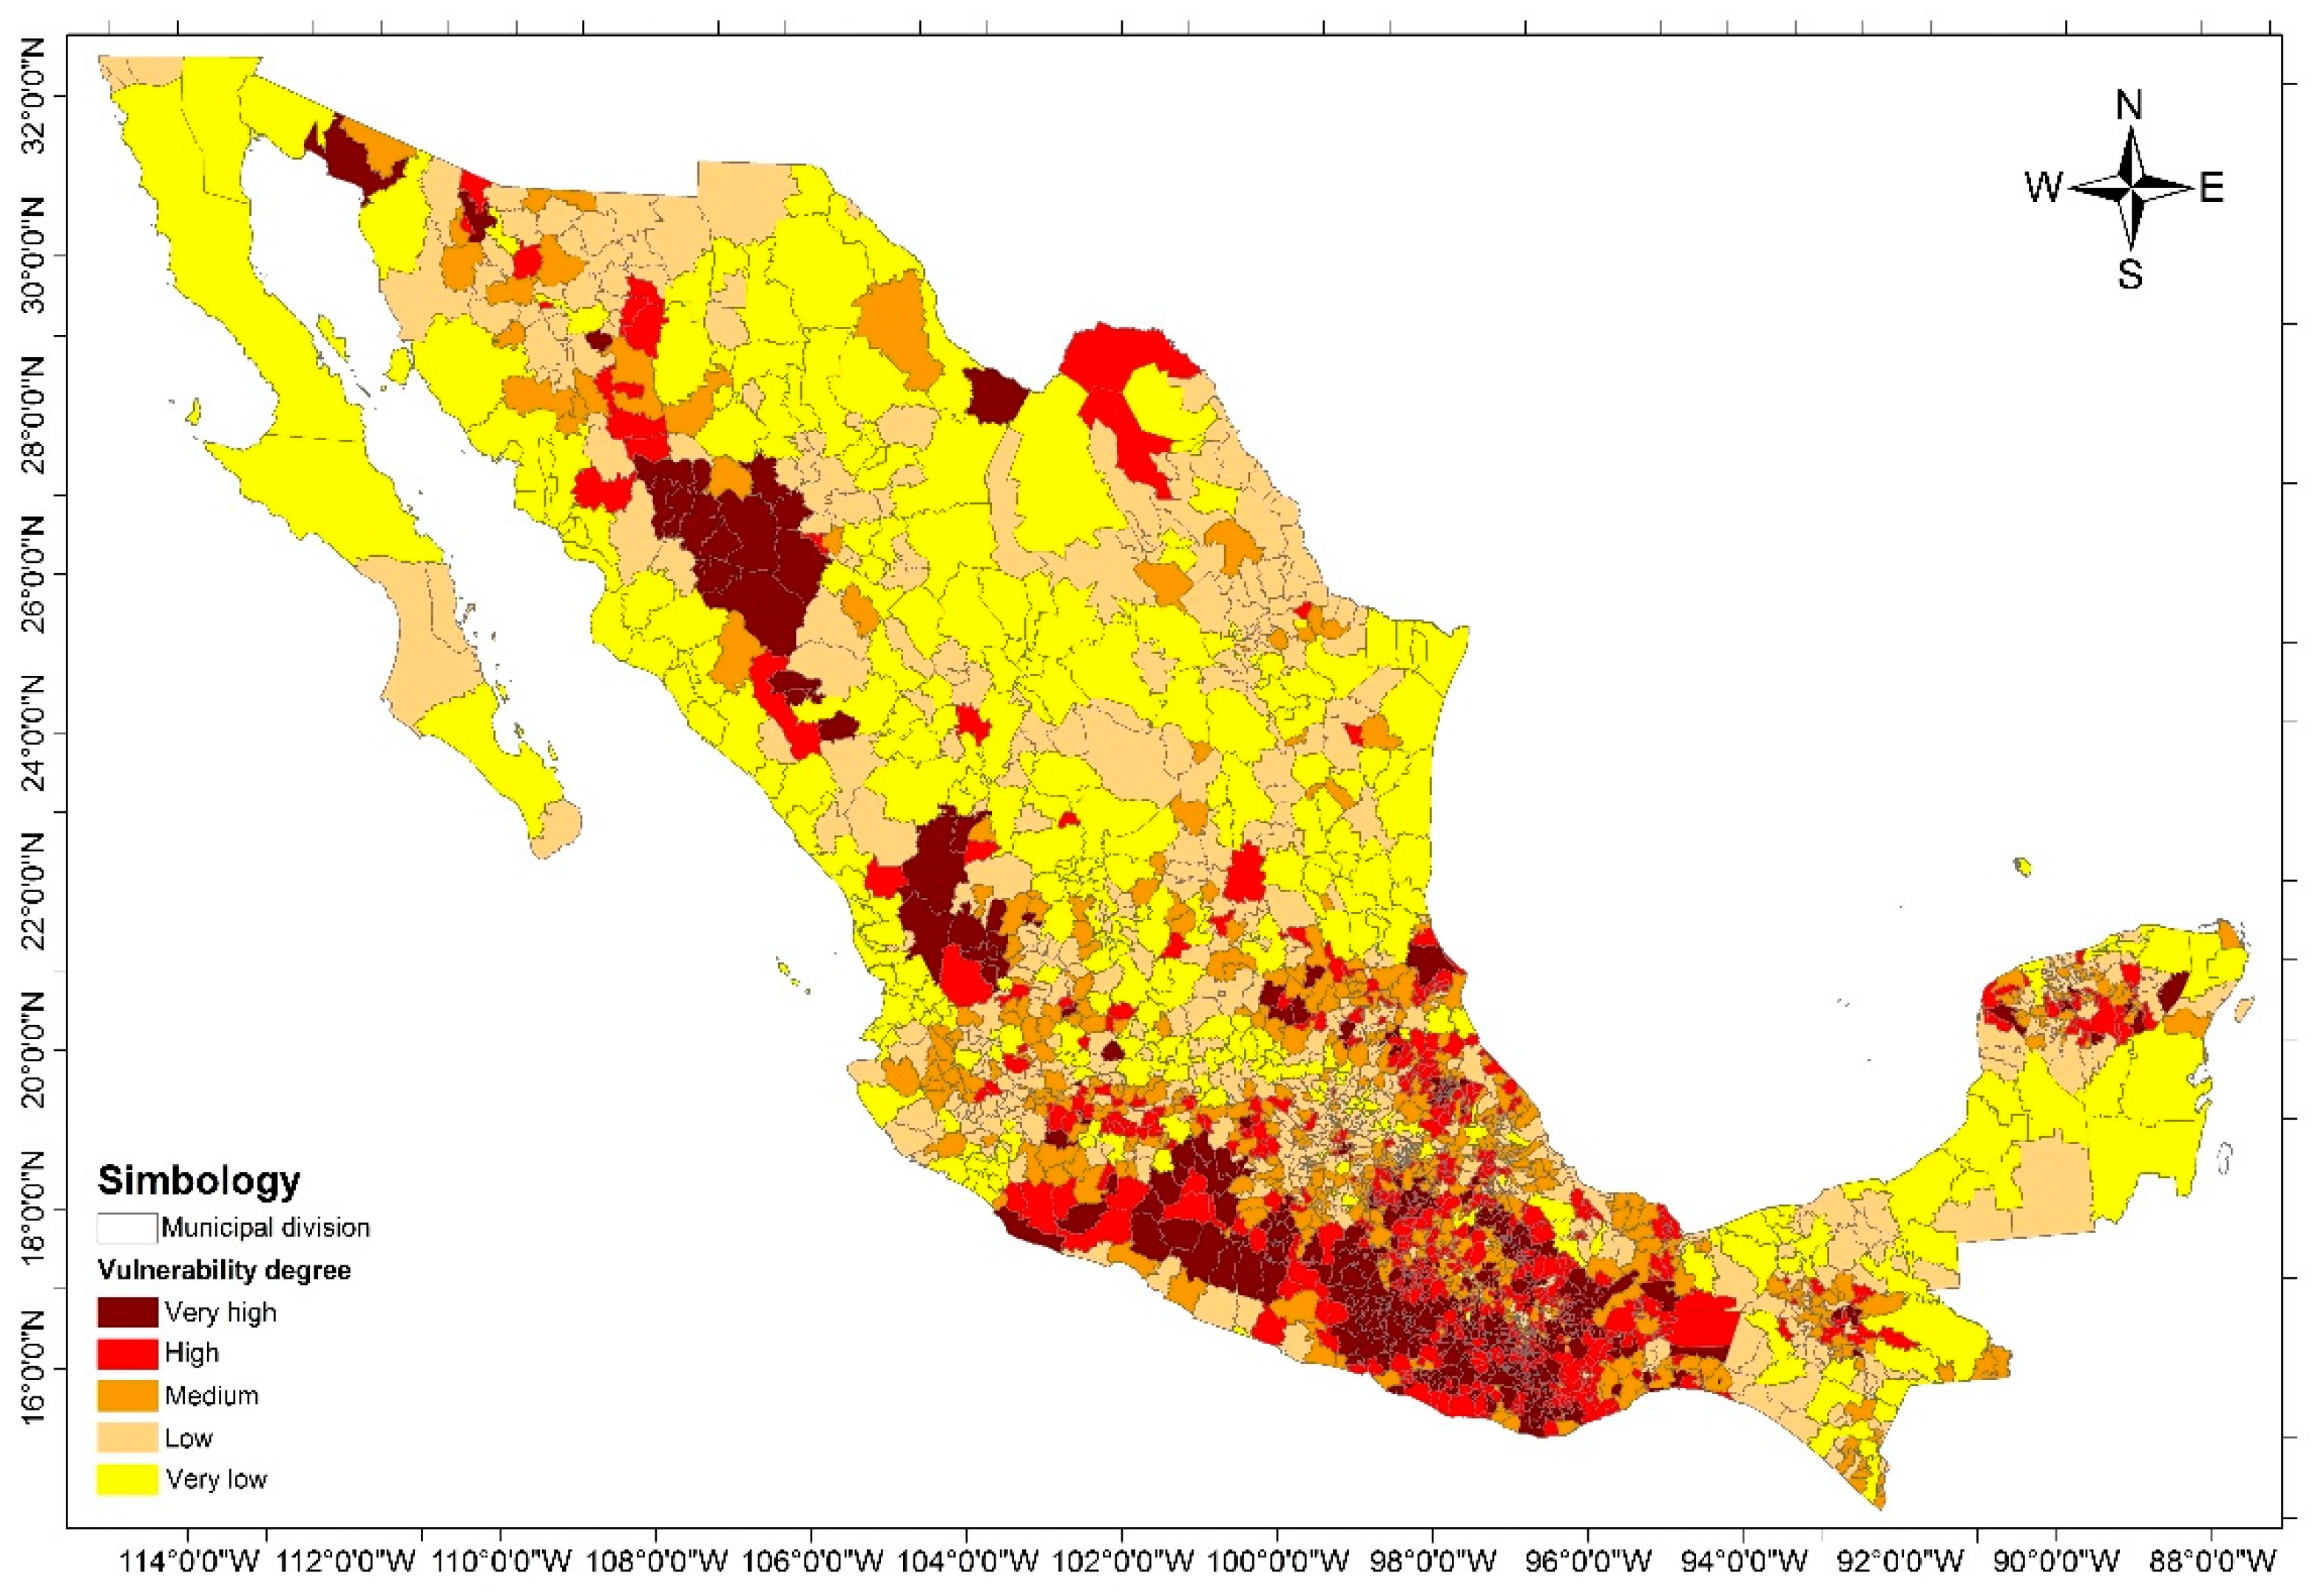
4.1. Social Vulnerability
Figure 5 presents the social vulnerability to drought map. This figure, together with Table 9, shows that 37.2% of Mexican municipalities present high and very high social vulnerability to drought, which represents 18.7% of the national territory and 22.3 million people (18.1% of total population). The Mexican states with highest proportions of municipalities with high and very high degrees of social vulnerability are located especially in the south and center, for instance the states of Oaxaca and Guerrero, in which more than 75% of municipalities have conditions of high and very high vulnerability, but also the states of Puebla (67.7%), Michoacán (45.1%), Mexico City (31.2%), Veracruz (30.2%), and Yucatán (26.4%). Additionally, 22.4% of municipalities in the northern state of Chihuahua present high and very high social vulnerability. Less than 20% of municipalities in the rest of the states in the country are in this condition (see Appendix B).
These results are similar to those reported by other social vulnerability studies in Mexico (e.g., [69]). In both cases, the most socially vulnerable municipalities were determined to be in the south of the country, the most critical being Oaxaca and Guerrero, which is due to a long history of poverty, marginalization, and social backwardness shared by people in these states.
According to CONEVAL [70], despite considerable investments on social development programs in Mexico over the past 15 years, which have increased the availability of basic services (running water, sanitation, electric energy, education, health care, etc.) required for dignified life, 46.2% of the population is in moderate or extreme multidimensional poverty conditions, which represents 55.3 million Mexicans. Evidently, people in poverty normally live in houses lacking running water, drainage, or flush toilets, their living space is insufficient and inadequate, and they are frequently excluded from access to public health care services. Therefore, they face increased vulnerability as a result of the absence of crucial elements for the lives of their families. People with low or no education face similar problems; low academic level is directly related to low economic income, which ultimately determines a family’s capacity to acquire goods and services to allow them to survive in case of a contingency or disaster associated with natural phenomena such as droughts.
Marginalization and poverty conditions can limit the adaptive capacity people and communities need to buffer the adverse effects of drought. In fact, there is a mutual influence between marginalization conditions and the potential effects of drought. On the one hand, the most impoverished communities and regions are also the most affected by natural hydro-meteorological events, which, as has been anticipated, will increase in frequency and intensity [59]; on the other hand, these adverse effects will make living conditions in those communities and regions progressively harsher, which will further dwindle their adaptive capacity. Therefore, poverty and vulnerability to danger are closely linked and are mutually reinforcing. Poor people are forced to exploit natural resources to survive, which increases both risk and exposure to disasters, especially those caused by extreme phenomena such as droughts and floods. Repeated exposure to those events can throw populations into a downward spiral of chronic poverty.
Summarizing, social vulnerability to drought is closely associated with economic vulnerability, i.e., the insecurity and defenselessness of certain economic activities or production sectors toward the phenomenon, especially in the states or municipalities where people are more dependent on agricultural and stockbreeding activities, as will be analyzed in the following paragraphs.
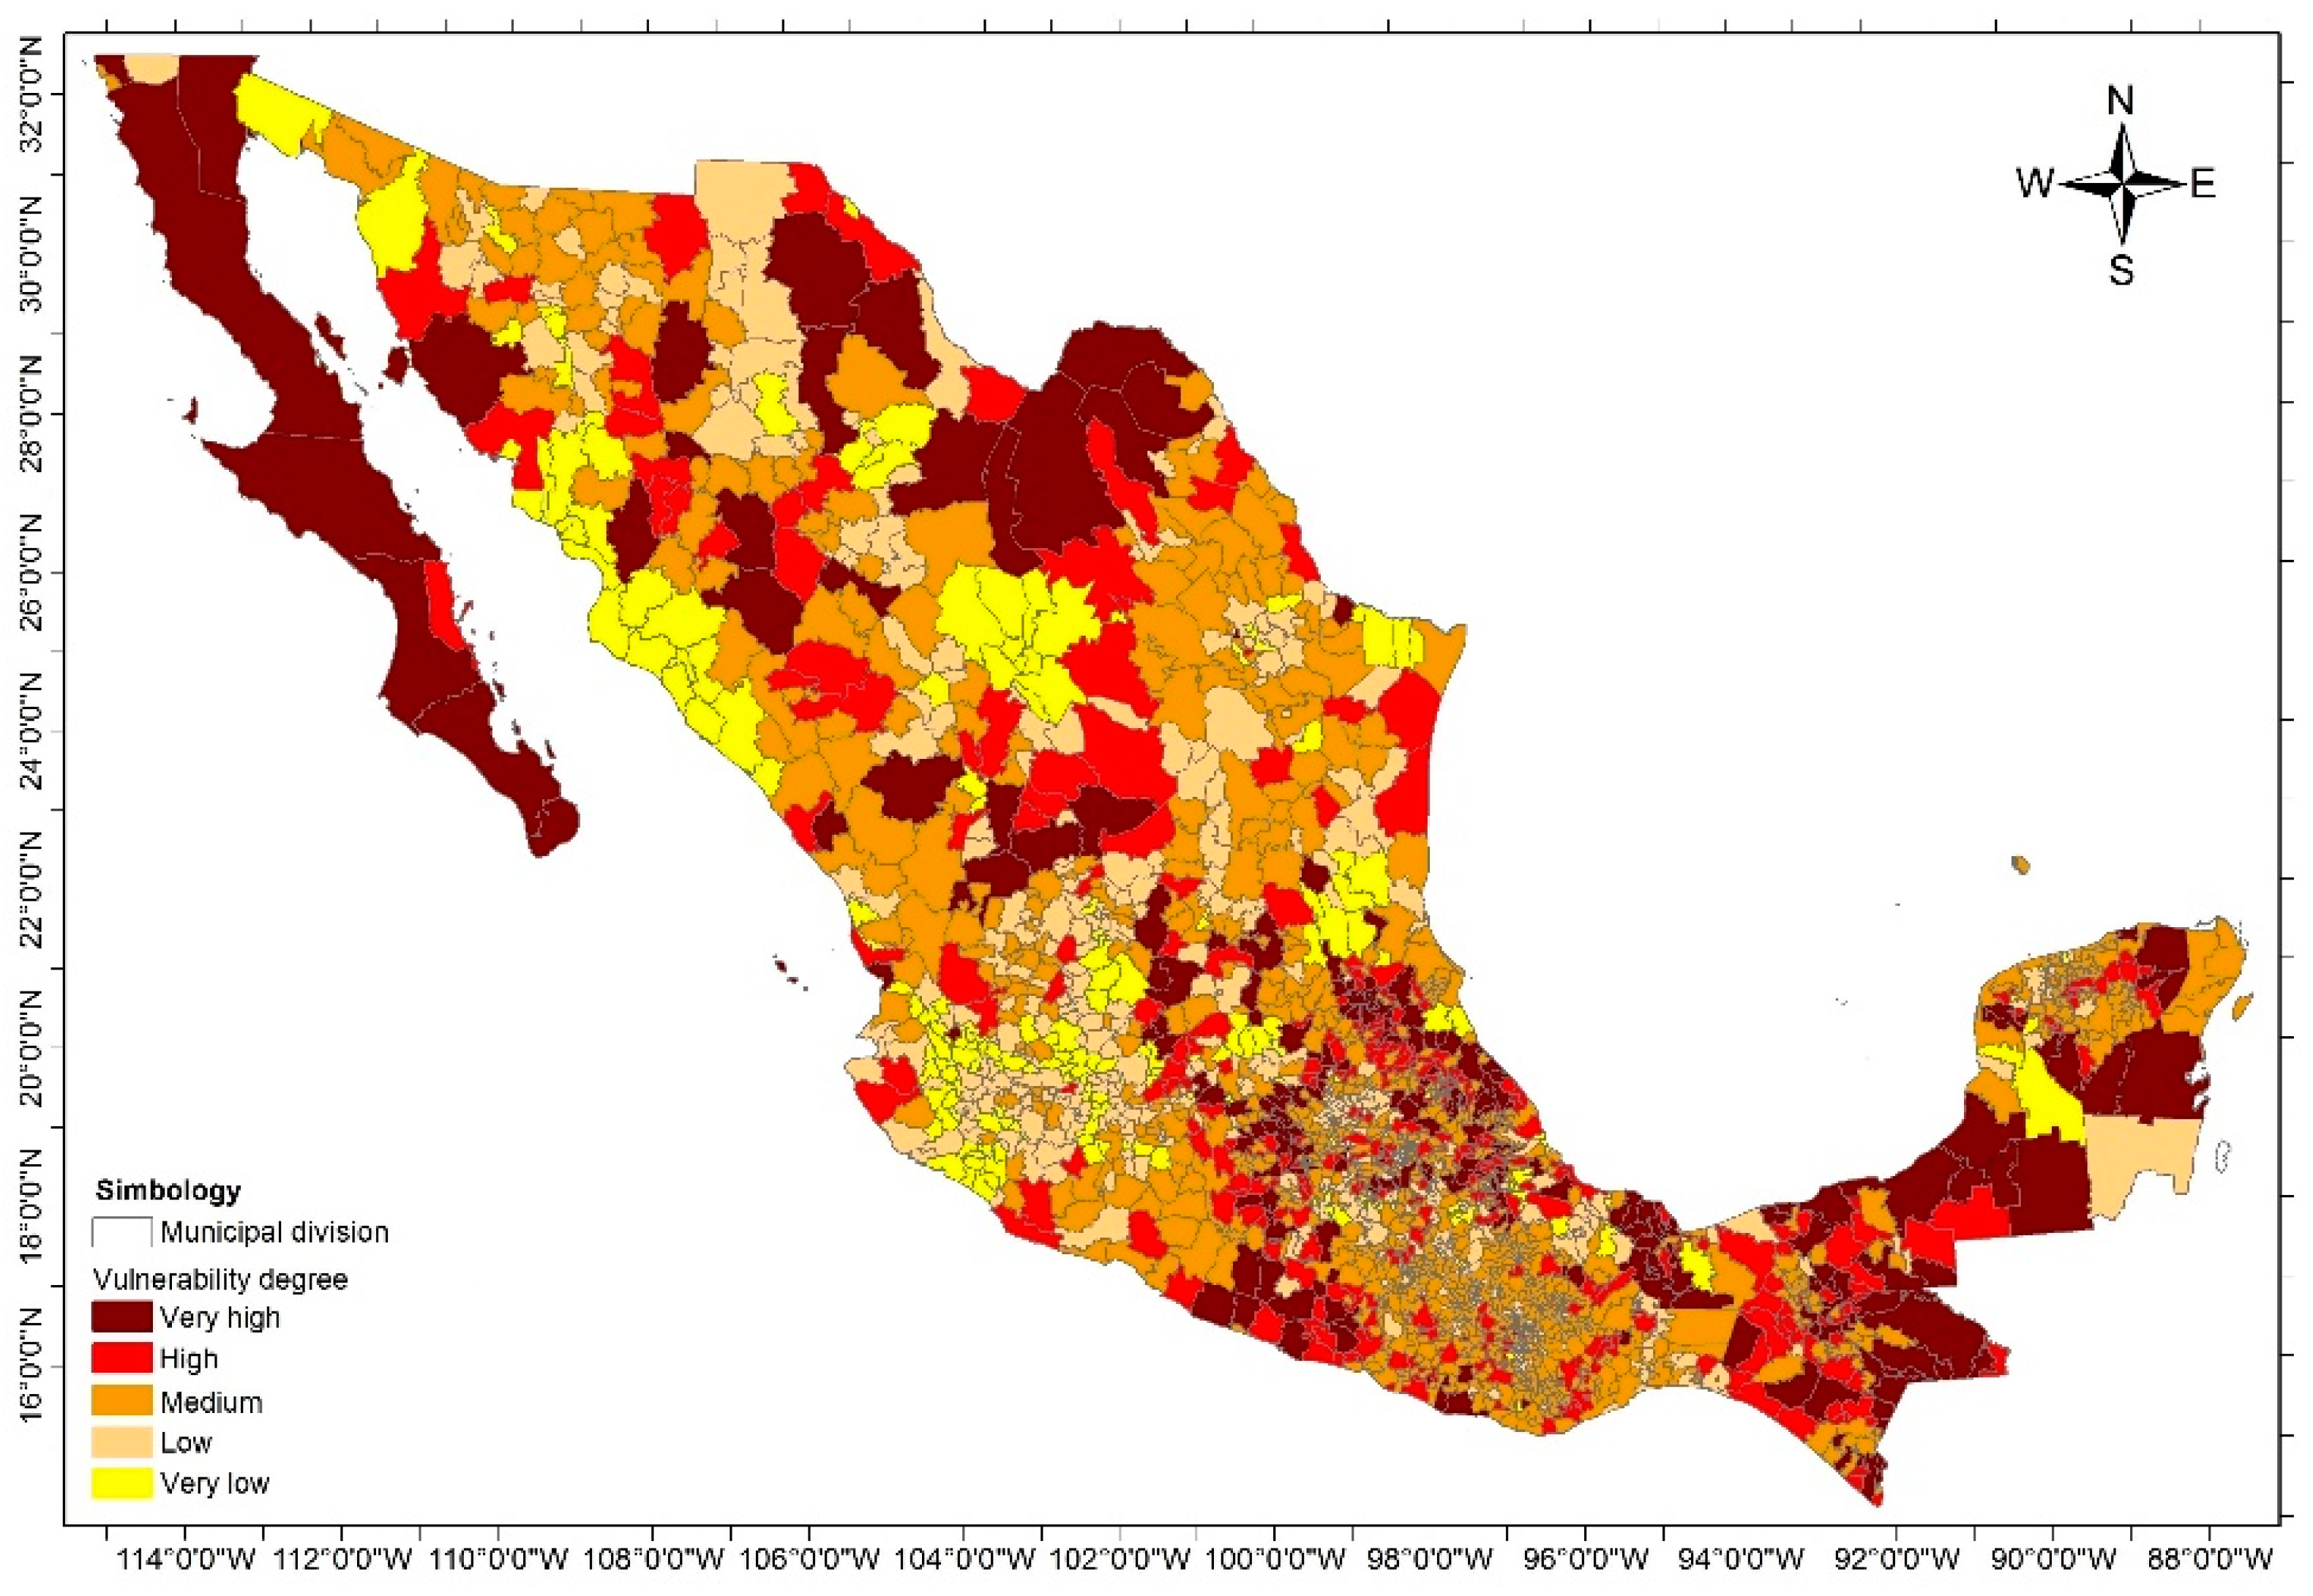
4.2. Economic Vulnerability
Figure 6 presents a map of economic vulnerability to drought. This figure, together with Table 10, shows that 22.6% of Mexican municipalities present high and very high economic vulnerability to drought, which represents 37.3% of the national territory and 37.5 million people (30.4% of total population). The states in the Mexican Republic with the highest degrees of economic vulnerability (high and very high) are located at different latitudes across the territory: Baja California and Baja California Sur in the north (both with 60% of municipalities in this condition), as well as San Luis Potosí (32.8%), Chihuahua (28.4%), and Coahuila (26.3%); in the center are Hidalgo (45.2%), Guanajuato (34.8%), State of Mexico (28.8%), and Puebla (28.1%), and in the south are Chiapas (55.9%); Campeche (45.5%), Guerrero (42.3%), Veracruz (42.9%), and Yucatán (25.5%).
In general, these results are in line with disaster declarations issued by SAGARPA during the period from 2000 to 2015. The states where agricultural and stockbreeding disaster has been declared more often are Chihuahua, Coahuila, Durango, Sonora, Sinaloa, San Luis Potosí, and Nuevo León in the north; Puebla, Guanajuato, and the State of Mexico in the center, and Guerrero, Veracruz, Chiapas, and Yucatan in the south. This is because all those states are characterized by intense agricultural and stockbreeding activities, which makes an important contribution to the value of agricultural product and livestock production with respect to national totals (altogether, these states represent 60.5% of total production).
Rainfed agriculture, extensively practiced in states such as Veracruz, Chiapas, Mexico, Guerrero and Puebla, depends exclusively on rainwater for production, which makes it highly vulnerable to meteorological drought. This type of agriculture is practiced mostly by low-income farmers, the first among society to feel the effects of drought. They are small producers who, supported by a small team, their own work and their families’, achieve just enough production to supply themselves and rarely more. As a result of droughts, their plants fail to germinate or they wither and die. In any case, they are unable to harvest: a first step into disaster.
For its part, irrigated agriculture (practiced in the states of Sinaloa, Sonora, Michoacán, Chihuahua, Guanajuato, and Baja California, among others) is supplied by wells, dams, pumping stations, and river branches, which makes it vulnerable to hydrological drought. Nearly 77% of total groundwater and surface water withdrawal in the country is used for rainfed agriculture [71]; therefore, this economic activity takes the largest proportion of this vital liquid. Given the importance of water for irrigated agricultural production, when the resource is scarce as a consequence of drought, the hydrological deficit is substantially reflected in low production rates and decreased producer income and quality of life, as well as forced importation, increased product prices, and degradation of production infrastructure, among other adverse effects.
As in the case of agriculture, stockbreeding is strongly affected by the short-, medium-, and long-term detrimental effects of drought. The initial impact of the phenomenon is in the lack of drinking water for the animals, followed by fodder scarcity, and finally decreased production in the form of lower livestock weight and decreased reproduction and milk production rates. In these cases, drought can result in livestock death.
Consequently, in Mexico, where agriculture and stockbreeding are essential activities from the economic and social points of view, the vulnerability of these producers entails a higher risk when drought occurs, as has been the case in large portions of the territory, where drought was responsible for severe economic disruptions at the regional and national levels, for instance the last great drought of 2011–2012, the most severe in 70 years. This particular drought resulted in agricultural production losses of more than 16 million MXN (1.3 million USD), and total losses across all economic sectors were equal to 10% of the national gross domestic product; 48 million Mexicans living in arid, semiarid, and dry-sub-humid areas are calculated to have suffered the consequences of the phenomenon—the problem affected two out of three planted hectares and caused death to thousands of livestock animals [72].
Clearly, social and economic vulnerability are closely associated with environmental vulnerability: ecological conditions and natural resource management can be determining factors in the increase or decrease of the adverse impacts of drought, as is explained in the following paragraphs.
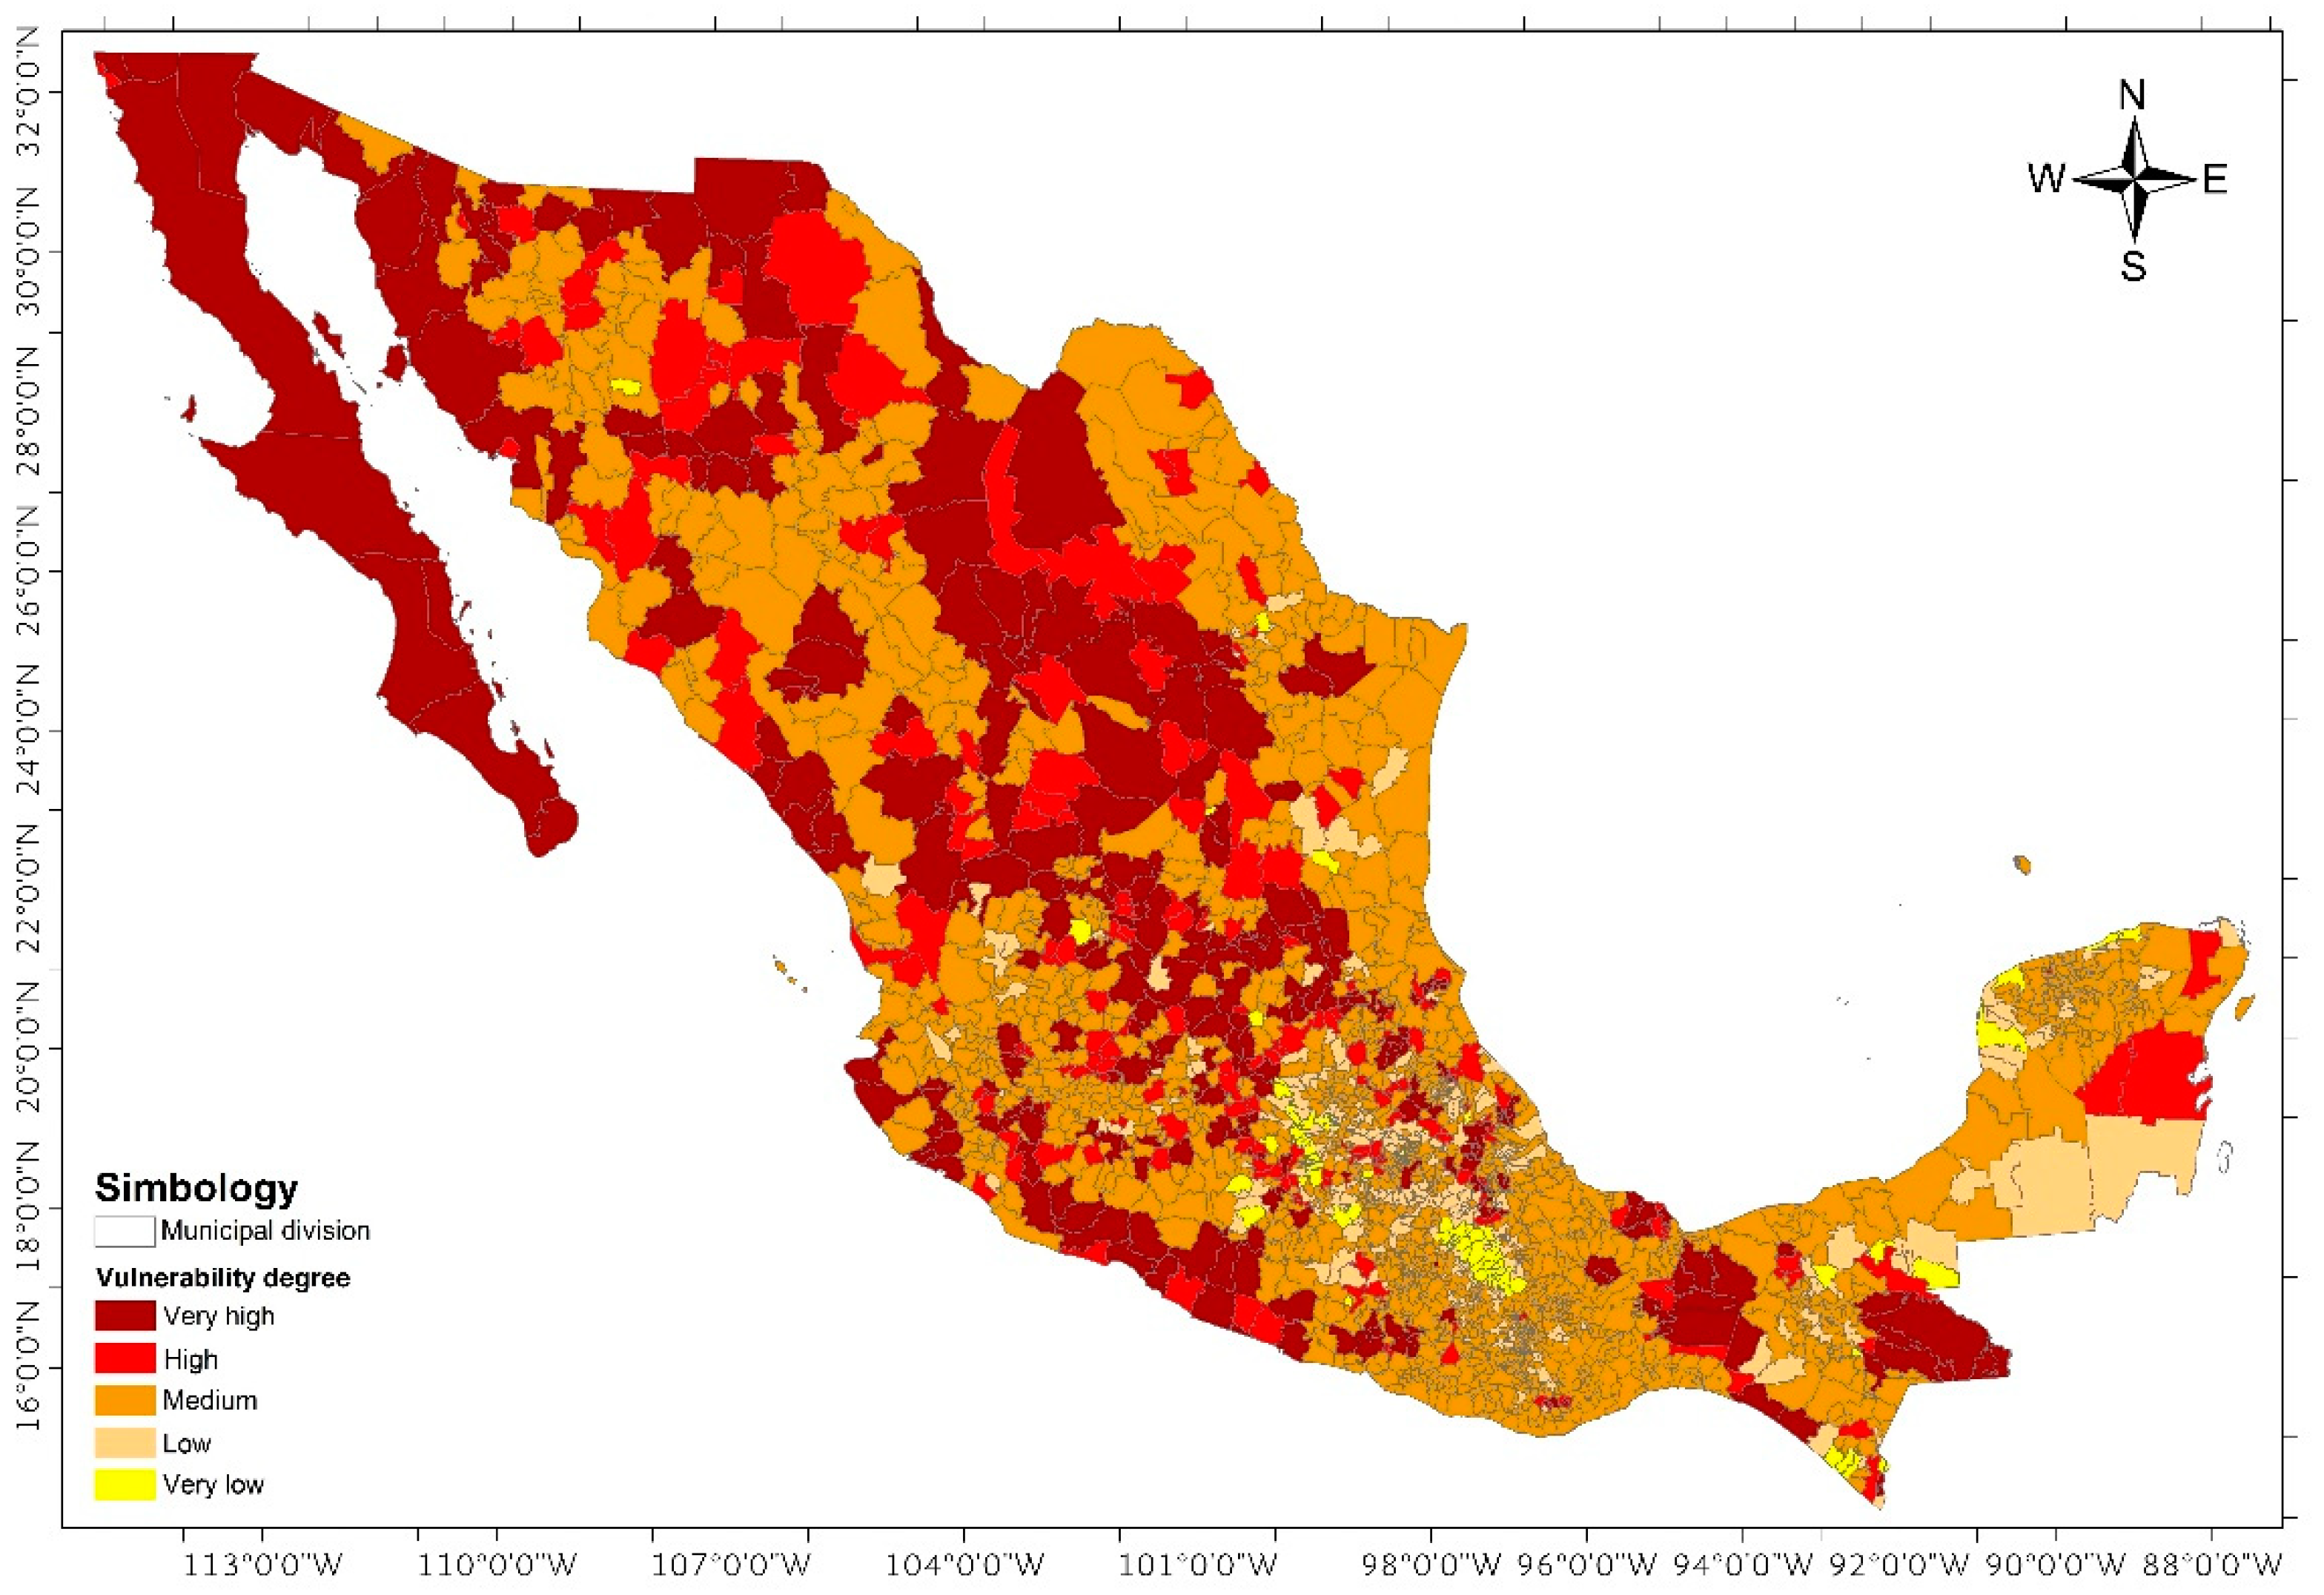
4.3. Environmental Vulnerability
Figure 7 presents a map of environmental vulnerability to drought. This figure and Table 11 show that 20.2% of Mexican municipalities present high and very high environmental vulnerability to drought, which represents 49.4% of the national territory and 52.8 million people (42.7% of total population). Figure 7 also shows that the Mexican states with highest environmental vulnerability (high and very high) are those located in the north-west (Baja California, Baja California Sur, Sonora, Sinaloa) and in the Mexican Plateau (Chihuahua, Coahuila, Durango, Nuevo León, San Luis Potosí, Zacatecas, Querétaro, Guanajuato, Aguascalientes, Michoacán, and Hidalgo, among others).
Undoubtedly, degree of aridity is among the main environmental factors making a region vulnerable to the effects of drought. As a result of their nature, Mexican arid and semiarid areas—located in the northern part of the country and its central plateau—face severe water availability problems. When the phenomenon presents itself, as has occurred in recent years, the northern and northern-central states are seriously disrupted.
Similarly, the degradation of natural resources (also known as environmental degradation) contributes to increased vulnerability to drought. Watershed and aquifer overexploitation, deforestation and forest fires significantly increase the population’s degree of exposure and sensitivity to the phenomenon. More than 100 of Mexico’s aquifers are currently being overexploited [71], which causes considerable damage to the environment and poses risks to water and food security. Additionally, 31 of these aquifers are located on saline soil and present brackish water, especially in the Baja California Peninsula and the Central Mexican Plateau, in which low rainfall and high solar radiation converge causing evaporation and the presence of connate water and highly soluble evaporite minerals. In some cases, for instance the Hermosillo (Sonora) coastal aquifer, excessive pumping has resulted in salt water intrusion and saltpeter presence in agricultural fields.
Moreover, in many Mexican states (e.g., Baja California Sur, State of Mexico, Morelos, and Yucatán), environmental degradation is alarming, especially the soil’s; in many others, (Baja California, Sonora, Chihuahua, Nuevo León, Zacatecas, and Jalisco, among others) the problem is also serious [73]. In these states, the main reasons behind soil deterioration are deforestation, changes in the use of soil, and overgrazing. Soil in deforested regions erodes, and the soil frequently becomes unproductive. When an efficient reforestation plan is not put in place, felling results in serious habitat damage, loss of biodiversity, and aridity, which in extreme cases can ultimately be conducive to desertification.
Changes in the use given to soil, such as turning forests into agricultural surface, clearing land, urban sprawls or undertaking extensive construction work, affect the natural characteristics of the area or watershed where they take place, and in combination with complex interactions among systems and hydrological factors, the impact of meteorological drought can reach beyond the areas where precipitation deficits are centered [74]. In fact, dry season frequency is altered mostly by changes in soil use, even when meteorological drought is not severe or absent.
All the previously mentioned factors (deforestation, changes in soil use, overgrazing, etc.) influence the extent of climate changes. When terrain surface is changed by deforestation, fires, altering the course of rivers, paving, and soil degradation, the ground undergoes a rapid loss of its capacity to catch and retain humidity. This generates arid microclimates that alter regional climate patterns. As a result, arid areas can become even dryer and increase their extension [75].
Fertile soil detriment increases drought vulnerability conditions, which can of course present themselves in every climate region, although the worst consequences take place in regions where water supply is limited, as in the case of northern Mexican states. Furthermore, the loss of vegetal cover aggravates the adverse effects of extreme hydro-meteorological events, whose frequency is expected to increase due to global climate change [59].
The interaction among the three types of vulnerability previously described (social, economic, and environmental) converges in overall vulnerability to drought, which includes all the indicators considered in the analysis; overall vulnerability results are described in the following paragraphs.
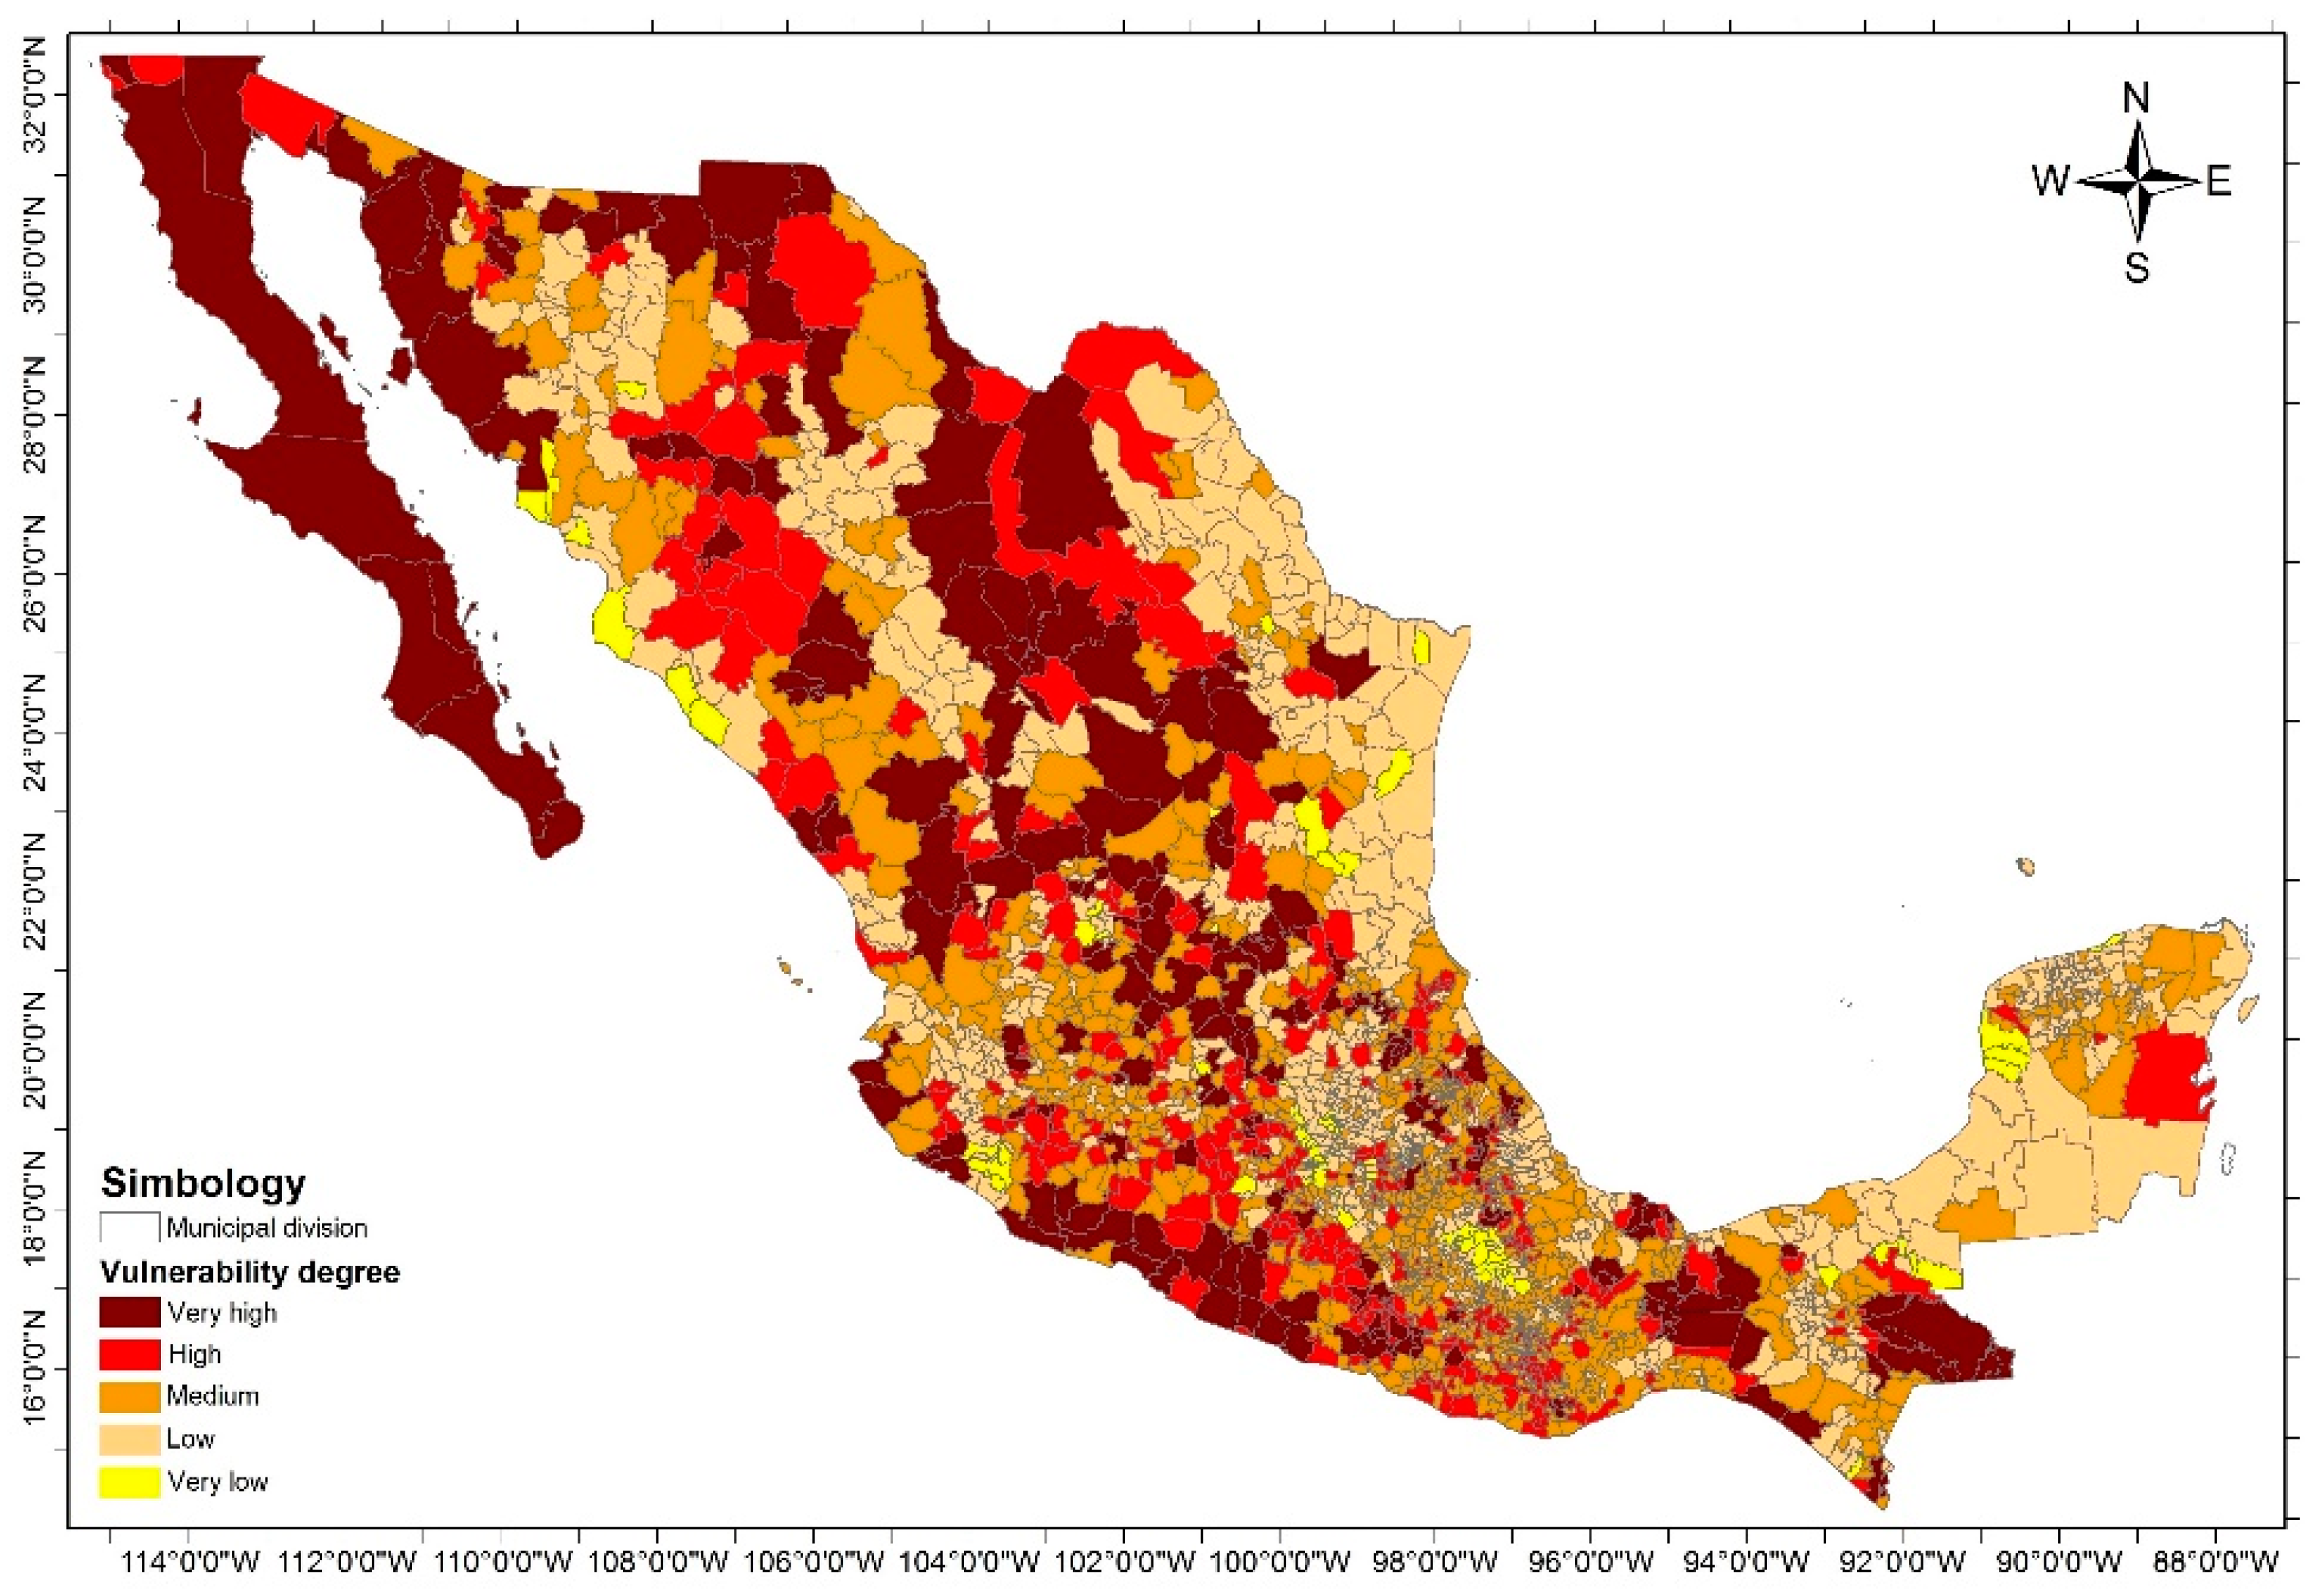
4.4. Overall Vulnerability
Finally, Figure 8 presents a map of overall vulnerability to drought. This figure and Table 12 show that 24.7% of Mexican municipalities present high and very high overall vulnerability to drought, which represents 52.2% of the national territory and 48.0 million people (38.9% of total population). Due to previously presented reasons, the states in Mexico with the highest overall degree of vulnerability to drought are especially those located in the north-west (Baja California, Baja California Sur, Sonora, and Sinaloa) and in the Mexican Plateau (Chihuahua, Coahuila, Durango, San Luis Potosí, Zacatecas, Querétaro, Guanajuato, Michoacán, and Jalisco, among others), as well as some in the south (mainly Guerrero, Oaxaca, and Chiapas).
These data reflect historical drought records in Mexico (e.g., [17,72]); historically, the most affected states in the country—where drought presents itself more frequently—are located in the north and in the Mexican Plateau. Sorted by severity of adverse effects, the states are: Chihuahua, Coahuila, Durango, Nuevo León, Baja California, Sonora, Sinaloa, Zacatecas, San Luis Potosí, Aguascalientes, Guanajuato, Querétaro, and Hidalgo [72]. As has been mentioned, the threat to these states is aggravated by their eminently arid landscape, which makes their population and their economic activities highly vulnerable to water scarcity brought about by drought because dry and semi-dry climate extremes are predominant in most of their territories.
Nevertheless, even though most vulnerable states and municipalities are located in the north of the country and in the Mexican Plateau, there are southern states such as Guerrero, Oaxaca, and Chiapas (characterized by high precipitation) where many municipalities are also severely affected by the phenomenon, especially in the years when ENSO presents itself, for instance in 2015. That year, drought emergency and disaster conditions were declared in many municipalities, especially in Chiapas, Guerrero, Oaxaca, and Tabasco, and municipalities lost a considerable part of their agricultural and livestock production. For instance, only in the state of Guerrero, drought affected more than 163 thousand hectares of corn fields in 66 municipalities; in Chiapas, 49.2% of the territory suffered the effects of severe drought, and in Tabasco, the rainiest state in the country, drought affected 17 municipalities and caused a 60% loss of sorghum production [76].
4.5. How to Reduce Drought Vulnerability
Once we have identified the municipalities and states of the Mexican Republic that are most vulnerable to drought, it is worth asking: how can this vulnerability be reduced? A step forward would be to analyze the potential impacts and assess the underlying causes of the vulnerability. The analysis of drought effects and its causes is crucial to reduce the risk before the phenomenon occurs, and to establish appropriate response measures during and after the event. This requires a thorough analysis that is beyond the scope of this work, so here we will only present some general guidelines that can guide decision makers and policy makers going forward to intervene on the causes of vulnerability and reduce it, because the most important thing is to correct those causes.
As we have seen, vulnerability is a condition that results from social, economic and environmental factors or processes that increase the susceptibility of a system to drought impacts. To know specifically “Who and what is at risk and why?”, it is necessary to conduct vulnerability assessments at the local level, with the participation of experts and key actors from each region or study area of the country, in such a way that it is possible to identify and propose the measures that are most appropriate for each specific context. Some important characteristics that these evaluations should include are the following [77]:
- ○
- Recording drought impacts on vulnerable economic sectors, including rain-fed and irrigated agriculture, livestock, environment, energy, tourism and health sectors.
- ○
- Assessing the reasons for vulnerability and the conditions that impact the resistance of a system to drought.
- ○
- Assessing the degree or extent of potential damage or loss in the event of a drought.
- ○
- Assessing the coping capacity of communities affected by drought.
- ○
- Assessing sectors, population groups, and ecosystems most at risk and identifying appropriate and reasonable mitigation measures to address these risks.
When the impacts and causes have been evaluated, it is possible to correct them. For this, it is necessary to implement preventive and mitigation drought measures. In general terms, we propose some measures that can contribute to reducing vulnerability in the municipalities of Mexico by changing the indicators used in this work to assess vulnerability (Table 1). Thus, to reduce social vulnerability to drought through public policies, the following measures among others could be applied:
- ○
- Strengthen and increase the coverage of government programs aimed at combating poverty and social inequality;
- ○
- Increase the coverage of health and social assistance services, to take care of the population on a regular basis and in emergency cases;
- ○
- Extend the coverage of drinking water and sanitation services, especially in the most marginalized rural areas of the country;
- ○
- Implement programs for the installation of rainwater collection and storage systems in homes, schools and public and private buildings;
- ○
- Expand the coverage and quality of educational services, especially at the basic and middle levels (primary and secondary education), to increase the level of human development of the population.
On the other hand, to reduce economic vulnerability it would be important to implement, as part of public policies, some measures among others such as the following:
- ○
- Providing economic support and credits so that the agricultural and livestock production units have adequate and sufficient infrastructure to develop their activities;
- ○
- Providing technical assistance to the production units through qualified technical personnel so that they can optimally carry out their activities;
- ○
- Facilitate the access of production units to local and regional markets, improving communication channels and transport means;
- ○
- Increase the technified agricultural area (which uses irrigation systems and agricultural machinery) in the production units, and promote the change of traditional irrigation systems (gravity irrigation) by more efficient irrigation systems (dripping, sprinkling, etc.);
- ○
- Facilitate the organization of production units in civil associations and mercantile societies so that they have easier and quicker access to financing, credit and agricultural insurance.
Finally, to reduce drought vulnerability from the environmental point of view, measures such as the following among others could be implemented:
- ○
- Impose bans for the extraction of surface and groundwater in critical areas, with the purpose of avoiding and counteracting overexploitation of watersheds and aquifers;
- ○
- Implement programs for the restoration of eroded soils and those impregnated with saltpeter, by sowing or planting native plant species that contribute to re-establishing the natural vegetation cover;
- ○
- Restore damaged forest areas because of indiscriminate felling or fires, by sowing or planting native or adapted forest species;
- ○
- Expand the number and coverage of protected natural areas (biosphere reserves, national parks, wildlife sanctuaries, etc.), to preserve the hydrological cycle and the ecosystems balance.
5. Conclusions
Different socioeconomic and environmental factors make the population of a country, state, or municipality more or less vulnerable to danger or disaster associated with natural phenomena, such as a severe and long-lasting drought. However, there is no universally accepted method for evaluating and measuring a region’s degree of vulnerability to hydrological deficit events; therefore, scientists are free in each case to select or propose the method that most adapts to the specific needs and purposes of a study. This article presents a method for obtaining indices and maps of vulnerability to drought in Mexico; indices and maps are based on a set of socioeconomic and environmental indicators that the method combines using an objective analytic procedure that identifies the most vulnerable states and municipalities from social, economic, and environmental perspectives, all of which converge in overall vulnerability to drought. These vulnerability indices and maps can be useful for decision makers and actors responsible for developing different types of public policies, for instance when establishing priorities to prevent and mitigate the effects of drought, understanding where and how adaptive capacity should be improved, where and how to decrease sensitivity and exposure, and ultimately, optimizing the distribution of resources to the different social development government programs, which contribute to increase regions’ capacities to tackle extreme hydro-meteorological phenomena and help regions adapt to climate change.
The results obtained by this study indicate that 38.9% of the total Mexican population inhabits municipalities with high and very high degrees of overall vulnerability to drought. The socioeconomic and environmental characteristics of these municipalities make them especially vulnerable, through poverty, marginalization, and social backwardness; their agricultural and stockbreeding activities are sensitive and exposed to climate variations due to the lack of an adequate infrastructure; they suffer from severe deterioration of natural resources due to deforestation, soil degradation, and aquifer overexploitation, among others. Even though the majority of vulnerable states and municipalities is located in the north of the country and the Mexican Plateau (characterized by arid areas, more exposed and sensitive to drought), there are also states in the south, such as Guerrero, Oaxaca, and Chiapas (characterized by abundant rainfall), where municipalities present high degrees of environmental, economic, and social vulnerability to drought and are also severely affected by the phenomenon.
The results reported in this article—i.e., the vulnerability indices and maps—reflect current conditions in the country. In order to observe possible spatial changes of vulnerability along time and to verify whether the different actions put in place to reduce vulnerability have been effective, for instance those carried out within PRONACOSE, it is necessary to calculate the indices again in the future. The advantage of the proposed method is that it is based on an orderly procedure that can be easily replicated and allows for periodic updates of vulnerability indices and maps by updating the data associated with the indicators used for analysis. Additionally, given the flexibility provided by municipal-level analysis, the method can be adapted so as to obtain periodical vulnerability indices and maps for a certain state or region of the country, which can be especially useful for planning and decision-making at the local and regional levels.
It is necessary for Mexico to continue implementing actions and preventive and mitigation strategies via public policies and social programs aimed at decreasing the country’s vulnerability to the occurrence and recurrence of drought events. The role of spearheading and defraying the enactment of structural and non-structural strategies adequate for risk management and reduction of possible adverse impacts of droughts in the future corresponds to the federal organisms comprising the CIASI. In addition, as part of these risk management efforts, it is essential to put in place a broad communications campaign to provide the population with relevant and timely information for taking precautionary actions in case of drought alert and possible emergency. This is the only way to facilitate the necessary conditions to reduce the impact of drought and to decrease people’s vulnerability to this phenomenon.
Supplementary Materials
The following are available online at https://www.mdpi.com/2073-4441/10/11/1671/s1, Table S1: Municipalities of Mexico that present high and very high degrees of social, economic, environmental, and overall vulnerability to drought (ordered by state and from highest to lowest vulnerability index).
Author Contributions
Conceptualization and writing–original draft, D.O.-G.; methodology, D.O.-G. and J.d.l.C.B.; investigation and data curation J.d.l.C.B. and H.V.C.B.
Funding
This research was funded by the Scientific Research and Technological Development Fund of the Mexican Institute of Water Technology, through project TH1705.F.
Acknowledgments
We express our sincere thanks to the three anonymous reviewers who made comments and recommendations that allowed us to substantially improve this work.
Conflicts of Interest
The authors declare no conflict of interest.
Appendix A

Table A1.
States that comprise the Mexican Republic.
| No. | State | Municipality | Surface | Population (2017) | Population Density (Persons/km2) | |||
|---|---|---|---|---|---|---|---|---|
| No. | % | km2 | % | Inhabitants | % | |||
| 1 | Aguascalientes | 11 | 0.45 | 5560 | 0.28 | 1,321,453 | 1.07 | 238 |
| 2 | Baja California | 5 | 0.20 | 73,566 | 3.76 | 3,584,606 | 2.90 | 49 |
| 3 | Baja California Sur | 5 | 0.20 | 73,964 | 3.78 | 809,834 | 0.66 | 11 |
| 4 | Campeche | 11 | 0.45 | 57,679 | 2.95 | 935,047 | 0.76 | 16 |
| 5 | Chiapas | 118 | 4.80 | 73,570 | 3.76 | 3,029,738 | 2.45 | 41 |
| 6 | Chihuahua | 67 | 2.73 | 246,971 | 12.63 | 747,801 | 0.61 | 3 |
| 7 | Coahuila | 38 | 1.55 | 150,670 | 7.71 | 5,382,084 | 4.36 | 36 |
| 8 | Colima | 10 | 0.41 | 5752 | 0.29 | 3,782,018 | 3.06 | 658 |
| 9 | Ciudad de México | 16 | 0.65 | 1487 | 0.08 | 8,811,265 | 7.13 | 5,926 |
| 10 | Durango | 39 | 1.59 | 122,161 | 6.25 | 1,799,322 | 1.46 | 15 |
| 11 | Guanajuato | 46 | 1.87 | 30,336 | 1.55 | 5,908,848 | 4.78 | 195 |
| 12 | Guerrero | 81 | 3.30 | 63,609 | 3.25 | 3,607,211 | 2.92 | 57 |
| 13 | Hidalgo | 84 | 3.42 | 20,653 | 1.06 | 2,947,207 | 2.39 | 143 |
| 14 | Jalisco | 125 | 5.09 | 77,953 | 3.99 | 8,110,942 | 6.57 | 104 |
| 15 | México | 125 | 5.09 | 22,227 | 1.14 | 17,363,383 | 14.06 | 781 |
| 16 | Michoacán | 113 | 4.60 | 58,300 | 2.98 | 4,658,160 | 3.77 | 80 |
| 17 | Morelos | 33 | 1.34 | 4862 | 0.25 | 1,965,487 | 1.59 | 404 |
| 18 | Nayarit | 20 | 0.81 | 27,771 | 1.42 | 1,268,460 | 1.03 | 46 |
| 19 | Nuevo León | 51 | 2.08 | 63,615 | 3.25 | 5,229,492 | 4.23 | 82 |
| 20 | Oaxaca | 570 | 23.21 | 93,942 | 4.81 | 4,061,500 | 3.29 | 43 |
| 21 | Puebla | 217 | 8.84 | 34,119 | 1.75 | 6,313,794 | 5.11 | 185 |
| 22 | Querétaro | 18 | 0.73 | 11,604 | 0.59 | 2,063,147 | 1.67 | 178 |
| 23 | Quintana Roo | 9 | 0.37 | 42,658 | 2.18 | 1,664,667 | 1.35 | 39 |
| 24 | San Luis Potosí | 58 | 2.36 | 60,463 | 3.09 | 2,801,838 | 2.27 | 46 |
| 25 | Sinaloa | 18 | 0.73 | 56,800 | 2.91 | 3,034,940 | 2.46 | 53 |
| 26 | Sonora | 72 | 2.93 | 180,936 | 9.26 | 3,011,806 | 2.44 | 17 |
| 27 | Tabasco | 17 | 0.69 | 24,701 | 1.26 | 2,431,339 | 1.97 | 98 |
| 28 | Tamaulipas | 43 | 1.75 | 79,404 | 4.06 | 3,622,607 | 2.93 | 46 |
| 29 | Tlaxcala | 60 | 2.44 | 3982 | 0.20 | 1,313,064 | 1.06 | 330 |
| 30 | Veracruz | 212 | 8.63 | 71,470 | 3.66 | 8,163,965 | 6.61 | 114 |
| 31 | Yucatán | 106 | 4.32 | 39,663 | 2.03 | 2,172,843 | 1.76 | 55 |
| 32 | Zacatecas | 58 | 2.36 | 74,502 | 3.81 | 1,600,410 | 1.30 | 21 |
| Total | 2456 | 100.0 | 1,954,950 | 100.0 | 123,518,278 | 100.0 | 63 | |
Appendix B
Table A2.
Social vulnerability. Number of municipalities by state and percentages of municipalities with high and very high social vulnerability by state.
Table A2.
Social vulnerability. Number of municipalities by state and percentages of municipalities with high and very high social vulnerability by state.
| State | Total Municipalities | High Vulnerability | Very high Vulnerability | Sum of High and Very High Vulnerability | |||
|---|---|---|---|---|---|---|---|
| Number of Municipalities | % | Number of Municipalities | % | Number of Municipalities | % | ||
| Aguascalientes | 11 | 0 | 0.0 | 0 | 0.0 | 0 | 0.0 |
| Baja California | 5 | 0 | 0.0 | 0 | 0.0 | 0 | 0.0 |
| Baja California Sur | 5 | 0 | 0.0 | 0 | 0.0 | 0 | 0.0 |
| Campeche | 11 | 0 | 0.0 | 0 | 0.0 | 0 | 0.0 |
| Chiapas | 118 | 13 | 11.0 | 6 | 5.1 | 19 | 16.1 |
| Chihuahua | 67 | 2 | 3.0 | 13 | 19.4 | 15 | 22.4 |
| Ciudad de México | 16 | 3 | 18.8 | 2 | 12.5 | 5 | 31.3 |
| Coahuila | 38 | 2 | 5.3 | 0 | 0.0 | 2 | 5.3 |
| Colima | 10 | 0 | 0.0 | 0 | 0.0 | 0 | 0.0 |
| Durango | 39 | 2 | 5.1 | 5 | 12.8 | 7 | 17.9 |
| Guanajuato | 46 | 1 | 2.2 | 1 | 2.2 | 2 | 4.3 |
| Guerrero | 81 | 16 | 19.8 | 45 | 55.6 | 61 | 75.3 |
| Hidalgo | 84 | 7 | 8.3 | 2 | 2.4 | 9 | 10.7 |
| Jalisco | 125 | 10 | 8.0 | 9 | 7.2 | 19 | 15.2 |
| México | 125 | 11 | 8.8 | 4 | 3.2 | 15 | 12.0 |
| Michoacán | 113 | 37 | 32.7 | 14 | 12.4 | 51 | 45.1 |
| Morelos | 33 | 1 | 3.0 | 0 | 0.0 | 1 | 3.0 |
| Nayarit | 20 | 2 | 10.0 | 1 | 5.0 | 3 | 15.0 |
| Nuevo León | 51 | 1 | 2.0 | 0 | 0.0 | 1 | 2.0 |
| Oaxaca | 570 | 198 | 34.7 | 232 | 40.7 | 430 | 75.4 |
| Puebla | 217 | 106 | 48.8 | 41 | 18.9 | 147 | 67.7 |
| Querétaro | 18 | 1 | 5.6 | 2 | 11.1 | 3 | 16.7 |
| Quintana Roo | 9 | 0 | 0.0 | 0 | 0.0 | 0 | 0.0 |
| San Luis Potosí | 58 | 8 | 13.8 | 1 | 1.7 | 9 | 15.5 |
| Sinaloa | 18 | 0 | 0.0 | 0 | 0.0 | 0 | 0.0 |
| Sonora | 72 | 11 | 15.3 | 3 | 4.2 | 14 | 19.4 |
| Tabasco | 17 | 0 | 0.0 | 0 | 0.0 | 0 | 0.0 |
| Tamaulipas | 43 | 1 | 2.3 | 0 | 0.0 | 1 | 2.3 |
| Tlaxcala | 60 | 3 | 5.0 | 0 | 0.0 | 3 | 5.0 |
| Veracruz | 212 | 55 | 25.9 | 9 | 4.2 | 64 | 30.2 |
| Yucatán | 106 | 21 | 19.8 | 7 | 6.6 | 28 | 26.4 |
| Zacatecas | 58 | 3 | 5.2 | 0 | 0.0 | 3 | 5.2 |
| Total | 2456 | 515 | 21.0 | 397 | 16.2 | 912 | 37.1 |
Table A3.
Economic vulnerability. Number of municipalities by state and percentages of municipalities with high and very high economic vulnerability by state.
Table A3.
Economic vulnerability. Number of municipalities by state and percentages of municipalities with high and very high economic vulnerability by state.
| State | Total Municipalities | High Vulnerability | Very High Vulnerability | Sum of High and Very High Vulnerability | |||
|---|---|---|---|---|---|---|---|
| Number of Municipalities | % | Number of Municipalities | % | Number of Municipalities | % | ||
| Aguascalientes | 11 | 1 | 9.1 | 0 | 0.0 | 1 | 9.1 |
| Baja California | 5 | 0 | 0.0 | 3 | 60.0 | 3 | 60.0 |
| Baja California Sur | 5 | 2 | 40.0 | 1 | 20.0 | 3 | 60.0 |
| Campeche | 11 | 1 | 9.1 | 4 | 36.4 | 5 | 45.5 |
| Chiapas | 118 | 34 | 28.8 | 32 | 27.1 | 66 | 55.9 |
| Chihuahua | 67 | 11 | 16.4 | 8 | 11.9 | 19 | 28.4 |
| Ciudad de México | 16 | 2 | 12.5 | 2 | 12.5 | 4 | 25.0 |
| Coahuila | 38 | 5 | 13.2 | 5 | 13.2 | 10 | 26.3 |
| Colima | 10 | 0 | 0.0 | 0 | 0.0 | 0 | 0.0 |
| Durango | 39 | 6 | 15.4 | 2 | 5.1 | 8 | 20.5 |
| Guanajuato | 46 | 7 | 15.2 | 9 | 19.6 | 16 | 34.8 |
| Guerrero | 81 | 22 | 27.2 | 13 | 16.0 | 35 | 43.2 |
| Hidalgo | 84 | 23 | 27.4 | 15 | 17.9 | 38 | 45.2 |
| Jalisco | 125 | 3 | 2.4 | 1 | 0.8 | 4 | 3.2 |
| México | 125 | 17 | 13.6 | 19 | 15.2 | 36 | 28.8 |
| Michoacán | 113 | 10 | 8.8 | 3 | 2.7 | 13 | 11.5 |
| Morelos | 33 | 2 | 6.1 | 0 | 0.0 | 2 | 6.1 |
| Nayarit | 20 | 2 | 10.0 | 1 | 5.0 | 3 | 15.0 |
| Nuevo León | 51 | 2 | 3.9 | 1 | 2.0 | 3 | 5.9 |
| Oaxaca | 570 | 38 | 6.7 | 8 | 1.4 | 46 | 8.1 |
| Puebla | 217 | 34 | 15.7 | 27 | 12.4 | 61 | 28.1 |
| Querétaro | 18 | 1 | 5.6 | 1 | 5.6 | 2 | 11.1 |
| Quintana Roo | 9 | 0 | 0.0 | 2 | 22.2 | 2 | 22.2 |
| San Luis Potosí | 58 | 9 | 15.5 | 10 | 17.2 | 19 | 32.8 |
| Sinaloa | 18 | 1 | 5.6 | 1 | 5.6 | 2 | 11.1 |
| Sonora | 72 | 4 | 5.6 | 1 | 1.4 | 5 | 6.9 |
| Tabasco | 17 | 3 | 17.6 | 3 | 17.6 | 6 | 35.3 |
| Tamaulipas | 43 | 5 | 11.6 | 2 | 4.7 | 7 | 16.3 |
| Tlaxcala | 60 | 4 | 6.7 | 1 | 1.7 | 5 | 8.3 |
| Veracruz | 212 | 45 | 21.2 | 46 | 21.7 | 91 | 42.9 |
| Yucatán | 106 | 17 | 16.0 | 10 | 9.4 | 27 | 25.5 |
| Zacatecas | 58 | 6 | 10.3 | 5 | 8.6 | 11 | 19.0 |
| Total | 2456 | 317 | 12.9 | 236 | 9.6 | 553 | 22.5 |
Table A4.
Environmental vulnerability. Number of municipalities by state and percentages of municipalities with high and very high environmental vulnerability by state.
Table A4.
Environmental vulnerability. Number of municipalities by state and percentages of municipalities with high and very high environmental vulnerability by state.
| State | Total Municipalities | High Vulnerability | Very High Vulnerability | Sum of High and Very High Vulnerability | |||
|---|---|---|---|---|---|---|---|
| Number of Municipalities | % | Number of Municipalities | % | Number of Municipalities | % | ||
| Aguascalientes | 11 | 2 | 18.2 | 2 | 18.2 | 4 | 36.4 |
| Baja California | 5 | 1 | 20.0 | 4 | 80.0 | 5 | 100.0 |
| Baja California Sur | 5 | 0 | 0.0 | 5 | 100.0 | 5 | 100.0 |
| Campeche | 11 | 0 | 0.0 | 0 | 0.0 | 0 | 0.0 |
| Chiapas | 118 | 7 | 5.9 | 15 | 12.7 | 22 | 18.6 |
| Chihuahua | 67 | 12 | 17.9 | 17 | 25.4 | 29 | 43.3 |
| Ciudad de México | 16 | 0 | 0.0 | 0 | 0.0 | 0 | 0.0 |
| Coahuila | 38 | 10 | 26.3 | 9 | 23.7 | 19 | 50.0 |
| Colima | 10 | 1 | 10.0 | 1 | 10.0 | 2 | 20.0 |
| Durango | 39 | 4 | 10.3 | 12 | 30.8 | 16 | 41.0 |
| Guanajuato | 46 | 6 | 13.0 | 13 | 28.3 | 19 | 41.3 |
| Guerrero | 81 | 8 | 9.9 | 20 | 24.7 | 28 | 34.6 |
| Hidalgo | 84 | 11 | 13.1 | 6 | 7.1 | 17 | 20.2 |
| Jalisco | 125 | 16 | 12.8 | 23 | 18.4 | 39 | 31.2 |
| México | 125 | 10 | 8.0 | 4 | 3.2 | 14 | 11.2 |
| Michoacán | 113 | 10 | 8.8 | 18 | 15.9 | 28 | 24.8 |
| Morelos | 33 | 3 | 9.1 | 1 | 3.0 | 4 | 12.1 |
| Nayarit | 20 | 4 | 20.0 | 0 | 0.0 | 4 | 20.0 |
| Nuevo León | 51 | 4 | 7.8 | 6 | 11.8 | 10 | 19.6 |
| Oaxaca | 570 | 10 | 1.8 | 7 | 1.2 | 17 | 3.0 |
| Puebla | 217 | 12 | 5.5 | 15 | 6.9 | 27 | 12.4 |
| Querétaro | 18 | 4 | 22.2 | 11 | 61.1 | 15 | 83.3 |
| Quintana Roo | 9 | 3 | 33.3 | 0 | 0.0 | 3 | 33.3 |
| San Luis Potosí | 58 | 8 | 13.8 | 19 | 32.8 | 27 | 46.6 |
| Sinaloa | 18 | 3 | 16.7 | 8 | 44.4 | 11 | 61.1 |
| Sonora | 72 | 10 | 13.9 | 17 | 23.6 | 27 | 37.5 |
| Tabasco | 17 | 0 | 0.0 | 0 | 0.0 | 0 | 0.0 |
| Tamaulipas | 43 | 3 | 7.0 | 0 | 0.0 | 3 | 7.0 |
| Tlaxcala | 60 | 0 | 0.0 | 0 | 0.0 | 0 | 0.0 |
| Veracruz | 212 | 24 | 11.3 | 49 | 23.1 | 73 | 34.4 |
| Yucatán | 106 | 1 | 0.9 | 0 | 0.0 | 1 | 0.9 |
| Zacatecas | 58 | 12 | 20.7 | 15 | 25.9 | 27 | 46.6 |
| Total | 2456 | 199 | 8.1 | 297 | 12.1 | 496 | 20.2 |
Table A5.
Overall vulnerability. Number of municipalities by state and percentages of municipalities with high and very high overall vulnerability by state.
Table A5.
Overall vulnerability. Number of municipalities by state and percentages of municipalities with high and very high overall vulnerability by state.
| State | Total Municipalities | High Vulnerability | Very high Vulnerability | Sum of High and Very High Vulnerability | |||
|---|---|---|---|---|---|---|---|
| Number of Municipalities | % | Number of Municipalities | % | Number of Municipalities | % | ||
| Aguascalientes | 11 | 1 | 9.1 | 2 | 18.2 | 3 | 27.3 |
| Baja California | 5 | 2 | 40.0 | 3 | 60.0 | 5 | 100.0 |
| Baja California Sur | 5 | 0 | 0.0 | 5 | 100.0 | 5 | 100.0 |
| Campeche | 11 | 0 | 0.0 | 0 | 0.0 | 0 | 0.0 |
| Chiapas | 118 | 10 | 8.5 | 15 | 12.7 | 25 | 21.2 |
| Chihuahua | 67 | 14 | 20.9 | 15 | 22.4 | 29 | 43.3 |
| Ciudad de México | 16 | 0 | 0.0 | 0 | 0.0 | 0 | 0.0 |
| Coahuila | 38 | 7 | 18.4 | 8 | 21.1 | 15 | 39.5 |
| Colima | 10 | 0 | 0.0 | 1 | 10.0 | 1 | 10.0 |
| Durango | 39 | 3 | 7.7 | 11 | 28.2 | 14 | 35.9 |
| Guanajuato | 46 | 6 | 13.0 | 11 | 23.9 | 17 | 37.0 |
| Guerrero | 81 | 32 | 39.5 | 25 | 30.9 | 57 | 70.4 |
| Hidalgo | 84 | 8 | 9.5 | 4 | 4.8 | 12 | 14.3 |
| Jalisco | 125 | 21 | 16.8 | 13 | 10.4 | 34 | 27.2 |
| México | 125 | 11 | 8.8 | 3 | 2.4 | 14 | 11.2 |
| Michoacán | 113 | 22 | 19.5 | 12 | 10.6 | 34 | 30.1 |
| Morelos | 33 | 2 | 6.1 | 1 | 3.0 | 3 | 9.1 |
| Nayarit | 20 | 1 | 5.0 | 1 | 5.0 | 2 | 10.0 |
| Nuevo León | 51 | 3 | 5.9 | 4 | 7.8 | 7 | 13.7 |
| Oaxaca | 570 | 119 | 20.9 | 12 | 2.1 | 131 | 23.0 |
| Puebla | 217 | 29 | 13.4 | 15 | 6.9 | 44 | 20.3 |
| Querétaro | 18 | 5 | 27.8 | 7 | 38.9 | 12 | 66.7 |
| Quintana Roo | 9 | 1 | 11.1 | 0 | 0.0 | 1 | 11.1 |
| San Luis Potosí | 58 | 6 | 10.3 | 15 | 25.9 | 21 | 36.2 |
| Sinaloa | 18 | 7 | 38.9 | 2 | 11.1 | 9 | 50.0 |
| Sonora | 72 | 5 | 6.9 | 12 | 16.7 | 17 | 23.6 |
| Tabasco | 17 | 0 | 0.0 | 0 | 0.0 | 0 | 0.0 |
| Tamaulipas | 43 | 1 | 2.3 | 0 | 0.0 | 1 | 2.3 |
| Tlaxcala | 60 | 0 | 0.0 | 0 | 0.0 | 0 | 0.0 |
| Veracruz | 212 | 37 | 17.5 | 33 | 15.6 | 70 | 33.0 |
| Yucatán | 106 | 2 | 1.9 | 0 | 0.0 | 2 | 1.9 |
| Zacatecas | 58 | 10 | 17.2 | 10 | 17.2 | 20 | 34.5 |
| Total | 2456 | 365 | 14.9 | 240 | 9.8 | 605 | 24.6 |
References
- Wilhite, D.A. Drought as a natural hazard: Concepts and definitions. In Drought: A Global Assessment; Wilhite, D.A., Ed.; Routledge: London, UK, 2000; Volume 1, pp. 3–18. ISBN 978-0-415-16834-2. [Google Scholar]
- WMO (World Meteorological Organization). Drought Monitoring and Early Warning: Concepts, Progress and Future Challenges; WMO: Geneva, Switzerland, 2006; 24p, ISBN 978-92-63-11006-0. [Google Scholar]
- Wilhite, D.A.; Glantz, M. Understanding the drought phenomenon: The role of definitions. Water Int. 1985, 10, 111–120. [Google Scholar] [CrossRef]
- Wilhite, D.A. Drought. In Encyclopedia of Water Science, 2nd ed.; Trimble, S.W., Ed.; Taylor & Francis Group: Boca Raton, FL, USA, 2008; pp. 215–217. ISBN 978-0-8493-9627-4. [Google Scholar]
- Heim, R.R. A review of twentieth-century drought indices used in the United States. Bull. Am. Meteorol. Soc. 2002, 83, 1149–1165. [Google Scholar] [CrossRef]
- Hayes, M.J.; Alvord, C.; Lowrey, J. Drought indices. Interm. West Clim. Summ. 2007, 3, 2–6. [Google Scholar]
- Palmer, W.C. Meteorological Drought; Research Paper No. 45; US Weather Bureau: Washington, DC, USA, 1965.
- McKee, T.; Doesken, N.; Kleist, J. The relationship of drought frequency and duration to time scales. In Proceedings of the 8th Conference of Applied Climatology, Anaheim, CA, USA, 17–22 January 1993; pp. 179–184. [Google Scholar]
- Tsakiris, G.; Vangelis, H. Establishing a drought index incorporating evapotranspiration. Eur. Water 2005, 9, 3–11. [Google Scholar]
- Vicente-Serrano, S.M.; Beguería, S.; López-Moreno, J.I. A multiscalar drought index sensitive to global warming: The Standardized Precipitation Evapotranspiration Index. J. Clim. 2010, 23, 1696–1718. [Google Scholar] [CrossRef]
- Nalbantis, I.; Tsakiris, G. Assessment of hydrological drought revisited. Water Res. Manag. 2008, 23, 881–897. [Google Scholar] [CrossRef]
- World Meteorological Organization (WMO); Global Water Partnership (GWP). Handbook of Drought Indicators and Indices; Svoboda, M., Fuchs, B.A., Eds.; Integrated Drought Management Programme (IDMP): Geneva, Switzerland, 2016; 45p, ISBN 978-92-63-11173-9. [Google Scholar]
- Zargar, A.; Sadiq, R.; Naser, B.; Khanb, F.I. A review of drought indices. Environ. Rev. 2011, 19, 333–349. [Google Scholar] [CrossRef]
- Onyutha, C. On rigorous drought assessment using daily time scale: Non-stationary frequency analyses, revisited concepts, and a new method to yield non-parametric indices. Hydrology 2017, 4. [Google Scholar] [CrossRef]
- Seavoy, R.E. Famine in Peasant Societies; Greenwood Press: Santa Barbara, CA, USA, 1986; 490p, ISBN 031-325-130-4. [Google Scholar]
- Gill, R.B. The Great Maya Droughts. Water, Life and Death; University of New Mexico Press: Albuquerque, NM, USA, 2001; ISBN 082-632-774-5. [Google Scholar]
- Wilhite, D.A.; Vanyarkho, O. Drought: Pervasive impacts of a creeping phenomenon. In Drought: A Global Assessment; Wilhite, D.A., Ed.; Routledge: London, UK, 2000; Volume 1, pp. 245–255. ISBN 978-0-415-16834-2. [Google Scholar]
- Florescano, E. Breve Historia de la Sequía en México, 2nd ed.; Conaculta: D.F., Mexico, 2000; 252p, ISBN 970-184-852-7. [Google Scholar]
- Magaña, V.; Zermeño, D.; Neri, C. Climate change scenarios and potential impacts on water availability in northern Mexico. Clim. Res. 2012, 51, 171–184. [Google Scholar] [CrossRef] [Green Version]
- SMN (National Meteorological Service). Monitor de Sequía en México. Available online: http://smn1.conagua.gob.mx/ (accessed on 25 August 2018).
- Korenfeld, F.D.; Arreguín, C.F.; López, P.M. Constructing a framework for National Drought Policy: The way forward in Mexico. Weather Clim. Extrem. 2014, 3, 90–94. [Google Scholar] [CrossRef]
- Arreguín, C.F.; López, M.; Korenfeld, D.; Ortega-Gaucin, D. The National Drought Policy in Mexico. J. Energy Chall. Mech. 2016, 3, 157–166. [Google Scholar]
- Arreguín, C.F.; López, P.M.; Ortega-Gaucin, D.; Ibañez, F.O. La política pública para la sequía en México: Avances, necesidades y perspectivas. Tecnología y Ciencias del Agua 2016, 7, 63–76. [Google Scholar]
- Ortega-Gaucin, D.; López, P.M.; Arreguín, C.F. Drought risk management in Mexico: Progress and challenges. Int. J. Saf. Secur. Eng. 2016, 6, 161–170. [Google Scholar] [CrossRef]
- Sönmez, F.K.; Kömüşcü, A.Ü.; Erkan, A.; Turgu, E. An analysis of spatial and temporal dimension of drought vulnerability in Turkey using the standardized precipitation index. Nat. Hazards 2005, 35, 243–264. [Google Scholar] [CrossRef]
- Shahid, S.; Behrawan, H. Drought risk assessment in the western part of Bangladesh. Nat. Hazards 2008, 46, 391–413. [Google Scholar] [CrossRef]
- Hall, J.; Murphy, C. Vulnerability analysis of future public water supply under changing climate conditions: A case study of the Moy Catchement, Western Ireland. Water Res. Manag. 2010, 24, 3527–3545. [Google Scholar] [CrossRef]
- Shiau, J.T.; Hsiao, Y.Y. Water-deficit-based drought risk assessment in Taiwan. Nat. Hazards 2012, 64, 237–257. [Google Scholar] [CrossRef]
- Al-Kalbani, M.S.; Price, M.F.; Abahussain, A.; Ahmed, M.; O’Higgins, T. Vulnerability assessment of environmental and climate change impacts on water resources in Al Jabal Al Akhdar, Sultanate of Oman. Water 2014, 6, 3118–3135. [Google Scholar] [CrossRef]
- Rajsekhar, D.; Singh, V.P.; Mishra, A.K. Integrated drought causality, hazard, and vulnerability assessment for future socioeconomic scenarios: An information theory perspective. J. Geophys. Res. Atmos. 2015, 120, 6346–6378. [Google Scholar] [CrossRef] [Green Version]
- Tanago, I.G.; Urquijo, J.; Blauhut, V.; Villarroyai, F.; De Stefano, L. Learning from experience: A systematic review of assessments of vulnerability to drought. Nat. Hazards 2016, 80, 951–973. [Google Scholar] [CrossRef]
- Pei, W.; Fu, Q.; Li, D.L.T. Assessing agricultural drought vulnerability in the Sanjiang plain based on an improved projection pursuit model. Nat. Hazards 2016, 82, 683–701. [Google Scholar] [CrossRef]
- Núñez, J.; Vergara, A.; Leyton, C.; Metzkes, C.; Mancilla, G.; Bettancourt, D. Reconciling drought vulnerability assessment using a convergent approach: Application to water security in the Elqui River Basin, North-Central Chile. Water 2017, 9, 589. [Google Scholar] [CrossRef]
- Epule, T.E.; Ford, J.D.; Lwasa, S.; Lepage, L. Vulnerability of maize yields to droughts in Uganda. Water 2017, 9, 181. [Google Scholar] [CrossRef]
- Ahmadalipour, A.; Moradkhani, H. Multi-dimensional assessment of drought vulnerability in Africa: 1960–2100. Sci. Total Environ. 2018, 644, 520–535. [Google Scholar] [CrossRef] [PubMed]
- Dabanli, I. Drought hazard, vulnerability, and risk assessment in Turkey. Arab. J. Geosci. 2018, 11, 538. [Google Scholar] [CrossRef]
- Masia, S.; Sušnik, J.; Marras, S.; Mereu, S.; Spano, D.; Trabucco, A. Assessment of irrigated agriculture vulnerability under climate change in Southern Italy. Water 2018, 10, 209. [Google Scholar] [CrossRef]
- Escalante Sandoval, C.A. La vulnerabilidad ante los extremos: La sequía. Ingeniería Hidráulica en México 2003, XVIII, 133–155. [Google Scholar]
- Ortega-Gaucin, D. Sequía en Nuevo León: Vulnerabilidad, Impactos y Estrategias de Mitigación; Instituto del Agua del Estado de Nuevo León: Apodaca, Mexico, 2012; 222p, ISBN 978-607-9203-06-1. [Google Scholar]
- García, R.E. Índices de Vulnerabilidad a la Sequía en la Cuenca del Río Bravo. Master’s Thesis, Universidad Nacional Autónoma de México, D.F., Mexico, 20 January 2014. [Google Scholar]
- Ortega-Gaucin, D.; Castellano, B.H.V.; de la Cruz, B.J. Economic, social and environmental vulnerability to drought in the Northwest River Basin System, Mexico. Int. J. Environ. Impacts 2018, 1, 240–253. [Google Scholar] [CrossRef]
- Meza-González, R.A.; Ibáñez-Hernández, O.F. Análisis de propuestas metodológicas sobre vulnerabilidad contenidas en los Programas de Medidas Preventivas y de Mitigación de la Sequía en México. Tecnociencia Chihuahua 2016, IX, 180–191. [Google Scholar]
- CONAGUA (National Water Comission). Análisis Espacial de las Regiones Más Vulnerables Ante las Sequías en México; SEMARNAT: D.F., Mexico, 2012; Available online: http://www.conagua.gob.mx/CONAGUA07/Publicaciones/Publicaciones/sequiasB.pdf (accessed on 22 February 2018).
- Neri, C.; Magaña, V. Estimation of vulnerability and risk to meteorological drought in Mexico. Weather Clim. Soc. 2016, 8, 95–110. [Google Scholar] [CrossRef]
- Hoffman, S.; Oliver, S.A. Anthropology and the angry Earth: An overview. In The Angry Earth. Disaster in Anthropological Perspective; Oliver, S.A., Hoffman, S., Eds.; Routledge: London, UK, 1999; pp. 1–16. ISBN 978-041-591-987-6. [Google Scholar]
- Cardona, O.D. The need for rethinking the concepts of vulnerability and risk from a holistic perspective: A necessary review and criticism for effective risk management. In Mapping Vulnerability. Disasters, Development & People; Bankoff, G., Frerks, G., Hilhorst, D., Eds.; Earthscan: London, UK, 2004; pp. 37–51. ISBN 1-85383-964-7. [Google Scholar]
- Hannigan, J. Environmental Sociology, 3rd ed.; Taylor & Francis Ltd.: London, UK, 2014; ISBN 041-566-189-7. [Google Scholar]
- Thywissen, K. Core terminology of disaster reduction: A comparative glossary. In Measuring Vulnerability to Natural Hazards. Towards Disaster Resilient Societies; Birkmann, J., Ed.; United Nations University: Tokyo, Japan, 2006; pp. 448–496. ISBN 92-808-1135-5. [Google Scholar]
- Alwang, J.; Siegel, P.B.; Jorgensen, S.L. Vulnerability: A View from Different Disciplines; Social Protection Discussion Paper Series; The World Bank: Washington, DC, USA, 2011; Available online: http://documents.worldbank.org/curated/en/636921468765021121/Vulnerability-a-view-from-different-disciplines (accessed on 15 February 2018).
- Cutter, S.L.; Boruff, B.J.; Shirley, W.L. Social vulnerability to environmental hazards. Soc. Sci. Q. 2003, 84, 242–261. [Google Scholar] [CrossRef]
- Vogel, C.; O’Brien, K. Vulnerability and global environmental change: Rhetoric and reality. Available online: https://idl-bnc-idrc.dspacedirect.org/handle/10625/39859 (accessed on 12 July 2018).
- Birkmann, J. Risk and vulnerability indicators at different scales: Applicability, usefulness and policy implications. Environ. Hazards 2007, 7, 20–31. [Google Scholar] [CrossRef]
- Wilhelmi, O.V.; Wilhite, D.A. Assessing vulnerability to agricultural drought: A Nebraska case study. Nat. Hazards 2002, 25, 37–58. [Google Scholar] [CrossRef]
- Alcamo, J.; Acosta-Michlik, L.; Carius, A.; Eierdanz, F.; Klein, R.J.T.; Kromker, D.; Taenzler, D. A new approach to quantifying and comparing vulnerability to drought. Reg. Environ. Chang. 2008, 8, 137–149. [Google Scholar] [CrossRef]
- Fontaine, M.M.; Steinemann, A.C. Assessing vulnerability to natural hazards: Impact-based method and application to drought in Washington state. Nat. Hazards Rev. 2009, 10, 11–18. [Google Scholar] [CrossRef]
- Liu, X.; Wang, Y.; Peng, J.; Braimoh, A.K.; Yin, H. Assessing vulnerability to drought based on exposure, sensitivity and adaptive capacity: A case study in middle Inner Mongolia of China. Chin. Geogr. Sci. 2013, 23, 13–25. [Google Scholar] [CrossRef]
- Stathatou, P.M.; Kampragou, E.; Grigoropoulou, H.; Assimacopoulos, D.; Karavitis, C.; Porto, M.F.A.; Gironás, J.; Vanegas, M.; Reyna, S. Vulnerability of water systems: A comprehensive framework for its assessment and identification of adaptation strategies. Desalin. Water Treat. 2016, 57, 2243–2255. [Google Scholar] [CrossRef]
- IPCC (Intergovernmental Panel on Climate Change). Climate Change 2007: Synthesis Report. Contribution of Working Groups I, II and III to the Fourth Assessment Report of the Intergovernmental Panel on Climate Change; IPCC: Geneva, Switzerland, 2008; 104p, ISBN 929-169-122-4. [Google Scholar]
- IPCC (Intergovernmental Panel on Climate Change). Climate Change 2014: Synthesis Report. Contribution of Working Groups I, II and III to the Fifth Assessment Report of the Intergovernmental Panel on Climate Change; IPCC: Geneva, Switzerland, 2015; 152p, ISBN 978-92-9169-143-2. [Google Scholar]
- BID (Inter-American Development Bank). Indicadores de riesgo de desastre y de gestión de riesgos. Programa para América Latina y el Caribe; BID: Lima, Perú, 2007; 74p. [Google Scholar]
- Costa, L.; Kropp, J.P. Linking components of vulnerability in theoretic frameworks and case studies. Sustain. Sci. 2013, 8, 1–9. [Google Scholar] [CrossRef]
- Wilches-Chaux, G. La vulnerabilidad global. In Los Desastres no Son Naturales; Maskrey, A., Comp.; Red de Estudios Sociales en Prevención de Desastres en América Latina: Puerto Limón, Costa Rica, 1993; pp. 11–44. [Google Scholar]
- CONAPO (National Population Council). Proyecciones de Población de México 1990–2030. Available online: http://www.conapo.gob.mx/es/CONAPO/Consultas_Interactivas (accessed on 17 January 2018).
- Díaz-Padilla, G.; Sánchez-Cohen, I.; Guajardo-Panes, R.A.; del Ángel-Pérez, A.L.; Ruíz-Corral, A.; Medina-García, G.; Ibarra-Castillo, D. Mapeo del índice de aridez y su distribución poblacional en México. Revista Chapingo. Serie Ciencias Forestales y del Ambiente 2011, XVII, 267–275. [Google Scholar] [CrossRef]
- Magaña, V. Los Impactosdel Niño en México; Universidad Nacional Autónoma de México: D.F., Mexico, 2004; 229p. [Google Scholar]
- UNDP (United Nations Development Programme). Informesobredesarrollohumano 2006; Grupo Mindi Prensa: Madrid, Spain, 2006; 422p, ISBN 84-8476-301-3. [Google Scholar]
- Iyengar, N.S.; Sudarshan, P. A method of classifying regions from multivariate data. Econ. Polit. Wkly. 1982, 17, 2047–2052. [Google Scholar]
- INEGI (National Institute of Statistic and Geography). Marco Geoestadístico Nacional. Available online: http://www.inegi.org.mx/geo/contenidos/geoestadistica/m_geoestadistico.aspx (accessed on 25 July 2018).
- Soares, D.; Romero, R.; López, R. Conceptualización de vulnerabilidad y construcción de un índice de vulnerabilidad social. In Atlas de Vulnerabilidad Hídrica en México Ante el Cambio Climático; Instituto Mexicano de Tecnología del Agua: Jiutepec, Mexico, 2015; pp. 11–16. ISBN 978-607-9368-07-4. [Google Scholar]
- CONEVAL (National Council for Evaluation of Social Development Policy). Resultados de Pobreza en México 2016 a Nivel Nacional y por Entidades Federativas. Available online: http://www.coneval.org.mx/Medicion/MP/Paginas/Pobreza_2014.aspx (accessed on 15 May 2018).
- CONAGUA (National Water Comission). Estadísticas del Agua en México; SEMARNAT: D.F., Mexico, 2017; Available online: http://sina.conagua.gob.mx/publicaciones/EAM_2017.pdf (accessed on 14 March 2018).
- INEGI (National Institute of Statistic and Geography). Estadísticas a Propósito del Día Mundial Contra la Desertificación y la Sequía. Available online: http://www.iieg.gob.mx/contenido/GeografiaMedioAmbiente/INEGI_Diamundialcontraladesertificacionylasequia.pdf (accessed on 16 June 2018).
- CENAPRED (National Center for Disaster Prevention). Diagnóstico de Peligros e Identificación de Riesgos de Desastres en México; Secretaría de Gobernación: D.F., Mexico, 2001; 225p, ISBN 970-628-593-8. [Google Scholar]
- Postel, S. Administración del Agua en Época de Escasez; Trad. of Ugalde, V.; Instituto Mexicano de Tecnología del Agua: Jiutepec, Mexico, 1991; 71p. [Google Scholar]
- Moreno, P. Nubes Ausentes: Las Sequías; Planeta Mexicana: D.F., Mexico, 2004; 35p, ISBN 970-370-072-1. [Google Scholar]
- El Universal. Por la Sequía, Todo se Está Acabando. Available online: http://www.eluniversal.com.mx/articulo/estados/2015/08/30/por-la-sequia-todo-se-esta-acabando (accessed on 13 September 2018).
- UNCCD (United Nations Convention to Combat Desertification). Drought: Reducing Impacts and Building Resilience. Available online: https://knowledge.unccd.int/topics/drought-reducing-impacts-and-building-resilience (accessed on 29 October 2018).
Figure 1.
Drought vulnerability indices calculation method.

Figure 2.
Geographical location and political distribution in the Mexican Republic.

Figure 3.
Geographical location and political distribution in the Mexican Republic.

Figure 4.
Fitting of the social (a); economic (b); environmental (c); and overall (d) vulnerability indices to the beta probability density function.
Figure 4.
Fitting of the social (a); economic (b); environmental (c); and overall (d) vulnerability indices to the beta probability density function.

Figure 5.
Map of social vulnerability to drought.

Figure 6.
Map of economic vulnerability to drought.

Figure 7.
Map of environmental vulnerability to drought.

Figure 8.
Map of overall vulnerability to drought.

Table 1.
Matrix showing the selected indicators, grouped by type and component of vulnerability to drought.
Table 1.
Matrix showing the selected indicators, grouped by type and component of vulnerability to drought.
| Types of Vulnerability | Components of Vulnerability | |||
|---|---|---|---|---|
| Degree of Exposure (ED) | Sensitivity (S) | Adaptive Capacity (AC) | ||
| Indicators | ||||
| Overall | Social |
|
|
|
| Economic |
|
|
| |
| Environmental |
|
|
| |
Table 2.
Indicators of degree of exposure to drought.
| Type of Vulnerability | Indicator | Description | How It Relates to Drought Vulnerability | |
|---|---|---|---|---|
| Overall | Social | Population density (persons/km2) | A measure of population distribution equivalent to the number of municipality inhabitants divided by municipality area. | The higher the population density of a municipality, the greater the volume of water required to satisfy the demand and, therefore, the municipality is more vulnerable to suffer water deficit effects as a result of drought. |
| Population in poverty (%) | Proportion of population whose income is insufficient to cover basic needs. In Mexico, it is measured using a method developed by the National Council for the Evaluation of Social Development Policy (CONEVAL). | Poverty is synonymous with social vulnerability. The municipalities with the highest proportion of population living in poverty are more vulnerable to any type of natural hazard, including drought. The official measurement of poverty is used by the federal and state governments to prioritize programs and actions. | ||
| Population without health care insurance (%) | Proportion of population not registered with any of the federal or state institutions providing health care services, such as the Mexican Social Security Institute (IMSS) or the Institute for Social Security and Services for State Workers (ISSSTE). | The greater the population of a municipality that does not have health services, the greater social vulnerability to drought, because this phenomenon may be the trigger of certain types of diseases (respiratory, gastrointestinal, etc.) caused by low humidity, high temperatures and lack of water for personal hygiene and household cleaning. | ||
| Economic | Agriculture and livestock production units (dimensionless) | Consists in the lands used for stockbreeding and agricultural activities within a given municipality, together with the equipment, machinery, and vehicles employed in the activities and managed by the same administration. | Agricultural and livestock activities are, without a doubt, the first economic sector affected by drought and are often the most damaged. Therefore, the greater the number of units of agricultural and livestock production that a municipality has, the greater its vulnerability to drought, since the volumes of water required to satisfy the demand increase considerably. | |
| Value of irrigated and rainfed agricultural production (thousands of MXN) | Represents the value of rainfed and irrigated production obtained in one year. | Irrigated and rainfed agriculture is the economic activity that requires and consumes the largest volumes of water in Mexico (around 70%). Therefore, the value of agricultural production is an indicator that can reflect potential economic losses in the presence of drought, where municipalities with greater agricultural activity are more vulnerable. | ||
| Value of livestock production (thousands of MXN) | Value of existing livestock, including different species (cattle, horses, sheep, goats, pigs, and poultry). | The value of livestock production represents the quantity and quality of feed that livestock receives, as it depends on the pasture areas and water volumes for trough. Undoubtedly, in presence of drought, the negative impact is direct on this economic activity, which is why livestock municipalities are more vulnerable to drought. | ||
| Environmental | Aridity index (dimensionless) | An index used to classify the degree of aridity in a region; it is calculated as the relationship between precipitation and potential evapotranspiration. | The arid zones are characterized by extreme dry and semi-dry climates, where scarcity and lack of water are permanent situations. Therefore, the municipalities located in these areas of the country are highly vulnerable to drought, since they already have a water deficit. | |
| Degree of watershed exploitation (dimensionless) | The relationship between annual surface water withdrawal and mean annual volume of watershed natural runoff. | Drought causes a significant reduction of precipitation, runoff and surface water storage; therefore, the areas that have a greater degree of basins exploitation are more vulnerable to drought, which affects all economic, social and environmental spheres. | ||
| Degree of aquifer exploitation (dimensionless) | The relationship between annual groundwater withdrawal volume and an aquifer’s mean annual recharge volume. | When drought occurs, groundwater often represents the only source of water to supply population, economic activities and services. In this sense, those areas of the country where there are overexploited aquifers are obviously more vulnerable to drought. | ||
Table 3.
Indicators of sensitivity to drought.
| Type of Vulnerability | Indicator | Description | How It Relates to Drought Vulnerability | |
|---|---|---|---|---|
| Overall | Social | Households without running water (%) | An indicator of marginalization and social backwardness that reflects the proportion of households in a municipality lacking tap water. | This indicator directly reflects the population vulnerability to drought by not having the basic running water service in their home. If this service is not available, water has to be obtained generally at great distances, which is aggravated by the presence of drought. |
| Households without drainage and flush toilet (%) | It refers to the proportion of households without a proper connection to the drainage services and lacking a flush toilet. | This indicator reflects the population social backwardness and influences vulnerability to drought, because families living in homes without sanitation are more susceptible to gastrointestinal and other diseases associated with lack of hygiene at home. | ||
| Households with dirt floor (%) | An indicator of marginalization and social backwardness that reflects the proportion of households in a municipality lacking firm concrete flooring. | This indicator of social lag reflects the vulnerability to which the population is subject given that it does not have a basic service. In drought conditions, this population segment becomes more susceptible to presenting health problems due to the hygiene lack in their home. | ||
| Economic | Insufficient production infrastructure (%) | Percentage of agricultural and livestock production units lacking sufficient infrastructure to develop their economic activities. | The agricultural and livestock production units that do not have sufficient infrastructure for their activities, are more susceptible to be affected by drought because they lack the necessary means to deal with the phenomenon and to continue in a normal way with their production. | |
| Lack of technical assistance (%) | Production of livestock production units without support from qualified technical staff to optimize their performance. | Production units that do not have technical advice to carry out their economic activity are more vulnerable to drought, since they lack the specialized knowledge that could provide them with tools to cope with drought trough appropriate risk management strategies. | ||
| Commercialization problems (%) | Percentage of livestock production units having difficulties to sell their products due to the lack of a suitable market, thoroughfares, or modes of transport. | Those production units that have difficulties to market their products are more vulnerable to drought, because they can not sell their production and, therefore, lack the necessary economic resources that would allow them to cope adequately with the damage caused by this phenomenon. | ||
| Environmental | Surface eroded or impregnated with saltpeter (ha) | Area of production units where soil productivity has decreased due to erosion or saltpeter presence. | The agricultural areas that have problems of soil erosion or saltpeter are more vulnerable to drought, because these problems cause losses in land productivity, which are aggravated when the soil and vegetation are dry for a long time by lack of rain. | |
| Deforested surface (%) | Proportion of forested areas in critical conditions due to indiscriminate felling and changes in soil usage (forestry to agricultural, urban, etc.). | The indiscriminate forest felling often causes irreversible damage to ecosystems, as it breaks the natural balance of the species and causes abrupt changes in the hydrological cycle, so deforested areas are more vulnerable to drought because they have lost their capacity for natural regeneration. | ||
| Surface affected by forest fires (ha) | Forested area that has been affected by fires, both natural and intentional. | The frequency and severity of forest fires increases when there are drought conditions, because due to high temperatures and low relative humidity, the forest material available is highly susceptible to burning easily, so that dry and damaged forest areas are more vulnerable to drought. | ||
Table 4.
Indicators of adaptive capacity.
| Type of Vulnerability | Indicator | Description | How It Relates to Drought Vulnerability | |
|---|---|---|---|---|
| Overall | Social | Beneficiaries of social programs (%) | Percentage of population included in the social inclusion federal program named “Prospera”, which articulates and coordinates the institutional offer of social policy actions and programs, including those related to production support, income generation, economic welfare, education, food, and health care, targeted at impoverished population. | Municipalities that have a greater proportion of beneficiaries of social programs are less vulnerable to any extreme weather phenomenon, including drought, because they have better income, food and health services that allow them to face emergencies with more resources and better risk-management strategies. |
| Average schooling years (dimensionless) | A human development indicator reflecting the average education degree of the population in a municipality. | This indicator reflects the degree of population human development and represents a strength with respect to vulnerability to drought, since the population with higher educational levels generally has better economic income and greater access to information and other types of resources that allow it to face the phenomenon with adequate risk-management strategies. | ||
| Medical doctors per thousand inhabitants (dimensionless) | An indicator of the extent to which medical services are offered to the population expressed as the number of medical doctors in a municipality divided by one thousand inhabitants. | Those municipalities that have a greater number of medical doctors per thousand inhabitants are better prepared to face any type of weather emergency, including drought, since health services are available to care for the sick population as a result of these phenomena. | ||
| Economic | Organization for production (%) | Represents the percentage of production units belonging to producers’ organizations that support access to services or miscellaneous assistance. | Production units that are organized in civil associations or mercantile societies have greater opportunities to access government services or support that allow them to be less vulnerable to drought and other natural phenomena that affect agricultural and livestock production. | |
| Availability of credit and insurance (%) | Reflects the proportion of production units that have some type of credit or insurance associated with their economic activity. | When the production units have credits and insurance to carry out their economic activity, they are less vulnerable to drought and other weather phenomena, because they have access to economic resources that allow them to face and mitigate the contingencies caused by these phenomena. | ||
| Technified agriculture surface (%) | The percentage of irrigated agricultural surface that also employs agricultural machinery to prepare the soil, sow, harvest, etc. | Those production units that have irrigation systems in their plots and agricultural machinery to carry out their productive activities, are obviously less vulnerable to drought, since they usually have water available and are better equipped to deal with emergencies. | ||
| Environmental | Natural vegetation cover (km2) | Municipal surface covered by some type of natural vegetation. | Natural vegetation cover allows soil to retain moisture for a longer time and prevents water and wind erosion, favoring rain infiltration and aquifers recharge. Therefore, areas covered by some type of natural vegetation are less vulnerable to drought. | |
| Re-forested surface (ha) | Forest areas that have been recovered by planting or sowing forest tree species. | The recovery of areas that have been deforested allows for the restoration of the hydrological cycle and favors the ecosystems balance, so these areas are less vulnerable to drought than those that are damaged by deforestation or changes in land use. | ||
| Protected natural areas (ha) | Areas that the federal government has demarcated and preserved to avoid alterations or deterioration by human activity. Includes national parks, biosphere reserves, and wildlife sanctuaries. | The conservation of ecosystems and their biodiversity, through protected natural areas and other conservation modalities (biosphere reserves, national parks, wildlife sanctuaries, etc.), contribute to preserve the hydrological cycle and ecosystems balance; therefore, they reduce environmental vulnerability to drought. | ||
Table 5.
Formulas and sources of information to calculate indicators.
| Components of Vulnerability | Indicator (Key) | Formula and Units of Measurement | Information Source |
|---|---|---|---|
| Degree of exposure | Population density (PD) | ; people/km2 | CONAPO (2017) |
| Population in poverty (PIP) | ; % | CONEVAL (2016) | |
| Population without health care insurance (PWHC) | ; % | CONEVAL (2016) | |
| Agriculture and livestock production units (PU) | PU; dimensionless number | SAGARPA (2017) | |
| Value of irrigated and rainfed agricultural production (VAP) | VAP; amount, thousands of MXN | SAGARPA (2017) | |
| Value of livestock production (VLP) | VLP; amount, thousands of MXN | SAGARPA (2017) | |
| Aridity index (AI) | AI; dimensionless number | INIFAP (2017) | |
| Degree of watershed exploitation (DWE) | ; dim. | CONAGUA (2017) | |
| Degree of aquifer exploitation (DAE) | ; dim. | CONAGUA (2017) | |
| Sensitivity | Households without running water (HWRW) | HWRW; data in % | CONAPO (2015) |
| Households without drainage and flush toilet (HWDT) | HWDT; data in % | CONAPO (2015) | |
| Households with dirt floor (HWDF) | HWDT; data in % | CONAPO (2015) | |
| Insufficient production infrastructure (IPI) | ; % | INEGI (2017) | |
| Lack of technical assistance (LTA) | ;% | INEGI (2017) | |
| Commercialization problems (CP) | ; % | INEGI (2017) | |
| Eroded surface or impregnated with saltpeter (ES) | ES; data in hectares | SAGARPA (2017) | |
| Deforested surface (DS) | ; % | CONAFOR (2017) | |
| Surface affected by forest fires (SAFF) | SAFF; data in hectares | CONAFOR (2017) | |
| Adaptive capacity | Beneficiaries of social programs (BSP) | ; % | INEGI (2017) |
| Average years of schooling (AYS) | AYS; dimensionless data | INEGI (2017) | |
| Medical doctors per thousand inhabitants (MDH) | MDH; dimensionless data | INEGI (2017) | |
| Organization for production (OP) | ; % | INEGI (2017) | |
| Availability of credit and insurance (ACI) | ; % | INEGI (2017) | |
| Technified agriculture surface (TAS) | ;% | INEGI (2017) | |
| Natural vegetation cover (NVC) | NVC; data in km2 | INEGI (2017) | |
| Re-forested surface (RFS) | RFS; data in hectares | CONAFOR (2017) | |
| Protected natural areas (PNA) | PNA; data in hectares | CONANP (2017) |
Table 6.
Selected indicators and their functional relationship with vulnerability to drought.
| Components of Vulnerability | Indicators | Key | Relationship of Indicator with Vulnerability | Simple Expression of Relationship |
|---|---|---|---|---|
| Degree of exposure | Population density (persons/km2) | PD | PD↑ ≥ Vul↑ | ↑ |
| Population in poverty (%) | PIP | PIP↑ ≥ Vul↑ | ↑ | |
| Population without health care insurance (%) | PWHC | PWHC↑ ≥ Vul↑ | ↑ | |
| Production units (dimensionless) | PU | PU↑ ≥ Vul↑ | ↑ | |
| Value of irrigated and rainfed agricultural production (thousands of MXN) | VAP | VAP↑ ≥ Vul↑ | ↑ | |
| Value of livestock production (thousands of MXN) | VLP | VLP↑ ≥ Vul↑ | ↑ | |
| Aridity index (dimensionless) | AI | AI↑ ≥ Vul↑ | ↑ | |
| Degree of watershed exploitation (dimensionless) | DWE | DWE↑ ≥ Vul↑ | ↑ | |
| Degree of aquifer exploitation (dimensionless) | DAE | DAE↑ ≥ Vul↑ | ↑ | |
| Sensitivity | Households without running water (%) | HWRW | HWRW↑ ≥ Vul↑ | ↑ |
| Households without drainage and flush toilet (%) | HWDT | HWDT↑ ≥ Vul↑ | ↑ | |
| Households with dirt floor (%) | HWDF | HWDF↑ ≥ Vul↑ | ↑ | |
| Insufficient production infrastructure (%) | IPI | IPI↑ ≥ Vul↑ | ↑ | |
| Lack of technical assistance (%) | LTA | LTA↑ ≥ Vul↑ | ↑ | |
| Commercialization problems (%) | CP | CP↑ ≥ Vul↑ | ↑ | |
| Surface eroded or impregnated with saltpeter (ha) | ES | ES↑ ≥ Vul↑ | ↑ | |
| Deforested surface (%) | DS | DS↑ ≥ Vul↑ | ↑ | |
| Surface affected by forest fires (%) | SAFF | SAFF ↑ ≥ Vul↑ | ↑ | |
| Adaptive capacity | Beneficiaries of social programs (%) | BSP | BSP↑ ≥ Vul↓ | ↓ |
| Average schooling years (dimensionless) | AYS | AYS↑ ≥ Vul↓ | ↓ | |
| Medical doctors per thousand inhabitants (dimensionless) | MDH | MDH↑ ≥ Vul↓ | ↓ | |
| Organization for production (%) | OP | OP↑ ≥ Vul↓ | ↓ | |
| Availability of credit and insurance (%) | ACI | ACI↑ ≥ Vul↓ | ↓ | |
| Technified agriculture surface (%) | TAS | TAS↑ ≥ Vul↓ | ↓ | |
| Natural vegetation cover (km2) | NVC | NVC↑ ≥ Vul↓ | ↓ | |
| Re-forested surface (%) | RFS | RFS↑ ≥ Vul↓ | ↓ | |
| Protected natural areas (%) | PNA | PNA↑ ≥ Vul↓ | ↓ |
Table 7.
Results of the Pearson’s chi-square goodness-of-fit test (χ2) for all types of vulnerability indices.
Table 7.
Results of the Pearson’s chi-square goodness-of-fit test (χ2) for all types of vulnerability indices.
| Type of Vulnerability Indices | Degrees of Freedom (d.f.) | χ2 Tabulated (α ≤ 0.05) | χ2 Calculated | Conclusion |
|---|---|---|---|---|
| Social | 9 | 16.919 | 9.909 | Since in all cases: χ2 tabulated >χ2 calculated. It is concluded that indices fitting well to the beta distribution. |
| Economic | 9 | 16.919 | 12.456 | |
| Environmental | 9 | 16.919 | 10.163 | |
| Overall | 9 | 16.919 | 9.338 |
Table 8.
Degree of vulnerability to drought classification categories.
| Degree of Vulnerability | Value of Percentile |
|---|---|
| Very low | 0 < IVi ≤ 20 |
| Low | 20 < IVi ≤ 40 |
| Moderate | 40 < IVi ≤ 60 |
| High | 60 < IVi ≤ 80 |
| Very high | 80 < IVi ≤ 100 |
Table 9.
Distribution of number of municipalities, surface area, and population by degree of social vulnerability to drought.
Table 9.
Distribution of number of municipalities, surface area, and population by degree of social vulnerability to drought.
| Degree of Vulnerability | Municipality | Surface | Population | |||
|---|---|---|---|---|---|---|
| No. | % | km2 | % | Million Inhabitants | % | |
| Very high | 397 | 16.2 | 181,810 | 9.3 | 8.5 | 6.9 |
| High | 515 | 21.0 | 183,765 | 9.4 | 13.8 | 11.2 |
| Medium | 589 | 24.0 | 232,639 | 11.9 | 21.2 | 17.2 |
| Low | 630 | 25.7 | 527,837 | 27.0 | 37.1 | 30 |
| Very low | 325 | 13.2 | 828,899 | 42.4 | 42.9 | 34.7 |
| Total | 2456 | 100.0 | 1,954,950 | 100.0 | 123.5 | 100.0 |
Table 10.
Distribution of number of municipalities, surface area, and population by degree of economic vulnerability to drought.
Table 10.
Distribution of number of municipalities, surface area, and population by degree of economic vulnerability to drought.
| Degree of Vulnerability | Municipality | Surface | Population | |||
|---|---|---|---|---|---|---|
| No. | % | km2 | % | Million Inhabitants | % | |
| Very high | 236 | 9.6 | 392,945 | 20.1 | 20.1 | 16.3 |
| High | 320 | 13.0 | 336,251 | 17.2 | 17.4 | 14.1 |
| Medium | 1162 | 47.3 | 631,449 | 32.3 | 44.6 | 36.1 |
| Low | 534 | 21.7 | 295,197 | 15.1 | 21.5 | 17.4 |
| Very low | 204 | 8.3 | 299,107 | 15.3 | 20.0 | 16.2 |
| Total | 2456 | 100.0 | 1,954,950 | 100.0 | 123.5 | 100.0 |
Table 11.
Distribution of number of municipalities, surface area, and population by degree of environmental vulnerability to drought.
Table 11.
Distribution of number of municipalities, surface area, and population by degree of environmental vulnerability to drought.
| Degree of Vulnerability | Municipality | Surface | Population | |||
|---|---|---|---|---|---|---|
| No. | % | km2 | % | Million Inhabitants | % | |
| Very high | 297 | 12.1 | 707,692 | 36.2 | 35.0 | 28.3 |
| High | 199 | 8.1 | 258,053 | 13.2 | 17.8 | 14.4 |
| Medium | 1592 | 64.8 | 850,403 | 43.6 | 56.9 | 46.1 |
| Low | 287 | 11.7 | 113,387 | 5.8 | 10.6 | 8.6 |
| Very low | 81 | 3.3 | 25,414 | 1.3 | 3.1 | 2.5 |
| Total | 2456 | 100.0 | 1,954,950 | 100.0 | 123.5 | 100.0 |
Table 12.
Distribution of number of municipalities, surface area, and population by degree of overall vulnerability to drought.
Table 12.
Distribution of number of municipalities, surface area, and population by degree of overall vulnerability to drought.
| Degree of Vulnerability | Municipality | Surface | Population | |||
|---|---|---|---|---|---|---|
| No. | % | km2 | % | Million Inhabitants | % | |
| Very high | 240 | 9.8 | 635,359 | 32.5 | 31.5 | 25.5 |
| High | 365 | 14.9 | 332,342 | 17.0 | 16.5 | 13.4 |
| Medium | 904 | 36.8 | 445,729 | 22.9 | 26.9 | 21.8 |
| Low | 856 | 34.9 | 496,557 | 25.4 | 43.0 | 34.8 |
| Very low | 91 | 3.7 | 44,964 | 2.3 | 5.6 | 4.5 |
| Total | 2456 | 100.0 | 1,954,950 | 100.0 | 123.5 | 100.0 |
© 2018 by the authors. Licensee MDPI, Basel, Switzerland. This article is an open access article distributed under the terms and conditions of the Creative Commons Attribution (CC BY) license (http://creativecommons.org/licenses/by/4.0/).
Share and Cite
MDPI and ACS Style
Ortega-Gaucin, D.; De la Cruz Bartolón, J.; Castellano Bahena, H.V. Drought Vulnerability Indices in Mexico. Water 2018, 10, 1671. https://doi.org/10.3390/w10111671
AMA Style
Ortega-Gaucin D, De la Cruz Bartolón J, Castellano Bahena HV. Drought Vulnerability Indices in Mexico. Water. 2018; 10(11):1671. https://doi.org/10.3390/w10111671
Chicago/Turabian StyleOrtega-Gaucin, David, Jesús De la Cruz Bartolón, and Heidy V. Castellano Bahena. 2018. "Drought Vulnerability Indices in Mexico" Water 10, no. 11: 1671. https://doi.org/10.3390/w10111671
Note that from the first issue of 2016, this journal uses article numbers instead of page numbers. See further details here.