Extraction of Urban Waterlogging Depth from Video Images Using Transfer Learning


1
Smart City Research Center, Hangzhou Dianzi University, Hangzhou 310012, China
2
Smart City Collaborative Innovation Center of Zhejiang Province, Hangzhou 310012, China
3
Key Laboratory of Virtual Geographic Environment, Ministry of Education, Nanjing Normal University, Nanjing 210023, China
4
Jiangsu Center for Collaborative Innovation in Geographical Information Resource Development and Application, Nanjing 210023, China
5
State Key Lab of Resources and Environmental Information System, Institute of Geographic Sciences and Natural Resources Research, CAS, Beijing 100101, China
6
Key Laboratory of Land Surface Pattern and Simulation, Institute of Geographic Sciences and Natural Resources Research, CAS, Beijing 100101, China
*
Author to whom correspondence should be addressed.
Water 2018, 10(10), 1485; https://doi.org/10.3390/w10101485
Submission received: 25 September 2018
/
Revised: 18 October 2018
/
Accepted: 19 October 2018
/
Published: 21 October 2018
(This article belongs to the Special Issue Flash Floods in Urban Areas)
Abstract
:Urban flood control requires real-time and spatially detailed information regarding the waterlogging depth over large areas, but such information cannot be effectively obtained by the existing methods. Video supervision equipment, which is readily available in most cities, can record urban waterlogging processes in video form. These video data could be a valuable data source for waterlogging depth extraction. The present paper is aimed at demonstrating a new approach to extract urban waterlogging depths from video images based on transfer learning and lasso regression. First, a transfer learning model is used to extract feature vectors from a video image set of urban waterlogging. Second, a lasso regression model is trained with these feature vectors and employed to calculate the waterlogging depth. Two case studies in China were used to evaluate the proposed method, and the experimental results illustrate the effectiveness of the method. This method can be applied to video images from widespread cameras in cities, so that a powerful urban waterlogging monitoring network can be formed.
1. Introduction
Because of the rapid urbanization and extreme storms in recent decades, urban floods have become one of the most frequent and serious disasters for cities at the global scale [1,2]. Notably, 233 of the 633 largest cities around the world are threatened by urban floods, with more than 660 million inhabitants affected [3]. Urban floods usually cause loss of life and serious economic damage [4,5,6]. For example, the flood event in Beijing on 21 July 2012, led to 79 deaths and an economic loss of 11.64 billion yuan according to Beijing’s Flood Control and Drought Relief Office [7]. To address urban floods and mitigate their damage, real-time and spatially detailed waterlogging depth information with wide coverage is required [1,8,9].
Currently, there are three main types of methods for urban flood depth extraction, which can be classified according to the data sources used, e.g., water level sensors, remote sensing, and social media and crowdsourcing data. Traditional methods use water level sensors as the data sources [10]. However, because of the high costs of water level sensors, limited numbers of waterlogging points can be monitored. Therefore, it is difficult to obtain urban flood depths with wide coverage across a city.
Floods with wide coverage can be monitored using remotely sensed data acquired by satellites or other aircrafts [11,12]. However, satellite-based remote sensing images are affected by clouds and vegetation canopies and often have low resolutions or long revisit cycles. Therefore, it remains difficult to obtain spatially detailed and real-time urban flood information from satellite-based remote sensing data. As a state-of-the-art approach to remote sensing, unmanned aerial vehicles (UAVs) can provide spatially detailed information for the detection of flood areas [13,14]. However, there are still problems with UAV-based methods, such as airspace supervision, safe operation in rainy weather, and power issues, which make it difficult to obtain real-time urban flood depth information over broad areas.
Social media and crowdsourcing data have recently been proposed as a new data source for extracting urban flood information [15,16]. However, the necessary data may not be immediately available during flood events, and their data quality limits the accuracy of the monitoring.
Storm-water runoff models can be used to predict urban waterlogging depths [17,18,19,20,21]. However, such models usually require a large amount of data that are often difficult to obtain (e.g., detailed data on sewer systems and observations) [17]. Additionally, urban flooding is a fast process, with a time scale as small as tens of minutes, while these models usually require considerable computing time. Currently, storm-water runoff models are mainly used for planning and evaluation purposes.
Because of the limitations of the current methods of obtaining waterlogging depth, it is necessary to utilize other potential data sources. One of the most attractive data sources is the large amount of video surveillance data acquired by widely distributed traffic and security cameras in cities [22]. For example, the number of cameras in the urban area of Beijing is approximately 1.15 million, with an average density of 71 per square kilometer. Video supervising equipment is almost ubiquitous in cities and can record the entire process of urban flooding. These large video data sets have ultrahigh spatiotemporal resolutions and wide coverage in cities. Extracting the information of urban flood depth from these video data could be a potential and cost-effective way to supplement the existing approaches.
Extracting urban waterlogging depth information from video images can be defined as a computer vision task. With a process flow similar to that of other fundamental computer vision tasks, such as classification, object detection, and segmentation, extracting feature vectors from images is a key step in the process flow. Recently, transfer learning has gained considerable attention due to its success in automatically learning features from images. The features obtained by transfer learning often contain information that is more complex than traditional computer vision information, such as histograms of oriented gradients (HOGs) and color histograms [23]. The features can be effectively used for classification, regression, and clustering [24,25,26]. For example, transfer learning was used to extract feature vectors from satellite images, and then a regression model was built between the feature vectors and poverty [25]. Therefore, extracting urban flood depth from video images based on the feature vectors obtained by transfer learning has a great potential.
This paper aims to propose a method of extracting the information of urban flood depth from video images using transfer learning. Section 2 presents the detailed design of the methodology. Section 3 uses two case studies to evaluate the effectiveness of the proposed method. The discussion is presented in Section 4, and the conclusions and future work are presented in Section 5.
2. Method
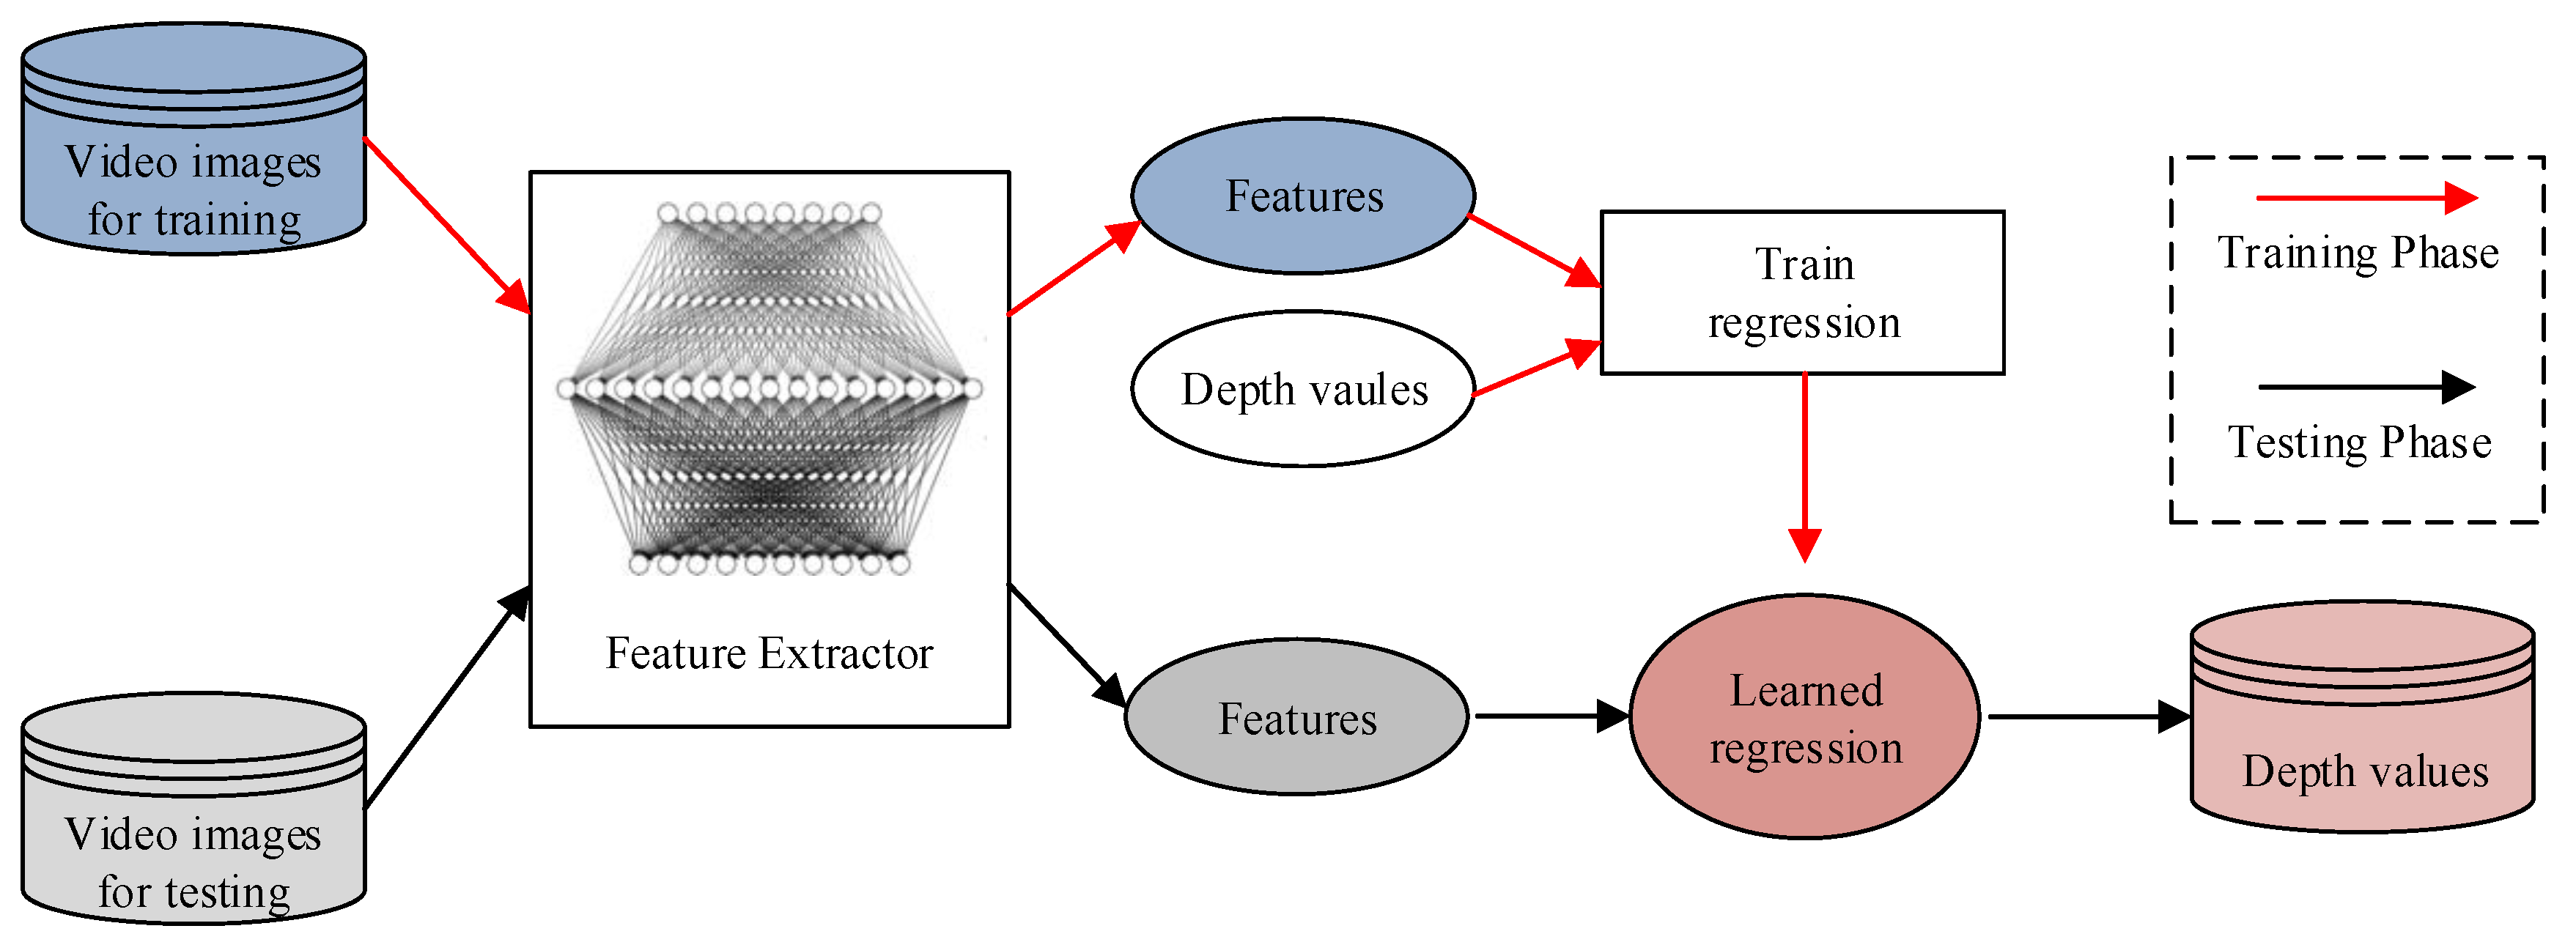
As shown in Figure 1, the proposed method consists of a training phase and a testing phase in sequence. In the training phase, a transfer learning model is used as the feature extractor to capture the feature vectors from video images. Then, a regression model is trained on the basis of the extracted feature vectors and the corresponding observed depth values. In the testing phase, the feature vectors are derived from the testing image set by the same transfer learning model that was adopted in the training phase. Then, these feature vectors are input into the regression model, which is trained to calculate the waterlogging depth of urban floods.
2.1. Extracting Feature Vectors from Video Images Using Inception V3
Transfer learning usually uses a pretrained convolutional neural network (CNN) as an initialization or a fixed feature extractor for the task of interest with a limited number of labelled images [27]. In this study, Inception V3 (Version1.0, Google Brain, Mountain View, CA, USA) [28], a pretrained CNN based on ImageNet, was used to extract image features from video images. Inception V3 is composed of sequentially connected layers, and its architecture is given in Table 1. The images were first resized to 299 × 299 pixels, and then the resized images were input into the first layer of Inception V3 to extract features through a specific operation. Next, each layer takes the features extracted by the previous layer as an input to obtain more complex features. After the operations of these layers, Inception V3 can transform the original images into high-level abstract features, which can be used for classification, regression, clustering, and so on. For more details of Inception V3, please refer to reference [28].
Following the standard pipeline of the previous works [29,30], we removed the last fully connected layer (i.e., the linear layer) and the softmax layer of Inception V3 and then treated the rest as a fixed feature extractor. The bottleneck layer of Inception V3, a 2048-dimension feature vector, was considered a global feature representation of the video image. Each video image from both the training image set and the testing image set was used as an input for this feature extractor to generate a feature vector.
In this study, TensorFlow(Version1.2.1, Google Brain, Mountain View, CA, USA), an open-source software library developed by Google Brain, was selected to establish a transfer learning model based on Inception V3.
2.2. Calculating the Waterlogging Depth by Lasso Regression
Lasso regression was adopted to calculate the waterlogging depth using extracted feature vectors. Lasso regression is suitable for situations in which the number of features is greater than that of observations [31,32]. The lasso regression model is based on the following equation:
where xi (i = 1, 2, …, n, n is the number of observations) is the independent variable, yi (i = 1, 2, …, n, n is the number of observations) is the dependent variable, β0 is the intercept, βj (j = 1, 2, …, p, p is the number of features) represents the regression coefficient, and λ is the tuning parameter that regulates the penalty. Thus, the lasso regression model can be presented in the following form:
Here, is the intercept of the lasso regression, and are the regression coefficients.
In this study, the number of features is greater than the one of observations. The lasso model was used to select features. The lasso model can set the coefficients of some features to zero to remove these features. The number of selected features can be adjusted by tuning the λ value. The k-fold cross-validation method has usually been used to obtain the optimal λ value [32,33,34]. For more details about the k-fold cross-validation technique, we refer the readers to reference [35].
In the training phase, the feature vectors obtained by Inception V3 (as independent variables) and the waterlogging depths (i.e., the dependent variables) were used to train the lasso regression. In the testing phase, the feature vectors obtained by Inception V3 were input into the trained lasso regression model to calculate the waterlogging depth from each image of interest.
In this study, scikits-learn (Version 0.17.1, scikit-learn developers), a free software machine learning library, was selected to establish the lasso regression model.
2.3. Preparing the Waterlogging Depth Data for Video Images
To train and test a regression, observations (i.e., waterlogging depths) are required. Waterlogging depths can be estimated by hand according to reference objects in video images [17,36]. The role of the reference objects is the same as that of water-level gauges. For example, pavement fences, anti-collision barrels, post boxes, and even vehicles could be used as reference objects. The waterlogging depth can be estimated by comparing the heights of the reference objects in flooding and non-flooding periods. The height differences can be treated as waterlogging depths.
3. Case Study
3.1. Data Set
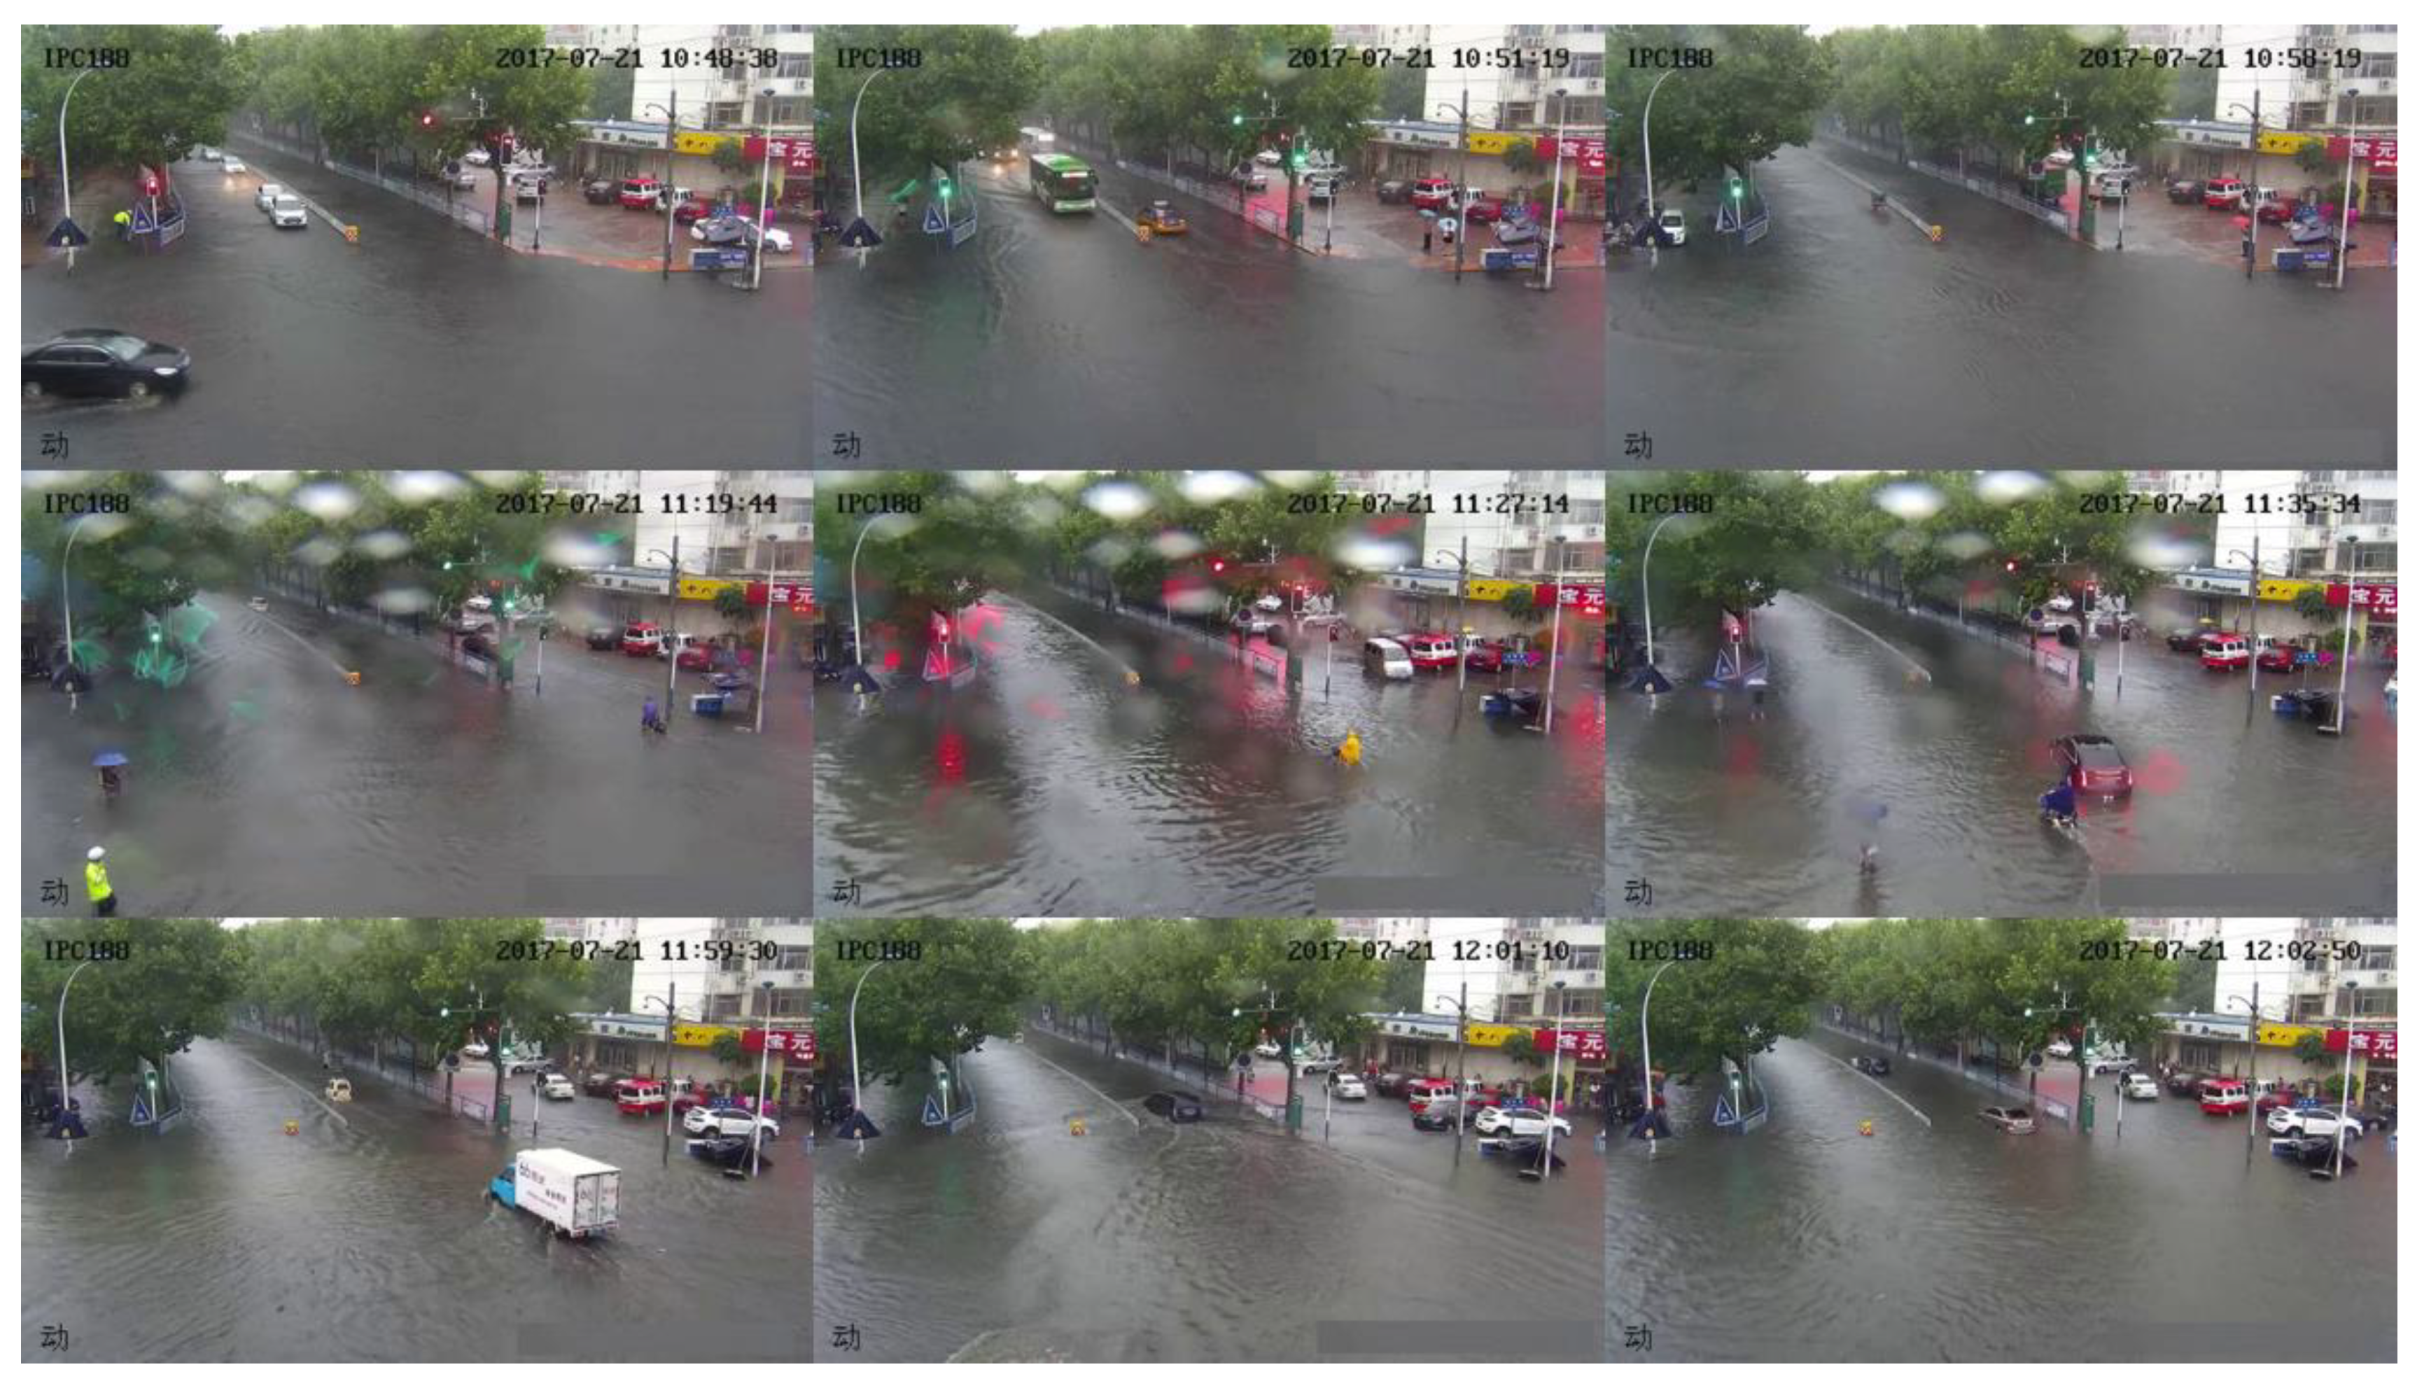
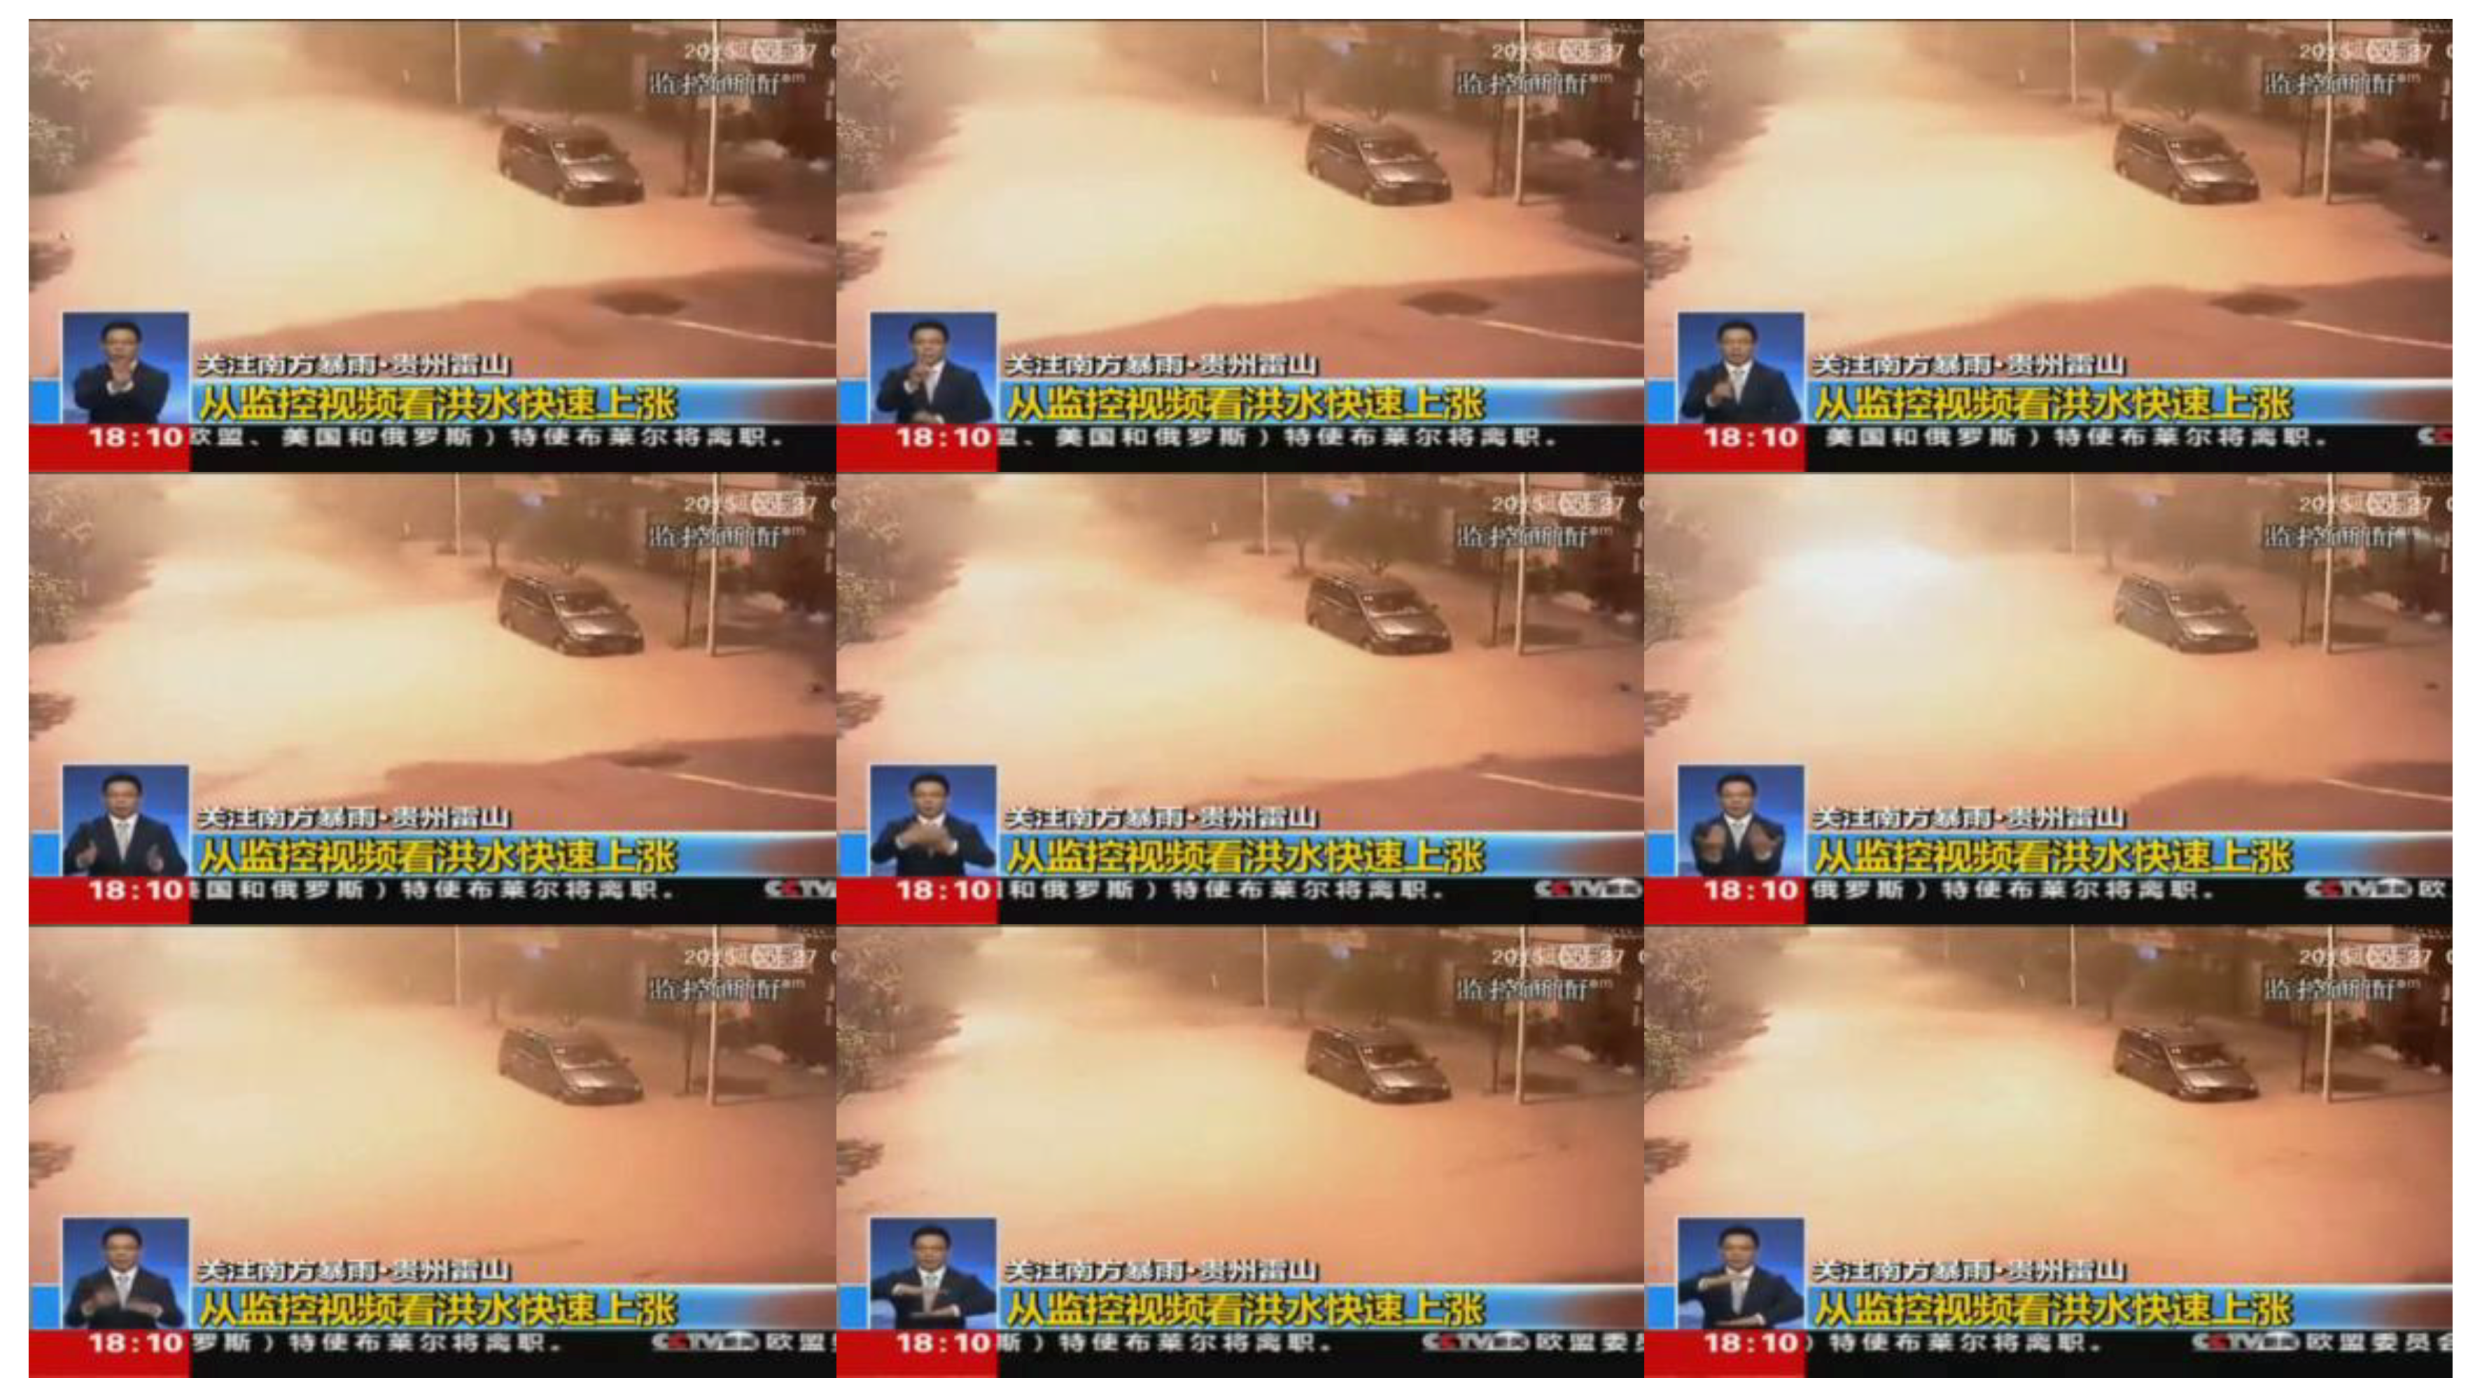
To evaluate the effectiveness of the proposed method, two video data sets recording the urban waterlogging process were used. One data set was from a city in Hebei Province, China, and the other was from a city in Guizhou Province, China. Figure 2 and Figure 3 show some sample images of these two data sets.
Video data set 1 was a normal-motion video, and the frame rate of the video was 24 frames per second (fps). The video was output as images with an interval of 30 s, and each image was given a frame number. The interval between adjacent serial frame numbers was 720. For example, if the frame number of one image was 1760, the frame number of the next one was 2480. The video was converted to 105 JPG images. The original resolution of the video images was 1280 × 720 pixels. These images were resized to 299 × 299 pixels to meet the input requirements of Inception V3. Each image was associated with an observed value of the waterlogging depth. These images were randomly divided into a training set of 85 images (approximately 80% of the data set) and a testing set of 20 images.
Video data set 2 was a fast-motion video, with a frame rate of 24 fps. Each frame of the video was output as an image, and each image was given a frame number. The interval between adjacent serial frame numbers was 1. The video was converted to 183 JPG images. The original resolution of the video images was 856 × 480 pixels. These images were resized to 299 × 299 pixels to meet the input requirements of Inception V3. Each image was associated with an observed value of the waterlogging depth. These images were divided randomly into a training set of 148 images (approximately 80% of the data set) and a testing set of 35 images.
All images were input into Inception V3 to extract feature vectors. The average computational times for the feature vector extraction from an image were 0.990 s and 0.957 s for videos 1 and 2, respectively, on a Windows 10 computer (Intel(R) Xeon(R) CPU E3-1535M v5 @ 2.90 GHz with 16 GB of RAM).
3.2. Results from the Proposed Method
3.2.1. Waterlogging Depth Results for Data Set 1
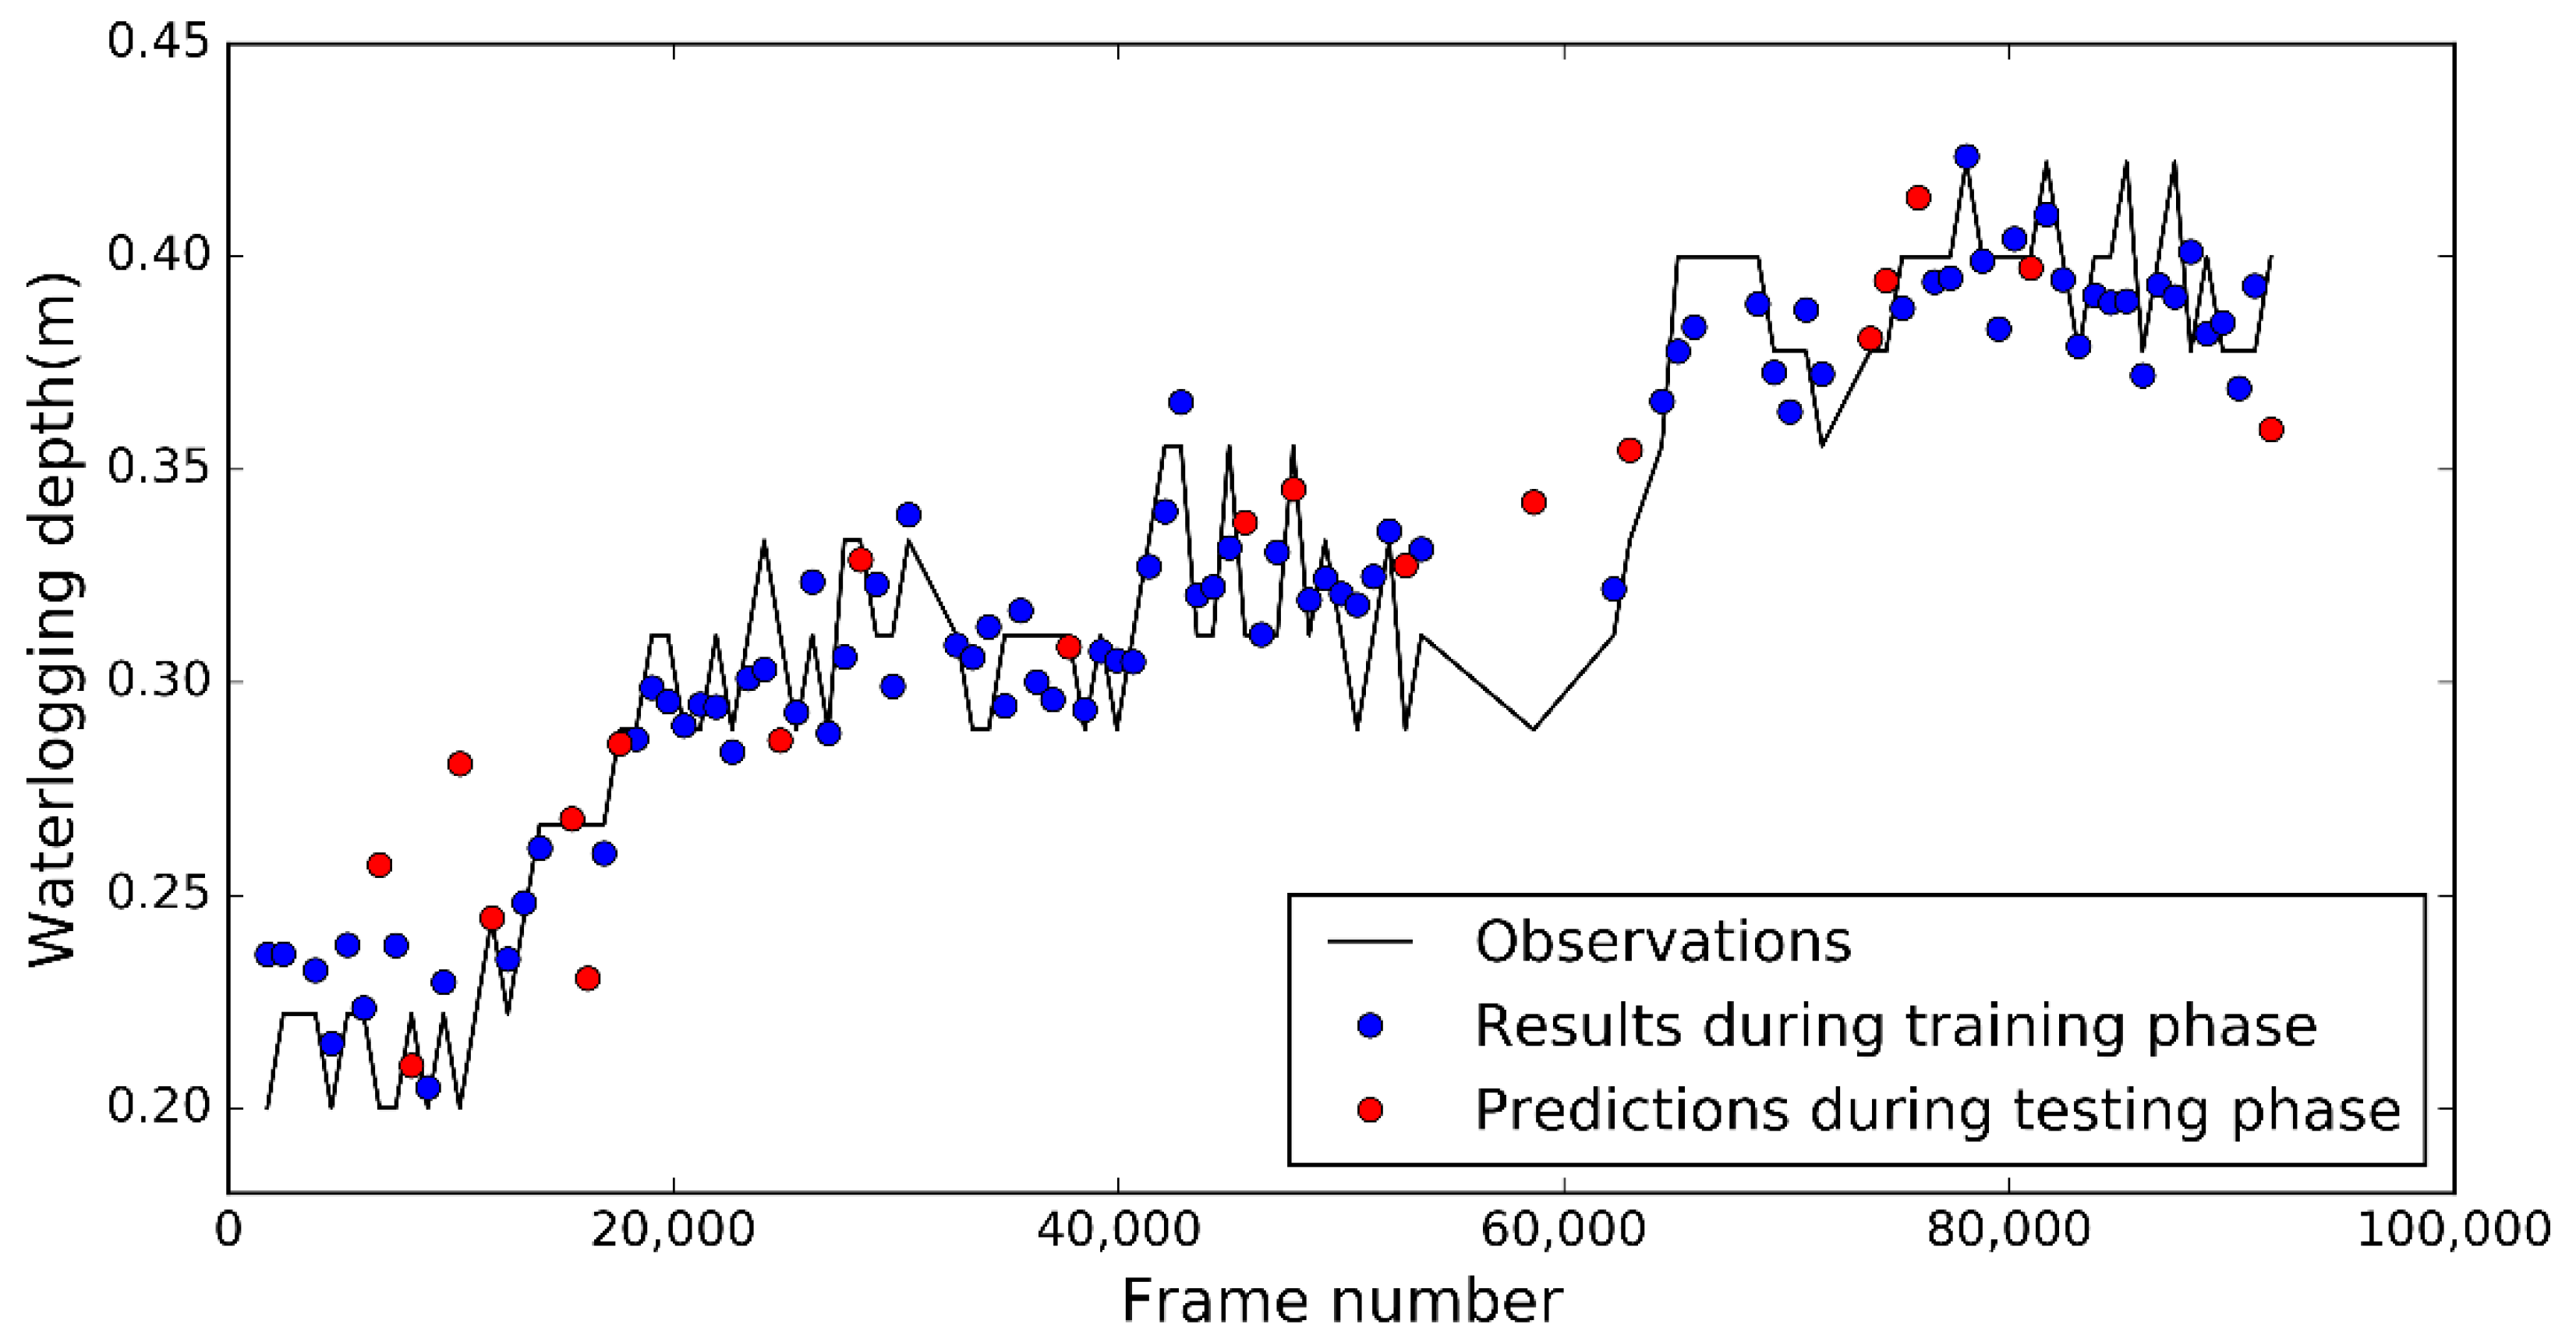
For data set 1, 85 observations were used to train the lasso model, and the 20-fold cross-validation was used to obtain the optimal λ parameter. The optimal λ value was 0.000735, and 49 features were selected. During the training phase, the coefficient of determination R2 and the root-mean-square error (RMSE) of the modeling results were 0.94 and 0.015 m, respectively (Table 2). During the testing phase, the coefficient of determination R2 and the RMSE of the predictions were 0.75 and 0.031 m, respectively (Table 2). The R2 value of data set 1 during the training phase was larger than the value during the testing phase, and the RMSE value during the training phase was smaller than that during the testing phase. Figure 4 shows that during the training phase, the overall trend of the results (the blue dots in Figure 4) agreed well with that of the observed values. During the testing phase, the predictions (the red dots in Figure 4) were also consistent with the observed values.
The computational time required to train the lasso regression model was 18.308 s, and the computational time required to predict the waterlogging depths of all testing images was 0.031 s, using the previously described computer system (Table 3).
3.2.2. Waterlogging Depth Results for Data Set 2
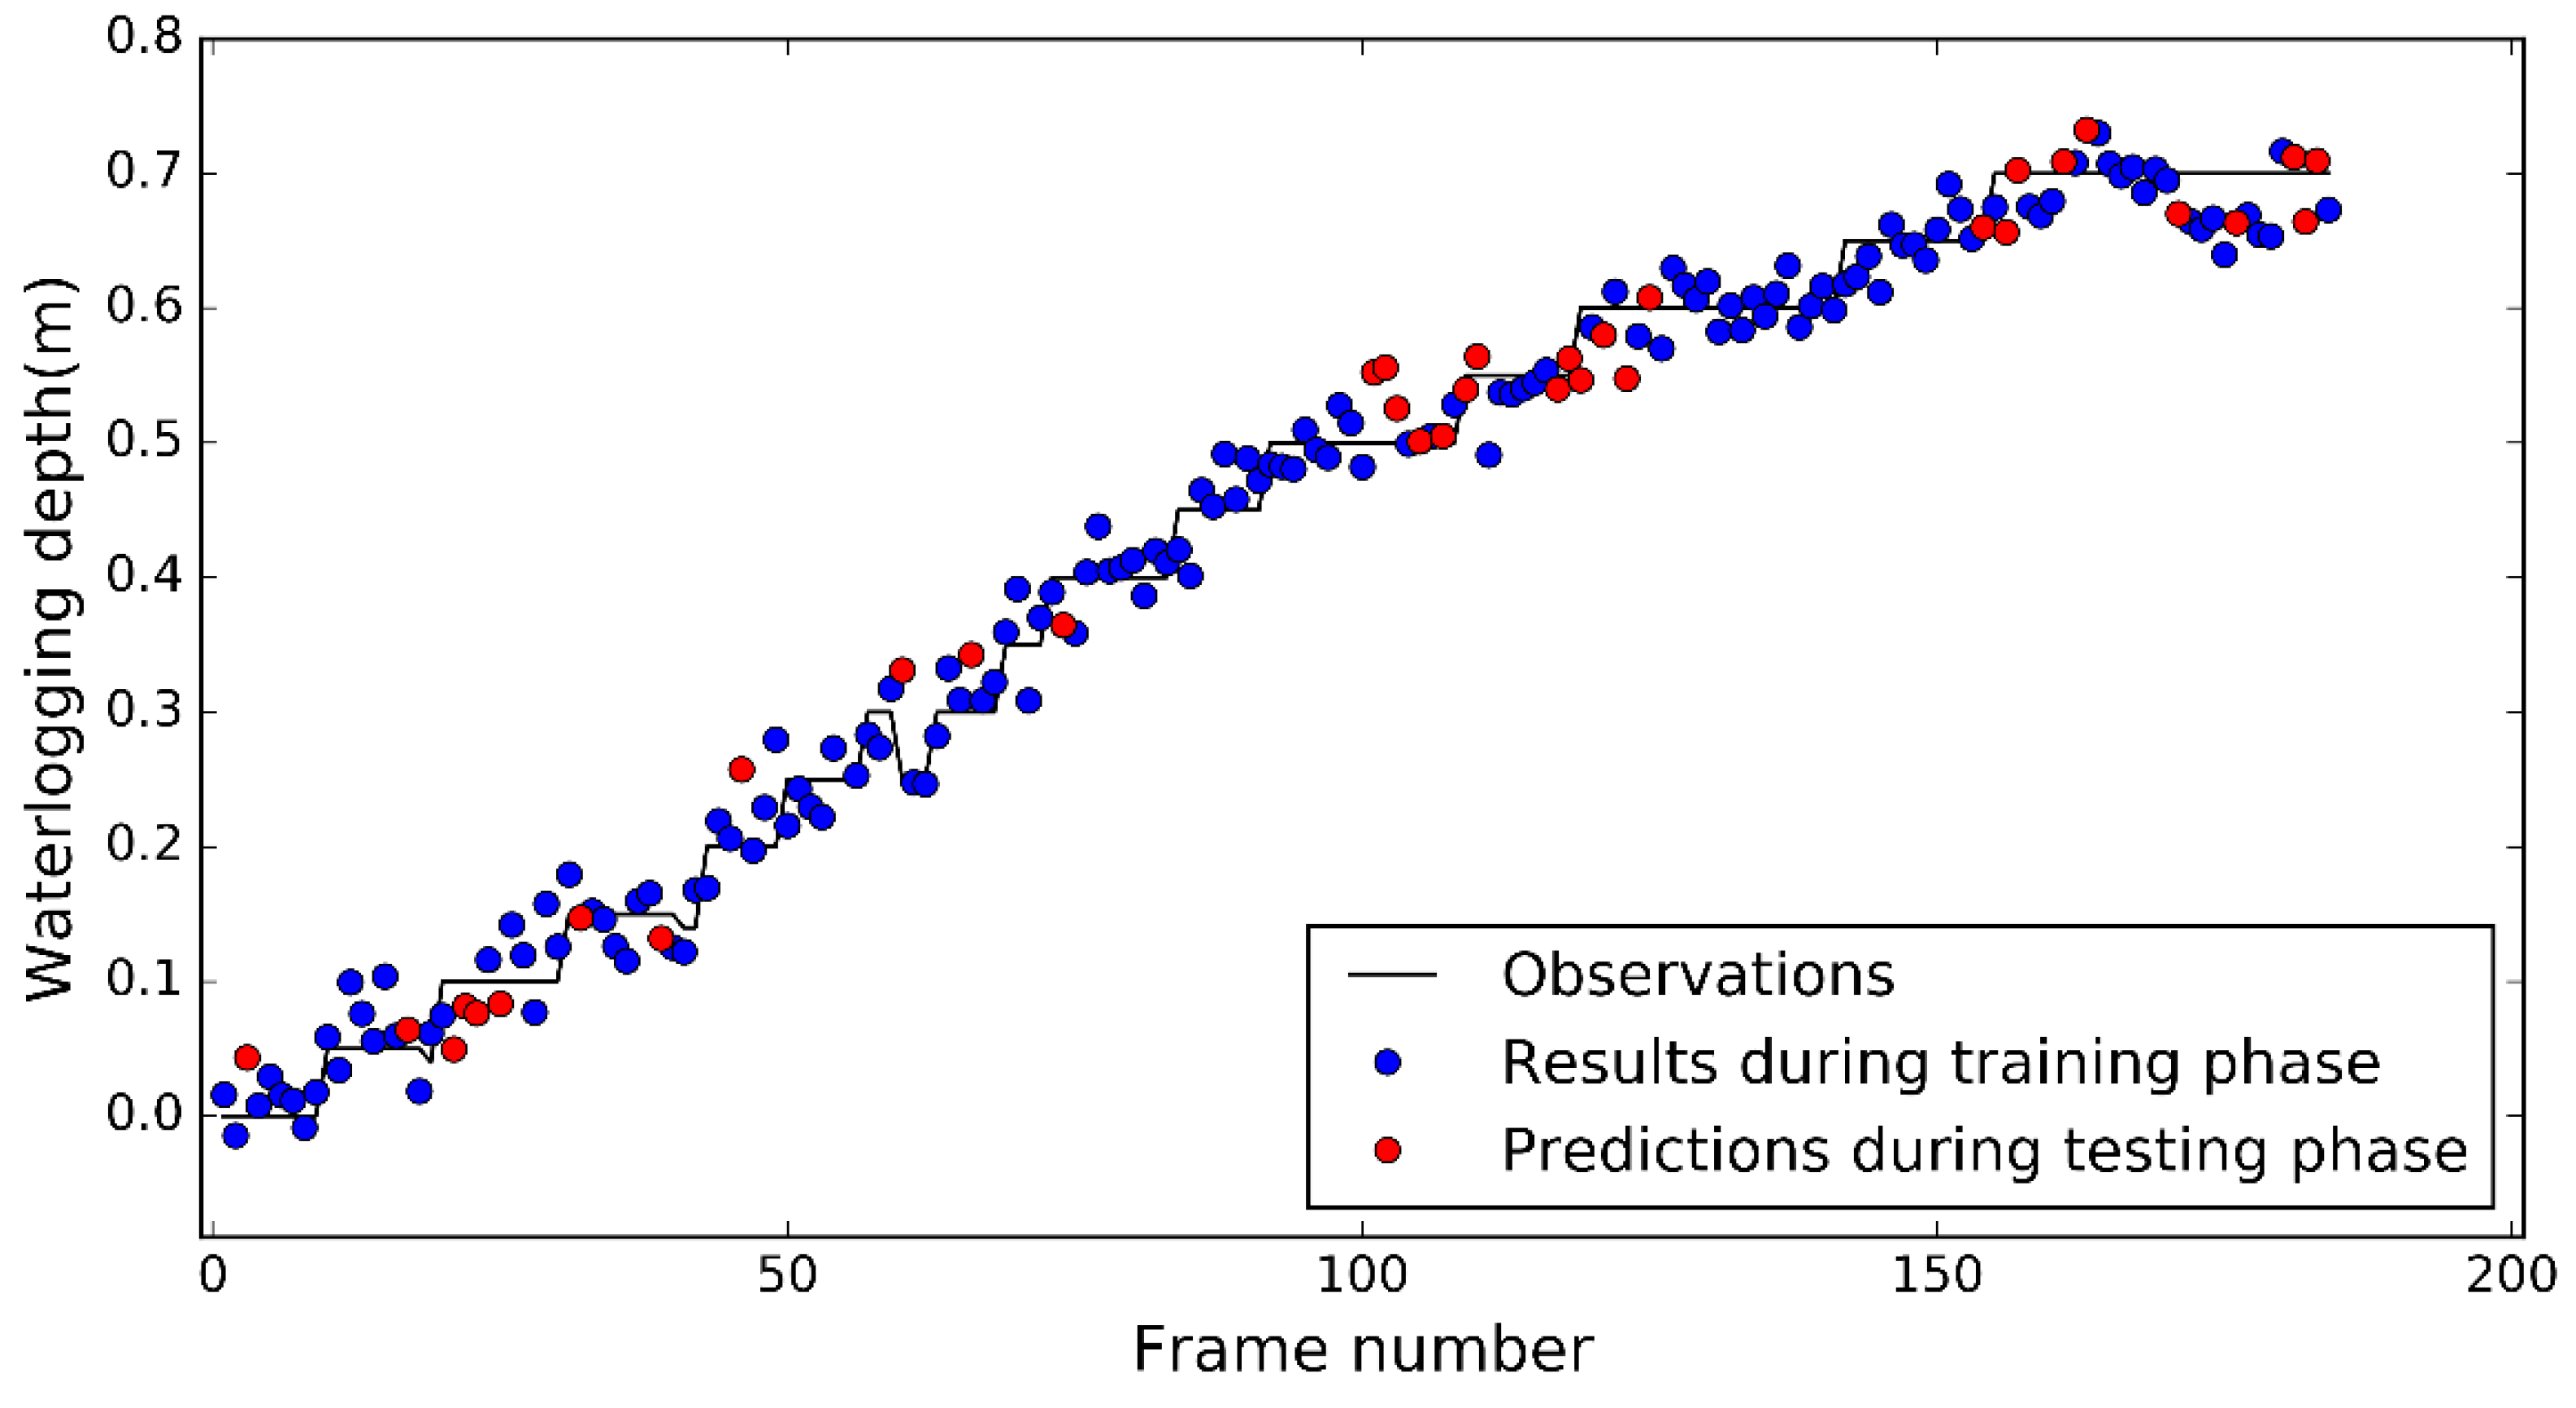
For data set 2, 148 observations were used to train the lasso model, and the 20-fold cross-validation was used to obtain the optimal λ parameter. The optimal λ value was 0.000821, and 42 features were selected. During the training phase, the coefficient of determination R2 and the RMSE of the modeling results were 0.98 and 0.025 m, respectively (Table 2). During the testing phase, the R2 and RMSE of the predictions were 0.98 and 0.033 m, respectively (Table 2). The R2 value of data set 2 during the training phase was the same as the value during the testing phase, and the RMSE value during the training phase was smaller than that during the testing phase. Figure 5 shows good agreement between the results (the blue dots in Figure 5) of the training phase and the observed values. Figure 5 also shows satisfactory agreement between the predictions (the red dots in Figure 5) of the testing phase and the observed values. It was found that the R2 of data set 2 was larger than that of data set 1, which can be attributed to two reasons: (1) the video image scenes in data set 1 were more complicated. For example, the movements of vehicles could influence the waterlogging depth. (2) The range of the waterlogging depth in data set 2 was larger than that in data set 1.
The computational time required to train the lasso regression model was 24.286 s, and the time required to predict the waterlogging depths of all testing images was 0.055 s, using the previously described computer system (Table 3).
4. Discussion
Transfer learning has been applied for feature extraction from images and computer vision, and the feature vectors obtained by transfer learning can be used to effectively solve image classification and prediction problems. In this paper, we applied a transfer learning model (Inception V3) to extract feature vectors from urban waterlogging images. The dimension of the feature vectors extracted by Inception V3 was 2048, which is larger than the number of observations (105 and 183 in the two cases). Therefore, ordinary least squares (OLS) regression is not suitable in this case, and lasso regression was employed to reduce the dimension of the feature vectors. The reduced numbers of dimensions of the feature vectors in video data sets 1 and 2 were 49 and 42, respectively, which were smaller than the numbers of observations.
Although lasso regression can reduce the dimension of feature vectors, overfitting may still occur if the number of observations is too small or if there is considerable data redundancy. In lasso regression, λ is a crucial parameter, so it is important to select an optimal λ value. In this paper, the k-fold cross-validation technique was used to determine this parameter. The λ parameter of the lasso model affects the number of selected features and may cause underfitting or overfitting problems. Taking data set 1 as an example, when the λ value was 0.01, the number of selected features was 7, the R2 value was 0.51 during the training phase, and there was an underfitting problem. When the λ value was 0.00001, the number of selected features was 128, the R2 value was 1.00 during the training phase, and there was an overfitting problem. When the λ value of the lasso model was optimal (i.e., 0.000735), the number of selected features was 49, and the R2 value was 0.94 during the training phase. We thus think that there was no obvious underfitting or overfitting.
The computational time required to predict the waterlogging depth based on one video surveillance system is very short, and the real-time waterlogging depth can be obtained. However, extracting the real-time waterlogging depth from tens of thousands or even hundreds of thousands of camera videos within a city requires a large amount of computational power. Cloud computing technology could be used to solve this problem.
Compared with the existing methods, the proposed method has advantages, including low economic costs, good real-time performance, and satisfactory accuracy. Although the method proposed has lower accuracy than water-level sensors, whose error can be controlled within 1 cm [9], it is much cheaper in real applications. Compared with the methods of remote sensing, our proposed method is timelier and less prone to be affected by cloud and tree coverage [10,11,12]. The proposed method is more accurate and reliable than the methods based on social media and crowdsourcing data [13], it needs less input data (i.e., only the video data as input), and has higher computational efficiency than the storm-water runoff models.
Currently, the proposed method depends on manual image annotation (i.e., obtaining waterlogging depth observations according to reference objects in the images). There may be errors in the process of manual image annotation, which may affect the accuracy of the waterlogging depths. Moreover, distortions introduced by camera lenses, the resolution, and the metric extent of the field of view may also affect the accuracy. Another disadvantage is that the learned lasso model may be inapplicable if the changes in the video scene are too large (e.g., a lasso model trained using the video images of small floods cannot be used to extract the waterlogging depth of severe floods, and a lasso model trained using the video images of one location may not be able to extract accurate waterlogging depths at another location). To ensure that the proposed method is robust, video data from different locations, seasons, and weather conditions must be collected to train and test the model.
In addition, this study only used videos of the rising phase of floods because of data limitation. It would be interesting to test the proposed method in the falling phase, if we could gather video data of the falling phase of floods. We think that the lasso model trained during the rising phase would succeed in extracting the waterlogging depth in the falling phase, as the video scenes of the rising phase and the falling phase are similar.
5. Conclusions and Future Work
The existing methods cannot obtain real-time and spatially detailed information of urban waterlogging depth. In this paper, we propose a new approach to extracting urban waterlogging depths from video images of cameras, which are almost ubiquitous in cities and record the entire process of urban flooding, based on transfer learning and lasso regression. First, a transfer learning model was used to extract feature vectors from a video image set of urban waterlogging. Second, a lasso regression model was trained with these feature vectors and employed to calculate the waterlogging depth. This approach was applied in two case studies, and it was found that during the testing phase, the RMSEs were 0.031 and 0.033 m, respectively, and the computational time was 0.031 and 0.055 s, respectively. These results showed that the proposed approach has the advantages of both satisfactory accuracy and fast calculating speed and demonstrated that video images form video supervision equipment in cities are valuable and alternative data sources to obtain the waterlogging depth. Because of the low economic costs, it is feasible to apply this approach to cameras of cities to form a powerful system for urban waterlogging monitoring. In addition, the approach can also be extended to monitor water levels of lakes, rivers, reservoirs, and other types of water bodies using video images.
It should be noted that we only used two video data sets because of data availability. If more data sets become available in the future, the precision and robustness of the method are expected to be further improved, because the increase in the data volume enhances the performance of statistic-based models. In the future, we will determine whether the models trained with video images of specific flood events can be applied to new flood events in different scenarios (e.g., different seasons, day and night scenes) at the same location and also whether the models trained with video images collected at specific locations can be applied to other locations with similar scenarios.
Author Contributions
Conceptualization, J.J.; Methodology, J.J., J.L., C.-Z.Q.; Software, J.J., J.L.; Validation, J.J., J.L., C.-Z.Q.; Formal Analysis, J.L.; Investigation, J.J.; Resources, L.J., C.-Z.Q.; Writing-Original Draft Preparation, J.J.; Writing-Review & Editing, J.L., C.-Z.Q., D.W.; Funding Acquisition, J.J., L.J.
Funding
This research was funded by the National Natural Science Foundation of China (41601423; 41601413) and Natural Science Foundation of Jiangsu Province of China (BK20150975).
Acknowledgments
The authors thank Jingzhou Huang for his valuable comments, and the editor and reviewers for their constructive comments and helpful suggestions.
Conflicts of Interest
The authors declare no conflict of interest.
References
- Xie, J.; Chen, H.; Liao, Z.; Gu, X.; Zhu, D.; Zhang, J. An integrated assessment of urban flooding mitigation strategies for robust decision making. Environ. Modell. Softw. 2017, 95, 143–155. [Google Scholar] [CrossRef]
- Vacondio, R.; Aureli, F.; Ferrari, A.; Mignosa, P.; Dal Palù, A. Simulation of the January 2014 flood on the Secchia River using a fast and high-resolution 2D parallel shallow-water numerical scheme. Nat. Hazards. 2016, 80, 103–125. [Google Scholar] [CrossRef]
- World Urbanization Prospects The 2011 Revision. Available online: http://www.un.org/en/development/desa/population/publications/pdf/urbanization/WUP2011_Report.pdf (accessed on 2 September 2018).
- Shuster, W.D.; Bonta, J.; Thurston, H.; Warnemuende, E.; Smith, D.R. Impacts of impervious surface on watershed hydrology: A review. Urban Water J. 2005, 2, 263–275. [Google Scholar] [CrossRef]
- Miller, J.D.; Hutchins, M. The impacts of urbanisation and climate change on urban flooding and urban water quality: A review of the evidence concerning the United Kingdom. J. Hydrol. 2017, 12, 345–362. [Google Scholar] [CrossRef]
- Pan, Y.; Shao, Z.; Cheng, T.; Wang, Z.; Zhang, Z. Influence analysis of waterlogging based on deep learning model in Wuhan. ISPRS—Int 2017, XLII-2/W7, 1313–1318. [Google Scholar] [CrossRef]
- Yin, J.; Yu, D.; Wilby, R. Modelling the impact of land subsidence on urban pluvial flooding: A case study of downtown Shanghai, China. Sci. Total Environ. 2016, 544, 744–753. [Google Scholar] [CrossRef] [PubMed] [Green Version]
- Xu, G.; Huang, G.Q.; Fang, J. Cloud asset for urban flood control. Adv. Eng. Inform. 2015, 29, 355–365. [Google Scholar] [CrossRef]
- De Risi, R.; De Paola, F.; Turpie, J.; Kroeger, T. Life Cycle Cost and Return on Investment as complementary decision variables for urban flood risk management in developing countries. Int. J. Disaster Risk Reduct. 2018, 28, 88–106. [Google Scholar] [CrossRef]
- Crabit, A.; Colin, F.; Bailly, J.S.; Ayroles, H.; Garnier, F. Soft water level sensors for characterizing the hydrological behaviour of agricultural catchments. Sensors 2011, 11, 4656–4673. [Google Scholar] [CrossRef] [PubMed] [Green Version]
- Ticehurst, C.; Guerschman, J.P.; Chen, Y. The strengths and limitations in using the daily MODIS open water likelihood algorithm for identifying flood events. Remote Sens. 2014, 6, 11791–11809. [Google Scholar] [CrossRef]
- Schumann, G.J. Preface: Remote sensing in flood monitoring and management. Remote Sens. 2015, 7, 17013–17015. [Google Scholar] [CrossRef]
- Feng, Q.; Liu, J.; Gong, J. Urban flood mapping based on unmanned aerial vehicle remote sensing and random forest classifier—A case of Yuyao, China. Water 2015, 7, 1437–1455. [Google Scholar] [CrossRef]
- Perks, M.T.; Russell, A.J.; Large, A.R. Advances in flash flood monitoring using unmanned aerial vehicles (UAVs). Hydrol. Earth Syst. Sci. 2016, 20, 4005–4015. [Google Scholar] [CrossRef]
- Wang, R.Q.; Mao, H.; Wang, Y.; Rae, C.; Shaw, W. Hyper-resolution monitoring of urban flooding with social media and crowdsourcing data. Comput. Geosci. 2018, 111, 139–147. [Google Scholar] [CrossRef]
- Tauro, F.; Selker, J.; van de Giesen, N.; Abrate, T.; Uijlenhoet, R.; Porfiri, M.; Manfreda, S.; Caylor, K.; Moramarco, T.; Benveniste, J.; et al. Measurements and Observations in the XXI century (MOXXI): Innovation and multi-disciplinarity to sense the hydrological cycle. J. Sci. Hydrol. 2018, 63, 169–196. [Google Scholar] [CrossRef]
- Liu, L.; Liu, Y.; Wang, X.; Yu, D.; Liu, K.; Huang, H.; Hu, G. Developing an effective 2-d urban flood inundation model for city emergency management based on cellular automata. Nat. Hazards Earth Syst. Sci. 2015, 2, 6173–6199. [Google Scholar] [CrossRef]
- Xue, F.; Huang, M.; Wang, W.; Zou, L. Numerical simulation of urban waterlogging based on floodarea model. Adv. Meteorol. 2016. [Google Scholar] [CrossRef]
- Huang, G.; Huang, W.; Zhang, L.; Chen, W.; Feng, J. Simulation of rainstorm waterlogging in urban areas based on GIS and SWMM model. J. Water Resour. Water Eng. 2015, 26, 1–6. [Google Scholar] [CrossRef]
- Dai, J.; Liu, Z.; Lu, S. Risk-assessment of city waterlogging based on numerical simulation—case study on urban center of Suzhou. Chin. Water Resour. 2015, 13, 20–23. [Google Scholar]
- Zhang, C.; Huang, H.; Li, Y. Analysis of water accumulation in urban street based on DEM generated from LiDAR data. In Proceedings of the Qingdao International Water Congress, Qingdao, China, 27–30 June 2017. [Google Scholar] [CrossRef]
- Leitão, J.P.; Peña-Haro, S.; Lüthi, B.; Scheidegger, A.; de Vitry, M.M. Urban overland runoff velocity measurement with consumer-grade surveillance cameras and surface structure image velocimetry. J. Hydrol. 2018, 565, 791–804. [Google Scholar] [CrossRef]
- Xie, M.; Jean, N.; Burke, M.; Lobell, D.; Ermon, S. Transfer learning from deep features for remote sensing and poverty mapping. In Proceedings of the Thirtieth AAAI Conference on Artificial Intelligence, Phoenix, AZ, USA, 12–17 February 2016; pp. 3929–3935. [Google Scholar]
- Pan, S.J.; Yang, Q. A survey on transfer learning. IEEE Trans. Knowl. Data Eng. 2010, 22, 1345–1359. [Google Scholar] [CrossRef]
- Jean, N.; Burke, M.; Xie, M.; Davis, W.M.; Lobell, D.B.; Ermon, S. Combining satellite imagery and machine learning to predict poverty. Science 2016, 353, 790–794. [Google Scholar] [CrossRef] [PubMed]
- Li, N.; Hao, H.; Gu, Q.; Wang, D.; Hu, X. A transfer learning method for automatic identification of sandstone microscopic images. Comput. Geosci. 2017, 103, 111–121. [Google Scholar] [CrossRef]
- Koitka, S.; Friedrich, C.M. Traditional feature engineering and deep learning approaches at medical classification task of ImageCLEF 2016. In Proceedings of the Working Notes of CLEF, Évora, Portugal, 5–8 September 2016. [Google Scholar]
- Szegedy, C.; Vanhoucke, V.; Ioffe, S.; Shlens, J.; Wojna, Z. Rethinking the inception architecture for computer vision. In Proceedings of the IEEE Conference on Computer Vision and Pattern Recognition, Las Vegas, NV, USA, 27–30 June 2016; pp. 2818–2826. [Google Scholar]
- Hu, F.; Xia, G.S.; Hu, J.; Zhang, L. Transferring deep convolutional neural networks for the scene classification of high-resolution remote sensing imagery. Remote Sens. 2015, 7, 14680–14707. [Google Scholar] [CrossRef]
- Khosravi, P.; Kazemi, E.; Imielinski, M.; Elemento, O.; Hajirasouliha, I. Deep convolutional neural networks enable discrimination of heterogeneous digital pathology images. EBioMedicine. 2018, 27, 317–328. [Google Scholar] [CrossRef] [PubMed]
- Tibshirani, R. Regression shrinkage and selection via the lasso: A retrospective. J. R. Stat. Soc. Ser. B-Stat. Methodol. 2011, 73, 273–282. [Google Scholar] [CrossRef]
- Saccoccio, M.; Wan, T.H.; Chen, C.; Ciucci, F. Optimal regularization in distribution of relaxation times applied to electrochemical impedance spectroscopy: Ridge and lasso regression methods—a theoretical and experimental study. Electrochim. Acta. 2014, 147, 470–482. [Google Scholar] [CrossRef]
- Huang, T.; Gong, H.; Yang, C.; He, Z. Proteinlasso: A lasso regression approach to protein inference problem in shotgun proteomics. Comput. Biol. Chem. 2013, 43, 46–54. [Google Scholar] [CrossRef] [PubMed]
- Yang, D.; Ye, Z.; Li, H.I.L.; Dong, Z. Very short term irradiance forecasting using the lasso. Sol. Energy. 2015, 114, 314–326. [Google Scholar] [CrossRef] [Green Version]
- Efron, B.; Hastie, T.; Johnstone, I.; Tibshirani, R. Least angle regression. Ann. Statist. 2004, 32, 407–499. [Google Scholar] [CrossRef] [Green Version]
- Wang, Y.; Chen, A.S.; Fu, G.; Djordjević, S.; Zhang, C.; Savić, D.A. An integrated framework for high-resolution urban flood modelling considering multiple information sources and urban features. Environ. Modell. Softw. 2018, 107, 85–95. [Google Scholar] [CrossRef]
Figure 1.
Overall design of the proposed method.

Figure 2.
Sample images of video data set 1 in a city in Hebei Province, China.

Figure 3.
Sample images of video data set 2 in a city in Guizhou Province, China.

Figure 4.
Observations vs. results and predictions during the training and testing phases for data set 1.
Figure 4.
Observations vs. results and predictions during the training and testing phases for data set 1.

Figure 5.
Observations vs. results and predictions during the training and testing phases for data set 2.
Figure 5.
Observations vs. results and predictions during the training and testing phases for data set 2.


Table 1.
The architecture of Inception V3. The output size of each module is the input size of the next one. The three dimensions of “input size” are width, height, and channel dimension.
Table 1.
The architecture of Inception V3. The output size of each module is the input size of the next one. The three dimensions of “input size” are width, height, and channel dimension.
| Type of Layer | Patch Size/Stride or Remarks | Input Size |
|---|---|---|
| Convolutional | 3 × 3/2 | 299 × 299 × 3 |
| Convolutional | 3 × 3/1 | 149 × 149 × 32 |
| Convolutional padded | 3 × 3/1 | 147 × 147 × 32 |
| Pool | 3 × 3/2 | 147 × 147 × 64 |
| Convolutional | 3 × 3/1 | 73 × 73 × 64 |
| Convolutional | 3 × 3/2 | 71 × 71 × 80 |
| Convolutional | 3 × 3/1 | 35 × 35 × 192 |
| 3 × Inception | As in Figure 5 of [28] | 35 × 35 × 288 |
| 5 × Inception | As in Figure 6 of [28] | 17 × 17 × 768 |
| 2 × Inception | As in Figure 7 of [28] | 8 × 8 × 1280 |
| Pool | 8 × 8 | 8 × 8 × 2048 |
| Linear | Logits | 1 × 1 × 2048 |
| Softmax | Classifier | 1 × 1 × 1000 |
Table 2.
The coefficient of determination (R2) and the root mean square error (RMSE) values of the results and predictions of the lasso models for data sets 1 and 2.
Table 2.
The coefficient of determination (R2) and the root mean square error (RMSE) values of the results and predictions of the lasso models for data sets 1 and 2.
| Data Set | Training Phase | Testing Phase | ||
|---|---|---|---|---|
| R2 | RMSE (m) | R2 | RMSE (m) | |
| Data set 1 | 0.94 | 0.015 | 0.75 | 0.031 |
| Data set 2 | 0.98 | 0.025 | 0.98 | 0.033 |
Table 3.
The computational time of the lasso models for data sets 1 and 2.
| Data Set | Training Time (s) | Testing Time (s) |
|---|---|---|
| Data set 1 | 18.308 | 0.031 |
| Data set 2 | 24.286 | 0.055 |
© 2018 by the authors. Licensee MDPI, Basel, Switzerland. This article is an open access article distributed under the terms and conditions of the Creative Commons Attribution (CC BY) license (http://creativecommons.org/licenses/by/4.0/).
Share and Cite
MDPI and ACS Style
Jiang, J.; Liu, J.; Qin, C.-Z.; Wang, D. Extraction of Urban Waterlogging Depth from Video Images Using Transfer Learning. Water 2018, 10, 1485. https://doi.org/10.3390/w10101485
AMA Style
Jiang J, Liu J, Qin C-Z, Wang D. Extraction of Urban Waterlogging Depth from Video Images Using Transfer Learning. Water. 2018; 10(10):1485. https://doi.org/10.3390/w10101485
Chicago/Turabian StyleJiang, Jingchao, Junzhi Liu, Cheng-Zhi Qin, and Dongliang Wang. 2018. "Extraction of Urban Waterlogging Depth from Video Images Using Transfer Learning" Water 10, no. 10: 1485. https://doi.org/10.3390/w10101485
Note that from the first issue of 2016, this journal uses article numbers instead of page numbers. See further details here.