Numerical Investigation on the Hydraulic Properties of the Skimming Flow over Pooled Stepped Spillway

State Key Laboratory of Hydraulics and Mountain River Engineering, Sichuan University, Chengdu 610065, China
*
Author to whom correspondence should be addressed.
Water 2018, 10(10), 1478; https://doi.org/10.3390/w10101478
Submission received: 21 September 2018
/
Revised: 4 October 2018
/
Accepted: 15 October 2018
/
Published: 19 October 2018
(This article belongs to the Special Issue Advances in Hydraulics and Hydroinformatics)
Abstract
:Pooled stepped spillway is known for high aeration efficiency and energy dissipation, but the understanding for the effects of pool weir configuration on the flow properties and energy loss is relatively limited, so RNG εturbulence model with VOF method was employed to simulate the hydraulic characteristics of the stepped spillways with four types of pool weirs. The calculated results suggested the flow in the stepped spillway with staggered configuration of` two-sided pooled and central pooled steps (TP-CP) was highly three dimensional and created more flow instabilities and vortex structures, leading to 1.5 times higher energy dissipation rate than the fully pooled configuration (FP-FP). In FP-FP configuration, the stepped spillway with fully pooled and two-sided pooled steps (FP-TP) and the spillway with fully pooled and central pooled steps (FP-CP), the pressure on the horizontal step surfaces presented U-shaped variation, and TP-CP showed the greatest pressure fluctuation. For FP-TP and FP-CP, the vortex development in the transverse direction presented the opposite phenomenon, and the maximum vortex intensity in TP-CP occurred at Z/W = 0.25, while FP-FP illustrated no significant change in the transverse direction. The overlaying flow velocity distribution in the spanwise direction demonstrated no obvious difference among FP-FP, FP-TP, and FP-CP, while the velocity in TP-CP increased from the axial plane to the sidewalls, but the maximum velocity for all cases were approximately the same.
1. Introduction
Stepped spillway, an important water-transferring hydraulic infrastructure, has long been used in water related projects owing to its high efficiency of energy dissipation and air entrainment, making it possible to release massive and high speed flood flows while reducing and preventing dangerous scour and cavitation. Additionally, economic benefits will be enjoyed due to the reduction in the construction of the downstream energy dissipation basin [1,2]. Due to the advantages of stepped spillway, a growing number of this particular hydraulic structure is being applied to engineering projects.
For the past decades, stepped spillway has been studied globally by the means of laboratory experiments and numerical simulations [3,4,5,6,7], providing significant insights into the complicated air-water flow properties, momentum exchange process, and energy loss mechanism. For example, model tests performed by Felder and Chanson [8] to investigate the influence of uniform and non-uniform step height on the hydraulic performance illustrated that there was no significant change between the two configurations regarding the residual head. Channel slope also plays a vital role in the air-water flow properties, such as velocity profile and turbulence intensity reported by Felder and Chanson [9]. The time-averaged pressure on the step faces was experimentally measured by Zhang et al. [10], drawing the conclusions that the pressure distributions on the horizontal step surfaces exhibited S-shaped variations with the maximum and minimum values occurring at the downstream end and upstream start, respectively. Physical models were established by Zhang and Chanson [11] to examine the effect of step edge and cavity geometry on the air entrainment and energy loss performance in stepped chutes. Apart from experimental studies, thanks to the advances in the computational performance of computers, numerical methods have also been successfully used to study the detailed flow properties in complex contexts [12,13,14,15]. Baylar et al. [16] numerically examined the energy loss and aeration efficiency of the stepped chutes and found that both of them in nappe flow regime were greater than that of the skimming flow regime. Numerical simulations by researchers [17,18,19] demonstrated its high performance in investigating the detailed flow field and pressure distribution over stepped spillway.
In recent years, an innovative design has been made to stepped spillway to improve the energy dissipation performance. Unlike the conventional stepped spillway whose horizontal step faces are flat, this novel kind of stepped spillway, pooled stepped spillway, is equipped with pool weirs at the step edges. A few of the researches have been carried out to investigate the air-water structures in this unique type of stepped spillway. For instance, the differences concerning the air entrainment processes of flat, pooled, and a combination of flat and pooled stepped spillway have been clarified by André [20] and Kökpinar [21]. Thorwarth [22] reported self-induced instabilities over pooled stepped spillways with channel slopes of 8.9° and 14.6°. The detailed air-water flow properties over several kinds of stepped pooled spillway were also physically studied by Felder [7] and Felder and Chanson [9].
While the existing researches have gained understanding into this particular type of stepped spillway, little has been known about the impact of pool weir configurations on the flow properties. Therefore, in order to expand the limited insights into the effect of pool weir’s geometrical properties on the flow characteristics, numerical investigations of pooled stepped spillways with different pool weir configurations were carried out.
2. Numerical Simulation
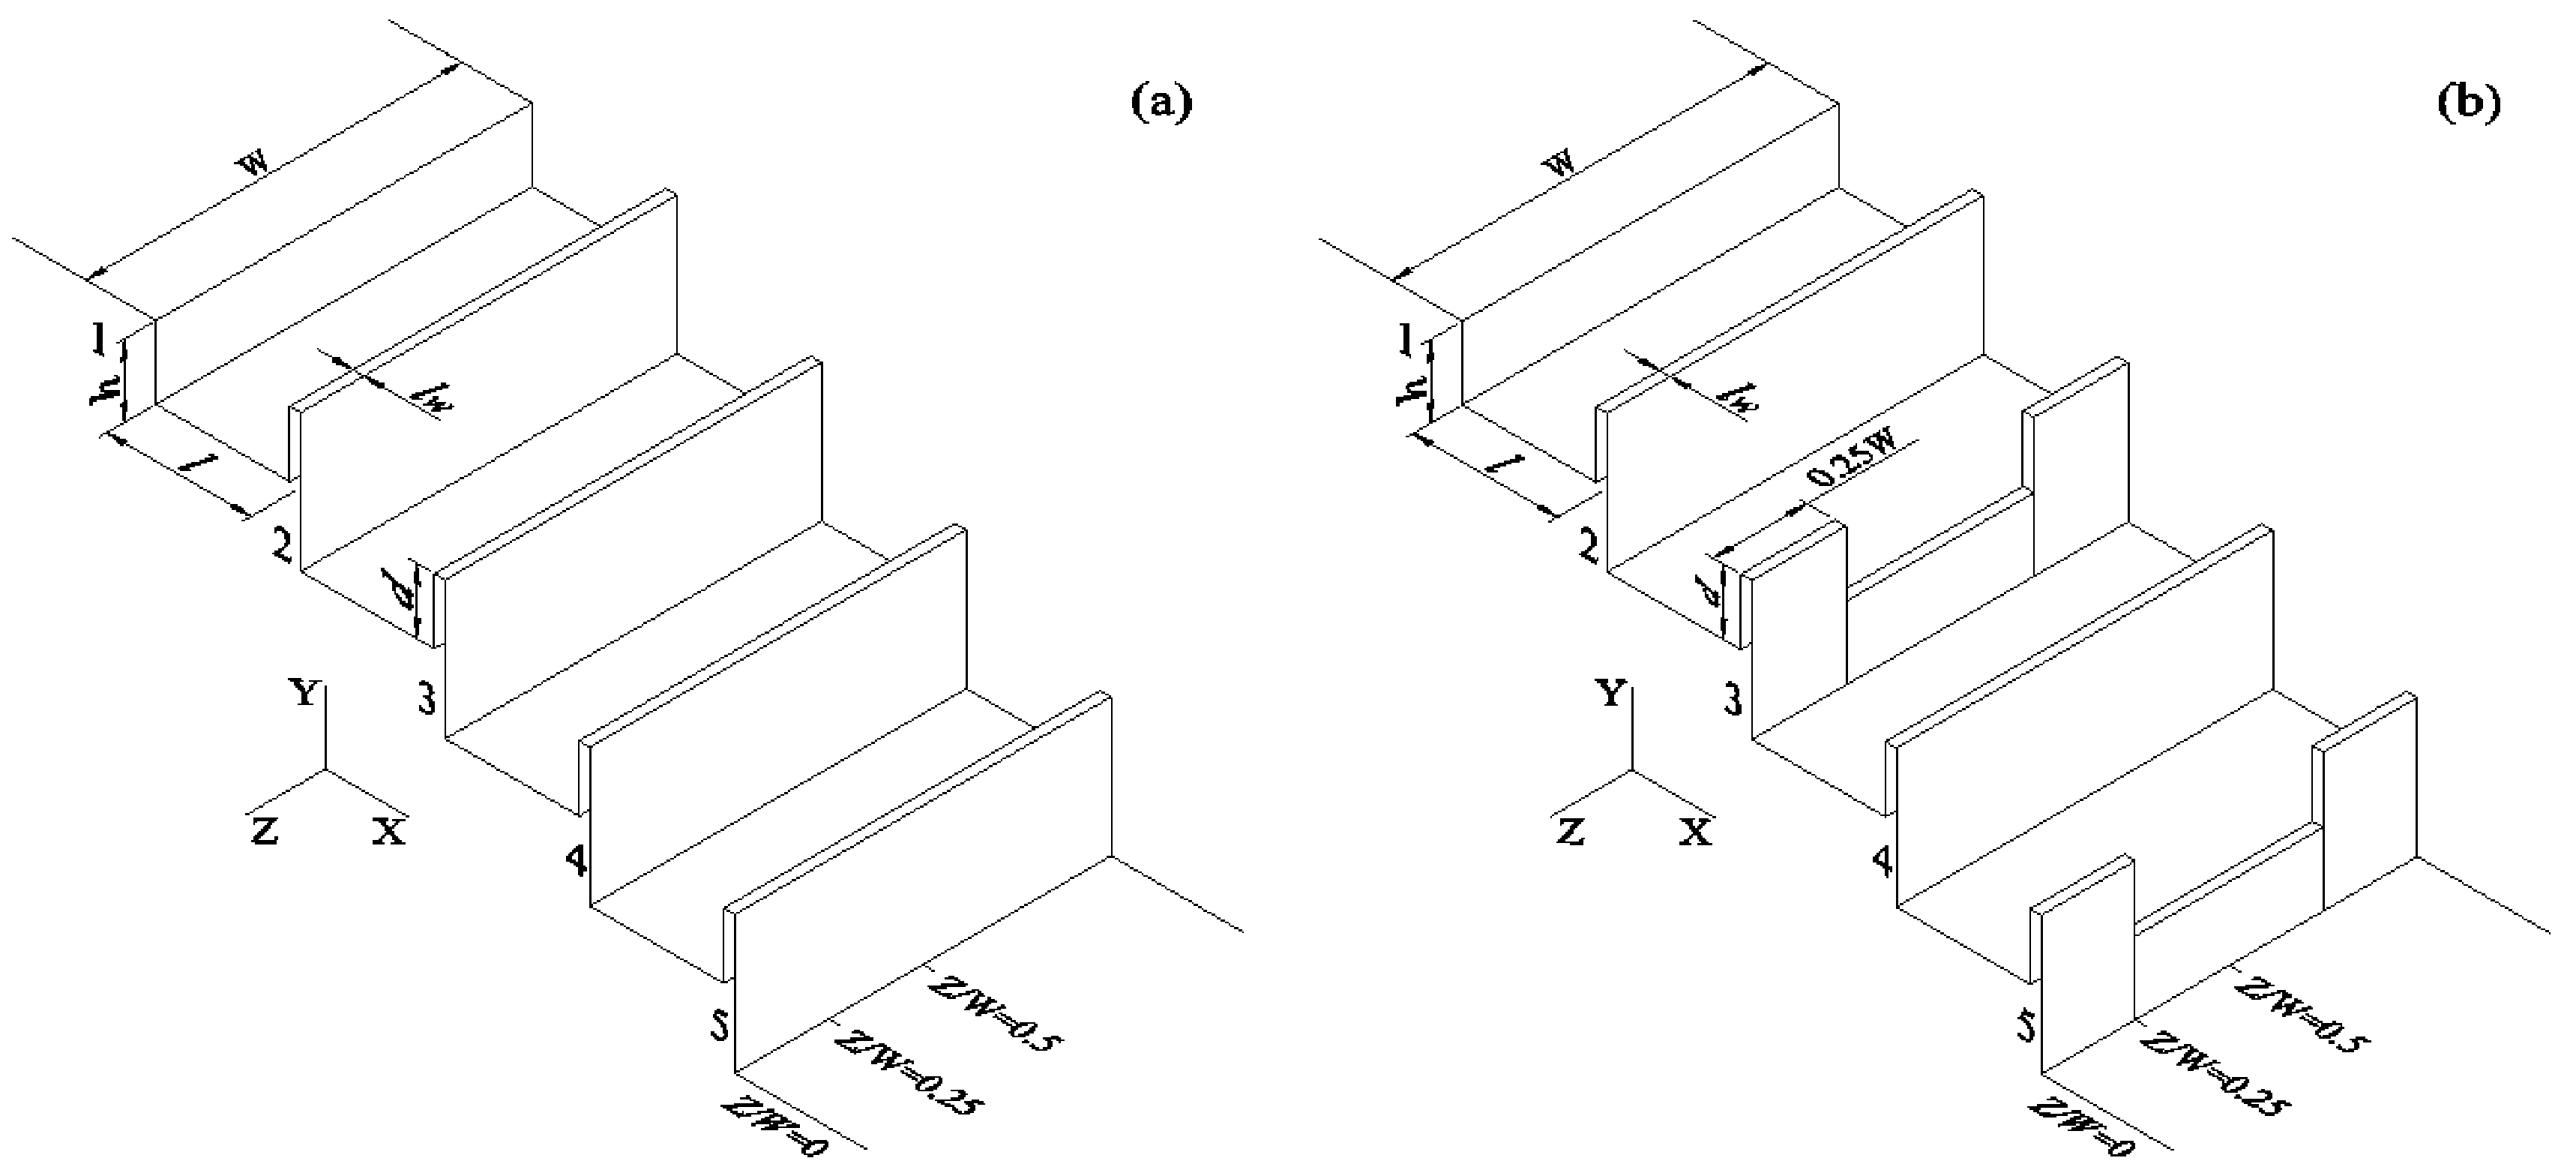
In the present study, ANSYS 16.0 (ANSYS®, Canonsburg, PA, USA) was utilized to investigate the flow characteristics over stepped spillway with different pool weir configurations. The numerical model consists of 4 parts: the upstream water tank, the broad-crested weir with an upstream rounded corner (radius = 0.08 m), the stepped spillway and the downstream channel. The length, Lcrest, and width, W, of the broad-crested weir are 1.01 m and 0.52 m, respectively. The spillway has 10 steps with vertical step height, h, and horizontal step length, l, of 0.1 m and 0.2 m, respectively. The channel slope is 26.6° and constant in each configuration. Moreover, the height, d, and the thickness, lw, of pool weir are, respectively, 0.09 m and 0.015 m. The schematics of the spillways are shown in Figure 1.
2.1. Volume of Fluid Method
Developed by Hirt and Nichols [23], the volume of fluid (VOF) model is believed to be a highly effective method to determine the position of the interface of two or more immiscible flows [19,24,25,26]. For the purpose of tracking the air-water interface, the continuity equation for the volume fraction of water is adopted in the following format:
where is the volume fraction of water, and are the velocity components and coordinates (), respectively. Hence, by solving the continuity equation, the free surface of water can be determined. In addition, it is clear that the sum of their volume fractions, and , respectively, is unity in every computational cell, which can be described as:
Obviously, the maximum and minimum value for the volume fraction of water, , is 1 and 0, indicating the given cell is full of water or air, respectively, between which there must be a mixture of them containing the interface.
As for the density, , and molecular viscosity, , they can be given as
where and represents the density of water and air, respectively, while and are the molecular viscosity of water and air, respectively. Therefore the values of and can be known by iterating the Equations (3) and (4).
2.2. Turbulence Model
Proposed by Yakhot and Orszag [27], the Renormalization Group (RNG) closure model has been employed to simulate flow over stepped spillways in many studies [28,29,30], yielding reliable results compared with laboratory experiments. The continuity equation, momentum equation, and transport equations of turbulent kinetic energy, and the turbulent dissipation rate, used in the model, are shown below.
Continuity equation:
Momentum equation:
k equation:
equation:
where and respectively represent the average density of the volume fraction and the molecular viscosity. is the modified pressure, and is the turbulent viscosity, which can be calculated from the following equations consisting of and . , , , . The constants in the above expressions are given in the Table 1.
2.3. Boundary Conditions
Combined with VOF method, RNG turbulence model was applied to numerically study the flow characteristics over stepped spillway with different pool weirs and the entire simulation domain was meshed with structured grids, as shown in Figure 2. The boundary conditions for the mathematical models were set as follows:
- (a)
- Inflow boundary: Velocity of the flow calculated from the discharge, which is 0.113 m3/s in all cases, was given as the inlet boundary;
- (b)
- Outflow boundary: Pressure outlet boundary was selected at the outlet and there was no normal gradient for all variables;
- (c)
- Free surface: Pressure inlet was employed and its value was the standard atmospheric pressure; and
- (d)
- Wall boundary: No-slip velocity boundary and wall function were chosen for the wall surfaces and near-wall regions, respectively.
2.4. Grid Testing and Model Verification
Before applying the numerical model to further analysis, it is necessary to validate its reliability. Therefore, the accuracy of the calculation results were tested by utilizing grid convergence index (GCI) [31] with grid numbers of approximately 0.31 million, 0.55 million and 0.76 million. Figure 3 presents the impact of the grid sizes on the uncertainty of the computational velocity distribution at the axial plane. The discretization uncertainties at most locations were quite small. The maximum GCI values for the velocity profiles over step 6 and step 7 were 7.7% and 5.6%, corresponding to ±0.19 m/s and ±0.15 m/s, respectively. Considering the simulation efficiency and accuracy, the grid number set as 0.55 million is reasonable.
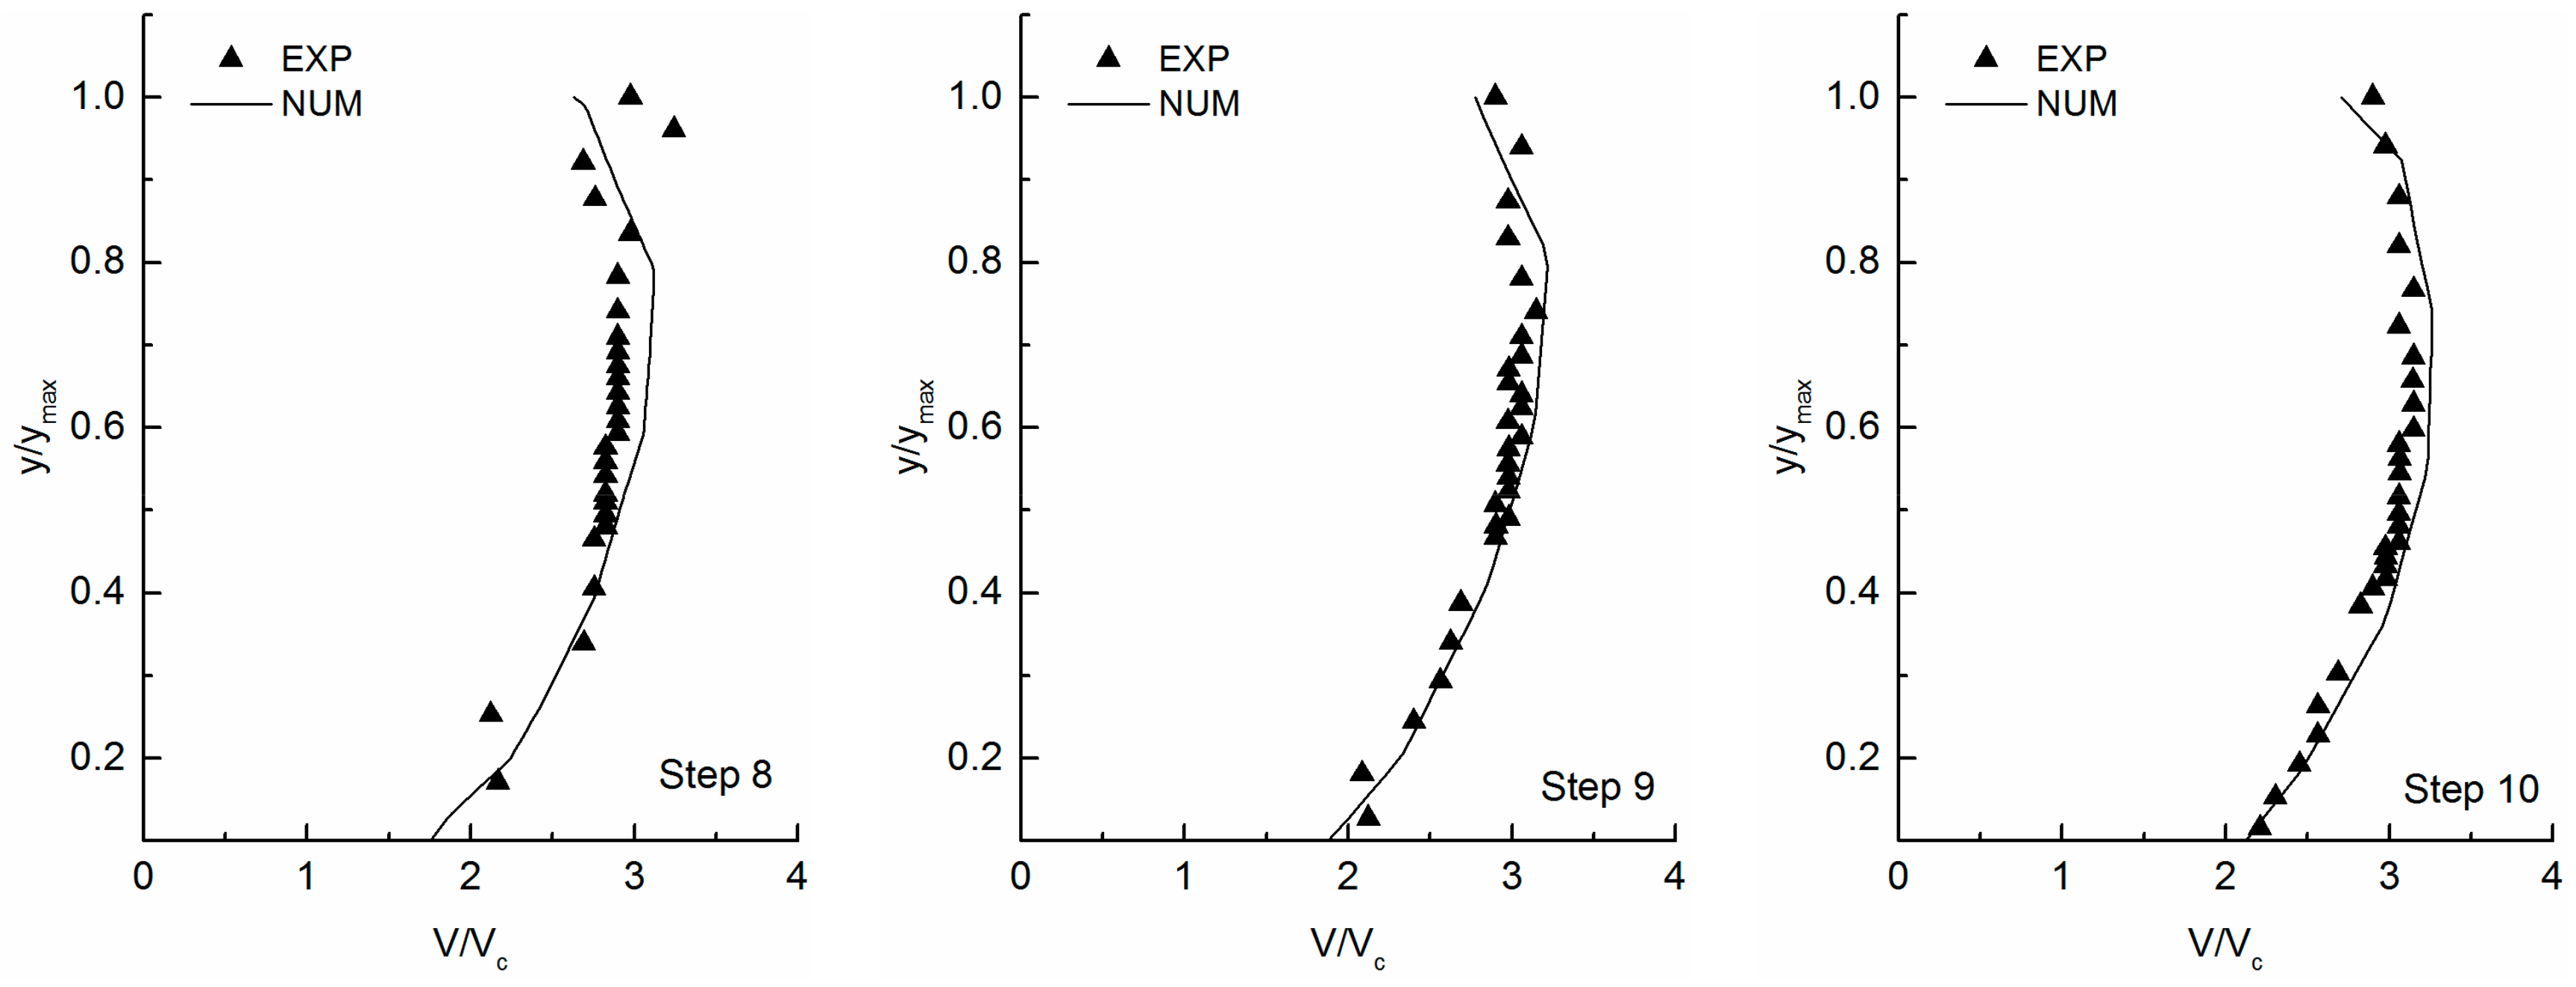
In addition, experimental data obtained from Felder et al. [32] were used to verify the numerical results by comparing the velocity distribution over the pool at steps 8, 9, and 10, as shown in Figure 4. The schematic of the physical model used for validation was the same as the FP-FP configuration in the present article, except the pool weir height. In the research of Felder et al. [32], the pool weir height was 0.031 m. It can be seen from Figure 4 that, at most locations, the calculated results of velocity distribution were fairly consistent with that of laboratory tests. The maximums of the relative error for steps 8, 9 and 10 were 14.8%, 7.1% and 6.5%, respectively, indicating that the numerical simulations produced reliable and acceptable results.
3. Results and Analysis
3.1. Flow Pattern
After ensuring the accuracy of the calculation, the effects of pool weir geometrical parameters on the hydraulic behaviors were numerically examined. Figure 5 illustrates the flow pattern at the axial plane in the calculated cases. It is noticeable that the free water surface of FP-FP configuration was parallel to the pseudo-bottom, and showed the least instability among the simulated configurations. FP-TP and FP-CP showed the similar free surface profile, but slight flow turbulences caused by the partially pooled steps can be observed. An obvious feature of the flow in TP-CP was the highly three-dimensional flow motion in the spanwise direction, so TP-CP highlighted strong fluctuations in free water surface.
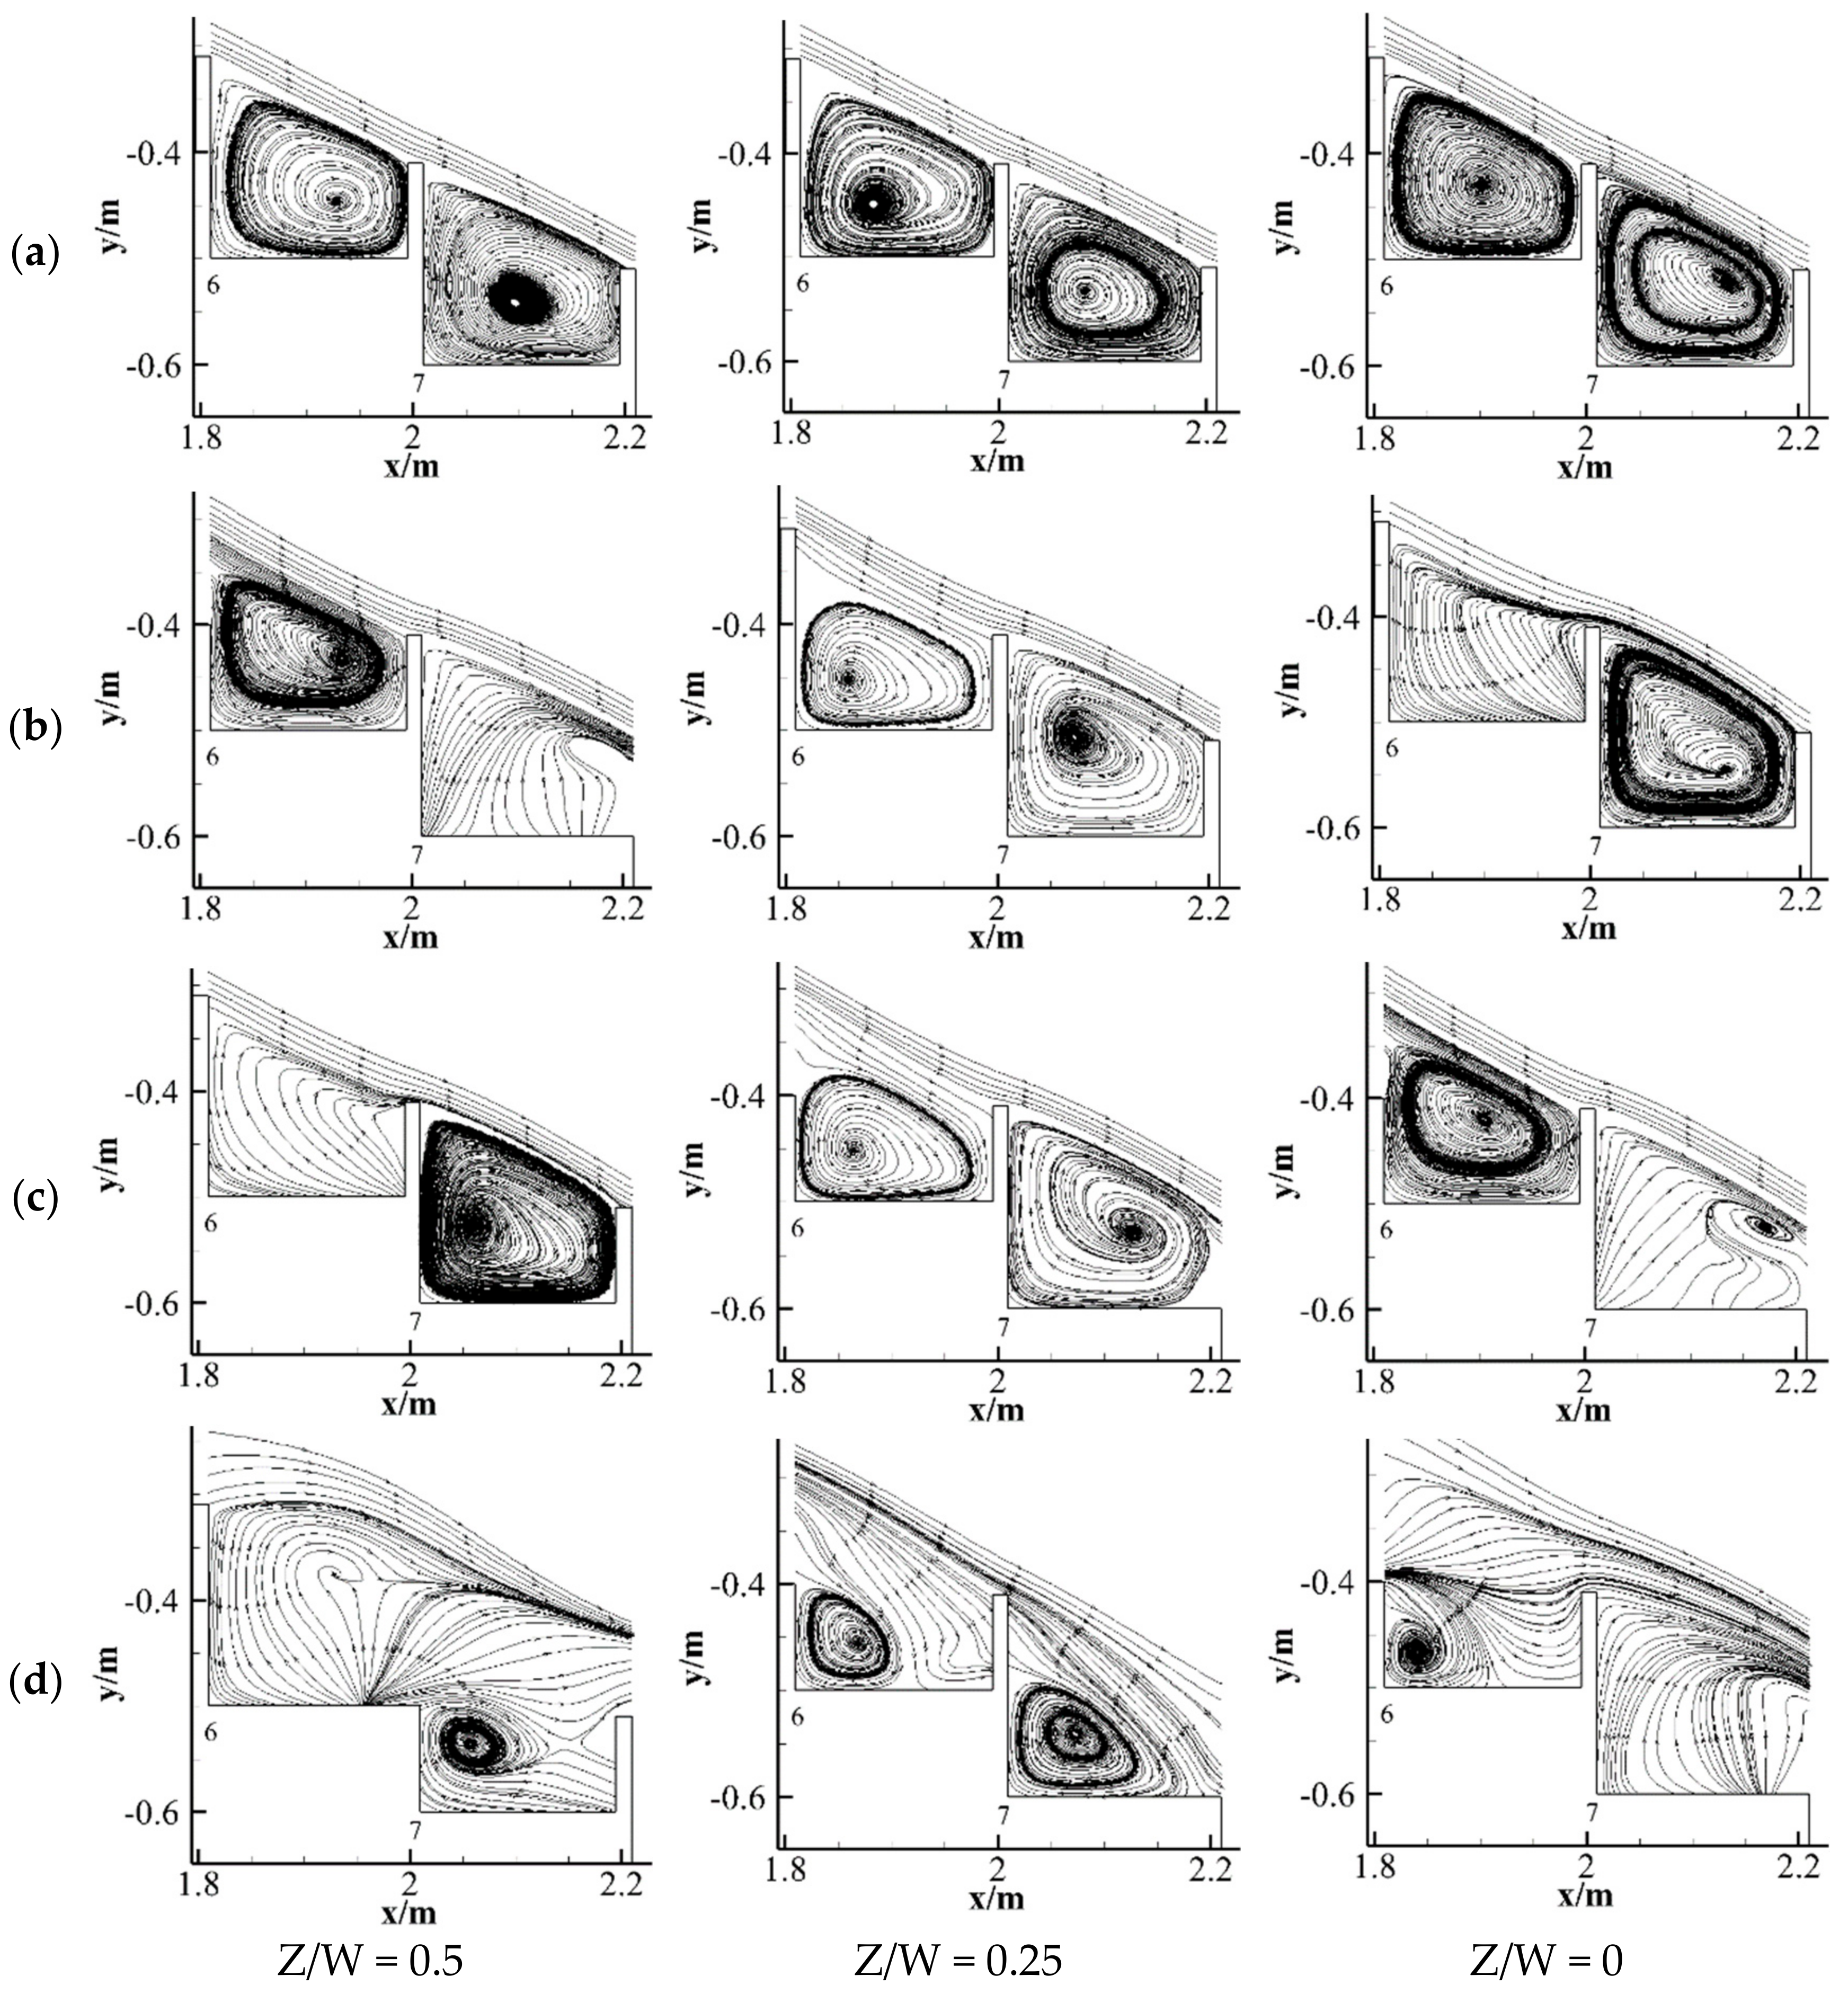
Figure 6 highlights the streamlines on the representative steps in each configuration. As can be seen, like the traditional flat stepped spillway, the flow surface over the pool weir was approximately parallel to the pseudo-bottom formed by the pool edges, although TP-CP presented some instabilities caused by the staggered configurations of central pooled and two-sided pooled steps. For FP-FP configuration, vortexes with the similar size and position were formed in every pool and there was no significant change in the transverse direction, which was different from other configurations, that is, the flow pattern in FP-TP, FP-CP, and TP-CP was three-dimensional. In FP-TP, the scale of the vortex on the two-sided pooled steps increased from the axial plane to the sidewalls, while the scale of the vortex on the fully pooled steps decreased from the axial plane to the sidewalls. FP-CP presented the opposite phenomenon compared with FP-TP. In TP-CP configuration, the maximum vortex intensity occurred at Z/W = 0.25 and no eddy can be found on the central pooled steps at the sidewalls and on the two-sided pooled steps at the axial plane.
For the identification of turbulence structures, Q criterion [33] is introduced to examine the effects of pool weir geometry on the vortex flow. The Q criterion is defined as follows:
where
represents the rate of rotation tensor corresponding to the pure rotational motion, and
represents the rate of strain tensor corresponding to the irrotational motion.
The parameter Q is an effective approach to reveal the main motion pattern of fluid element. It can been seen from Equation (9) that the rotation motion will dominate the region where the value of Q is positive, while the deformation motion will dominate when Q is negative. However, it should be noted that the vortex structures cannot be accurately represented in the region with Q = 0, due to experimental error and viscous diffusion.
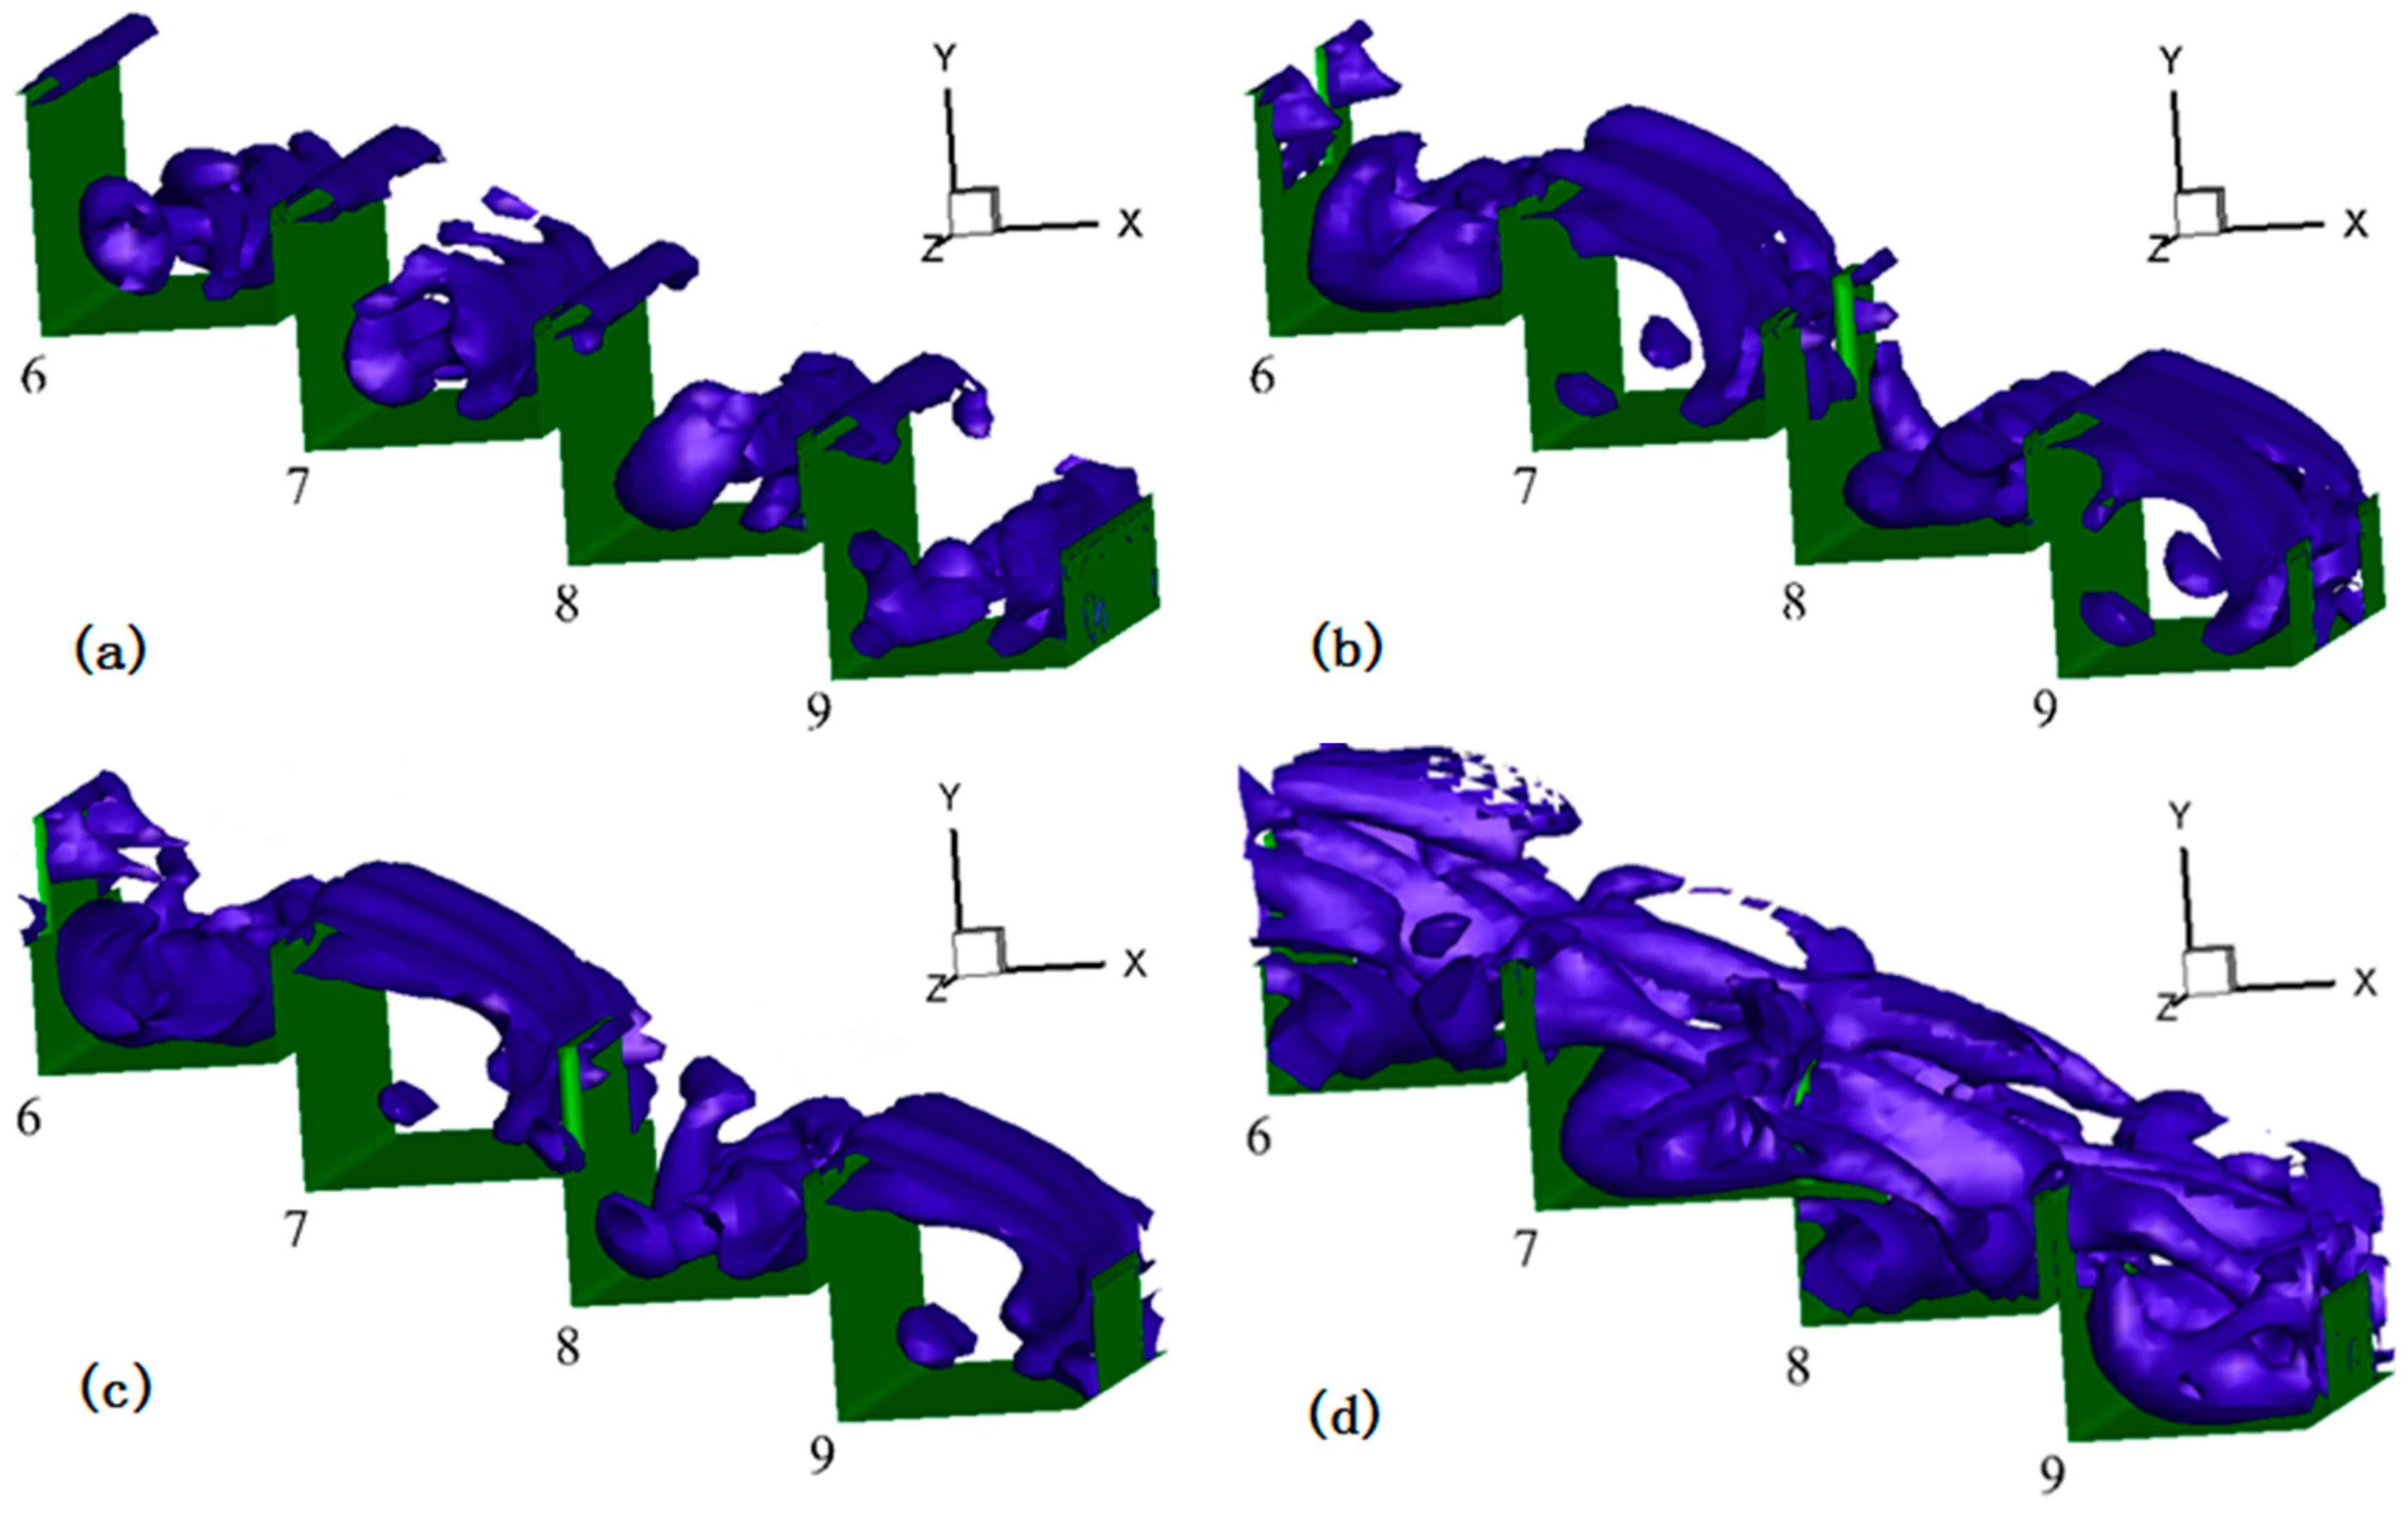
Figure 7 demonstrates the iso-surface of Q = 100. In FP-FP configuration, the number of lumps of the Q iso-surface distributing on each step was approximately the same and there was no apparent change in the transverse direction. The distribution of lumps in FP-TP and FP-CP exhibited the similar pattern. The major difference was that small lumps can be found near the sidewalls on the two-sided pooled steps in FP-TP, while small lumps were located near the axial plane in FP-CP, meaning turbulent structures existed at the two locations. It is noticeable that distribution of lumps in TP-CP configuration was much denser than that of other cases, indicating greater vortex and more turbulent structures.
3.2. Velocity Distribution
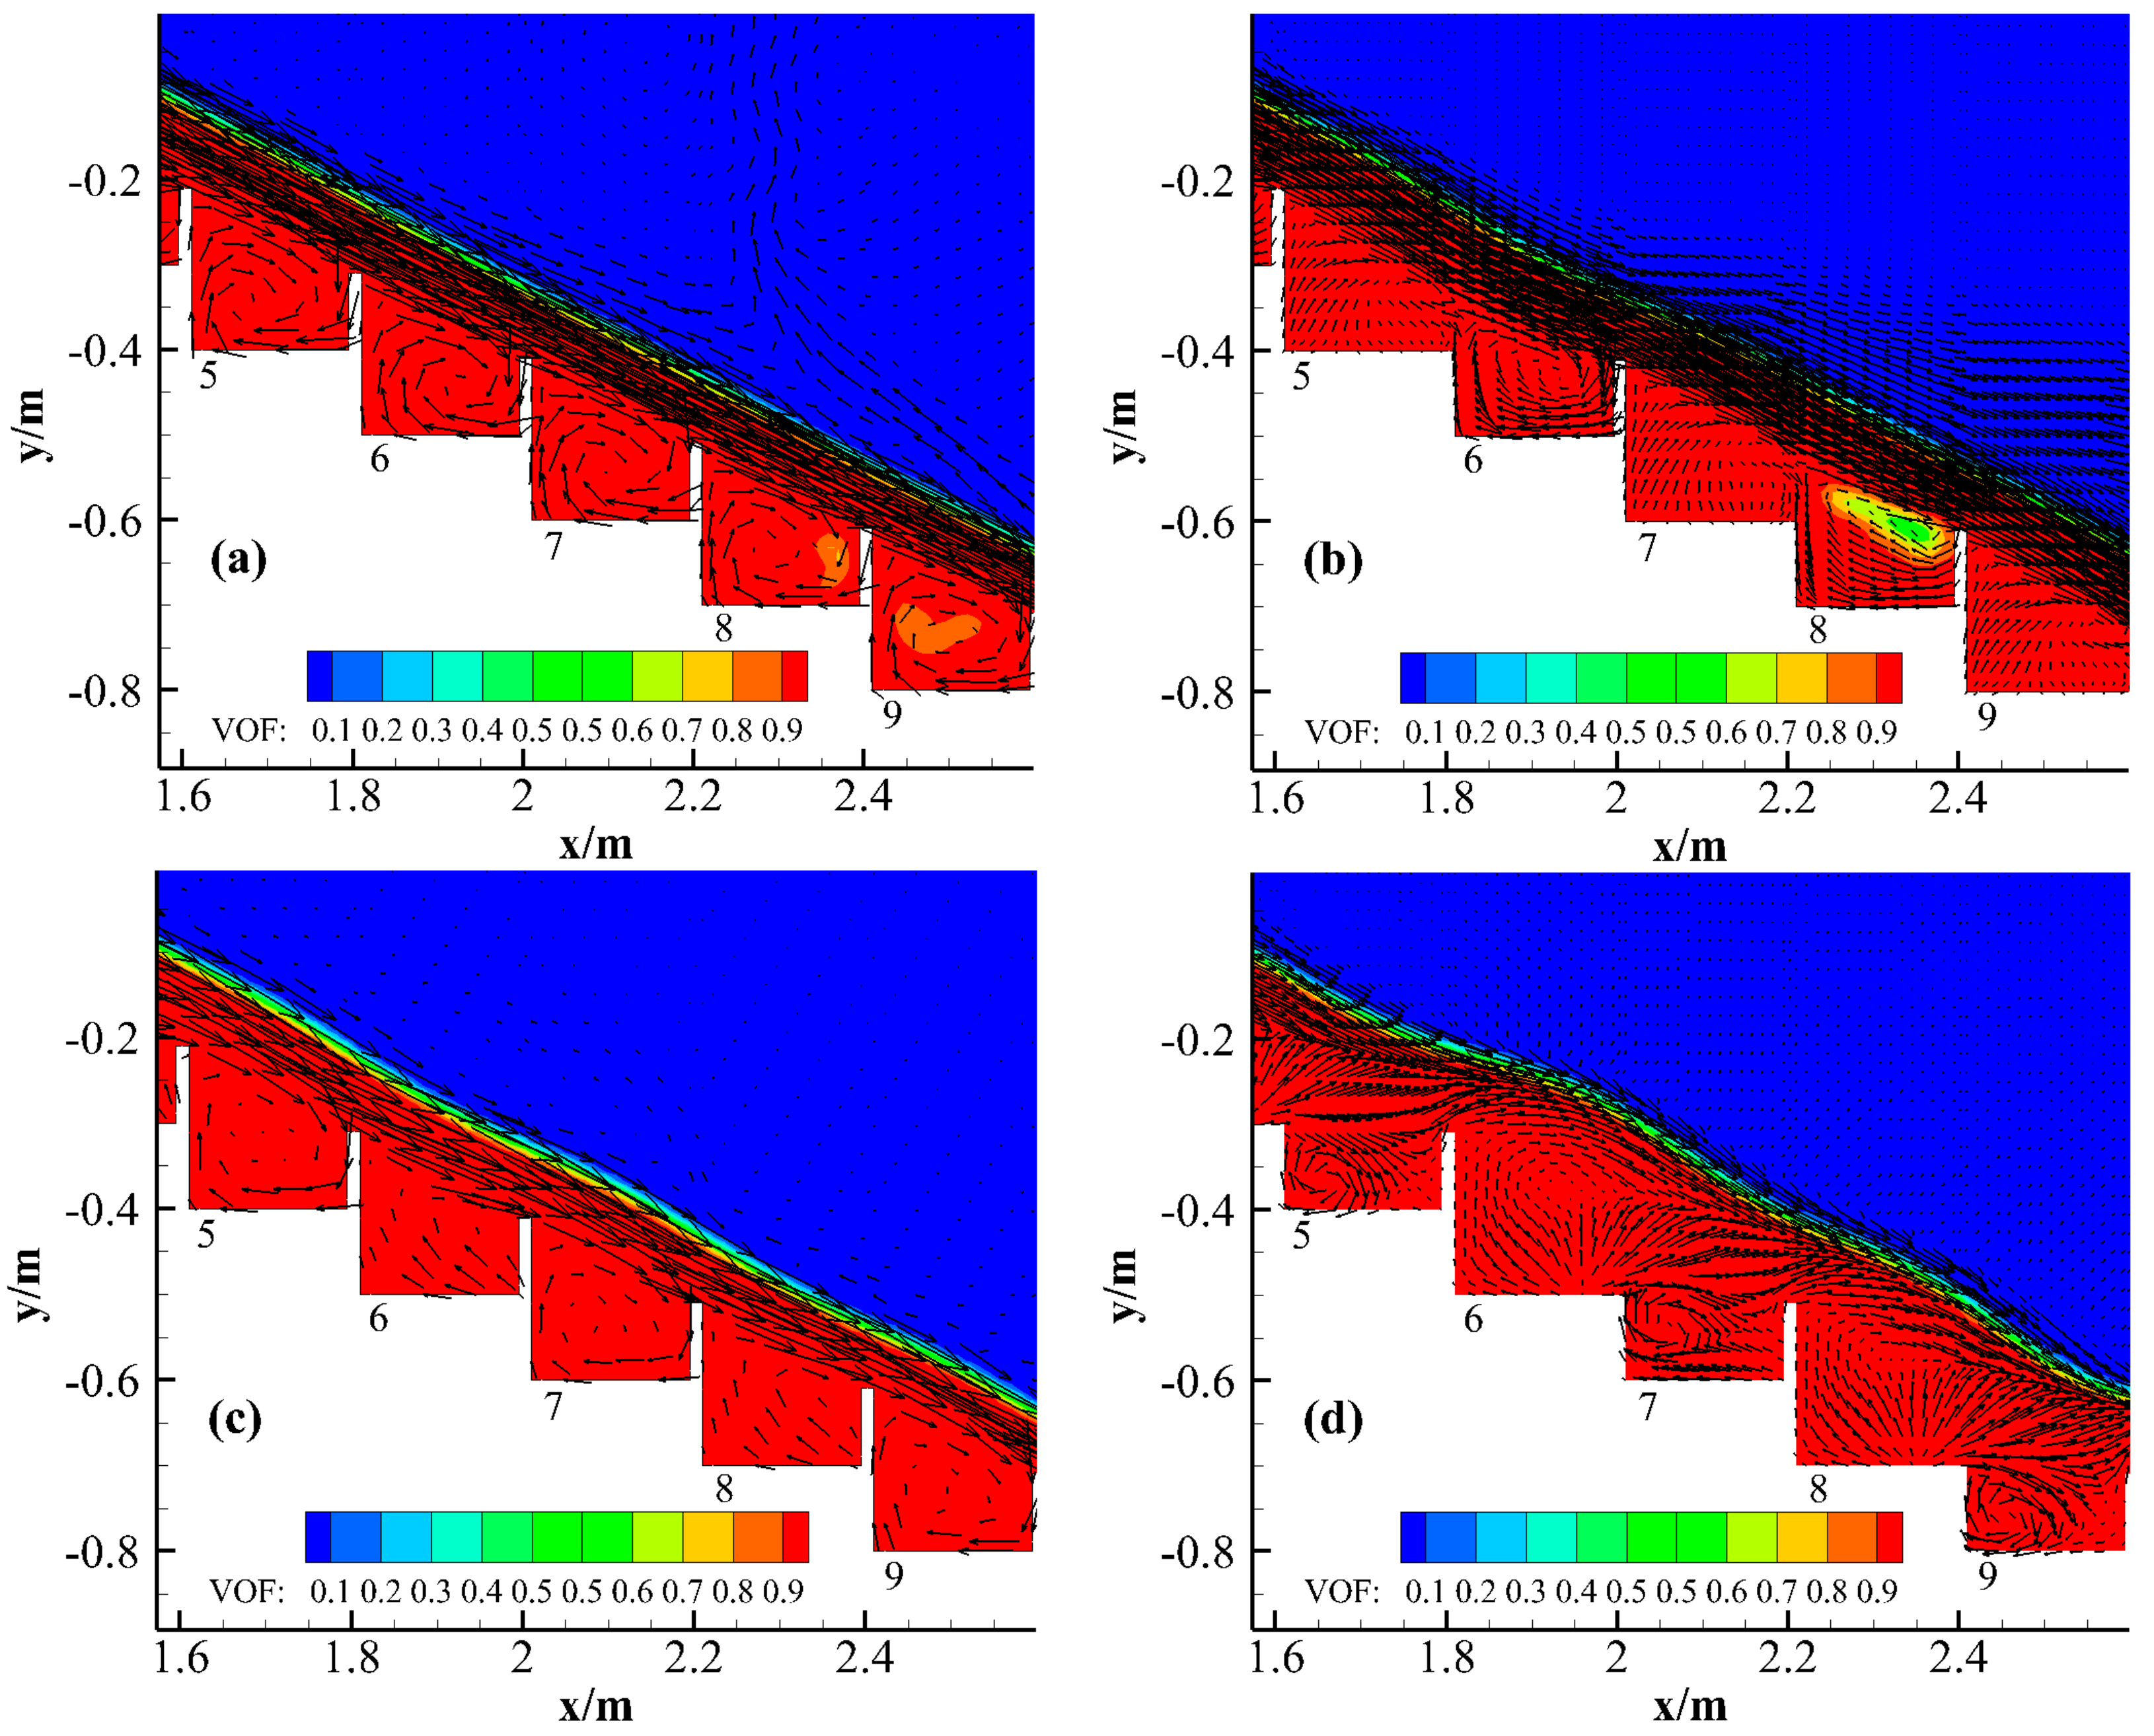
Figure 8 illustrates the velocity vectors at the axial plane. It implies that, in all configurations, the skimming flow transferring from the upstream to the downstream over the steps was partly trapped in the recirculating zones under the pseudo-bottom. However, it is evident that stable vortices can only be found on some steps at the axial plane in FP-TP, FP-CP, and TP-CP, which is consistent with the analysis from flow pattern. Furthermore, the velocity magnitude of the overlaying flow was significantly greater than that of the vortex.
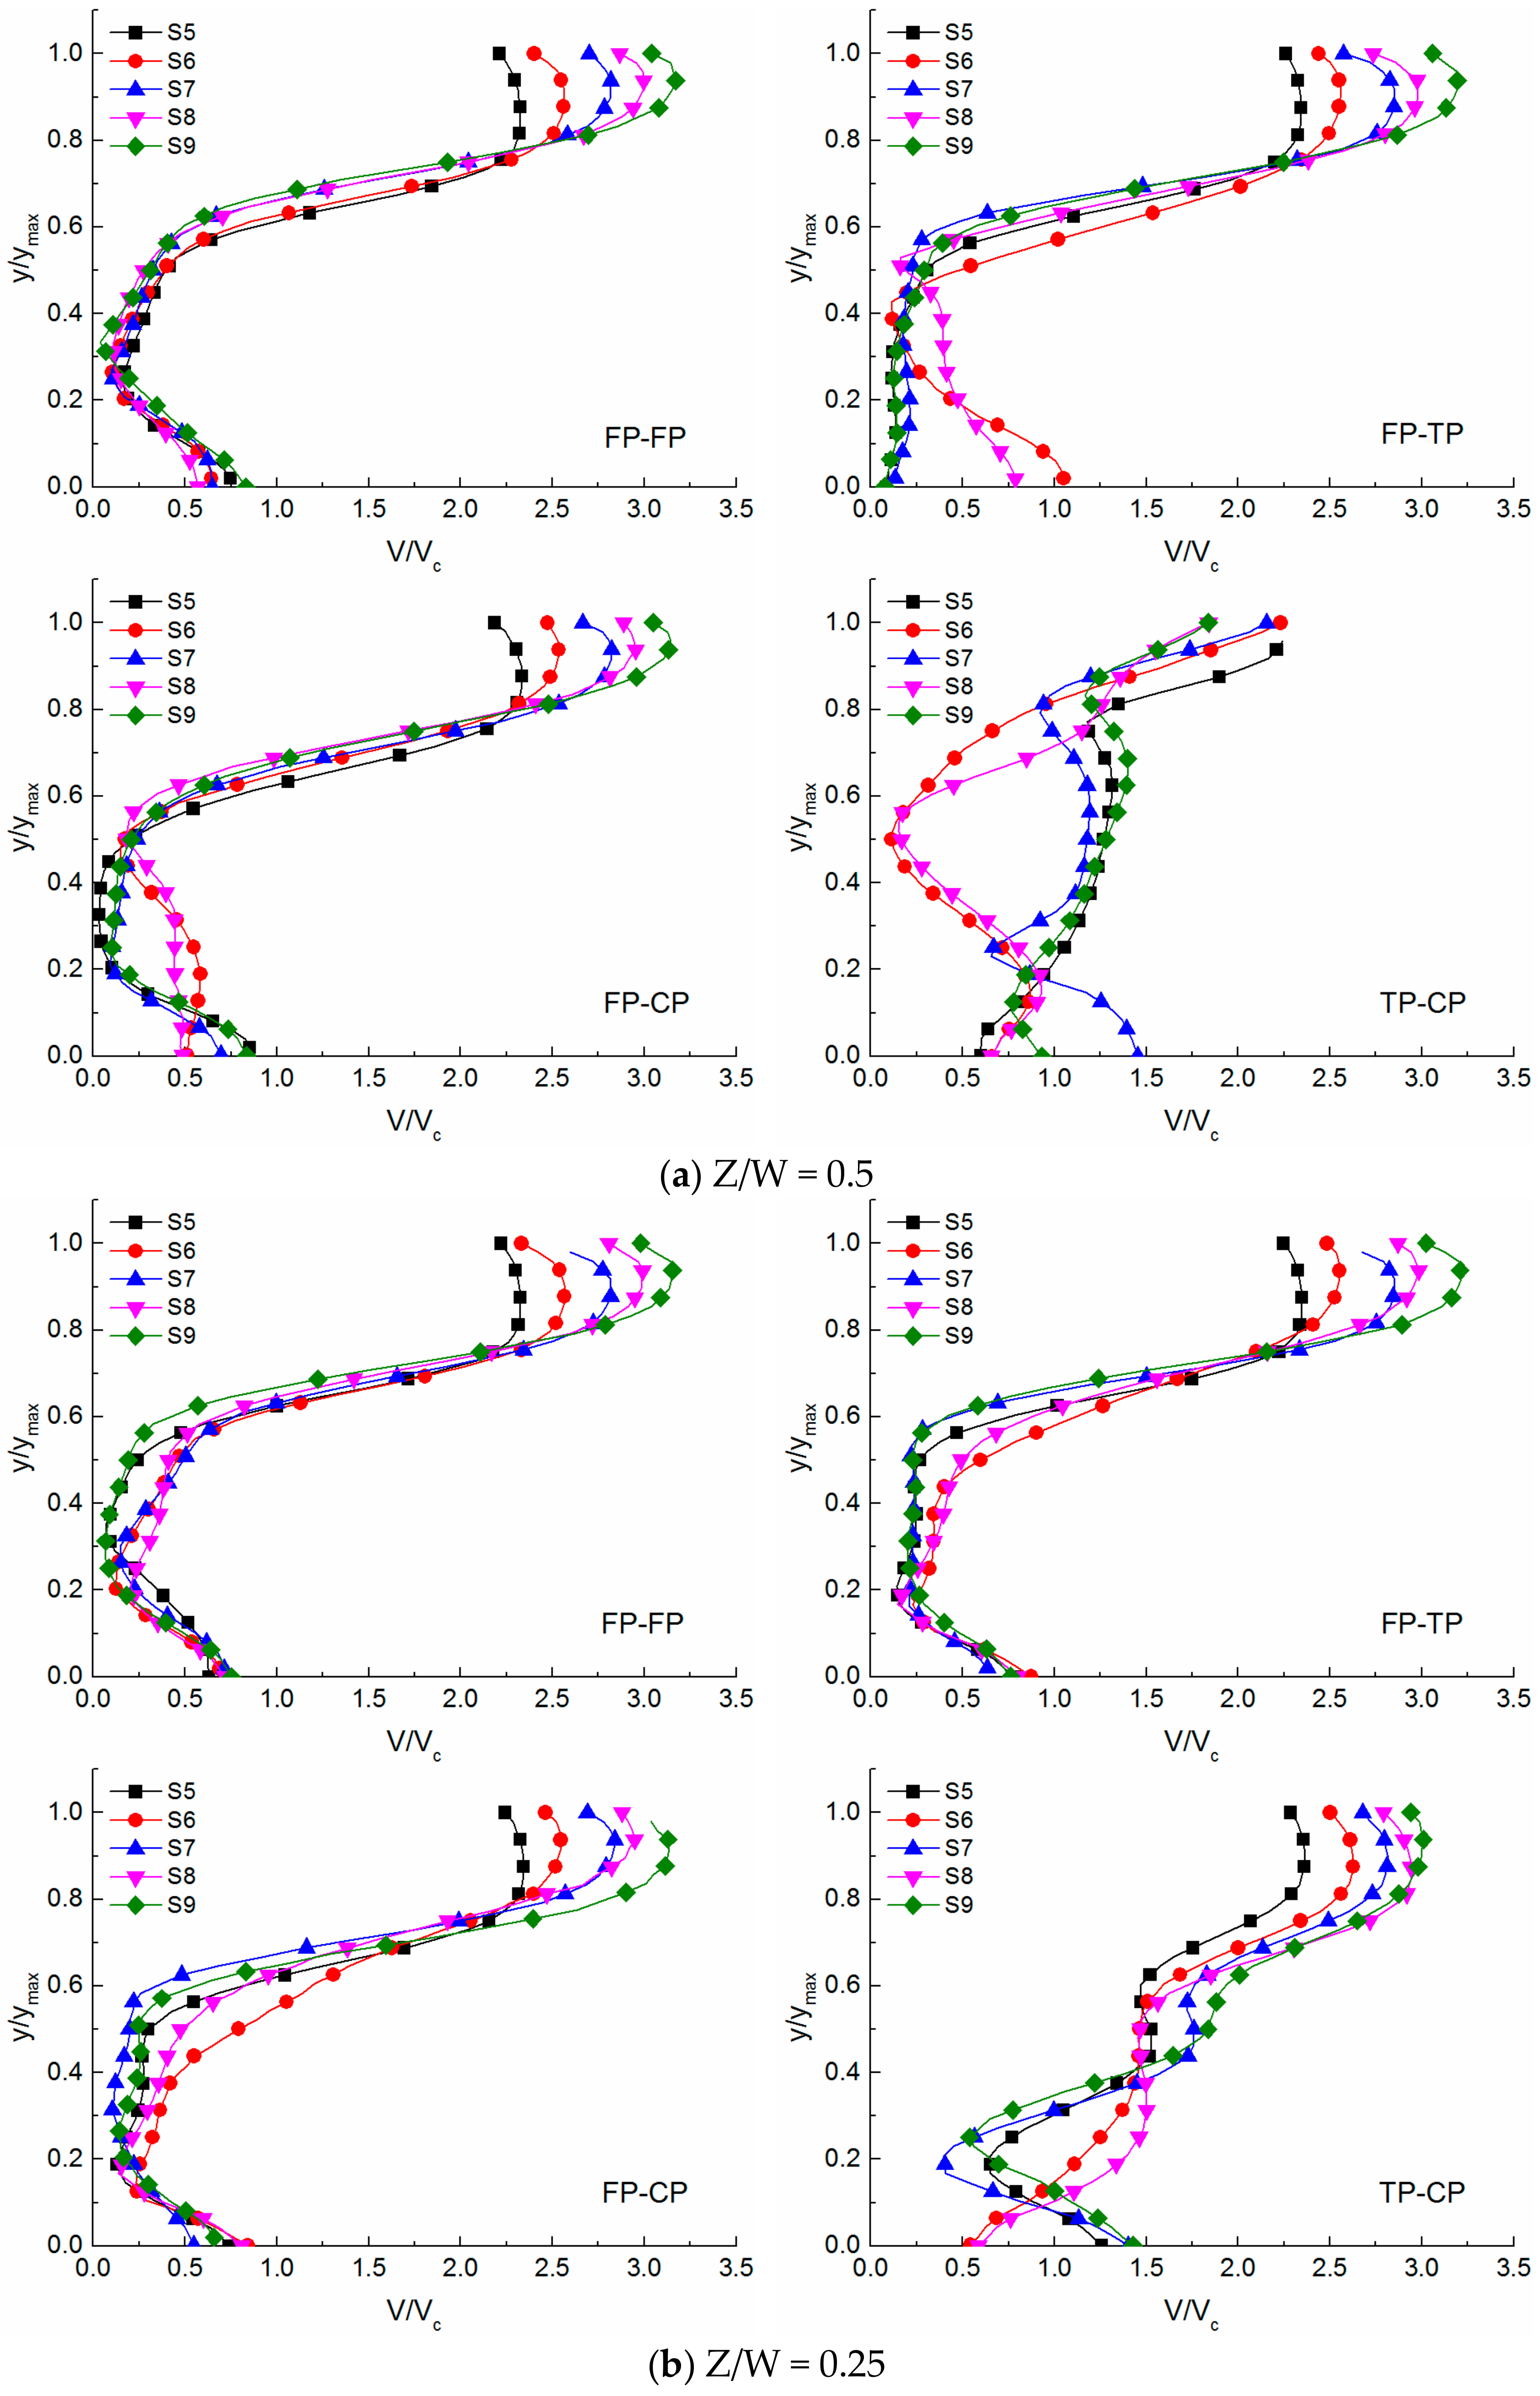
Figure 9 displays the velocity distributions above the center of the horizontal step surfaces. In FP-FP, the velocity showed the same distribution in the transverse direction; the velocity distributions on each step presented the similar pattern, and no significant change between different steps can be observed for , but in the flow surface region, the velocity above the downstream step surfaces was greater than that of the upstream ones; the minimum and maximum velocity above each step occurred at the same position: and , respectively. In FP-TP configuration, at the axial plane, the velocity distributions above the fully pooled and two-sided pooled steps were obviously different in the bottom region, with the former greater than the latter; However, at Z/W = 0.25, there was no major difference in the velocity distribution above different steps except the free surface region. In FP-CP, at Z/W = 0.5, the velocity at for different steps indicated the same distribution; different from Z/W = 0.5, the velocity over different steps at Z/W = 0.25 exhibited similar distributions. In TP-CP, the velocity distributions presented a totally different pattern from other configurations; the velocity demonstrated the different distribution on two-sided pooled steps and central pooled steps, and velocity fluctuated greatly in the spanwise direction, proving its highly three dimensional characteristics.
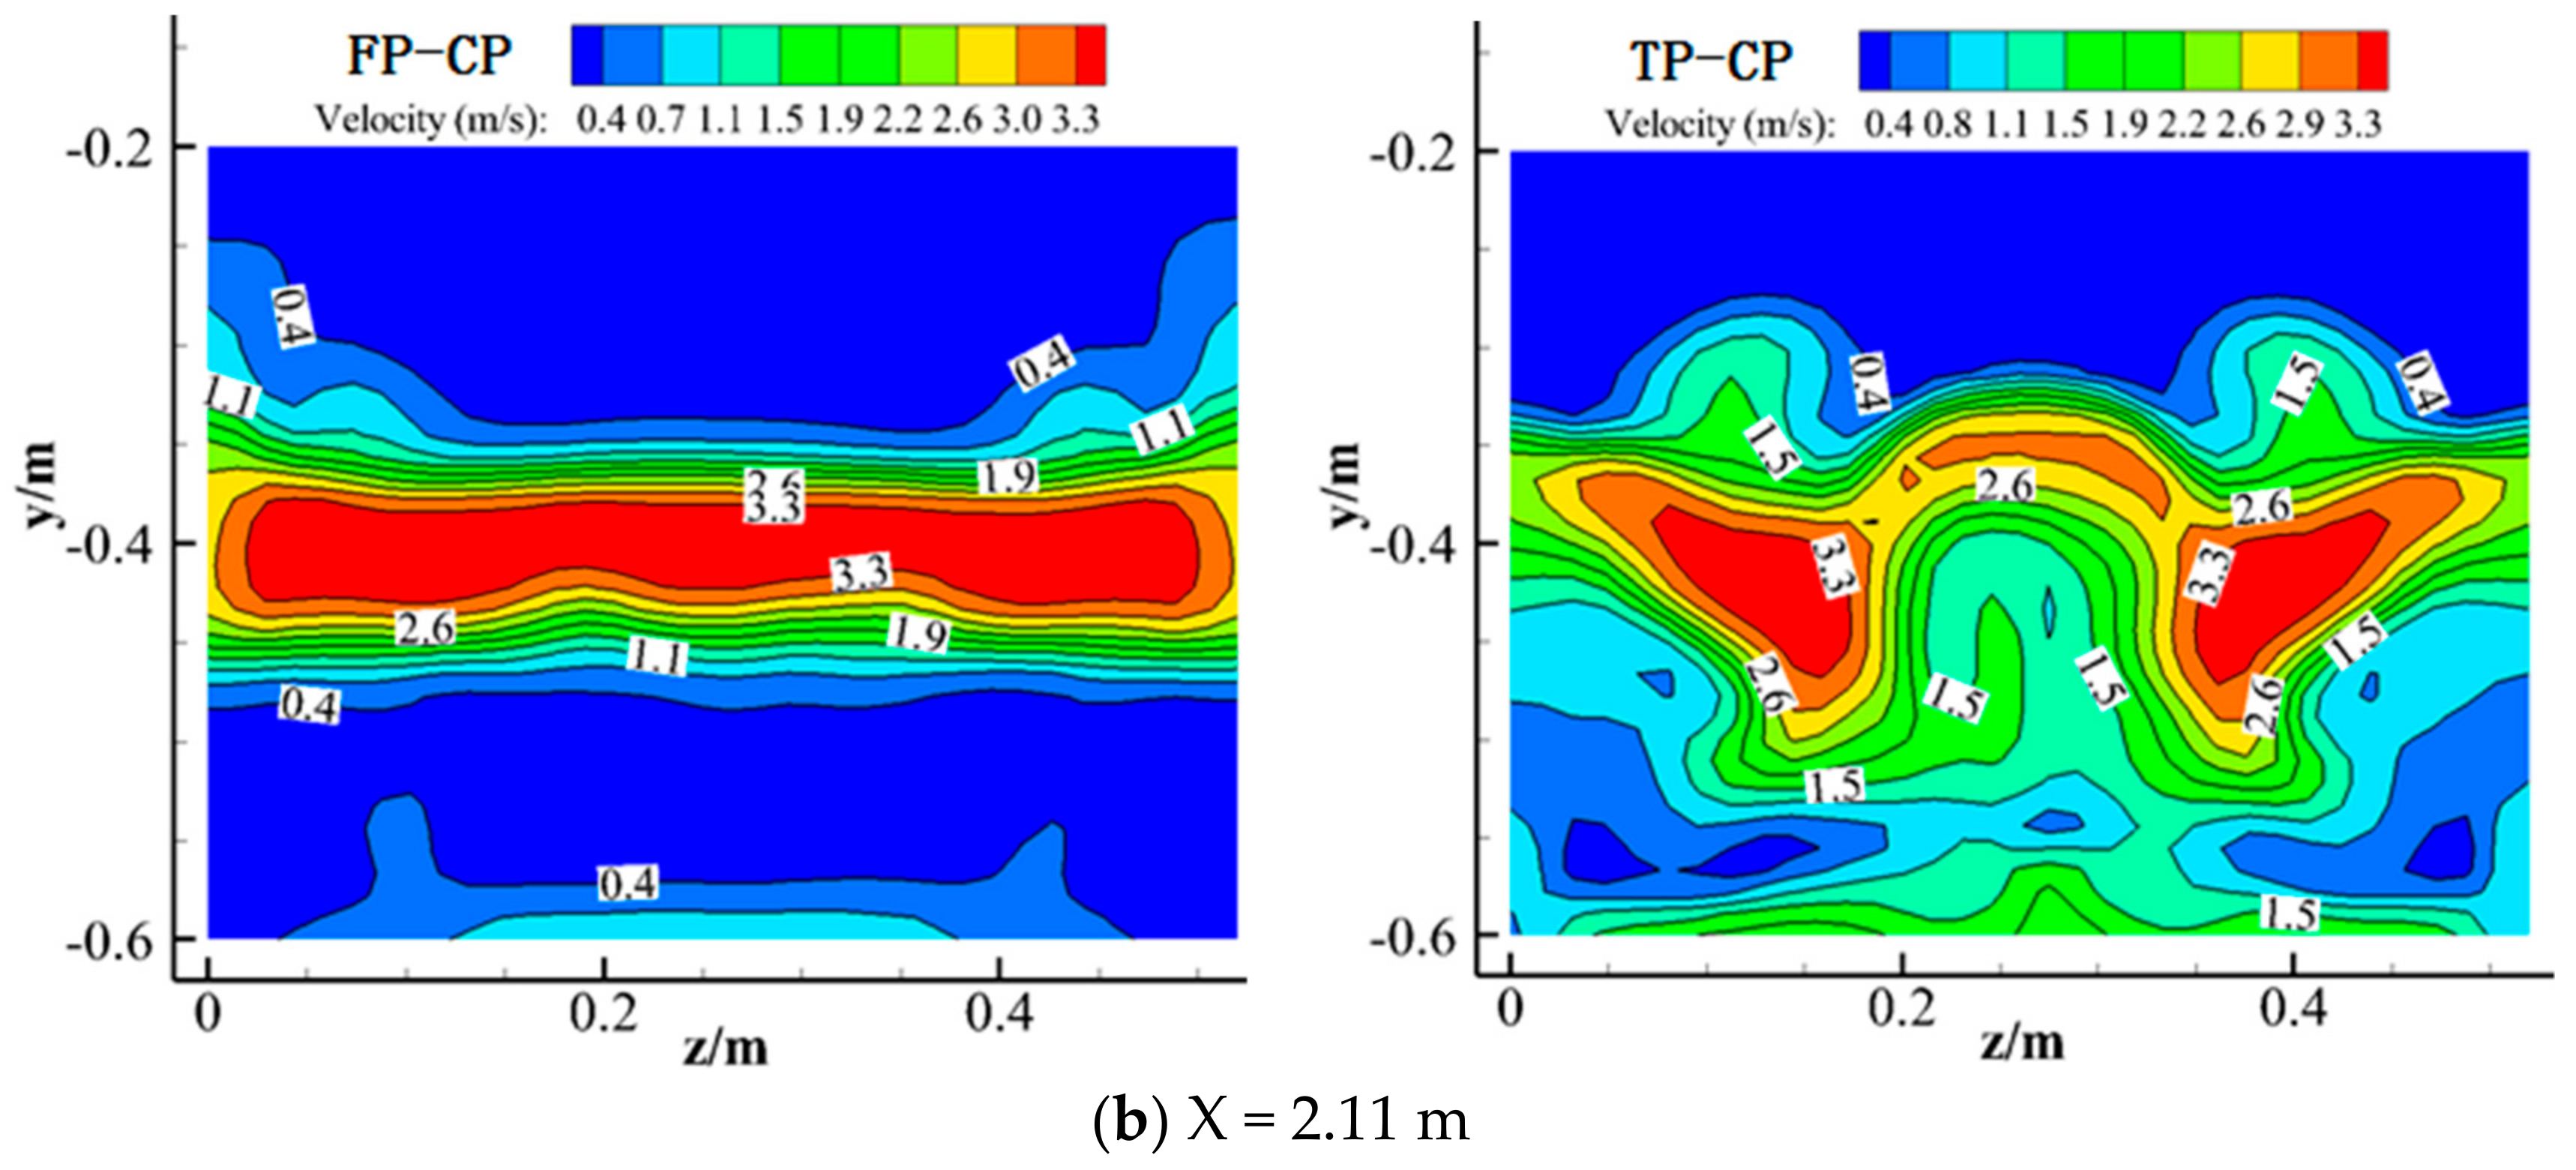
In order to better compare the velocity field in the transverse direction, velocity contour maps at different cross-sections are shown in Figure 10. It can be noticed that, in all cases, the velocity distribution along the transverse direction was symmetrical and the overlaying flow over the pool weir showed the maximum velocity magnitude, while the minimum velocity value occurred near the bottom, but both the minimum and maximum indicated no apparent change in different configurations; In FP-FP, FP-TP and FP-CP, the velocity of the mainstream illustrated no significant difference along the spanwise direction, but the velocity in TP-CP fluctuated greatly with its value increasing from the axial plane to the sidewalls.
3.3. Pressure Distribution
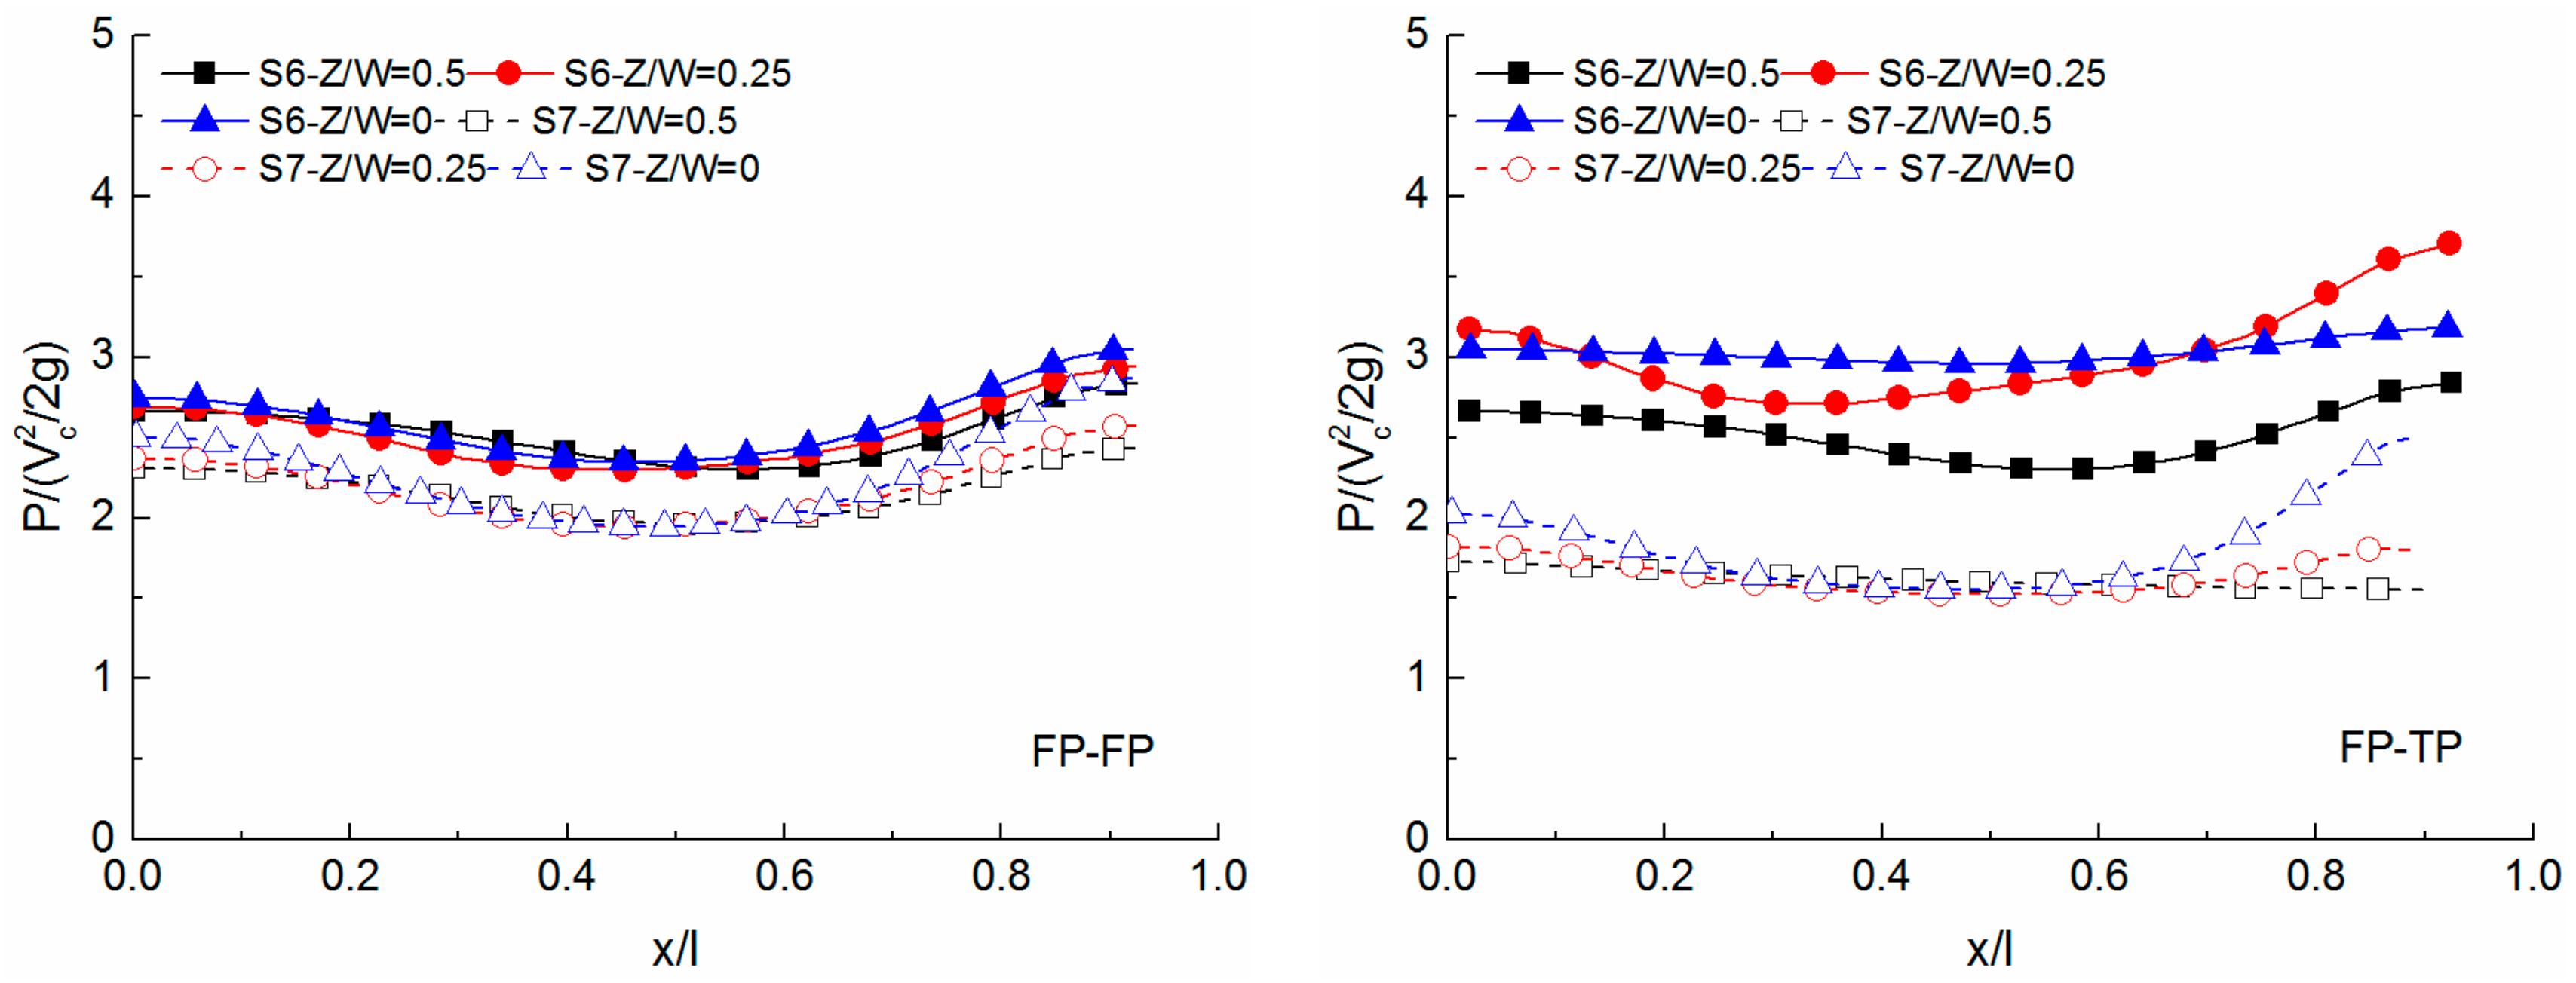
Figure 11 highlights the pressure distributions on the horizontal step surfaces of two representative steps (steps 6 and 7). In FP-FP configuration, the minimum and maximum pressure on different horizontal step surfaces showed no significant change, as well as the locations where the minimum and maximum pressure occurred. The pressure distribution patterns on the fully pooled steps in FP-TP and on the central pooled steps in FP-CP were similar with the extreme pressure occurring at the axial plane near the downstream end of the step face and the minimum pressure occurring in the middle the step surface; the pressure distributions on the two-sided pooled steps in FP-TP and on the fully pooled steps in FP-CP demonstrated the similar patterns with the extreme pressure occurring at the sidewalls near the downstream end of the step face. As for TP-CP configuration, the extreme pressures on the two-sided pooled and central pooled steps occurred near the sidewalls and axial plane, respectively.
Figure 12 illustrates the pressure distributions on the vertical step surfaces of two representative steps (steps 6 and 7). As can been seen, in FP-FP, FP-TP and FP-CP, the pressure distributions on the vertical step surfaces highlighted the same pattern: the value of pressure decreased with the increasing in water depth, but the pressure for TP-CP presented some variations in the vertical direction. The maximum pressures on odd-number step surfaces in different configurations were in the following order: FP-CP > TP-CP > FP-TP > FP-FP, while for the even-number steps, it was TP-CP > FP-FP > FP-TP > FP-CP.
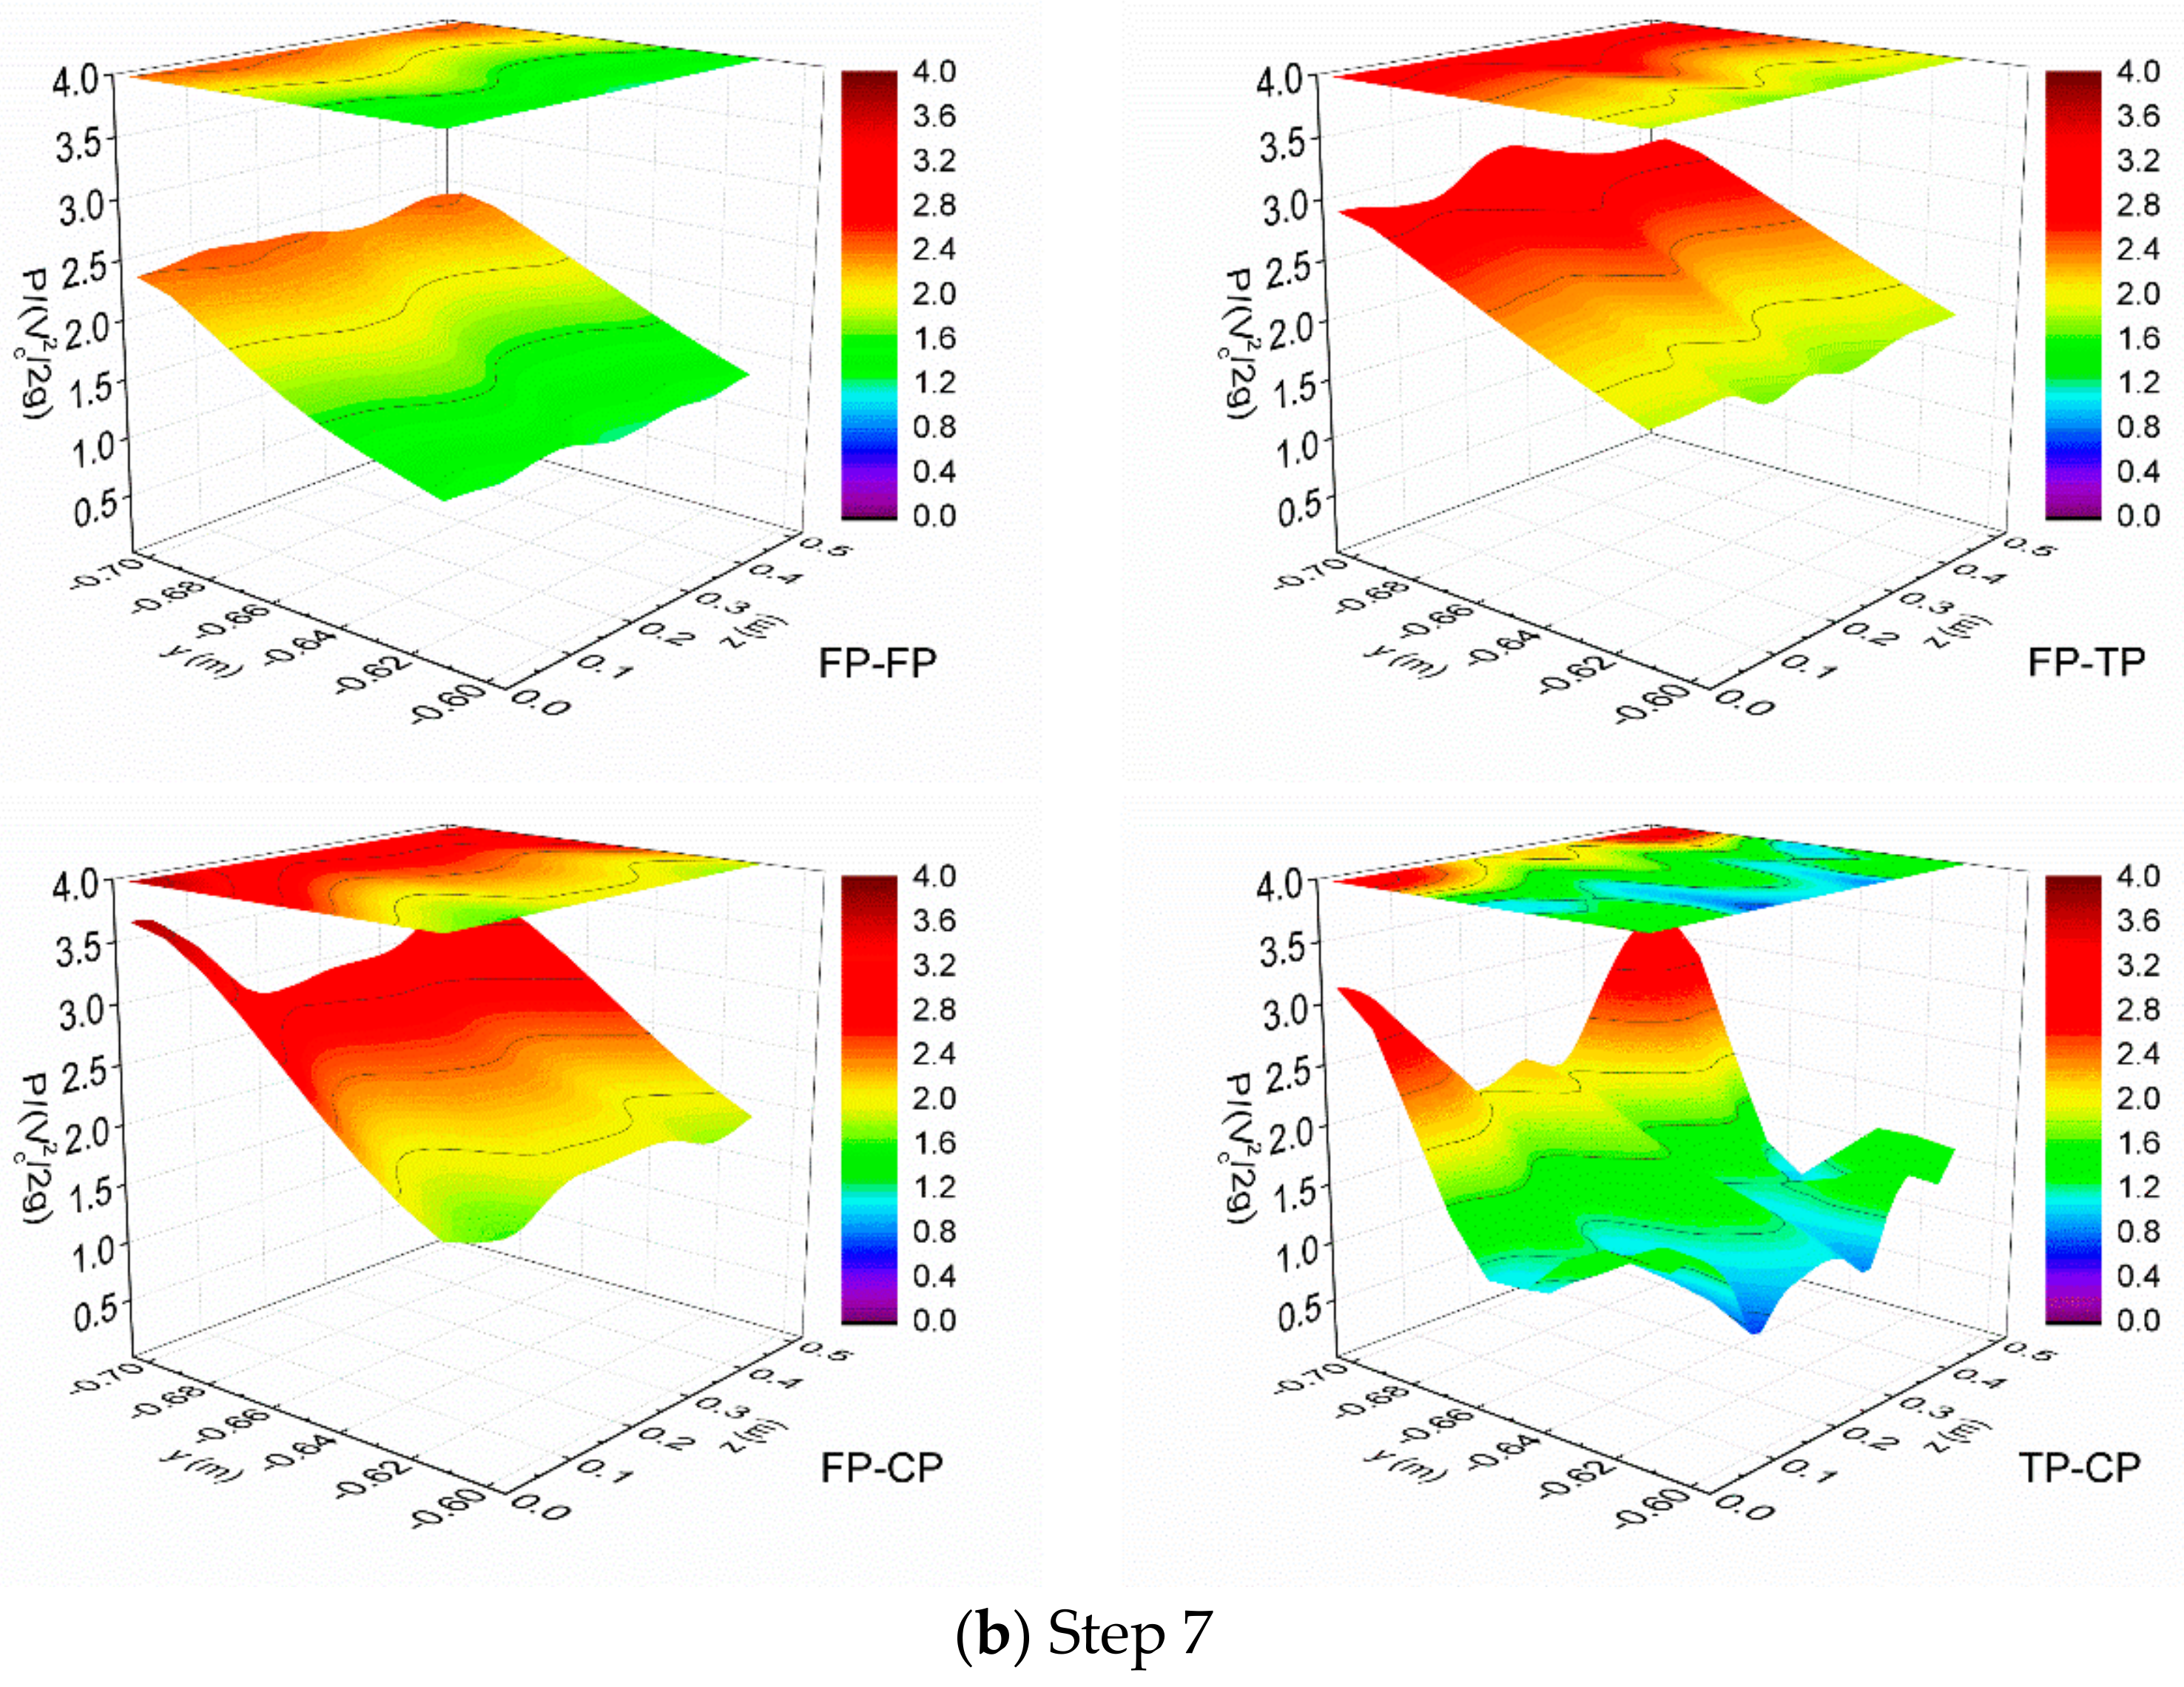
Figure 13 presents the pressure distributions on the horizontal step surfaces in the transverse direction. In FP-FP, FP-TP and TP-CP, the pressure on the upstream step surfaces was greater than that of the downstream ones, but it was quite chaotic and showed no obvious trend in TP-CP. The pressure distributions on horizontal step surfaces of FP-FP, FP-TP, and TP-CP showed U-shaped variation with the maximum pressures occurring at the downstream end of the step surface. In addition, the greatest fluctuation in pressure in the spanwise and streamwise direction can be found in TP-CP, indicating its flow complexities and highly three-dimensional characteristics.
Figure 14 presents the pressure distributions on the vertical step surfaces in the transverse direction. In FP-FP, FP-TP, and FP-CP, the pressure distributions on the vertical step surfaces displayed no significant change in the transverse direction, but great pressure fluctuation can be seen in TP-CP. In FP-TP and FP-CP, the pressure on the vertical step surfaces of the downstream steps was moderately greater than that of the upstream ones, while FP-FP showed no evident difference.
3.4. Residual Head and Energy Dissipation
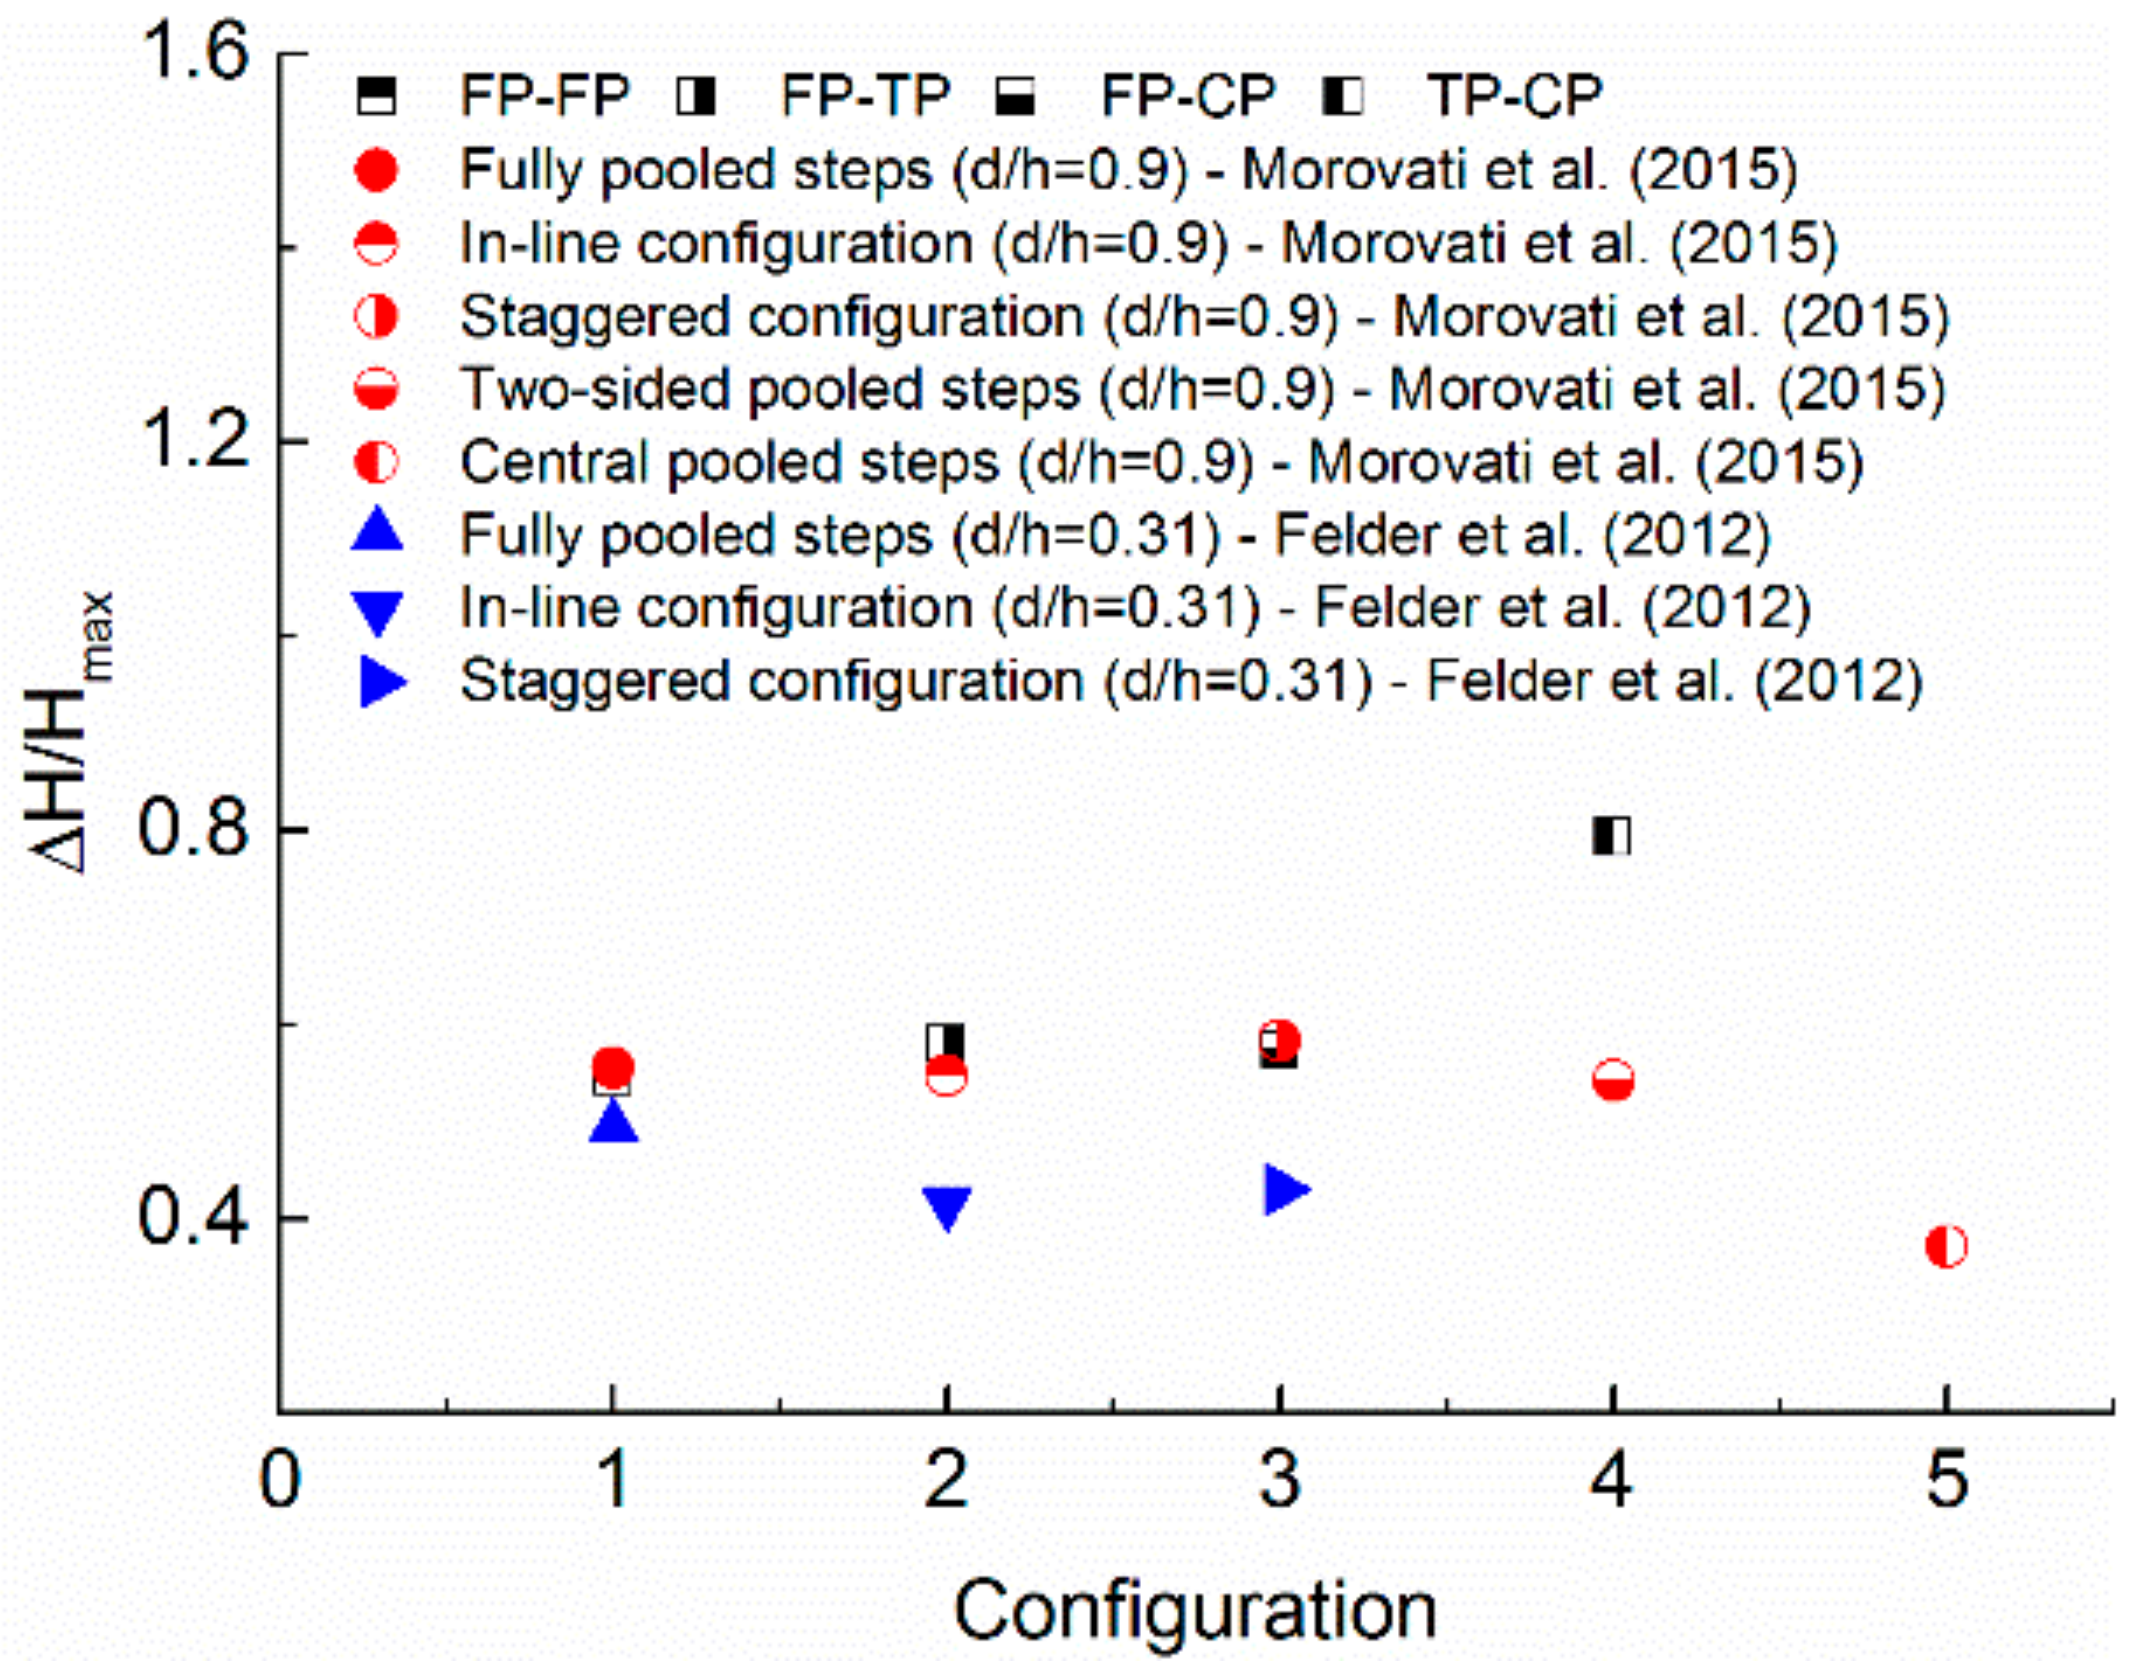
For the conservation of the downstream hydraulic structures, it is critical to quantify the residual head at the downstream of the spillway and the relative energy dissipation rate over the stepped spillway. The residual head, , at the last pool weir can be estimated through the following equation:
where is the equivalent clear water depth, represents the channel slope, and indicate the flow velocity and the pool weir height, respectively.
Together with the previous studies in Table 2, the dimensionless residual head, , is shown in Figure 15. The flow discharge of the studies in Table 2 was the same and the flow regime was skimming flow. The residual energy in FP-FP configuration between the present work and the study of Morovati et al. [29] showed little difference, indicating the accuracy of the simulation. For configuration 1~3, the residual head showed no significant change for a given pool height, but the residual data increased with the decrease in pool height. In addition, the residual energy for the spillway with the combination of two-sided pooled steps and central pooled steps (TP-CP) decreased significantly compared with the spillway with only two-sided pooled steps or central pooled steps.
The energy dissipation rate, , is an important indicator to evaluate the relative energy loss from the start to the end of the stepped spillway. The energy dissipation rate is given as:
where represents the dam height. The rate of energy dissipation is presented in Figure 16. It can be seen that TP-CP showed the best energy dissipation performance compared with other configurations, and the energy dissipation rate for TP-CP was almost 1.5 times larger than that of FP-FP, but no obvious change can be observed in FP-FP, FP-TP and FP-CP. That is because there were more turbulent structures in TP-CP caused by the concave-convex pool weirs, leading to greater momentum change between the overlaying flow and the vortex flow, thus creating more energy loss.
4. Conclusions
In the present study, four types of pooled stepped spillway with different pool weirs were numerically investigated by using RNG turbulence model with VOF method. The numerical results agreed well with the experimental data from Felder et al. [32] and the following conclusions can be drawn:
- The flow pattern in FP-FP presented no significant change in the transverse direction and was similar on different steps. But changing half of the fully pooled steps into partially pooled steps (two-sided pooled or central pooled) can result in three dimensional flow motion. In FP-TP, the maximum vortex intensity on the fully pooled steps and partially pooled steps occurred at the axial plane and sidewalls, respectively, while the opposite phenomenon can be seen in FP-CP. When replacing all the fully pooled steps by staggered configuration of two-sided pooled and central pooled steps (TP-CP), the flow was characterized by highly three dimensional motion, and the vortex development in the transverse direction showed a unique pattern with the maximum intensity of vortex occurring at Z/W = 0.25. Besides, TP-CP created more flow instabilities and turbulent structures.
- The velocity distributions over the steps in FP-FP highlighted the similar pattern with the minimum and maximum values occurring at y/ymax = 0.3 and 0.9, respectively. In FP-TP, FP-CP and TP-CP, the velocity distributions on the odd-number steps was different from that of the even-number steps, but the maximum velocity in all configurations indicated no difference. In the transverse direction, the velocity distribution in FP-FP showed the smallest variation, while TP-CP presented the greatest change.
- The pressure on the horizontal step surfaces of FP-FP, FP-TP and FP-CP showed U-shaped variations with the maximum pressures occurring at the downstream end of the step surface, and TP-CP highlighted the greatest pressure fluctuation in both streamwise and transverse direction. The pressure distribution patterns on the fully pooled steps in FP-TP and on the central pooled steps in FP-CP were similar; the pressure distributions on the two-sided pooled steps in FP-TP and on the fully pooled steps in FP-CP demonstrated the similar patterns. For the vertical steps, the maximum pressures on odd-number step surfaces were in the following order: FP-CP > TP-CP > FP-TP > FP-FP, while for the even-number steps, it was TP-CP > FP-FP > FP-TP > FP-CP. There was no negative pressure on the step surfaces.
- From the largest to the smallest, the energy dissipation rates were in the following order: TP-CP > FP-CP > FP-TP > FP-FP. Specifically, the energy loss for FP-TP and FP-CP was quite close, but slightly higher than FP-FP, and the energy dissipation rate for TP-CP was 1.5 times larger than FP-FP. Thus, changing half of the fully pooled steps into central pooled or two-sided pooled steps presented no obvious effect on the energy dissipation ratio, while shifting all the fully pooled steps into the combination of central pooled and two-sided pooled steps can significantly improve the energy dissipation performance.
Author Contributions
Conceptualization, S.L.; Methodology, S.L.; Software, S.L.; Formal Analysis, S.L.; Investigation, S.L.; Writing-Original Draft Preparation, S.L.; Writing-Review & Editing, J.Z.; Supervision, J.Z.; Project administration, J.Z.; Funding acquisition, J.Z.
Funding
This research was funded by the National Key Research and Development Program of China (No. 2016YFC0401707), National Natural Science Foundation of China (No. 51579165), and National Science Fund for Distinguished Young Scholars (No. 51625901).
Conflicts of Interest
The authors declare no conflict of interest.
References
- Boes, R.M.; Hager, W.H. Hydraulic design of stepped spillways. J. Hydraul. Eng. 2002, 129, 671–679. [Google Scholar] [CrossRef]
- Chanson, H. Hydraulic Design of stepped spillways and downstream energy dissipators. Dam Eng. 2001, 11, 205–242. [Google Scholar]
- Chanson, H.; Luke, T. Hydraulics of stepped chutes: The transition flow. J. Hydraul. Res. 2004, 42, 43–54. [Google Scholar] [CrossRef] [Green Version]
- Chanson, H.; Toombes, L. Experimental investigations of air entrainment in transition and skimming flows down a stepped chute. Can. J. Civ. Eng. 2002, 29, 145–156. [Google Scholar] [CrossRef] [Green Version]
- Felder, S.; Chanson, H. Turbulence, dynamic similarity and scale effects in high-velocity free-surface flows above a stepped chute. Exp. Fluids 2009, 47, 1–18. [Google Scholar] [CrossRef] [Green Version]
- Wang, J.; Fu, L.; Xu, H.; Jin, Y. Numerical study on flow over stepped spillway using Lagrangian method. In Proceedings of the International Conference on Energy Engineering and Environmental Protection, Sanya, China, 20–22 November 2017. [Google Scholar]
- Felder, S. Air-Water Flow Properties on Stepped Spillways for Embankment Dams: Aeration, Energy Dissipation and Turbulence on Uniform, Non-Uniform and Pooled Stepped Chutes. Ph.D. Thesis, University of Queensland, Brisbane, Australia, 2013. [Google Scholar]
- Felder, S.; Chanson, H. Energy dissipation down a stepped spillway with non-uniform step heights. J. Hydraul. Eng. 2011, 137, 1543–1548. [Google Scholar] [CrossRef]
- Felder, S.; Chanson, H. Aeration, flow instabilities, and residual energy on pooled stepped spillways of embankment dams. J. Irrig. Drain. Eng. 2013, 139, 880–887. [Google Scholar] [CrossRef]
- Zhang, J.M.; Chen, J.G.; Wang, Y.R. Experimental study on time-averaged pressures in stepped spillway. J. Hydraul. Res. 2012, 50, 236–240. [Google Scholar] [CrossRef]
- Zhang, G.; Chanson, H. Effects of step and cavity shapes on aeration and energy dissipation performances of stepped chutes. J. Hydraul. Eng. 2018, 144, 04018060. [Google Scholar] [CrossRef]
- Peng, Y.; Zhou, J.G.; Burrows, R. Modelling the free surface flow in rectangular shallow basins by lattice Boltzmann method. J. Hydraul. Eng. 2011, 137, 1680–1685. [Google Scholar] [CrossRef]
- Peng, Y.; Zhou, J.G.; Burrows, R. Modelling solute transport in shallow water with the lattice Boltzmann method. Comput. Fluids 2011, 50, 181–188. [Google Scholar] [CrossRef]
- Peng, Y.; Mao, Y.F.; Wang, B.; Xie, B. Study on C-S and P-R EOS in pseudo-potential lattice Boltzmann model for two-phase flows. Int. J. Mod. Phys. C 2017, 28, 1750120. [Google Scholar] [CrossRef]
- Peng, Y.; Wang, B.; Mao, Y.F. Study on force schemes in pseudopotential lattice Boltzmann model for two-phase flows. Math. Probl. Eng. 2018, 6496379. [Google Scholar] [CrossRef]
- Baylar, A.; Unsal, M.; Ozkan, F. The effect of flow patterns and energy dissipation over stepped chutes on aeration efficiency. KSCE J. Civ. Eng. 2011, 15, 1329–1334. [Google Scholar] [CrossRef]
- Dong; Zhi-yong; Joseph; Hun-wei. Numerical simulation of skimming flow over mild stepped channel. J. Hydrodyn. 2006, 18, 367–371. [Google Scholar] [CrossRef]
- Zhenwei, M.U.; Zhang, Z.; Zhao, T. Numerical simulation of 3-D flow field of spillway based on VOF method. Procedia Eng. 2012, 28, 808–812. [Google Scholar] [CrossRef]
- Tabbara, M.; Chatila, J.; Awwad, R. Computational simulation of flow over stepped spillways. Comput. Struct. 2005, 83, 2215–2224. [Google Scholar] [CrossRef]
- André, S. High Velocity Aerated Flows on Stepped Chutes with Macro-Roughness Elements. Ph.D. Thesis, EPFL, Lausanne, Switzerland, 2004. [Google Scholar]
- Kökpinar, M.A. Flow over a stepped chute with and without macro-roughness elements. Can. J. Civ. Eng. 2004, 31, 880–891. [Google Scholar] [CrossRef]
- Thorwarth, J. Hydraulics of Pooled Stepped Spillways—Self-Induced Unsteady Flow and Energy Dissipation. Ph.D. Thesis, University of Aachen, Aachen, Germany, 2008. [Google Scholar]
- Hirt, C.W.; Nichols, B.D. Volume of fluid (VOF) method for the dynamics of free boundaries. J. Comput. Phys. 1981, 39, 201–225. [Google Scholar] [CrossRef]
- Li, X.; Wang, Y.R.; Zhang, J.M. Numerical simulation of an offset jet in bounded pool with deflection wall. Math. Probl. Eng. 2017, 2017, 1–11. [Google Scholar] [CrossRef]
- Zhang, J.M.; Chen, J.G.; Xu, W.L.; Wang, Y.R. Three-dimensional numerical simulation of aerated flows downstream sudden fall aerator expansion-in a tunnel. J. Hydrodyn. 2011, 23, 71–80. [Google Scholar] [CrossRef]
- Chen, Q.; Dai, G.; Liu, H. Volume of Fluid Model for Turbulence Numerical Simulation of Stepped Spillway Overflow. J. Hydraul. Eng. 2002, 128, 68–688. [Google Scholar] [CrossRef]
- Yakhot, V.; Orszag, S.A. Renormalization group analysis of turbulence. I. Basic theory. J. Sci. Comput. 1986, 1, 3–51. [Google Scholar] [CrossRef]
- Bai, Z.L.; Zhang, J.M. Comparison of different turbulence models for numerical simulation of pressure distribution in V-shaped stepped spillway. Math. Probl. Eng. 2017, 2017, 1–9. [Google Scholar] [CrossRef]
- Morovati, K.; Eghbalzadeh, A.; Javan, M. Numerical investigation of the configuration of the pools on the flow pattern passing over pooled stepped spillway in skimming flow regime. Acta Mech. 2015, 227, 1–14. [Google Scholar] [CrossRef]
- Carvalho, R.F.; Rui, M. Stepped spillway with hydraulic jumps: Application of a numerical model to a scale model of a conceptual prototype. J. Hydraul. Eng. 2014, 135, 615–619. [Google Scholar] [CrossRef]
- Celik, I.B.; Ghia, U.; Roache, P.J.; Freitas, C.J. Procedure of estimation and reporting of uncertainty due to discretization in CFD applications. J. Fluids Eng. 2008, 130, 078001–078004. [Google Scholar] [CrossRef]
- Felder, S.; Guenther, P.; Hubert, C. Air-Water Flow Properties and Energy Dissipation on Stepped Spillways: A Physical Study of Several Pooled Stepped Configurations; The University of Queensland: Brisbane, Australia, 2012; ISBN 9781742720555. [Google Scholar]
- Hunt, J.C.R.; Wray, A.A.; Moin, P. Eddies, streams and convergence zones in turbulent flows. In Proceedings of the Summer Program 1988; Stanford University: Stanford, CA, USA, 1988. [Google Scholar]
Figure 1.
Sketch of pooled stepped spillway configurations. (a) Fully pooled steps (FP-FP); (b) fully pooled and two-sided pooled steps (FP-TP); (c) fully pooled and central pooled steps (FP-CP); and (d) two-sided pooled and central pooled steps (TP-CP).
Figure 1.
Sketch of pooled stepped spillway configurations. (a) Fully pooled steps (FP-FP); (b) fully pooled and two-sided pooled steps (FP-TP); (c) fully pooled and central pooled steps (FP-CP); and (d) two-sided pooled and central pooled steps (TP-CP).


Figure 2.
Meshing pattern in the computational domain.

Figure 3.
Fine-grid solution with discretization error bars computed using the GCI index.

Figure 4.
Comparison of numerical and experimental data. Notes: Vc: critical flow velocity; y represents the distance normal to the pseudo-bottom formed by the pool edges with y = 0 at the pool edges.
Figure 4.
Comparison of numerical and experimental data. Notes: Vc: critical flow velocity; y represents the distance normal to the pseudo-bottom formed by the pool edges with y = 0 at the pool edges.

Figure 5.
Flow pattern at the axial plane in different configurations. (a) FP-FP; (b) FP-TP; (c) FP-CP; and (d) TP-CP.
Figure 5.
Flow pattern at the axial plane in different configurations. (a) FP-FP; (b) FP-TP; (c) FP-CP; and (d) TP-CP.

Figure 6.
Instantaneous streamlines in the transeverse direction. (a) FP-FP; (b) FP-TP; (c) FP-CP; and (d) TP-CP.
Figure 6.
Instantaneous streamlines in the transeverse direction. (a) FP-FP; (b) FP-TP; (c) FP-CP; and (d) TP-CP.

Figure 7.
Distributions of lumps of the iso-surface of Q = 100. (a) FP-FP; (b) FP-TP; (c) FP-CP; and (d) TP-CP.
Figure 7.
Distributions of lumps of the iso-surface of Q = 100. (a) FP-FP; (b) FP-TP; (c) FP-CP; and (d) TP-CP.

Figure 8.
Velocity vectors at the axial plane. (a) FP-FP; (b) FP-TP; (c) FP-CP; and (d) TP-CP.

Figure 9.
Velocity distributions above the step surfaces in each configuration. (a) Z/W = 0.5; and (b) Z/W = 0.25.
Figure 9.
Velocity distributions above the step surfaces in each configuration. (a) Z/W = 0.5; and (b) Z/W = 0.25.

Figure 10.
Velocity countour maps at the cross-sections. (a) X = 1.91 m; and (b) X = 2.11 m.


Figure 11.
Pressure distributions on the horizontal step surfaces. (a) Step 6; (b) Step 7.


Figure 12.
Pressure distributions on the vertical step surfaces. (a) Step 6; and (b) Step 7.


Figure 13.
Pressure distributions on horizontal step surfaces in the transverse direction.


Figure 14.
Pressure distributions on vertical step surfaces in the transverse direction.

Figure 15.
Residual energy at the downstream end of the spillway.

Figure 16.
Energy dissipation rate.


Table 1.
Constants of governing equations.
| 438 | |
| 0.012 | |
| 0.085 | |
| 1.68 | |
| 0.7179 | |
| 0.7179 |
Table 2.
Summary of the pooled stepped spillways in previous and present studies.
| Reference | Step Geometry |
|---|---|
| Morovati et al. [29] | Fully pooled steps: h = 0.1 m, l = 0.2 m, d = 0.09 m |
| In-line configuration (pooled and flat steps in-line): h = 0.1 m, l = 0.2 m, d = 0.09 m | |
| Staggered configuration (pooled and flat steps staggered): h = 0.1 m, l = 0.2 m, d = 0.09 m | |
| Two-sided pooled steps: h = 0.1 m, l = 0.2 m, d = 0.09 m | |
| Central-pooled steps: h = 0.1 m, l = 0.2 m, d = 0.09 m | |
| Felder et al. [32] | Fully pooled steps: h = 0.1 m, l = 0.2 m, d = 0.031 m |
| In-line configuration (pooled and flat steps in-line): h = 0.1 m, l = 0.2 m, d = 0.031 m | |
| Staggered configuration (pooled and flat steps staggered): h = 0.1 m, l = 0.2 m, d = 0.031 m | |
| Present study | FP-FP: h = 0.1 m, l = 0.2 m, d = 0.09 m |
| FP-TP: h = 0.1 m, l = 0.2 m, d = 0.09 m | |
| FP-CP: h = 0.1 m, l = 0.2 m, d = 0.09 m | |
| TP-CP: h = 0.1 m, l = 0.2 m, d = 0.09 m |
© 2018 by the authors. Licensee MDPI, Basel, Switzerland. This article is an open access article distributed under the terms and conditions of the Creative Commons Attribution (CC BY) license (http://creativecommons.org/licenses/by/4.0/).
Share and Cite
MDPI and ACS Style
Li, S.; Zhang, J. Numerical Investigation on the Hydraulic Properties of the Skimming Flow over Pooled Stepped Spillway. Water 2018, 10, 1478. https://doi.org/10.3390/w10101478
AMA Style
Li S, Zhang J. Numerical Investigation on the Hydraulic Properties of the Skimming Flow over Pooled Stepped Spillway. Water. 2018; 10(10):1478. https://doi.org/10.3390/w10101478
Chicago/Turabian StyleLi, Shicheng, and Jianmin Zhang. 2018. "Numerical Investigation on the Hydraulic Properties of the Skimming Flow over Pooled Stepped Spillway" Water 10, no. 10: 1478. https://doi.org/10.3390/w10101478
Note that from the first issue of 2016, this journal uses article numbers instead of page numbers. See further details here.