Validation of ECMWF Multi-Layer Reanalysis Soil Moisture Based on the OzNet Hydrology Network


1
Guangzhou Institute of Geography, Guangzhou 510000, China
2
Key Laboratory of Guangdong for Utilization of Remote Sensing and Geographical Information System, Guangzhou 510000, China
3
Guangdong Open Laboratory of Geospatial Information Technology and Application, Guangzhou 510000, China
4
State Key Laboratory of Resources and Environmental Information System, Institute of Geographic Sciences and Natural Resources Research, Chinese Academy of Sciences, Beijing 100000, China
5
Jiangsu Center for Collaborative Innovation in Geographical Information Resource Development and Application, Nanjing Normal University, Nanjing 210000, China
*
Author to whom correspondence should be addressed.
Water 2018, 10(9), 1123; https://doi.org/10.3390/w10091123
Submission received: 5 August 2018
/
Accepted: 21 August 2018
/
Published: 23 August 2018
(This article belongs to the Section Hydrology)
Abstract
:Soil moisture reanalysis products can provide soil water information for the surface and root zone soil layers, which are significant for understanding the water cycle and climate change. However, the accuracy of multi-layer soil moisture datasets obtained from reanalysis products remains unclear in some areas. In this study, we evaluated the root zone soil moisture of the ERA-Interim soil moisture product, as well as the surface soil moisture based on in situ measurements from the OzNet hydrological measurement network over southeast Australia. In general, the ERA-Interim soil moisture product presents good agreement with in situ soil moisture values and can nicely reflect time variations, with correlation coefficient (R) values in the range of 0.73 to 0.84 and unbiased root mean square difference (ubRMSD) values from 0.035 m3·m−3 to 0.060 m3·m−3. Although the ERA-Interim soil moisture also can reflect temporal dynamics of soil moisture at root zone layer at depths of 28–100 cm, low correlations were found in winter. In addition, the ERA-Interim soil moisture product overestimates in situ measurements at depths of 0–7 cm and 7–28 cm, whereas the product shows underestimated values compared with in situ soil moisture at the root zone of 28–100 cm. Consequently, the ERA-Interim soil moisture product has both high absolute and temporal accuracy at depths of 7–28 cm, and the ERA-Interim soil moisture product can nicely capture temporal dynamics at all the evaluated soil level depths, except for the depth of 28–100 cm during the winter months. The contributions of terrain, vegetation cover, and soil texture to the model error were addressed by feature importance estimations using the random forest (RF) algorithm. Results indicate that terrain features may have an impact on the model errors. It is clear that the accuracy of the ERA-Interim soil moisture can be improved by adjusting the assimilation scheme, and the results of this study are expected to provide a comprehensive understanding of the model errors and references for optimizing the model.
1. Introduction
Soil acts as an important container for water on Earth [1]. Soil water plays a significant role in the water cycle, and is a key medium between precipitation, vegetation water, and underground water [2]. The measurement of soil water content is helpful for our understanding of the global water cycle, as well as the occurrence and development of flooding and drought disasters [3,4,5]. In addition, the soil water is a key variable in various hydrological and surface runoff models. Therefore, soil moisture datasets are urgently needed in multiple hydrological applications and climatic studies [6].
In recent decades, satellite remote sensing has provided innovation in observational approaches of soil moisture, making global observations of soil moisture possible at high temporal resolutions [7,8,9,10,11,12]. Microwave sensors onboard satellites have been the main sources for the retrieval of soil moisture because of the penetration capacity of microwave signals and the sensitivity of backscatter to the soil dielectric constant [13,14]. However, because of the effects of radio frequency interference and the influence of vegetation signals, great uncertainties and data gaps exist in some areas [15,16,17]. Additionally, microwave sensors can only provide information about the surface soil layer, while the root zone soil moisture is the main variable of interest for applications such as meteorological modelling and hydrological studies [18,19,20].
The ERA-Interim is the latest global atmospheric reanalysis product, and was produced using a sequential data assimilation scheme by the European Centre for Medium-Range Weather Forecasts (ECMWF), and ERA stands for ‘ECMWF Re-Analysis’ and refers to a series of research projects at ECMWF [21]. In the data assimilation system of ERA-Interim, available observations are combined with prior information from a forecast model to estimate the evolving state of the global atmosphere and its underlying surface [22]. The model estimates a wide variety of physical parameters such as precipitation, turbulent fluxes, radiation fields, soil moisture, etc. The ERA-Interim reanalysis product provides soil moisture information at four different soil level depths (0–7 cm, 7–28 cm, 28–100 cm, and 100–289 cm). Thus, spatially continuous root zone soil moisture can be obtained from the ERA-Interim reanalysis product, as well as the surface layer soil moisture.
Validation and evaluation for the satellite-based and reanalysis soil moisture products have been widely carried out [23,24,25,26,27,28,29,30]. The results showed the ERA-Interim reanalysis soil moisture product not only captured the variation of in situ surface soil moisture well but also provided close absolute values of the soil moisture observations of surface soil [26,31,32]. Therefore, the reanalysis products are usually regarded as equivalent to observations because reanalysis represents available observations. However, this is not always justifiable because there are large uncertainties which are always very difficult to quantify in the empirical approach and interpolation schemes to analyze observations in the assimilation system [21]. In addition, current evaluations were conducted mainly for the soil moisture products at the surface layer; the performance of root zone ERA-Interim soil moisture is still unclear in some areas. Although validations of the ECWMF soil moisture reanalysis have been conducted at different soil depths [33], further in-depth discussions on the impacts of topography, vegetation cover, and soil types are still urgently needed. Considering the water content and the temporal varies in different soil layers [34,35], the evaluation of soil moisture in deeper soil layers, combined with the influencing factors analysis, are significant for the comprehensive understating of the performance of reanalysis soil moisture at different root-zone soil layer.
The objective of this paper is to investigate the ERA-Interim soil moisture product at different soil layers based on the in situ monitoring network. The ERA-Interim soil moisture at depths of 0–7 cm, 7–28 cm, and 28–100 cm were validated against the in situ soil moisture from the OzNet hydrological network in Australia. Consequently, this comprehensive comparison of different soil layers aims to provide an understanding of how well the ERA-Interim soil moisture product performs at different soil level depths, and try to identify the capacity of the ERA-Interim soil moisture for capturing the soil moisture time variations under the conditions of the OzNet hydrological network.
2. Data Resources and Method
2.1. Study Area and in Situ Measurements
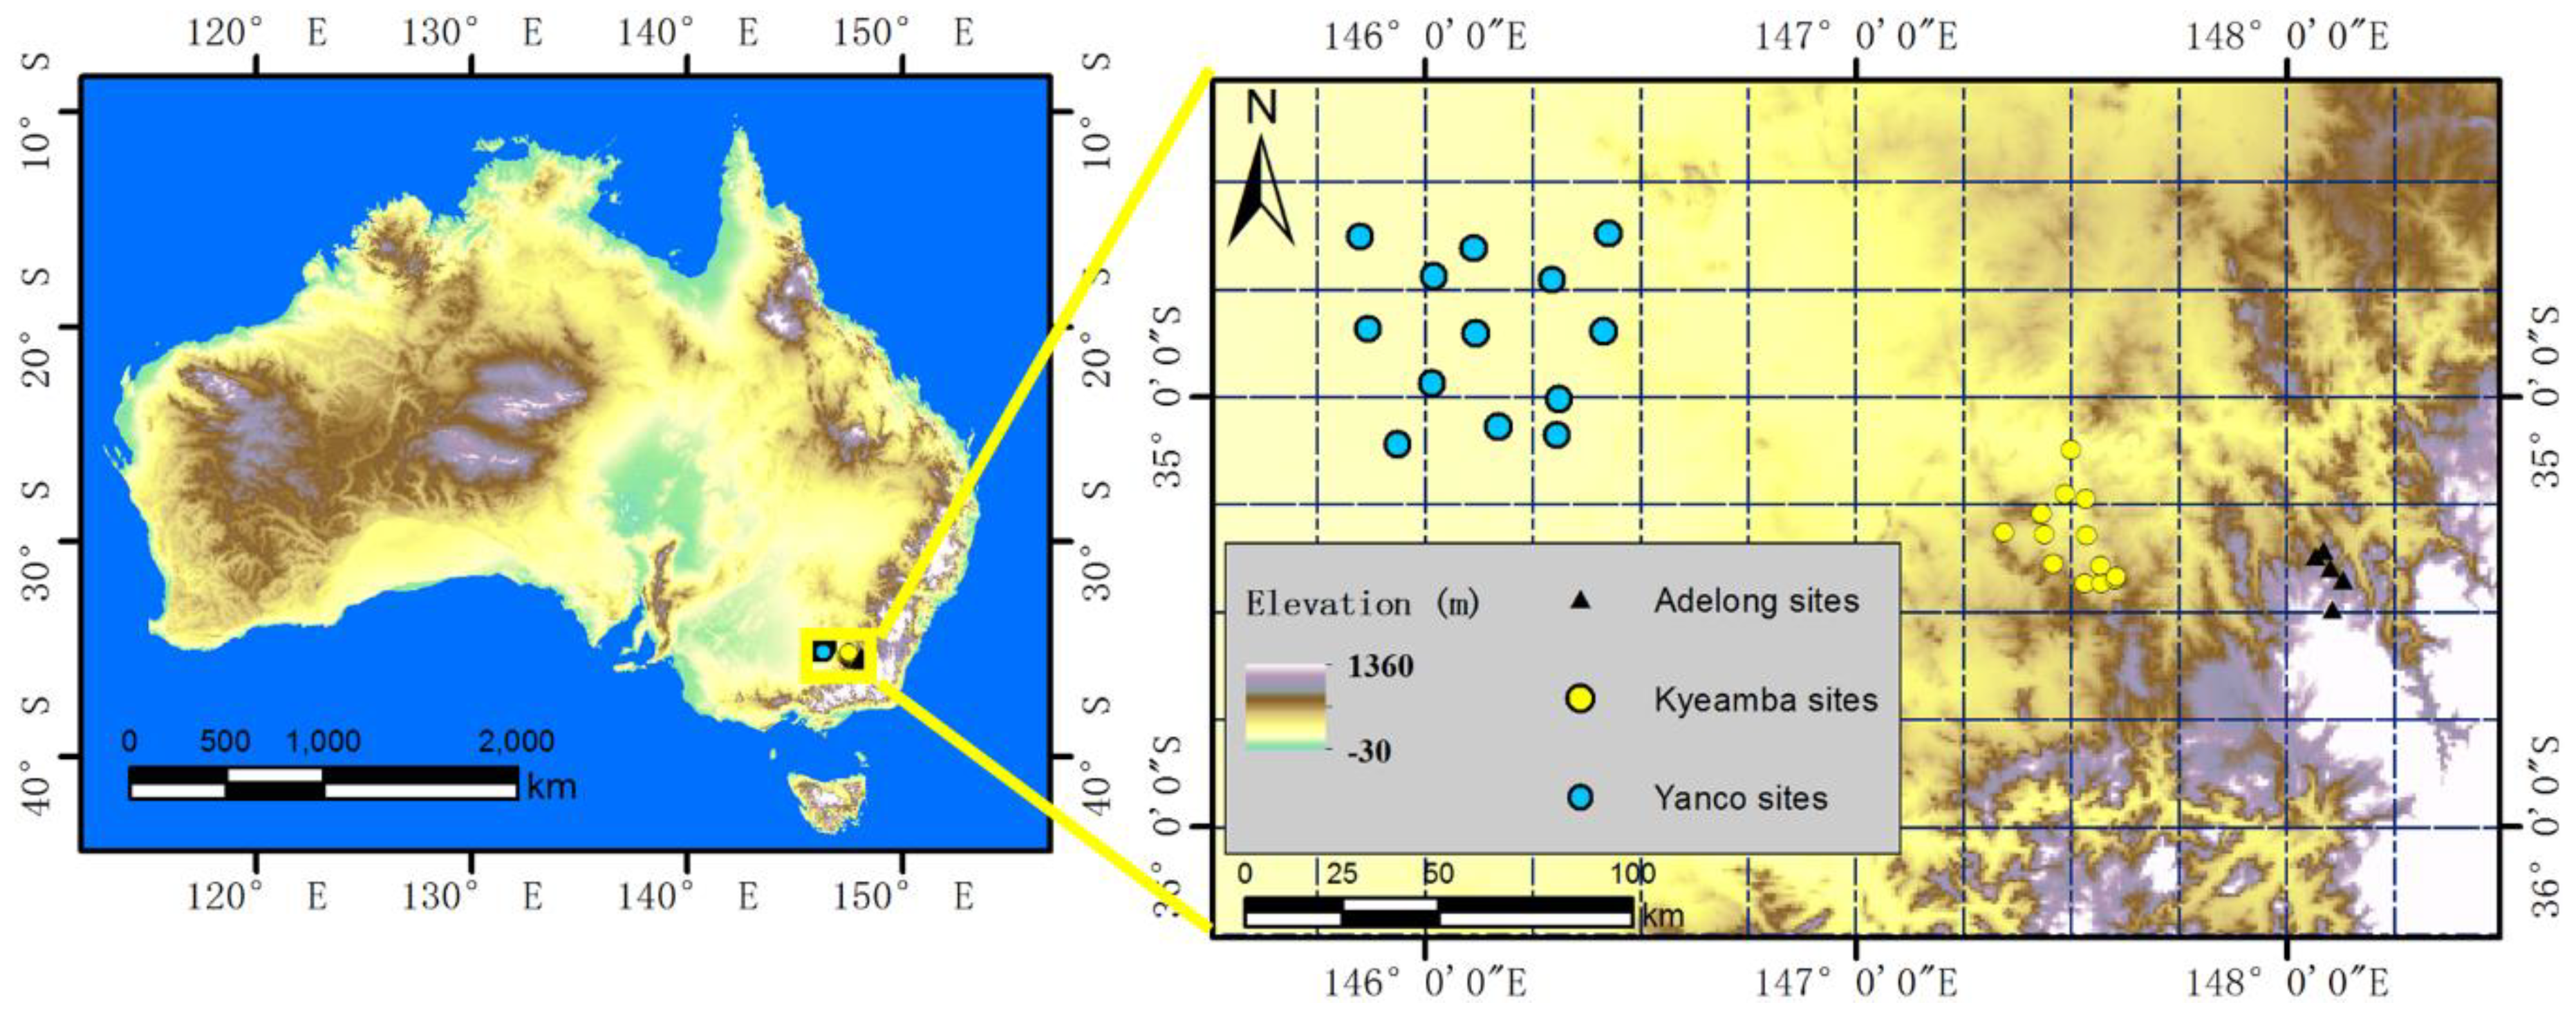
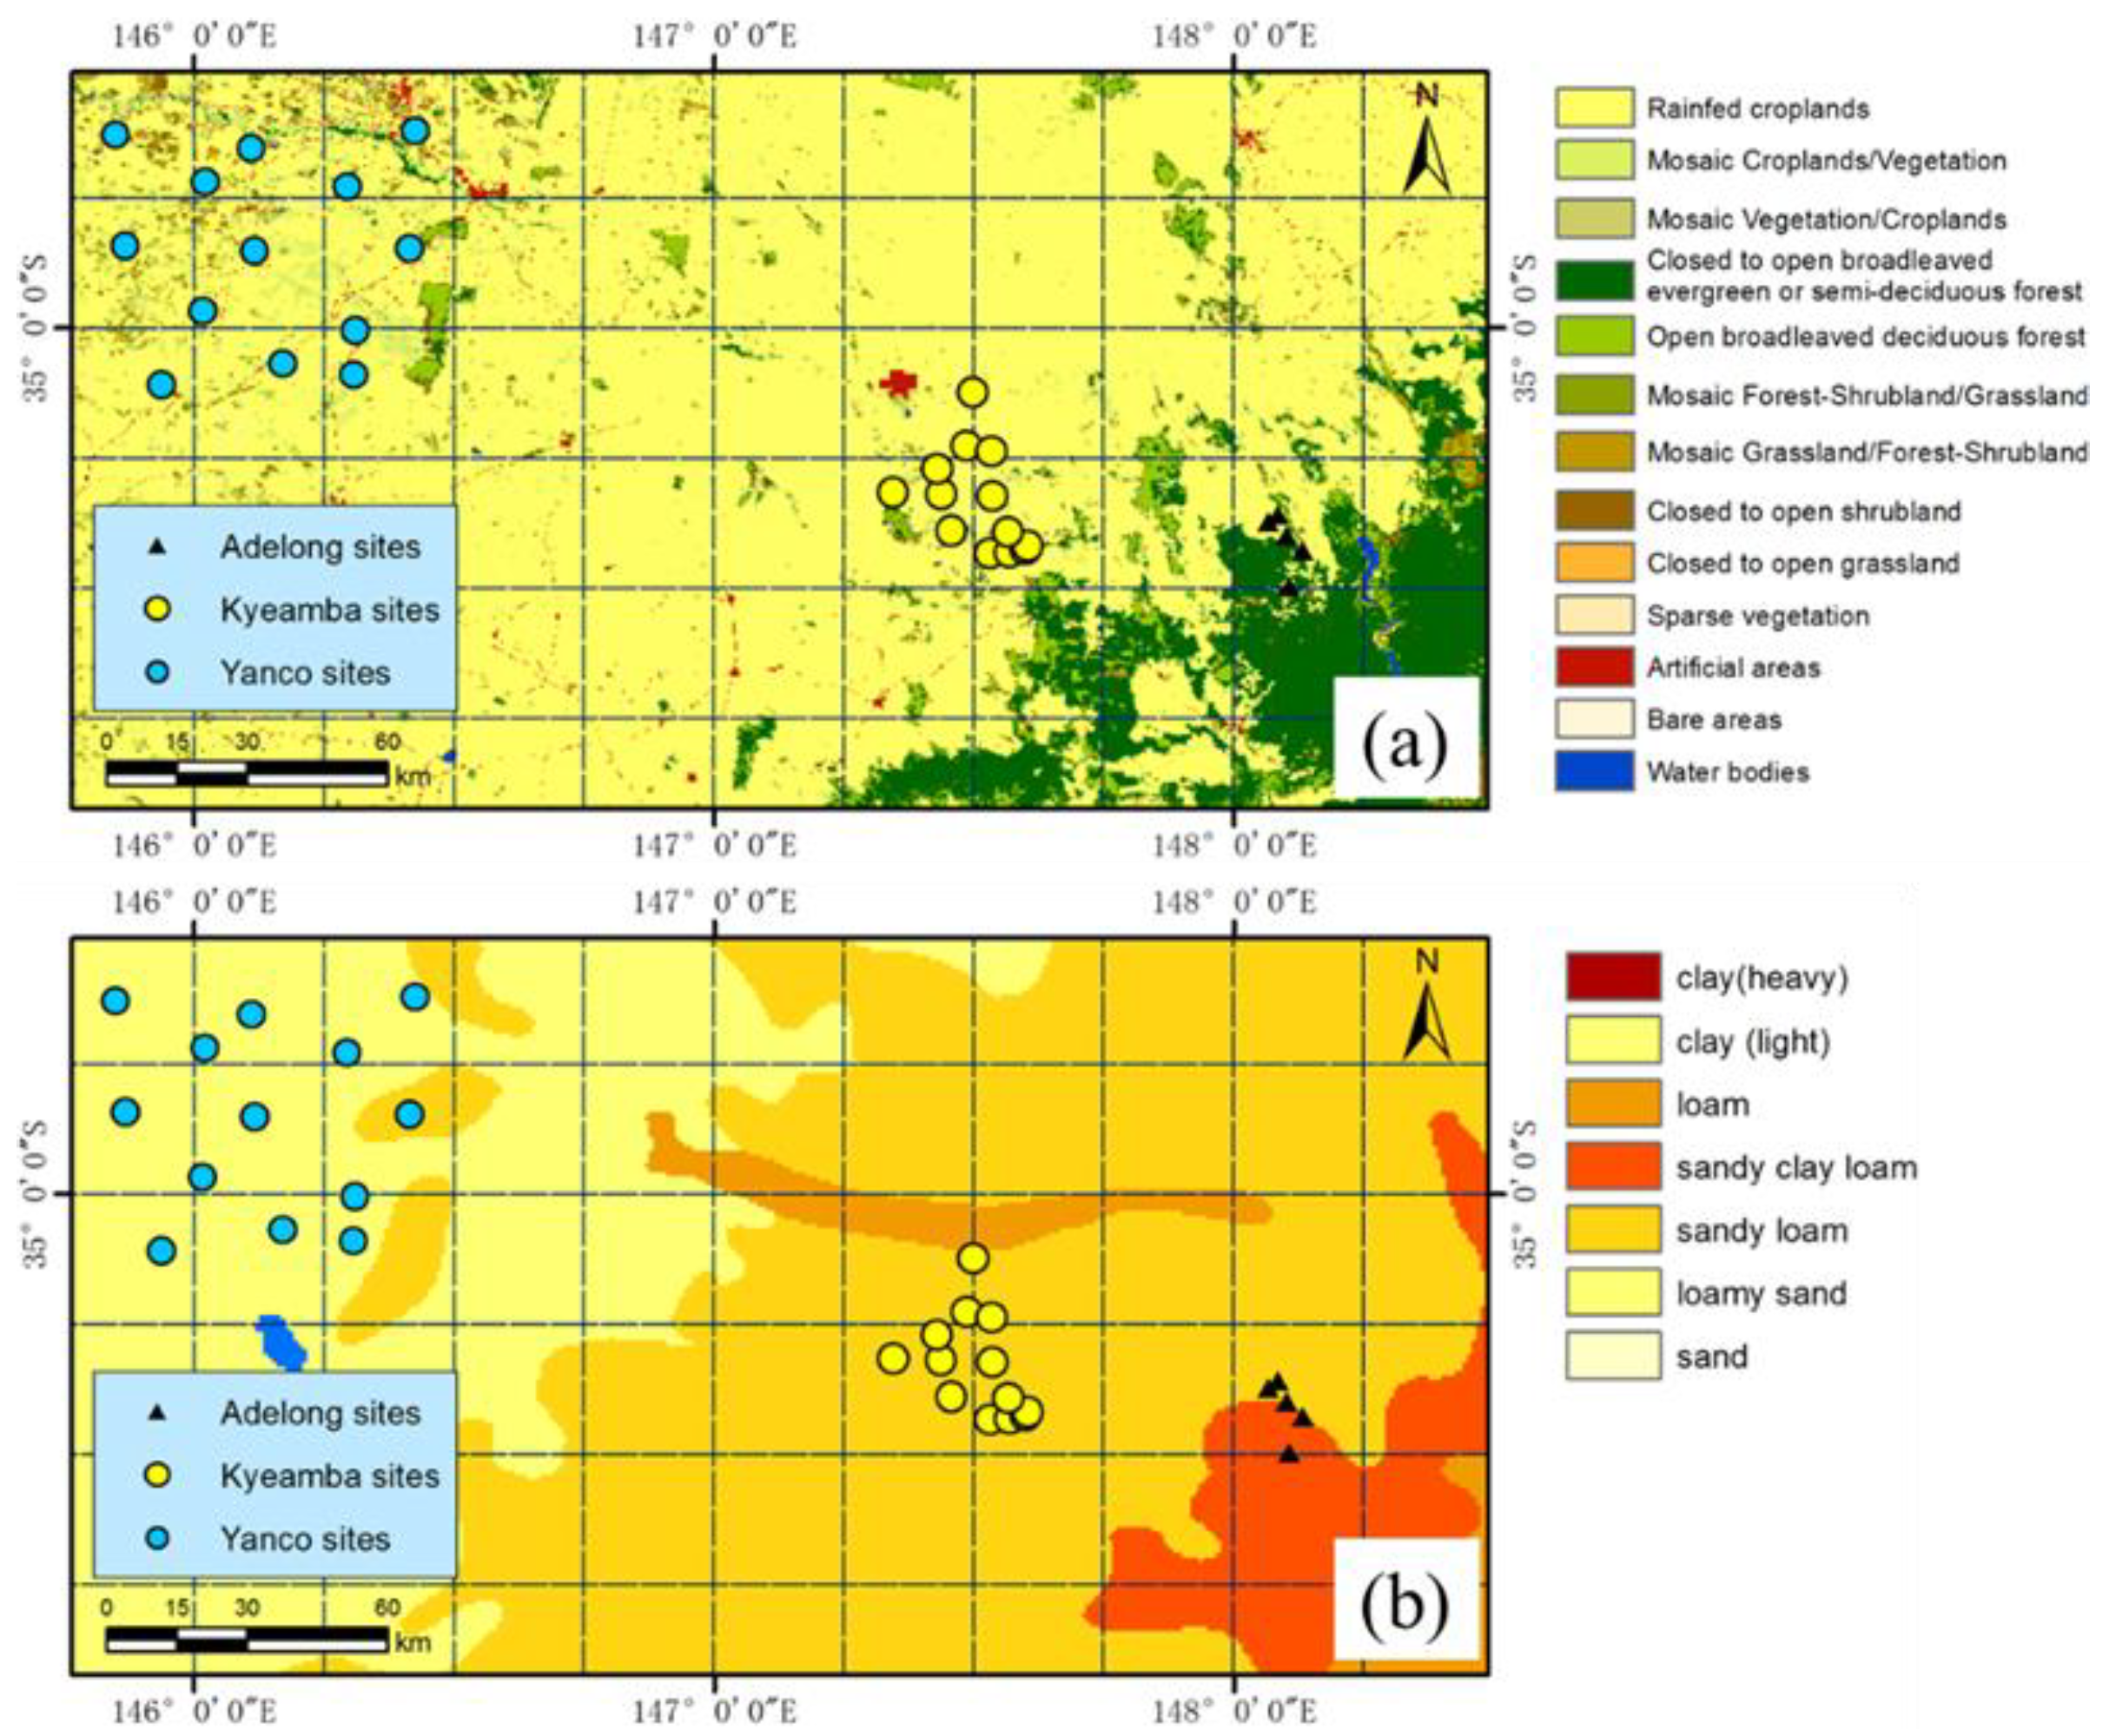
We used in situ soil moisture measurements from OzNet hydrological network over southeast Australia. The network is located in Murrumbidgee River Catchment in southern New South Wales, Australia [36]. The Murrumbidgee Catchment represents a range of conditions typical of much of temperate Australia, with a climate ranging from semiarid to humid. We used three subareas in the OzNet network for validation. These three subareas are at different scales: the Adelong subarea is at a scale of about 0.25° and includes five in situ sites; the Kyeamba subarea is at a scale of 0.5° and there are 12 in situ sites in the network; and the Yanco subarea is at a scale fo 0.75° and includes 13 in situ sites. The spatial distribution of the three subareas is shown in Figure 1. The OzNet hydrological measurement network measures soil moisture at four different soil layer depths: 0–5 cm or 0–8 cm, 0–30 cm, 30–60 cm, and 60–90 cm. The original measurements were provided at 20- or 30-minute intervals; daily soil moisture data were calculated by resampling the sub-hourly data to daily using the average method.
2.2. Soil Moisture Data from ERA-Iterim
The ERA-Interim is a global atmospheric reanalysis product produced by the European Centre for Medium-Range Weather Forecasts (ECMWF). The product is based on a data assimilation system that includes a four-dimensional variational analysis (4D-Var) with a 12-h analysis window [21,37,38]. The ERA-Interim soil moisture product uses soil depths at four levels (0–7 cm, 7–28 cm, 28–100 cm, and 100–289 cm). In this study, we evaluated layers 1–3 of daily averaged ERA-Interim soil moisture product from 2008 to 2012. The products were acquired at spatial resolution of 0.25° × 0.25° from the data access website of the ECMWF (http://apps.ecmwf.int/datasets/data/interim-full-daily).
2.3. Method
The ERA-Interim (ERA) soil moisture dataset includes four soil depths. Although the OzNet network also measures in soil water content at four depths, there exist inconsistencies between the soil layer depths of the two datasets. The in situ soil moisture measures at 0–5 cm or 0–8 cm were used to validate the top layer of ERA soil moisture (0–7 cm), and the soil moisture values at 0–30 cm were used to validate the second layer of ERA soil moisture (7–28 cm). The in situ observed soil moisture values at depths of 30–60 cm and 60–90 cm were averaged to obtain average soil moisture at a depth of 30–90 cm, which is basically consistent with the third layer of ERA soil moisture (28–100 cm). The fourth layer of ERA soil moisture was not validated because of the lack of in situ measurements in the corresponding depth. The corresponding relationship of the two datasets is shown in Table 1.
The validation was conducted at both the individual site and the subarea-average scale. The ERA soil moisture was directly validated against the in situ soil moisture at each site. In addition, the in situ soil moisture values at each subarea (Adelong, Kyeamba, and Yancon) were averaged for each layer. The average in situ soil moisture were implemented to validate the average soil moisture in the corresponding subarea. Four error metrics were utilized for validation of the ERA soil moisture, which are the correlation coefficient (R), root mean square error (RMSE), unbiased root mean square difference (ubRMSD), and bias. The expressions of these error metrics are shown as follows:
where is the in situ soil moisture measured by site i, is the soil moisture estimated by the ERA product at the location of site i; is the mean value of all sites’ observations, and is the mean value of the estimated soil moisture at all the locations of sites. The seasonal performance of the ERA soil moisture were also evaluated according to the local season division over the study area, where September to November belongs to spring, March to May is autumn, the winter is from June to August, and the summer includes December, January, and February.
3. Results and Discussion
3.1. Performance of ERA-Iterim Soil Moisure at Each Network
3.1.1. Adelong
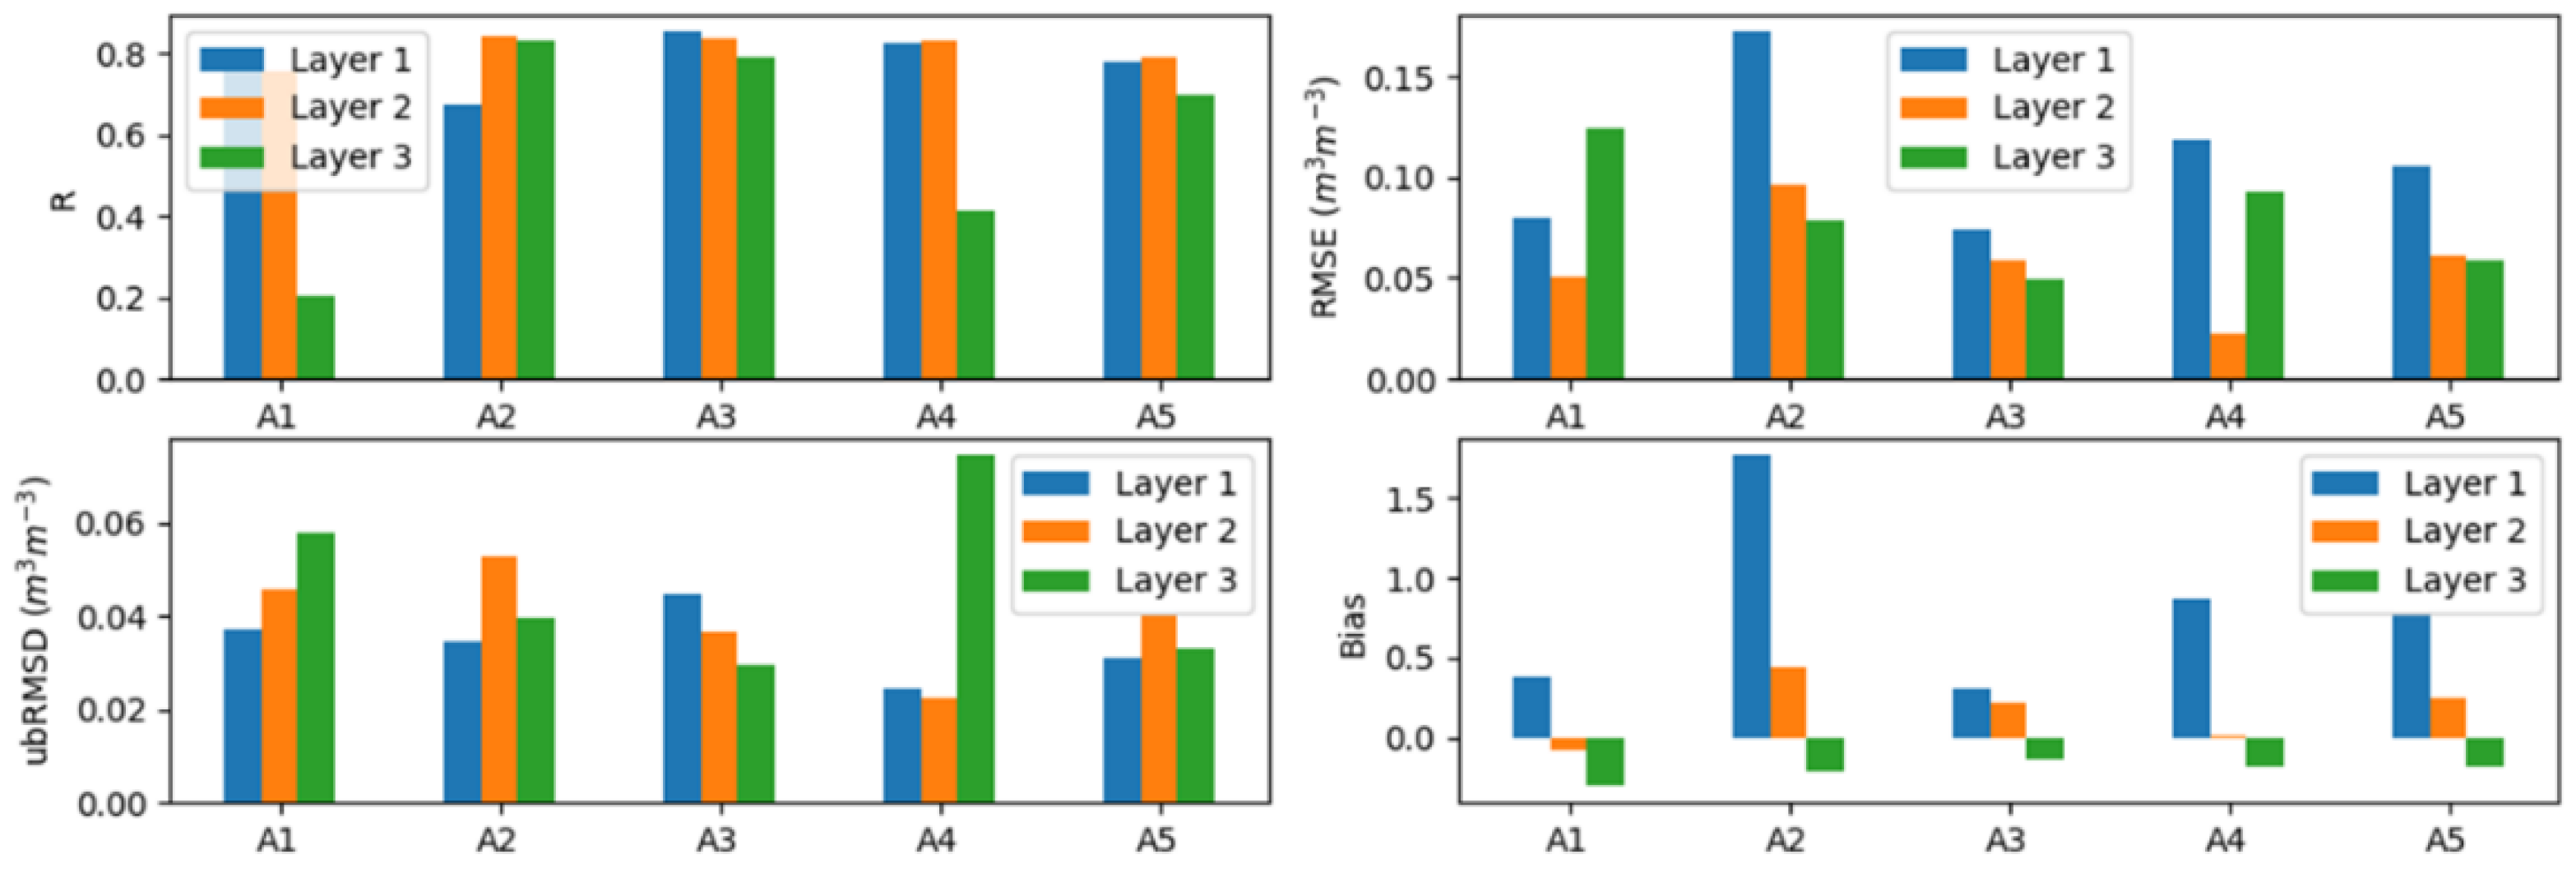
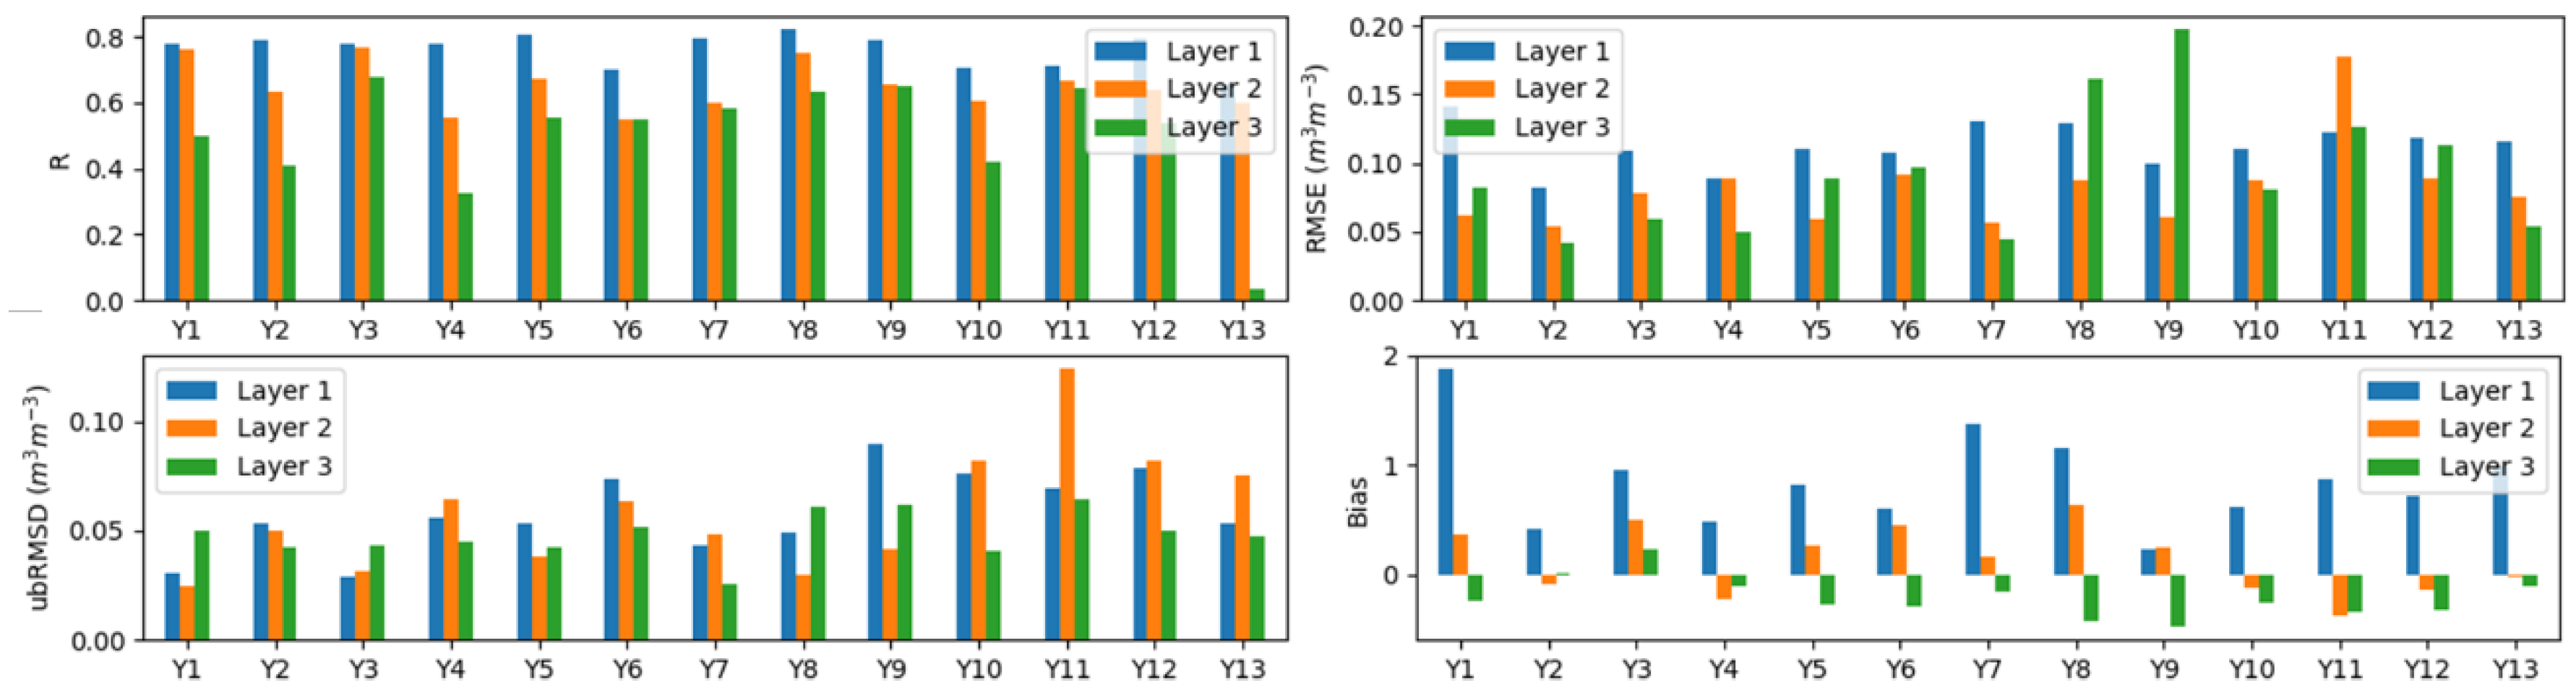
The Adelong subarea includes five sites. The land cover type and latitude/longitude for each individual site are shown in Table 2. Figure 2 shows comparison of the R, RMSE, ubRMSD, and bias of different layers at each site. As can be seen from Figure 2, the ERA soil moisture has comparable correlations at three layers, except for the A1 and A4 site. Layer 1 of the ERA (ERA/LYR1) soil moisture generally produces higher RMSE and bias than layer 2 (ERA/LYR2) and layer 3 (ERA/LYR3) against the in situ soil moisture at each individual site. However, the ubRMSD value of ERA layer 1 soil moisture is in general lower than for the other two layers at each site, ranging from 0.02 to 0.04 m3·m−3. Additionally, ERA/LYR1 apparently overestimates in situ soil moisture at individual sites in Adelong, whereas ERA/LYR3 underestimates in situ soil moisture, with negative bias values at each site. ERA/LYR3 also overestimates in situ measurements but with lower bias values than those of ERA/LYR1.
Table 3 shows the error metrics of subarea average for different seasons at three soil layers. As can be seen from Table 3, ERA/LYR1 and ERA/LYR2 have higher correlations with in situ soil moisture. ERA/LYR2 soil moisture shows the best performance compared with the soil moisture data of other layers, with the highest R value (0.816) and the lowest RMSE (0.04 m3·m−3), ubRMSD (0.035 m3·m−3), and bias (0.081). ERA/LYR1 soil moisture also has high correlations with in situ measurements (R = 0.727), but the bias is also the highest among three layers (bias = 0.627). This indicates that ERA/LYR1 soil moisture highly overestimates soil moisture at the top soil layer at Adelong subarea. In addition, ERA/LYR3 performs more poorly than the ERA/LYR1 and ERA/LYR2 for soil moisture, and tends to underestimate the in situ soil moisture.
Comparing the seasonal performance, the ERA soil moisture produces best correlations with in situ soil moisture in summer at layer 1 and layer 2, but also produces higher bias values. The ERA soil moisture in autumn at layer 1 and layer 2 performs the most poorly when compared with other seasons. In winter, the ERA soil moisture produces the lowest RMSE, ubRMSD, and bias values. In addition, the ubRMSDs of ERA/LYR1 and ERA/LYR2 range between 0.022 and 0.039 m3·m−3, and ERA/LYR2 tends to underestimate in situ soil moisture, with negative bias values. In other seasons, the ERA/LYR1 and ERA/LYR2 all overestimate in situ moisture. For ERA/LYR3, the correlation coefficients of spring, summer, autumn, and winter are 0.623, 0.76, 0.749, and 0.045, respectively. The ERA/LYR3 soil moisture shows the worst correlation with in situ measurements in winter.
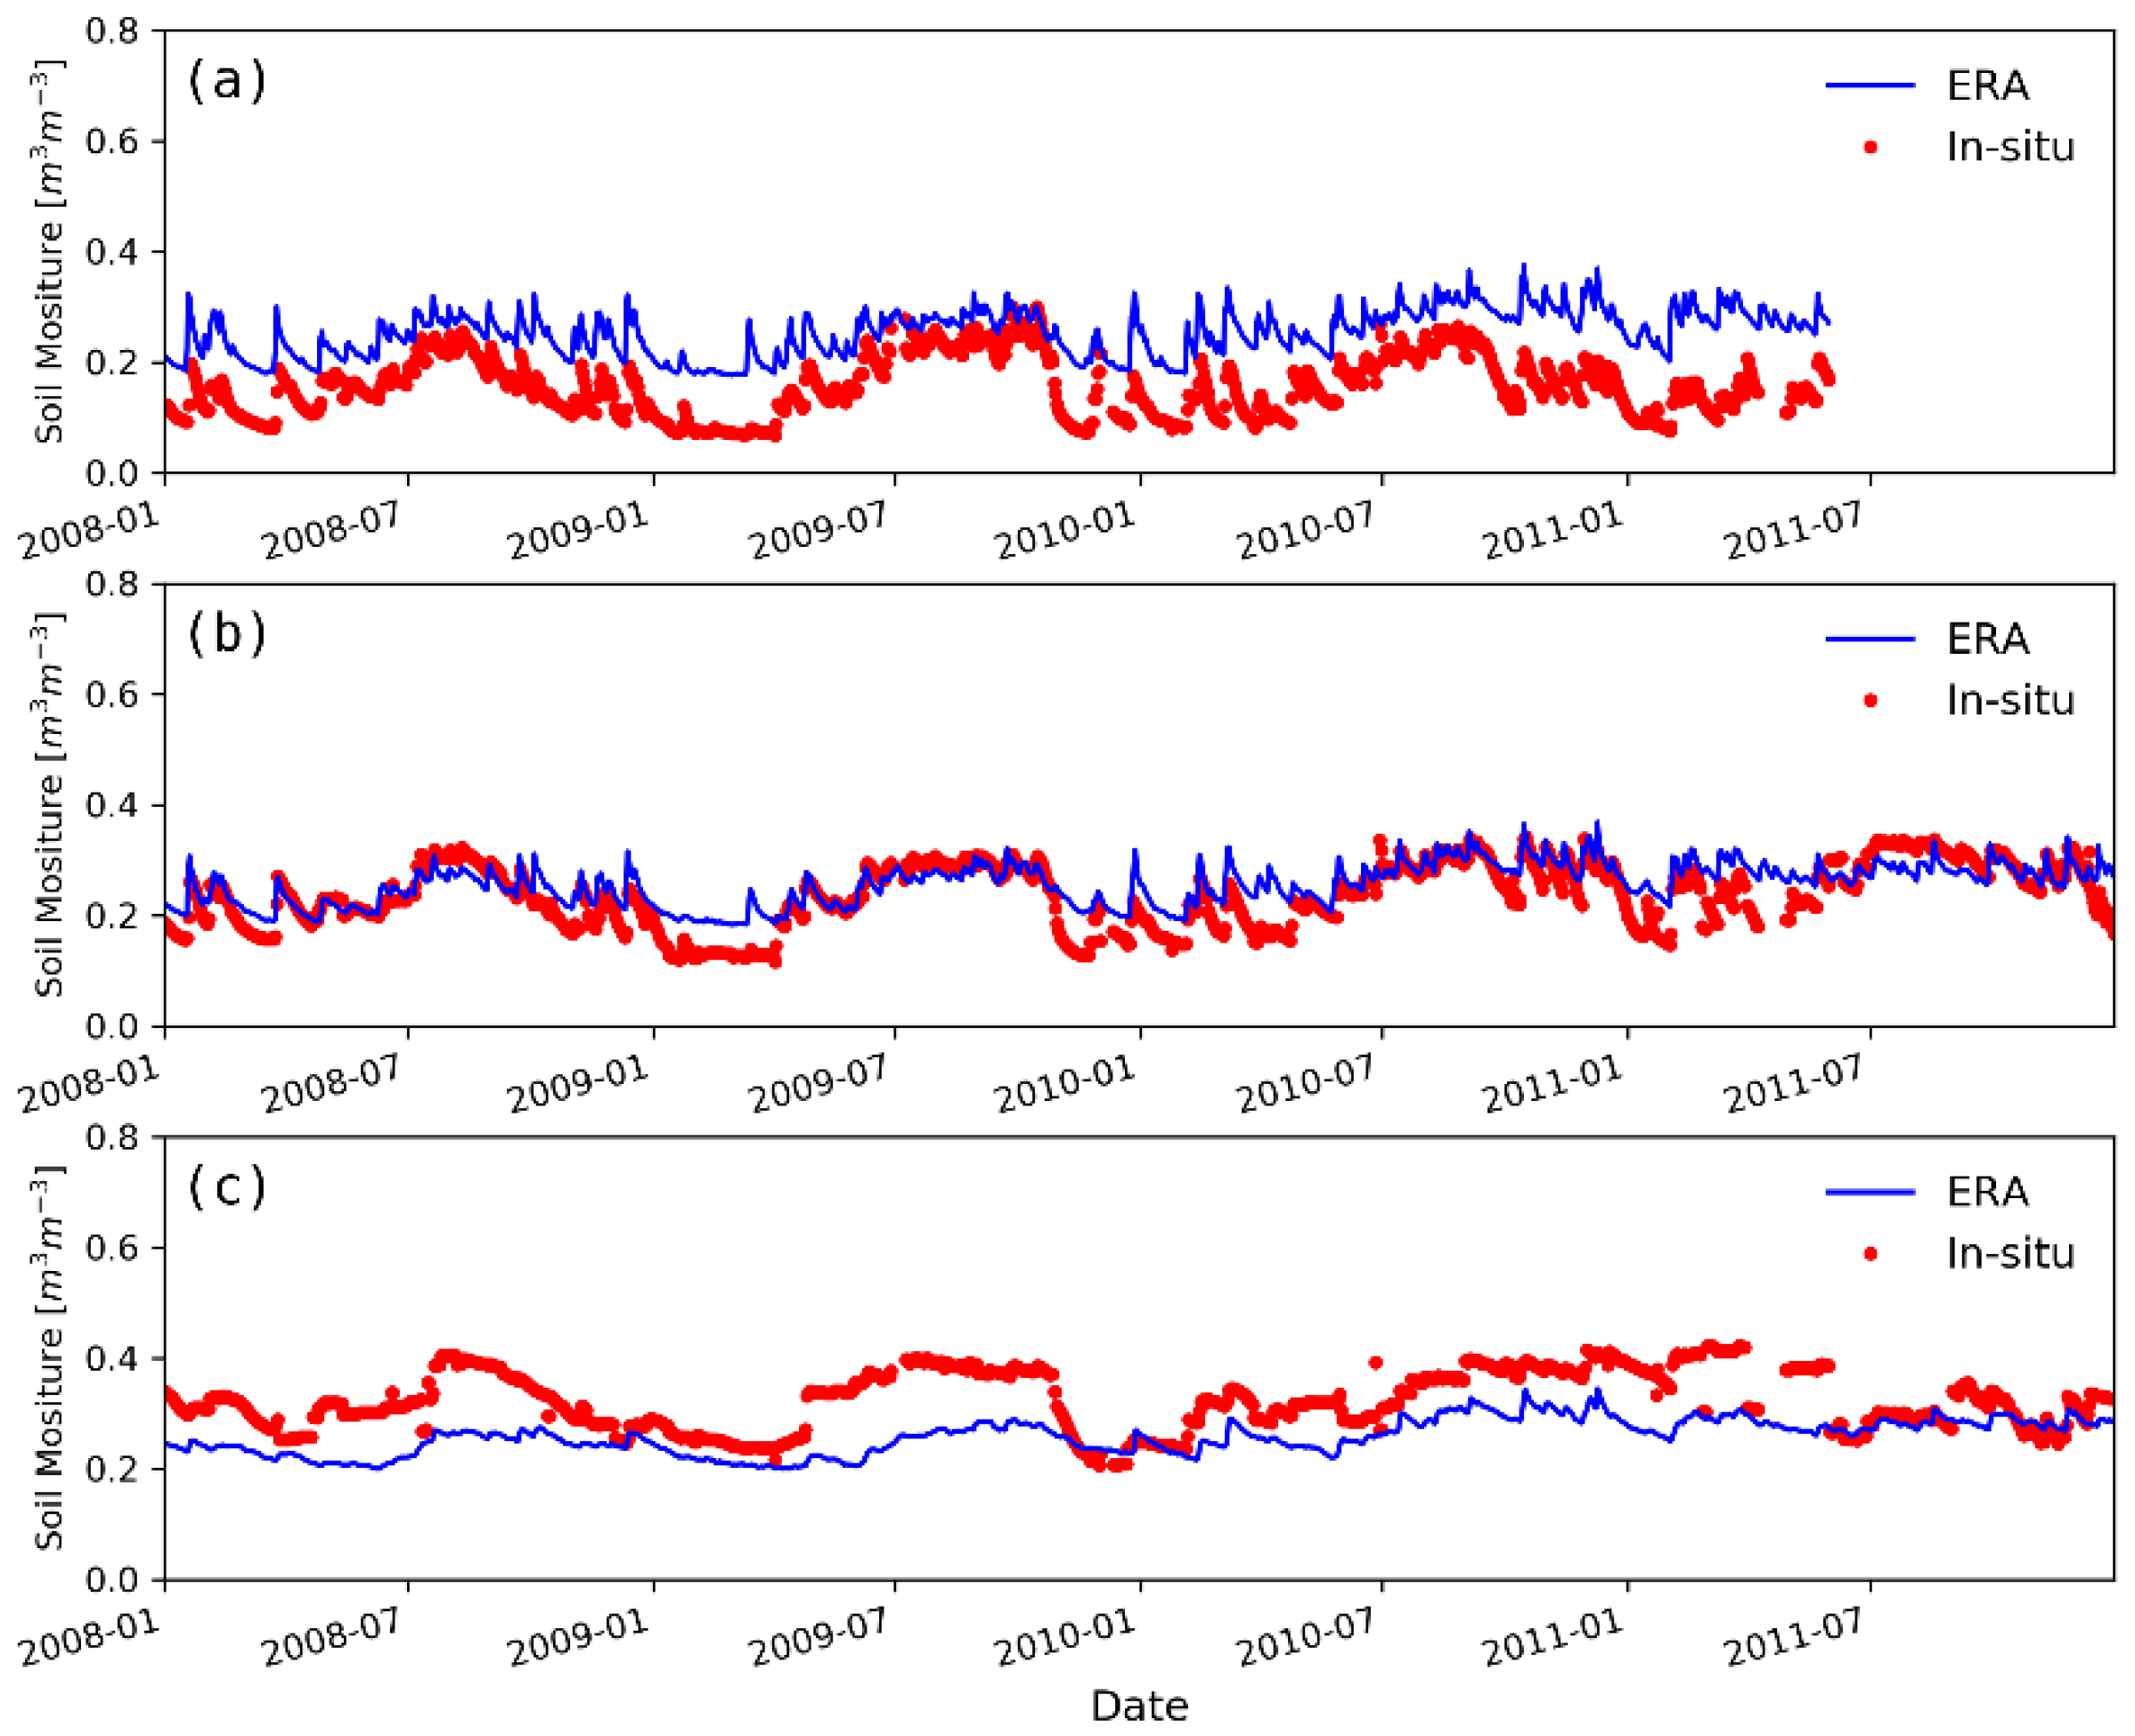
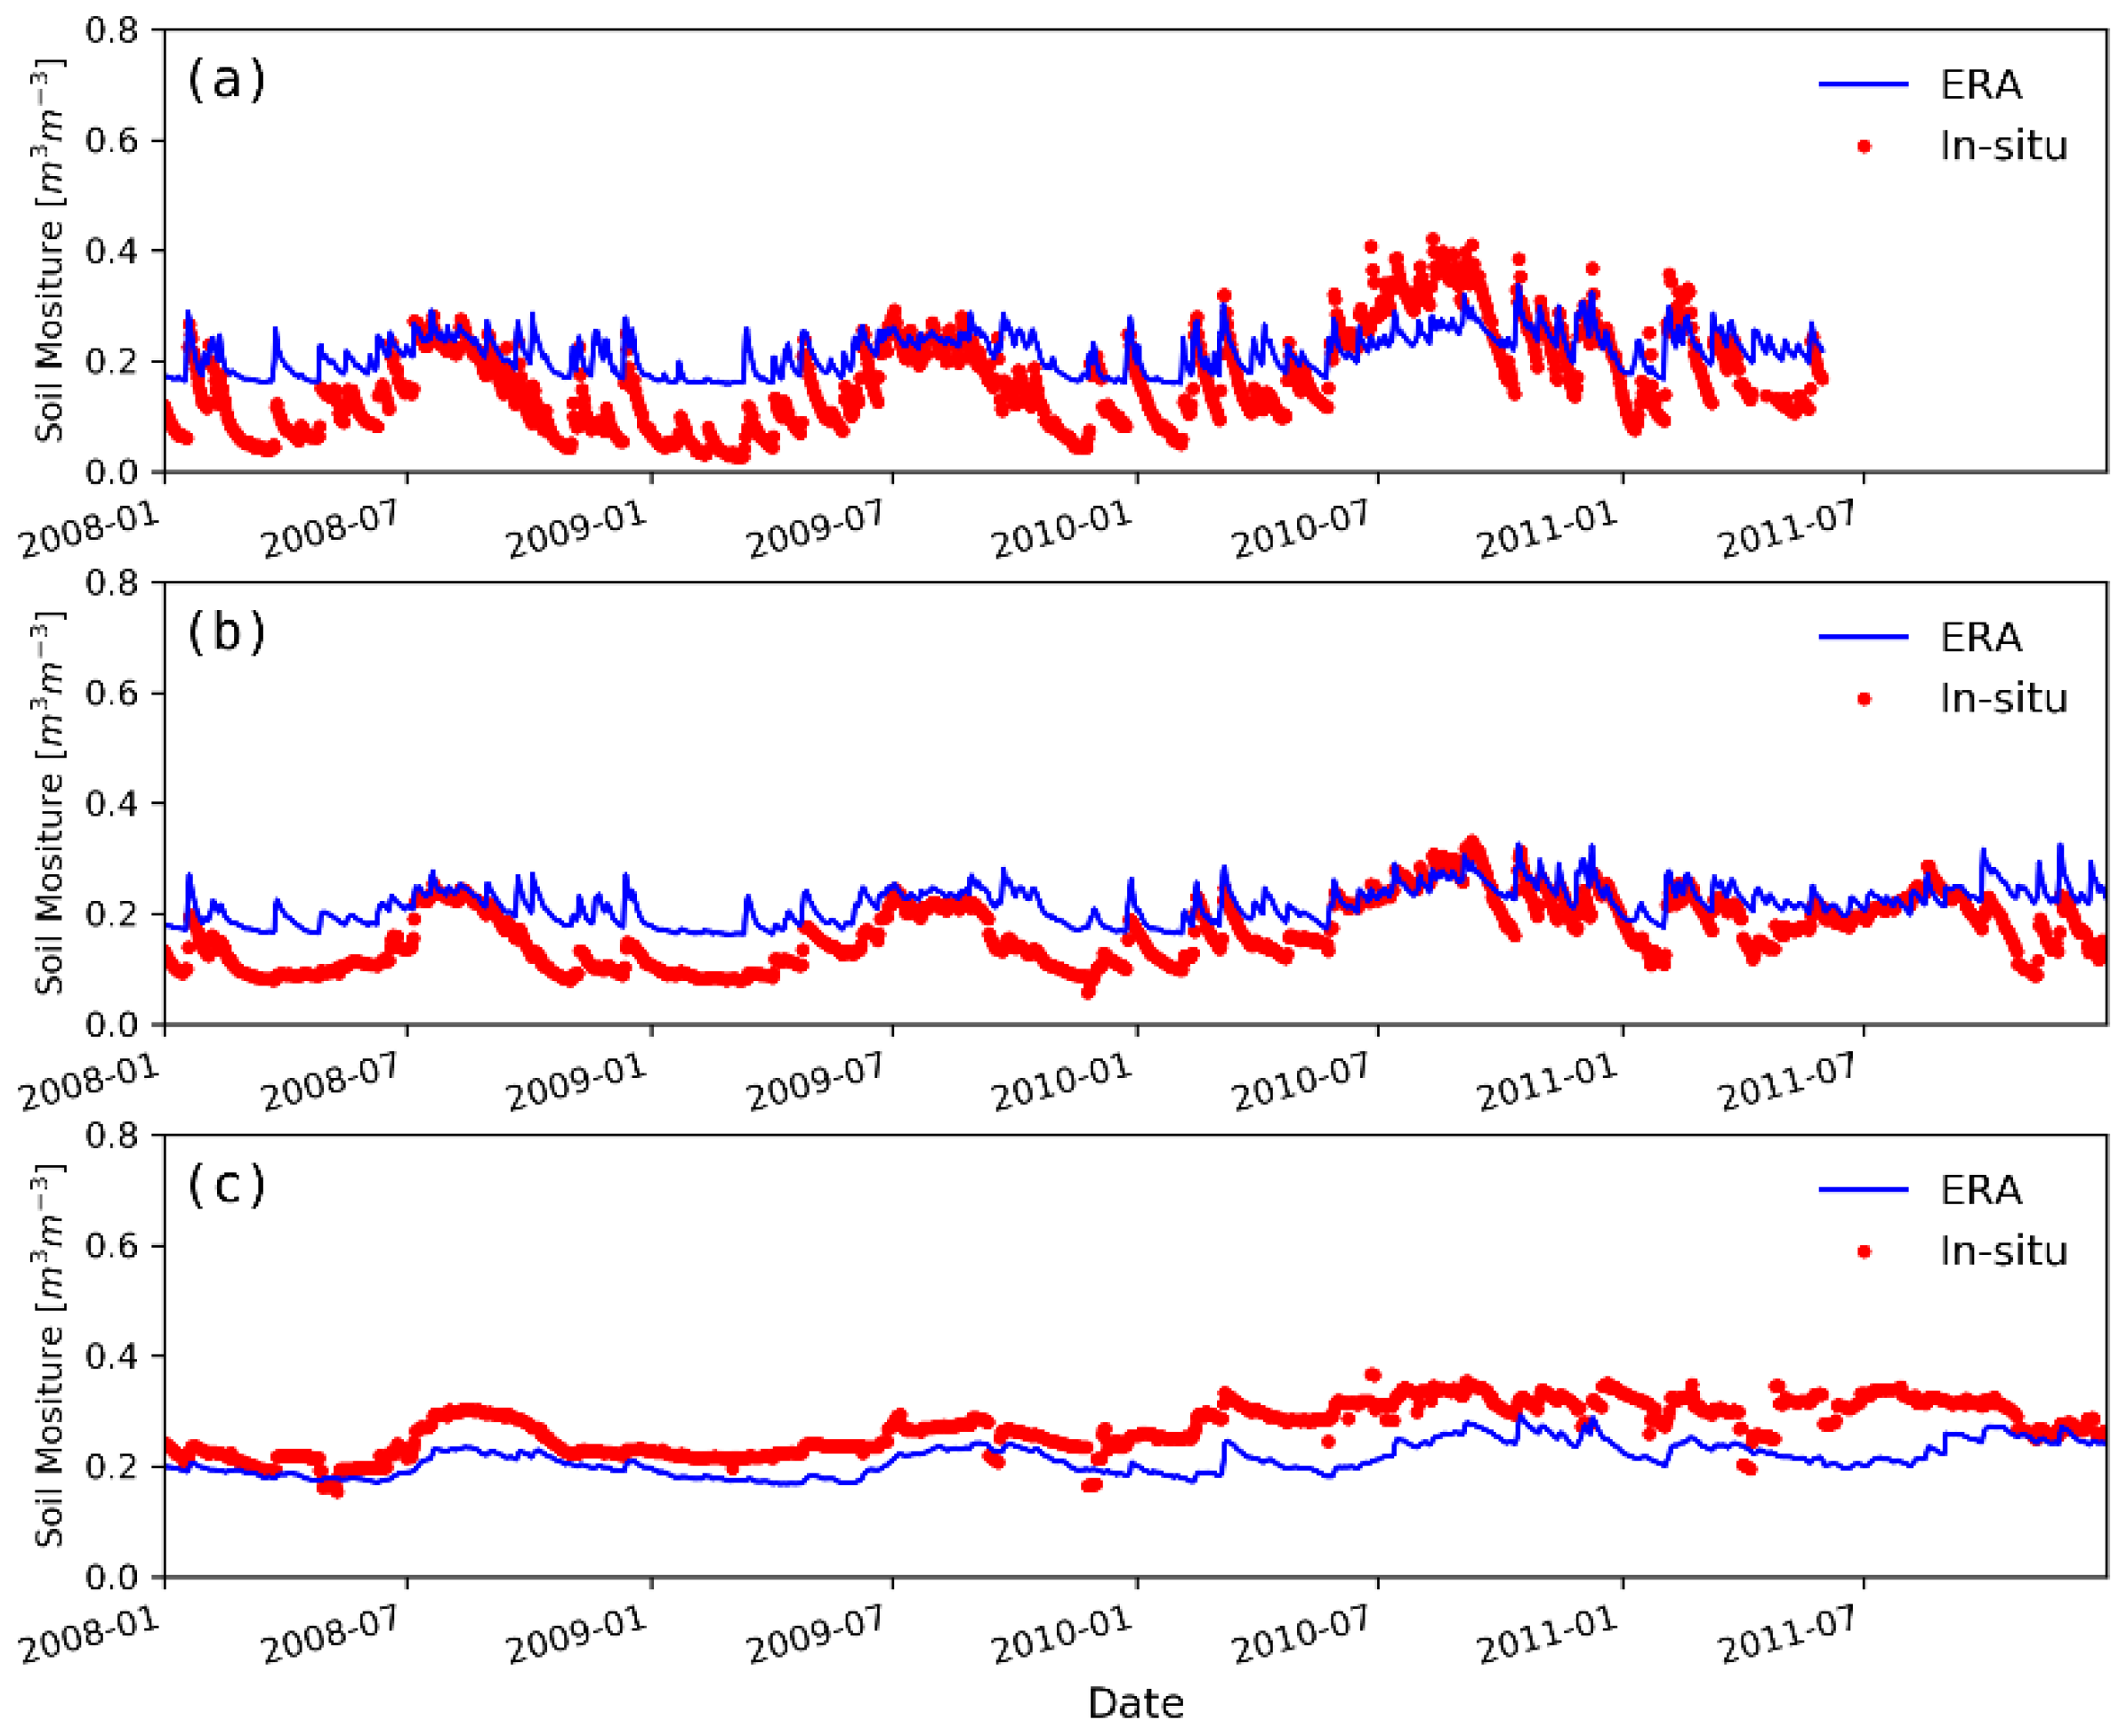
The temporal behavior of the ERA soil moisture and in situ measurements were examined at the three different layers. As can be seen from Figure 3, the ERA soil moisture at three layers can all reflect the temporal trends of in situ soil moisture; ERA/LYR2 soil moisture performs the best and nicely captures the in situ soil moisture dynamics. In general, ERA/LYR1 evidently overestimates in situ top layer soil moisture and ERA/LYR3 underestimates in situ root zone soil moisture at depths of 30–90 cm.
3.1.2. Kyeamba
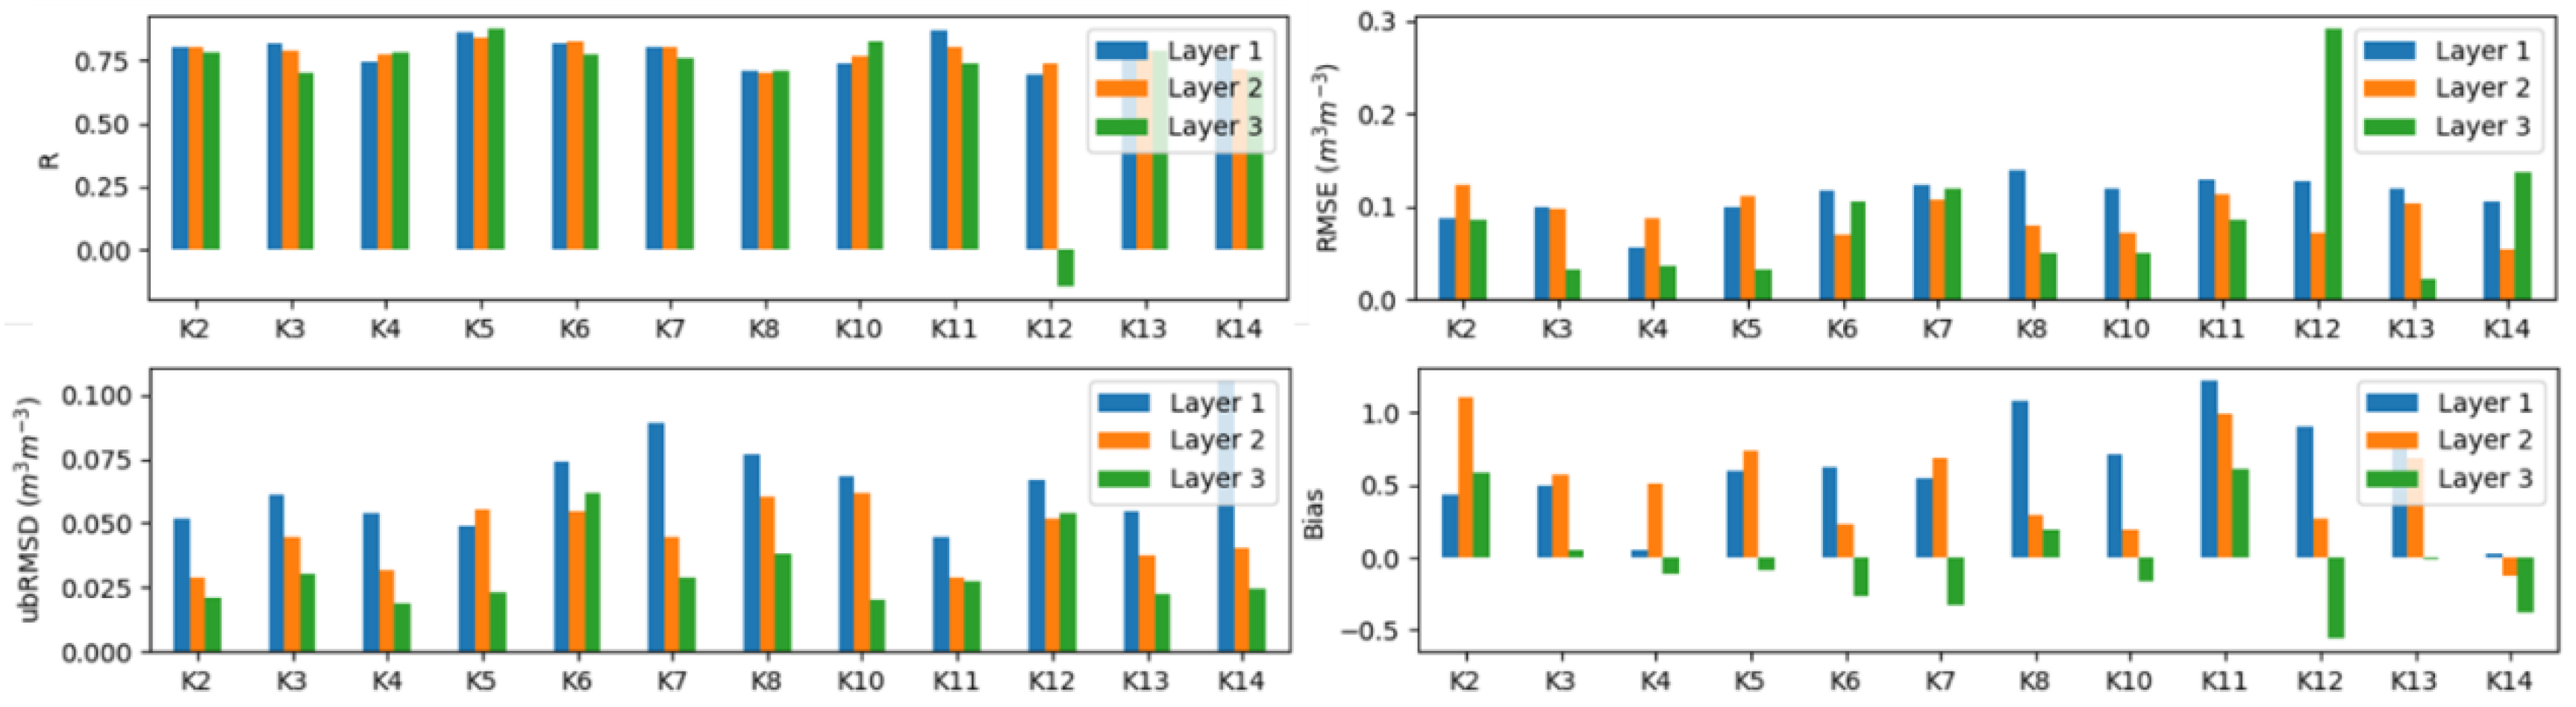
The in situ soil moisture dataset from 12 sites in Kyeamba was used to validated the ERA soil moisture. K1 and K9 were excluded because their measurements were unavailable in the acquired in situ moisture datasets. Table 4 shows the land cover type and geolocation for each site. Figure 4 presents comparisons of error metrics of different layers at each individual site. ERA/LYR3 soil moisture has negative correlation with in situ measurements at the K12 site, and it produces the highest RMSE at K12. At other sites in of Kyeamba, ERA/LYR3 generally has the lowest R value as compared to ERA/LYR1 and ERA/LYR2. However, ERA/LYR3 has the lowest ubRMSD values in terms of in situ soil moisture at each site except for K12, and ERA/LYR1 has the highest ubRMSD values. Negative bias values occur in most sites at the layer 3, indicating the underestimation of the ERA/LYR3 soil moisture against the in situ measurements.
Table 5 summarizes the error metrics of the three soil layers at Kyeamba subarea. ERA/LYR1 shows the best correlation with in situ soil moisture (R = 0.839), and the R values of ERA/LYR2 and ERA/LYR3 against the in situ measurements are 0.792 and 0.682. However, the RMSE, ubRMSD, and bias values of the ERA/LYR1 are higher than those of other two layers. Similar to Adelong, ERA/LYR1 and ERA/LYR2 overestimate the in situ soil moisture, while ERA/LYR3 produces underestimations. Comparing the seasonal performance, the soil moisture datasets have lowest correlation coefficients with in situ moisture in winter compared with other seasons. However, at layer 1 and layer 2, it also produces the lowest bias values. For ERA/LYR1, the modeled soil moisture has the highest correlations with in situ soil moisture in summer (R = 0.884); the ubRMSD values for the four seasons are in 0.036–0.060 m3·m−3, with the lowest value in autumn and the highest value in winter. For the ERA/LYR2, the R values of different seasons range from 0.761 to 0.819 m3·m−3, and the summer data has the outstanding consistency to in situ data, while the winter data performs poorly. At layer 3, modeled soil moisture in summer performs better than other seasons, with the highest R and lowest ubRMSD and bias.
Figure 5 illustrates the comparison of soil moisture temporal variations of different soil layers. It can be found that the ERA soil moisture can capture soil moisture temporal dynamics at three layers during the entire period. At layer 1 and layer 2, the ERA soil moisture generally overestimates the in situ value. On the contrary, the modeled soil moisture underestimates in situ measurements at layer 3. In addition, as can be seen from Figure 5, the root zone (layer 3) soil moisture values are more stable over time, and the surface soil moisture shows higher temporal variability.
3.1.3. Yanco
The Yanco subarea includes 13 sites, which are evenly distributed in an area at a scale of about 0.75° × 0.75°. The geolocation and land cover type of each site in Yanco subarea are shown in Table 6. The error metrics of different layers at individual sites are shown in Figure 6. In general, ERA/LYR1 has good correlation with in situ measurements at the site scale, however, it also has higher RMSE and bias values. Evident overestimations occur at surface soil moisture. Table 7 summarizes the error metrics for subarea-averaged soil moisture. Comparisons of temporal variations between ERA and in situ moisture are displayed in Figure 7.
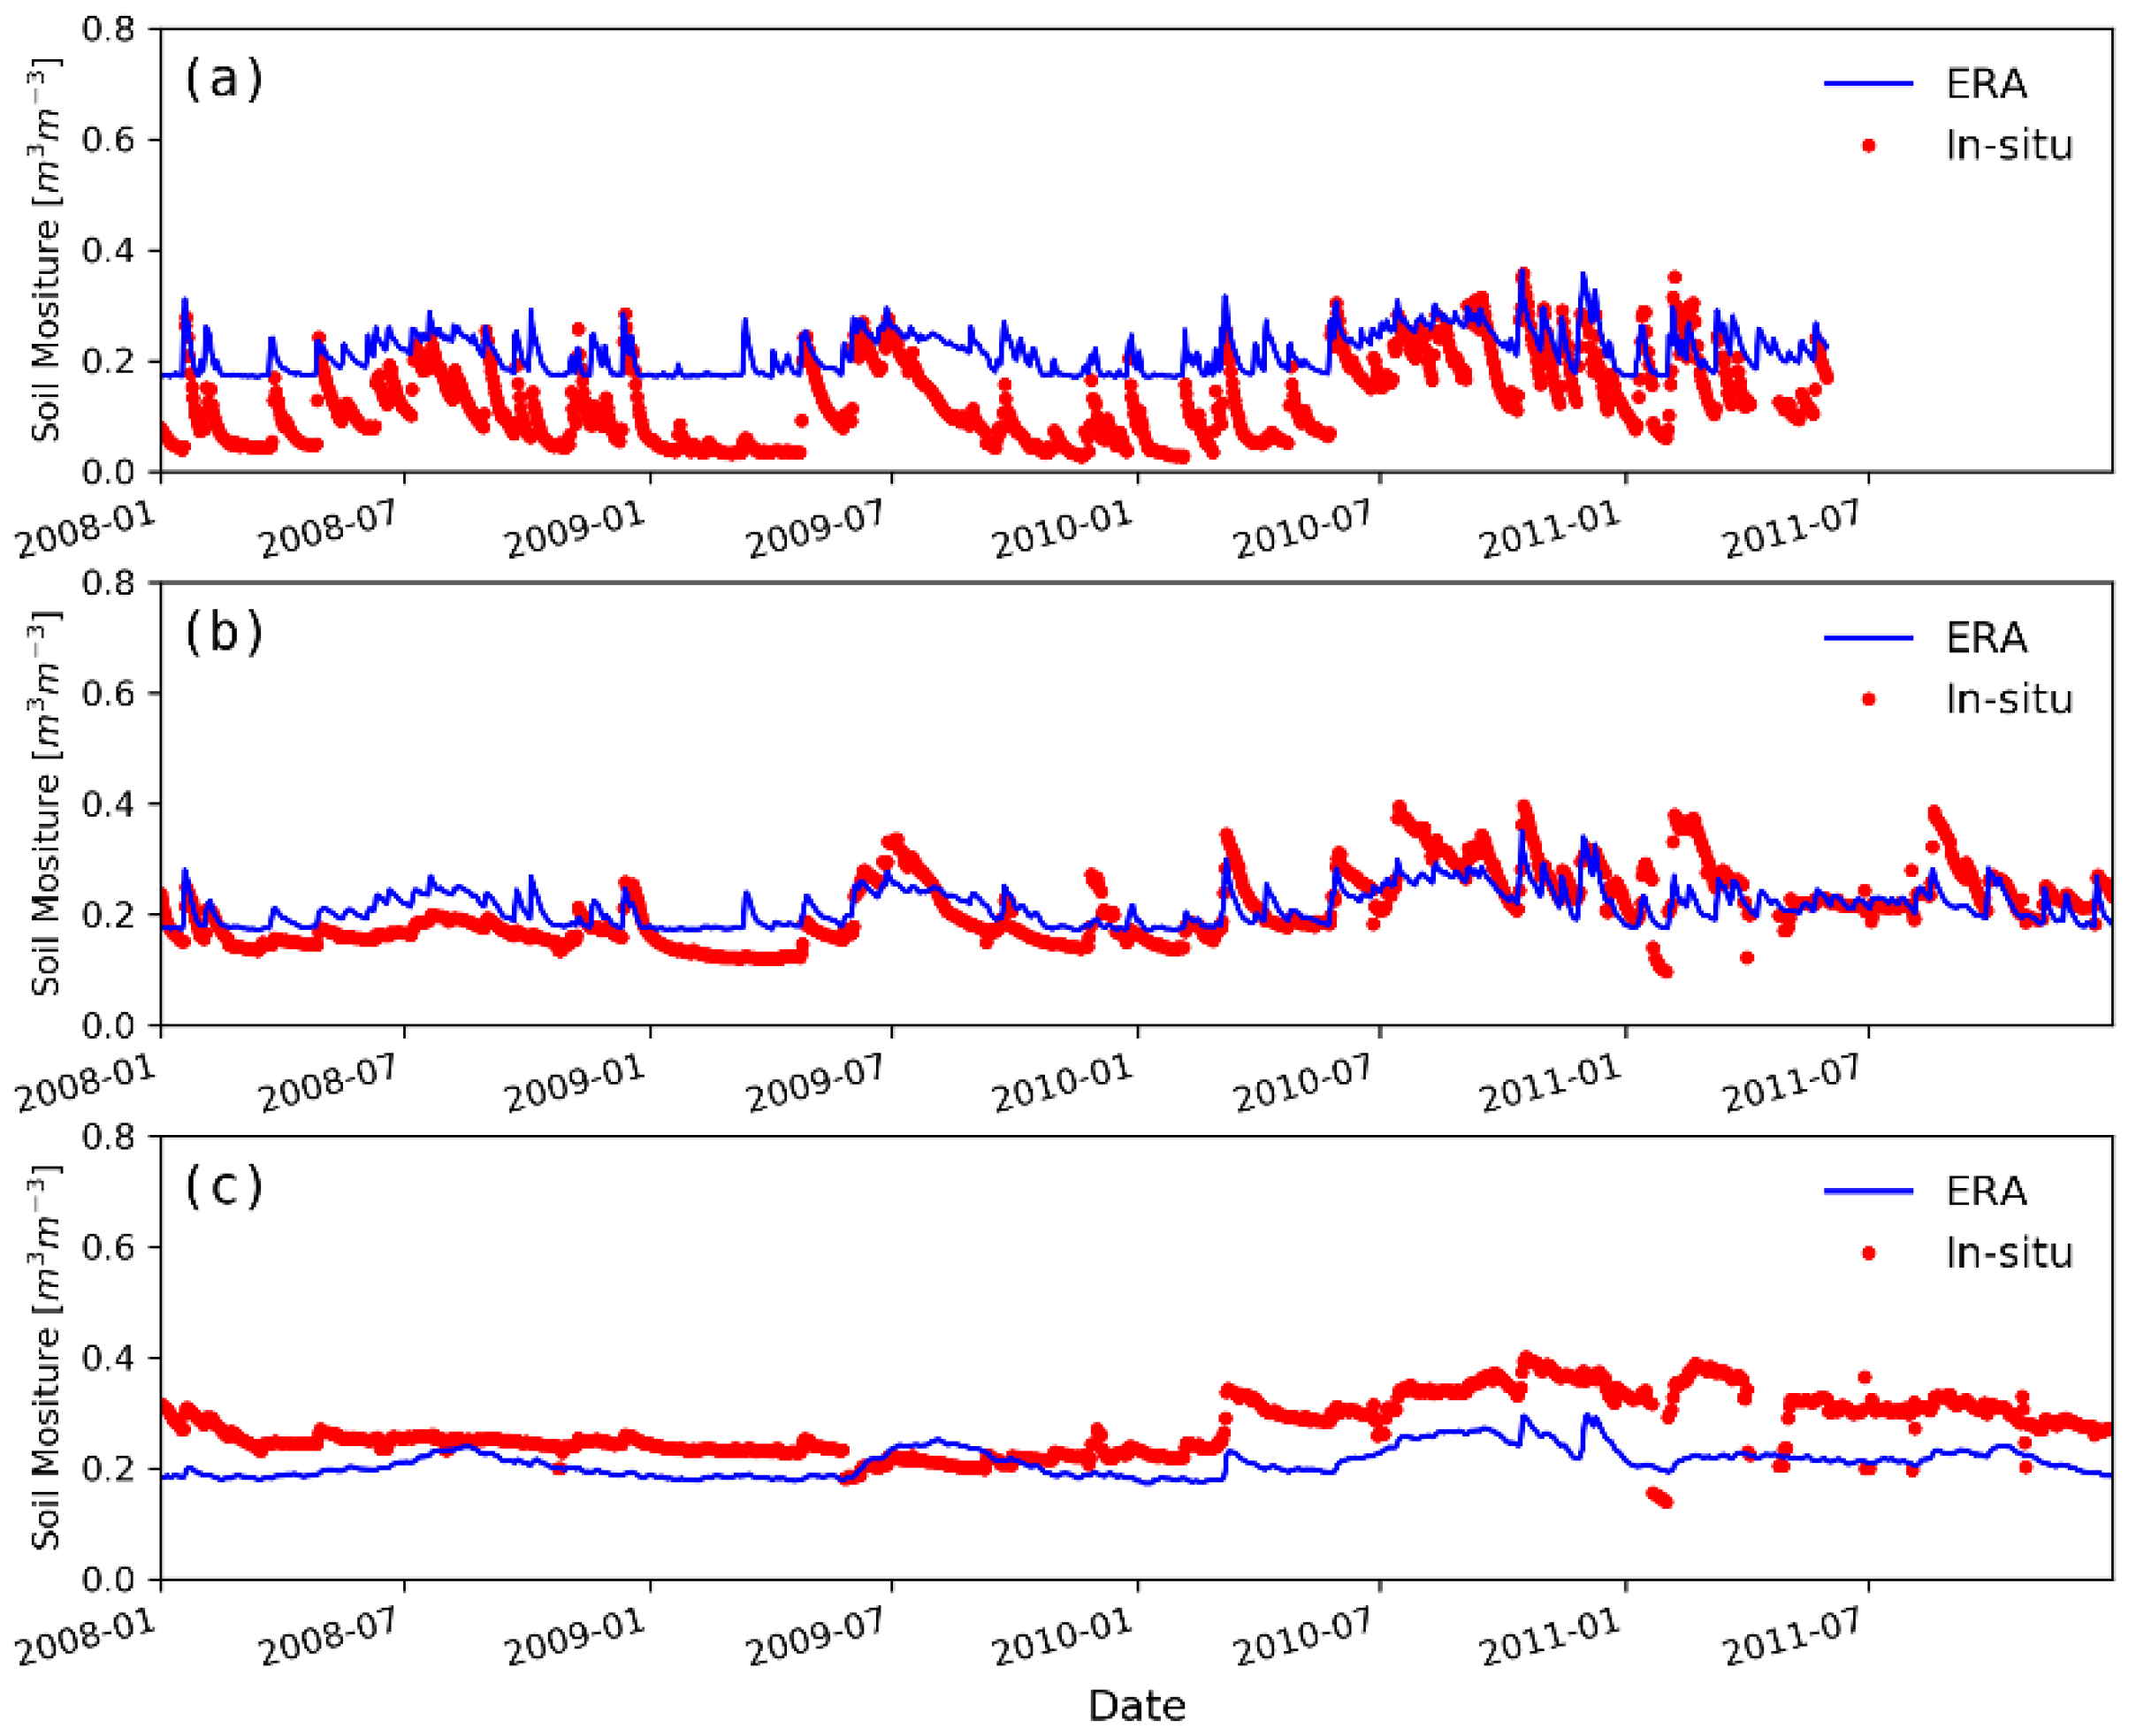
As is shown in Table 7 and Figure 7, the ERA surface soil moisture shows high correlations with in situ soil moisture and perfectly captures the temporal dynamics of in situ measurements, with an R value of 0.84. However, it overestimates soil moisture, especially in summer and autumn. The bias for surface soil moisture in autumn is more than 1.0. For the ERA/LYR2, it produces lower RMSE, ubRMSD, and bias than the other two layers. According to Figure 7, ERA/LYR2 precisely reflects the temporal trends of in situ moisture and also has good agreement with the in situ values. In addition, ERA/LYR2 in autumn has a higher bias value than those of other seasons. ERA/LYR3 has a poor correlation with in situ soil moisture (R = 0.559), but this is mainly caused by the great discrepancy in winter (R = 0.220).
In general, at the Yanco subarea, ERA/LYR2 soil moisture is in greater accordance with the in situ measurements compared to the other layers, and the ERA/LYR1 soil moisture does well in capturing the temporal variations of in situ soil moisture. In addition, the above two layers of soil moisture generally overestimate the in situ soil moisture, whereas layer 3 of ERA soil moisture has underestimations compared with the in situ values.
3.2. Inter-Comparison of Different Layers
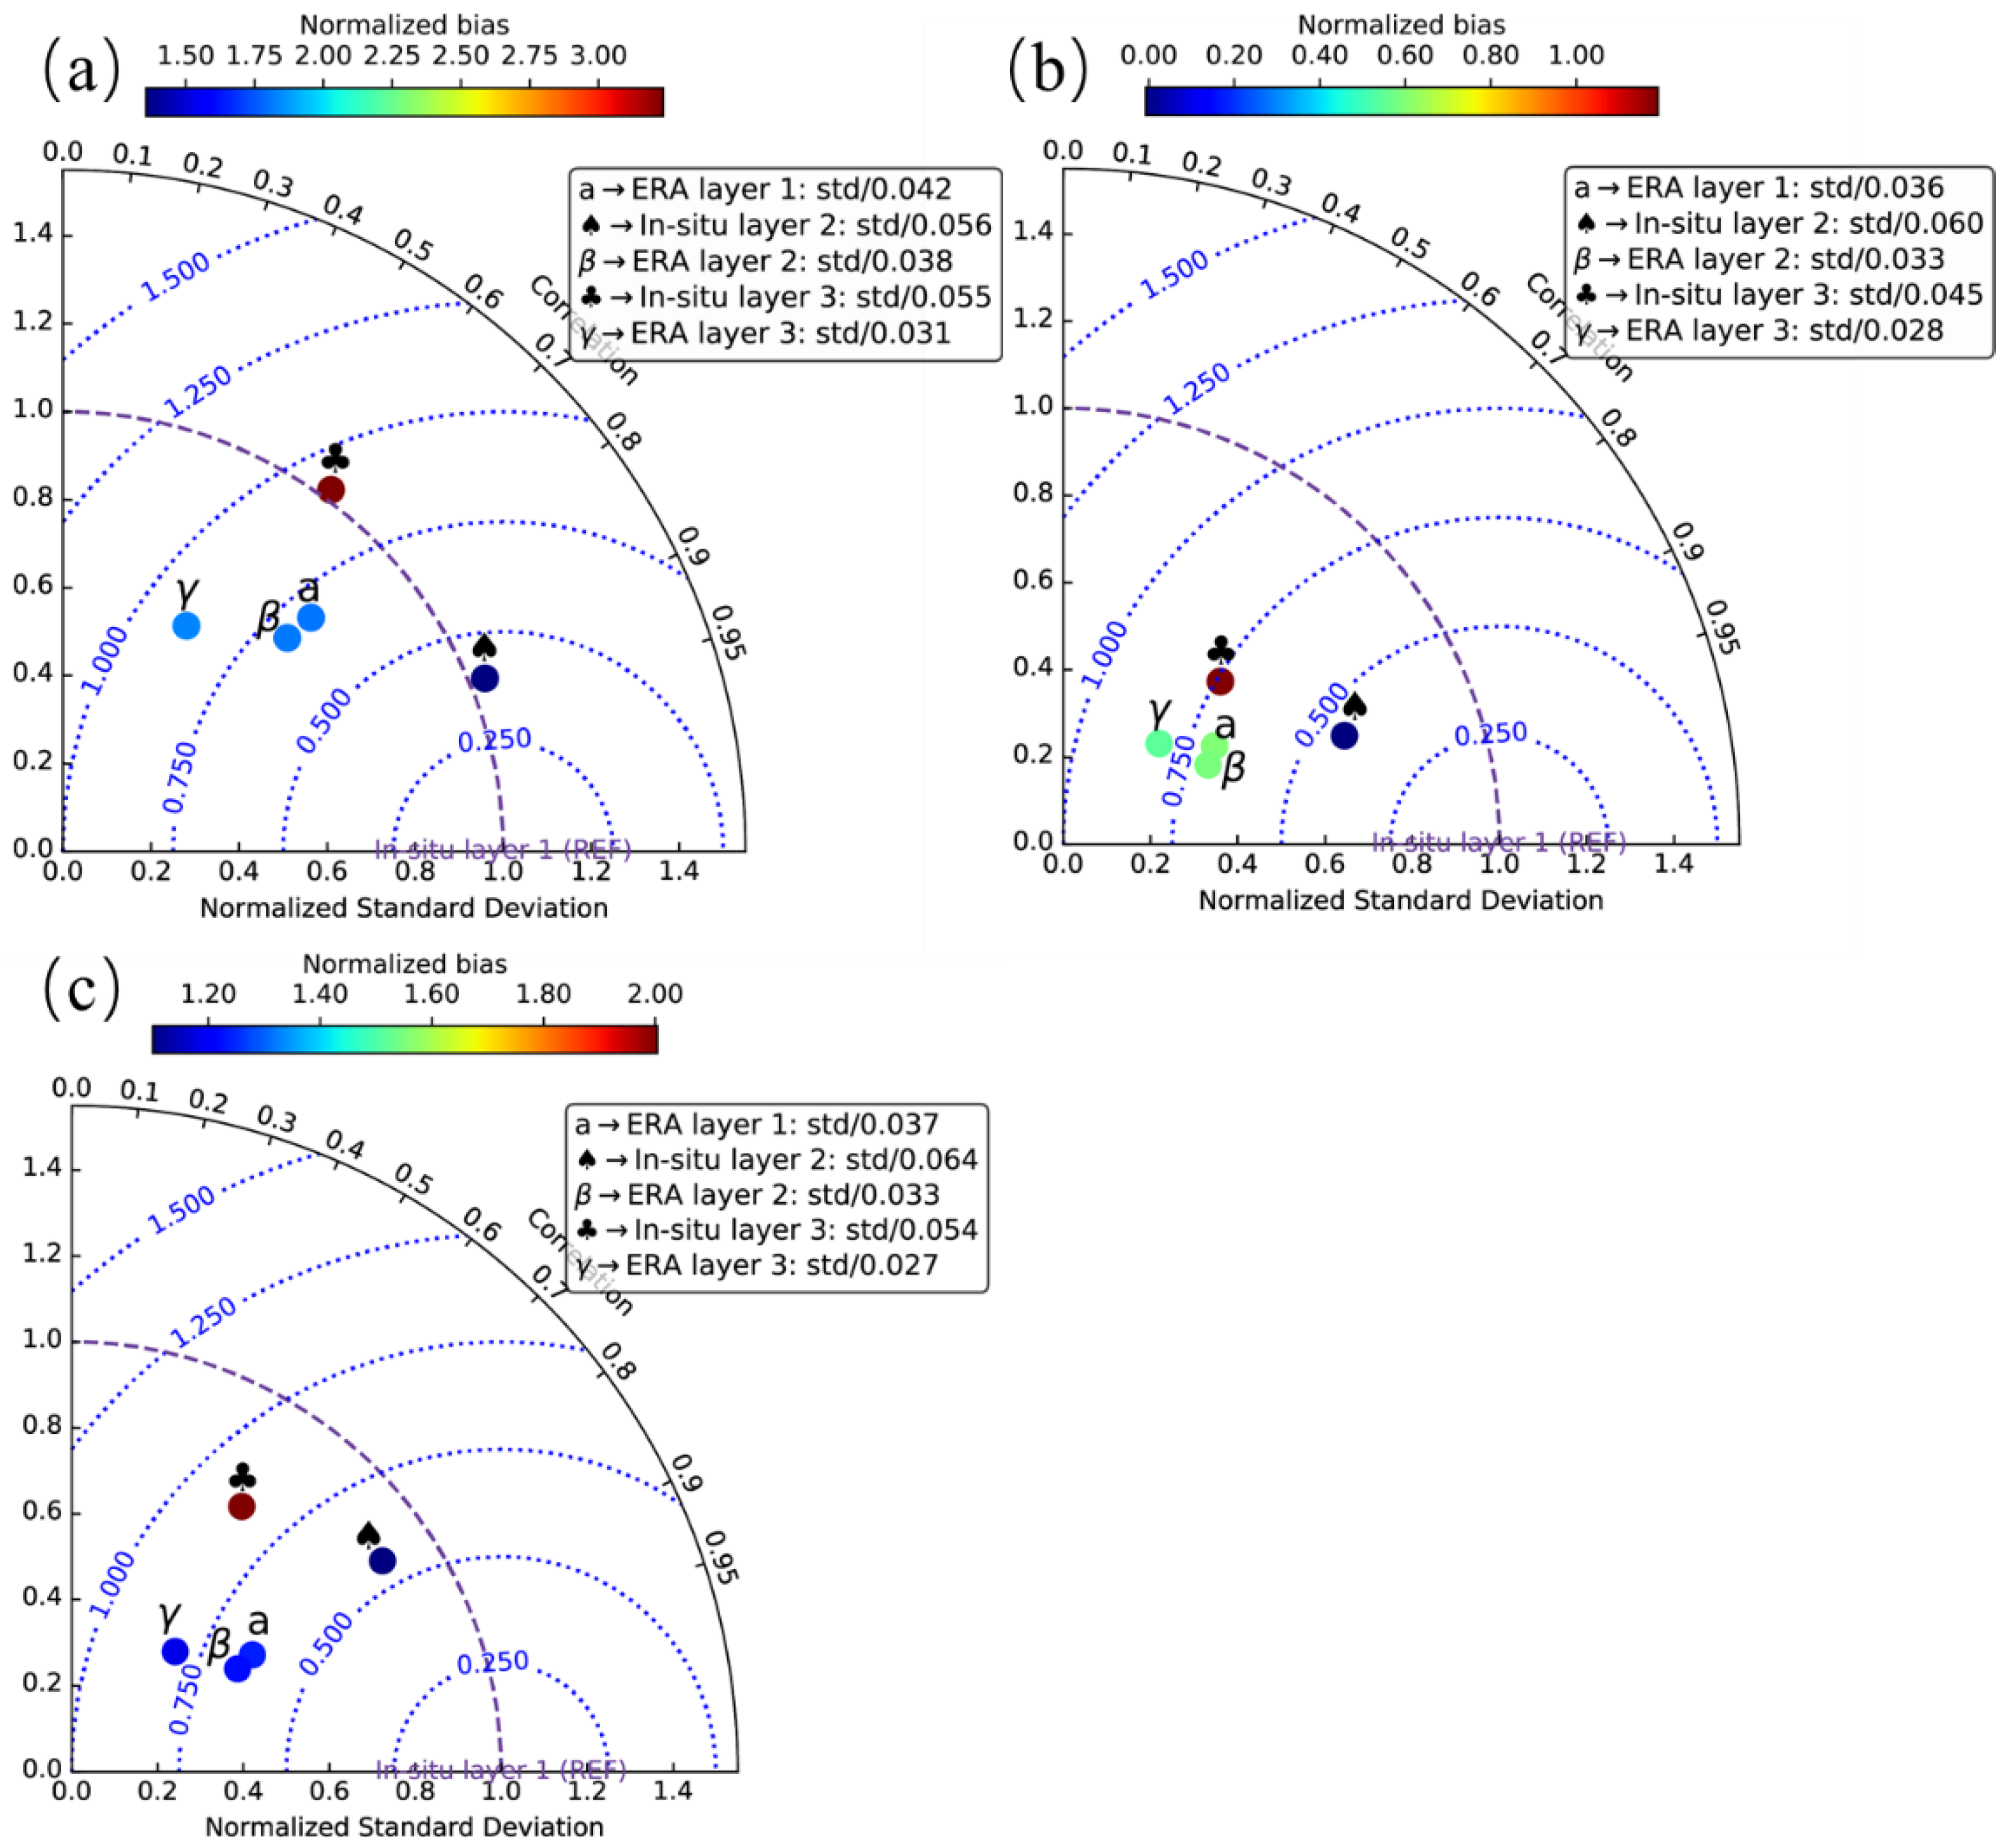
To have a comprehensive perspective of the performance of ERA multi-layer soil moisture product over the OzNet network, we plotted Taylor diagrams for illustrating the normalized bias, the normalized standard deviation, and the correlations. The in situ soil moisture at layer 1 was considered as the reference data (Figure 8). The Taylor diagram indicates the relative bias and standard deviations of the investigated data from the reference data. The temporal variations of the standard deviation among three soil layers for ERA and in situ soil moisture are plotted in Figure 9.
Comparing the performance of ERA soil moisture at different depths, the surface soil moisture of ERA (0–7 cm) generally has the best correlations with in situ soil moisture, but also has the highest ubRMSD and bias values. The positive bias values between ERA surface soil moisture and in situ measurements indicate the overestimations of the ERA product to the in situ soil moisture at the surface soil layer. According to the evaluation results over Tibetan Plateau and southwest China by Peng et al. and Zeng et al. [26,31], the ERA surface soil moisture also has overestimated trends over those areas; however, the degree of bias deviations are smaller than their results in the above studies. Moreover, the ubRMSD and correlation coefficients in the above two studies are similar to the evaluated results in this study, indicating that the capacity of the ERA-Interim product for revealing temporal dynamics of surface soil moisture is reliable across different regions. However, the absolute magnitudes differ among different networks.
The ERA soil moisture at depths of 7–28 cm has lower correlation coefficients than the depth of 0–7 cm, but also lower ubRMSD and bias. The ERA soil moisture at layer 2 is generally closer to the absolute magnitudes of in situ soil moisture. According to the examinations of the soil moisture temporal behavior, the top two layers of soil moisture present similar temporal characteristics. This is true for both the ERA and in situ soil moisture. However, according the Figure 8, the in situ soil moisture of layer 1 and layer 2 show varied correlations and different standard deviations, whereas the ERA soil moisture of layer 1 and layer 2 present very close correlations and similar standard deviations. This is also can be inferred from Figure 9: the standard deviations of soil moisture of three depths for ERA product are almost constant values between 0.0 and 0.01.
The ERA soil moisture of root zone depth (28–100 cm) has the lowest correlations and underestimates the in situ soil moisture, while layer 1 and layer 2 of ERA soil moisture overestimate in situ soil moisture. The ERA soil moisture prevalently has higher correlations with in situ values in local spring and summer months than those in autumn and winter. The ERA soil moisture in winter months shows the lowest correlation coefficients. However, the bias values in winter are lower than other seasons. In general, the ubRMSD of different layers and subareas are all smaller than 0.06 m3·m−3.
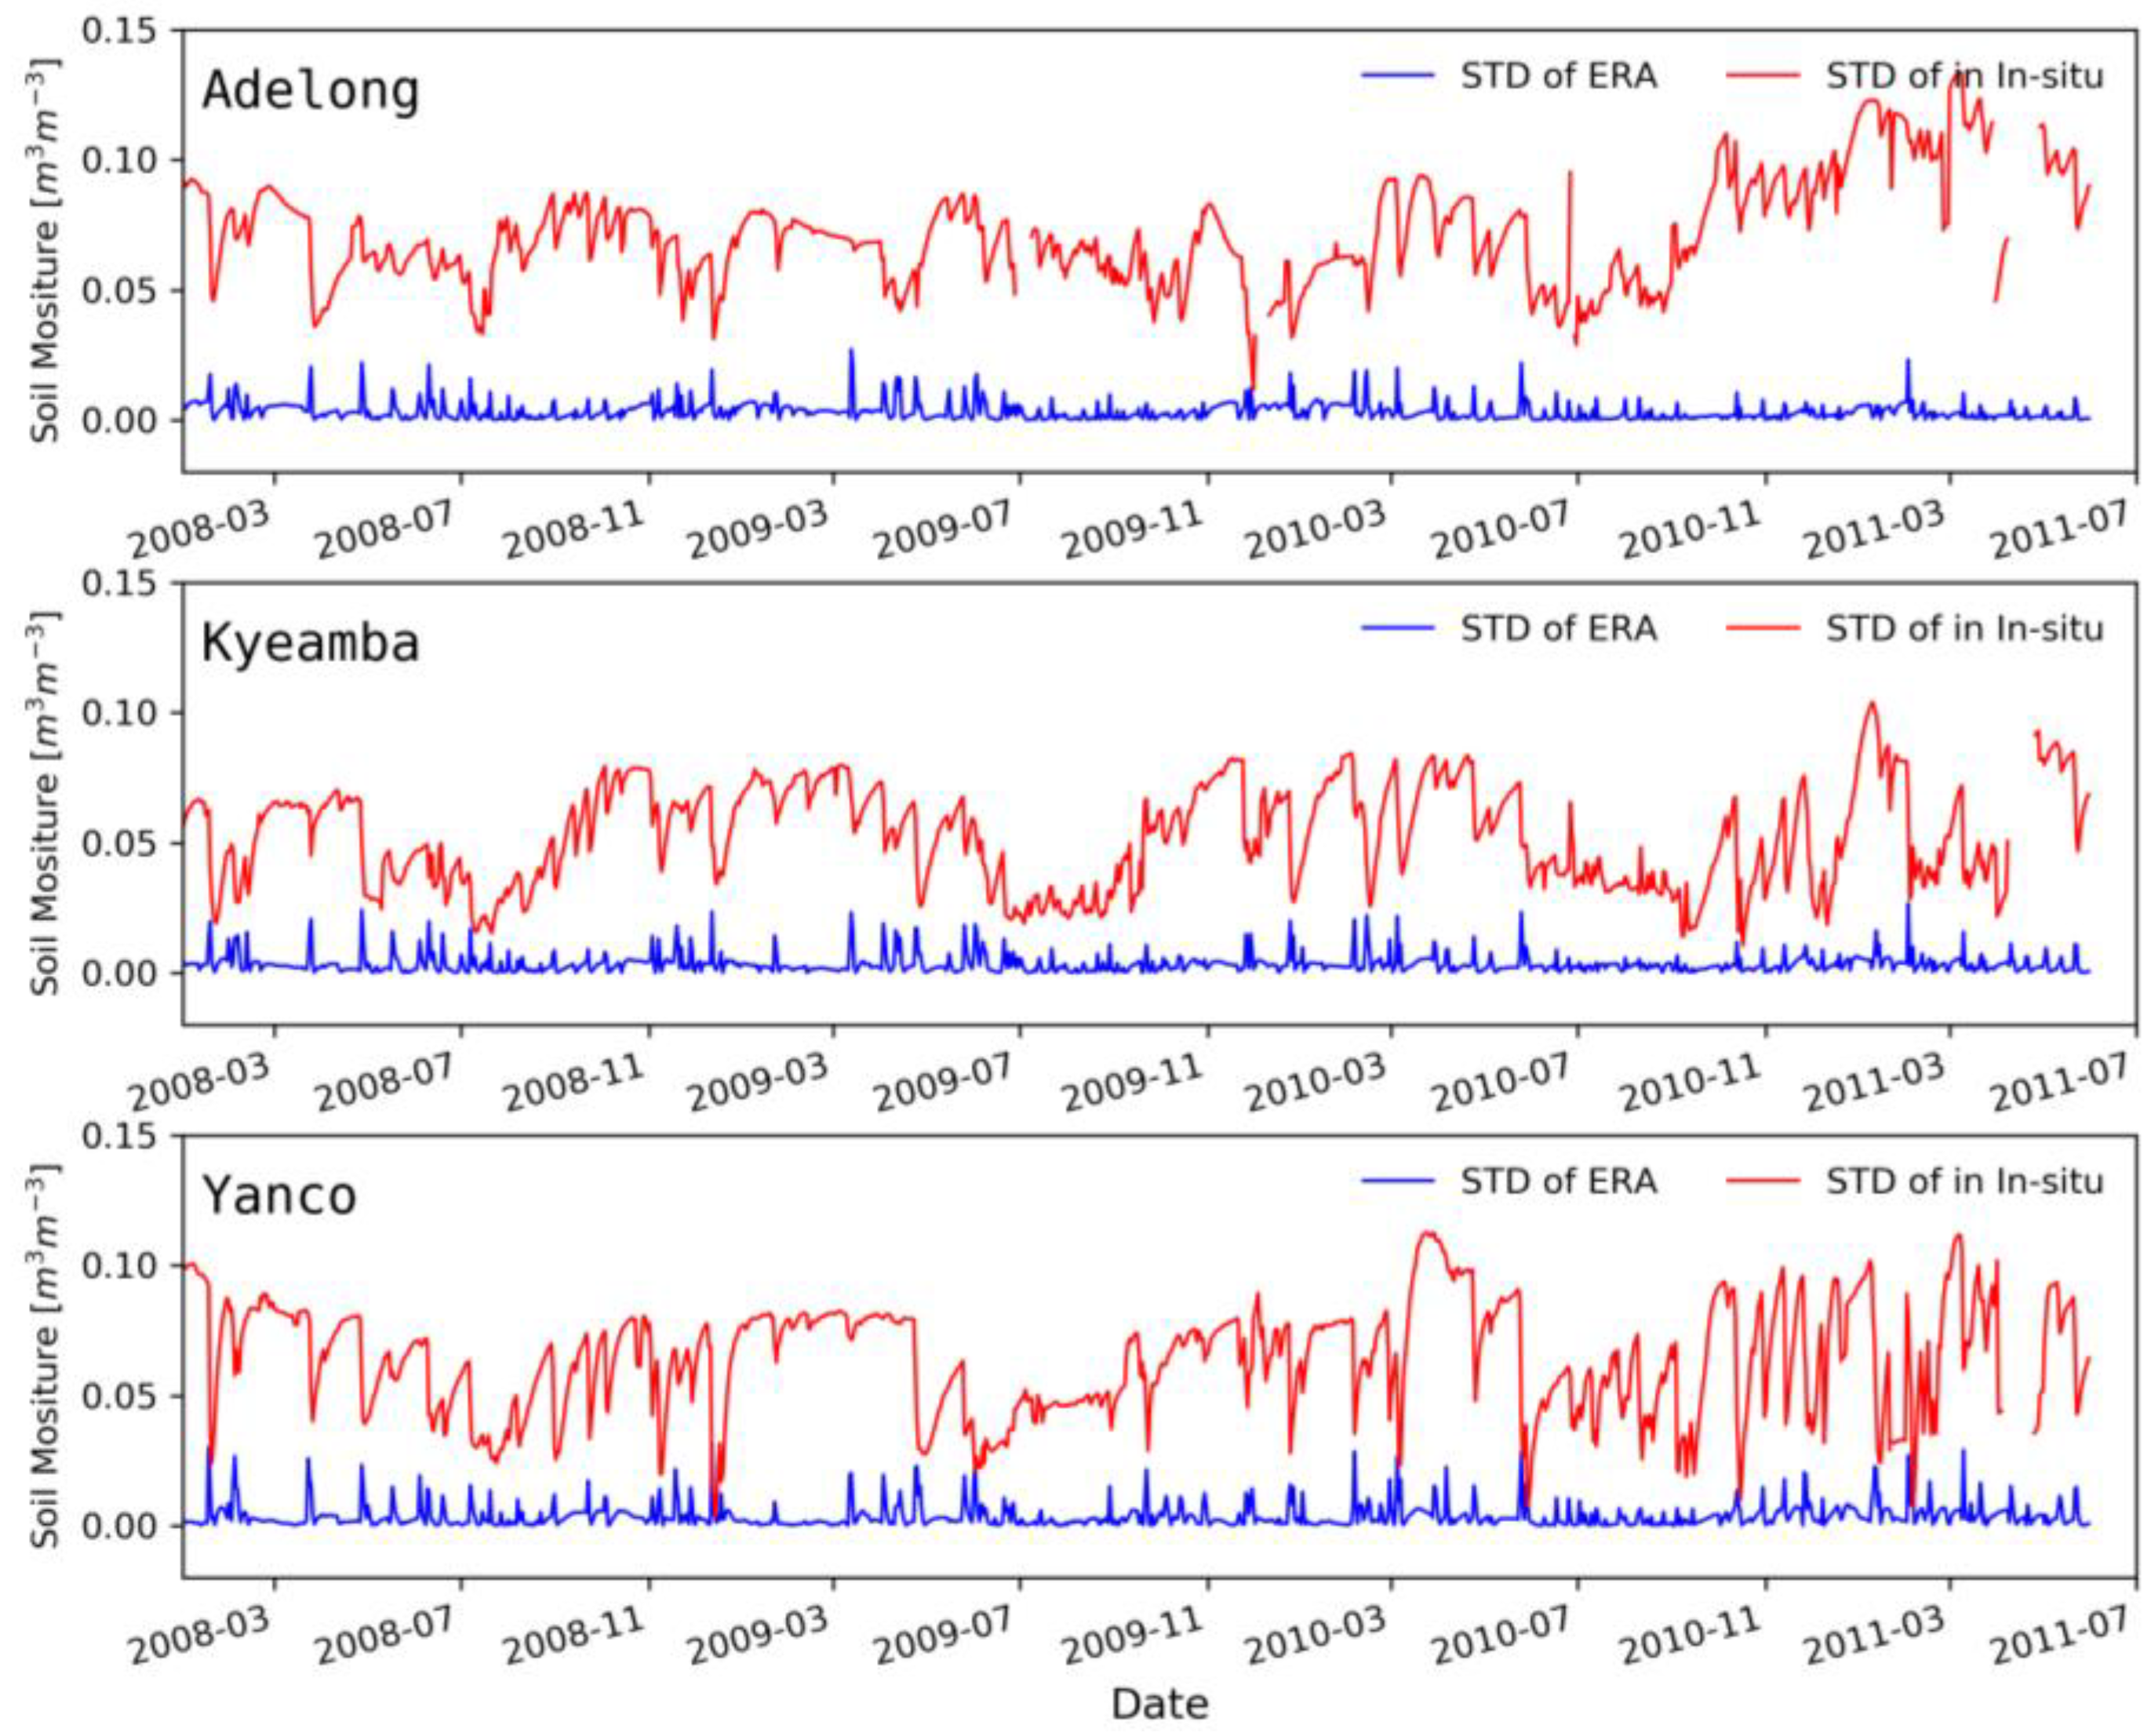
In addition, as can be inferred from Figure 3, Figure 5, Figure 7 and Figure 8, in situ root zone soil moisture values increase with the increasing soil depth and the temporal variations decrease gradually with increasing soil depth. The decreasing temporal variations indicate time stability improves with increasing depth and the in situ surface soil moisture is more variable than the root zone soil moisture. This difference between surface and root zone soil moisture can be explained by the fact that surface soil moisture is more affected by atmospheric conditions than root zone soil moisture [39,40,41]. However, according to Figure 9, the standard deviations between the three depths of the ERA soil moisture are much smaller than those of in situ soil moisture. This implies that the ERA soil moisture values of different layers have much fewer differences and smaller inter-deviations compared with the in situ soil moisture of different soil layers. Therefore, the ERA soil moisture product may fail to reflect the internal differences between different layers of in situ soil moisture.
The ERA soil moisture at three layers, in general, can be recommended if only the temporal accuracy is needed, while the ERA soil moisture at depths of 7–28 cm has higher absolute accuracy as compared to the soil moisture at depths of 0–7 cm and 28–100 cm.
3.3. Relationship between Model Error and Local Environmental Factors
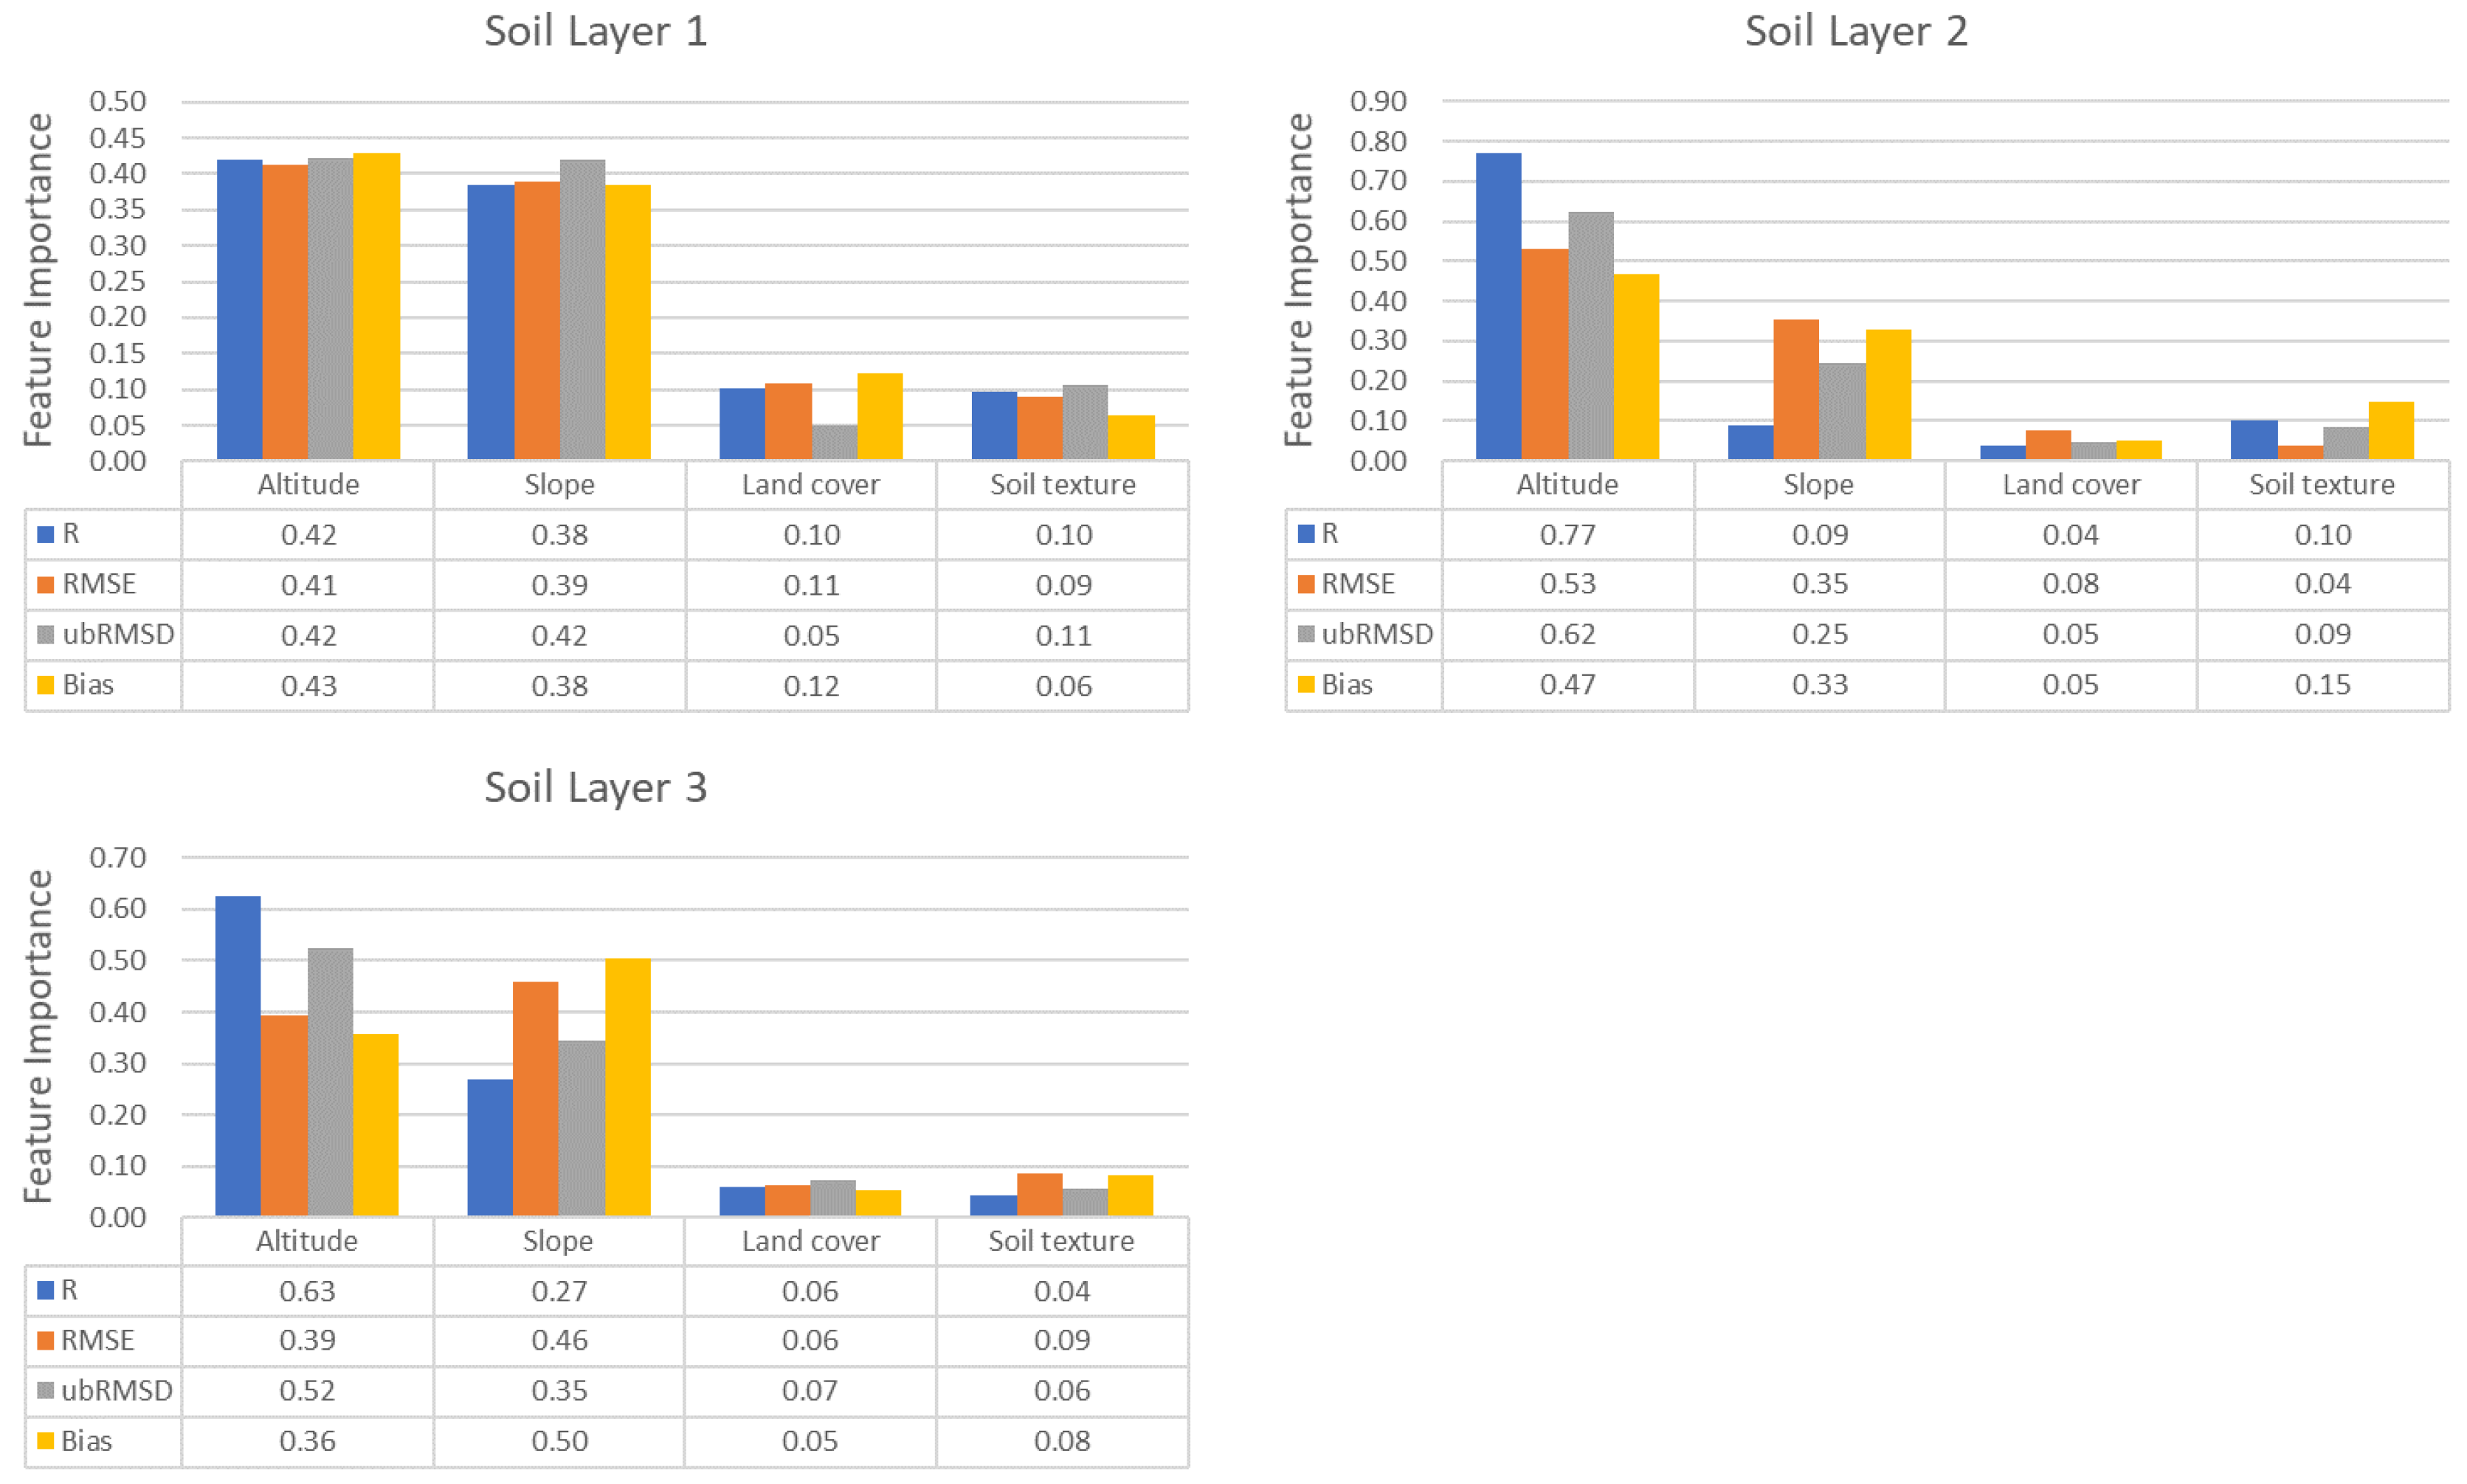
It is a difficult task to quantify the source of the land surface model error. In this section, we statistically analyzed the feature importance of some local factors to the errors of the ERA-interim soil moisture, including altitude, terrain slope, land cover types, and soil texture, to address the possible influencing features. An ensemble learning algorithm, the random forest (RF), was implemented to analyze the impacts of local environmental factors. The RF algorithm can measure feature importance by using a cross-validation strategy based on out-of-bag data (OOB) predictions. The sum of the feature importance values is 1.0, and greater feature importance value indicates a higher impact of the independent variable on the target dependent variable. Details of the algorithms can be read from relative publications [42,43]. In practice, the error metrics were considered as the dependent variables and the elevation, terrain slope, land cover types, and soil texture at each station were considered as independent variables. The feature importance of each independent variable was measured by running the algorithm over each metric.
Figure 10 shows the feature importance values at different soil depths. As is shown in Figure 10, the elevation and terrain slope have close relations with the error metrics at different soil depths. However, the feature importance values for elevation and terrain slopes vary at different soil layers. Specifically, elevation and slope have similar feature importance values, but at layer 2 and layer 3, the feature importance value of elevation is higher than that of slope. A possible reason for this is the terrain slope may have more impacts on the surface soil moisture than deep layers. In theory, a steeper slope leads to drier biases of the surface soil moisture from satellite-based soil moisture retrievals [44,45,46]. These errors may have impacts on the assimilation systems that use remote sensing datasets.
Land cover type and soil texture, according to Figure 10, have low importance feature values. Figure 11 illustrates the land cover map and soil texture map of the study area, which are derived from the GlobCover 2009 obtained from the European Space Agency (ESA) GlobCover project [47] and the Harmonized World Soil Database (HWSD) v1.2 [48]. The land cover types and soil textures in the region are homogeneous; most of the region is covered by grasslands and croplands. Table 8 and Table 9 summarize average error metrics for each different land cover types and soil textures. It can be seen that averaged R2, RMSE, ubRMSD, and bias values for croplands and grasslands have small differences. This is consistent with the feature importance analyzing results. In addition, the latest data assimilation system of ECMWF considered the soil texture in the interpolation to the model grid [21], instead of using the constant soil texture in previous version [49]. Thus, this scheme is able to decrease the model biases over different soil types.
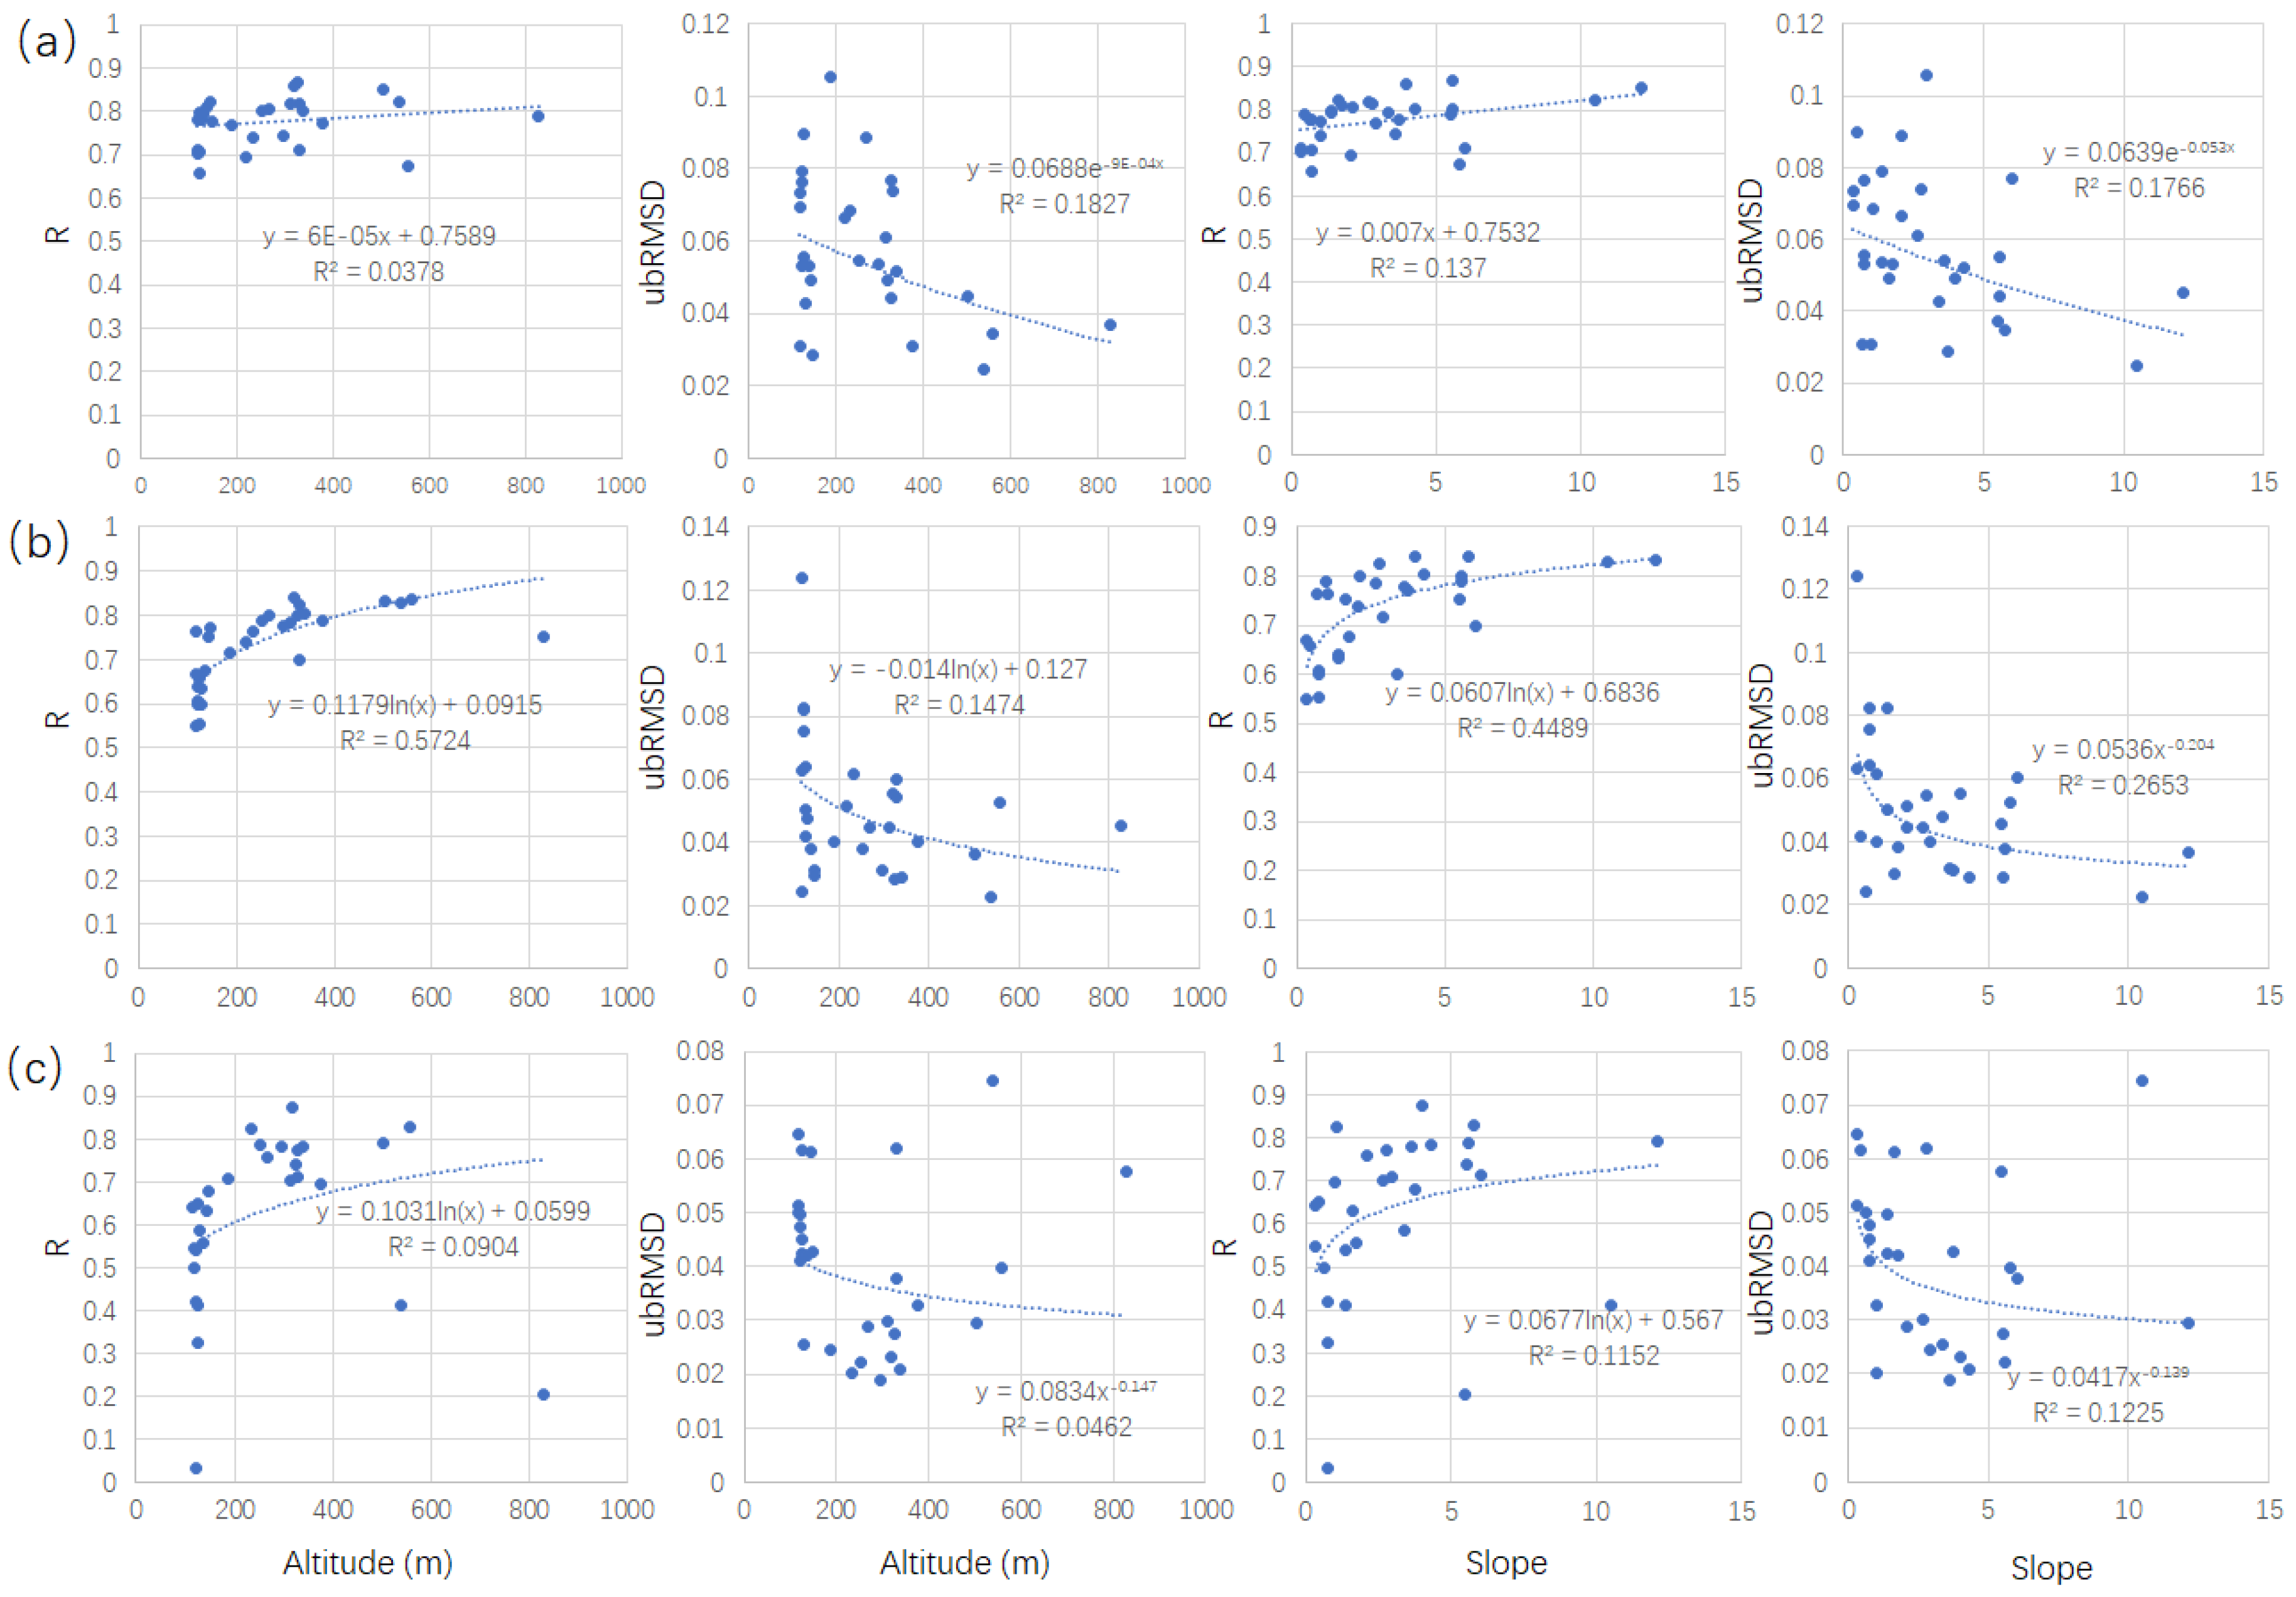
To furtherly address the relationship between terrain factors and the model errors, we plotted the R and ubRMSD and the altitude and slopes as scattered plots (Figure 12). As is shown in Figure 12, the model errors at individual stations have an evident negative relation with the terrain factors. Specifically, the R values tend to increase with the increasing of slopes and elevation, and the ubRMSD values are greater at stations at higher altitude and slopes. A possible explanation is that the observations at higher altitudes may have a greater contribution to the given model grid. This indicates that the model results have the potential to be improved by adjusting the assimilation scheme. However, it should be noted that results in this study are within the confines of the given model grid, and further analysis and validation over broader area need to be conducted by introducing more observations.
4. Conclusions
Root zone soil moisture is as important as surface soil moisture in various hydrological models. Limited by the penetration depth of microwave signals, satellite-based soil moisture data can only provide quantitative information about the water content of a shallow near surface layer. Root zone soil moisture can be estimated by using assimilation algorithms that combine observations and model trajectory. Soil water content information in deeper layers can then be propagated from surface observations. However, few systemic evaluations on the multi-layer reanalysis soil moisture from surface to root zone have been carried out currently. In this study, we evaluated the ERA-Interim reanalysis soil moisture at soil level depths of 0–7 cm, 7–28 cm, and 28–100 cm based on in situ measurements of the OzNet hydrological network over southeast Australia. A corresponding relationship between the soil layer depths of ERA-Interim and the measured depths of in situ sites of the OzNet network was established.
Generally, the ERA soil moisture product at depths of 0–7 cm and 7–28 cm show good agreement with in situ measurements and nicely capture the time variations of in situ soil moisture. The R value of the ERA soil moisture at the top two layers ranges from 0.73 to 0.84, and the ubRMSD of these two layers ranges from 0.035 m3·m−3 to 0.060 m3·m−3. At the root zone of 28–100 cm, the ERA soil moisture product shows poorer performance than other two layers. The R value at layer 3 ranges from 0.56 to 0.68; these are lower values than for layer 1 and layer 2. This relative poorer correlation is mainly caused by the discrepancy in winter months. Additionally, The ubRMSD for layer 3 ranges between 0.031 m3·m-3 and 0.052 m3·m−3. In general, the ERA soil moisture also can reflect temporal dynamics of soil moisture at root zone layer, but low correlations can be found in winter. At the top two layers, the ERA soil moisture product overestimates in situ measurements, whereas the product shows underestimations comparing with in situ soil moisture at root zone of 28–100 cm. The performance of ERA soil moisture product varied remarkably during different seasons, especially for soil depths of 28–100 cm in winter. The R values at Adelong and Yanco for ERA layer 3 soil moisture in the winter are 0.045 and 0.22, much lower than those in other seasons. Moreover, the ERA soil moisture of different layers shows much fewer differences and smaller inter-deviations compared with the in situ soil moisture of different soil layers, indicating the ERA soil moisture does not well reflect inter-variations through soil layers.
Although a corresponding relationship between the soil layer depths of ERA and the measured depths of in situ sites of the OzNet network was established in this study, the deepest depth researched by the OzNet network in situ sites is 90 cm, shallower than for the ERA soil moisture product. Therefore, it should be noted that the layer depths of the two datasets did not strictly correspond. This study focused on the OzNet hydrological network in southeast Australia, and the land cover types of those implemented sites are mainly grasslands and croplands. Thus, the conclusions in this study may not reflect the product’s accuracy in other areas and other landscapes. A comprehensive understanding of the ERA-Interim soil moisture product at different soil level depths would require more systemic analysis with a greater number of networks across the globe in the future.
Author Contributions
W.J. designed the research then drafted the manuscript. J.S. conceived and improved the research. X.Z. reviewed the manuscript. All the authors contributed to editing manuscript and collecting data utilized in this paper.
Funding
This study were jointly funded by the National Natural Science Foundation of China (41801362, 41771380), the Natural Science Foundation of Guangdong Province, China (2018A030310470), the GDAS′ Project of Science and Technology Development (2017GDASCX-0101, 2018GDASCX-0904), the Guangdong Innovative and Entrepreneurial Research Team Program (2016ZT06D336), the 13th Five-year Informatization Plan of Chinese Academy of Sciences (XXH13503-07), the State Key Laboratory of Resources and Environmental Information System (O88RA20CYA), and the National Earth System Science Data Sharing Infrastructure (http://www.geodata.cn/).
Acknowledgments
The authors would like to acknowledge the European Centre for Medium-Range Weather Forecasts for providing ERA-Interim reanalysis data, and the OzNet hydrological monitoring network jointly operated by Department of Civil Engineering, Monash University and Department of Infrastructure Engineering, the University of Melbourne for providing in situ measurement soil moisture data. The authors would also like to thank the anonymous reviewers for their helpful comments and suggestions.
Conflicts of Interest
The authors declare that they have no conflict of interest.
References
- Vereevken, H.; Maes, J.; Feyen, J.; Darius, P. Estimating the soil moisture retention characteristic from texture, bulk density, and carbon content. Soil Sci. 1989, 148, 389–403. [Google Scholar] [CrossRef]
- Koster, R.D.; Dirmeyer, P.A.; Guo, Z.; Bonan, G.; Chan, E.; Cox, P.; Gordon, C.T.; Kanae, S.; Kowalczyk, E.; Lawrence, D.; et al. Regions of strong coupling between soil moisture and precipitation. Science 2004, 305, 1138–1140. [Google Scholar] [CrossRef] [PubMed]
- Chauhan, N.S.; Miller, S.; Ardanuy, P. Spaceborne soil moisture estimation at high resolution: A microwave-optical/ir synergistic approach. Int. J. Remote Sens. 2003, 24, 4599–4622. [Google Scholar] [CrossRef]
- Qiu, J.; Gao, Q.; Wang, S.; Su, Z. Comparison of temporal trends from multiple soil moisture data sets and precipitation: The implication of irrigation on regional soil moisture trend. Int. J. Appl. Earth Obs. Geoinform. 2016, 48, 17–27. [Google Scholar] [CrossRef] [Green Version]
- Su, B.; Wang, A.; Wang, G.; Wang, Y.; Jiang, T. Spatiotemporal variations of soil moisture in the tarim river basin, china. Int. J. Appl. Earth Obs. Geoinform. 2016, 48, 122–130. [Google Scholar] [CrossRef]
- Western, A.W.; Zhou, S.-L.; Grayson, R.B.; McMahon, T.A.; Blöschl, G.; Wilson, D.J. Spatial correlation of soil moisture in small catchments and its relationship to dominant spatial hydrological processes. J. Hydrol. 2004, 286, 113–134. [Google Scholar] [CrossRef]
- Kerr, Y.H.; Waldteufel, P.; Wigneron, J.P.; Martinuzzi, J.; Font, J.; Berger, M. Soil moisture retrieval from space: The soil moisture and ocean salinity (smos) mission. IEEE Trans. Geosci. Remote Sens. 2002, 39, 1729–1735. [Google Scholar] [CrossRef]
- Njoku, E.G.; Wilson, W.J.; Yueh, S.H.; Dinardo, S.J. Observations of soil moisture using a passive and active low-frequency microwave airborne sensor during sgp99. IEEE Trans. Geosci. Remote Sens. 2002, 40, 2659–2673. [Google Scholar] [CrossRef]
- Koike, T.; Nakamura, Y.; Kaihotsu, I.; Davaa, G.; Matsuura, N.; Tamagawa, K.; Fujii, H. Development of an advanced microwave scanning radiometer (AMSR-E) algorithm for soil moisture and vegetation water content. Proc. Hydraul. Eng. 2004, 48, 217–222. [Google Scholar] [CrossRef]
- De Jeu, R.; Wagner, W.; Holmes, T.; Dolman, A.; Van De Giesen, N.; Friesen, J. Global soil moisture patterns observed by space borne microwave radiometers and scatterometers. Surv. Geophys. 2008, 29, 399–420. [Google Scholar] [CrossRef] [Green Version]
- Entekhabi, D.; Njoku, E.; O’Neill, P.; Spencer, M.; Jackson, T.; Entin, J.; Im, E.; Kellogg, K. The soil moisture active/passive mission (smap). IEEE Int. Geosci. Remote Sens. Symp. 2008. [Google Scholar] [CrossRef]
- Kerr, Y.H.; Waldteufel, P.; Richaume, P.; Wigneron, J.P.; Ferrazzoli, P.; Mahmoodi, A.; Bitar, A.A.; Cabot, F.; Gruhier, C.; Juglea, S.E.; et al. The smos soil moisture retrieval algorithm. IEEE Trans. Geosci. Remote Sens. 2012, 50, 1384–1403. [Google Scholar] [CrossRef]
- Kellogg, K.; Njoku, E.; Thurman, S.; Edelstein, W.; Jai, B.; Spencer, M.; Chen, G.S.; Entekhabi, D.; O′Neill, P.; Piepmeier, J. Nasa′s soil moisture active and passive (smap) mission. In Proceedings of the 2010 SPIE Remote Sensing Conference, Toulouse, France, 4–5 June 2010. [Google Scholar]
- Kerr, Y.H.; Waldteufel, P.; Wigneron, J.P.; Delwart, S.; Cabot, F.; Boutin, J.; Escorihuela, M.J.; Font, J.; Reul, N.; Gruhier, C.; et al. The smos mission: New tool for monitoring key elements ofthe global water cycle. Proc. IEEE 2010, 98, 666–687. [Google Scholar] [CrossRef] [Green Version]
- Cui, Y.; Long, D.; Hong, Y.; Zeng, C.; Zhou, J.; Han, Z.; Liu, R.; Wan, W. Validation and reconstruction of fy-3b/mwri soil moisture using an artificial neural network based on reconstructed modis optical products over the tibetan plateau. J. Hydrol. 2016, 543, 242–254. [Google Scholar] [CrossRef]
- Peng, J.; Loew, A.; Merlin, O.; Verhoest, N.E.C. A review of spatial downscaling of satellite remotely sensed soil moisture. Rev. Geophys. 2017, 55, 341–366. [Google Scholar] [CrossRef] [Green Version]
- Dorigo, W.; Wagner, W.; Albergel, C.; Albrecht, F.; Balsamo, G.; Brocca, L.; Chung, D.; Ertl, M.; Forkel, M.; Gruber, A.; et al. Esa cci soil moisture for improved earth system understanding: State-of-the art and future directions. Remote Sens. Environ. 2017, 203, 185–215. [Google Scholar] [CrossRef]
- Sabater, J.M.; Jarlan, L.; Calvet, J.-C.; Bouyssel, F.; Rosnay, P.D. From near-surface to root-zone soil moisture using different assimilation techniques. J. Hydrometeorol. 2007, 8, 194–206. [Google Scholar] [CrossRef]
- Calvet, J.-C.; Noilhan, J.; Bessemoulin, P. Retrieving the root-zone soil moisture from surface soil moisture or temperature estimates: A feasibility study based on field measurements. J. Appl. Meteorol. 1998, 37, 371–386. [Google Scholar] [CrossRef]
- Kornelsen, K.C.; Coulibaly, P. Root-zone soil moisture estimation using data-driven methods. Water Resour. Res. 2014, 50, 2946–2962. [Google Scholar] [CrossRef] [Green Version]
- Dee, D.P.; Uppala, S.M.; Simmons, A.J.; Berrisford, P.; Poli, P.; Kobayashi, S.; Andrae, U.; Balmaseda, M.A.; Balsamo, G.; Bauer, P.; et al. The era-interim reanalysis: Configuration and performance of the data assimilation system. Q. J. R. Meteorol. Soc. 2011, 137, 553–597. [Google Scholar] [CrossRef]
- Uppala, S.M.; KÅllberg, P.W.; Simmons, A.J.; Andrae, U.; Bechtold, V.D.C.; Fiorino, M.; Gibson, J.K.; Haseler, J.; Hernandez, A.; Kelly, G.A.; et al. The era-40 re-analysis. Q. J. R. Meteorol. Soc. 2005, 131, 2961–3012. [Google Scholar] [CrossRef]
- Wagner, W. Evaluation of the agreement between the first global remotely sensed soil moisture data with model and precipitation data. J. Geophys. Res. 2003, 108, 4611–4620. [Google Scholar] [CrossRef]
- Draper, C.S.; Walker, J.P.; Steinle, P.J.; de Jeu, R.A.M.; Holmes, T.R.H. An evaluation of amsr–e derived soil moisture over australia. Remote Sens. Environ. 2009, 113, 703–710. [Google Scholar] [CrossRef]
- Bitar, A.A.; Leroux, D.; Kerr, Y.H.; Merlin, O.; Richaume, P.; Sahoo, A.; Wood, E.F. Evaluation of smos soil moisture products over continental U.S. Using the scan/snotel network. IEEE Trans. Geosci. Remote Sens. 2012, 50, 1572–1586. [Google Scholar] [CrossRef] [Green Version]
- Peng, J.; Niesel, J.; Loew, A.; Zhang, S.; Wang, J. Evaluation of satellite and reanalysis soil moisture products over southwest china using ground-based measurements. Remote Sens. 2015, 7, 15729–15747. [Google Scholar] [CrossRef]
- Griesfeller, A.; Lahoz, W.A.; de Jeu, R.A.M.; Dorigo, W.; Haugen, L.E.; Svendby, T.M.; Wagner, W. Evaluation of satellite soil moisture products over norway using ground-based observations. Int. J. Appl. Earth Obs. Geoinform. 2016, 45, 155–164. [Google Scholar] [CrossRef]
- Zhang, X.; Zhang, T.; Zhou, P.; Shao, Y.; Gao, S. Validation analysis of smap and amsr2 soil moisture products over the united states using ground-based measurements. Remote Sens. 2017, 9, 104. [Google Scholar] [CrossRef]
- Kędzior, M.; Zawadzki, J. Smos data as a source of the agricultural drought information: Case study of the vistula catchment, poland. Geoderma 2017, 306, 167–182. [Google Scholar] [CrossRef]
- Kędzior, M.; Zawadzki, J. Comparative study of soil moisture estimations from smos satellite mission, gldas database, and cosmic-ray neutrons measurements at cosmos station in eastern poland. Geoderma 2016, 283, 21–31. [Google Scholar] [CrossRef]
- Zeng, J.; Li, Z.; Chen, Q.; Bi, H.; Qiu, J.; Zou, P. Evaluation of remotely sensed and reanalysis soil moisture products over the tibetan plateau using in-situ observations. Remote Sens. Environ. 2015, 163, 91–110. [Google Scholar] [CrossRef]
- Fang, L.; Hain, C.R.; Zhan, X.; Anderson, M.C. An inter-comparison of soil moisture data products from satellite remote sensing and a land surface model. Int. J. Appl. Earth Obs. Geoinform. 2016, 48, 37–50. [Google Scholar] [CrossRef]
- Albergel, C.; De Rosnay, P.; Balsamo, G.; Isaksen, L.; Muñozsabater, J. Soil moisture analyses at ecmwf: Evaluation using global ground-based in situ observations. J. Hydrometeorol. 2012, 13, 1442–1460. [Google Scholar] [CrossRef]
- Penna, D.; Brocca, L.; Borga, M.; Dalla Fontana, G. Soil moisture temporal stability at different depths on two alpine hillslopes during wet and dry periods. J. Hydrol. 2013, 477, 55–71. [Google Scholar] [CrossRef]
- Martínez-Fernández, J.; Ceballos, A. Temporal stability of soil moisture in a large-field experiment in spain. Soil Sci. Soc. Am. J. 2003, 67, 1647–1656. [Google Scholar] [CrossRef]
- Smith, A.B.; Walker, J.P.; Western, A.W.; Young, R.I.; Ellett, K.M.; Pipunic, R.C.; Grayson, R.B.; Siriwardena, L.; Chiew, F.H.S.; Richter, H. The murrumbidgee soil moisture monitoring network data set. Water Resour. Res. 2012, 48, 7701. [Google Scholar] [CrossRef]
- Albergel, C.; Dorigo, W.; Reichle, R.H.; Balsamo, G.; de Rosnay, P.; Muñoz-Sabater, J.; Isaksen, L.; de Jeu, R.; Wagner, W. Skill and global trend analysis of soil moisture from reanalyses and microwave remote sensing. J. Hydrometeorol. 2013, 14, 1259–1277. [Google Scholar] [CrossRef]
- Balsamo, G.; Albergel, C.; Beljaars, A.; Boussetta, S.; Brun, E.; Cloke, H.; Dee, D.; Dutra, E.; Muñoz-Sabater, J.; Pappenberger, F.; et al. Era-interim/land: A global land surface reanalysis data set. Hydrol. Earth Syst. Sci. 2015, 19, 389–407. [Google Scholar] [CrossRef]
- Paris Anguela, T.; Zribi, M.; Hasenauer, S.; Habets, F.; Loumagne, C. Analysis of surface and root-zone soil moisture dynamics with ers scatterometer and the hydrometeorological model safran-isba-modcou at grand morin watershed (France). Hydrol. Earth Syst. Sci. 2008, 12, 1415–1424. [Google Scholar] [CrossRef] [Green Version]
- Wang, X.; Xie, H.; Guan, H.; Zhou, X. Different responses of modis-derived ndvi to root-zone soil moisture in semi-arid and humid regions. J. Hydrol. 2007, 340, 12–24. [Google Scholar] [CrossRef]
- Choi, M.; Jacobs, J.M. Soil moisture variability of root zone profiles within smex02 remote sensing footprints. Adv. Water Resour. 2007, 30, 883–896. [Google Scholar] [CrossRef]
- Breiman, L. Random forest. Mach. Learn. 2001, 45, 5–32. [Google Scholar] [CrossRef]
- Belgiu, M.; Drăguţ, L. Random forest in remote sensing: A review of applications and future directions. ISPRS J. Photogramm. Remote Sens. 2016, 114, 24–31. [Google Scholar] [CrossRef]
- He, L.; Chen, J.M.; Chen, K.S. Simulation and smap observation of sun-glint over the land surface at the l-band. IEEE Trans. Geosci. Remote Sens. 2017, 55, 2589–2604. [Google Scholar] [CrossRef]
- Jin, M.; Zheng, X.; Jiang, T.; Li, X.; Li, X.J.; Zhao, K. Evaluation and improvement of smos and smap soil moisture products for soils with high organic matter over a forested area in northeast china. Remote Sens. 2017, 9, 387. [Google Scholar] [CrossRef]
- Jing, W.; Song, J.; Zhao, X. A comparison of ecv and smos soil moisture products based on oznet monitoring network. Remote Sens. 2018, 10, 703. [Google Scholar] [CrossRef]
- Bicheron, P.; Amberg, V.; Bourg, L.; Petit, D.; Huc, M.; Miras, B.; Brockmann, C.; Hagolle, O.; Delwart, S.; Ranera, F. Geolocation assessment of meris globcover orthorectified products. IEEE Trans. Geosci. Remote Sens. 2011, 49, 2972–2982. [Google Scholar] [CrossRef] [Green Version]
- Fischer, G.; Velthuizen, H.V.; Shah, M.; Nachtergaele, F. Global Agro-Ecological Zones Assessment for Agriculture (GAEZ 2008); International Institute for Applied Systems Analysis (IIASA): Laxenburg; Agriculture Organization of the United Nations: Rome, Italy, 2008. [Google Scholar]
- Douville, H.; Viterbo, P.; Mahfouf, J.-F.; Beljaars, A.C.M. Evaluation of the optimum interpolation and nudging techniques for soil moisture analysis using fife data. Mon. Weather Rev. 2000, 128, 1733–1756. [Google Scholar] [CrossRef]
Figure 1.
Spatial distribution of OzNet hydrological network sites. (The dashed grid in the figure illustrates the pixel size of the ERA soil moisture of 0.25° × 0.25°)
Figure 1.
Spatial distribution of OzNet hydrological network sites. (The dashed grid in the figure illustrates the pixel size of the ERA soil moisture of 0.25° × 0.25°)

Figure 2.
Error metrics at each individual site in Adelong for different layers.

Figure 3.
Comparison of area-averaged soil moisture temporal behaviors between the ERA product and in situ soil moisture at (a) layer 1, (b) layer 2, and (c) layer 3 in Adelong.
Figure 3.
Comparison of area-averaged soil moisture temporal behaviors between the ERA product and in situ soil moisture at (a) layer 1, (b) layer 2, and (c) layer 3 in Adelong.

Figure 4.
Error metrics at each individual site in Kyeamba for different layers.

Figure 5.
Comparisons of area-averaged soil moisture temporal behaviors between the ERA product and in situ soil moisture at (a) layer 1, (b) layer 2, and (c) layer 3 at Kyeamba.
Figure 5.
Comparisons of area-averaged soil moisture temporal behaviors between the ERA product and in situ soil moisture at (a) layer 1, (b) layer 2, and (c) layer 3 at Kyeamba.

Figure 6.
Error metrics at each individual site in Yanco for different layers.

Figure 7.
Comparisons of area-averaged soil moisture temporal behaviors between the ERA product and in situ soil moisture at (a) layer 1, (b) layer 2, and (c) layer 3 in Yanco.
Figure 7.
Comparisons of area-averaged soil moisture temporal behaviors between the ERA product and in situ soil moisture at (a) layer 1, (b) layer 2, and (c) layer 3 in Yanco.

Figure 8.
The modified Taylor diagrams displaying correlations, normalized bias, and normalized standard deviations between ERA soil moisture and in situ soil moisture in different subareas: (a) Adelong, (b) Kyeamba, (c) Yanco. (The in situ soil moisture at layer 1 was considered as the reference).
Figure 8.
The modified Taylor diagrams displaying correlations, normalized bias, and normalized standard deviations between ERA soil moisture and in situ soil moisture in different subareas: (a) Adelong, (b) Kyeamba, (c) Yanco. (The in situ soil moisture at layer 1 was considered as the reference).

Figure 9.
Temporal variations of standard deviation among three soil layers for ERA and in situ soil moisture.
Figure 9.
Temporal variations of standard deviation among three soil layers for ERA and in situ soil moisture.

Figure 10.
The feature importance values of four factors at different soil depths.

Figure 11.
(a) Land cover and (b) soil texture maps of the study area (the dashed line presents the pixel size of 0.25° × 0.25°).
Figure 11.
(a) Land cover and (b) soil texture maps of the study area (the dashed line presents the pixel size of 0.25° × 0.25°).

Figure 12.
Scatter plots between error metrics (R and ubRMSD) and terrain factors (altitude and slope) at individual stations for different soil layers: (a) soil layer 1, (b) soil layer 2, and (c) soil layer 3.
Figure 12.
Scatter plots between error metrics (R and ubRMSD) and terrain factors (altitude and slope) at individual stations for different soil layers: (a) soil layer 1, (b) soil layer 2, and (c) soil layer 3.


Table 1.
The corresponding relationship of ERA soil moisture and OzNet in situ soil moisture.
| Layers of ERA Soil Moisture | Depths of OzNet Soil Moisture |
|---|---|
| Layer 1 (0–7 cm) | 0–5 cm or 0–8 cm |
| Layer 2 (7–28 cm) | 0–30 cm |
| Layer 3 (28–100 cm) | Average of 30–60 cm and 60–90 cm |
Table 2.
The land cover types and latitudes/longitudes for sites of Adelong.
| Site Number | Latitude | Longitude | Land Cover Type |
|---|---|---|---|
| A1 | −35.4975 | 148.106488 | Savannas |
| A2 | −35.4283 | 148.131626 | Grasslands |
| A3 | −35.3997 | 148.101076 | Grasslands |
| A4 | −35.3731 | 148.066082 | Grasslands |
| A5 | −35.3602 | 148.085427 | Croplands |
Table 3.
The error metrics of three layers for Adelong area-averaged soil moisture. RMSE: root mean square error; ubRMSD: unbiased root mean square difference; R: correlation coefficient.
Table 3.
The error metrics of three layers for Adelong area-averaged soil moisture. RMSE: root mean square error; ubRMSD: unbiased root mean square difference; R: correlation coefficient.
| Soil Layers | Seasons | R | RMSE (m3·m−3) | ubRMSD (m3·m−3) | Bias |
|---|---|---|---|---|---|
| Layer 1 | All seasons | 0.727 | 0.104 | 0.037 | 0.627 |
| Spring | 0.685 | 0.104 | 0.039 | 0.558 | |
| Summer | 0.839 | 0.118 | 0.025 | 0.976 | |
| Autumn | 0.521 | 0.113 | 0.036 | 0.819 | |
| Winter | 0.725 | 0.066 | 0.022 | 0.293 | |
| Layer 2 | All seasons | 0.816 | 0.040 | 0.035 | 0.081 |
| Spring | 0.853 | 0.033 | 0.030 | 0.055 | |
| Summer | 0.881 | 0.049 | 0.024 | 0.214 | |
| Autumn | 0.590 | 0.047 | 0.033 | 0.170 | |
| Winter | 0.753 | 0.026 | 0.022 | −0.048 | |
| Layer 3 | All seasons | 0.575 | 0.078 | 0.043 | −0.202 |
| Spring | 0.623 | 0.070 | 0.040 | −0.173 | |
| Summer | 0.760 | 0.068 | 0.040 | −0.177 | |
| Autumn | 0.749 | 0.084 | 0.035 | −0.244 | |
| Winter | 0.045 | 0.089 | 0.052 | −0.216 |
Table 4.
The land cover types and latitudes/longitudes for sites in Kyeamba.
| Site Number | Latitude | Longitude | Land Cover Type | Site Number | Latitude | Longitude | Land Cover Type |
|---|---|---|---|---|---|---|---|
| K2 | −35.4353 | 147.531 | Croplands | K8 | −35.3163 | 147.344 | Grasslands |
| K3 | −35.4341 | 147.569 | Grasslands | K10 | −35.324 | 147.535 | Croplands |
| K4 | −35.4269 | 147.6 | Croplands | K11 | −35.272 | 147.429 | Grasslands |
| K5 | −35.4193 | 147.604 | Croplands | K12 | −35.2275 | 147.485 | Croplands |
| K6 | −35.3898 | 147.457 | Grasslands | K13 | −35.2389 | 147.533 | Grasslands |
| K7 | −35.3939 | 147.566 | Grasslands | K14 | −35.1249 | 147.497 | Croplands |
Table 5.
The error metrics of three layers for Kyeamba area-averaged soil moisture.
| Soil Layers | Seasons | R | RMSE (m3·m−3) | ubRMSD (m3·m−3) | Bias |
|---|---|---|---|---|---|
| Layer 1 | All seasons | 0.839 | 0.079 | 0.060 | 0.319 |
| Spring | 0.840 | 0.086 | 0.059 | 0.379 | |
| Summer | 0.884 | 0.080 | 0.049 | 0.472 | |
| Autumn | 0.843 | 0.086 | 0.036 | 0.632 | |
| Winter | 0.671 | 0.060 | 0.060 | −0.023 | |
| Layer 2 | All seasons | 0.792 | 0.064 | 0.038 | 0.310 |
| Spring | 0.781 | 0.078 | 0.042 | 0.392 | |
| Summer | 0.819 | 0.065 | 0.030 | 0.406 | |
| Autumn | 0.794 | 0.069 | 0.027 | 0.468 | |
| Winter | 0.761 | 0.035 | 0.031 | 0.083 | |
| Layer 3 | All seasons | 0.682 | 0.066 | 0.033 | −0.210 |
| Spring | 0.830 | 0.048 | 0.023 | −0.149 | |
| Summer | 0.689 | 0.059 | 0.029 | −0.201 | |
| Autumn | 0.702 | 0.066 | 0.035 | −0.224 | |
| Winter | 0.617 | 0.083 | 0.031 | −0.264 |
Table 6.
The land cover types and latitudes/longitudes for sites of Yanco.
| Site Number | Latitude | Longitude | Land Cover Type | Site Number | Latitude | Longitude | Land Cover Type |
|---|---|---|---|---|---|---|---|
| Y1 | −34.6289 | 145.849 | Croplands | Y8 | −34.847 | 146.414 | Croplands |
| Y2 | −34.6548 | 146.11 | Grasslands | Y9 | −34.9678 | 146.016 | Grasslands |
| Y3 | −34.6208 | 146.424 | Croplands | Y10 | −35.0054 | 146.31 | Grasslands |
| Y4 | −34.7194 | 146.02 | Croplands | Y11 | −35.1098 | 145.936 | Grasslands |
| Y5 | −34.7284 | 146.293 | Grasslands | Y12 | −35.0696 | 146.169 | Croplands |
| Y6 | −34.8426 | 145.867 | Grasslands | Y13 | −35.0903 | 146.306 | Grasslands |
| Y7 | −34.8518 | 146.115 | Open shrublands |
Table 7.
The error metrics of three layers for Yanco area-averaged soil moisture.
| Soil Layers | Seasons | R | RMSE (m3·m−3) | ubRMSD (m3·m−3) | Bias |
|---|---|---|---|---|---|
| Layer 1 | All seasons | 0.840 | 0.103 | 0.047 | 0.741 |
| Spring | 0.847 | 0.106 | 0.053 | 0.726 | |
| Summer | 0.832 | 0.106 | 0.050 | 0.921 | |
| Autumn | 0.755 | 0.111 | 0.041 | 1.024 | |
| Winter | 0.798 | 0.083 | 0.038 | 0.420 | |
| Layer 2 | All seasons | 0.738 | 0.045 | 0.044 | 0.022 |
| Spring | 0.768 | 0.039 | 0.039 | 0.013 | |
| Summer | 0.742 | 0.047 | 0.047 | −0.010 | |
| Autumn | 0.700 | 0.042 | 0.037 | 0.105 | |
| Winter | 0.665 | 0.050 | 0.050 | −0.006 | |
| Layer 3 | All seasons | 0.559 | 0.076 | 0.043 | −0.231 |
| Spring | 0.821 | 0.072 | 0.040 | −0.211 | |
| Summer | 0.716 | 0.083 | 0.038 | −0.276 | |
| Autumn | 0.812 | 0.085 | 0.035 | −0.281 | |
| Winter | 0.220 | 0.065 | 0.048 | −0.161 |
Table 8.
The average error metrics of three layers for different land cover types.
| Soil Layers | Land Cover Type | R | RMSE (m3·m−3) | UbRMSD (m3·m−3) | Bias | Number of Stations |
|---|---|---|---|---|---|---|
| Soil layer 1 | Croplands | 0.78 | 0.11 | 0.06 | 0.73 | 12 |
| Grasslands | 0.77 | 0.11 | 0.06 | 0.77 | 16 | |
| Open shrublands | 0.79 | 0.13 | 0.04 | 1.38 | 1 | |
| Savannas | 0.79 | 0.08 | 0.04 | 0.38 | 1 | |
| Soil layer 2 | Croplands | 0.74 | 0.08 | 0.05 | 0.34 | 12 |
| Grasslands | 0.72 | 0.08 | 0.05 | 0.28 | 16 | |
| Open shrublands | 0.60 | 0.06 | 0.05 | 0.17 | 1 | |
| Savannas | 0.75 | 0.05 | 0.05 | −0.08 | 1 | |
| Soil layer 3 | Croplands | 0.60 | 0.10 | 0.04 | −0.14 | 12 |
| Grasslands | 0.61 | 0.08 | 0.04 | −0.12 | 16 | |
| Open shrublands | 0.59 | 0.04 | 0.03 | −0.15 | 1 | |
| Savannas | 0.21 | 0.12 | 0.06 | −0.30 | 1 |
Table 9.
The average error metrics of three layers for different soil textures.
| Soil Layers | Land Cover Type | R | RMSE (m3·m−3) | UbRMSD (m3·m−3) | Bias | Number of Stations |
|---|---|---|---|---|---|---|
| Soil layer 1 | Loamy sand | 0.76 | 0.11 | 0.06 | 0.77 | 9 |
| Sandy clay loam | 0.73 | 0.13 | 0.04 | 1.07 | 2 | |
| Silty loam | 0.76 | 0.12 | 0.07 | 0.81 | 11 | |
| Sandy loam | 0.82 | 0.10 | 0.05 | 0.59 | 8 | |
| Soil layer 2 | Loamy sand | 0.64 | 0.09 | 0.07 | 0.06 | 9 |
| Sandy clay loam | 0.79 | 0.07 | 0.05 | 0.18 | 2 | |
| Silty loam | 0.73 | 0.07 | 0.05 | 0.31 | 11 | |
| Sandy loam | 0.81 | 0.08 | 0.04 | 0.55 | 8 | |
| Soil layer 3 | Loamy sand | 0.50 | 0.09 | 0.04 | -0.22 | 9 |
| Sandy clay loam | 0.52 | 0.10 | 0.05 | -0.25 | 2 | |
| Silty loam | 0.58 | 0.11 | 0.04 | −0.20 | 11 | |
| Sandy loam | 0.72 | 0.06 | 0.03 | 0.07 | 8 |
© 2018 by the authors. Licensee MDPI, Basel, Switzerland. This article is an open access article distributed under the terms and conditions of the Creative Commons Attribution (CC BY) license (http://creativecommons.org/licenses/by/4.0/).
Share and Cite
MDPI and ACS Style
Jing, W.; Song, J.; Zhao, X. Validation of ECMWF Multi-Layer Reanalysis Soil Moisture Based on the OzNet Hydrology Network. Water 2018, 10, 1123. https://doi.org/10.3390/w10091123
AMA Style
Jing W, Song J, Zhao X. Validation of ECMWF Multi-Layer Reanalysis Soil Moisture Based on the OzNet Hydrology Network. Water. 2018; 10(9):1123. https://doi.org/10.3390/w10091123
Chicago/Turabian StyleJing, Wenlong, Jia Song, and Xiaodan Zhao. 2018. "Validation of ECMWF Multi-Layer Reanalysis Soil Moisture Based on the OzNet Hydrology Network" Water 10, no. 9: 1123. https://doi.org/10.3390/w10091123
Note that from the first issue of 2016, this journal uses article numbers instead of page numbers. See further details here.