1. Introduction
Europe is one of the most urbanized continents in the world. More than two-thirds of the European population lives in urban areas and this share continues to grow [
1]. Besides the urbanization, climate change as well as demand for goods and services may influence water demand. In different cities, this impact will be different. Part of water is delivered by public water supply (public or private systems with public access). Although the share of the households water demand in total water abstraction can be relatively small, it is nevertheless often the focus of public interest, as it comprises the water volumes that are directly used by the population. The way in which water is managed in cities has consequences both for city dwellers and for the wider community and hence dictates water availability (in both quantity and quality) for other users. It thus also influences the environmental, economic, and social development of regions and countries. For those reasons sustainable, efficient and equitable management of water in cities has never been as important as in today’s world. Looking forward to the next few decades, it seems likely that there will be a significant expansion in urban water infrastructure. Additionally, urban development, especially the sealing of surfaces and land use change, put pressure on urban infrastructure and quality of water discharged to the water bodies [
2]. The lack of interaction between heterogeneous users, decision-makers, and isolated water managers has caused serious degradation of water resources and increased the risks to all the developmental sectors that depend upon them [
3]. The traditional methods for the analysis and assessment of water availability as well as quality are not sufficient to evaluate the equitable utilization of available water and sustainable water management due to different ambient conditions as well as efficiency of use which differs between cities. One of the relevant approaches recognized by the EU to contribute positively to water management is the water footprint assessment [
4]. The water footprint (WF) concept was introduced by Hoekstra as an indicator of freshwater use [
5]. For years, the approach was continuously developed and now there are two methodologies (water footprint developed by The Water Footprint Network and Life Cycle Assessment developed by the Life Cycle Assessment community) used to calculate WF. Debate on their potential common grounds and differences is still ongoing [
6]. WF was introduced to support better water management, however the experience at an urban level is limited. Most work on the water footprint has focused on agriculture and food production [
7]. However, growing concern about water scarcity makes the concept of the water footprint potentially useful to other sectors, such as water utilities as well as with politicians, planners, and other stakeholders who have an influence on the investments and policies associated with water management at urban areas. For these reasons, the usage of tools to promote and encourage relevant measures, solutions, and technologies at a local (urban) scale is one of the key challenges for water footprint analyses, as well as the assessment and prediction of the influence of local policy on urban water [
8]. Water should be managed both from a qualitative and quantitative perspective. Urban utilities frequently and independently assess water availability and vulnerability as a part of their planning processes which influence residential, commercial, and industrial development and land use patterns [
6,
9]. Changes in water quality pose a risk to aquatic ecosystems, but also involve the need to modify the water treatment technologies which significantly boosts the cost of its production and distribution [
10]. The water footprint concept applied at an urban scale can be used as a measure to improve the communication with customers about their impact on the water environment which eventually influences conservation behavior [
8]. It can be used as an awareness raising tool in decision making and in public debate by linking water supply, water use, as well as quality and quantity of sewage discharged to the receiving water [
11].
Current urban studies have employed approaches for single cities and have adopted the water footprint accounting approach [
12]. This kind of water footprint studies have been performed for Berlin (Germany), Delhi (India), Lagos (Nigeria) [
13], Leshan (China) [
14], Beijing (China) [
15], Milan (Italy) [
16], and Wroclaw (Poland) [
17]. The majority of the cities WF studies set emphasis on evaluating virtual water (VW) which is mostly a focus on food consumption [
18,
19]. However, municipalities and water managers have limited influence on indirect (virtual) water use in the cities (e.g., by water saving campaigns regarding virtual water) but their impact on direct water use is much higher (e.g., applying tariffs, modernizing infrastructure, implementing water saving technologies, and organizing water saving campaigns). As the first has already been elaborated in many publications [
15,
20], the latter was not supported by WF analysis. In order to manage water resources in effective, efficient, and consistent way, decision making companies require access to appropriate data. A detailed assessment of the water footprint for urban areas would require the collection of a large amount of data and application of complex and sophisticated models [
6]. This could restrict a wide application of the WF approach in the management of water in cities.
Therefore, the primary objective of this study is to propose a model which simplifies water footprint accounting of direct water use in urban area by adapting the approach proposed by Hoekstra et al. [
12]. The proposed model is intended to support urban water managers and, as such, it can include additional aspects usually disregarded in previous water footprint of cities. To clarify this, the relevant equations to calculate components of urban WF are presented in the Methodology section. The model is tested through the application in three case studies (cities) with different characteristics. The results are presented using different metrics. To prove the effectiveness of a less data-intensive model, it is compared with the results of Manzardo et al. [
11]. The authors of this paper propose to use the WF to solely investigate the direct water use in urban areas because it is the one directly managed by the local municipality. This paper is therefore a new contribution in applying WF. The discussion elaborates the secondary objective of this paper, which is the demonstration of model usefulness in supporting the definition of urban water management strategies and solutions. Differences between the proposed model and the one of Manzardo et al. [
11] are further clarified in the discussion section.
2. Materials and Methods
The scope of this study focuses on the WF of direct water use which after Hoekstra et al. [
12] refers to the freshwater consumption and pollution associated to the water use within city boundaries considering only urban area defined as locations with over 50% constructed surfaces [
11]. Agricultural use within the city is excluded in this research. Considering that WF assessment in complex environments, such as urban areas, can be very challenging and resource consuming (time and money) a simplified method is needed. The novelty of proposed approach is not in the method itself but in improving applicability of the method in this specific context.
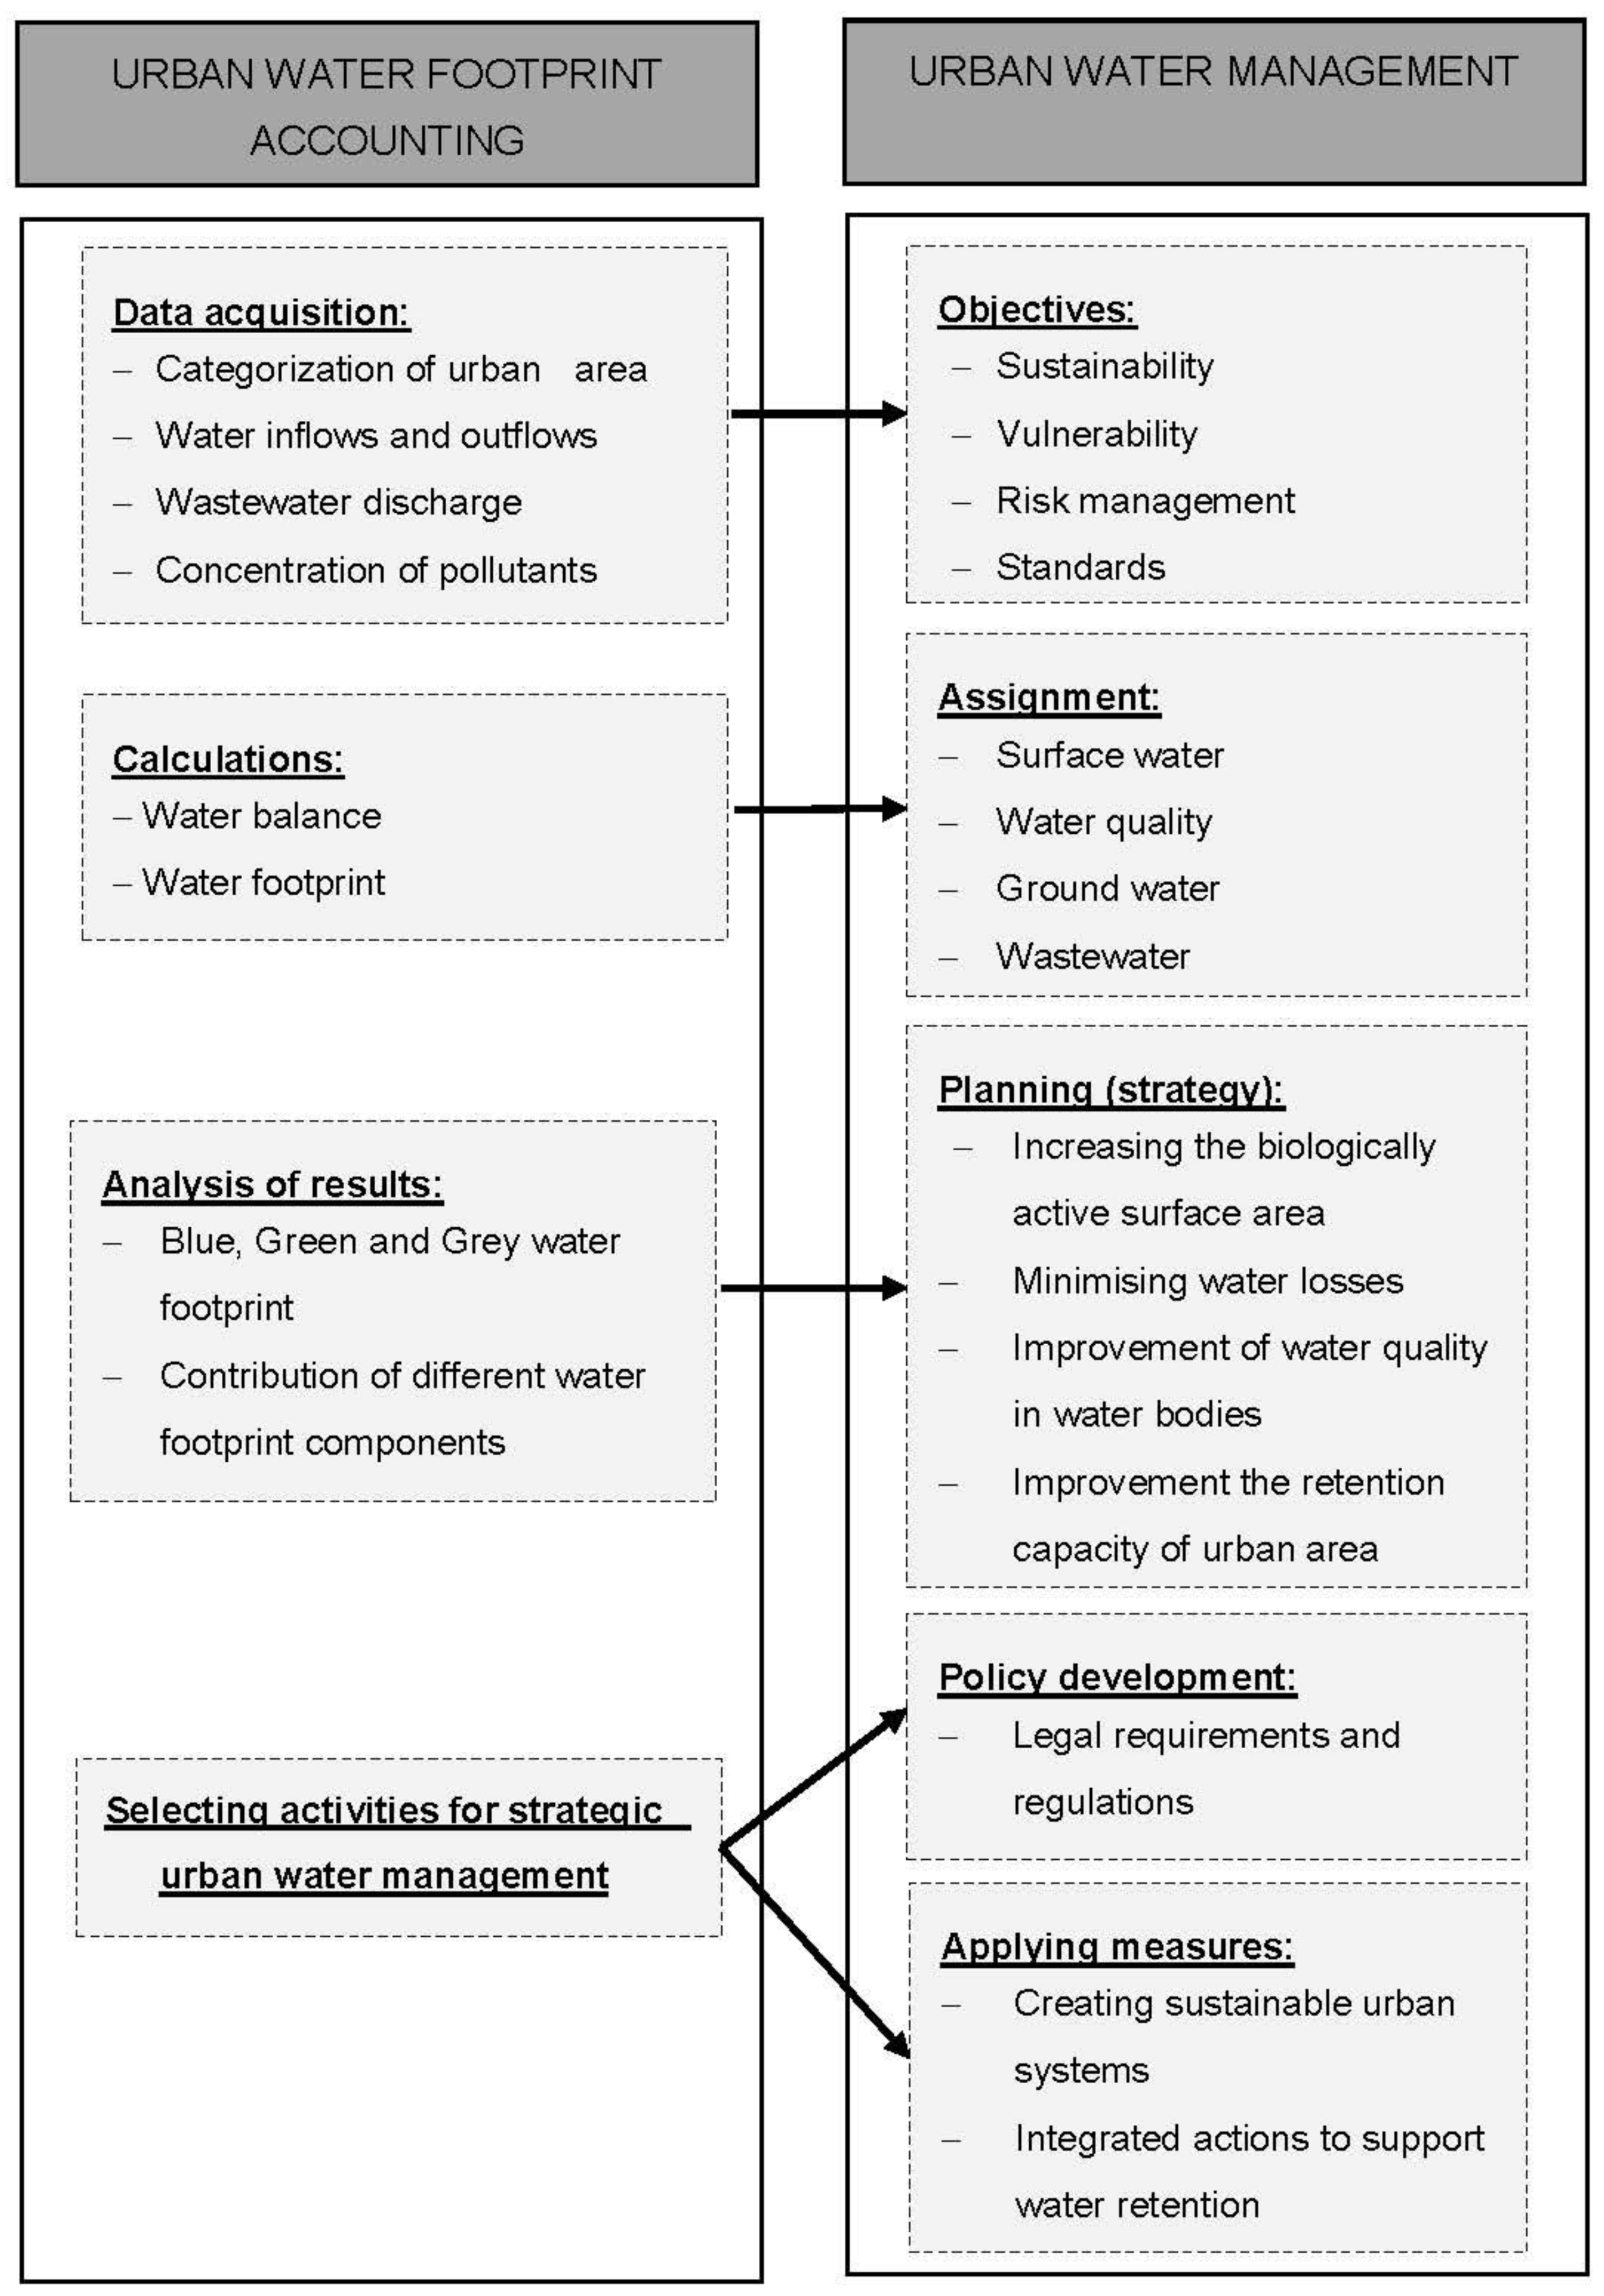
The simplified approach developed for urban areas and its application in urban water management is presented in
Figure 1. The whole process starts with dividing the urban area into generic categories such as: impermeable area, permeable area, and water area. These categories can be subdivided further into surfaces characterized with similar water use pattern, e.g., impermeable area can be represented by paved area, roof surface, and transportation area, permeable area can consist of public and private green surfaces. The number of surfaces will depend on the local representation of urban area used by a municipality and the objectives set-up in urban water management. During the data acquisition phase, parameters characterizing all surfaces (area, evaporation coefficients), as well as water inflows and outflows (including mean annual precipitation), wastewater discharge and the concentration of pollutants are collected. The sources of the data can be found in municipalities, local water companies, legal regulations, and publicly accessible databases.
The calculation phase requires to perform a water balance for the urban area. In order to reduce the calculation effort it is recommended to use simple models [
21]. The following paragraph describes how the green, blue, and grey components of WF are calculated for the urban area. This phase is complementary with the assignment of water quantity and quality in the urban area.
Calculated WF is evaluated during analysis of results phase and finally its findings are used to support creating or modifying urban water management strategies and plans. They also allow selecting activities aimed to reduce the urban WF which could stimulate policy development and create sustainable urban systems.
2.1. Urban Water Footprint Accounting Formulation
The green water footprint (WF
green) refers to the total rainwater evapotranspiration (from fields and plantations) plus the water incorporated into the harvested crop or wood [
12]. In the urban environment, Manzardo et al. [
11] proposed to limit accounting of WF
green to green areas, such as private (gardens) or recreational land (lawns, public parks). According to this definition, WF
green depends directly on the area with permeable surface covered by private and public vegetation
where the coefficients K
pubg and K
privg represent fraction of precipitation PREC (mm/a) which evapotranspirates from public green area A
pubg (m
2) and private green area A
privg (m
2), respectively. As the urban area does not include agricultural land, it is assumed that water used for agricultural activities, which might be present within city boundaries, is excluded from calculating urban WF.
The blue water footprint (WF
blue) is the consumption of blue water resources, i.e., surface and groundwater withdrawn and not returned to the same water body [
12]. According to this definition and its adaptation done by Manzardo et al. [
11] it is proposed that WF
blue in urban area accounts for the part of rainwater that evaporates from impervious surfaces Q
imperm (such as roads and car parks) (m
3/a) and from water surfaces (rivers, ponds) Q
water (m
3/a), water that is lost due to heating and cooling processes Q
therm (heating plants) (m
3/a), water exported outside the city boundary Q
exp (m
3/a), loss of supply water during transportation Q
tl (m
3/a), water consumed by the citizens and services and stored for a long term usage Q
del (m
3/a)
If the impermeable area is further subdivided into transportation area A
transp (m
2), roof area A
roof (m
2), and paved area A
paved (m
2) the volume of water evaporated from impervious surfaces can be calculated using the following formula
where K
transp, K
roof, and K
paved (unitless) represent fractions of precipitation PREC (mm/a) which evaporates from transportation, roof and paved surfaces respectively.
The volume of water which evaporates from the area covered by water A
water (m
2) is expressed as
where K
water (unitless) is the fraction of precipitation which evaporates from water surfaces.
The volume of water lost due to heating and cooling processes is assessed based on input–output water balance
where Q
cool is the volume of water withdrawn from the water body (m
3/a) by a thermal power plant and Q
heat is the volume of water which is discharged after use to the water body (m
3/a).
The most ambitious term to assess in Equation (2) is the volume of water consumed and stored Q
del (m
3/a). To avoid laborious activities in collecting data about citizens water usage, a simple water balance of an urban catchment can be applied [
22]
where A
urban is the total urban area in the city, Q
imp the volume of water imported to the city (m
3/a), Q
evap the total volume of water evaporated (m
3/a), Q
runoff the loss of water due to surface runoff (m
3/a), and Q
waste wastewater discharge (m
3/a).
The grey water footprint (WF
grey) is defined as the volume of freshwater that is required to assimilate the load of pollutants discharged into a receiving water body based on natural background concentrations and existing ambient water quality standards [
12]. In the urban environment, the pollution of water can be of chemical or thermal nature. In the case of pollution by chemicals, the WF
grey is calculated as
where c
sewage is the concentration of a pollutant in treated sewage discharged into receiving water body(g/m
3), Q
sewage the volume of sewage discharged into receiving water body by the sewage treatment plant (m
3/a), c
act is the actual concentration of a pollutant in water abstracted for consumption (g/m
3), Q
abstr the volume of abstraction by the water treatment plant (m
3/a), c
max the ambient water quality standard for a pollutant (the maximum acceptable concentration) (g/m
3), and c
nat the natural concentration of a pollutant in the receiving water body(g/m
3). In the case of separate sewage systems, WF
grey should be calculated separately for the treated and untreated wastewater.
When water is used for cooling—e.g., in thermal power plants—the processed water is discharged into the receiving water body, causing thermal pollution producing WF
grey which can be calculated as
where T
heat is the temperature of the heated water discharged into the receiving water body (°C), T
act the actual temperature of water in a receiving water body (°C), T
max the maximum acceptable temperature in a receiving water body (°C), T
nat the natural temperature in a receiving water body (°C), and Q
heat the volume of water which was discharged after use (m
3/a).
The final value of WF
grey is the maximum of the chemical and thermal WFs
Equation (9) is valid if the water for heating and cooling processes is released to the same water body as the water contaminated by chemical pollution. If the thermal and chemical pollutions are discharged to different water bodies, the final value of WFgrey should be the sum of WFgrey, chem and WFgrey, therm.
The total value of the urban WF is the sum of green, blue, and grey WF
2.2. Study Area Description
The assessment of urban water footprint was applied for three central European cities: Wroclaw (Poland), Vicenza (Italy), and Innsbruck (Austria). The cities assessed represent a diversity of geographical, climatic, and infrastructural aspects as presented in
Table 1. The data on demographics, area, hydrology, infrastructure, and water usage were collected from the municipal authorities, sewage and water companies, law regulations, publicly accessible databases, and literature (for details see footer of the
Table 1).
Wroclaw is situated in the southwestern part of Poland on the Lower Silesian Lowlands. The city has two main water treatment plants in which surface and infiltration water, originating from the Sudetes mountains, are treated. The water supply system in Wroclaw connects 99% of inhabitants and is characterized by a great variance in age and material. The waste water is transported through the sewage system to one main mechanical–biological treatment plant. The sewage system in Wroclaw collects sewage from 98% of population and is comprised of two system types: combined and separate (sanitary and storm water) systems. The urbanized area in Wroclaw (54%), especially in the city center, and the large parts of the industrial area are mostly impermeable, hence most of the rainwater enters into the sewage system. Related with an increase in sealed surfaces is the lack of natural water retention for drier periods. Another important factor influencing the operation of water companies is water loss within the network, which amounts to over 10%.
Vicenza is located in the northeast part of Italy, on the Veneto Plain. Water from 18 artesian wells is treated in five plants, while one-third of the water consumed in the city is withdrawn from around 700 private wells. Currently, 97% of the population is connected to the water system. The waste water is treated in three plants. Around 92% of the population is connected to the sewerage system which consists of combined and separate systems. The latter is characteristic rather for new housing areas [
29]. The annual rainfall in Vicenza is descending based on the data from the last two decades especially in winter season, which is characteristic for the whole Veneto region [
26]. The yearly mean temperature is increasing which also causes an increase in evaporation leading to reduction in water reserves. At the same time, one of the main environmental issues in Vicenza is flooding, which happened a few times within recent years as a consequence of intensive rainfalls in autumn. Another reason for flooding is an overbuilt area and thus reduced ground permeability limiting water absorption. Even though the old water pipes are renovated systematically, the water losses reach up to 25%.
Innsbruck is located in Western Austria, surrounded by mountain ranges in the north and south. Only 32% (southern part) of the city is available for permanent settlement. Due to the alpine orography of the region, rainfall varies heavily in space, even within the municipality. The flow regime is influenced by snow and glacier melt in upstream regions and high precipitation during summer. The variations throughout the year and over the years according to the meteorological conditions are significant. Additionally, there is an influence of hydropower reservoirs [
30]. As water flows rapidly through Innsbruck, the groundwater interaction is minimal [
31]. Water intake to the distribution network relies mainly on a single spring in the mountains north of the city. All buildings are connected to the water (100%) and combined sewerage systems (99%). The major constraint influencing population density is topography, with mountain ranges north and south of the city. Both, heavy rainfalls and increasing temperatures cause accelerated glacier melting leading to higher risk of flooding [
32]. The water loses in the water network are relatively small—below 10% is assumed, which might be due to the fact that about 1% of the network is rehabilitated each year.
3. Results
The data presented in
Table 1 has been used to calculate three WF components: WF
blue, WF
green, and WF
grey for three cities in central Europe. Calculations for all cities were made on the basis of data from 2014 year except precipitation for which ten years average annual value was used. It is obvious that the total WF
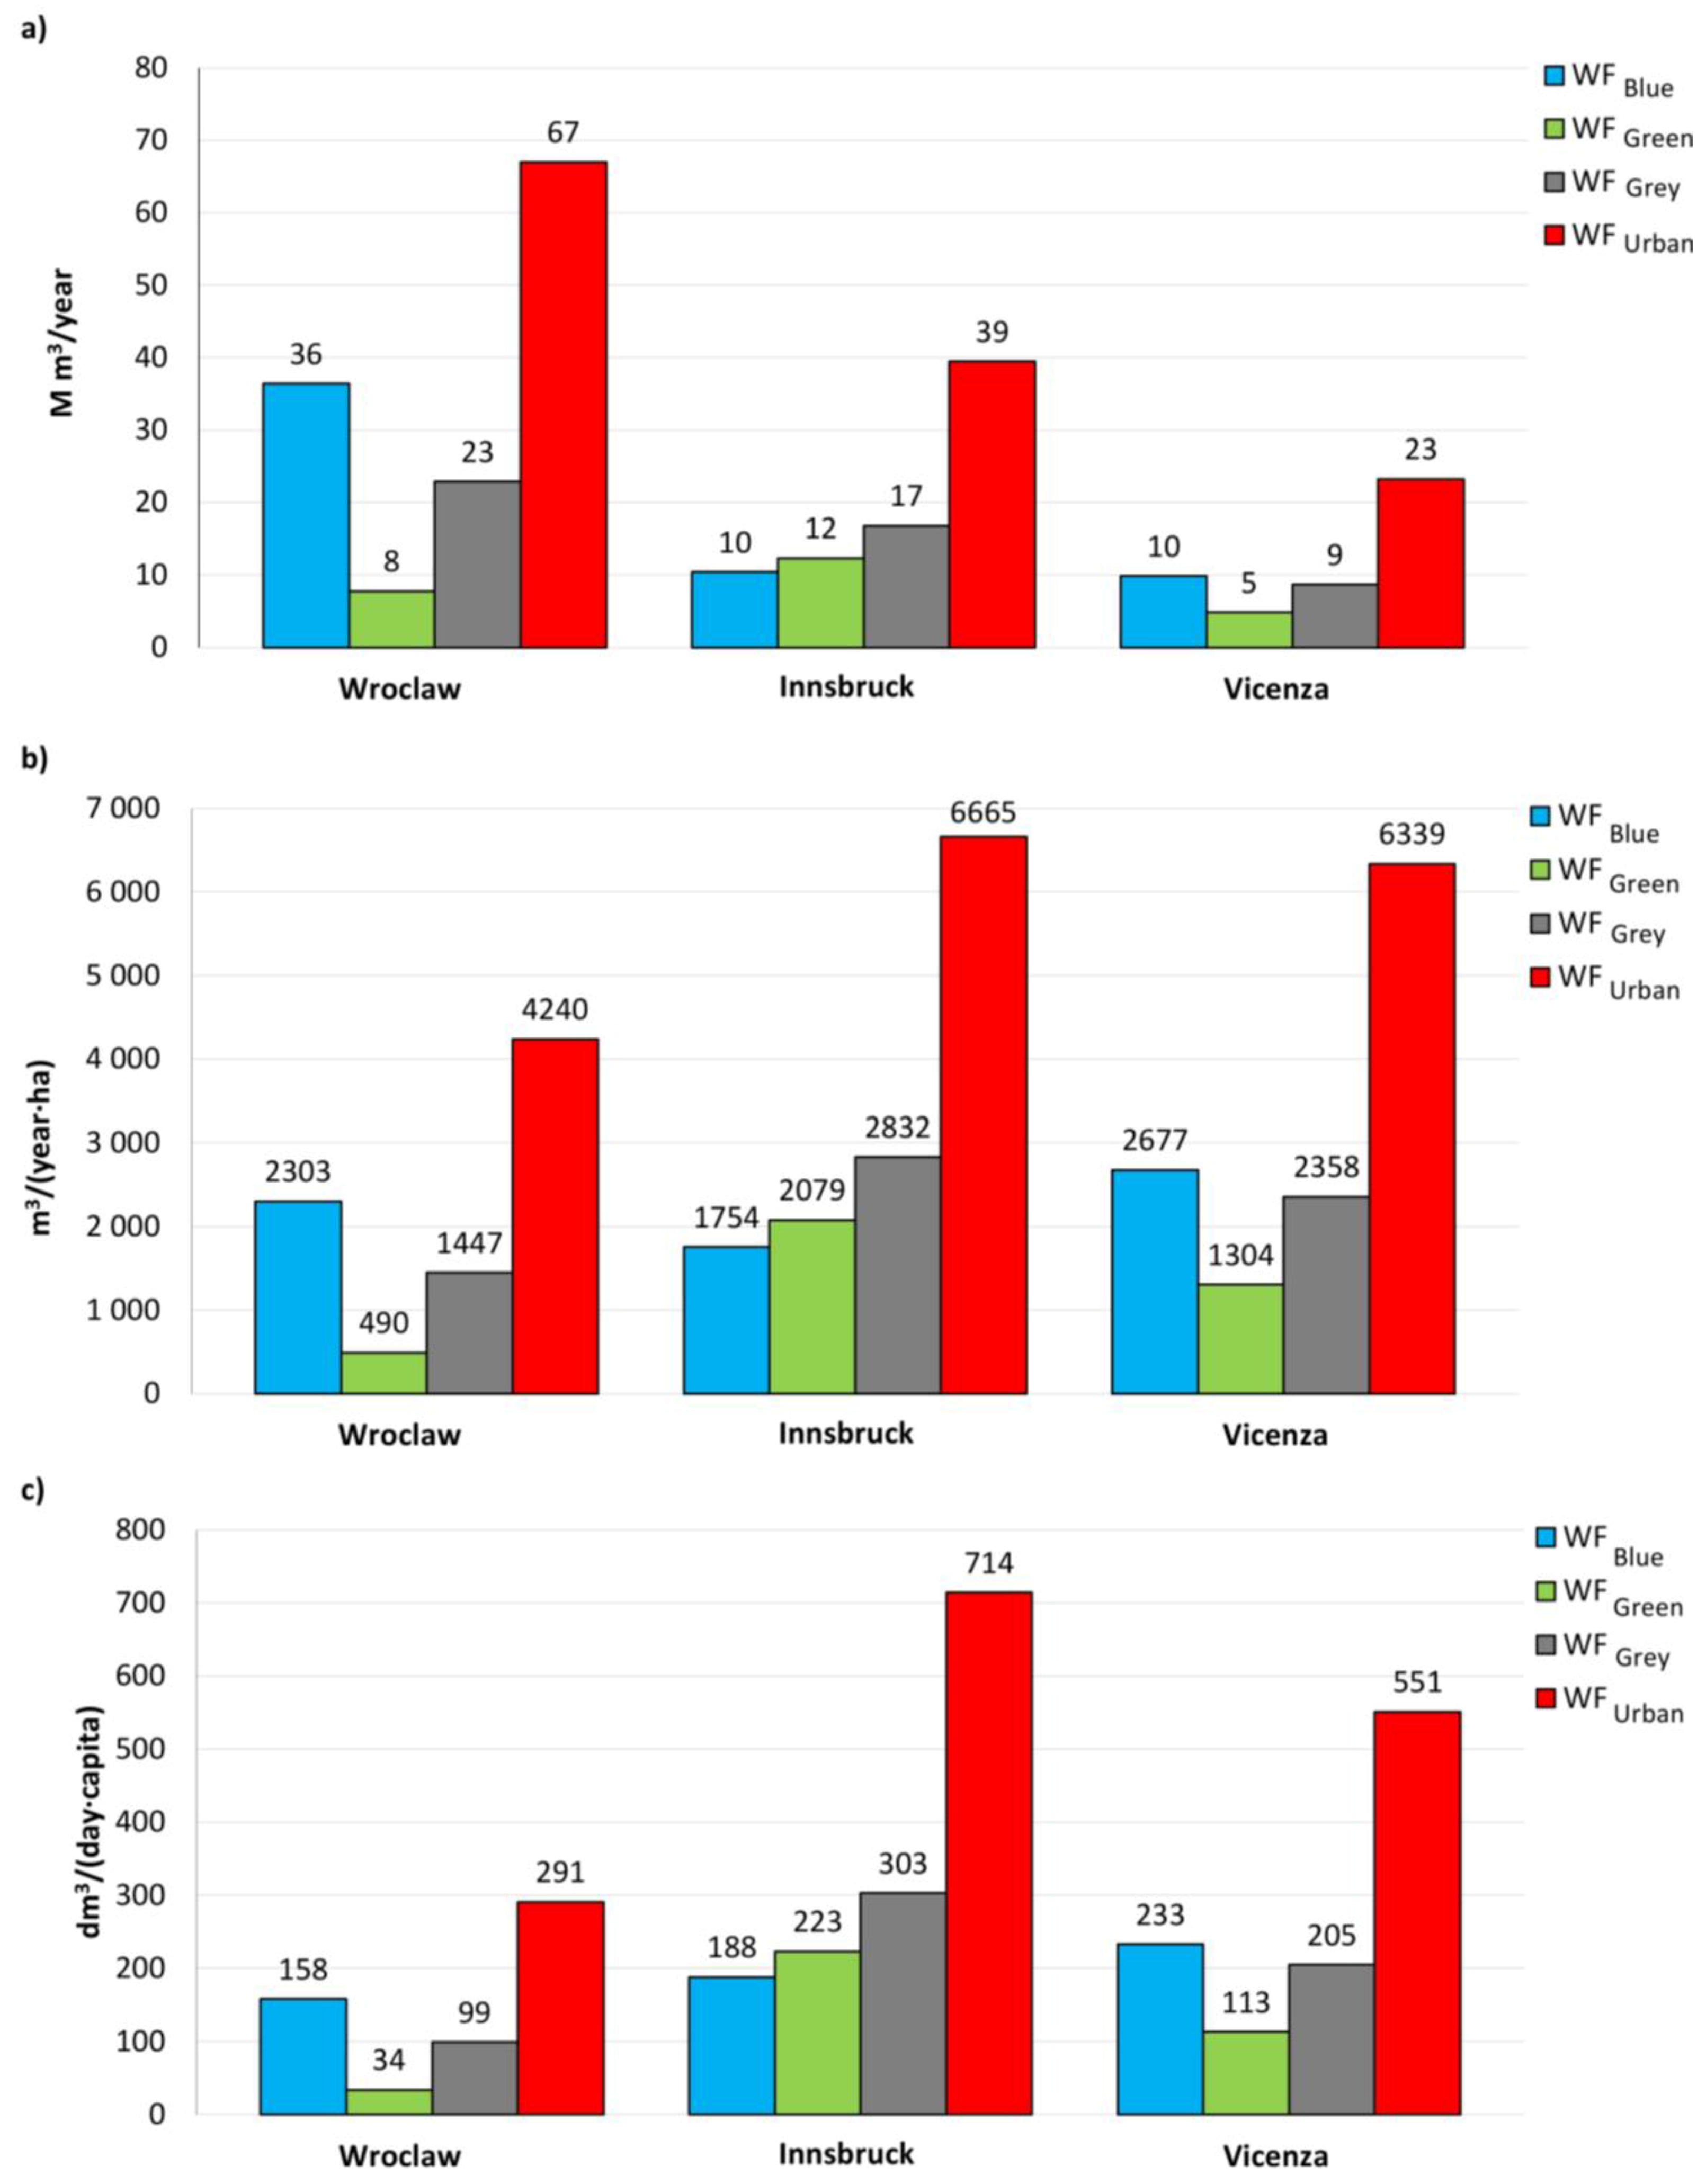
urban is proportional to the urban area and the number of inhabitants. In order to compare cities of different size it is proposed to expressed WF per unit of area and per capita. Therefore, three different units (Mm³/year, m³/(year∙ha), dm³/(day∙capita)) were used to analyze obtained results as illustrated in
Figure 2.
The highest total WF
urban of 67 Mm³/year was obtained by Wroclaw, a 41% lower value for Innsbruck (39 Mm³/year) and a 65% lower value for Vicenza (23 Mm³/year) (
Figure 2a). These values are in accordance to the size of the cities. For Wroclaw, WF
blue is dominating (36 Mm³/year), the second value is reached for WF
grey (23 Mm³/year), and the lowest value for WF
green (8 Mm³/year), due to the relatively small share of the permeable area (24%) in the urbanized area and local climate. For Innsbruck, all three WFs are similar, with the smallest value for WF
blue (10 Mm³/year), middle value for WF
green (12 Mm³/year), and highest value for WF
grey (17 Mm³/year). In Innsbruck, relatively high WF
green in proportion to other WFs in comparison to other cities is associated with a very high percentage of permeable area (ca. 82%) which consists of a green area. In Vicenza blue and grey WFs are comparable (10 and 9 Mm³/year respectively) and the least significant is WF
green (5 Mm³/year), reflecting small percentage of permeable area (ca. 35%).
Relating WF with the areas of Wroclaw, Innsbruck, and Vicenza which are 293 km², 105 km², and 80 km² respectively, it appears that the largest total WF of 6665 m³/year∙ha is reached for Innsbruck (
Figure 2b). A very close value of 6339 m³/year∙ha was obtained for Vicenza and a relatively small value of 4240 m³/year∙ha is reached for Wroclaw. These results imply that the total urban WF is inverse proportional to the population density. In the cases of Vicenza and Wroclaw, WF
blue is the major component of WF
urban which is the result of a high share of the impermeable area in the urbanized area at 61 and 69% respectively. In Innsbruck, WF
green dominates over WF
blue which correlates with the relation of permeable (green) 82% to impermeable 16% area. However, the grey WF is greatly influencing WF
urban which could be explained with the very high dilution factor of 0.865 reported for Innsbruck, while Wroclaw and Vicenza have 0.51 and 0.32, respectively. In general, it should be beneficial for a city, when the WF
green reaches a high value as this reflects a great percentage of permeable area in the city and its retention capacity of rain water.
The comparison of WF
urban expressed per day and capita (
Figure 2c) is especially relevant for blue and grey WFs determined to a large extent by the number of inhabitants having an impact on the volume of water used and contaminated. The results show that even though the number of citizens is the greatest in Wroclaw (632,000), the WF
blue per capita is the smallest (158 dm³/d∙ca), with the second value (188 dm³/d∙ca) reached in Innsbruck which is five time less populated (125,000), and the greatest value reached for Vicenza (233 dm³/d∙ca) consisting of only 115,000 citizens. The significantly high value for Vicenza is a result of a high groundwater withdrawal from private wells and high water losses in public water distribution system. Looking at WF
green the highest value was calculated for Innsbruck (223 dm³/d∙ca) which reflects the highest percentage of permeable green area in the city (ca. 82%) and the smallest population density (1190 inhabitants/km
2). The value of Vicenza is about half the value of Innsbruck (113 dm³/d∙ca) and Wroclaw is approximately seven times smaller (34 dm³/d∙ca). This is due to the smallest share of the green area in the urbanized area (ca. 25%) and the highest population density (2157 inhabitants/km
2). Similar relationship among the cities is observed for WF
grey which is also the highest in Innsbruck (303 dm³/d∙ca) while the value for Wroclaw (99 dm³/ca∙d) is approximately three times lower. Regarding the volume of produced sewage and number of inhabitants the values for Vicenza and Innsbruck are comparable thus the WF
grey values for these cities should be comparable. In practice, the value for Vicenza (205 dm³/d∙ca) is about one-third lower than for Innsbruck. For a better understanding of this phenomenon we need to take a close look at the Equation (7) for WF
grey calculation. The dilution factors which multiply the volumes of produced sewage, for Innsbruck, Wroclaw, and Vicenza are 0.865, 0.507, and 0.377 respectively. The highest dilution factor for Innsbruck determines the highest value of WF
grey per capita. Even though the dilution factor for Vicenza is almost 26% smaller than for Wroclaw the WF
grey per capita is over twice greater. This can be explained by the fact that the number of inhabitants is five times higher in Wroclaw than in Vicenza while the volume of waste water produced in Wroclaw is only higher by the factor 2.5. It is also worth mentioning that, in Vicenza, the nitrogen concentration in the treated effluent is three times lower than the legal limit (30 mg/L) while in Wroclaw (and Innsbruck) the nitrogen concentration is only 10% lower than the legal limit.
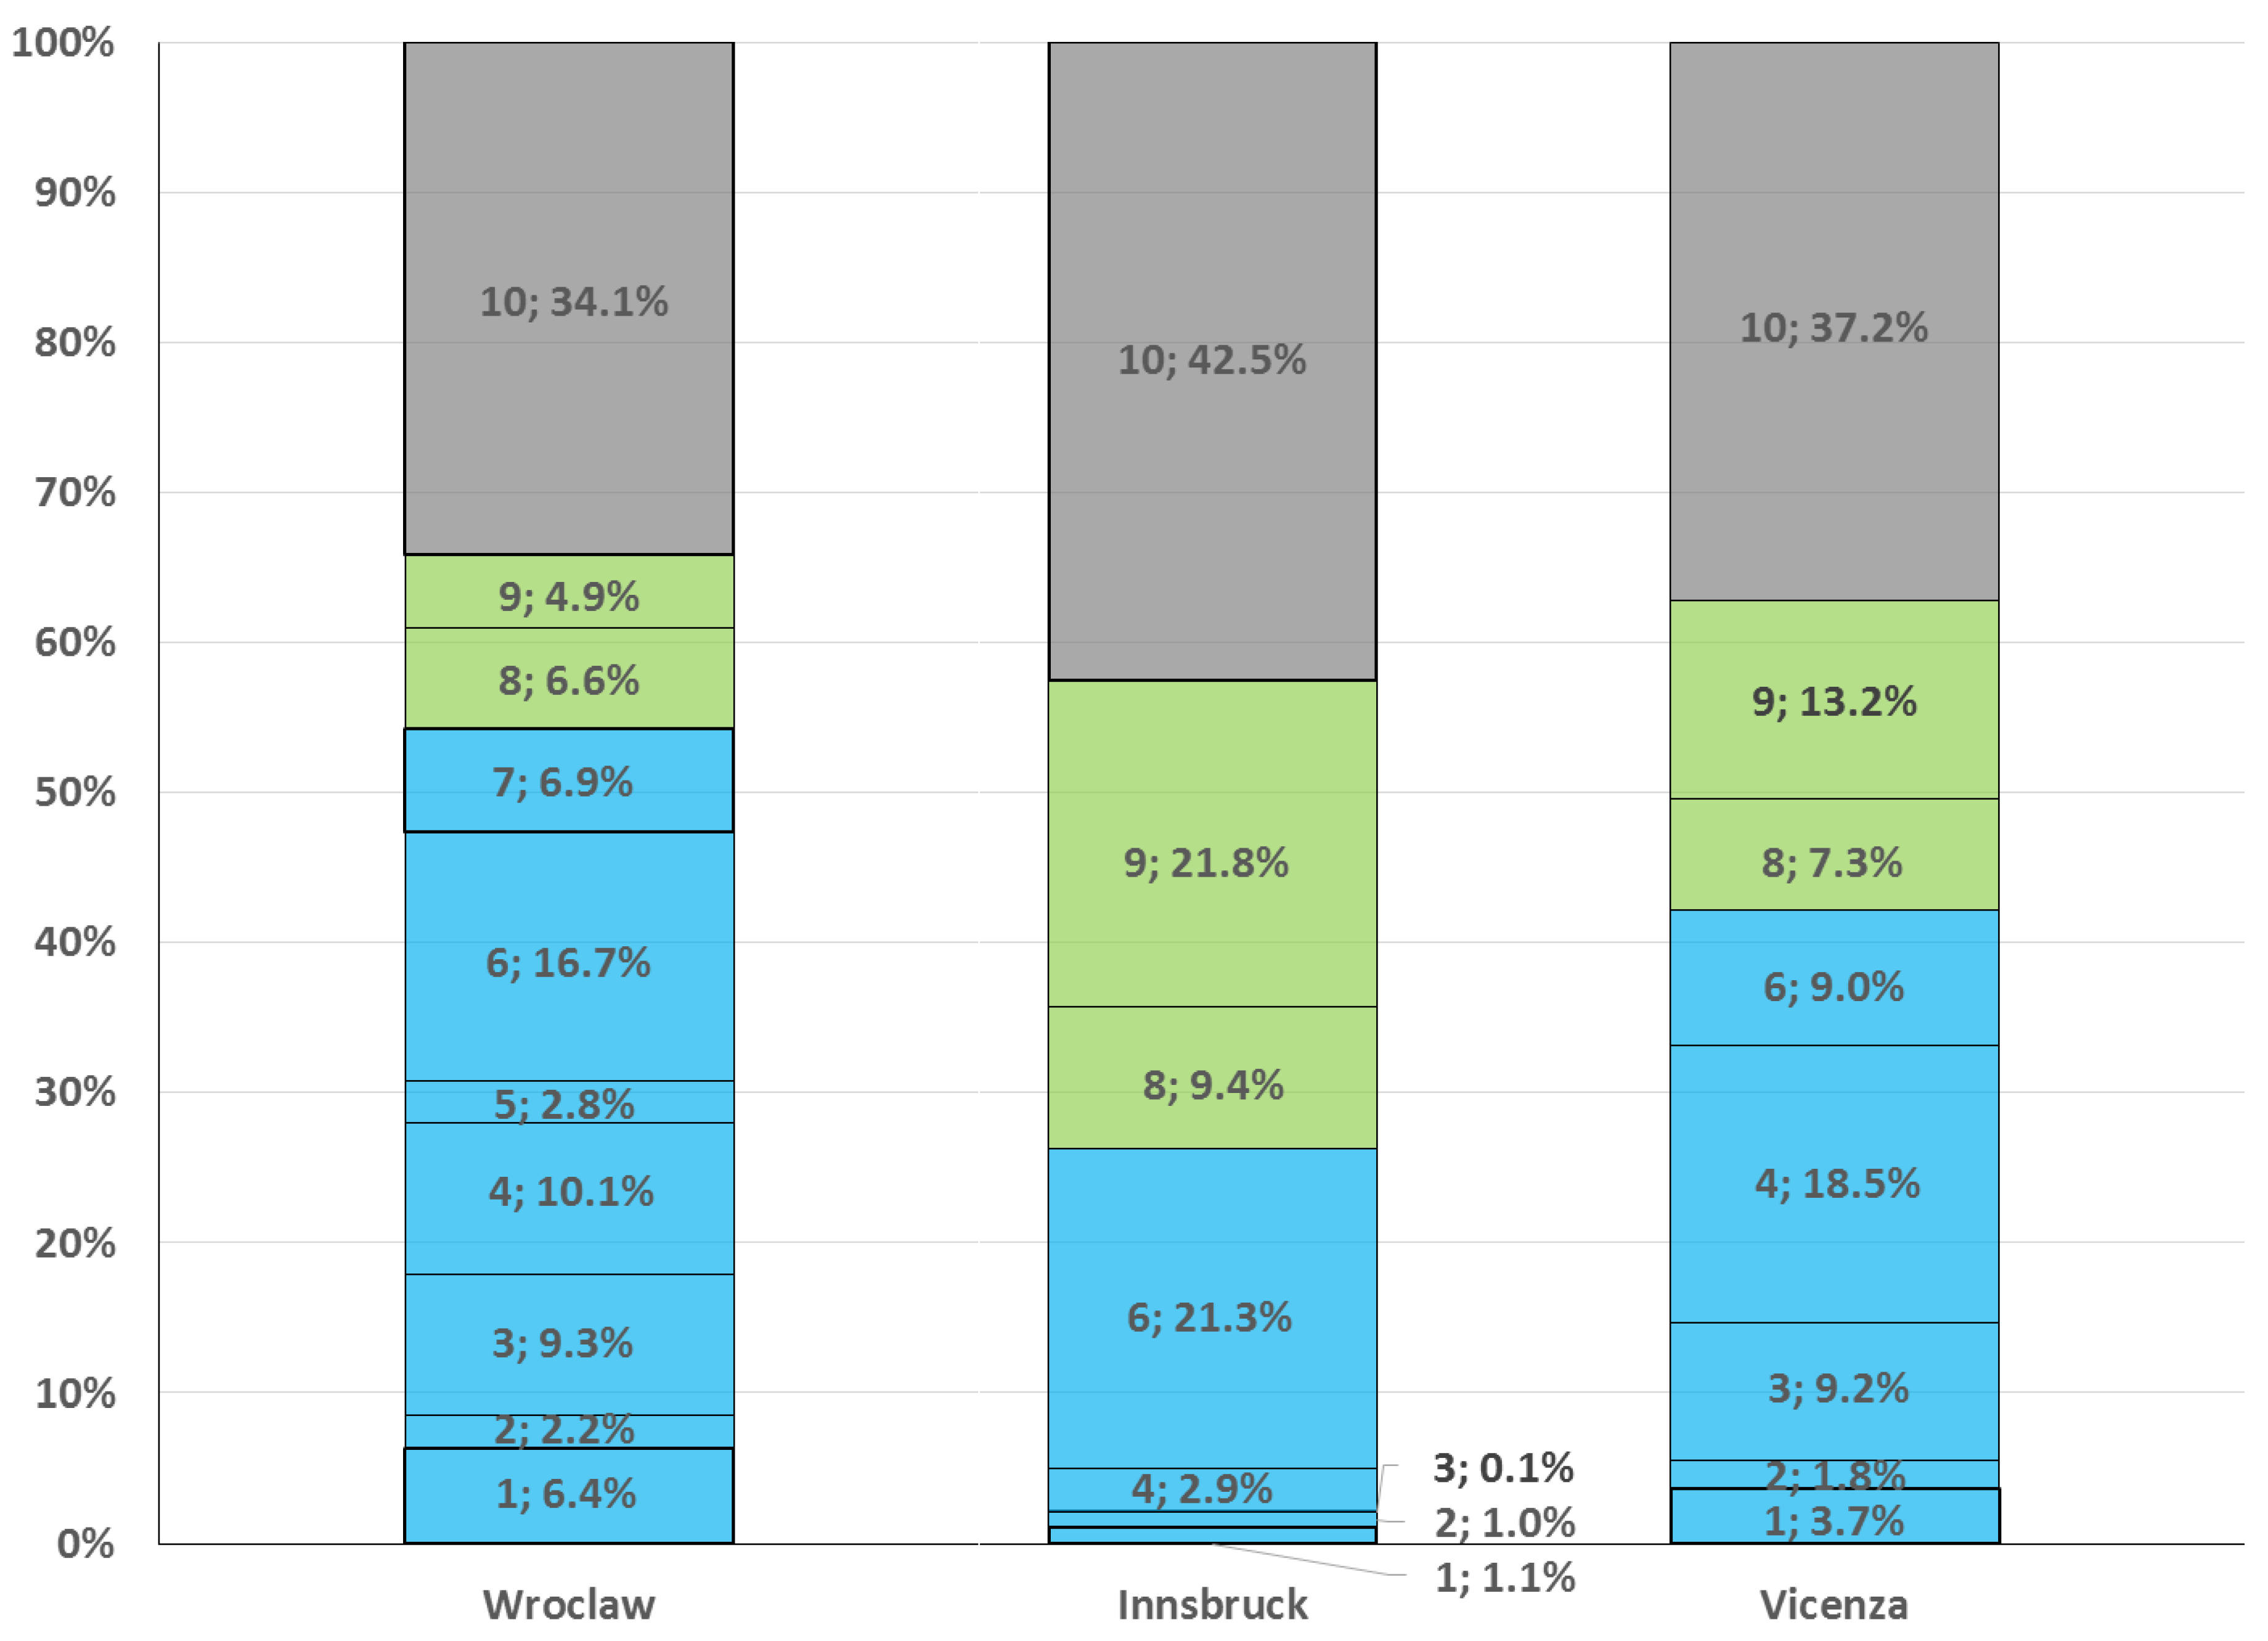
To see what contributes to specific WF
urban values in each city, the specific components are shown in
Figure 3. The value of WF
blue in Wroclaw is determined mostly by water usage (16.7% of total WF
urban), losses in distribution system (10.1%), and evaporation from the paved area (9.3%). Water loss for heat production and cooling, as well as evaporation from transportation area, also contribute significantly (6.9% and 6.4%, respectively). In Innsbruck WF
blue is mostly associated with water usage (21.3% of total WF
urban) with other components being insignificant. In Vicenza, water loss from the water distribution system (18.5%) is dominating WF
blue value with evaporation from the paved area and water usage giving similar shares (9.2% and 9.0%, respectively). The high share of the public and private green areas in Innsbruck lead to high values of water evaporated from the permeable area of the city which accounts for 31.2% of total WF
urban. It is almost three times higher than in Wroclaw and 1.5 times higher than in Vicenza. The sewage discharged into the receiving body of the sewage treatment plant results in a significant share of WF
grey in WF
urban in all three cities, of which Innsbruck has the highest value (42.5%). The shares in Vicenza and Wroclaw are a bit lower with 37.2% and 34.1%, respectively. It has to be noted that climatic conditions (e.g., precipitation, average yearly/monthly temperature) influence WF results. This is of course particularly relevant for warmer climates such as the one in Vicenza.
The simplified approach described in this paper has been compared with the more complex approach introduced by Manzardo et al. [
11]. This approach assumes that the urban area is divided into basic modules with consistent characteristics which consist of building blocks with similar functions, needs, and behavior. In the accounting phase, a representative sample of building blocks for each module is identified, relevant quantitative and qualitative water data is collected and the average blue, green, and grey WF are calculated for each module—which are multiplied by the number of building blocks, providing the total WF. The flow of this methodology is that it relies on building blocks for which many parameters need to be provided to formulate water mass balance for each building block. This has been overcome in simplified approach by using the surfaces to represent the urban area. This requires less data as the water mass balance is performed for the whole city represented with homogenous surfaces and the necessary data is easily available from municipality and water and sewage companies. The two approaches have been applied to the city of Vicenza and the results of WF accounting are presented in
Table 2.
It is worth noticing that the simplified approach yields very close results for blue and grey WF which are overestimated with a few percent compared to modular approach. The highest difference of 27.6% was obtained for WFgreen which might be the result of considering private green area differently. In a modular approach, private green area is included in building blocks but in a simplified approach it is a separated surface. Due to the fact that green WF was underestimated, the total WFurban differs only by 2.8%. These results prove that the new simplified approach is robust and provides reliable results.
4. Discussion
Looking at the results the question arises: which city does a good job in water management? Assuming the one with the lowest water footprint might be an unequivocal answer. From the three cities analyzed, Vicenza has the lowest WF
urban expressed as total volume of water per year. If we relate the value of total WF
urban to the number of inhabitants or urban area in the city then it turned out that Wroclaw has the lowest WF per year per capita or per hectare. The answer becomes even more difficult if we consider the three components of WF: green, blue, and grey WFs. This is the merit of WF indicator as it enables to analyze different aspects of water management. In practice the urban water footprint results may be useful for decision-makers who have an influence on the investments and policies associated with water consumption, usage, and treatment. It turns out that the improvement in efficiency of water use by 40% or more is possible by implementing available technological solutions [
33]. Therefore, it is important to raise the awareness of decision-makers about water scarcity and motivate them to choose environmentally friendly and sustainable solutions. In this case, the water footprint indicator can be used as a measure to improve communication.
This paper shows that each urban area is very specific regarding climatic and hydrogeological conditions and each city has a potential to improve the water and sewage management. In the cases of Vicenza and Wroclaw WF
blue is the major component of WF
urban. This may lead to a potential water scarcity issue in the future. Local problems have been noticed with droughts in Vicenza and Wroclaw occasionally, leading to withering of plants and also to water shortages during hot summers. The climate observations and prognoses indicate that the water resources might be threatened at some point in the future due to the temperature increase in recent decades, elongation of antecedent dry weather period, as well as increased frequency and intensity of heavy rainfall events, both in Wroclaw [
34] and in Vicenza [
26].
The efficiency of water distribution system management is also measured by the loss of water and the associated failure of the water system. High and rising water losses will increase the WFblue and inform about inefficient water supply management, inadequate strategic planning or poor technical condition of the network. Results show that in Vicenza losses of supply water during transportation (18.5%) is determining WFblue value. Relatively high losses are also in Wroclaw (10.1% of WFblue). Investing in improvement of water supply system e.g., by means of general rehabilitation of aging water infrastructure, replacing inefficient components such as valves, pumps, pipes, and meters, monitoring domestic water use or leakage to rapidly repair leakage can reduce direct urban water use which in turn will reduce WFblue.
The green water footprint (WF
green) is a good measure for assessment of natural retention capacity of urban area. In Wroclaw and Vicenza, the share of permeable area is relatively small (24% and 35%, respectively). Unlike Innsbruck with the share of permeable area of 82%. Based on the obtained results, it is recommended, especially for Wroclaw and Vicenza to incorporate more and more permeable and green spaces in the urban landscape. This can be done by building houses with green roofs, car parks, and pavements (especially walkways and squares) with permeable surface and rainwater harvesting facilities as described in Manzardo et al. [
35]. Constructed wetlands, which are artificially created wetland ecosystems to treat—e.g., collected rainwater or wastewater, similarly to ponds and creeks—are also a possible solution for enhancing ecology and aesthetic value, enabling water retention for reuse for irrigation. The idea of linking water body and other open green spaces in a “blue-green infrastructure” is now recognized as part of cities planning strategy [
36,
37]. Local spatial management plans determine the indicators, forms, and functions of development, primarily the details of land use (including in areas excluded from construction) and the required percentage share of biologically active surfaces, providing opportunities to influence water management and mitigate the effects of flooding. Based on results of WF
green calculations for urban areas, local governance can modify land use patterns, and thus affect water quantity and quality changes. The current trends in urban planning should highlight the need to shape compact and user-friendly cities while at the same time emphasizing the wise use of natural resources. This is evidenced by the increasingly frequent implementation of concepts based on ecological trends such as sustainable urban drainage systems, water sensitive urban design, or low impact development. Rainwater harvesting and retention is especially needed during heavy rainfall and melting snow when the sewage system is overloaded. This would help to minimize the problem with flooding noticed in Wroclaw and Vicenza and inundation of basements of buildings and streets, especially after heavy rainfalls. Such changes require promotion and might also be stimulated by the incentives and appropriate local regulations.
From an environmental point of view, it would be very helpful if not only quantitative but also qualitative requirements would be considered. The highest WFgrey was in Wroclaw, then in Innsbruck, and finally in Vicenza. However, if we considered conversion to unit of area and capita these relationships would change. The highest value of WFgrey was indicated for Innsbruck, Vicenza is at only 75% of the Innsbruck value and Wroclaw shows an approximately three-times smaller value than Innsbruck. Water quality changes can be significantly affected by the local governance structures, since local authorities largely influence the behaviors of inhabitants, private agents including developers, businesses, and many other stakeholders. In the case of urban areas with bigger WFgrey value, the water and sewage companies should concentrate on potential process changes and investments that improve the contaminants removal from sewage (e.g., change of the operational scheme at the treatment stage). Reduction of the rainwater entering the sewage system will also result in reduction of the volume of treated sewage and thus WFgrey. The reduction in the treated effluent will limit the human influence on the receiving water body and maintain the river condition closer to natural. Communities further downstream may benefit especially, as well the ecosystem in general. The enhancement of awareness by means of improvement people’s knowledge on water use in order to reduce wastewater generation and to facilitate the return of water that is not affected by our use to the environment is the further step to improvement of grey water footprint in the urban areas.
From a methodological perspective, in this paper a direct water footprint accounting method at urban level is presented. As such, it includes water balances at local level to support water management without addressing the consequences of water use in a more comprehensive water footprint sustainability assessment [
12]. To better support informed decisions, recent scientific developments recommend adopting additional assessment such as the water scarcity or availability assessment [
2,
12,
38,
39,
40]. For example, Bayart et al. [
38] has presented the water impact index that allows the integration of consumptive and degradative water use of a process unit. The results are then characterized using a water scarcity index such as the one of Pfister et al. [
41]. Moreover, Berger et al. [
39] has presented the WAVE model considering atmospheric evaporation recycling and the risk of freshwater depletion. Recently, Boulay et al. [
40] presented the AWARE method resulting from a consensus process lead by the UNEP SETAC Life Cycle Initiative. The outcomes of the accounting method presented in this paper can support the application of such methods by providing and organizing urban inventory data in a simplified manner when compared to previous experiences at urban level [
13,
14,
15,
16,
17].
With reference to the design of WF accounting, indicator assumptions of the proposed method are based on the work of Manzardo et al. [
11]. In the specific case of blue water, it is important to note that the consideration of rainwater evaporation is lively debated in the literature [
39]. Therefore, the formulation of blue WF according to Equations (1) and (2) could be revised once consensus on this issue is found.
5. Conclusions
In this paper, a simplified model for water footprint accounting of direct water use in urban area was presented to support the definition of urban water management strategies and solutions. It was applied to three central Europe urban areas i.e., Wroclaw (Poland), Innsbruck (Austria), and Vicenza (Italy). The three cities under study represent a diversity of geographical, climatic and infrastructure aspects. This is directly reflected in three WF components: WF
blue, WF
green, and WF
grey. In addition, proposed model was compared with the modular approach applied to the city of Vicenza [
11] and proved to be robust in providing reasonable results. The results obtained for the three cities could be the base for drawing up water management plans or strategies. For example, to assess the efficiency of water use, one should look at the blue WF per capita. Here, Vicenza shows the highest values which is a consequence of uncontrolled water intake from private wells and a large share of impermeable area. Green WF is a good measure of rainwater consumption and its low value indicate vulnerability of urban area to floods as is the case in Wroclaw which has the smallest value per hectare. WF
grey could help to assess the impact of the cities on water environment. The highest value observed in Wroclaw is mainly due to the largest city area and population. Even though the value is justified, it still results in the highest contamination of the receiving water body by the treated wastewater discharged in comparison with the other cities.
Though the WF directly depends on location and time, the results obtained suggest that Vicenza and Wroclaw need most modifications in the area of water management and infrastructure which should lead to restoration of natural water cycle and forming water reserves in the cities. Potential identified measures to improve local water management in analyzed cities include reduction of leakage from the drinking water network, introduction of water saving technologies, local rainwater management, education of citizens on water saving, and reduction of soil sealing in the cities.
The experience of the presented cities shows that each urban area is very specific regarding climatic and hydrogeological conditions (which cannot be changed) and each city has a great potential to improve the water and waste water management. The WF tool developed and adopted to specific city needs could be a useful tool allowing for evaluation of current water management state of the city, city area, or even single building. On the other hand, the tool could be used to compare, favor, and possibly also subsidize the best solutions proposed by the city planners, developers, and other stakeholders responsible for water management in the city. The success of using WF in water management will depend on its widespread application. The proposed simplified approach is a small contribution to achieve this goal.
Considering the outcomes of this study, future research can be planned as: (1) the development of a simplified water footprint sustainability assessment method to take into consideration also local water scarcity and availability as well as social and economic aspects [
12,
38]; (2) the application and possible adaptation of the proposed method at different levels, such as the regional one [
42].

 ,
, 


