Injection Vaccines Formulated with Nucleotide, Liposomal or Mineral Oil Adjuvants Induce Distinct Differences in Immunogenicity in Rainbow Trout

 , ,
, , 
Abstract
:1. Introduction
2. Materials and Methods
2.1. Ethics Statement
2.2. Fish
2.3. Vaccines
- (I)
- CpG Oligodeoxynucleotides: Nucleotides were synthesized with a phosphorothioate backbone and a 40% GC-content (Eurofins Genomics, Germany). Both sequence and dosage were based on that of CpG ODN 2143 published by Carrington and Secombes [27]:5′-TTCGTCGTTTTGTCGTTTTGTCGTT-3′The CpG ODNs were purified by high-performance liquid chromatography and lyophilized prior to shipment. Prior to use, they were reconstituted in TBS according to the manufacturer’s instructions.
- (II)
- CAF01 (Statens Serum Institut, Denmark): Liposomal formulation of dimethyldioctadecyl-ammonium bromide and α,α-trehalose 6,6-dibehenate (5:1) suspended in TBS.
- (III)
- FIA (Sigma-Aldrich, USA): A mixture of 85% paraffin oil and 15% mannide monooleate by volume. Forms a water-in-oil (W/O) emulsion when combined with an antigen in an aqueous solution.
2.4. Vaccination and Experimental Group Setup
2.5. Sampling
2.6. ELISA
2.7. Semi-Quantitative Immunohistochemical Analysis (IHC)
2.8. In Vitro Restimulation of Anterior Kidney Leukocytes
2.9. Isolation of RNA and cDNA Synthesis
2.10. Real-time Quantitative Polymerase Chain Reaction (RT-qPCR)
2.11. Statistical Analyses
3. Results
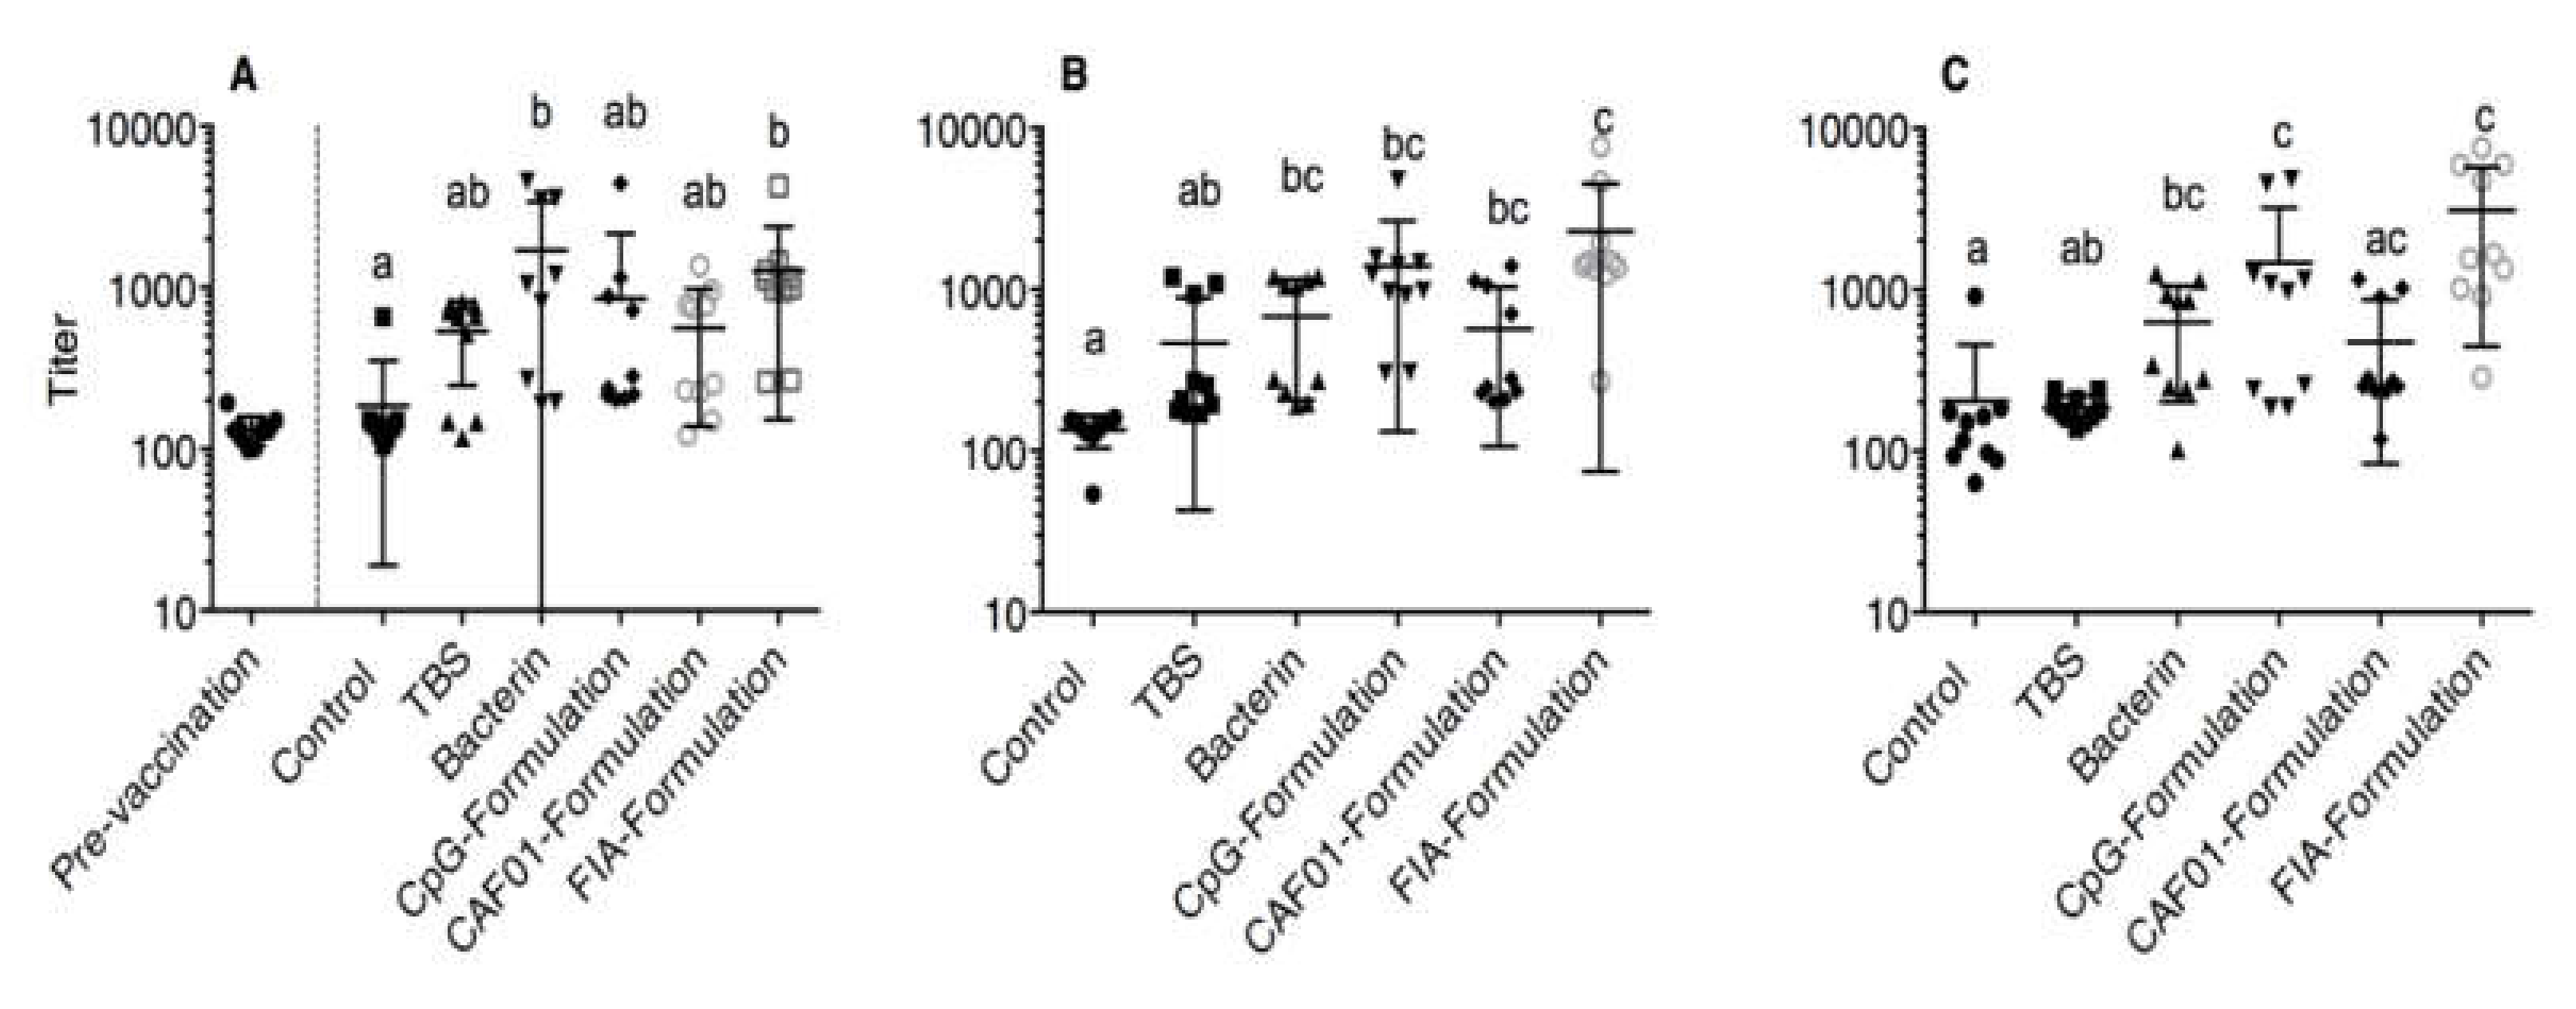
3.1. ELISA
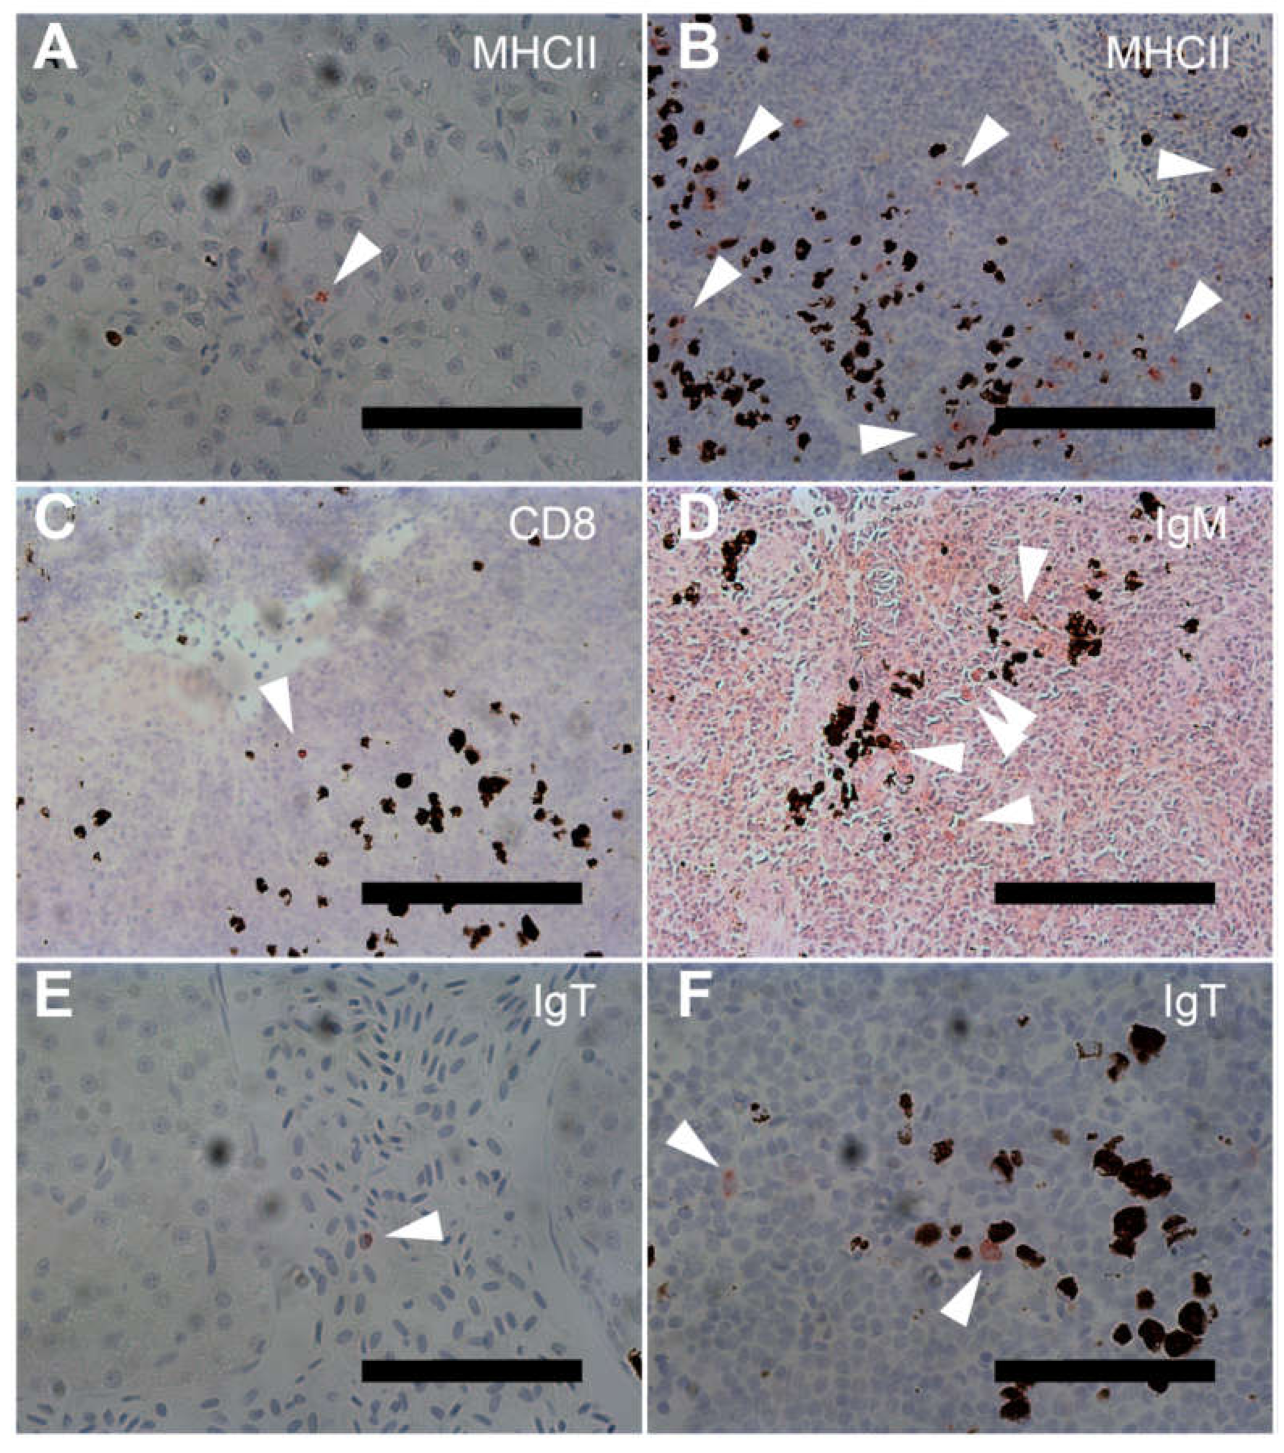
3.2. Semi-Quantitative Immunohistochemical Analysis
3.3. MHCII-Specific Staining
3.4. CD8 Specific Staining
3.5. IgM Specific Staining
3.6. IgT Specific Staining
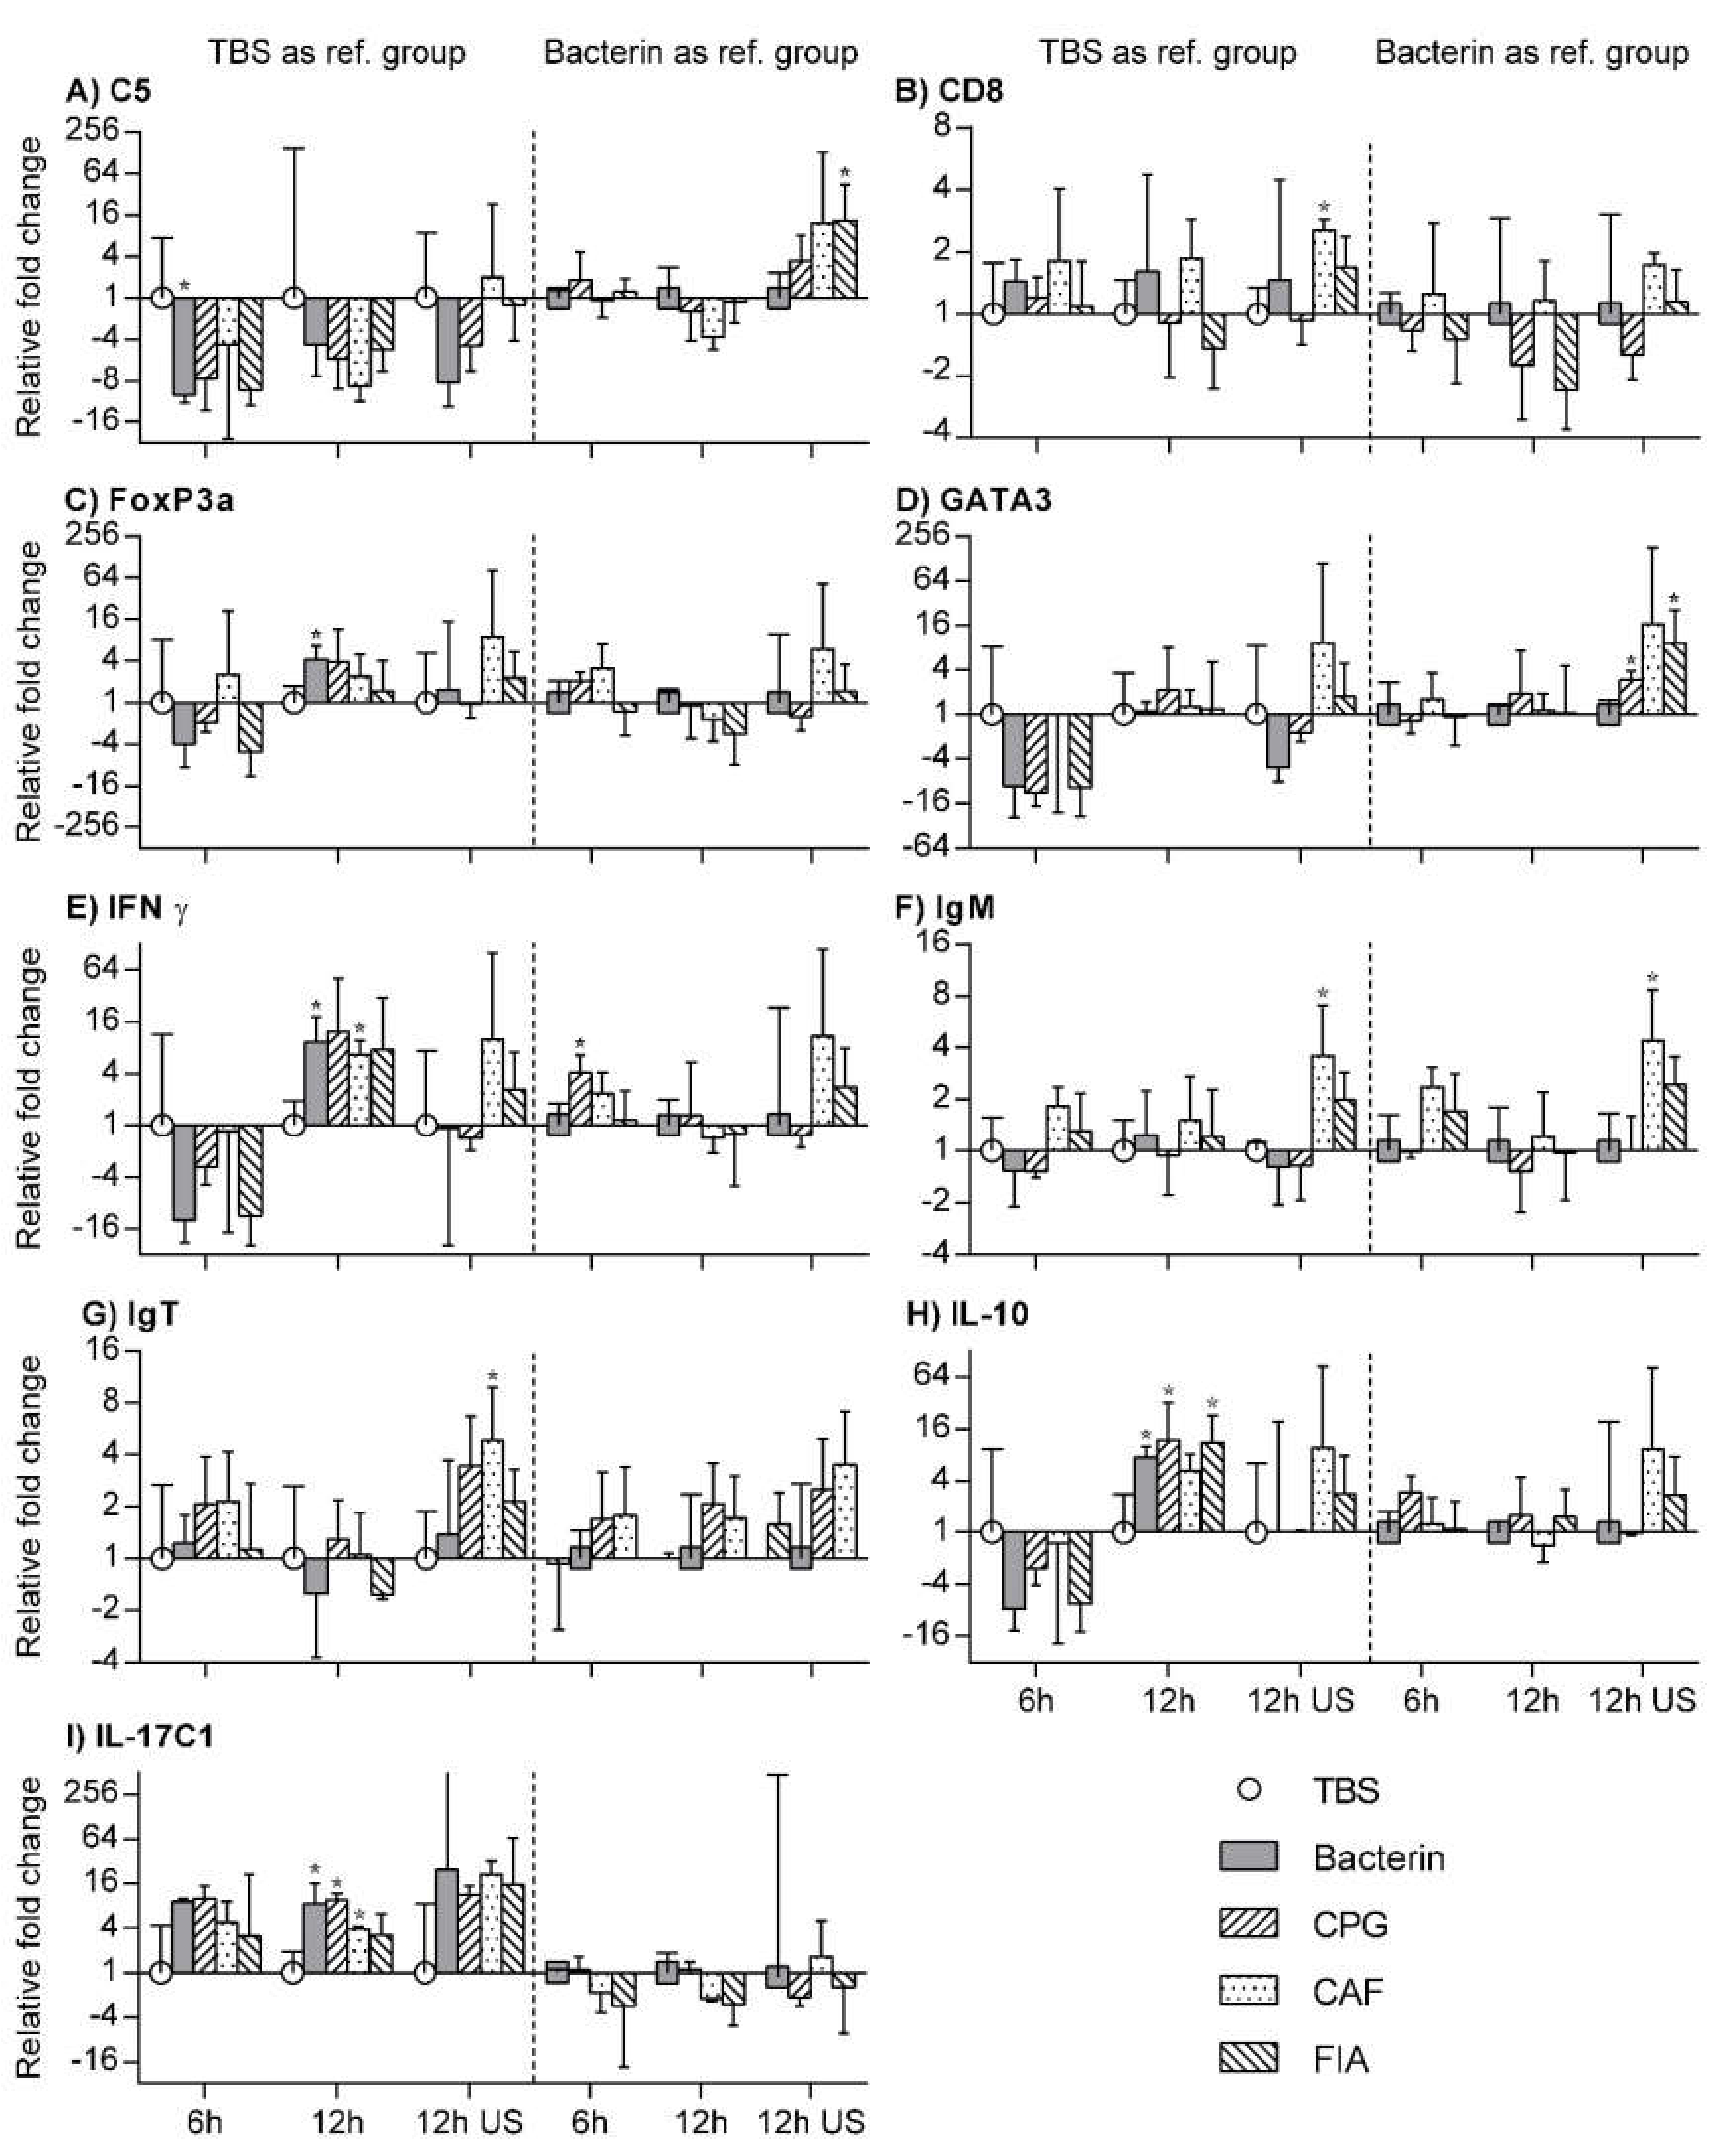
3.7. RT-qPCR
3.8. TBS Group as Reference Group
3.9. Bacterin Group as Reference Group
3.10. Unstimulated Leukocytes as a Reference Group
4. Discussion
5. Conclusions
Supplementary Materials
Author Contributions
Funding
Acknowledgments
Conflicts of Interest
References
- Sommerset, I.; Krossøy, B.; Biering, E.; Frost, P. Vaccines for fish in aquaculture. Expert Rev. Vaccines 2005, 4, 89–101. [Google Scholar] [CrossRef]
- Raida, M.; Buchmann, K. Bath vaccination of rainbow trout (Oncorhynchus mykiss Walbaum) against Yersinia ruckeri: Effects of temperature on protection and gene expression. Vaccine 2008, 26, 1050–1062. [Google Scholar] [CrossRef]
- Raida, M.K.; Nylén, J.; Holten-Andersen, L.; Buchmann, K. Association between Plasma Antibody Response and Protection in Rainbow Trout Oncorhynchus mykiss Immersion Vaccinated against Yersinia ruckeri. PLoS ONE 2011, 6, 18832. [Google Scholar] [CrossRef] [Green Version]
- Welch, T.; LaPatra, S. Yersinia ruckeri lipopolysaccharide is necessary and sufficient for eliciting a protective immune response in rainbow trout (Oncorhynchus mykiss, Walbaum). Fish Shellfish. Immunol. 2016, 49, 420–426. [Google Scholar] [CrossRef] [Green Version]
- Ohtani, M.; Villumsen, K.R.; Koppang, E.O.; Raida, M.K. Global 3D Imaging of Yersinia ruckeri Bacterin Uptake in Rainbow Trout Fry. PLoS ONE 2015, 10, e0117263. [Google Scholar] [CrossRef] [Green Version]
- Brudeseth, B.; Wiulsrød, R.; Fredriksen, B.N.; Lindmo, K.; Løkling, K.-E.; Bordevik, M.; Steine, N.; Klevan, A.; Gravningen, K. Status and future perspectives of vaccines for industrialised fin-fish farming. Fish Shellfish. Immunol. 2013, 35, 1759–1768. [Google Scholar] [CrossRef]
- Emmerich, R.; Weibel, E. Über eine durch Bacterien erzeugte Seuche unter den Forellen. Archiv. Für. Hygiene. 1894, 21, 1–21. [Google Scholar]
- Bernoth, E.M. Furunculosis: The History of the Disease and of Disease Research; Academic Press: Cambridge, MA, USA, 1997; p. 21. [Google Scholar]
- Krantz, G.E.; Reddecliff, J.M.; Heist, C.E. Development of antibodies against aeromonas salmonicida in trout. J. Immunol. 1963, 91, 757. [Google Scholar]
- Midtlyng, P.J.; Reitan, L.J.; Lillehaug, A.; Ramstad, A. Protection, immune responses and side effects in Atlantic salmon (Salmo salarL.) vaccinated against furunculosis by different procedures. Fish Shellfish. Immunol. 1996, 6, 599–613. [Google Scholar] [CrossRef]
- Midtlyng, P. A field study on intraperitoneal vaccination of Atlantic salmon (Salmo salarL.) against furunculosis. Fish Shellfish. Immunol. 1996, 6, 553–565. [Google Scholar] [CrossRef]
- Berg, A.; Rødseth, O.M.; Tangerås, A.; Hansen, T. Time of vaccination influences development of adhesions, growth and spinal deformities in Atlantic salmon Salmo salar. Dis. Aquat. Org. 2006, 69, 239–248. [Google Scholar] [CrossRef] [Green Version]
- Haugarvoll, E.; Bjerkås, I.; Szabo, N.J.; Satoh, M.; Koppang, E.O. Manifestations of systemic autoimmunity in vaccinated salmon. Vaccine 2010, 28, 4961–4969. [Google Scholar] [CrossRef]
- Koppang, E.O.; Bjerkås, I.; Haugarvoll, E.; Chan, E.K.; Szabo, N.J.; Ono, N.; Akikusa, B.; Jirillo, E.; Poppe, T.T.; Sveier, H.; et al. Vaccination-induced systemic autoimmunity in farmed Atlantic salmon. J. Immunol. 2008, 181, 4807–4814. [Google Scholar] [CrossRef] [Green Version]
- Koppang, E.O.; Haugarvoll, E.; Hordvik, I.; Aune, L.; Poppe, T.T. Vaccine-associated granulomatous inflammation and melanin accumulation in Atlantic salmon, Salmo salar L., white muscle. J. Fish Dis. 2005, 28, 13–22. [Google Scholar] [CrossRef]
- Satoh, M.; Bjerkås, I.; Haugarvoll, E.; Chan, E.K.; Szabo, N.J.; Jirillo, E.; Poppe, T.T.; Sveier, H.; Tørud, B.; Koppang, E.O. Polyclonal hypergammaglobulinemia and autoantibody production induced by vaccination in farmed Atlantic salmon. Fish Shellfish. Immunol. 2011, 30, 1080–1086. [Google Scholar] [CrossRef]
- Villumsen, K.R.; Koppang, E.O.; Raida, M.K. Adverse and long-term protective effects following oil-adjuvanted vaccination against Aeromonas salmonicida in rainbow trout. Fish Shellfish. Immunol. 2015, 42, 193–203. [Google Scholar] [CrossRef]
- Mutoloki, S.; Alexandersen, S.; Evensen, Ø. Sequential study of antigen persistence and concomitant inflammatory reactions relative to side-effects and growth of Atlantic salmon (Salmo salar L.) following intraperitoneal injection with oil-adjuvanted vaccines. Fish Shellfish. Immunol. 2004, 16, 633–644. [Google Scholar] [CrossRef]
- Midtlyng, P.; Reitan, L.; Speilberg, L. Experimental studies on the efficacy and side-effects of intraperitoneal vaccination of Atlantic salmon (Salmo salarL.) against furunculosis. Fish Shellfish. Immunol. 1996, 6, 335–350. [Google Scholar] [CrossRef]
- Villumsen, K.R.; Koppang, E.O.; Christensen, D.; Bojesen, A.M. Alternatives to mineral oil adjuvants in vaccines against Aeromonas salmonicida subsp. salmonicida in rainbow trout offer reductions in adverse effects. Sci. Rep. 2017, 7, 5930. [Google Scholar] [CrossRef] [Green Version]
- Jørgensen, J.; Johansen, L.-H.; Steiro, K.; Johansen, A. CpG DNA Induces Protective Antiviral Immune Responses in Atlantic Salmon (Salmo salar L.). J. Virol. 2003, 77, 11471–11479. [Google Scholar] [CrossRef] [Green Version]
- Iliev, D.B.; Skjæveland, I.; Jørgensen, J. CpG oligonucleotides bind TLR9 and RRM-Containing proteins in Atlantic Salmon (Salmo salar). BMC Immunol. 2013, 14, 12. [Google Scholar] [CrossRef] [PubMed] [Green Version]
- Carrington, A.C.; Collet, B.; Holland, J.W.; Secombes, C.J. CpG oligodeoxynucleotides stimulate immune cell proliferation but not specific antibody production in rainbow trout (Oncorhynchus mykiss). Veter- Immunol. Immunopathol. 2004, 101, 211–222. [Google Scholar] [CrossRef]
- Strandskog, G.; Skjæveland, I.; Ellingsen, T.; Jørgensen, J. Double-stranded RNA- and CpG DNA-induced immune responses in Atlantic salmon: Comparison and synergies. Vaccine 2008, 26, 4704–4715. [Google Scholar] [CrossRef] [PubMed]
- Agger, E.M.; Rosenkrands, I.; Hansen, J.; Brahimi, K.; Vandahl, B.S.; Aagaard, C.; Werninghaus, K.; Kirschning, C.; Lang, R.; Christensen, D.; et al. Cationic Liposomes Formulated with Synthetic Mycobacterial Cordfactor (CAF01): A Versatile Adjuvant for Vaccines with Different Immunological Requirements. PLoS ONE 2008, 3, e3116. [Google Scholar] [CrossRef] [PubMed] [Green Version]
- Knudsen, N.P.H.; Olsen, A.; Buonsanti, C.; Follmann, F.; Zhang, Y.; Coler, R.N.; Fox, C.B.; Meinke, A.; Oro, U.D.; Casini, D.; et al. Different human vaccine adjuvants promote distinct antigenin-dependent immunological signatures tailored to different pathogens. Sci. Rep.-UK 2016, 6, 19570. [Google Scholar] [CrossRef]
- Carrington, A.C.; Secombes, C.J. CpG oligodeoxynucleotides up-regulate antibacterial systems and induce protection against bacterial challenge in rainbow trout (Oncorhynchus mykiss). Fish Shellfish. Immunol. 2007, 23, 781–792. [Google Scholar] [CrossRef] [PubMed]
- PHARMAQ. Product Sheet for Alpha Ject 3000 (WayBack Machine Archived). Available online: https://web.archive.org/web/20200217093835/https://www.pharmaq.no/sfiles/3/44/9/file/aj3000_ie_insert_2012-08-24.pdf (accessed on 17 February 2020).
- PHARMAQ. Vaccination Manual (WayBack Machine Archived). Available online: https://web.archive.org/web/20200217094911/https://www.pharmaq.no/sfiles/8/30/2/file/vaccination-manual-english_web.pdf (accessed on 17 February 2020).
- Crowther, J.R. The ELISA Guidebook; Springer Science and Business Media LLC: Berlin/Heidelberg, Germany, 2009. [Google Scholar]
- Hewitt, S.M.; Baskin, D.G.; Frevert, C.W.; Stahl, W.L.; Rosa-Molinar, E. Controls for Immunohistochemistry. J. Histochem. Cytochem. 2014, 62, 693–697. [Google Scholar] [CrossRef]
- Shi, S.-R.; Cote, R.J.; Yang, C.; Chen, C.; Xu, H.-J.; Benedict, W.F.; Taylor, C.R. Development of an optimal protocol for antigen retrieval: a ‘test battery’ approach exemplified with reference to the staining of retinoblastoma protein (prb) in formalin-fixed paraffin sections. J. Pathol. 1996, 179, 347–352. [Google Scholar] [CrossRef]
- Shi, S.R.; Imam, S.A.; Young, L.; Cote, R.J.; Taylor, C.R. Antigen retrieval immunohistochemistry under the influence of pH using monoclonal antibodies. J. Histochem. Cytochem. 1995, 43, 193–201. [Google Scholar] [CrossRef]
- Olsen, M.M.; Kania, P.; Heinecke, R.D.; Skjoedt, K.; Rasmussen, K.J.; Buchmann, K. Cellular and humoral factors involved in the response of rainbow trout gills to Ichthyophthirius multifiliis infections: Molecular and immunohistochemical studies. Fish Shellfish. Immunol. 2011, 30, 859–869. [Google Scholar] [CrossRef]
- Hetland, D.L.; Jørgensen, S.M.; Skjødt, K.; Dale, O.B.; Falk, K.; Xu, C.; Mikalsen, A.B.; Grimholt, U.; Gjøen, T.; Press, C.M. In situ localisation of major histocompatibility complex class I and class II and CD8 positive cells in infectious salmon anaemia virus (ISAV)-infected Atlantic salmon. Fish Shellfish. Immunol. 2010, 28, 30–39. [Google Scholar] [CrossRef]
- Jørgensen, L.V.G.; Heinecke, R.D.; Skjødt, K.; Rasmussen, K.J.; Buchmann, K. Experimental evidence for direct in situ binding of IgM and IgT to early trophonts of Ichthyophthirius multifiliis (Fouquet) in the gills of rainbow trout, Oncorhynchus mykiss (Walbaum). J. Fish Dis. 2011, 34, 749–755. [Google Scholar] [CrossRef]
- Livak, K.J.; Schmittgen, T.D. Analysis of relative gene expression data using real-time quantitative PCR and the 2(T)(-Delta Delta C) method. Methods 2001, 25, 402–408. [Google Scholar] [CrossRef]
- Ingerslev, H.-C.; Pettersen, E.F.; Jakobsen, R.A.; Petersen, C.B.; Wergeland, H.I. Expression profiling and validation of reference gene candidates in immune relevant tissues and cells from Atlantic salmon (Salmo salar L.). Mol. Immunol. 2006, 43, 1194–1201. [Google Scholar] [CrossRef]
- Romstad, A.B.; Reitan, L.J.; Midtlyng, P.; Gravningen, K.; Evensen, Ø. Development of an antibody ELISA for potency testing of furunculosis (Aeromonas salmonicida subsp salmonicida) vaccines in Atlantic salmon (Salmo salar L). Biologicals 2012, 40, 67–71. [Google Scholar] [CrossRef]
- Romstad, A.B.; Reitan, L.J.; Midtlyng, P.; Gravningen, K.; Evensen, Ø. Antibody responses correlate with antigen dose and in vivo protection for oil-adjuvanted, experimental furunculosis (Aeromonas salmonicida subsp. salmonicida) vaccines in Atlantic salmon (Salmo salar L.) and can be used for batch potency testing of vaccines. Vaccine 2013, 31, 791–796. [Google Scholar]
- Villumsen, K.R.; Dalsgaard, I.; Holten-Andersen, L.; Raida, M.K. Potential Role of Specific Antibodies as Important Vaccine Induced Protective Mechanism against Aeromonas salmonicida in Rainbow Trout. PLoS ONE 2012, 7, e46733. [Google Scholar] [CrossRef] [Green Version]
- Evenhuis, J.P.; Wiens, G.; Wheeler, P.; Welch, T.; LaPatra, S.E.; Thorgaard, G.H. Transfer of serum and cells from Yersinia ruckeri vaccinated doubled-haploid hot creek rainbow trout into outcross F1 progeny elucidates mechanisms of vaccine-induced protection. Dev. Comp. Immunol. 2014, 44, 145–151. [Google Scholar] [CrossRef]
- Villumsen, K.R.; Raida, M.K. Long-lasting protection induced by bath vaccination against Aeromonas salmonicida subsp. salmonicida in rainbow trout. Fish Shellfish. Immunol. 2013, 35, 1649–1653. [Google Scholar] [CrossRef]
- Veenstra, K.A.; Wang, T.; Alnabulsi, A.; Douglas, A.; Russell, K.S.; Tubbs, L.; Ben Arous, J.; Secombes, C.J. Analysis of adipose tissue immune gene expression after vaccination of rainbow trout with adjuvanted bacterins reveals an association with side effects. Mol. Immunol. 2017, 88, 89–98. [Google Scholar] [CrossRef] [Green Version]
- Fischer, U.; Koppang, E.O.; Nakanishi, T. Teleost T and NK cell immunity. Fish Shellfish. Immunol. 2013, 35, 197–206. [Google Scholar] [CrossRef]
- Bassity, E.; Clark, T.G. Functional Identification of Dendritic Cells in the Teleost Model, Rainbow Trout (Oncorhynchus mykiss). PLoS ONE 2012, 7, e33196. [Google Scholar] [CrossRef] [Green Version]
- Ferguson, H.W. Systemic Pathology of Fish—A Text and Atlas of Normal Tissues in Teleosts and Their Responses in Disease, 2nd ed.; Scotian Press: London, UK, 2006. [Google Scholar]
- Xu, Z.; Parra, D.; Gómez, D.; Salinas, I.; Zhang, Y.-A.; Jørgensen, L.V.G.; Heinecke, R.D.; Buchmann, K.; LaPatra, S.; Sunyer, J.O. Teleost skin, an ancient mucosal surface that elicits gut-like immune responses. Proc. Natl. Acad. Sci. USA 2013, 110, 13097–13102. [Google Scholar] [CrossRef] [Green Version]
- Zhang, Y.-A.; Salinas, I.; Li, J.; Parra, D.; Bjork, S.; Xu, Z.; LaPatra, S.E.; Bartholomew, J.; Sunyer, J.O. IgT, a primitive immunoglobulin class specialized in mucosal immunity. Nat. Immunol. 2010, 11, 827–835. [Google Scholar] [CrossRef]
- Hansen, J.D.; Landis, E.D.; Phillips, R.B. Discovery of a unique Ig heavy-chain isotype (IgT) in rainbow trout: Implications for a distinctive B cell developmental pathway in teleost fish. Proc. Natl. Acad. Sci.USA 2005, 102, 6919–6924. [Google Scholar] [CrossRef] [Green Version]
- Bromage, E.S.; Kaattari, I.M.; Zwollo, P.; Kaattari, S.L. Plasmablast and plasma cell production and distribution in trout immune tissues. J. Immunol. 2004, 173, 7317–7323. [Google Scholar] [CrossRef] [Green Version]
- Ma, C.; Ye, J.; Kaattari, S. Differential compartmentalization of memory B cells versus plasma cells in salmonid fish. Eur. J. Immunol. 2013, 43, 360–370. [Google Scholar] [CrossRef] [Green Version]
- Zwollo, P.; Mott, K.; Barr, M. Comparative analyses of B cell populations in trout kidney and mouse bone marrow: Establishing “B cell signatures”. Dev. Comp. Immunol. 2010, 34, 1291–1299. [Google Scholar] [CrossRef] [Green Version]
- Mutoloki, S.; Jørgensen, J.; Evensen, Ø. The Adaptive Immune Response in Fish. In Fish Vaccination; Wiley: Hoboken, NJ, USA, 2014; pp. 104–115. [Google Scholar]
- Wang, T.; Secombes, C.J. The cytokine networks of adaptive immunity in fish. Fish Shellfish. Immunol. 2013, 35, 1703–1718. [Google Scholar] [CrossRef]
- Davidsen, J.; Rosenkrands, I.; Christensen, D.; Vangala, A.; Kirby, D.J.; Perrie, Y.; Agger, E.M.; Andersen, P. Characterization of cationic liposomes based on dimethyldioctadecylammonium and synthetic cord factor from M. tuberculosis (trehalose 6,6′-dibehenate)—A novel adjuvant inducing both strong CMI and antibody responses. Biochim. Et Biophys. Acta Biomembr. 2005, 1718, 22–31. [Google Scholar] [CrossRef] [Green Version]
- Van Dissel, J.T.; Joosten, S.A.; Hoff, S.T.; Soonawala, D.; Prins, C.; Hokey, D.; O’Dee, D.M.; Graves, A.J.; Thierry-Carstensen, B.; Andreasen, L.V.; et al. A novel liposomal adjuvant system, CAF01, promotes long-lived Mycobacterium tuberculosis-specific T-cell responses in human. Vaccine 2014, 32, 7098–7107. [Google Scholar] [CrossRef] [PubMed] [Green Version]


| Group Designation: | Injection: | TBS: | Antigenic Content: | Adjuvant: |
|---|---|---|---|---|
| Naïve controls | - | - | - | - |
| TBS group | + | + | - | - |
| Bacterin group | + | + | 1 × 10⁸ CFU | - |
| CpG ODN group | + | + | 1 × 10⁸ CFU | 0.6 nM CpG ODN in TBS |
| CAF01 group | + | + | 1 × 10⁸ CFU | 300 µg CAF01 in TBS |
| FIA group | + | + | 1 × 10⁸ CFU | 50 µL FIA in TBS |
| Target Antigen(s): | Optimized HIER Conditions: |
|---|---|
| IgM | 100 °C, 20 min, pH 6 |
| MHCII, CD8, IgT | 100 °C, 20 min, pH 10 |
| Target/Epitope | Dilution | Reference |
|---|---|---|
| MHCII (F1-6, beta 2 domain of Atlantic salmon MHCII beta chain) | 1:750 | [34,35] |
| CD8α (F1-29, membrane distal Ig-like domain of Atlantic salmon CD8α) | 1:150 | [34,35] |
| IgM (F1-18, anti-trout IgM) | 1:1800 | [36] |
| IgT (F1-8, second constant domain of the rainbow trout IgT heavy chain) | 1:300 | [34] |
© 2020 by the authors. Licensee MDPI, Basel, Switzerland. This article is an open access article distributed under the terms and conditions of the Creative Commons Attribution (CC BY) license (http://creativecommons.org/licenses/by/4.0/).
Share and Cite
Rømer Villumsen, K.; Kania, P.W.; Christensen, D.; Koppang, E.O.; Bojesen, A.M. Injection Vaccines Formulated with Nucleotide, Liposomal or Mineral Oil Adjuvants Induce Distinct Differences in Immunogenicity in Rainbow Trout. Vaccines 2020, 8, 103. https://doi.org/10.3390/vaccines8010103
Rømer Villumsen K, Kania PW, Christensen D, Koppang EO, Bojesen AM. Injection Vaccines Formulated with Nucleotide, Liposomal or Mineral Oil Adjuvants Induce Distinct Differences in Immunogenicity in Rainbow Trout. Vaccines. 2020; 8(1):103. https://doi.org/10.3390/vaccines8010103
Chicago/Turabian StyleRømer Villumsen, Kasper, Per Walter Kania, Dennis Christensen, Erling Olaf Koppang, and Anders Miki Bojesen. 2020. "Injection Vaccines Formulated with Nucleotide, Liposomal or Mineral Oil Adjuvants Induce Distinct Differences in Immunogenicity in Rainbow Trout" Vaccines 8, no. 1: 103. https://doi.org/10.3390/vaccines8010103