

Humoral Response after Two Doses of BNT162b2 mRNA Vaccine Has a Role in Predicting Response after Three Doses That Is Related to Plasma HIV Viremia and Nadir CD4+ Cell Count in HIV-Positive Patients
 ,
,  , ,
, ,
Abstract
:1. Introduction
2. Materials and Methods
2.1. Study Design
2.2. SARS-CoV-2 Serology
2.3. Statistical Analysis
3. Results
3.1. Characteristics of Humoral Response at T2
3.2. Humoral Response at T3 and Longitudinal Evolution
4. Discussion
5. Conclusions
Author Contributions
Funding
Institutional Review Board Statement
Informed Consent Statement
Data Availability Statement
Conflicts of Interest
References
- Inglet, S. Two Years of the COVID-19 Pandemic: What Lessons Have We Learned? Ann. Pharmacother. 2022, 56, 1376–1381. [Google Scholar] [CrossRef] [PubMed]
- Armstrong-Mensah, E.A.; Tetteh, A.K.; Ofori, E.; Ekhosuehi, O. Voluntary Counseling and Testing, Antiretroviral Therapy Access, and HIV-Related Stigma: Global Progress and Challenges. Int. J. Environ. Res. Public Health 2022, 19, 6597. [Google Scholar] [CrossRef] [PubMed]
- Bertagnolio, S.; Thwin, S.S.; Silva, R.; Nagarajan, S.; Jassat, W.; Fowler, R.; Haniffa, R.; Reveiz, L.; Ford, N.; Doherty, M.; et al. Clinical features of, and risk factors for, severe or fatal COVID-19 among people living with HIV admitted to hospital: Analysis of data from the WHO Global Clinical Platform of COVID-19. Lancet HIV 2022, 9, e486–e495. [Google Scholar] [CrossRef] [PubMed]
- Bhaskaran, K.; Rentsch, C.T.; MacKenna, B.; Schultze, A.; Mehrkar, A.; Bates, C.J.; Eggo, R.M.; Morton, C.E.; Bacon, S.C.J.; Inglesby, P.; et al. HIV infection and COVID-19 death: A population-based cohort analysis of UK primary care data and linked national death registrations within the OpenSAFELY platform. Lancet HIV 2021, 8, e24–e32. [Google Scholar] [CrossRef]
- Spinelli, M.A.; Jones, B.L.H.; Gandhi, M. COVID-19 Outcomes and Risk Factors Among People Living with HIV. Curr. HIV/AIDS Rep. 2022, 19, 425–432. [Google Scholar] [CrossRef]
- Hoffmann, C.; Casado, J.L.; Härter, G.; Vizcarra, P.; Moreno, A.; Cattaneo, D.; Meraviglia, P.; Spinner, C.D.; Schabaz, F.; Grunwald, S.; et al. Immune deficiency is a risk factor for severe COVID-19 in people living with HIV. HIV Med. 2021, 22, 372–378. [Google Scholar] [CrossRef]
- Yendewa, G.A.; Perez, J.A.; Schlick, K.; Tribout, H.; McComsey, G.A. Clinical Features and Outcomes of Coronavirus Disease 2019 among People With Human Immunodeficiency Virus in the United States: A Multicenter Study From a Large Global Health Research Network (TriNetX). Open Forum Infect. Dis. 2021, 8, ofab272. [Google Scholar] [CrossRef]
- Yang, X.; Sun, J.; Patel, R.C.; Zhang, J.; Guo, S.; Zheng, Q.; Olex, A.L.; Olatosi, B.; Weissman, S.B.; Islam, J.Y.; et al. Associations between HIV infection and clinical spectrum of COVID-19: A population level analysis based on US National COVID Cohort Collaborative (N3C) data. Lancet HIV 2021, 8, e690–e700. [Google Scholar] [CrossRef]
- Nomah, D.K.; Reyes-Urueña, J.; Díaz, Y.; Moreno, S.; Aceiton, J.; Bruguera, A.; Vivanco-Hidalgo, R.M.; Llibre, J.M.; Domingo, P.; Falcó, V.; et al. Sociodemographic, clinical, and immunological factors associated with SARS-CoV-2 diagnosis and severe COVID-19 outcomes in people living with HIV: A retrospective cohort study. Lancet HIV 2021, 8, e701–e710. [Google Scholar] [CrossRef]
- Bachelard, A.; Sautereau, A.; Digumber, M.; Isernia, V.; Phung, B.; Lehur, A.C.; Gac, S.L.; Landman, R.; Yazdanpanah, Y.; Ghosn, J. Risk Factors Associated with Severe/Critical COVID-19 in People Living with HIV-1. Int. J. Infect. Dis. 2022, 122, 152–154. [Google Scholar] [CrossRef]
- British HIV Association Guidelines. Available online: https://www.bhiva.org/vaccination-guidelines (accessed on 17 October 2022).
- European AIDS Clinical Society Guidelines Version 11.0. October 2021. Available online: https://www.eacsociety.org/guidelines/eacs-guidelines/ (accessed on 17 October 2022).
- Sarmati, L.; D’Ettorre, G.; Parisi, S.G.; Andreoni, M. HIV Replication at Low Copy Number and its Correlation with the HIV Reservoir: A Clinical Perspective. Curr. HIV Res. 2015, 13, 250–257. [Google Scholar] [CrossRef] [PubMed] [Green Version]
- Parisi, S.G.; Andreis, S.; Basso, M.; Cavinato, S.; Scaggiante, R.; Franzetti, M.; Andreoni, M.; Palù, G.; Cattelan, A.M. Time course of cellular HIV-DNA and low-level HIV viremia in HIV-HCV co-infected patients whose HCV infection had been successfully treated with directly acting antivirals. Med. Microbiol. Immunol. 2017, 206, 419–428. [Google Scholar] [CrossRef] [PubMed]
- Younas, M.; Psomas, C.; Reynes, C.; Cezar, R.; Kundura, L.; Portalès, P.; Merle, C.; Atoui, N.; Fernandez, C.; Le Moing, V.; et al. Residual Viremia Is Linked to a Specific Immune Activation Profile in HIV-1-Infected Adults Under Efficient Antiretroviral Therapy. Front. Immunol. 2021, 12, 663843. [Google Scholar] [CrossRef] [PubMed]
- Dijkstra, S.; Hofstra, L.M.; Mudrikova, T.; Wensing, A.M.J.; Oomen, P.G.A.; Hoepelman, A.I.M.; van Welzen, B.J. Lower Incidence of HIV-1 Blips Observed During Integrase Inhibitor-Based Combination Antiretroviral Therapy. J. Acquir. Immune Defic. Syndr. 2022, 89, 575–582. [Google Scholar] [CrossRef]
- Bonelli, F.; Blocki, F.A.; Bunnell, T.; Chu, E.; De La, O.A.; Grenache, D.G.; Marzucchi, G.; Montomoli, E.; Okoye, L.; Pallavicini, L.; et al. Evaluation of the automated LIAISON® SARS-CoV-2 TrimericS IgG assay for the detection of circulating antibodies. Clin. Chem. Lab. Med. 2021, 59, 1463–1467. [Google Scholar] [CrossRef]
- Clavero, R.; Parra-Lucares, A.; Méndez-Valdés, G.; Villa, E.; Bravo, K.; Mondaca, E.; Aranda, J.; Brignardello, R.; Gajardo, C.; Ordenes, A.; et al. Humoral Immune Response of BNT162b2 and CoronaVac Vaccinations in Hemodialysis Patients: A Multicenter Prospective Cohort. Vaccines 2022, 10, 1542. [Google Scholar] [CrossRef]
- Vergori, A.; Cozzi Lepri, A.; Cicalini, S.; Matusali, G.; Bordoni, V.; Lanini, S.; Meschi, S.; Iannazzo, R.; Mazzotta, V.; Colavita, F.; et al. Immunogenicity to COVID-19 mRNA vaccine third dose in people living with HIV. Nat. Commun. 2022, 13, 4922. [Google Scholar] [CrossRef]
- Gianserra, L.; Donà, M.G.; Giuliani, E.; Stingone, C.; Pontone, M.; Buonomini, A.R.; Giuliani, M.; Pimpinelli, F.; Morrone, A.; Latini, A. Immunogenicity and Safety of BNT162b2 Homologous Booster Vaccination in People Living with HIV under Effective cART. Vaccines 2022, 10, 1243. [Google Scholar] [CrossRef]
- Moussaoui, M.E.; Desmecht, S.; Tashkeev, A.; Lambert, N.; Maes, N.; Braghini, J.; Marechal, N.; Quintana, C.; Briquet, K.; Gofflot, S.; et al. Reduced T-cell response following a third dose of SARS-CoV-2 vaccine in infection-naïve people living with HIV. J. Infect. 2022, 85, 702–769. [Google Scholar] [CrossRef]
- Portillo, V.; Fedeli, C.; Ustero Alonso, P.; Petignat, I.; Mereles Costa, E.C.; Sulstarova, A.; Jaksic, C.; Yerly, S.; Calmy, A. Impact on HIV-1 RNA Levels and Antibody Responses Following SARS-CoV-2 Vaccination in HIV-Infected Individuals. Front. Immunol. 2022, 12, 820126. [Google Scholar] [CrossRef]
- Gianserra, L.; Donà, M.G.; Giuliani, E.; Stingone, C.; Pontone, M.; Buonomini, A.R.; Giuliani, M.; Pimpinelli, F.; Morrone, A.; Latini, A. Comment on “High seroconversion rate after vaccination with mRNA BNT162b2 vaccine against SARS-CoV-2 among people with HIV—But HIV viremia matters? ” AIDS 2022, 36, 1319–1320. [Google Scholar] [CrossRef] [PubMed]
- Kardava, L.; Moir, S. B-cell abnormalities in HIV-1 infection: Roles for IgG3 and T-bet. Curr. Opin. HIV AIDS 2019, 14, 240–245. [Google Scholar] [CrossRef] [PubMed]
- Moir, S.; Ho, J.; Malaspina, A.; Wang, W.; DiPoto, A.C.; O’Shea, M.A.; Roby, G.; Kottilil, S.; Arthos, J.; Proschan, M.A.; et al. Evidence for HIV-associated B cell exhaustion in a dysfunctional memory B cell compartment in HIV-infected viremic individuals. J. Exp. Med. 2008, 205, 1797–1805. [Google Scholar] [CrossRef] [PubMed] [Green Version]
- Parisi, S.G.; Sarmati, L.; Andreis, S.; Scaggiante, R.; Cruciani, M.; Ferretto, R.; Manfrin, V.; Basso, M.; Andreoni, M.; Mengoli, C.; et al. Strong and persistent correlation between baseline and follow-up HIV-DNA levels and residual viremia in a population of naïve patients with more than 4 years of effective antiretroviral therapy. Clin. Microbiol. Infect. 2015, 21, e5–e7. [Google Scholar] [CrossRef] [Green Version]
- Svicher, V.; Marchetti, G.; Ammassari, A.; Ceccherini-Silberstein, F.; Sarmati, L.; Impact Study Group. Novelties in Evaluation and Monitoring of Human Immunodeficiency Virus-1 Infection: Is Standard Virological Suppression Enough for Measuring Antiretroviral Treatment Success? AIDS Rev. 2017, 19, 119–133. [Google Scholar] [CrossRef]
- Baroncelli, S.; Galluzzo, C.M.; Pirillo, M.F.; Mancini, M.G.; Weimer, L.E.; Andreotti, M.; Amici, R.; Vella, S.; Giuliano, M.; Palmisano, L. Microbial translocation is associated with residual viral replication in HAART-treated HIV+ subjects with <50 copies/mL HIV-1 RNA. J. Clin. Virol. 2009, 46, 367–370. [Google Scholar]
- Milano, E.; Ricciardi, A.; Casciaro, R.; Pallara, E.; De Vita, E.; Bavaro, D.F.; Larocca, A.M.V.; Stefanizzi, P.; Tafuri, S.; Saracino, A. Immunogenicity and safety of the BNT162b2 COVID-19 mRNA vaccine in PLWH: A monocentric study in Bari, Italy. J. Med. Virol. 2022, 94, 2230–2236. [Google Scholar] [CrossRef]
- Xu, X.; Vesterbacka, J.; Aleman, S.; Nowak, P. COVAXID Study Group. High seroconversion rate after vaccination with mRNA BNT162b2 vaccine against SARS-CoV-2 among people with HIV—But HIV viremia matters? AIDS 2022, 36, 479–481. [Google Scholar] [CrossRef]
- Spinelli, M.A.; Peluso, M.J.; Lynch, K.L.; Yun, C.; Glidden, D.V.; Henrich, T.J.; Deeks, S.G.; Gandhi, M. Differences in Post-mRNA Vaccination Severe Acute Respiratory Syndrome Coronavirus 2 (SARS-CoV-2) Immunoglobulin G (IgG) Concentrations and Surrogate Virus Neutralization Test Response by Human Immunodeficiency Virus (HIV) Status and Type of Vaccine: A Matched Case-Control Observational Study. Clin. Infect. Dis. 2022, 75, e916–e919. [Google Scholar]
- Duro, R.; Rocha-Pereira, N.; Figueiredo, C.; Piñeiro, C.; Caldas, C.; Serrão, R.; Sarmento, A. Routine CD4 monitoring in HIV patients with viral suppression: Is it really necessary? A Portuguese cohort. J. Microbiol. Immunol. Infect. 2018, 51, 593–597. [Google Scholar] [CrossRef]
- Benet, S.; Blanch-Lombarte, O.; Ainsua-Enrich, E.; Pedreño-Lopez, N.; Muñoz-Basagoiti, J.; Raïch-Regué, D.; Perez-Zsolt, D.; Peña, R.; Jiménez, E.; de la Concepción, M.L.R.; et al. Limited humoral and specific T-cell responses after SARS-CoV-2 vaccination in PLWH with poor immune reconstitution. J. Infect. Dis. 2022, 226, 1913–1923. [Google Scholar] [CrossRef] [PubMed]
- Wong, C.S.; Buckner, C.M.; Lage, S.L.; Pei, L.; Assis, F.L.; Dahlstrom, E.W.; Anzick, S.L.; Virtaneva, K.; Rupert, A.; Davis, J.L.; et al. Rapid Emergence of T Follicular Helper and Germinal Center B Cells Following Antiretroviral Therapy in Advanced HIV Disease. Front. Immunol. 2021, 12, 752782. [Google Scholar] [CrossRef] [PubMed]
- Parmigiani, A.; Alcaide, M.L.; Freguja, R.; Pallikkuth, S.; Frasca, D.; Fischl, M.A.; Pahwa, S. Impaired antibody response to influenza vaccine in HIV-infected and uninfected aging women is associated with immune activation and inflammation. PLoS ONE 2013, 8, e79816. [Google Scholar] [CrossRef] [PubMed]
- Lapointe, H.R.; Mwimanzi, F.; Cheung, P.K.; Sang, Y.; Yaseen, F.; Umviligihozo, G.; Kalikawe, R.; Speckmaier, S.; Moran-Garcia, N.; Datwani, S.; et al. People with HIV receiving suppressive antiretroviral therapy show typical antibody durability after dual COVID-19 vaccination, and strong third dose responses. J. Infect. Dis. 2022; Epub ahead of print. [Google Scholar] [CrossRef]
- Favresse, J.; Bayart, J.L.; Mullier, F.; Elsen, M.; Eucher, C.; Van Eeckhoudt, S.; Roy, T.; Wieers, G.; Laurent, C.; Dogné, J.M.; et al. Antibody titres decline 3-month post-vaccination with BNT162b2. Emerg. Microbes Infect. 2021, 10, 1495–1498. [Google Scholar] [CrossRef]
- Meyers, J.; Windau, A.; Schmotzer, C.; Saade, E.; Noguez, J.; Stempak, L.; Zhang, X. SARS-CoV-2 antibody profile of naturally infected and vaccinated individuals detected using qualitative, semi-quantitative and multiplex immunoassays. Diagn. Microbiol. Infect. Dis. 2022, 104, 115803. [Google Scholar] [CrossRef]
- Krutikov, M.; Palmer, T.; Tut, G.; Fuller, C.; Azmi, B.; Giddings, R.; Shrotri, M.; Kaur, N.; Sylla, P.; Lancaster, T.; et al. Prevalence and duration of detectable SARS-CoV-2 nucleocapsid antibodies in staff and residents of long-term care facilities over the first year of the pandemic (VIVALDI study): Prospective cohort study in England. Lancet Healthy Longev. 2022, 3, e13–e21. [Google Scholar] [CrossRef]
- He, Z.; Ren, L.; Yang, J.; Guo, L.; Feng, L.; Ma, C.; Wang, X.; Leng, Z.; Tong, X.; Zhou, W.; et al. Seroprevalence and humoral immune durability of anti-SARS-CoV-2 antibodies in Wuhan, China: A longitudinal, population-level, cross-sectional study. Lancet 2021, 397, 1075–1084. [Google Scholar] [CrossRef]
- Overton, E.T.; Weir, I.R.; Zanni, M.V.; Fischinger, S.; MacArthur, R.D.; Aberg, J.A.; Fitch, K.V.; Frank, M.; Albrecht, H.; Goodenough, E.; et al. Asymptomatic SARS-CoV-2 Infection Is Common Among ART-Treated People With HIV. J. Acquir. Immune Defic. Syndr. 2022, 90, 377–381. [Google Scholar] [CrossRef]


| All the Patients (n = 184) | |
|---|---|
| Male, n (%) | 152 (82.6) |
| Age at HIV infection diagnosis (years) 1 | 38 (30–45) |
| Age at study enrollment (years) 1 | 55 (48–61) |
| Absolute number of CD4+ cell count at nadir (cells/mm3) 1 | 258 (107–384) |
| Overall CD4+ cell count (cells/mm3) 1 | 639 (486–845) |
| Delta CD4 cell count (cells/mm3) 1 | 372 (221–550) |
| Patients with persistently undetectable plasma HIV RNA, n (%) | 66 (35.9) |
| Patients with low level plasma HIV RNA, n (%) | 57 (31) |
| Patients with ongoing plasma HIV RNA, n (%) | 61 (33.1) |
| Patients with negative serum IgG level at T2, n (%) | 3 (1.6%) |
| Patients with serum IgG level >2080 BAU/mL, at T2 n (%) | 16 (8.7) |
| Patients with negative serum IgG level at T3, n (%) | 1 (0.5%) |
| Patients with serum IgG level >2080 BAU/mL at T3, n (%) | 118 (64.1) |
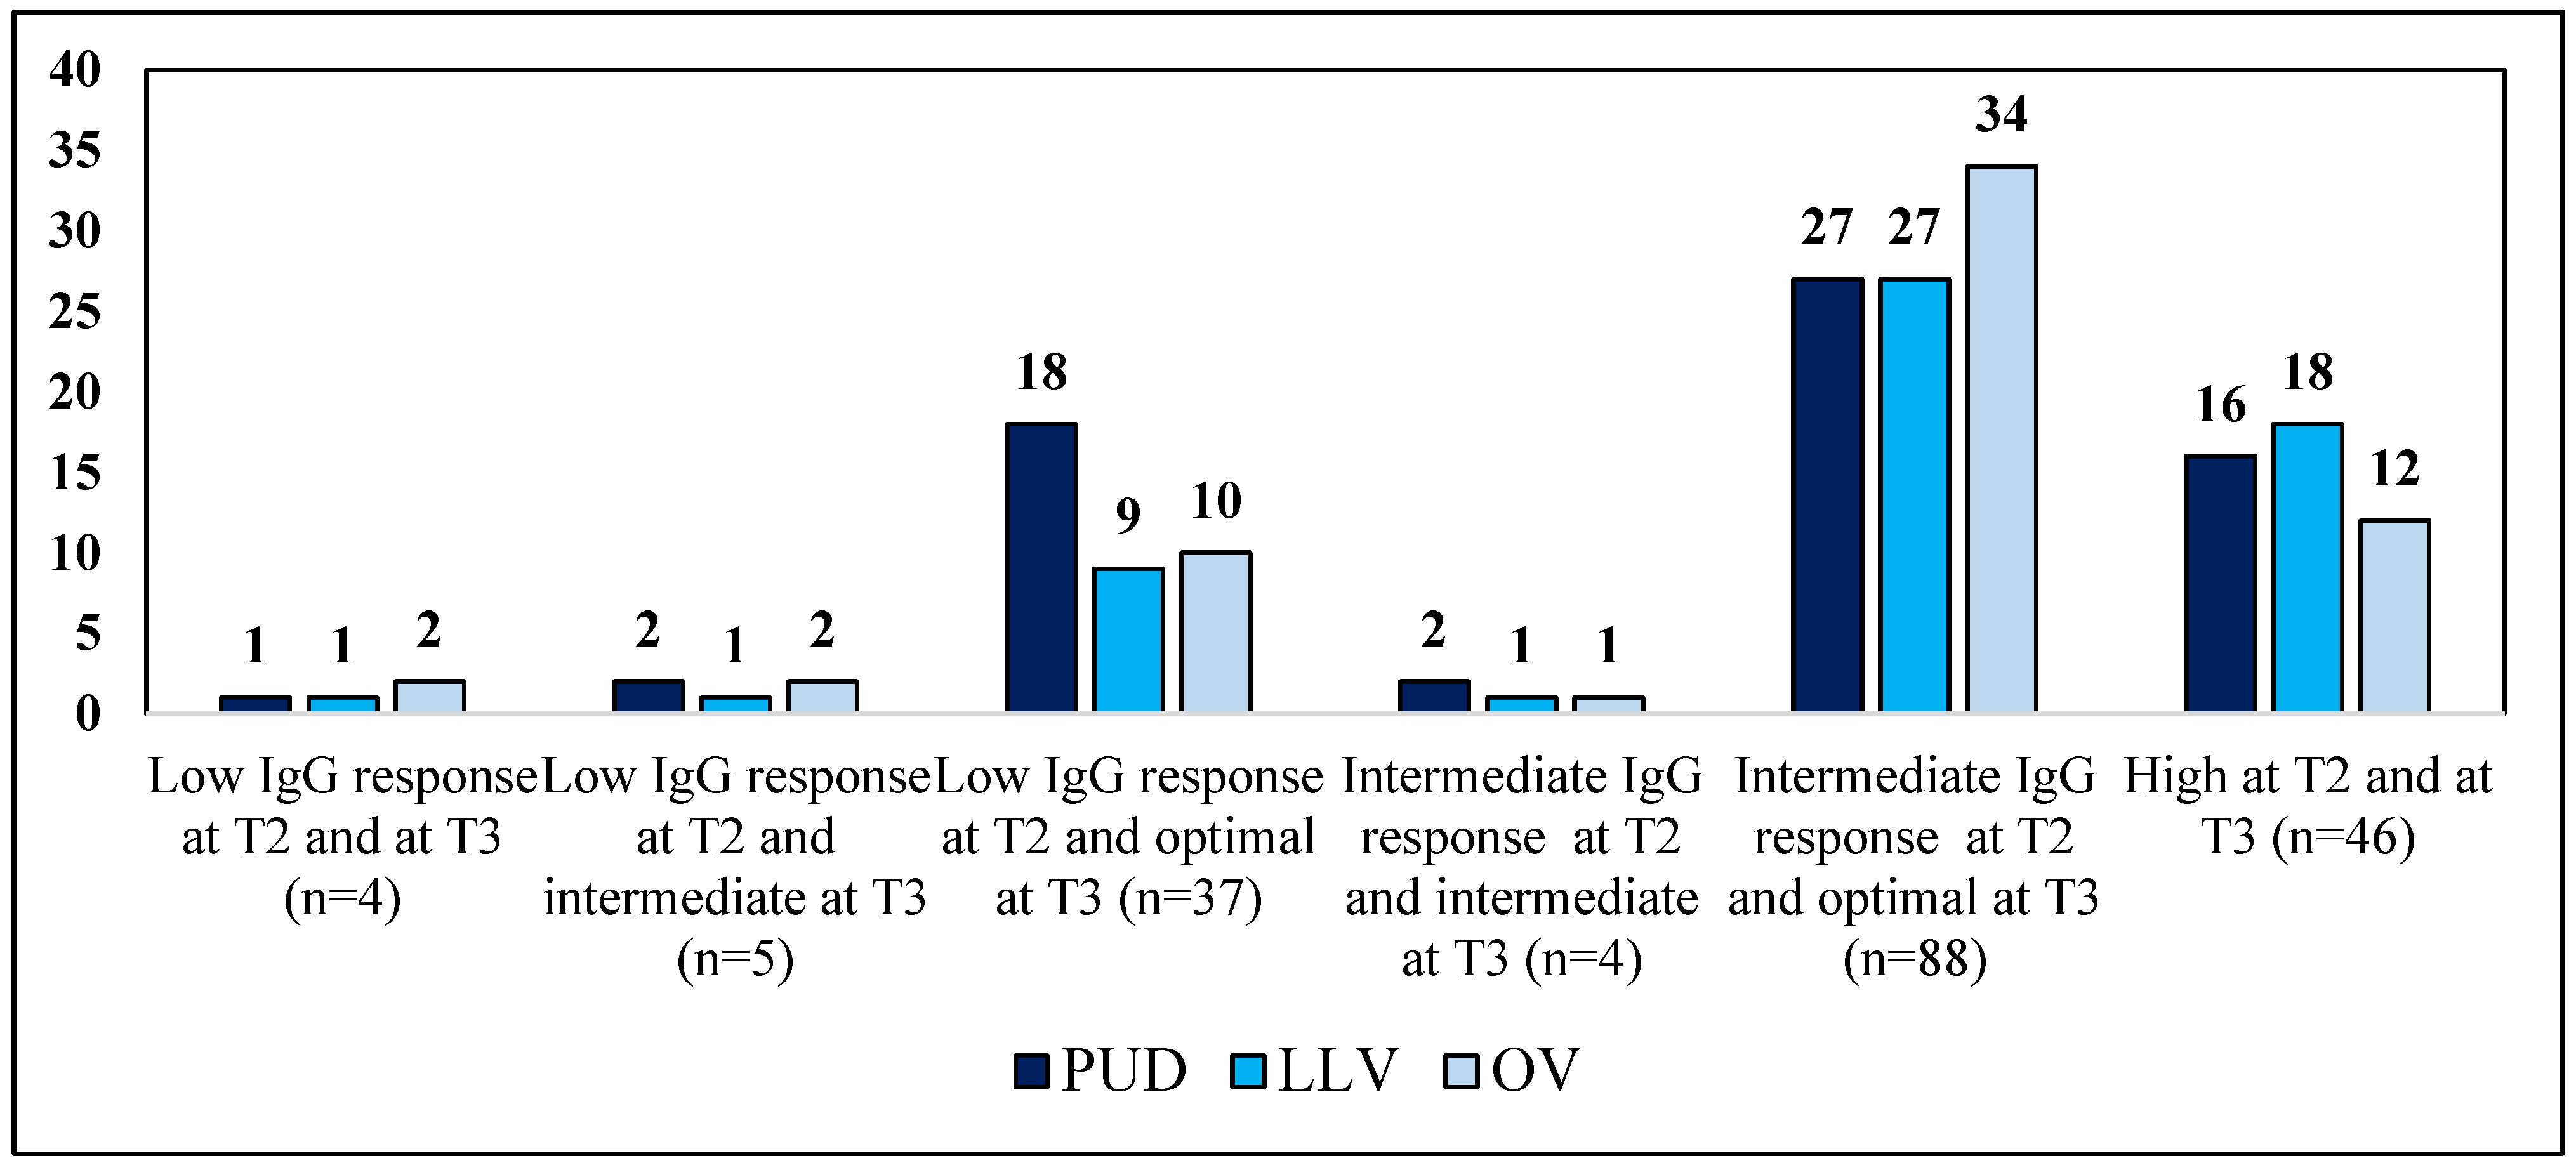
| Patients with Persistently Undetectable Viremia (n = 66) | ||||||
|---|---|---|---|---|---|---|
| Low Response (n,% = 21, 31.8) | Intermediate Response (n,% = 29, 44) | Optimal Response (n,% = 16, 24.2) | p L vs. I | p L vs. O | p I vs. O | |
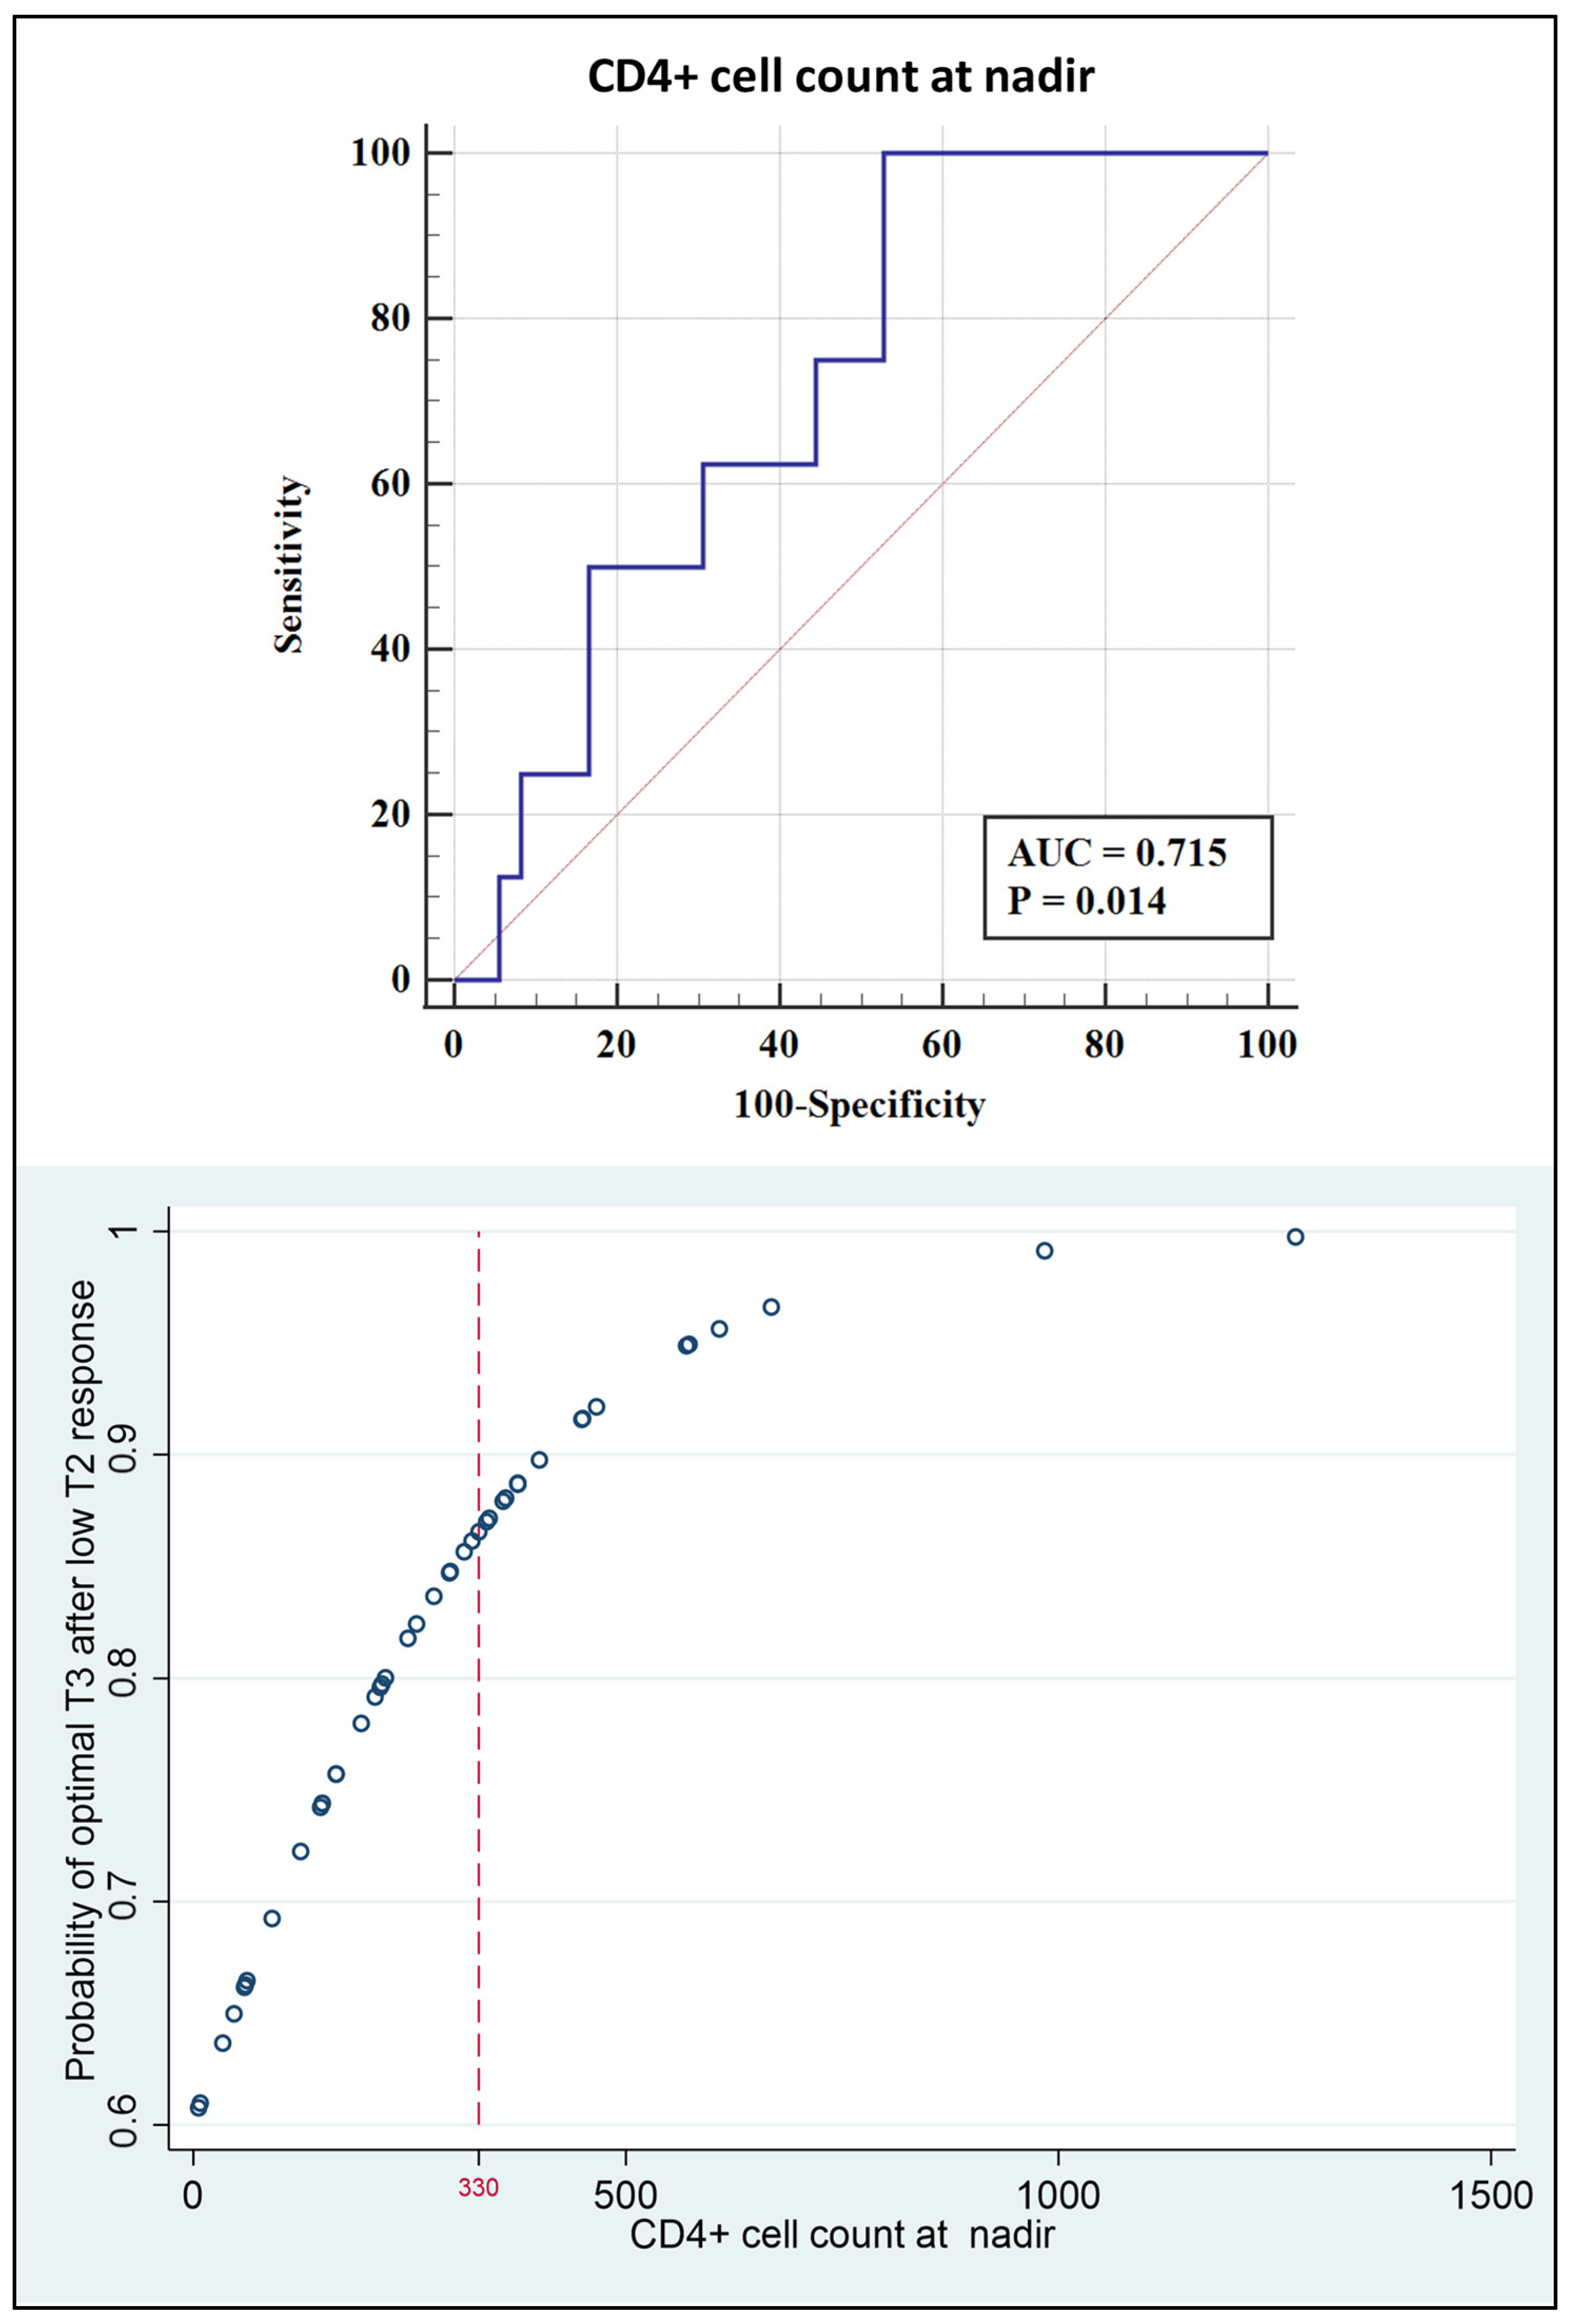
| CD4+ cell count at nadir (cells/mm3) 1 | 317 (157–425) | 310 (157–428) | 326 (134–408) | 0.7145 | 0.7388 | 0.8852 |
| Overall CD4+ cell count (cells/mm3) 1 | 575 (463–1051) | 673 (508–812) | 647 (552–841) | 0.5229 | 0.9511 | 0.5533 |
| Patients with low level viremia (n = 57) | ||||||
| Low response (n,% = 11, 19.3) | Intermediate response (n,% = 28, 49.1) | Optimal response (n,% = 18, 31.6) | p L vs. I | p L vs. O | p I vs. O | |
| CD4+ cell count at nadir (cells/mm3) 1 | 321 (222–375) | 320 (188–485) | 222 (111–368) | 0.9208 | 0.2918 | 0.1606 |
| Overall CD4+ cell count (cells/mm3) 1 | 729 (475–1001) | 721 (587–881) | 662 (459–826) | 0.6397 | 0.7419 | 0.3030 |
| Patients with ongoing viremia (n = 61) | ||||||
| Low response (n,% = 14, 22.9) | Intermediate response (n,% = 35, 57.4) | Optimal response (n,% = 12, 19.7) | p L vs. I | p L vs. O | p I vs. O | |
| CD4+ cell count at nadir (cells/mm3) 1 | 206 (60–322) | 159 (76–302) | 130 (45–214) | 0.9367 | 0.3474 | 0.2447 |
| Overall CD4+ cell count (cells/mm3)1 | 427 (269–814) | 529 (400–928) | 546 (412–569) | 0.1120 | 0.8100 | 0.5582 |
| Overall Responsiveness to T2 (N = 184) | ||||
|---|---|---|---|---|
| Variable | Odds Ratio | 95% CI | p-value | |
| CD4+ nadir count (cells/mm3) | 0.99 | 0.99 | 1.01 | 0.153 |
| CD4+ delta count (cells/mm3) | 0.99 | 0.99 | 1.01 | 0.943 |
| CD4+ overall count (cells/mm3) | 0.99 | 0.99 | 1.01 | 0.355 |
| Age on Enrollment (years) | 1.04 | 0.98 | 1.1 | 0.159 |
| Age on Diagnosis (years) | 0.98 | 0.94 | 1.04 | 0.6 |
| Responsiveness to T2 in persistently undetectable viremia group (N = 66) | ||||
| Variable | Odds Ratio | 95% CI | p-value | |
| CD4+ nadir count (cells/mm3) | 0.99 | 0.99 | 1.01 | 0.7 |
| CD4+ delta count (cells/mm3) | 0.99 | 0.99 | 1.01 | 0.72 |
| CD4+ overall count (cells/mm3) | 0.99 | 0.99 | 1.01 | 0.78 |
| Age on Enrollment (years) | 1.02 | 0.97 | 1.01 | 0.33 |
| Age on Diagnosis (years) | 0.99 | 0.95 | 1.04 | 0.84 |
| Responsiveness to T2 in low level viremia group (N = 57) | ||||
| Variable | Odds Ratio | 95% CI | p-value | |
| CD4+ nadir count (cells/mm3) | 0.99 | 0.99 | 1.01 | 0.12 |
| CD4+ delta count (cells/mm3) | 1.01 | 0.99 | 1.01 | 0.73 |
| CD4+ overall count (cells/mm3) | 0.99 | 0.99 | 1.01 | 0.35 |
| Age on enrollment (years) | 0.98 | 0.93 | 1.01 | 0.52 |
| Age on diagnosis (years) | 0.95 | 0.89 | 1.01 | 0.11 |
| Responsiveness to T2 in ongoing viremia group (N = 61) | ||||
| Variable | Odds Ratio | 95% CI | p-value | |
| CD4+ nadir count (cells/mm3) | 0.99 | 0.99 | 1.01 | 0.21 |
| CD4+ delta count (cells/mm3) | 0.99 | 0.99 | 1.01 | 0.9 |
| CD4+ overall count (cells/mm3) | 0.99 | 0.99 | 1.01 | 0.39 |
| Age on enrollment (years) | 1.03 | 0.96 | 1.01 | 0.37 |
| Age on diagnosis (years) | 1.1 | 0.01 | 1.52 | 0.11 |
| Patients with Low Response at T3 n (%) | Patients with Intermediate Response at T3 n (%) | Patients with Optimal Response at T3 (%) | |
|---|---|---|---|
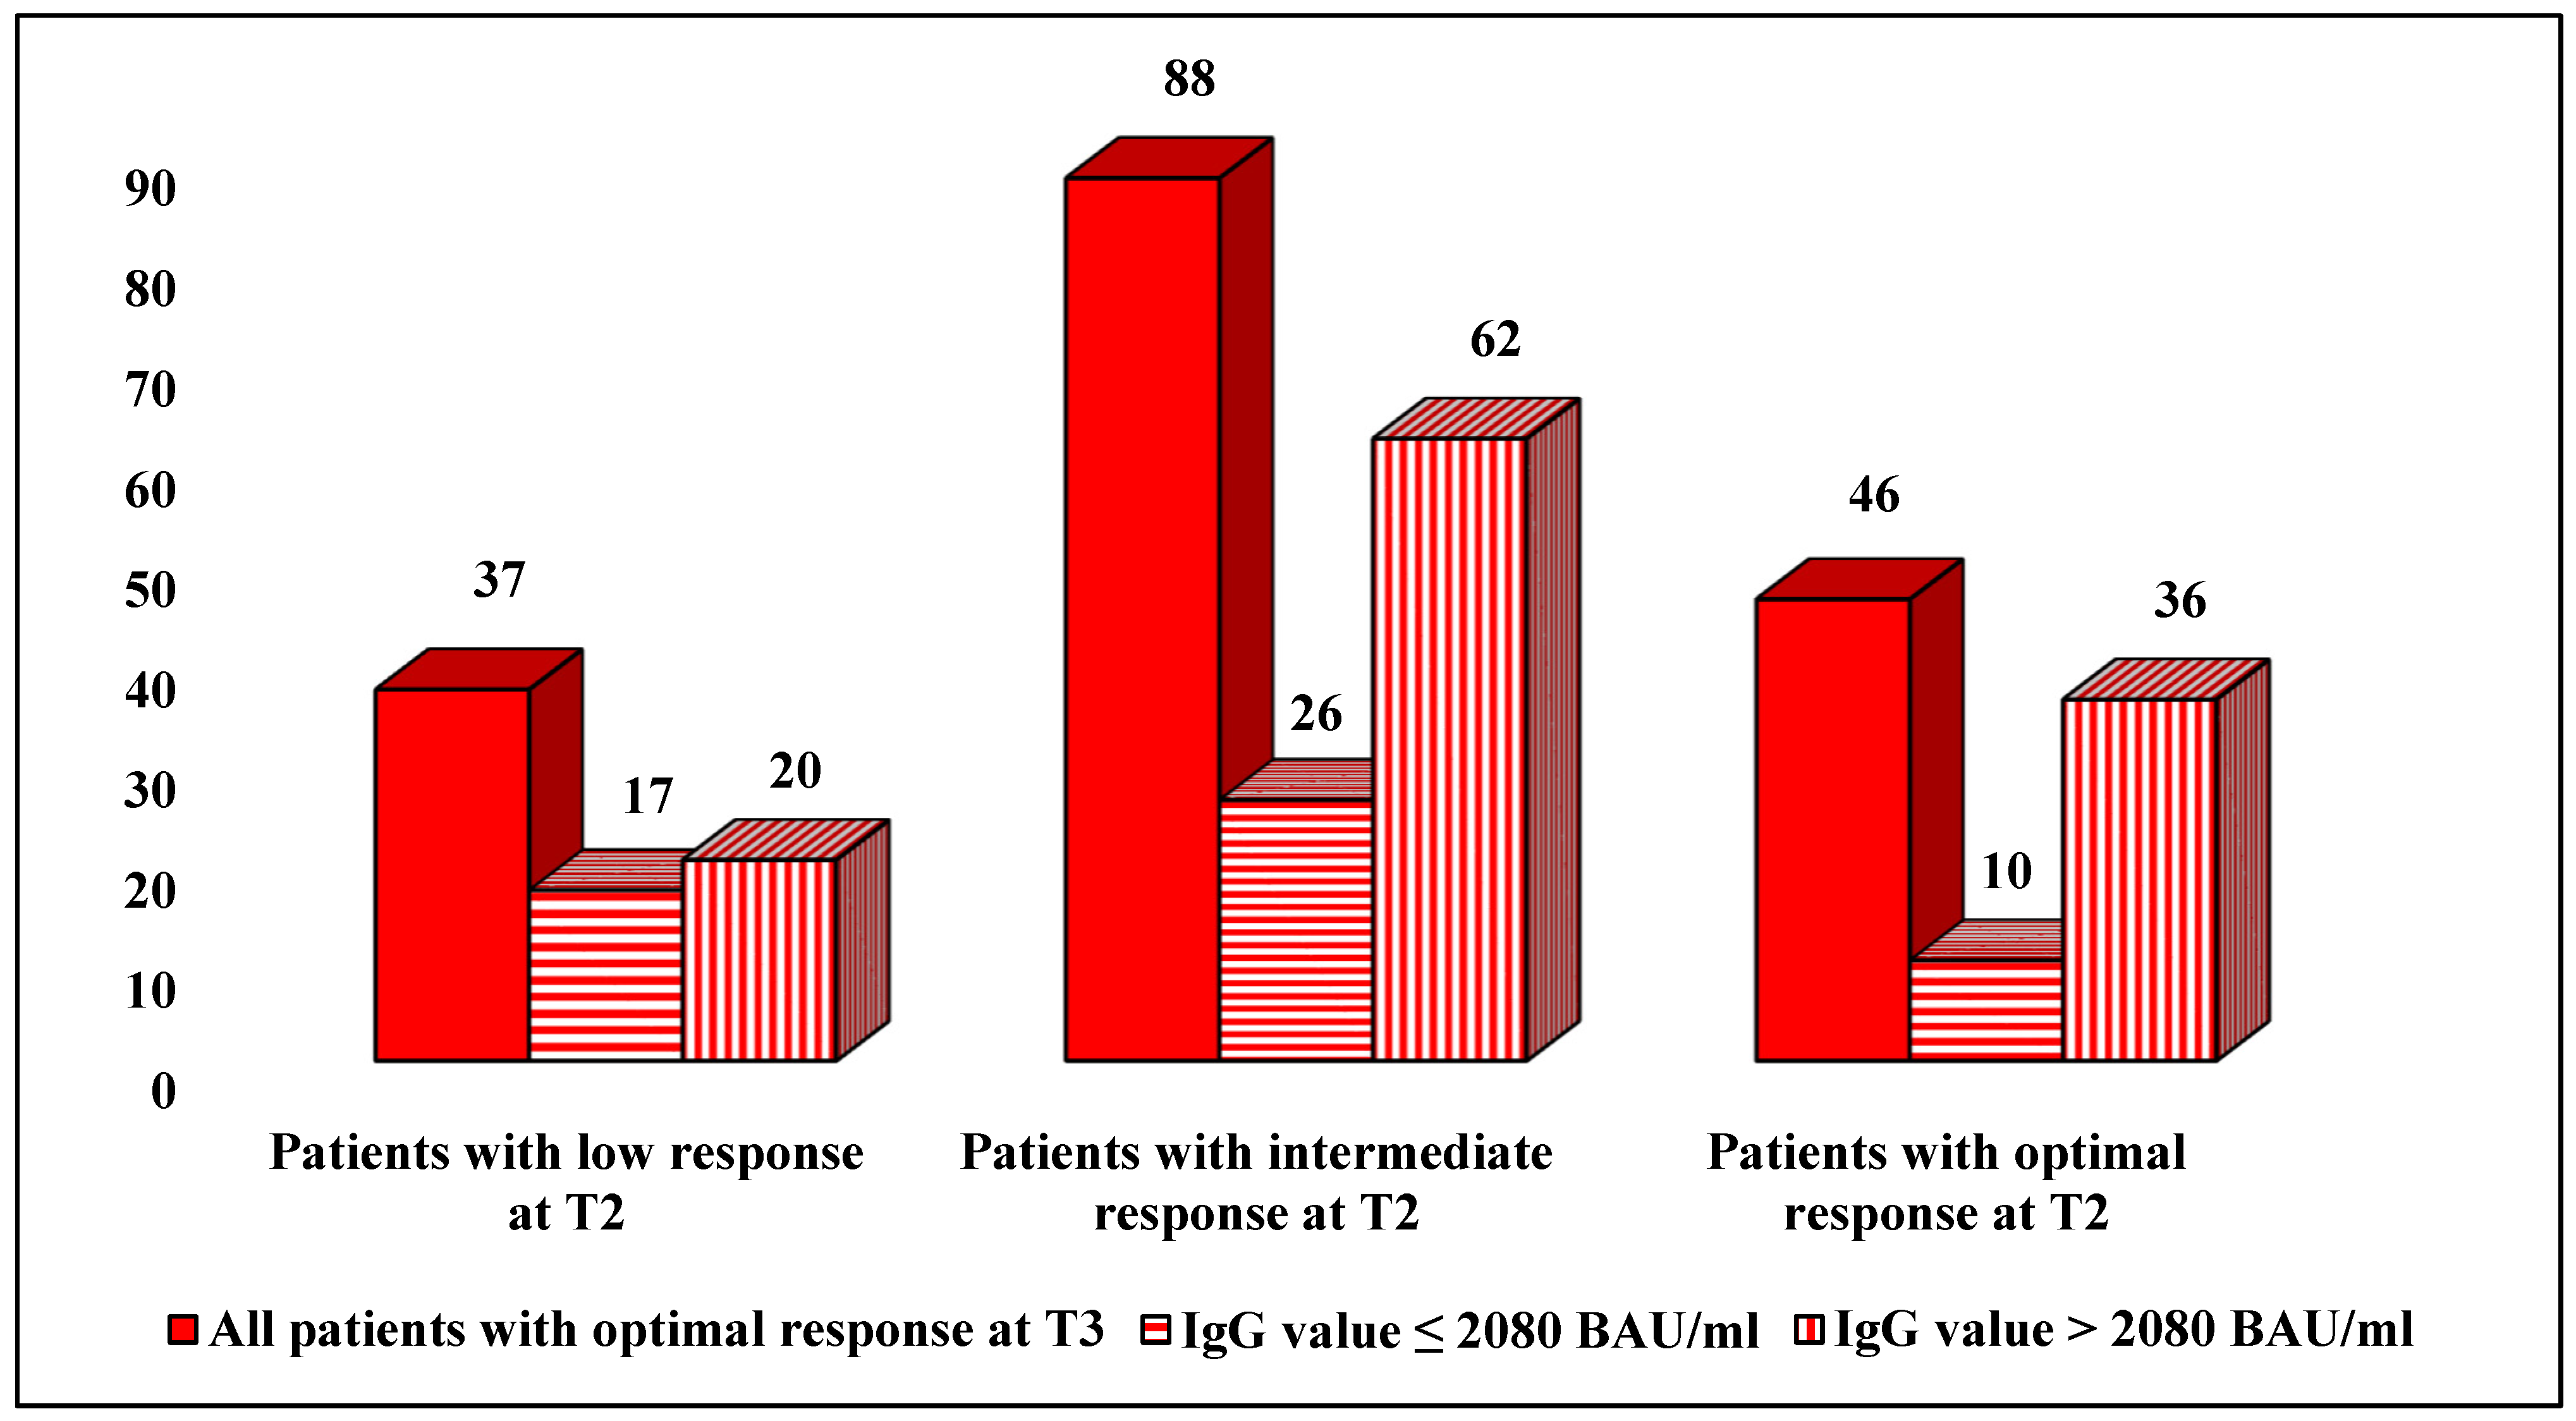
| Patients with low response at T2, n = 46 | 4 (8.7) | 5 (10.9) | 37 (80.4) |
| Patients with intermediate response at T2, n = 92 | 0 | 4 (4.3) | 88 (95.7) |
| Patients with optimal response at T2, n = 46 | 0 | 0 | 46 (100) |
| Overall Responsiveness to T3 | ||||
|---|---|---|---|---|
| Variable | Odds Ratio | 95% CI | p-value | |
| Responsiveness to T2 | 3.23 | 1.5 | 6.9 | 0.003 |
| CD4+ nadir count (cells/mm3) | 1.002 | 0.99 | 1.01 | 0.62 |
| CD4+ delta count (cells/mm3) | 1.01 | 0.99 | 1.01 | 0.26 |
| CD4+ overall count (cells/mm3) | 1.01 | 0.99 | 1.01 | 0.31 |
| Age on enrollment (years) | 1.04 | 0.98 | 1.1 | 0.16 |
| Age on diagnosis (years) | 0.98 | 0.94 | 1.03 | 0.6 |
| Responsiveness to T3 in persistently undetectable viremia group | ||||
| Variable | Odds Ratio | 95% CI | p-value | |
| Responsiveness to T2 | 2.16 | 0.79 | 5.86 | 0.09 |
| CD4+ nadir count (cells/mm3) | 0.99 | 0.99 | 1.01 | 0.79 |
| CD4+ delta count (cells/mm3) | 1.002 | 0.99 | 1.01 | 0.34 |
| CD4+ overall count (cells/mm3) | 1.001 | 0.99 | 1.003 | 0.82 |
| Age on enrollment (years) | 1.001 | 0.91 | 1.09 | 0.93 |
| Age on diagnosis (years) | 0.99 | 0.92 | 1.06 | 0.79 |
| Responsiveness to T3 in low level viremia group | ||||
| Variable | Odds Ratio | 95% CI | p-value | |
| Responsiveness to T2 | 5.23 | 0.75 | 36.68 | 0.021 |
| CD4+ nadir count (cells/mm3) | 1 | 0.99 | 1 | 0.31 |
| CD4+ delta count (cells/mm3) | 1.001 | 0.99 | 1.01 | 0.96 |
| CD4+ overall count (cells/mm3) | 1.003 | 0.99 | 1.01 | 0.2 |
| Age on enrollment (years) | 1.09 | 0.95 | 1.24 | 0.2 |
| Age on diagnosis (years) | 1.08 | 0.94 | 1.25 | 0.24 |
| Responsiveness to T3 in ongoing viremia group | ||||
| Variable | Odds Ratio | 95% CI | p-value | |
| Responsiveness to T2 | 4.27 | 1.01 | 18.12 | 0.013 |
| CD4+ nadir count (cells/mm3) | 1 | 0.99 | 1.01 | 0.45 |
| CD4+ delta count (cells/mm3) | 1.002 | 0.99 | 1.01 | 0.45 |
| CD4+ overall count (cells/mm3) | 1.001 | 0.99 | 1.01 | 0.78 |
| Age on enrollment (years) | 1.05 | 0.005 | 78.31 | 0.24 |
| Age on diagnosis (years) | 0.94 | 0.87 | 1.02 | 0.17 |
Disclaimer/Publisher’s Note: The statements, opinions and data contained in all publications are solely those of the individual author(s) and contributor(s) and not of MDPI and/or the editor(s). MDPI and/or the editor(s) disclaim responsibility for any injury to people or property resulting from any ideas, methods, instructions or products referred to in the content. |
© 2022 by the authors. Licensee MDPI, Basel, Switzerland. This article is an open access article distributed under the terms and conditions of the Creative Commons Attribution (CC BY) license (https://creativecommons.org/licenses/by/4.0/).
Share and Cite
Basso, M.; Pirola, N.; Pascoli, S.; Bragato, B.; Vinci, A.; Iannetta, M.; Colombo, F.; Geremia, N.; Martignago, L.; Rossi, M.C.; et al. Humoral Response after Two Doses of BNT162b2 mRNA Vaccine Has a Role in Predicting Response after Three Doses That Is Related to Plasma HIV Viremia and Nadir CD4+ Cell Count in HIV-Positive Patients. Vaccines 2023, 11, 82. https://doi.org/10.3390/vaccines11010082
Basso M, Pirola N, Pascoli S, Bragato B, Vinci A, Iannetta M, Colombo F, Geremia N, Martignago L, Rossi MC, et al. Humoral Response after Two Doses of BNT162b2 mRNA Vaccine Has a Role in Predicting Response after Three Doses That Is Related to Plasma HIV Viremia and Nadir CD4+ Cell Count in HIV-Positive Patients. Vaccines. 2023; 11(1):82. https://doi.org/10.3390/vaccines11010082
Chicago/Turabian StyleBasso, Monica, Nicole Pirola, Susanna Pascoli, Beatrice Bragato, Antonio Vinci, Marco Iannetta, Francesco Colombo, Nicholas Geremia, Luca Martignago, Maria Cristina Rossi, and et al. 2023. "Humoral Response after Two Doses of BNT162b2 mRNA Vaccine Has a Role in Predicting Response after Three Doses That Is Related to Plasma HIV Viremia and Nadir CD4+ Cell Count in HIV-Positive Patients" Vaccines 11, no. 1: 82. https://doi.org/10.3390/vaccines11010082