Inter-Strain Epigenomic Profiling Reveals a Candidate IAP Master Copy in C3H Mice

 ,
,  , and
, and 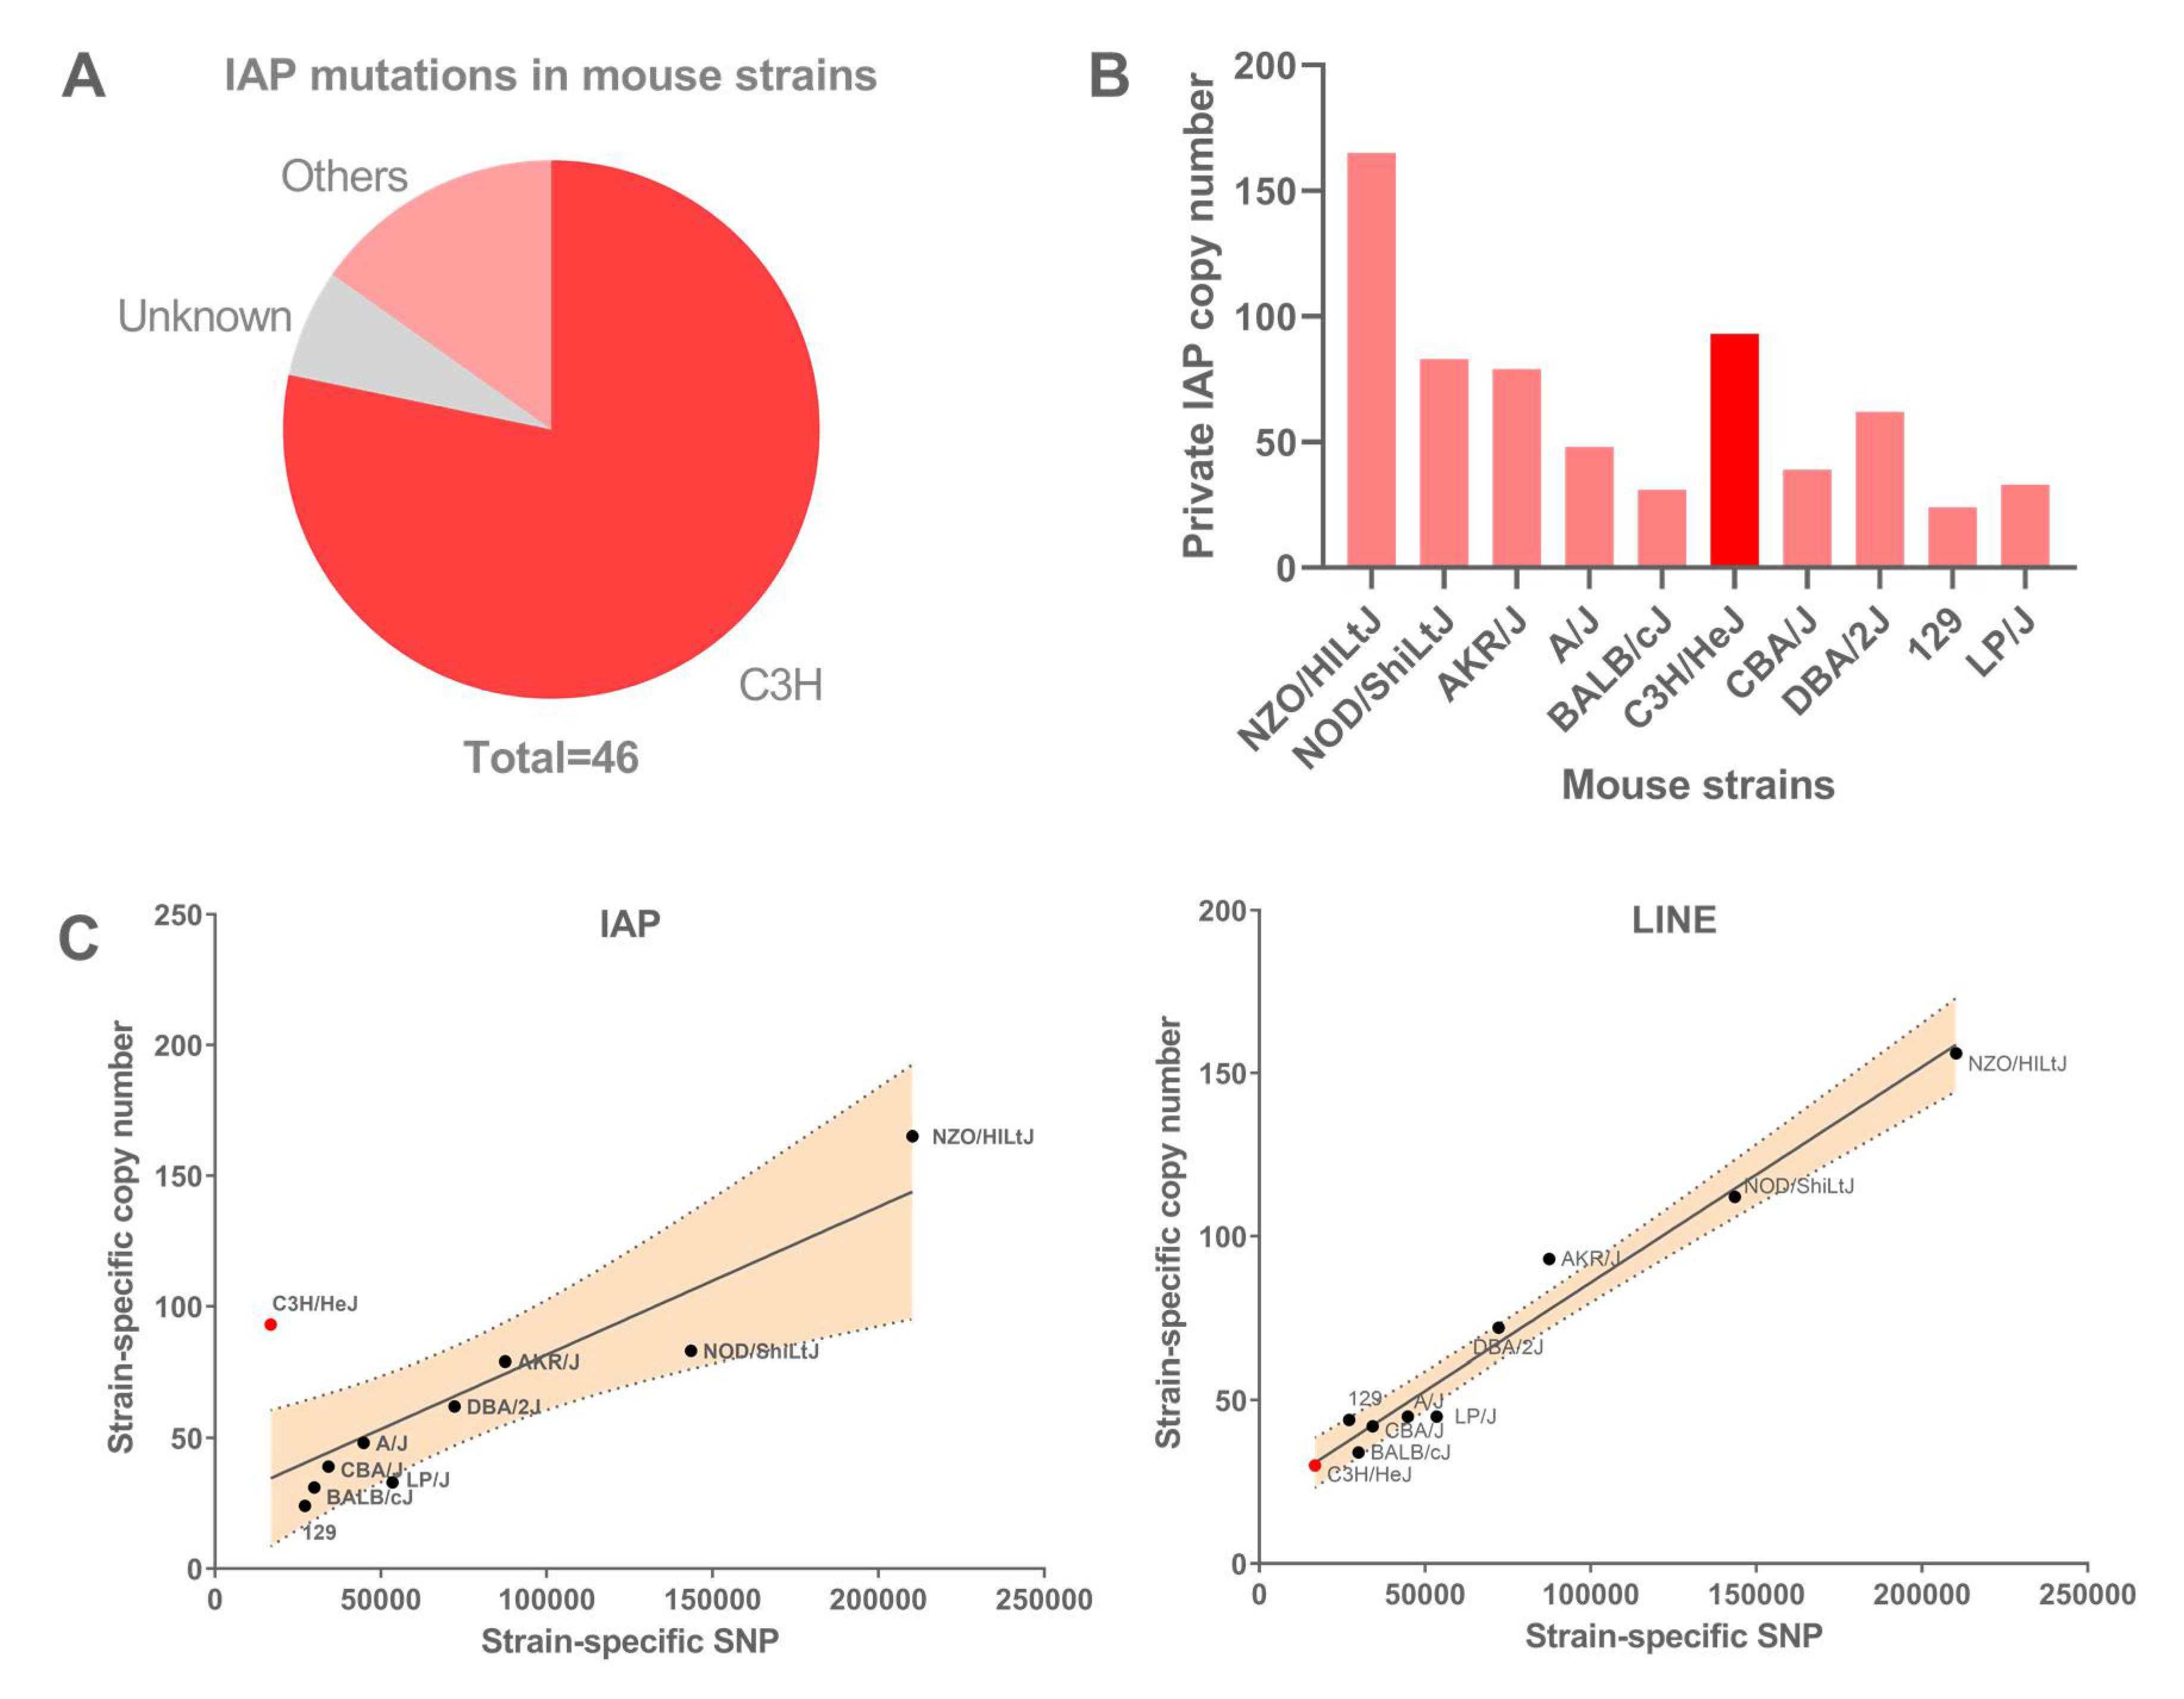
Abstract
:1. Introduction
2. Materials and Methods
2.1. Biological Material
2.2. Transposable Element Copies and SNP Analysis
2.3. IAP Expression Analysis
2.4. Native ChIP-Seq
2.5. Other Data Sets
2.6. Enrichment Profiles
2.7. Native ChIP-qPCR
2.8. Bisulfite Analysis of IAP Copies and Their Flanking Sequences
2.9. Size Determination of C3H/HeJ H3K4me3-IAP Copies
3. Results
3.1. IAP Accumulation in Mouse Strains
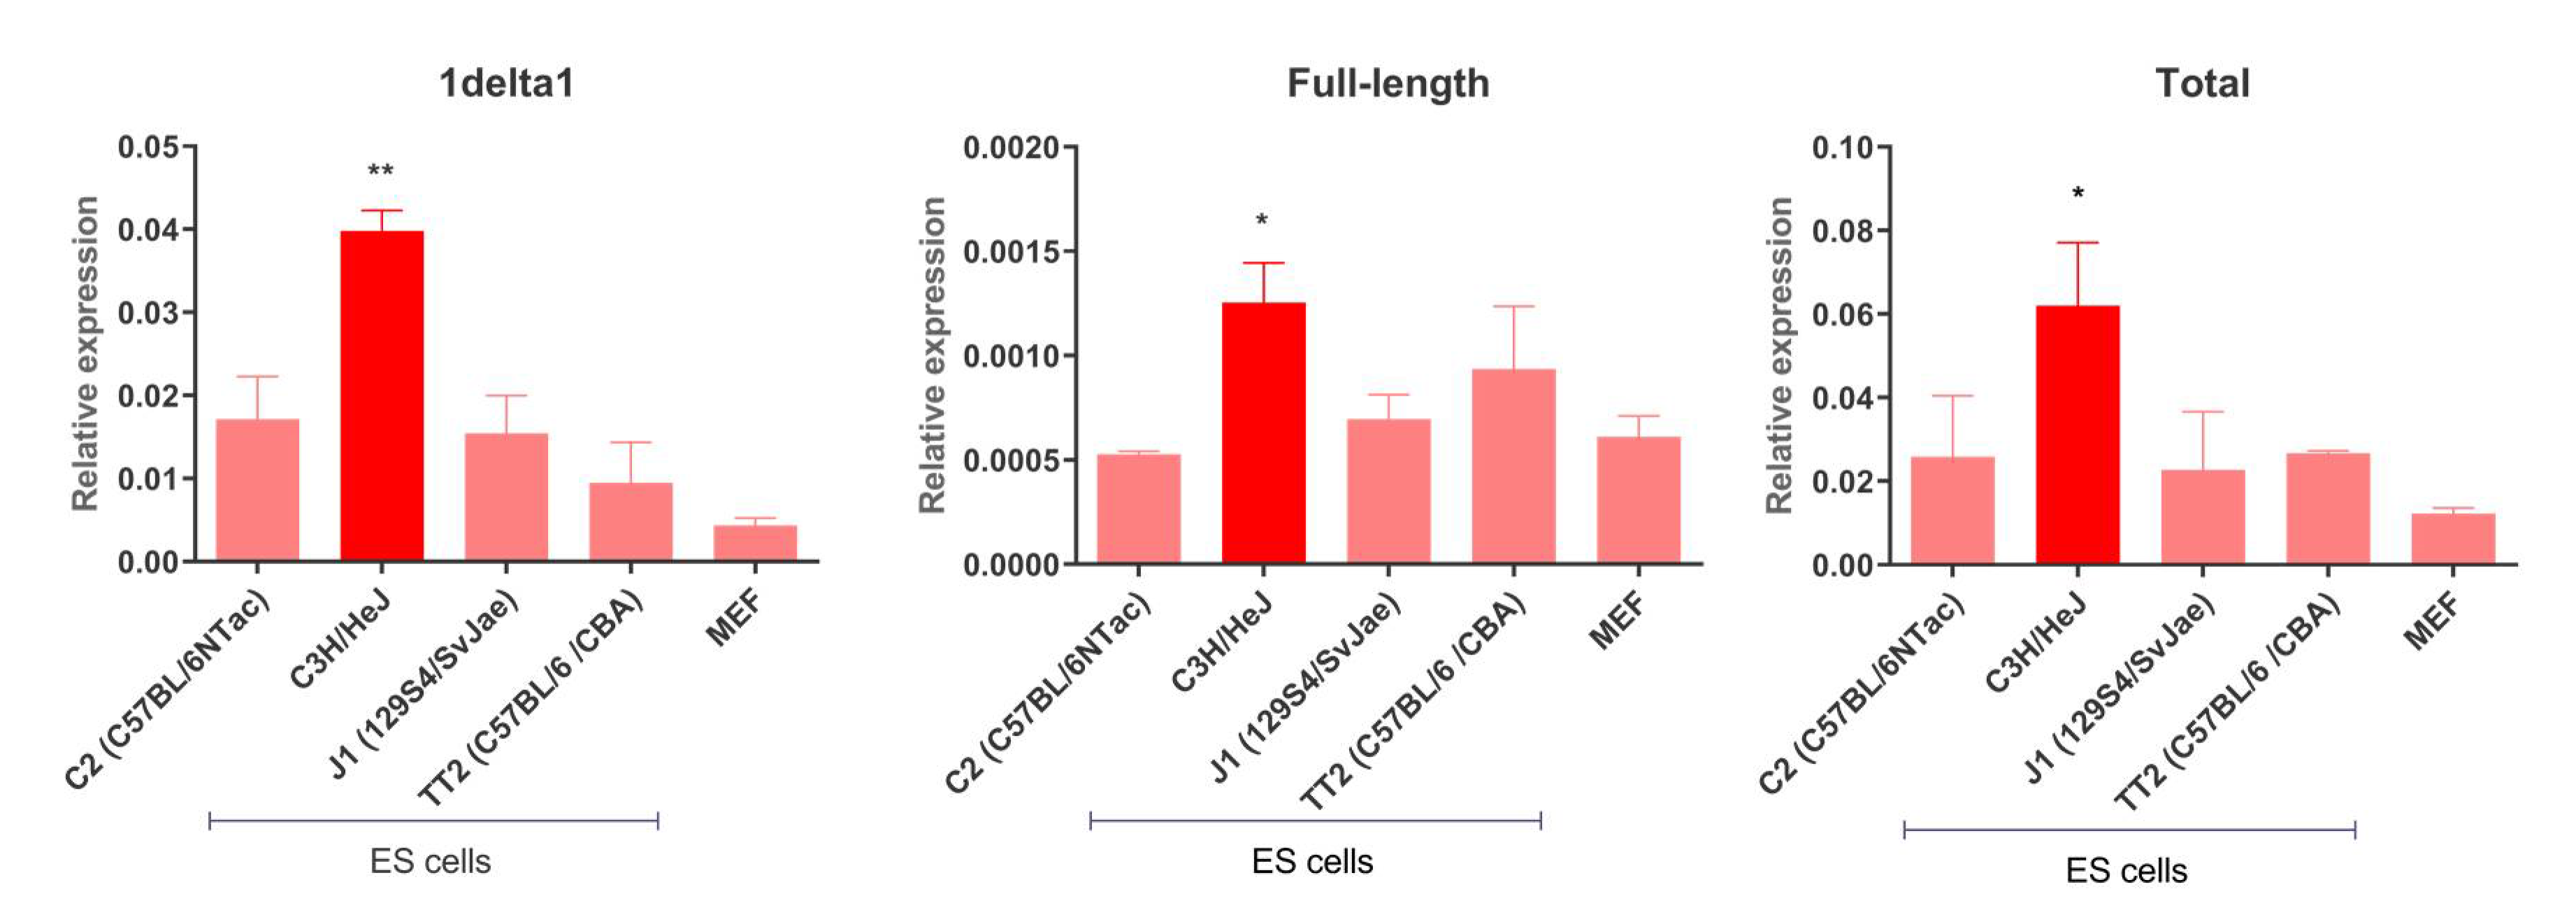
3.2. IAP Expression in Mouse ES Cells
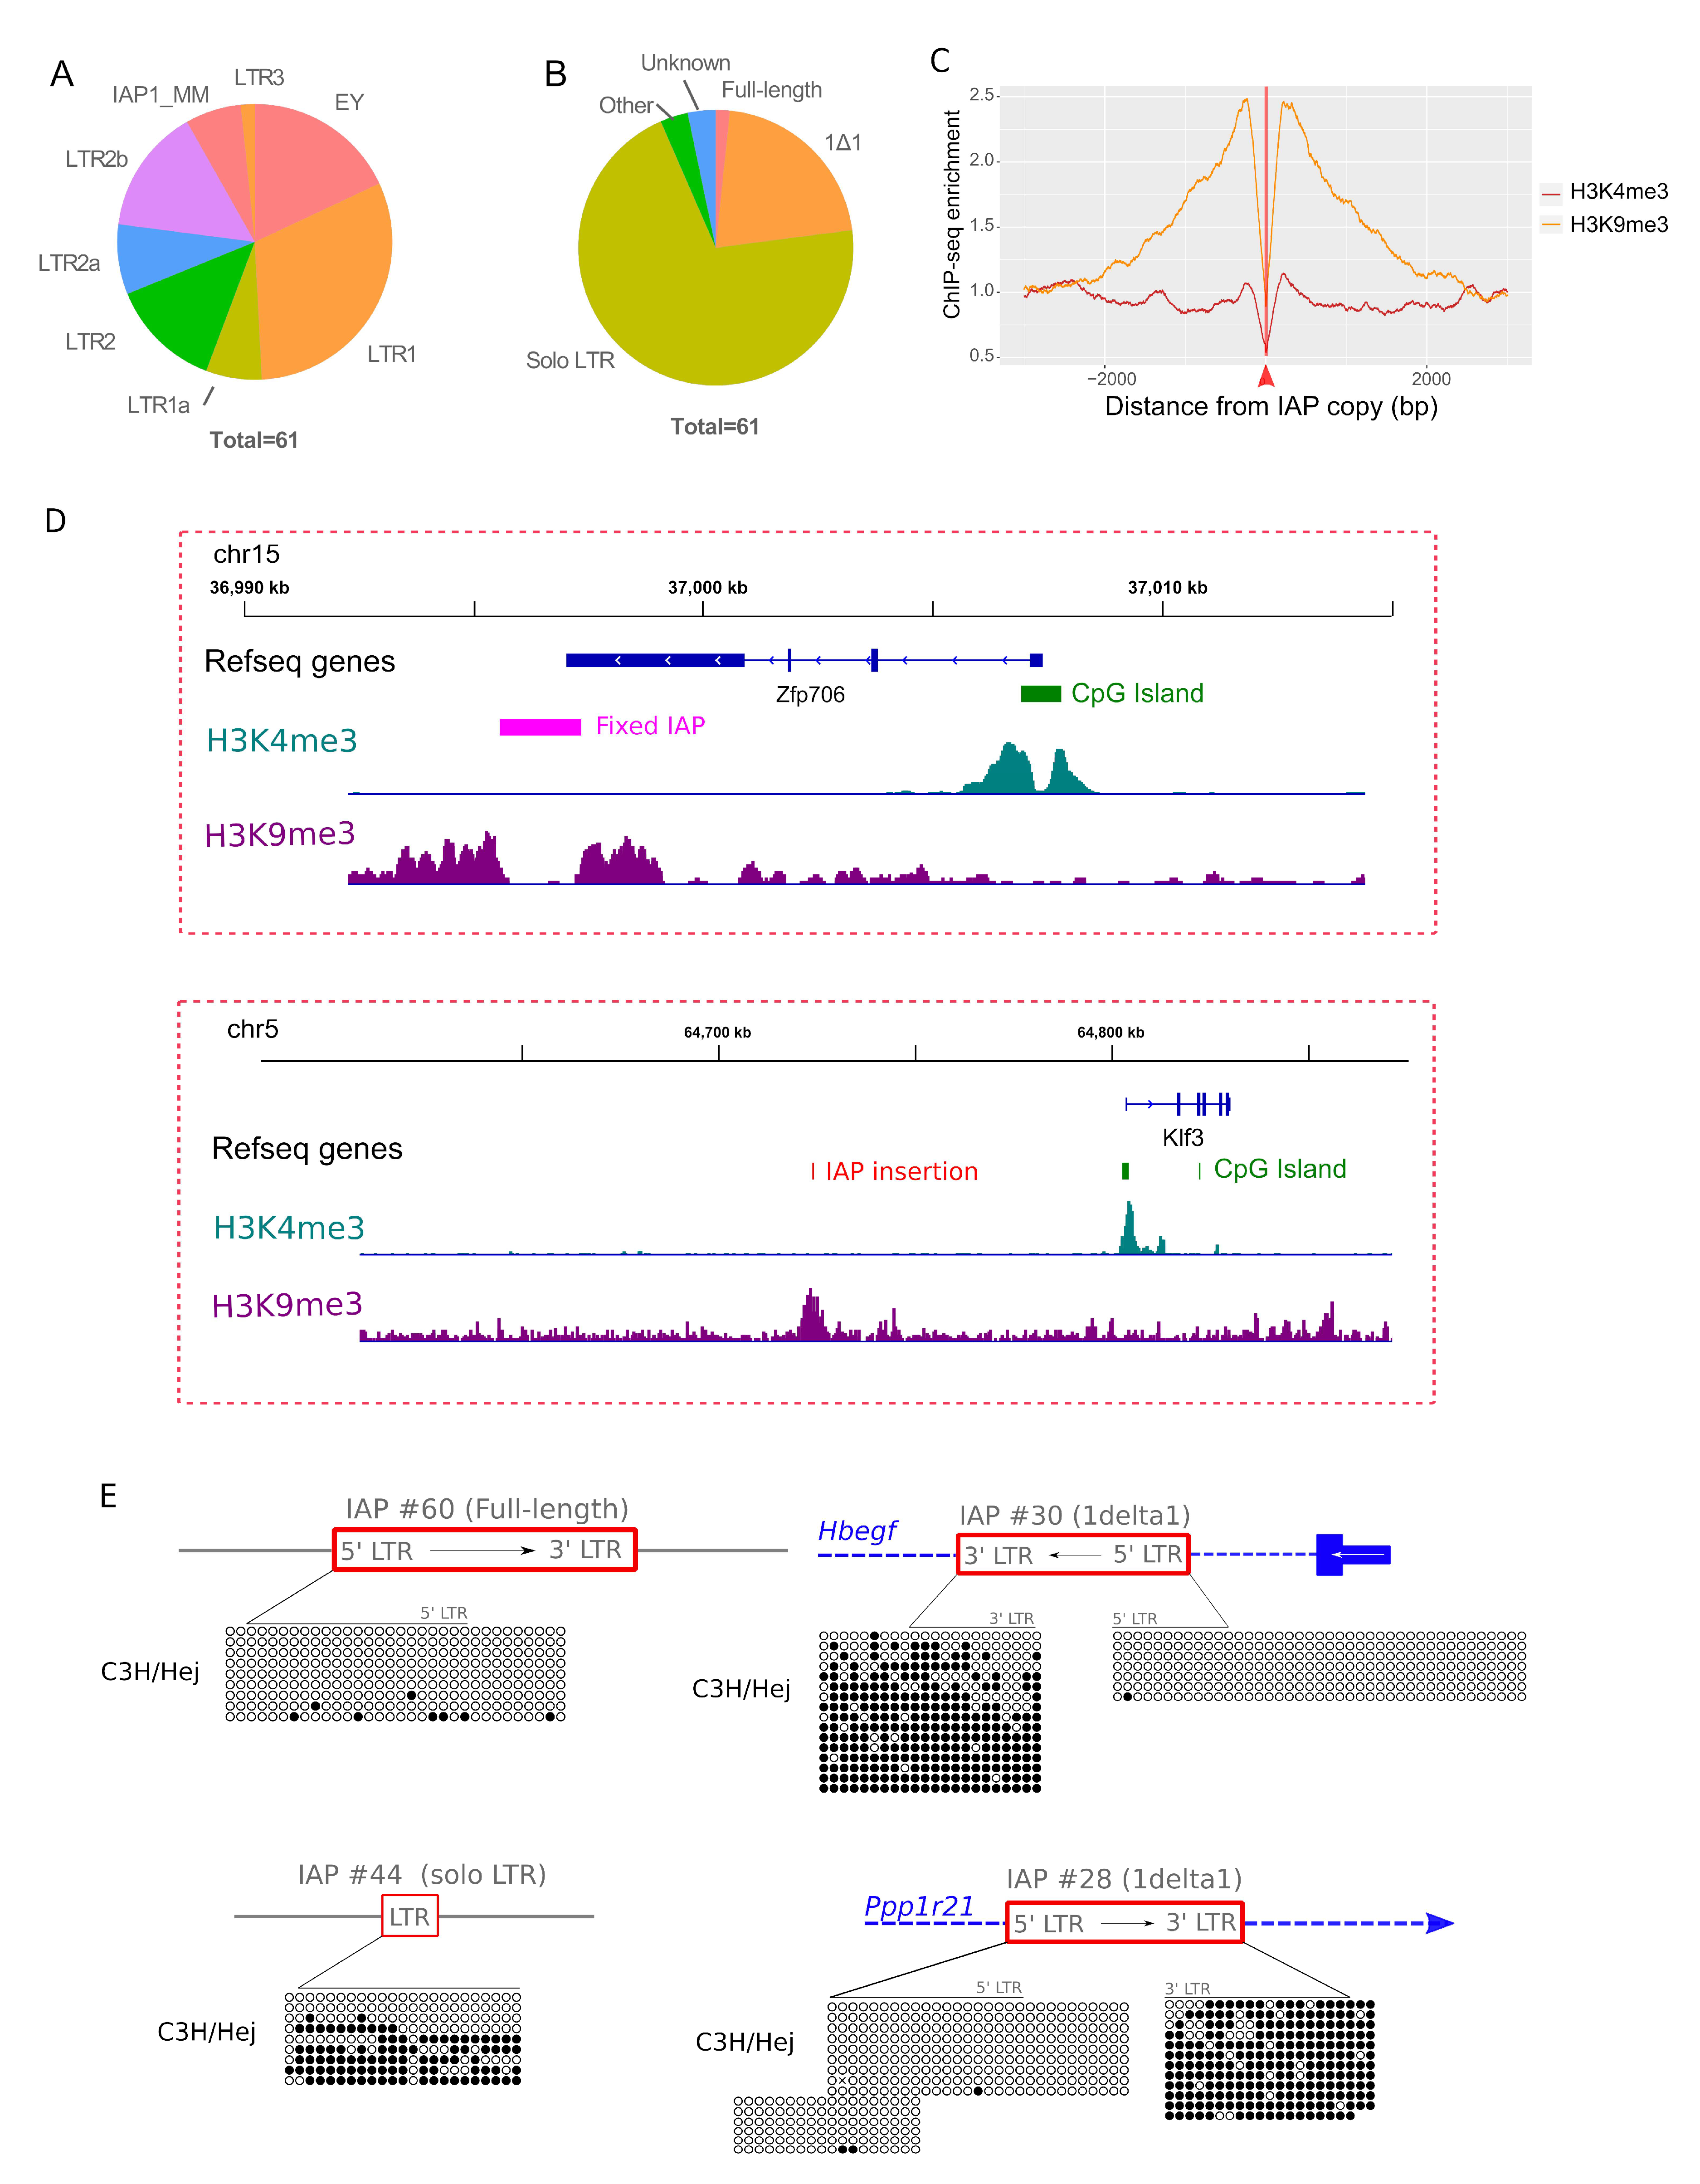
3.3. Permissive IAP Copies in C3H/HeJ ES Cells
3.4. IAP Copies Are Able to Recruit Permissive Chromatin
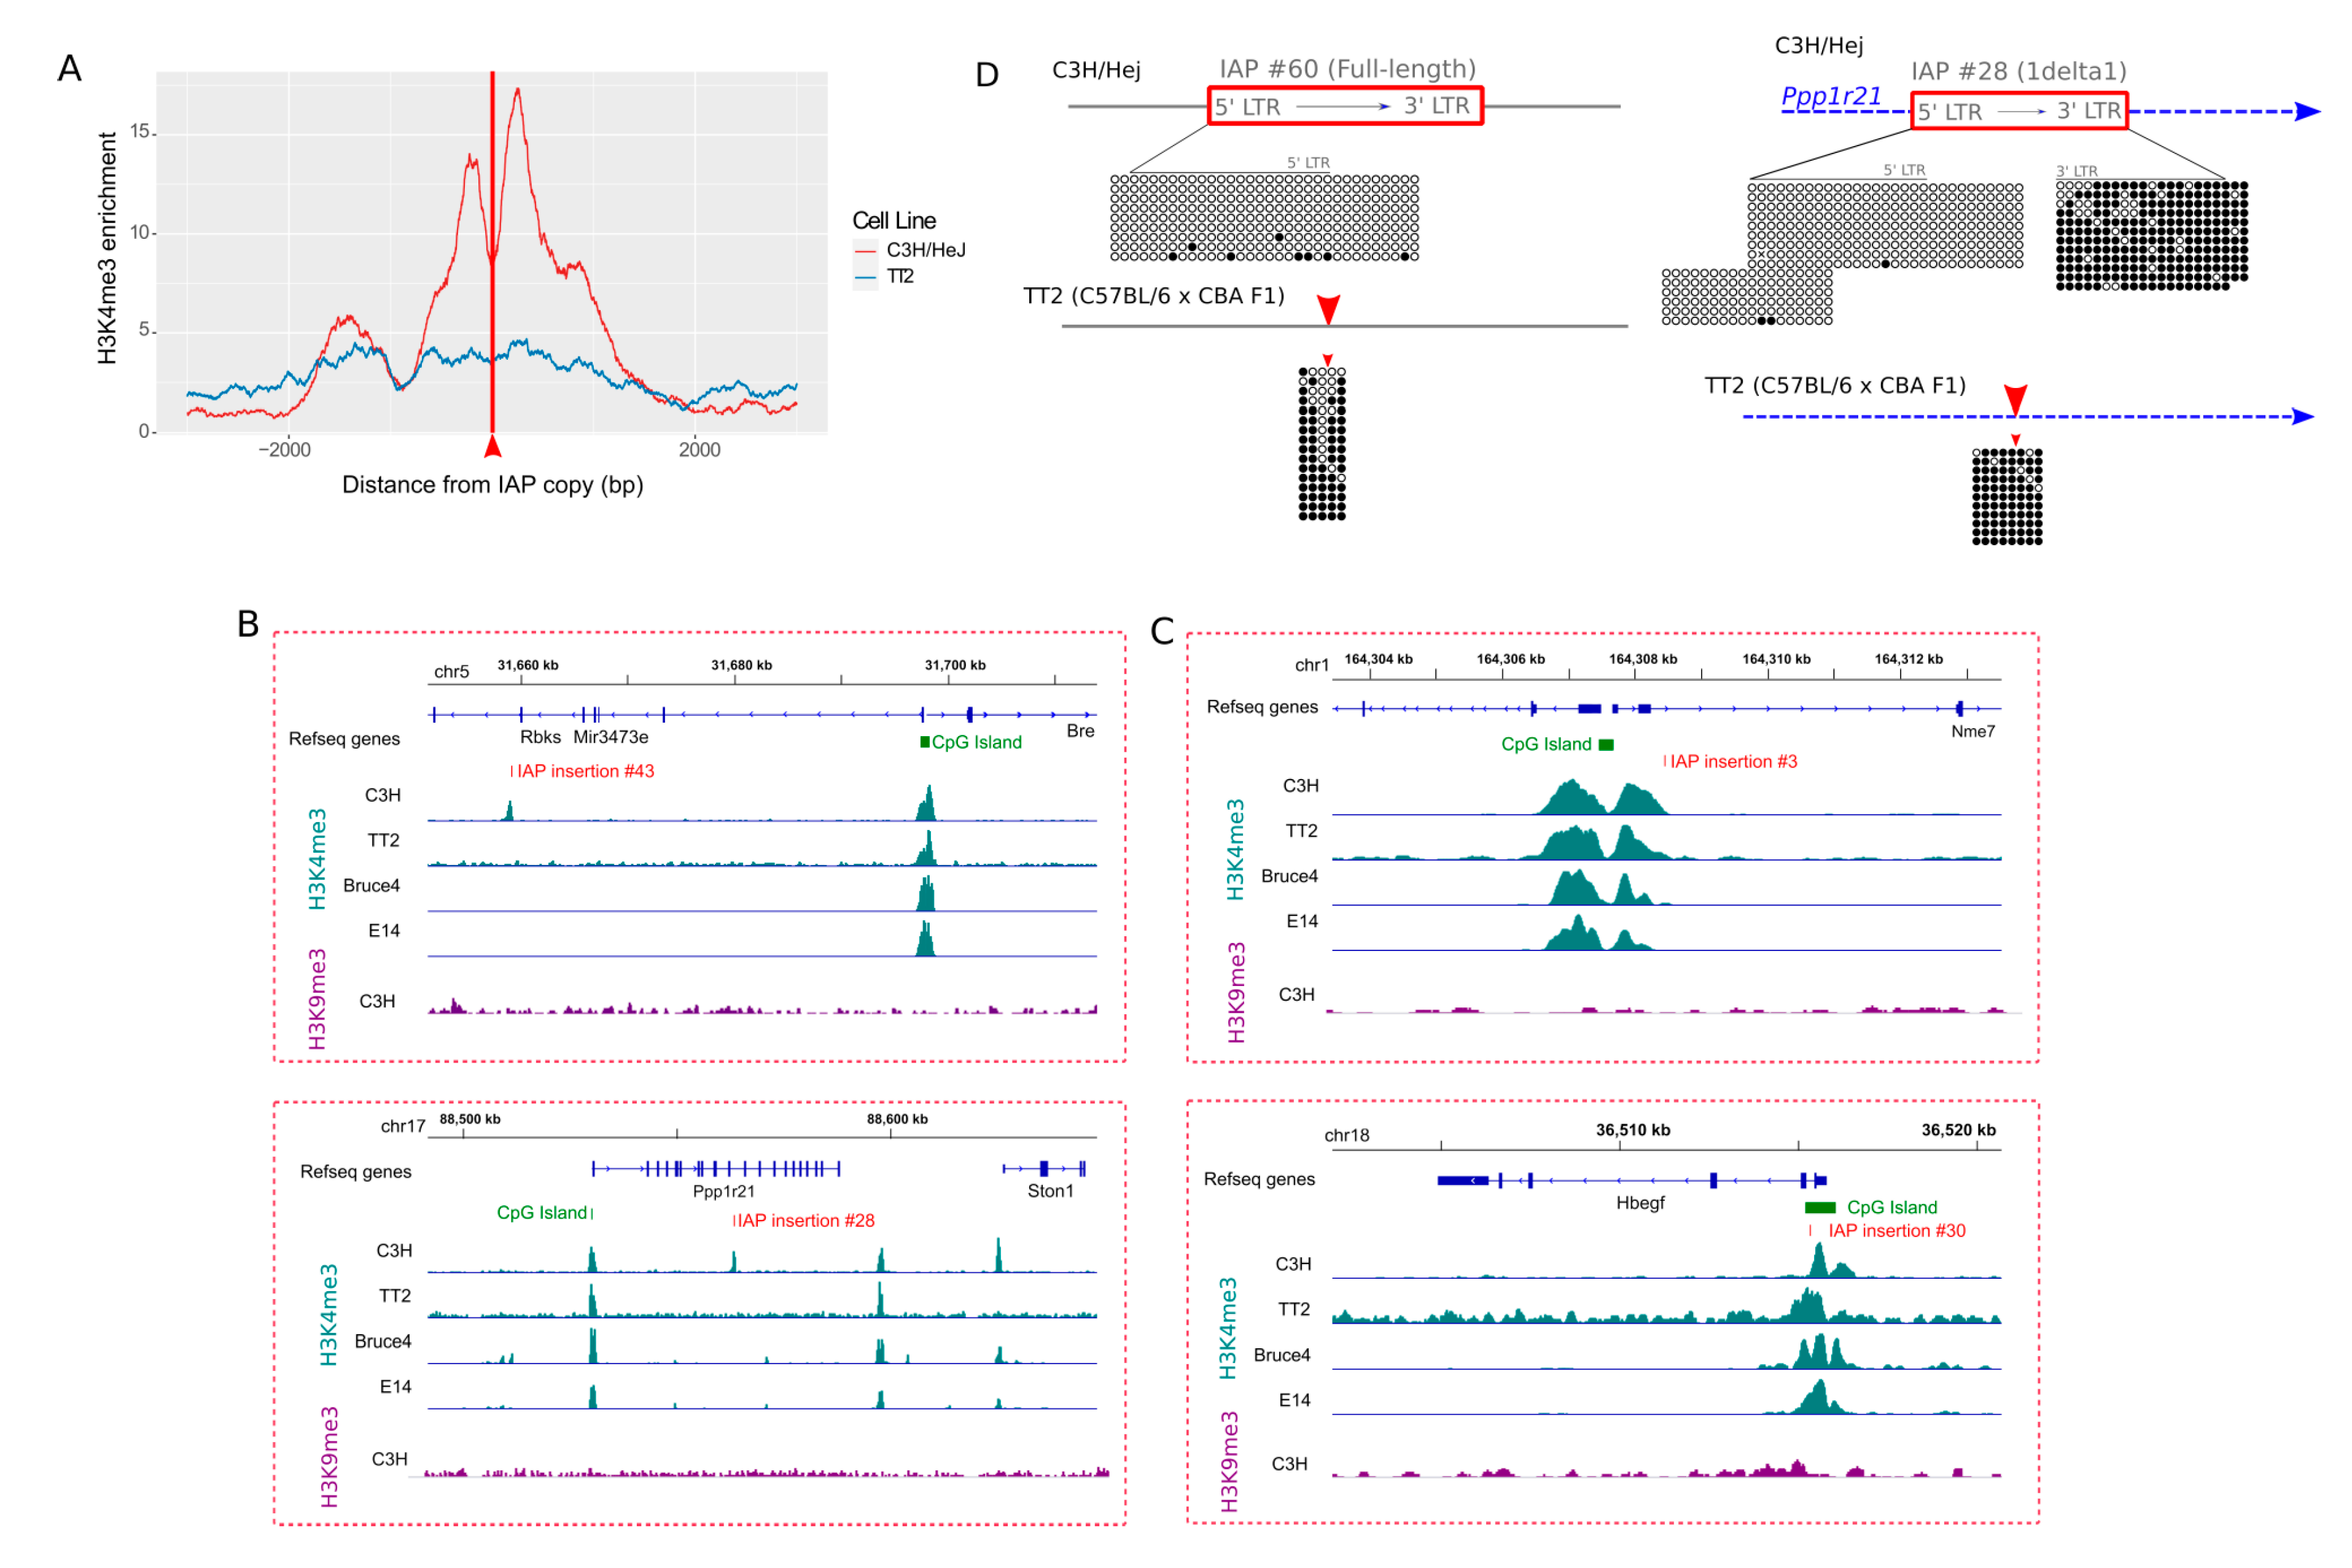
3.5. Difference in Chromatin State of Specific IAP Copies between Mouse Strains
3.6. Evidence for an Active “Master Copy” in the C3H Genome
4. Conclusions
Supplementary Materials
Author Contributions
Funding
Acknowledgments
Conflicts of Interest
References
- Elliott, T.A.; Gregory, T.R. Do larger genomes contain more diverse transposable elements? Bmc Evol. Biol. 2015, 15, 69. [Google Scholar] [CrossRef] [PubMed] [Green Version]
- Bourque, G.; Burns, K.H.; Gehring, M.; Gorbunova, V.; Seluanov, A.; Hammell, M.; Imbeault, M.; Izsvak, Z.; Levin, H.L.; Macfarlan, T.S.; et al. Ten things you should know about transposable elements. Genome Biol. 2018, 19, 199. [Google Scholar] [CrossRef] [PubMed]
- Feschotte, C. Transposable elements and the evolution of regulatory networks. Nat. Rev. Genet. 2008, 9, 397–405. [Google Scholar] [CrossRef] [PubMed] [Green Version]
- Rebollo, R.; Romanish, M.T.; Mager, D.L. Transposable Elements: An Abundant and Natural Source of Regulatory Sequences for Host Genes. Annu Rev. Genet. 2012, 46, 21–42. [Google Scholar] [CrossRef] [PubMed]
- Hancks, D.C.; Kazazian, H.H. Roles for retrotransposon insertions in human disease. Mob. DNA 2016, 7, 9. [Google Scholar] [CrossRef] [PubMed] [Green Version]
- Consortium, M.G.S. Initial sequencing and comparative analysis of the mouse genome. Nature 2002, 420, 520–562. [Google Scholar] [CrossRef] [PubMed]
- Maksakova, I.A.; Romanish, M.T.; Gagnier, L.; Dunn, C.A.; van de Lagemaat, L.N.; Mager, D.L. Retroviral Elements and Their Hosts: Insertional Mutagenesis in the Mouse Germ Line. PLoS Genet. 2006, 2, e2. [Google Scholar] [CrossRef] [Green Version]
- Gagnier, L.; Belancio, V.P.; Mager, D.L. Mouse germ line mutations due to retrotransposon insertions. Mob. DNA 2019, 10, 15. [Google Scholar] [CrossRef] [Green Version]
- Stocking, C.; Kozak, C.A. Murine endogenous retroviruses. Cell. Mol. Life Sci. 2008, 65, 3383–3398. [Google Scholar] [CrossRef] [Green Version]
- Kuff, E.L.; Lueders, K.K. The intracisternal A-particle gene family: Structure and functional aspects. Adv. Cancer Res. 1988, 51, 183–276. [Google Scholar]
- Qin, C.; Wang, Z.; Shang, J.; Bekkari, K.; Liu, R.; Pacchione, S.; McNulty, K.; Ng, A.; Barnum, J.; Storer, R. Intracisternal A particle genes: Distribution in the mouse genome, active subtypes, and potential roles as species-specific mediators of susceptibility to cancer. Mol. Carcinog. 2010, 49, 54–67. [Google Scholar] [CrossRef] [PubMed]
- Crichton, J.H.; Dunican, D.S.; Maclennan, M.; Meehan, R.R.; Adams, I.R. Defending the genome from the enemy within: Mechanisms of retrotransposon suppression in the mouse germline. Cell. Mol. Life Sci. 2014, 71, 1581–1605. [Google Scholar] [CrossRef] [PubMed] [Green Version]
- Leung, D.C.; Lorincz, M.C. Silencing of endogenous retroviruses: When and why do histone marks predominate? Trends Biochem. Sci 2012, 37, 127–133. [Google Scholar] [CrossRef]
- Molaro, A.; Malik, H.S. Hide and seek: How chromatin-based pathways silence retroelements in the mammalian germline. Curr. Opin. Genet. Dev. 2016, 37, 51–58. [Google Scholar] [CrossRef] [PubMed] [Green Version]
- Wolf, G.; Greenberg, D.; Macfarlan, T.S. Spotting the enemy within: Targeted silencing of foreign DNA in mammalian genomes by the Kruppel-associated box zinc finger protein family. Mob. DNA 2015, 6, 17. [Google Scholar] [CrossRef] [PubMed] [Green Version]
- Walsh, C.P.; Chaillet, J.R.; Bestor, T.H. Transcription of IAP endogenous retroviruses is constrained by cytosine methylation. Nat. Genet. 1998, 20, 116–117. [Google Scholar] [CrossRef]
- Rebollo, R.; Miceli-Royer, K.; Zhang, Y.; Farivar, S.; Gagnier, L.; Mager, D.L. Epigenetic interplay between mouse endogenous retroviruses and host genes. Genome Biol. 2012, 13, R89. [Google Scholar] [CrossRef] [Green Version]
- Ekram, M.B.; Kim, J. High-throughput targeted repeat element bisulfite sequencing (HT-TREBS): Genome-wide DNA methylation analysis of IAP LTR retrotransposon. PLoS ONE 2014, 9, e101683. [Google Scholar] [CrossRef] [Green Version]
- Karimi, M.M.; Goyal, P.; Maksakova, I.A.; Bilenky, M.; Leung, D.; Tang, J.X.; Shinkai, Y.; Mager, D.L.; Jones, S.; Hirst, M.; et al. DNA Methylation and SETDB1/H3K9me3 Regulate Predominantly Distinct Sets of Genes, Retroelements, and Chimeric Transcripts in mESCs. Cell Stem Cell 2011, 8, 676–687. [Google Scholar] [CrossRef] [Green Version]
- Rebollo, R.; Karimi, M.M.; Bilenky, M.; Gagnier, L.; Miceli-Royer, K.; Zhang, Y.; Goyal, P.; Keane, T.M.; Jones, S.; Hirst, M.; et al. Retrotransposon-Induced Heterochromatin Spreading in the Mouse Revealed by Insertional Polymorphisms. PLoS Genet. 2011, 7, e1002301. [Google Scholar] [CrossRef]
- Wolf, G.; de Iaco, A.; Sun, M.-A.; Bruno, M.; Tinkham, M.; Hoang, D.; Mitra, A.; Ralls, S.; Trono, D.; Macfarlan, T.S. KRAB-zinc finger protein gene expansion in response to active retrotransposons in the murine lineage. eLife 2020, 9, e56337. [Google Scholar] [CrossRef] [PubMed]
- Shimosuga, K.I.; Fukuda, K.; Sasaki, H.; Ichiyanagi, K. Locus-specific hypomethylation of the mouse IAP retrotransposon is associated with transcription factor-binding sites. Mob. DNA 2017, 8, 20. [Google Scholar] [CrossRef] [Green Version]
- Howard, G.; Eiges, R.; Gaudet, F.; Jaenisch, R.; Eden, A. Activation and transposition of endogenous retroviral elements in hypomethylation induced tumors in mice. Oncogene 2008, 27, 404–408. [Google Scholar] [CrossRef] [PubMed] [Green Version]
- Frankel, W.N.; Mahaffey, C.L.; McGarr, T.C.; Beyer, B.J.; Letts, V.A. Unraveling genetic modifiers in the gria4 mouse model of absence epilepsy. PLoS Genet. 2014, 10, e1004454. [Google Scholar] [CrossRef]
- Saito, E.-S.; Keng, V.W.; Takeda, J.; Horie, K. Translation from nonautonomous type IAP retrotransposon is a critical determinant of transposition activity: Implication for retrotransposon-mediated genome evolution. Genome Res. 2008, 18, 859–868. [Google Scholar] [CrossRef] [PubMed] [Green Version]
- Nellaker, C.; Keane, T.; Yalcin, B.; Wong, K.; Agam, A.; Belgard, T.G.; Flint, J.; Adams, D.; Frankel, W.; Ponting, C. The genomic landscape shaped by selection on transposable elements across 18 mouse strains. Genome Biol. 2012, 13, R45. [Google Scholar] [CrossRef] [Green Version]
- Keane, T.M.; Goodstadt, L.; Danecek, P.; White, M.A.; Wong, K.; Yalcin, B.; Heger, A.; Agam, A.; Slater, G.; Goodson, M.; et al. Mouse genomic variation and its effect on phenotypes and gene regulation. Nature 2011, 477, 289–294. [Google Scholar] [CrossRef] [Green Version]
- Lilue, J.; Doran, A.G.; Fiddes, I.T.; Abrudan, M.; Armstrong, J.; Bennett, R.; Chow, W.; Collins, J.; Collins, S.; Czechanski, A.; et al. Sixteen diverse laboratory mouse reference genomes define strain-specific haplotypes and novel functional loci. Nat. Genet. 2018, 50, 1574–1583. [Google Scholar] [CrossRef]
- Vandesompele, J.; De Preter, K.; Pattyn, F.; Poppe, B.; Van Roy, N.; De Paepe, A.; Speleman, F. Accurate normalization of real-time quantitative RT-PCR data by geometric averaging of multiple internal control genes. Genome Biol. 2002, 3, research0034.1. [Google Scholar] [CrossRef] [Green Version]
- Brind’Amour, J.; Liu, S.; Hudson, M.; Chen, C.; Karimi, M.M.; Lorincz, M.C. An ultra-low-input native ChIP-seq protocol for genome-wide profiling of rare cell populations. Nat. Commun. 2015, 6, 6033. [Google Scholar] [CrossRef] [Green Version]
- Bolger, A.M.; Lohse, M.; Usadel, B. Trimmomatic: A flexible trimmer for Illumina sequence data. Bioinformatics 2014, 30, 2114–2120. [Google Scholar] [CrossRef] [Green Version]
- Langmead, B.; Salzberg, S.L. Fast gapped-read alignment with Bowtie 2. Nat. Methods 2012, 9, 357–359. [Google Scholar] [CrossRef] [Green Version]
- Zhang, Y.; Liu, T.; Meyer, C.A.; Eeckhoute, J.; Johnson, D.S.; Bernstein, B.E.; Nusbaum, C.; Myers, R.M.; Brown, M.; Li, W.; et al. Model-based Analysis of ChIP-Seq (MACS). Genome Biol. 2008, 9, R137. [Google Scholar] [CrossRef] [PubMed] [Green Version]
- Quinlan, A.R.; Hall, I.M. BEDTools: A flexible suite of utilities for comparing genomic features. Bioinformatics 2010, 26, 841–842. [Google Scholar] [CrossRef] [PubMed] [Green Version]
- Stamatoyannopoulos, J.A.; Snyder, M.; Hardison, R.; Ren, B.; Gingeras, T.; Gilbert, D.M.; Groudine, M.; Bender, M.; Kaul, R.; Canfield, T.; et al. An encyclopedia of mouse DNA elements (Mouse ENCODE). Genome Biol. 2012, 13, 418. [Google Scholar]
- Zheng, R.; Wan, C.; Mei, S.; Qin, Q.; Wu, Q.; Sun, H.; Chen, C.-H.; Brown, M.; Zhang, X.; Meyer, C.A.; et al. Cistrome Data Browser: Expanded datasets and new tools for gene regulatory analysis. Nucleic Acids Res. 2018, 47, D729–D735. [Google Scholar] [CrossRef]
- Ramírez, F.; Ryan, D.P.; Grüning, B.; Bhardwaj, V.; Kilpert, F.; Richter, A.S.; Heyne, S.; Dündar, F.; Manke, T. deepTools2: A next generation web server for deep-sequencing data analysis. Nucleic Acids Res. 2016, 44, W160–W165. [Google Scholar] [CrossRef]
- Wickham, H. ggplot2: Elegant Graphics for Data Analysis; Springer: New York, NY, USA, 2016. [Google Scholar]
- Reiss, D.; Zhang, Y.; Mager, D.L. Widely variable endogenous retroviral methylation levels in human placenta. Nucleic Acids Res. 2007, 35, 4743–4754. [Google Scholar] [CrossRef] [PubMed]
- Kumaki, Y.; Oda, M.; Okano, M. QUMA: Quantification tool for methylation analysis. Nucleic Acids Res. 2008, 36, W170–W175. [Google Scholar] [CrossRef]
- Sedlazeck, F.J.; Rescheneder, P.; Smolka, M.; Fang, H.; Nattestad, M.; von Haeseler, A.; Schatz, M.C. Accurate detection of complex structural variations using single-molecule sequencing. Nat. Methods 2018, 15, 461–468. [Google Scholar] [CrossRef] [Green Version]
- Kosugi, S.; Momozawa, Y.; Liu, X.; Terao, C.; Kubo, M.; Kamatani, Y. Comprehensive evaluation of structural variation detection algorithms for whole genome sequencing. Genome Biol. 2019, 20, 117. [Google Scholar] [CrossRef] [PubMed] [Green Version]
- Chureau, C.; Prissette, M.; Bourdet, A.; Barbe, V.; Cattolico, L.; Jones, L.; Eggen, A.; Avner, P.; Duret, L. Comparative sequence analysis of the X-inactivation center region in mouse, human, and bovine. Genome Res. 2002, 12, 894–908. [Google Scholar] [PubMed]
- Zhang, Y.; Maksakova, I.A.; Gagnier, L.; de Lagemaat, L.N.V.; Mager, D.L. Genome-wide assessments reveal extremely high levels of polymorphism of two active families of mouse endogenous retroviral elements. PLoS Genet. 2008, 4, e1000007. [Google Scholar] [CrossRef] [PubMed] [Green Version]
- Barau, J.; Teissandier, A.; Zamudio, N.; Roy, S.; Nalesso, V.; Herault, Y.; Guillou, F.; Bourc’his, D. The DNA methyltransferase DNMT3C protects male germ cells from transposon activity. Science 2016, 354, 909–912. [Google Scholar] [CrossRef] [PubMed]
- Ishihara, H.; Tanaka, I.; Furuse, M.; Tsuneoka, K. Increased Expression of Intracisternal A-Particle RNA in Regenerated Myeloid Cells after X Irradiation in C3H/He Inbred Mice. Radiat. Res. 2000, 153, 392–397. [Google Scholar] [CrossRef]
- Ekram, M.B.; Kang, K.; Kim, H.; Kim, J. Retrotransposons as a major source of epigenetic variations in the mammalian genome. Epigenetics 2012, 7, 370–382. [Google Scholar] [CrossRef] [Green Version]
- Kazachenka, A.; Bertozzi, T.M.; Sjoberg-Herrera, M.K.; Walker, N.; Gardner, J.; Gunning, R.; Pahita, E.; Adams, S.; Adams, D.; Ferguson-Smith, A.C. Identification, Characterization, and Heritability of Murine Metastable Epialleles: Implications for Non-genetic Inheritance. Cell 2018, 175, 1259–1271. [Google Scholar] [CrossRef] [Green Version]
- Sadic, D.; Schmidt, K.; Groh, S.; Kondofersky, I.; Ellwart, J.; Fuchs, C.; Theis, F.J.; Schotta, G. Atrx promotes heterochromatin formation at retrotransposons. Embo Rep. 2015, 16, 836–850. [Google Scholar] [CrossRef] [Green Version]
- Gunn, T.M.; Inui, T.; Kitada, K.; Ito, S.; Wakamatsu, K.; He, L.; Bouley, D.M.; Serikawa, T.; Barsh, G.S. Molecular and phenotypic analysis of Attractin mutant mice. Genetics 2001, 158, 1683–1695. [Google Scholar]
- Ishihara, H.; Tanaka, I.; Wan, H.; Nojima, K.; Yoshida, K. Retrotransposition of limited deletion type of intracisternal A-particle elements in the myeloid leukemia cells of C3H/He mice. J. Radiat Res. (Tokyo) 2004, 45, 25–32. [Google Scholar] [CrossRef]
- Weimar, W.R.; Lane, P.W.; Sidman, R.L. Vibrator (vb): A spinocerebellar system degeneration with autosomal recessive inheritance in mice. Brain Res. 1982, 251, 357–364. [Google Scholar] [CrossRef]
- Hamilton, B.A.; Smith, D.J.; Mueller, K.L.; Kerrebrock, A.W.; Bronson, R.T.; van Berkel, V.; Daly, M.J.; Kruglyak, L.; Reeve, M.P.; Nemhauser, J.L.; et al. The vibrator Mutation Causes Neurodegeneration via Reduced Expression of PITPα: Positional Complementation Cloning and Extragenic Suppression. Neuron 1997, 18, 711–722. [Google Scholar] [CrossRef] [Green Version]
- Bagci, H.; Fisher, A.G. DNA Demethylation in Pluripotency and Reprogramming: The Role of Tet Proteins and Cell Division. Cell Stem Cell 2013, 13, 265–269. [Google Scholar] [CrossRef] [PubMed] [Green Version]
- Leitch, H.G.; McEwen, K.R.; Turp, A.; Encheva, V.; Carroll, T.; Grabole, N.; Mansfield, W.; Nashun, B.; Knezovich, J.G.; Smith, A.; et al. Naive pluripotency is associated with global DNA hypomethylation. Nat. Struct Mol. Biol 2013, 20, 311–316. [Google Scholar] [CrossRef] [PubMed] [Green Version]
- Deniz, Ö.; de la Rica, L.; Cheng, K.C.L.; Spensberger, D.; Branco, M.R. SETDB1 prevents TET2-dependent activation of IAP retroelements in naïve embryonic stem cells. Genome Biol. 2018, 19, 6. [Google Scholar] [CrossRef] [Green Version]
- Bruno, M.; Mahgoub, M.; Macfarlan, T.S. The Arms Race Between KRAB–Zinc Finger Proteins and Endogenous Retroelements and Its Impact on Mammals. Annu. Rev. Genet. 2019, 53, 393–416. [Google Scholar] [CrossRef]
- Krebs, C.J.; Larkins, L.K.; Khan, S.M.; Robins, D.M. Expansion and diversification of KRAB zinc-finger genes within a cluster including Regulator of sex-limitation 1 and 2. Genomics 2005, 85, 752–761. [Google Scholar] [CrossRef]


© 2020 by the authors. Licensee MDPI, Basel, Switzerland. This article is an open access article distributed under the terms and conditions of the Creative Commons Attribution (CC BY) license (http://creativecommons.org/licenses/by/4.0/).
Share and Cite
Rebollo, R.; Galvão-Ferrarini, M.; Gagnier, L.; Zhang, Y.; Ferraj, A.; Beck, C.R.; Lorincz, M.C.; Mager, D.L. Inter-Strain Epigenomic Profiling Reveals a Candidate IAP Master Copy in C3H Mice. Viruses 2020, 12, 783. https://doi.org/10.3390/v12070783
Rebollo R, Galvão-Ferrarini M, Gagnier L, Zhang Y, Ferraj A, Beck CR, Lorincz MC, Mager DL. Inter-Strain Epigenomic Profiling Reveals a Candidate IAP Master Copy in C3H Mice. Viruses. 2020; 12(7):783. https://doi.org/10.3390/v12070783
Chicago/Turabian StyleRebollo, Rita, Mariana Galvão-Ferrarini, Liane Gagnier, Ying Zhang, Ardian Ferraj, Christine R. Beck, Matthew C. Lorincz, and Dixie L. Mager. 2020. "Inter-Strain Epigenomic Profiling Reveals a Candidate IAP Master Copy in C3H Mice" Viruses 12, no. 7: 783. https://doi.org/10.3390/v12070783