Article

“Howya gettin’ on?” Investigating Public Transport Satisfaction Levels in Galway, Ireland

School of Political Science & Sociology, National University of Ireland Galway, Galway H91TK33, Ireland
*
Author to whom correspondence should be addressed.
Urban Sci. 2018, 2(4), 102; https://doi.org/10.3390/urbansci2040102
Submission received: 15 September 2018 / Revised: 6 October 2018 / Accepted: 9 October 2018 / Published: 11 October 2018

Abstract

:
Public transport transforms urban communities and the lives of citizens living in them by stimulating economic growth, promoting sustainable lifestyles and providing a greater quality of life. Globally, the healthiest cities have one thing in common, a public and active transport network that does not depend on each person owning a personal motorised vehicle. Growing dependence on the automobile has created a multitude of problems, some of which public transport can help solve. Adverse social, environmental and health effects related to automobile emissions and car-dependency suggest that using public transport will result in a decrease in an individual’s carbon footprint, will lessen overall CO2 emissions, and will help to ease urban traffic congestion as well as encourage more effective and efficient land use. With many urban areas experiencing ongoing traffic problems, it is acknowledged that any sustainable long-term solution must entail a significant public transport element. The aim of this research study, conducted in November and December 2017, was to obtain essential baseline information on service user satisfaction levels with the existing public bus services in Galway City, Ireland. By measuring levels of satisfaction, it is possible to build our overall knowledge of the public transport network and thus identify improvements in the service that would lead to an increase in bus passenger numbers and result in reductions in the amount of cars on the roads. Results suggest deficiencies in public transport infrastructure, such as Dedicated Bus Lanes, and the lack of attention to customer services are hindering improvements in the public bus service.

1. Introduction

As urbanisation intensifies, traffic congestion and the adverse effects of car dependency continue to blight the healthy sustainable growth of many cities and increasingly the challenges of meeting climate change goals will dominate the design and development of urban transport policy over the coming years. The unprecedented growth and use of the private car in cities and towns not only intensifies environmental concerns but also contributes to numerous social and economic problems such as road traffic accidents and congestion, air and noise pollution, poor personal health, reduced economic opportunities and the quality of life for urban inhabitants [1,2,3,4]. Driving a car has become the normal and habitual means of mobility in the city; however, there is a need to respond better to the actual needs of communities living in the city by improving liveability and making it simpler, safer, and more inexpensive to get about by foot, by bike, and by public transport. Public transport is critical to a city’s overall transportation system and the economic and social quality of life of all citizens, a sustainable and practical alternative to private car use [5,6]. Empirical research has concluded that the key characteristics of the sustainable city are that it should have a population of over 25,000 people—preferably over 50,000—with medium densities of over 40 persons per hectare, with mixed use developments, and with preference given to developments in public transport accessible corridors and near to highly public transport accessible connections [7]. Public transport systems contribute to social cohesion by creating common public spaces, and to increased social capital and inclusion by enabling all inhabitants to move freely and easily around the city [8,9]; once described as ‘the sinews of urban citizenship’ [10] (p. 24). Public transport services can attract private car users by improving the quality of the service they provide, but exactly what improvements must be made depends on the perspective of each targeted group and their motivations for using their car in the first instance [11]. This paper builds upon recommendations for a research agenda in addressing the utility of public transport services [12] and focuses on the quality of the public bus service in Galway, Ireland, a city with a population of just under 80,000 [13]. Public Transport in Galway primarily consists of a public bus service with a limited additional mainline rail service into and out of the city. The 2016 CSO figures suggest that 7.8% of commuters travelled to work/college by bus, coach or minibus while only 0.2% commuted by train [14]. A better understanding of the current public transport service, from a user perspective, can positively influence the development, direction and regeneration of the city. Good quality public transport that is accessible to all citizens, can generate improvements in social and economic mobility, improve citizen well-being and environmental sustainability, lessen harmful traffic congestion, and lower the costs of many public services. However, one precondition for a better customer-oriented service is that service providers are aware of customer expectations and that these are given sufficient attention in the planning process for public transport [15]. Providing a safe, reliable and convenient journey and caring about passenger satisfaction ought to be one of the key concerns and objectives of any public transport service provider. If such service providers fail with regards to satisfying their customers there will not only be a shortage of service users but also a higher burden placed on society and the environment caused by excessive car traffic [16]. The objective of this student-centred quantitative research study, conducted in late 2017, was to attain crucial baseline information on service user satisfaction levels with the current bus services in Galway. By evaluating levels of satisfaction it is possible to build upon our present understanding and knowledge of the public transport system and identify improvements in the service that could lead to an increase in bus passenger numbers and result in reductions in the overall number of cars on the roads. Results and data are principally descriptive in nature, with some comparative analysis with services available in other jurisdictions also provided. The research is situated within the broader context of moves towards urban sustainability through the promotion of more sustainable and active travel modes such as walking, cycling and public transport. As reasoned by Bannister [17] (p. 79); ‘strong support for enlarging the scope of public discourse and empowering the stakeholders through an interactive and participatory process to commit themselves to the sustainable mobility paradigm’ is needed, along with a wiliness to change and an acceptance of collective responsibility.

2. Key Debates on the Utility of Public Transport

Public transport is crucial to a region’s overall transportation system and the development of sustainable and efficient public transport networks leads to fundamental improvements to citizens’ quality of life [18,19]. The role of public transport has changed over time and is now regarded as a desirable alternative to the private car in most urban environs. An effective and well-resourced public transport system satisfies a number of requirements including minimising travel times for service users, providing acceptable levels of customer service, and contributing to the overall well-being and quality of life of people living in their chosen urban environment [20]. In this regard, transport system challenges are frequently viewed as being economic, environmental and social in character [21]. The economic benefits of public transport include, among others, the potential to reduce traffic congestion and delays [22,23], increase commuter productivity [24], and improve land use and property values along public transport route lines [25,26,27]. The estimated benefit–cost ratios for different categories of transport services indicates that public transport investments largely provide measurable and positive economic returns [28]. The social benefits include improved general health and decreasing levels of obesity associated with the sedentary lifestyle of car-dependency [29,30], the possibility of enhanced social inclusion for the transport of the poor, disadvantaged and the aging population [31]; and the possibility of increased levels of social capital [8,32], while the environmental benefits point to a cleaner local environment from reduced car (over)use, meeting climate change goals, and reducing air and noise pollution associated with excessive automobility [33,34]. A study and analysis of more than 350 actions designed to reduce carbon emissions by some 110 public transport organisations in cities across the world suggests that ‘by investing in low-carbon mobility models and doubling the market share of public transport, cities and governments can prevent the emission of 550 million tonnes of carbon dioxide (CO2) equivalent by the year 2025’ [35] (p. 5).
However, it is argued that ‘increased use of public transport will not yield environmental improvement unless it results in reduced car use, will not increase equity if only the richest people can afford to travel by car, and will not bring economic efficiency if journey times or costs are thereby increased’ [36] (p. 198). It has also been suggested that current public transport systems will not be in a position to provide an adequate fit for purpose service, with the necessary appeal to entice large numbers of regular car users to switch to public transport, without some correction or interventions [37,38]. Indeed, it has to prove itself on the transport market in competition with other modes because in most situations modal choice cannot be influenced by prohibitions and obligations alone [6]. To grow public transport the service needs to be designed to accommodate the necessary level of service required by existing customers and in doing so similarly appeal to prospective new potential service users [39,40]. Improvement can only be accomplished by a clear understanding of existing travel behaviours, and meeting consumer requirements and expectations. To make sure that investment and service changes can continue to attract existing customers, and reach out to potential new consumers, knowledge of user satisfaction with the existing service should provide policymakers and public transport service providers with crucial evidence [41,42]. Qualities such as reliability, frequency, comfort, service information, driver behaviour, and cleanliness are key features and attributes in determining public transport user satisfaction [39,43]. If quality is measured from the service user’s perspective then public transport utility depends on the passenger insights about many of the features that characterise the service. Research on public transport user satisfaction suggests that as customer satisfaction increases, so too does the tendency for users to continue to use the service-provided increase [44,45]. Identifying the specific features and attributes, such as complaint handling, about which passengers are most concerned are pre-requisites to customer satisfaction and will influence passenger behavioural intentions [46].
Public transport in Ireland exists in limited form, primarily in the country’s main urban centres. The cities of Dublin, Cork, Limerick and Galway all have their own suburban rail networks—Galway Suburban Rail has only one rail line connecting Galway and the satellite towns of Oranmore (population of approximately 5000) and Athenry (population of approximately 3000)—but bus conveyance is the primary form of public transport in all cities and major regional towns in the country. In line with its population size, Dublin has additional public transport in the form of the electrified Dublin Area Rapid Transit (DART) system and the light rail LUAS network. Combined bus, minibus or coach was the choice of just 7.8% of commuters in Galway in 2016 [14], up from 6.4% in 2011 [47]. In the intervening years, the population of Galway increased significantly to its current level of just under 80,000 [13], and while new buses and bus routes have been introduced to provide services to new residential areas of the city, major changes to upgrade the public transport infrastructure and network have not transpired. Two companies now provide public bus services in Galway; Bus Éireann and Galway City Direct. Sixteen bus routes serve the city and its suburbs, with Bus Éireann operating eleven routes while Galway City Direct runs five routes (see www.galwaytransport.info/2009/07/city-bus-services.html). Less than 10% of the city road network have Dedicated Bus Lanes (DBL), but commitment was reaffirmed in the Galway Transport Strategy to an ‘adaptable bus-based public transport mode, which can integrate with other modes when needed, [and is] considered the best suit for the city’ [48] (p. 34). The 2010 Galway Public Transport Feasibility Study maintained that bus priority measures to isolate bus operations from general traffic congestion were essential for the increase in the performance of the bus network [49]. It further proposed that ‘there is scope for a change of hearts and minds towards public transport, together with an unrealised potential for walking and cycling usefully serving to extend catchment of public transport provisions’ in the city (p. 11.1). Nationally, in a study conducted for the EPA it was argued that there are currently significant gaps in the public transport network and existing services are not always of sufficiently high quality to attract private motorists [50]. The report also revealed that 100% of local authority respondents felt that local public transport services were inadequate for the needs of their respective local areas. Findings of a survey conducted in Dublin suggested that visitors to the city were less concerned with traditional aspects of public transport service quality, they were more concerned with obtaining accurate information and service reliability [51]. However, indecision with regards to subsidising public transport, a focus on privatisation, and the lack of effective holistic regulation with regard to transport infrastructure provision continues to influence transport policy and governance in Ireland [52].

3. Research Method

To capture the service user experiences and opinions, a quantitative approach was adopted for this study. In November and December 2017 a 13-question survey of public bus transport users in Galway was conducted with the aim of providing a better understanding of this mode of transport and evaluate satisfaction levels from a service user perspective (a copy of the questionnaire is available to download from www.ssrc.ie/REaL/galway-public-transport.html). Three independent variable questions were asked of participants: where they currently live, their age, and gender. The following questions were asked: How often the participants took the bus in Galway, their main reason for taking the bus, if the bus was their only option and if not the primary reason for choosing the bus on this journey, and the bus route they most often used. A number of further questions were drawn from the Transport Focus’s Bus Passenger Survey Report [53], although it is important to note that the methodologies used in each research differ significantly. The motive for using this particular set of questions was to allow some degree of comparative analysis between results from the Galway survey and results from English regions (outside of London). Participants were asked to indicate their satisfaction, or otherwise, of features of their most recent journey on the local public bus service, issues such as; value for money, punctuality, length of time the journey took, and overall satisfaction with the journey. A final open question sought overall comments on the public bus service in Galway.
Data collection was carried out by undergraduate students from the School of Political Science & Sociology at the National University of Ireland Galway. The importance of connecting research and teaching to craft an improved agenda for undergraduate education is an emerging key focus for student development in higher education, hence this innovative research aimed to satisfy two goals. The positive impact on student understanding and learning through the addition of real-life research-like activities is central to undergraduate education [54] and thus students learn through their own discovery, supported by academic advisors and their peers, in a research-rich environment. In addition, the research stands to benefit from the addition of motivated and energetic student researchers who bring a positive and cooperative-learning perspective to the project, particularly to the data collection process. Data collection was initiated through the promotion of the questionnaire on various social media platforms and using the open source LimeSurvey software. Understandable concerns about the disproportionality of responses and digital divide meant that online participants were limited to just over half (n = 204). Subsequent data collection was thus carried out via face-to-face interviews in and around Eyre Square in the centre of Galway. The public bus service in the city is mono-centric in nature so all services stop off at bus stops at various locations around this specific part of the city centre. Seven students collected data in face-to-face interviews with service users over 3 separate days at the end of 2017. Over 360 (n = 363) completed questionnaires were collected and 36 incomplete questionnaires, making a total of n = 399 (service users with a free travel pass or DSP card were included in this study). Given the population of the city at just under 80,000, using a confidence level of 95% and 5% margin of error, this figure falls within a reasonable required sample size, i.e., n = 383. A small number of brief follow-up interviews were carried out (n = 6) mainly to clarify comments made in response to the open question.

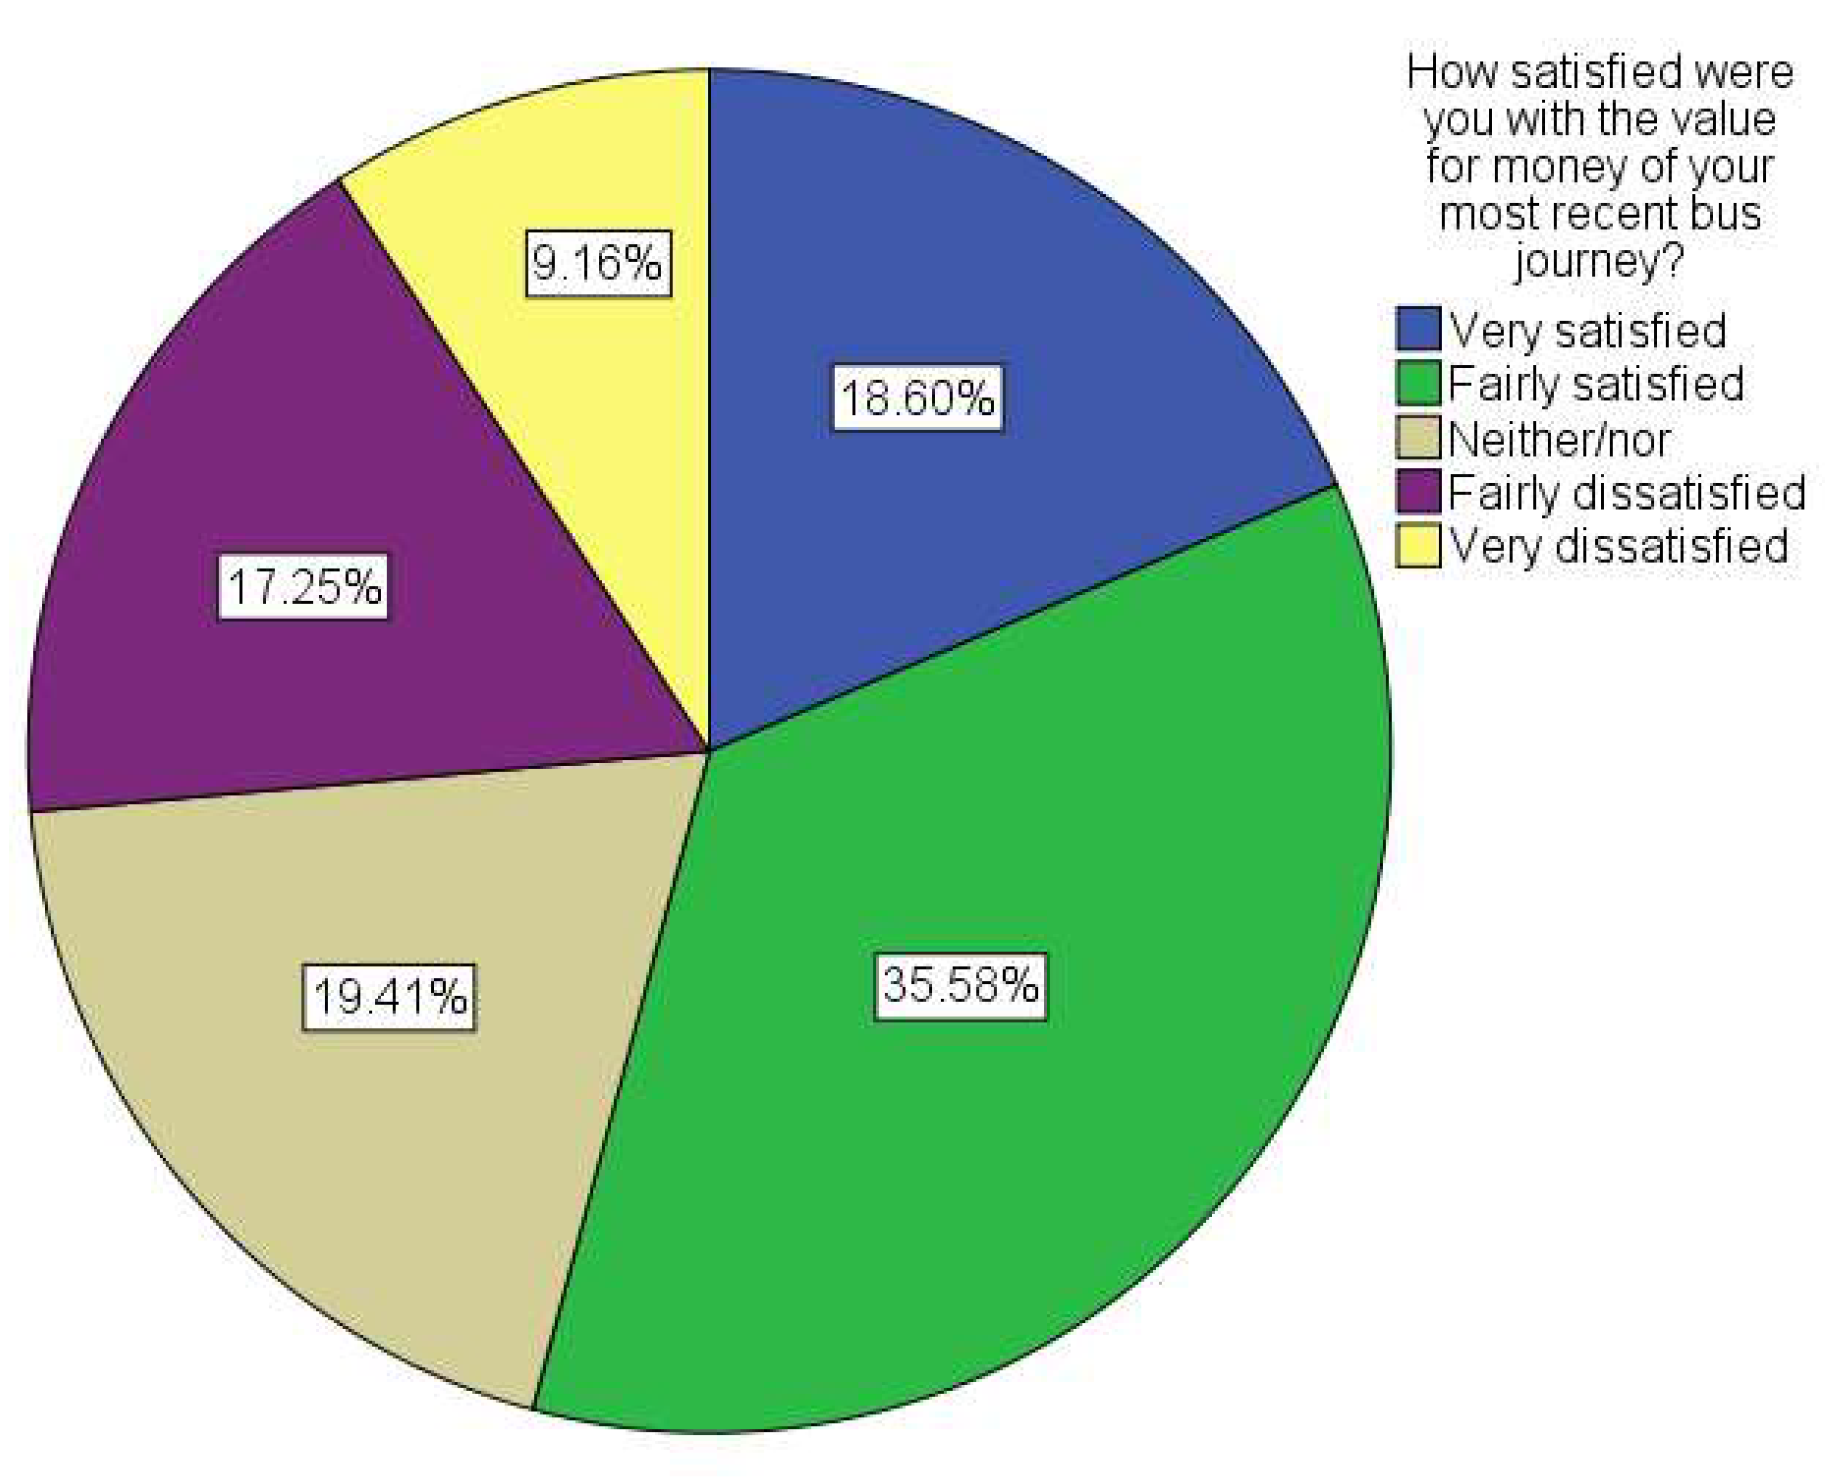
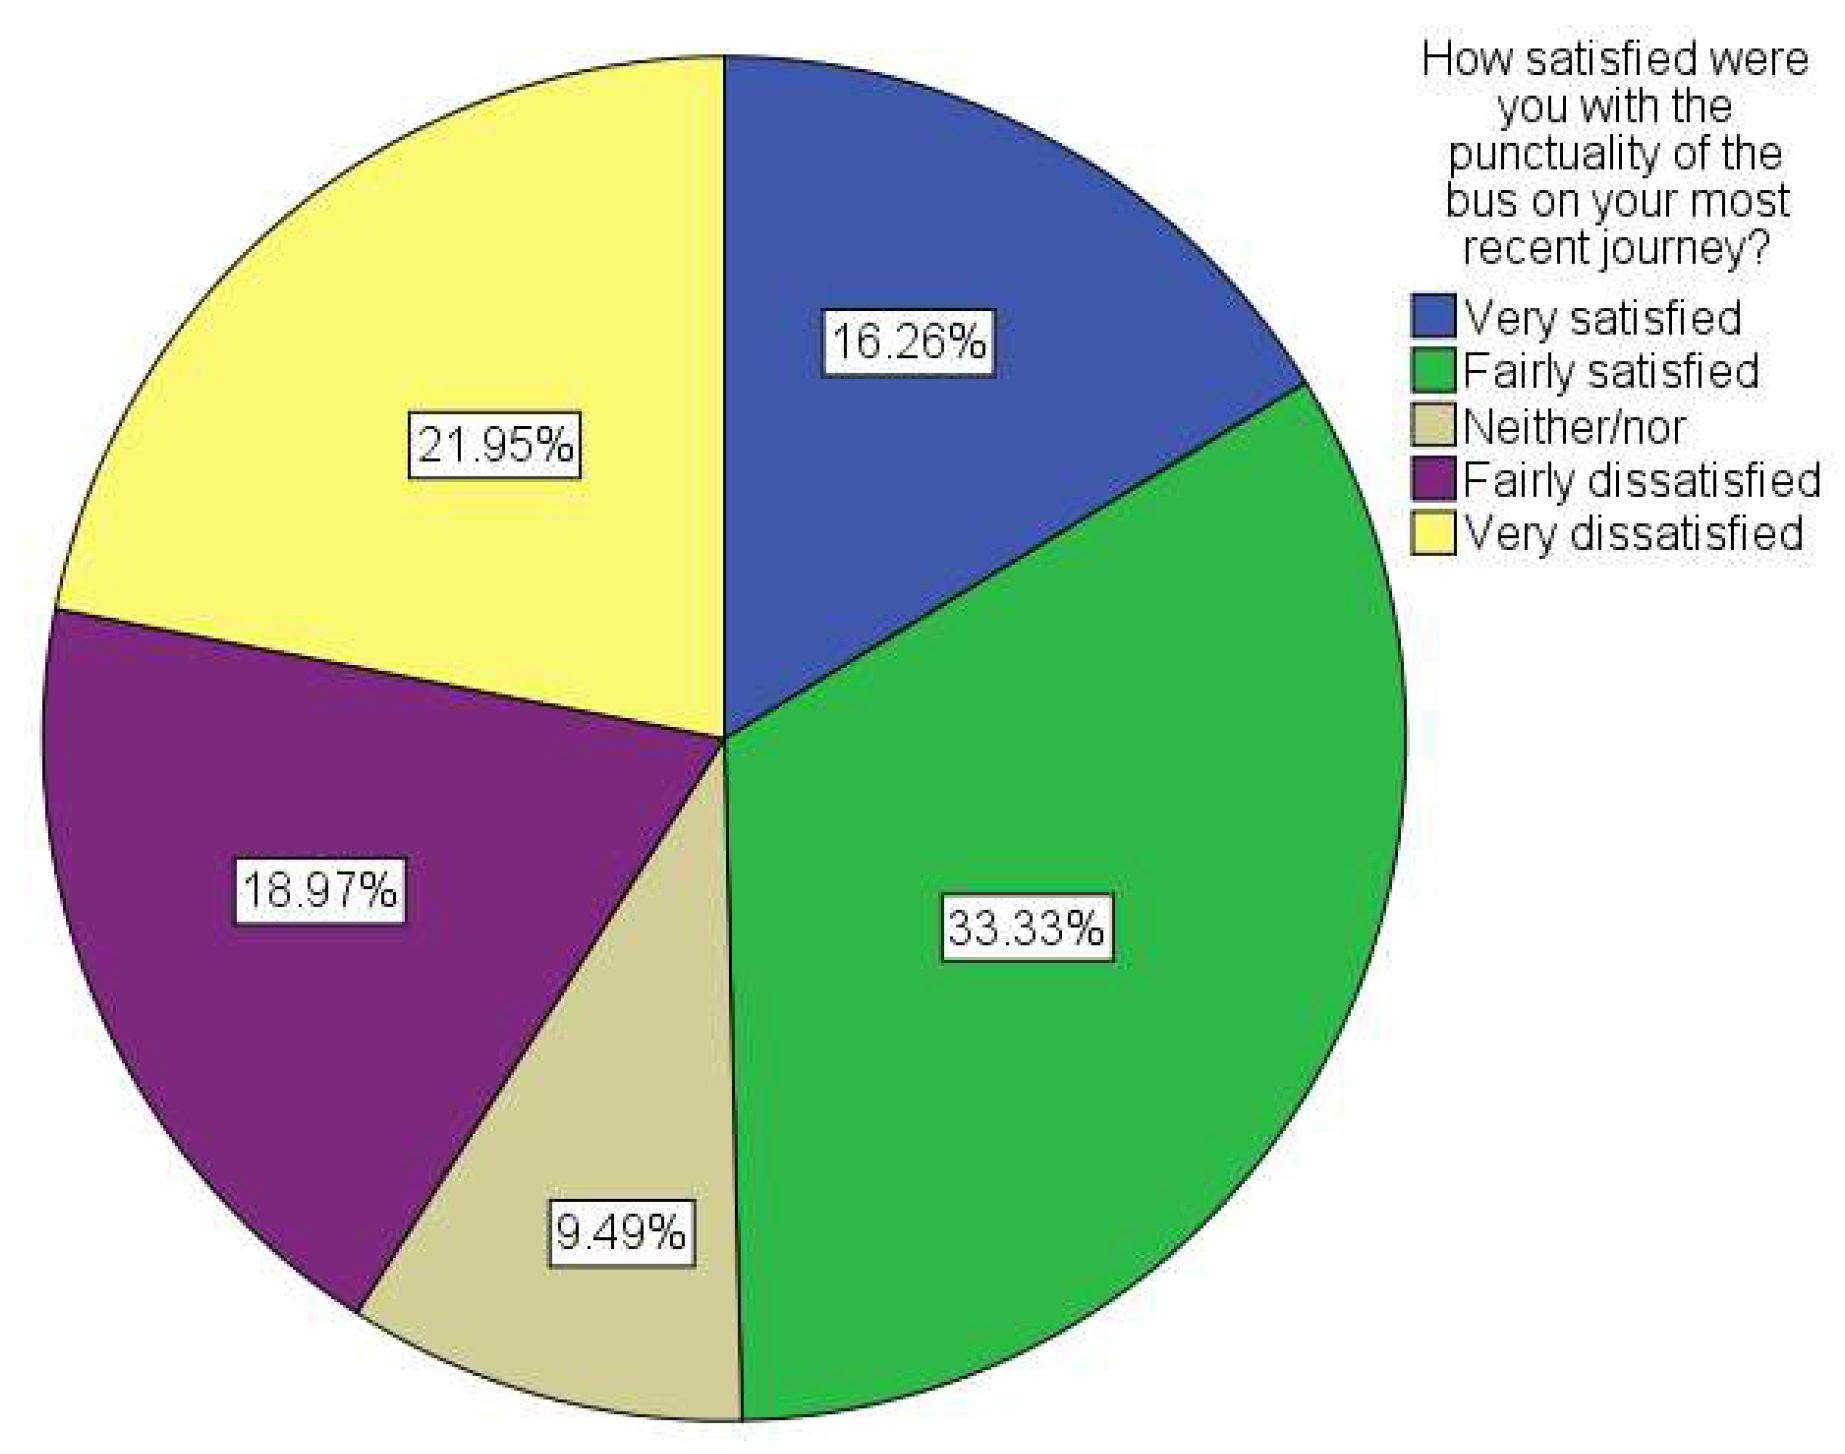
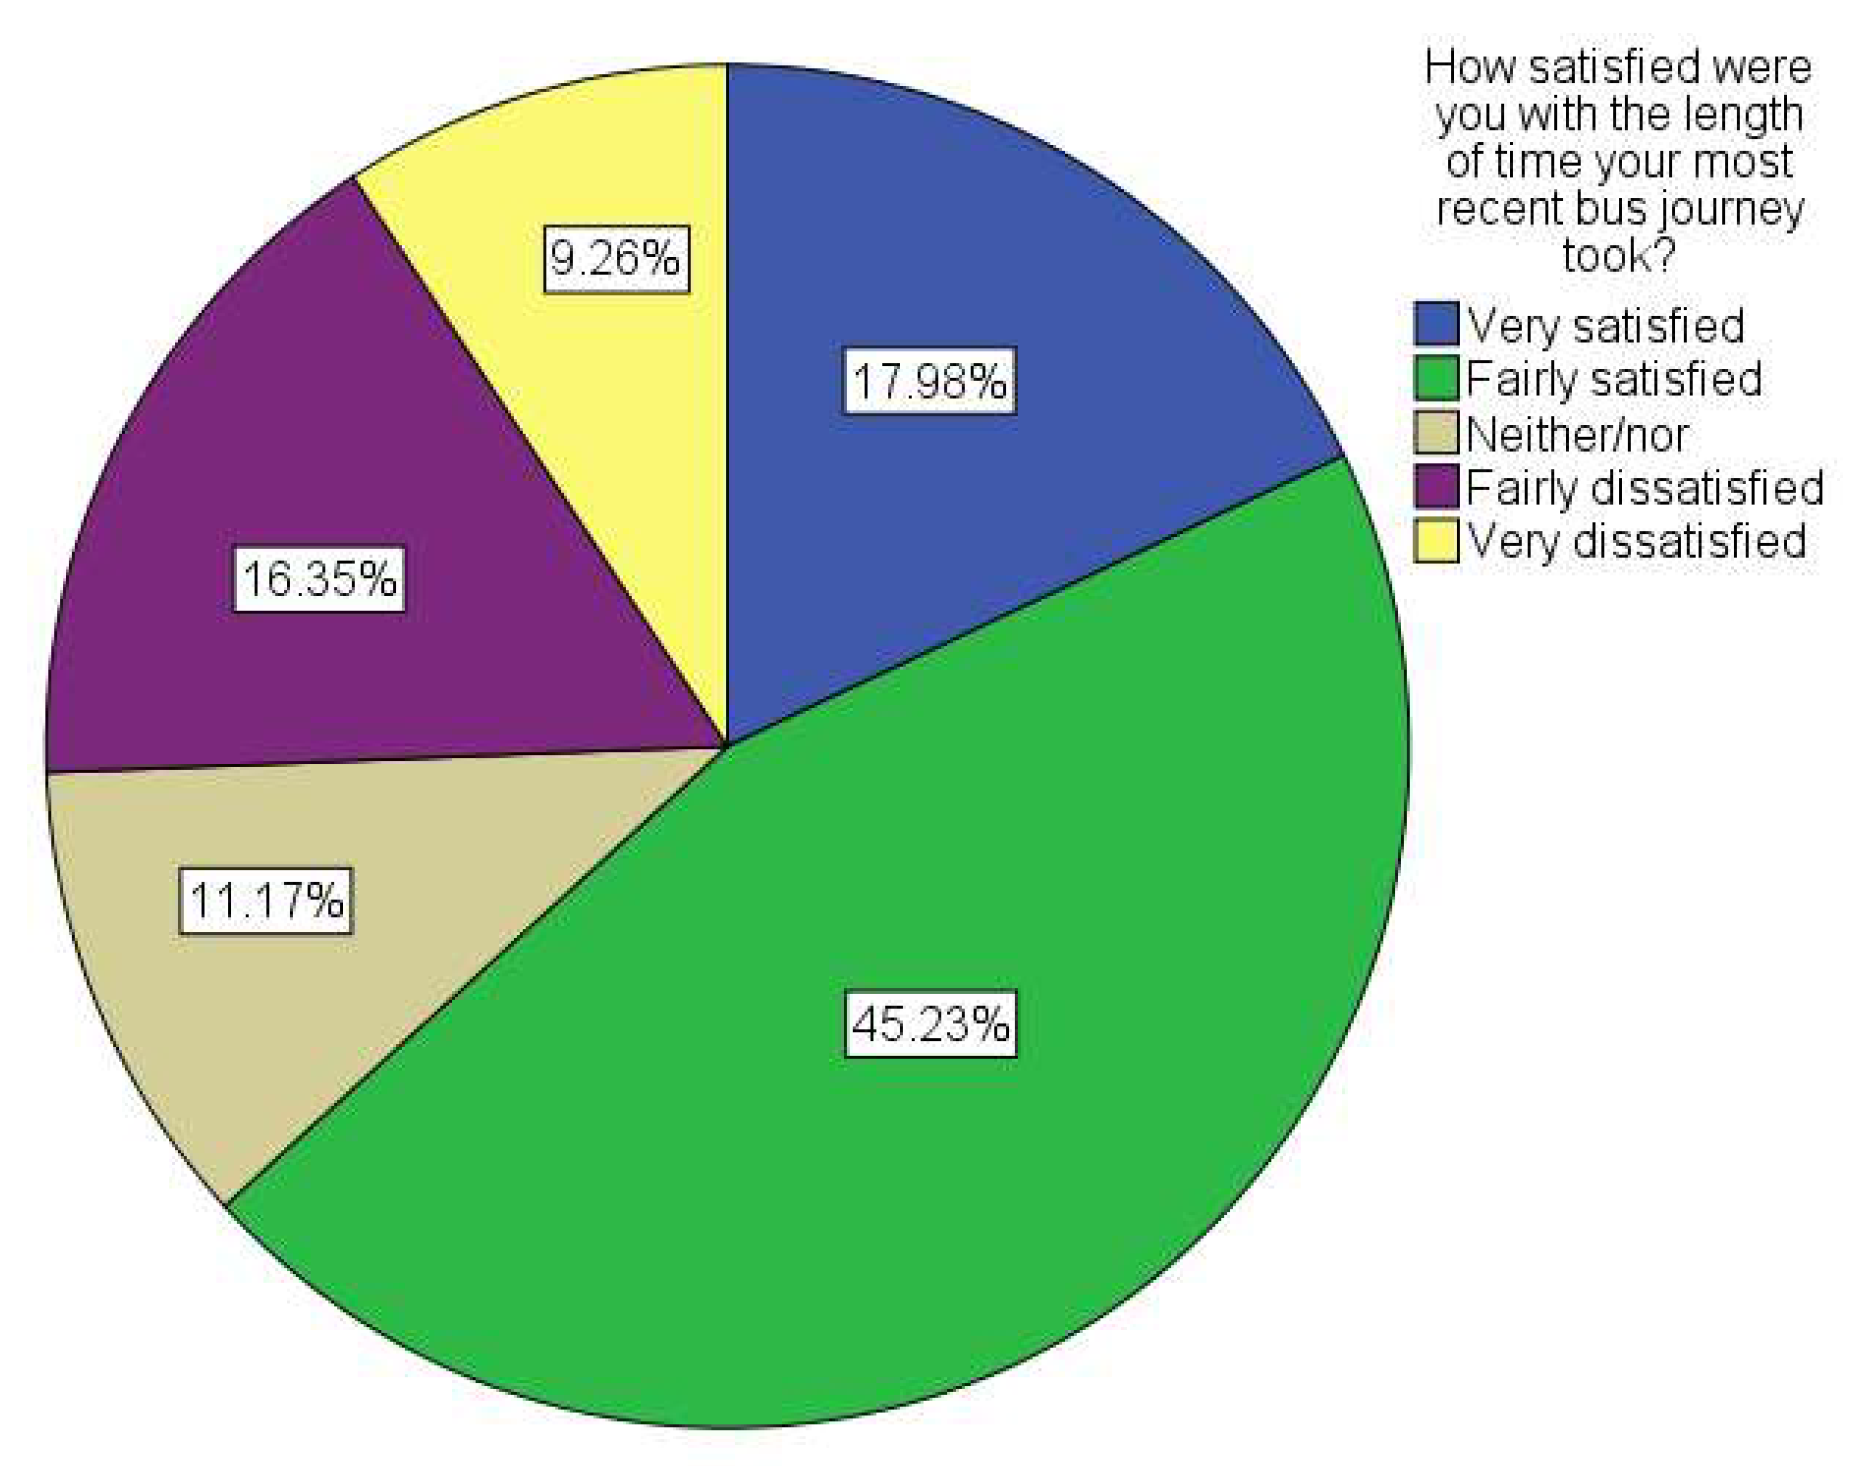
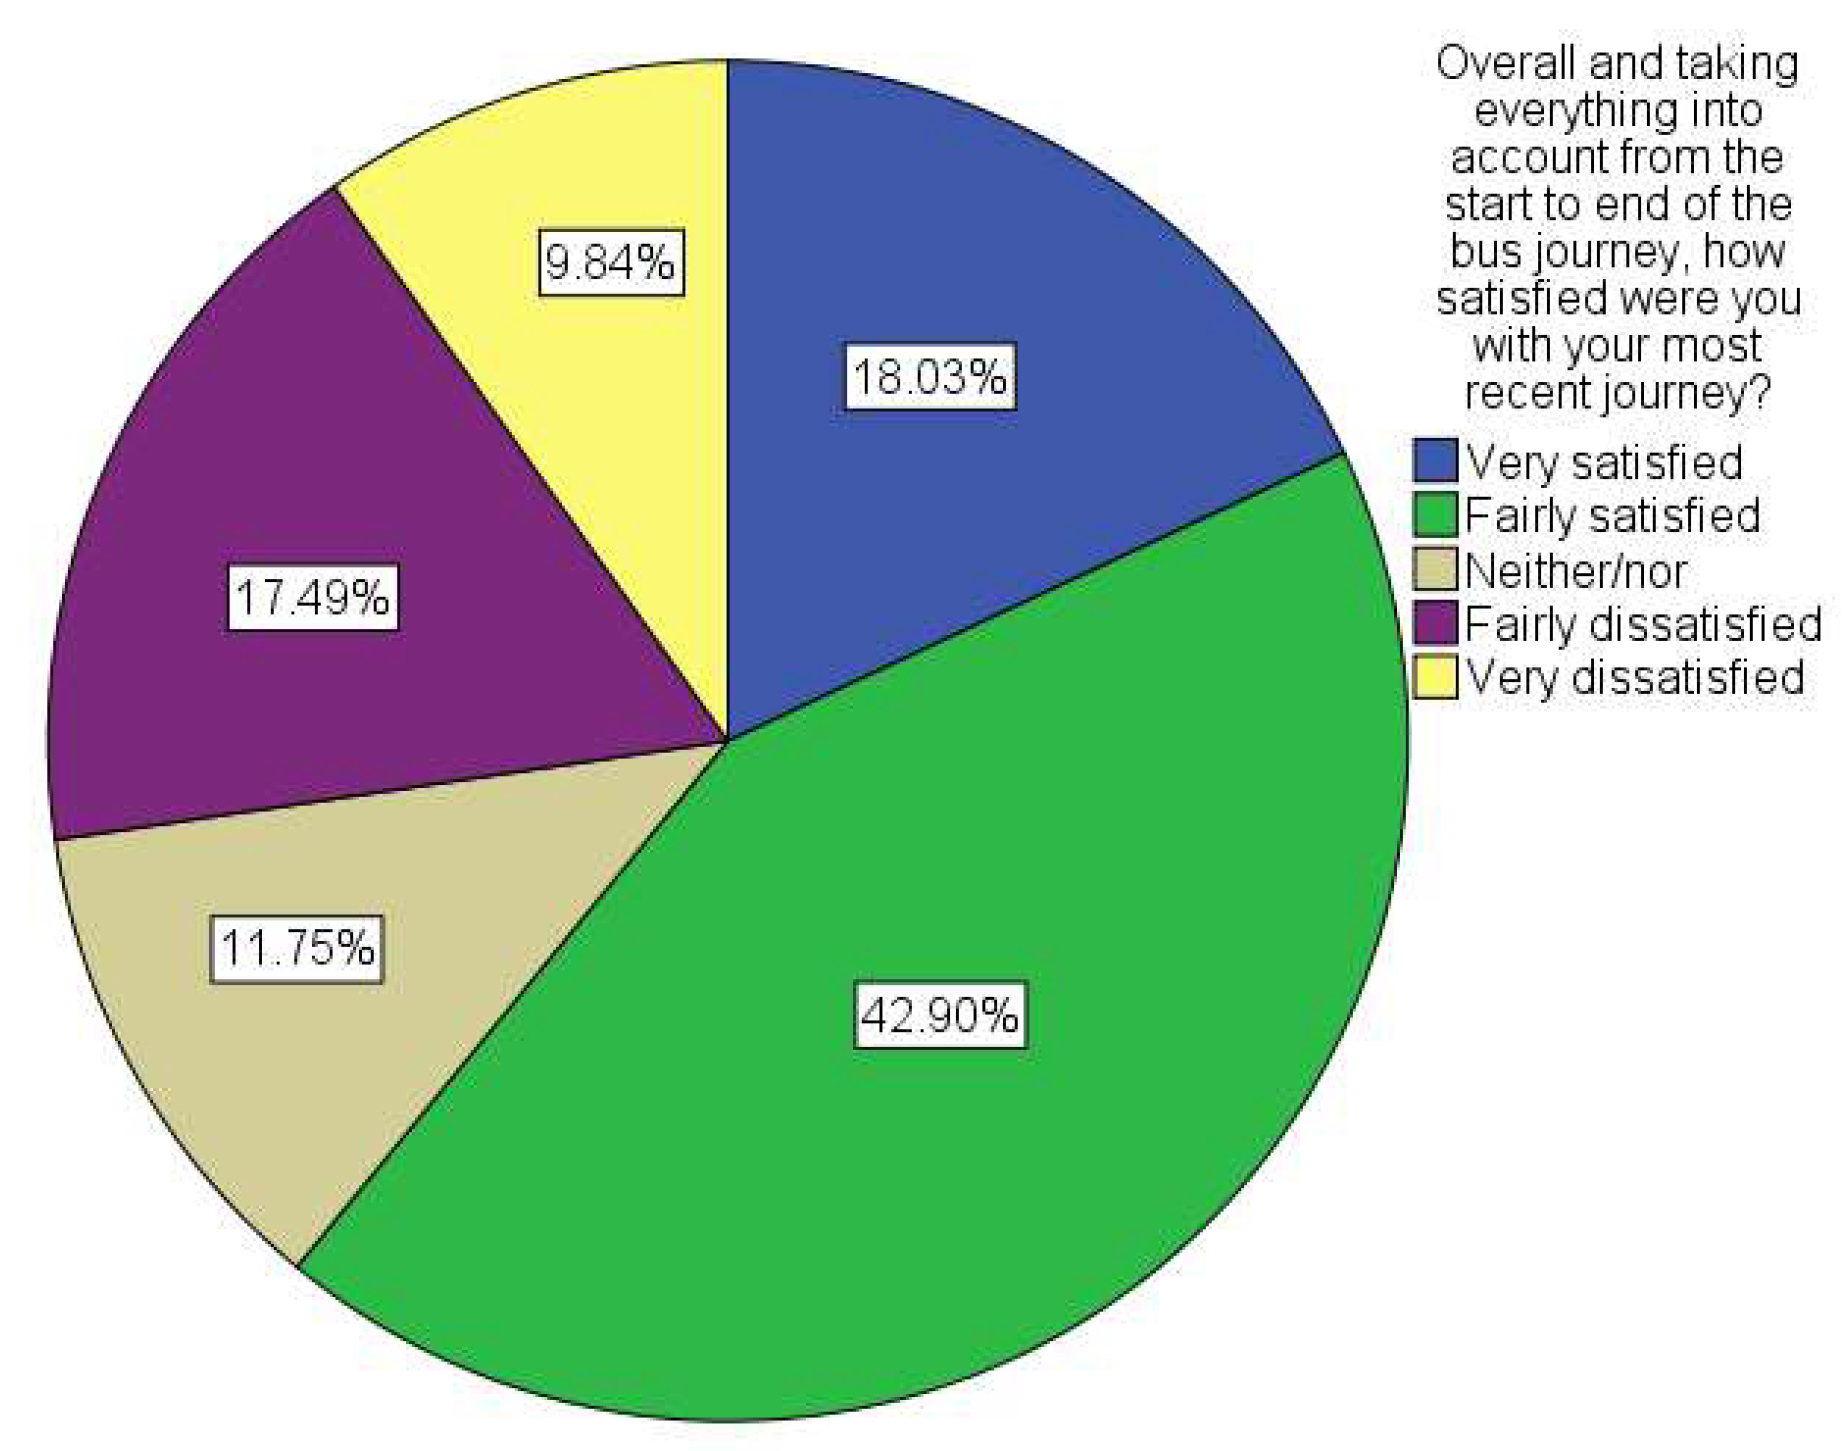
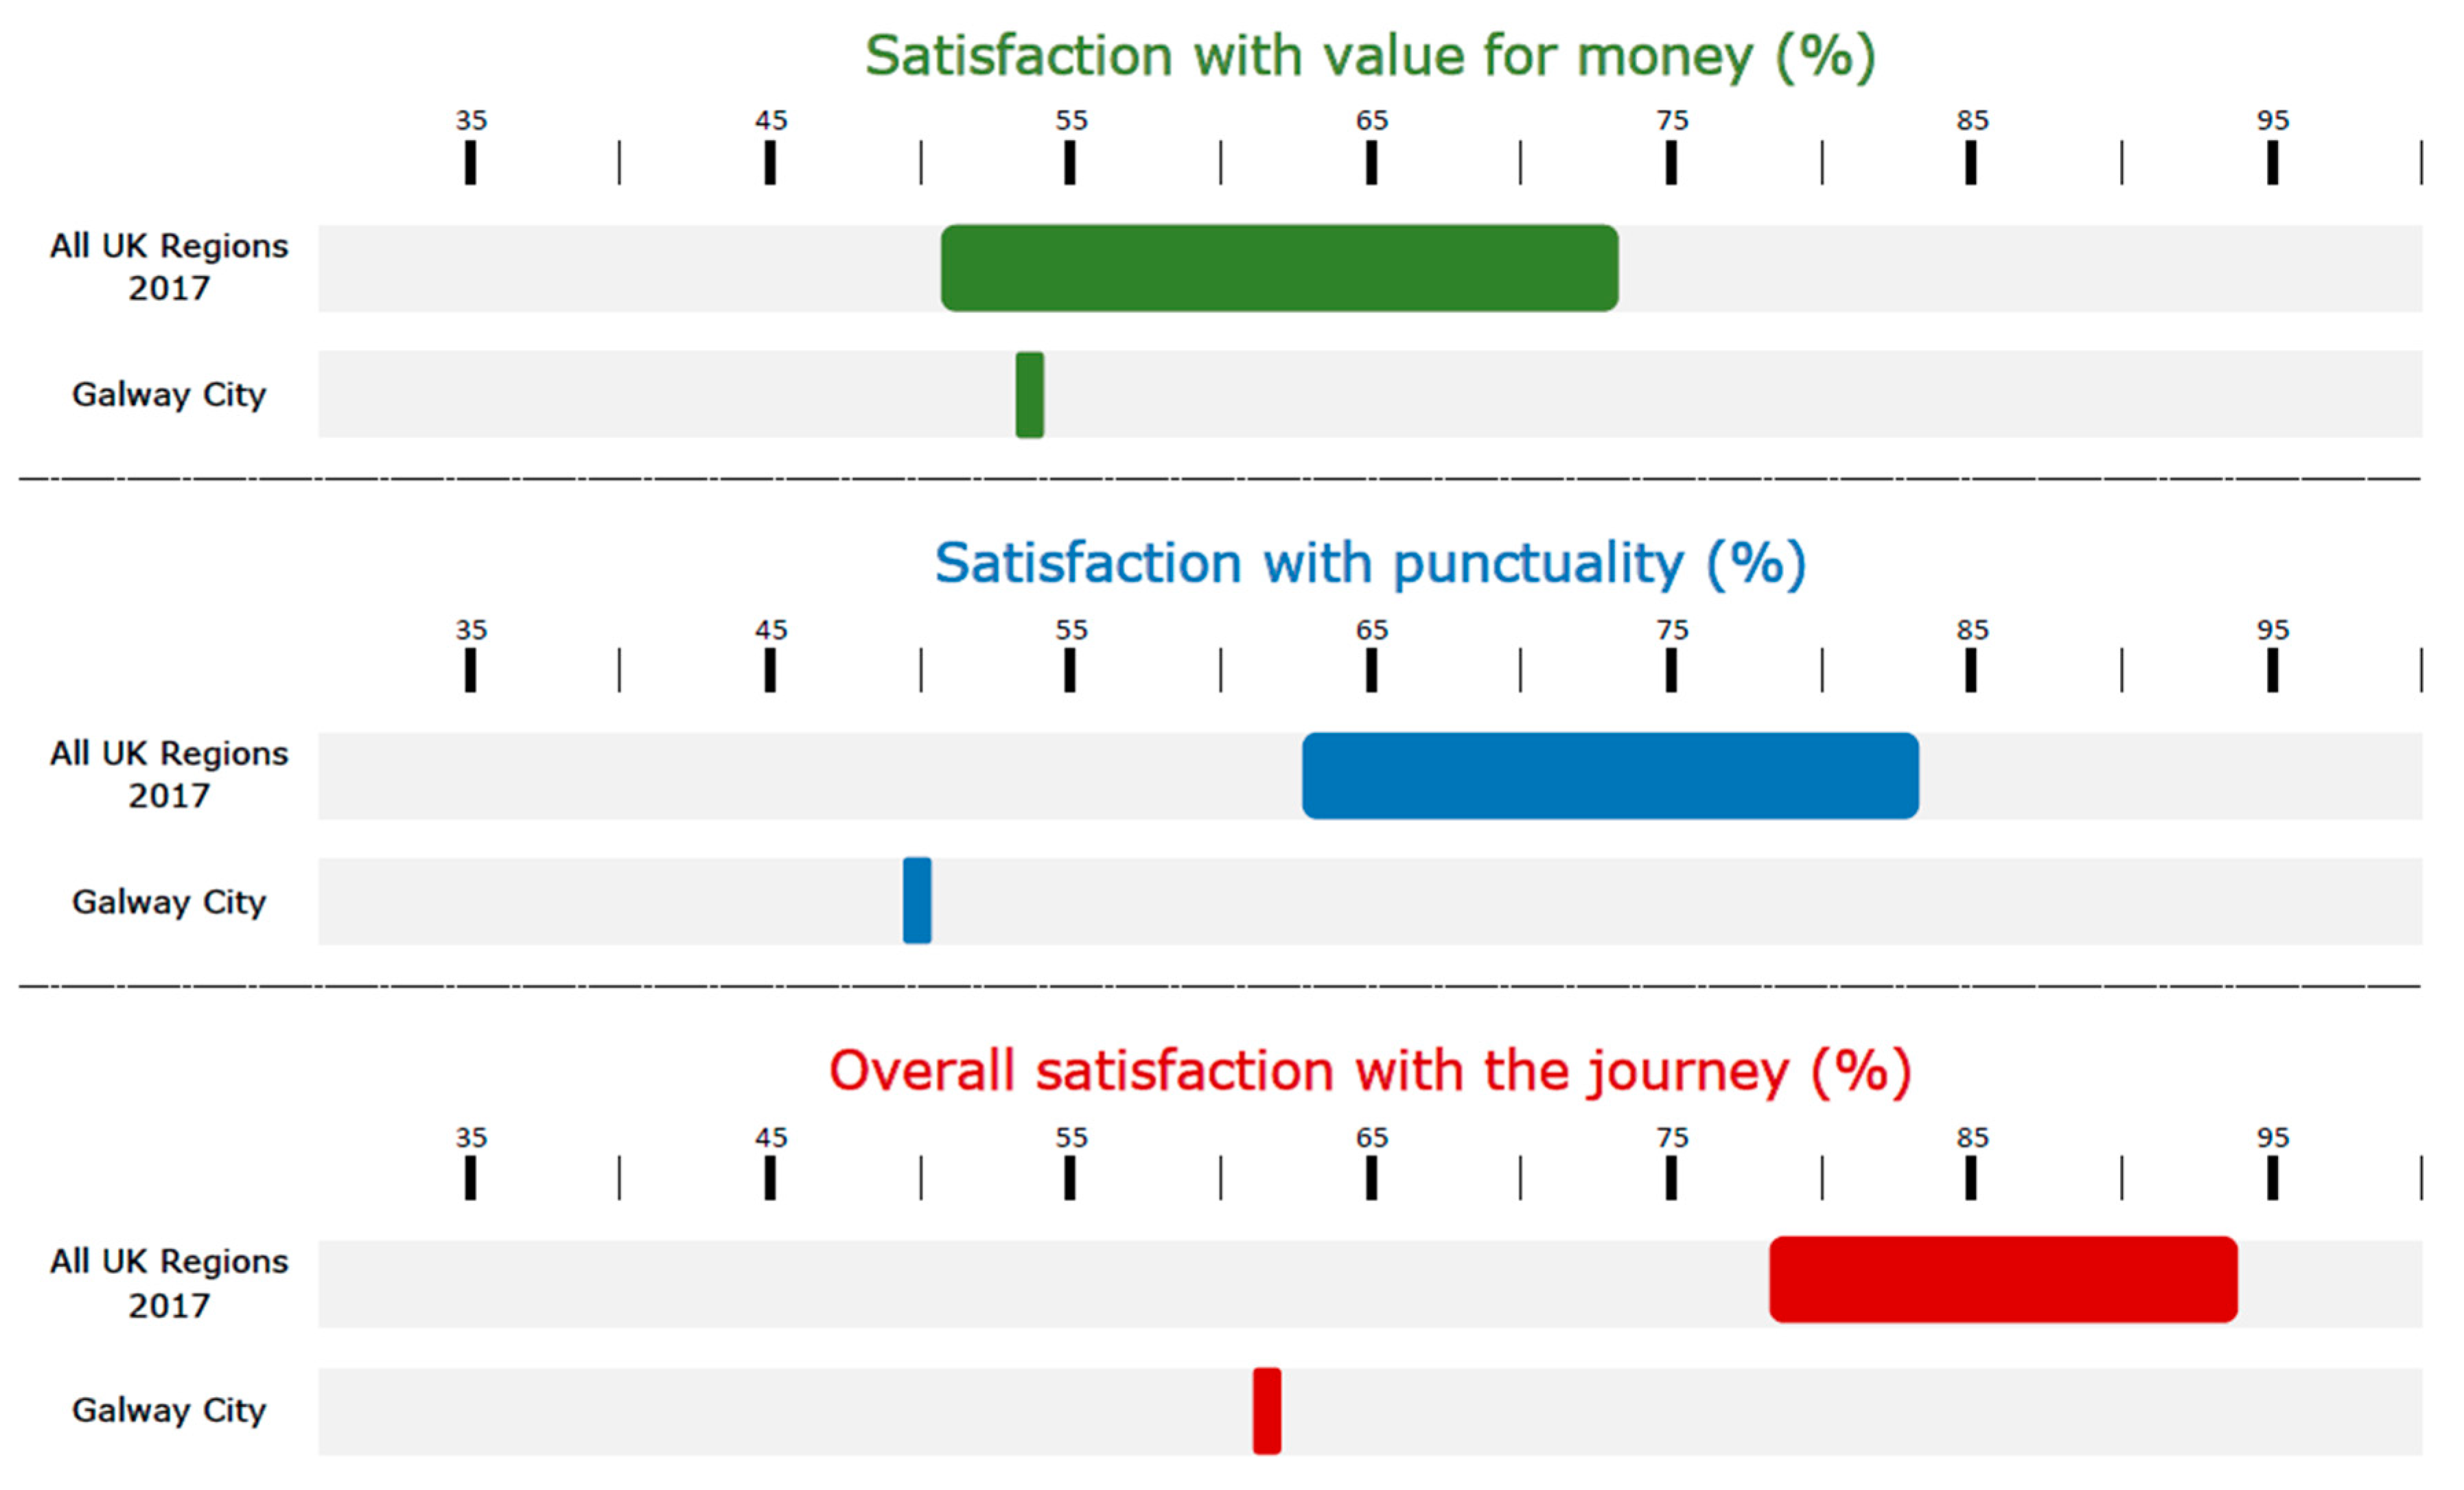
4. Reality Check: Exploring Levels of Satisfaction with the Service

Three demographic questions were asked of service users, in addition to how often they take the public bus service in Galway. Participants in the research were predominantly from the city—79.04% (n = 313) (see Figure 1)—and from a range of different age groups (see Figure 2). That over 20% of the bus users were from outside the city was an acceptable figure for the research team given the significant number of people who commute into the city on a daily basis [55]. Of these groups, most were between the ages of 15 to 24—35.01% (n = 139)—and 25 to 44 years of age —6.27% (n = 144)—while 54.91% (n = 218) were female and 45.09% (n = 179) male (see Figure 3). When asked how often they take the bus, nearly 50% (n = 198) answered ‘daily’, 28.46% (n = 113) are weekly service users, and nearly 20% (n = 76) replied ‘monthly’ or ‘occasionally’ (see Figure 4. The 2.52% (n = 10) who answered they never used the bus service were excluded from the main body of questions but were asked for their overall comments and observations of the public bus service in the city. Of those service users who took the bus on a daily basis, a large majority—over 70% (n = 140)—were between the ages of 15 and 44 years old.
Service users were then asked for their main reason for taking the bus, 29.14% (n = 95) stating school or college—Galway is widely regarded as a university town with a large community of students, estimated to be 20% of the population; the largest institutions being the National University of Ireland Galway (NUIG) located in the west of the city and the Galway-Mayo Institute of Technology (GMIT) on the east side of Galway—and 30.06% (n = 98) maintaining they used the bus for their commute to and from work (see Figure 5). When asked if the bus was their only option for completing their journey, 53.13% (n = 204) replied ‘yes’ (while appreciating that this reflects differing needs, incentives and motivations, this particular study is best served by keeping these two groups together when asking subsequent questions on satisfaction with the current service) (see Figure 6). Service users whose only option was to take the bus were then asked for their reasons for choosing the public bus service over other modes of travel (see Figure 7). The top three answers for this question were the journey was quicker (26.26%), it was less stressful travelling on the bus (18.99%) and it is less costly travelling by bus (18.44%). A breakdown of the most regular routes used by the participants is provided in Figure 8 (the 409 is the most popular bus route in the city serving the growing housing estates on the east of the city and the large industrial areas of Parkmore and Ballybrit).
The central questions on satisfaction with the service offered to customers were then asked. All service users are included in these findings regardless of whether the participant chooses the bus over other means or it is the only option available to them to complete the journey. On the question of value for money of their most recent journey, over 54% expressed a fairly satisfied or very satisfied response while over 26% claimed to be fairly dissatisfied or very dissatisfied (see Figure 9). When asked about the punctuality of the bus on their most recent journey, close to 50% were fairly or very satisfied while over 40% were fairly or very dissatisfied (see Figure 10). Participants were also asked about their satisfaction with the length of time that the journey took; over 63% were fairly or very satisfied while over 25% were fairly or very dissatisfied (see Figure 11). Finally, bus service users were asked about their overall levels of satisfaction, all things considered, and over 60% claimed to be fairly satisfied or very satisfied but over 17% were fairly dissatisfied and nearly 10% very dissatisfied with their bus journey (see Figure 12).
So how does the public bus service in Galway compare with other regions? Research undertaken in April 2017 on behalf of the National Transport Authority by Kantar MillwardBrown indicated that satisfaction levels nationally with Bus Éireann stood at 85% [56]. However, Bus Éireann’s remit is to provide expressway Inter-urban coach services, city bus services in Cork, Galway, Limerick and Waterford, town services in Athlone, Balbriggan, Drogheda, Dundalk, Navan and Sligo, in addition to commuter and rural and urban school bus services. In the Millward Brown study there was no focus directly on the Galway City service. In addition, the public bus service in Galway is jointly served by Bus Éireann and Galway City Direct and there is no existing research into overall service user satisfaction levels, to the authors’ knowledge. Transport Focus is an independent transport user watchdog with a strong emphasis on evidence-based campaigning and research which advocates on behalf of passengers and other road users for improvements in transport services in the UK (see www.transportfocus.org.uk/about/). The organisation annually conducts a Bus Passenger Report which records details of passenger journeys and levels of satisfaction with services in 27 regions and authorities in England (outside of London). In an attempt to offer some comparison with other available public bus services, we selected three questions from this report to be included in our questionnaire. It is important to note that the methodologies adopted in both questionnaires were not the same nor are the services comparable in size, so no firm conclusion can or should be made. It does, however, offer an interesting snapshot of the performance of the Galway public bus service when compared to other established services, albeit that these operate in a different jurisdiction. Satisfaction with value for money fluctuates between 51% to 73% in the varies authority regions in the Transport Focus report whilst in Galway this stands at 54%, overall satisfaction with punctuality varied between 63% to 83% while in Galway this figure was 50%, and overall satisfaction with the journey was between 78% and 94% in England (outside of London) but a figure of just 61% was found in Galway (see Figure 13 below).

5. Digging Deeper: Additional Comments and Remarks

The final question asked of service users was an open question seeking overall comments or remarks about the public bus service in Galway. A large number elected to give comments on the service (n = 223), some going into significant detail on their experiences and knowledge of the network. This suggests a high level of interest and awareness with regards to many of the issues and concerns faced by service users in the city. Furthermore, a number of brief face-to-face interviews were conducted to clarify, validate and elaborate on these experiences. While not meant to be a comprehensive critique of all these comments, this section sets out some of the key recurring themes and issues expressed in the questionnaire and interview responses.
A number of people, albeit whose response was brief, were happy and content with the service provided and largely complementary of the staff:
Staff are very nice and helpful (Participant # 202).
At the moment very satisfied. Great improvement from a few years ago (Participant # 223)
I was very happy with my bus journey as it was very clean and comfortable and stress free!! (Participant # 380)
However, for many who responded to this open question, there were some noteworthy issues and frustrations with the service on offer. One of the broadest concerns was with the punctuality of the service. While many expressed unhappiness and discontent with the punctuality of the bus service, there was recognition that this issue is interconnected with the overall problems of periodic traffic congestion experienced by people in the city:
Punctuality is a serious problem but it’s strictly related to traffic. If there is a heavy traffic, the bus has no chance to get [there] on time. Besides, most of the time I take the bus when [the] weather is bad. Otherwise, I prefer walking (Participant # 65)
A twenty minute journey can take forty minutes. A forty minute journey can take an hour and a half. It’s common for a bus to not appear at the correct time, or show up several minutes later. Whether it is the fault of the bus itself, or traffic conditions, I do not know (Participant # 115).
Yet others expressed dissatisfaction with the cost of public bus transport in the city:
Bus Service in Galway is terribly priced. Raising single tickets by €0.10c on December 1st every year is a joke. In 2017 things should be getting easier not harder (participant # 29)
I wish the tickets would be cheaper, then all my family would use [the] bus instead of [the] car (Participant # 31)
It’s quite expensive, especially for students. I honestly would rather walk at times, since they barely run on time as it is (Participant # 115).
One notable issue of concern that emerged was dissatisfaction with the attitude of some bus drivers and employees towards passengers. No particular reference to this was contained in any question asked yet a significant number of participants (n = 22) mentioned this as an ongoing concern:
Quite a poor service, very rude drivers that are often more concerned with finishing their shift than keeping to their bus time schedule (Participant # 75)
The customer service provided by bus drivers also varies wildly, from genuine good service to downright rudeness (Participant # 106)
There’s a serious attitude problem with the bus drivers employed. The vast majority are often rude for no reason. Only for it’s my only means to travel to college I wouldn’t use the service (Participant # 112).
Other concerns to emerge related to the dependability of the real-time service information available to customers:
Lack of reliability and no good options for mobile real-time information (or maybe digital time displays at every stop) make using the Galway buses a frustrating experience (Participant # 138)
Would like Real Time app to give actual location data for buses, not just scheduled times. Other bus services have accomplished this, we should be able to also (Participant # 160).
Many of the frustrations experienced by dissatisfied service users was summed up by two customers who stated:
Service has improved greatly over the years with Real Time Info at stops and Apps, Leap Card, New buses. But further improvements are needed [such as the] ability to transfer to other bus without paying for a second trip (1 ticket should last for 90mins), should be able to use the Leap Card without having to interact with the driver (interaction slows the bus down), more bus lanes and dedicated public transport corridors, the bus gets stuck in private vehicle traffic far too regularly, more bus shelters and their position should be assessed (i.e. the shelter should provide protection from the prevailing winds), cross city bus that does not stop at Eyre Sq (use N6 bridge) (Participant # 37)
The public transport in Galway is extremely undeveloped. First of all, it is not convenient. Long waiting at bus stops became a routine. Only a small amount of these stops are equipped with real-time information screens. The buses themselves have no proper information about the journey (visual and audible info at very poor level). The system of selling tickets is old-fashioned. Bus stops are shabby (they should be totally refurbished and updated). Ticket costs are extraordinary—the same distance made by a city bus in Leeds is 3 (!!!) times cheaper (as of late November 2017). The waiting time between buses should be no more than 5 minutes. The number of routes should be significantly increased. [… …] In general, it seems that the urban planning/transportation/strategic planning departments of the Galway City Council has no knowledge or will to perform their duties. The mark for their work is "F", unsatisfactory. Their preoccupation with building roads is silly and unprofessional. The huge blame for transportation issue[s] in Galway rests on the inadequate and unprofessional level of local governance (Participant # 86).

6. Discussion

The Irish Government’s 2009 policy shift with regards to transport—contained in Smarter Travel: A Sustainable Transport Future [57]—provided a new policy framework for promoting low-carbon alternatives to the car such as walking, cycling, and public transport. Despite such moves, it is argued that the dogma of ‘predict and provide’ transport infrastructure construction continues to dictate Irish transport policy thinking at the expense of more sustainable transport alternatives and environmental concerns [52]. Yet, Smarter Travel as a policy initiative has not been wholly acknowledged as ended by transport policy designers or decision-makers and with the Climate Change Advisory Council’s growing concerns that the country is completely off course with regards to achieving our carbon reduction commitments and goals [58], a refocus on sustainable alternatives to a car-centric transport policy is unavoidable, given Ireland’s disproportional projected transport emissions [59]. A central component for change will be improved and expanded public transport services and networks. Public transport, undoubtably, has the potential to substitute for a great number of present car journeys in urban and suburban neighbourhoods, and buses are utilised more often than any other public transport option to achieve this. An overall improved public transport system will offer smarter travel choices that will support people to more regularly relinquish their car and travel more sustainably. This also can contribute to inclusivity for those who cannot afford, or choose not, to own and run a private car. However, for demand for public transport to increase there is a need to identify areas where existing service users are unhappy and attempt to rectify these in a just and timely manner.
This study sought to ascertain which features of the current public bus service in Galway were in need of the direct attention of service providers in order for potential improvements in the system to be identified, discussed, redesigned and implemented. One of the key concerns expressed by many participants focused on poor punctuality. It must be acknowledged that Galway suffers sporadic traffic congestion at peak commuting times and buses also fall victim to this inefficiency in the transport network. There are inadequate Dedicated Bus Lanes (DBLs) throughout the metropolitan area and this infrastructural deficiency is having negative consequences for the development of an effective and efficient public transport service. Planning and transport policy- and decision-makers must prioritise the expansion of the DBL network, while making sufficient provision for crucial interconnected cycling and pedestrian linkages, if Galway is to grow as an economically, socially, environmentally mature city. If the city is to distance itself from its present image as a traffic congested municipality then hard decisions need to be made with regards to reassigning the current excessive car space in the city to further developing infrastructural DBLs, cycling and walking networks. A gridlocked city is not a sign of economic growth, it is a sign of long-term planning immaturity over many decades. In addition to prioritising public transport infrastructure development, existing service providers must play a more proactive role in the development of a better service. While there is some evidence of individual drivers being customer-focused, a repeated refrain of the opposite from service users reflects poorly on the public transport system in Galway. It is incumbent on these organisations to view their role as one of public service and improve their relationship with their customers. That this study appears to be the first attempt at understanding and acknowledging the experiences of bus passengers in the city reflects this lack of attention to their customers. An additional area of concern for service users was the lack of credible and reliable real-time service information throughout the network. While such information is available at some bus stops in the city at present, this needs to be rolled out throughout the network and supplemented by a mobile device-friendly real-time system. Moreover, such real-time service information must be trustworthy and factual to avoid a loss of credibility in the entire public transport system.

7. Conclusions

For cities to develop in a sustainable manner, an efficient, affordable and reliable public transport system must be central to all planning and transportation decisions. In the case of Galway, it suffers from periodic but chronic traffic congestion which cripples the economic and social life of the city, so the need to develop and improve the existing public transport system assumes even greater significance. There is evidence of some progressive thinking with regards to supplementing the existing network through lobbying for the development of a light rail system for Galway (see www.gluas.ie), but at present the existing public bus service on offer does not enjoy the full support of many current service users, and is failing to attract new customers in sufficient numbers. Improvements in the system are both necessary and essential. This study sought an understanding of the practices and experiences of public bus passengers in Galway with a view to identifying areas in the service that require improvements. For policy-makers and transport planners, deficiencies in public transport infrastructure, such as inadequate numbers and spans of DBLs, are seriously hampering overall improvements in the service and network. Local and national transport policy planners must prioritise bus only road infrastructure over and above what is already envisioned in the current city development plan and transport strategy if public transport is to grow. While broader questions related to public transport infrastructure need to be addressed, shorter term changes and improvements would, the authors suggest, lead to higher levels of satisfaction with the existing service in the near to medium terms. The two existing service providers must acknowledge they have a problem with their customer service, particularly in relation to their front line staff, the bus drivers. Service providers and staff must place more weight on their public service remit and obligations if the breakdown between bus companies and the travelling public is not to deteriorate further. Changes in training and employment policies may be necessary. In addition, more credible, dependable real-time information must be provided to passengers by means of available instruments and mobile devices, and more attention to the design, cleanliness and location of bus stops and shelters across the city is needed. While this study affords the first few tentative steps in obtaining a better understanding of the existing public transport system in Galway from a service user perspective, more research is needed to provide a deeper and more extensive appreciation of the issues we face. Only by identifying deficiencies in the current public transport network and system and attempting to rectify these can we be more confident in attracting new regular customers. The alternative is to forge ahead with car-centric policies that encourage and reward automobility at the expense of the economic, social and environmental health of the city and its citizens.

Author Contributions

Project conceptualisation, design, literature review, data analysis, manuscript writing and project supervision, M.H.; project design, administration and data collection, O.B., M.M.N., M.C., D. B., F.H. E.C. and C.M.

Funding

This research received no external funding but was supported financially by the EXPLORE initiative at NUI Galway, which assists students to innovate and co-create new learning opportunities.

Acknowledgments

The authors’ wishes to acknowledge the financial assistance of EXPLORE, which supports students and staff at NUI Galway to co-create new learning experiences and knowledge. This study was made possible through the Research Experience and Learning (REaL) initiative supported by the Social Sciences Research Centre (SSRC) at NUI Galway. The authors’ also wish to acknowledge the use of some questions from the Transport Focus Bus Passenger Report, and to thank all the research participants and contributors for their time, effort, and generosity of spirit.

Conflicts of Interest

The authors declare no conflict of interest.

References

  1. Wickham, J. Gridlock: Dublin’s Transport Crisis and the Future of the City; New Island: Dublin, Ireland, 2006. [Google Scholar]
  2. Sloman, L. Car Sick: Solutions for Our Car-Addicted Culture; Green Books Ltd.: Dartington, UK, 2006. [Google Scholar]
  3. Gössling, S. Urban transport justice. J. Transp. Geogr. 2016, 54, 1–9. [Google Scholar] [CrossRef]
  4. Lucas, K.; Grosvenor, T.; Simpson, R. Transport, the Environment and Social Exclusion; YPS: York, UK, 2001. [Google Scholar]
  5. Holmgren, J. Meta-analysis of public transport demand. Transp. Res. Part A Policy Pract. 2007, 41, 1021–1035. [Google Scholar] [CrossRef] [Green Version]
  6. Schiefelbusch, M. Passenger Interests in Public Transport. In Public Transport and its Users: The Passenger Perspective in Planning and Customer Care; Schiefelbusch, M., Dienel, H.-L., Eds.; Ashgate: Surrey, UK, 2009; pp. 5–18. [Google Scholar]
  7. Banister, D. Unsustainable Transport: City Transport in the New Century; Routledge: London, UK, 2005. [Google Scholar]
  8. Currie, G.; Stanley, J. Investigating links between social capital and public transport. Transp. Rev. 2008, 28, 529–547. [Google Scholar] [CrossRef]
  9. Kamruzzaman, M.; Yigitcanlar, T.; Yang, J.; Mohamed, M.A. Measures of transport-related social exclusion: A critical review of the literature. Sustainability 2016, 8, 696. [Google Scholar] [CrossRef]
  10. Wickham, J. Public Transport Systems: The sinews of European urban citizenship? Eur. Soc. 2006, 8, 3–26. [Google Scholar] [CrossRef]
  11. Redman, L.; Friman, M.; Gärling, T.; Hartig, T. Quality attributes of public transport that attract car users: A research review. Transp. Policy 2013, 25, 119–127. [Google Scholar] [CrossRef]
  12. Ojo, T.K. Quality of public transport service: An integrative review and research agenda. Transp. Lett. Int. J. Transp. Res. 2017, 1–14. [Google Scholar] [CrossRef]
  13. CSO. Population and Actual and Percentage Change 2011 to 2016 by Sex, Province County or City, Census Year and Statistics; Census of Population 2016—Preliminary Results [Webpage] 2016; Central Statistics Office: Cork, Ireland, 2016; Available online: http://www.cso.ie/en/releasesandpublications/ep/p-cpr/censusofpopulation2016-preliminaryresults/geochan/ (accessed on 19 September 2016).
  14. CSO. Means of Travel to Work; Census of Population 2016—Profile 6 Commuting in Ireland [Webpage] 2017; Central Statistics Office: Cork, Ireland, 2017; Available online: https://www.cso.ie/en/releasesandpublications/ep/p-cp6ci/p6cii/p6mtw/ (accessed on 12 November 2017).
  15. Dienel, H.-L. The Future of Passengers’ Rights and Passenger Participation. In Public Transport and its Users: The Passenger Perspective in Planning and Customer Care; Schiefelbusch, M., Dienel, H.-L., Eds.; Ashgate: Surrey, UK, 2009; pp. 275–280. [Google Scholar]
  16. Stelzer, A.; Englert, F.; Hörold, S.; Mayas, C. Using Customer Feedback in Public Transportation Systems. In Proceedings of the 2014 International Conference on Advanced Logistics and Transport (ICALT), Hammamet, Tunisia, 1–3 May 2014; pp. 29–34. [Google Scholar]
  17. Banister, D. The sustainable mobility paradigm. Transp. Policy 2008, 15, 73–80. [Google Scholar] [CrossRef]
  18. Stjernborg, V.; Mattisson, O. The Role of Public Transport in Society—A Case Study of General Policy Documents in Sweden. Sustainability 2016, 8, 1120. [Google Scholar] [CrossRef]
  19. Santos, M.D.d.; Silva, M.F.; Velloza, L.A.; Pompeu, J.E. Lack of accessibility in public transport and inadequacy of sidewalks: Effects on the social participation of elderly persons with functional limitations. Rev. Bras. Geriatr. Gerontol. 2017, 20, 161–174. [Google Scholar] [CrossRef]
  20. UNECE. Sustainable Urban Mobility and Public Transport in UNECE Capitals|Transport Trends and Economics Series (WP.5); United Nations Economic Commission for Europe: New York, NY, USA; Geneva, Switzerland, 2015. [Google Scholar]
  21. Givoni, M.; Macmillen, J.; Banister, D.; Feitelson, E. From Policy Measures to Policy Packages. Transp. Rev. 2013, 33, 1–20. [Google Scholar] [CrossRef]
  22. Anderson, M.L. Subways, Strikes, and Slowdowns: The Impacts of Public Transit on Traffic Congestion; NBER Working Paper No. 18757; National Bureau of Economic Research: Cambridge, MA, USA, 2013; Volume JEL.
  23. Beaudoin, J.; Farzin, Y.H.; Lawell, C.-Y.C.L. Lawell Public Transit Investment and Traffic Congestion Policy; University of California at Davis Working Paper; University of California: Davis, CA, USA, 2018. [Google Scholar]
  24. Litman, T. Evaluating Public Transit Benefits and Costs: Best Practices Guidebook; Victoria Transport Policy Institute: Victoria, BC, Canada, 2018. [Google Scholar]
  25. Ryan, S. Property values and transportation facilities: Finding the transportation-land use connection. J. Plan. Lit. 1999, 13, 412–427. [Google Scholar] [CrossRef]
  26. Ewing, R. Transportation infrastructure and urban growth and development patterns|3.1 Highway Induced Development: What Research in Metropolitan Areas Tells Us. In Transportation Infrastructure: The Challenges of Rebuilding America; Boarnet, M.G., Ed.; American Planning Association, Planning Advisory Service: Chicago, IL, USA, 2009; pp. 27–39. [Google Scholar]
  27. Cervero, R.; Kang, C.D. Bus rapid transit impacts on land uses and land values in Seoul, Korea. Transp. Policy 2011, 18, 102–116. [Google Scholar] [CrossRef] [Green Version]
  28. Ferrell, C.E. The Benefits of Transit in the United States: A Review and Analysis of Benefit-Cost Studies; Mineta Transportation Institute: San José, CA, USA, 2015. [Google Scholar]
  29. She, Z.; King, D.M.; Jacobson, S.H. Analyzing the impact of public transit usage on obesity. Prevent. Med. 2017, 99, 264–268. [Google Scholar] [CrossRef] [PubMed]
  30. Rissel, C.; Curac, N.; Greenaway, M.; Bauman, A. Physical activity associated with public transport use—A review and modelling of potential benefits. Int. J. Environ. Res. Public health 2012, 9, 2454–2478. [Google Scholar] [CrossRef] [PubMed]
  31. Lucas, K. Transport and social exclusion: Where are we now? Transp. Policy 2012, 20, 105–113. [Google Scholar] [CrossRef]
  32. Kamruzzaman, M.; Wood, L.; Hine, J.; Currie, G.; Giles-Corti, B.; Turrell, G. Patterns of social capital associated with transit oriented development. J. Transp. Geogr. 2014, 35, 144–155. [Google Scholar] [CrossRef] [Green Version]
  33. Hodges, T. Public Transportation’s Role in Responding to Climate Change; U.S. Department of Transportation, Federal Transit Administration: Washington, DC, USA, 2010.
  34. Lowe, M.; Aytekin, B.; Gereffi, G. Public Transit Buses: A Green Choice Gets Greener; Center on Globalization Governance and Competitiveness, Duke University: Durham, NC, USA, 2009. [Google Scholar]
  35. UITP. Climate Action and Public Transport: Analysis of Planned Actions; International Association of Public Transport: Brussels, Belgium, 2014; pp. 1–17. [Google Scholar]
  36. Marsden, G.; Bonsall, P. Performance targets in transport policy. Transp. Policy 2006, 13, 191–203. [Google Scholar] [CrossRef] [Green Version]
  37. Hensher, D.A. The imbalance between car and public transport use in urban Australia: Why does it exist? Res. Transp. Econ. 2007, 407–430. [Google Scholar] [CrossRef]
  38. Fujii, S.; Kitamura, R. What does a one-month free bus ticket do to habitual drivers? An experimental analysis of habit and attitude change. Transportation 2003, 30, 81–95. [Google Scholar] [CrossRef]
  39. Beirão, G.; Cabral, J.S. Understanding attitudes towards public transport and private car: A qualitative study. Transp. Policy 2007, 14, 478–489. [Google Scholar] [CrossRef]
  40. Diab, E.; Lierop, D.V.; El-Geneidy, A. Recommending transit: Disentangling users’ willingness to recommend transit and their intended continued use. Travel Behav. Soc. 2017, 6, 1–9. [Google Scholar] [CrossRef]
  41. Fellesson, M.; Friman, M. Perceived satisfaction with public transport service in nine European cities. J. Transp. Res. Forum 2008, 47, 93–103. [Google Scholar] [CrossRef]
  42. Lierop, D.v.; El-Geneidy, A. Is having a positive image of public transit associated with travel satisfaction and continued transit usage? An exploratory study of bus transit. Public Transp. 2018, 10, 241–256. [Google Scholar] [CrossRef]
  43. Eboli, L.; Mazzulla, G. Performance indicators for an objective measure of public transport service quality. Eur. Transp./Trasp. Eur. 2012, 5, 1–21. [Google Scholar]
  44. Oña, J.D.; Oña, R.D.; Eboli, L.; Forciniti, C.; Mazzulla, G. Transit passengers’ behavioural intentions: The influence of service quality and customer satisfaction. Transp. A Transp. Sci. 2016, 12, 385–412. [Google Scholar]
  45. Zhao, J.; Webb, V.; Shah, P. Customer loyalty differences between captive and choice transit riders. Transp. Res. Rec. J. Transp. Res. Board 2014, 80–88. [Google Scholar] [CrossRef]
  46. Lai, W.-T.; Chen, C.-F. Behavioral intentions of public transit passengers—The roles of service quality, perceived value, satisfaction and involvement. Transp. Policy 2011, 18, 318–325. [Google Scholar] [CrossRef]
  47. CSO. Means of Travel to Work; Census of Population 2011—Profile 6 Commuting in Ireland [Webpage] 2012; Central Statistics Office: Cork, Ireland, 2012; Available online: https://www.cso.ie/en/census/census2011reports/census2011profile10doortodoorcommutinginireland/ (accessed on 2 September 2018).
  48. Galway City Council. Galway Transort Strategy: An Integrated Transport Management Programme for Galway City and Environs; Galway City Council|Galway County Council: Galway, Ireland, 2016. [Google Scholar]
  49. Flavin, S.; Dhonghaile, S.N.; Baggaley, J.; Eogan, D. Galway Public Transport Feasibility Study: Robust Foundations; Report for Galway City Council in Association with HKT&T|MVAConsultancy; Galway City Council: Galway, Ireland, 2010. [Google Scholar]
  50. Browne, D.; Caulfield, B.; O’Mahony, M. Assessing the Barriers to Sustainable Transport in Ireland; Prepared for the Environmental Protection Agency by Trinity College Dublin; Johnstown Castle, Co.: Wexford, Ireland, 2011. [Google Scholar]
  51. Kinsella, J.; Caulfield, B. An Examination of the Quality and Ease of Use of Public Transport in Dublin from a Newcomer’s Perspective. J. Public Transp. 2011, 14, 69–81. [Google Scholar] [CrossRef] [Green Version]
  52. Rau, H.; Hynes, M.; Heisserer, B. Transport policy and governance in turbulent times: Evidence from Ireland. Case Stud. Transp. Policy 2016, 4, 45–56. [Google Scholar] [CrossRef]
  53. Transport Focus. Bus Passenger Survey—Autumn 2017 Report; Transport Focus: London, UK, March 2018. [Google Scholar]
  54. Neary, M.; Winn, J. The Student as Producer: Reinventing the Student Experience in Higher Education. In The Future of Higher Education: Policy, Pedagogy and the Student Experience; Continuum: London, UK, 2009; pp. 192–210. [Google Scholar]
  55. CSO. Where We Work; Census of Population 2016—Profile 6 Commuting in Ireland [Webpage] 2017; Central Statistics Office: Cork, Ireland, 2017; Available online: https://www.cso.ie/en/releasesandpublications/ep/p-cp6ci/p6cii/p6www/ (accessed on 12 November 2017).
  56. TFI. Public Transport Gets 91% Customer Satisfaction Rating; News [Webpage] 2018; Transport for Ireland: Dublin 2, Ireland, 2018; Available online: https://www.transportforireland.ie/public-transport-gets-91-customer-satisfaction-rating/ (accessed on 16 August 2018).
  57. Department of Transport. Smarter Travel: A Sustainable Transport Future. A New Transport Policy for Ireland 2009–2020; Government Publications: Dublin 2, Ireland, 2009.
  58. Hilliard, M. Ireland ‘can’t reach’ target to cut carbon emissions by 2020. The Irish Times, 25 July 2018. [Google Scholar]
  59. EPA. Ireland’s Greenhouse Gas Emission Projections 2017–2035; Environmental Protection Agency: Co Wexford, Ireland, 2018. [Google Scholar]
Figure 1. Participant’s Home.
Urbansci 02 00102 g001
Figure 2. Participant’s Age.
Urbansci 02 00102 g002
Figure 3. Participant’s Gender.
Urbansci 02 00102 g003
Figure 4. How Often Participants Take the Bus.
Urbansci 02 00102 g004
Figure 5. Reason for Taking the Bus.
Urbansci 02 00102 g005
Figure 6. Is the Bus your only Option?
Urbansci 02 00102 g006
Figure 7. Participants whose Only Option is the Bus | Reason for Taking the Bus.
Urbansci 02 00102 g007
Figure 8. Regular Bus Route.
Urbansci 02 00102 g008
Figure 9. Value for Money.
Urbansci 02 00102 g009
Figure 10. Journey Punctuality.
Urbansci 02 00102 g010
Figure 11. Length of Time of the Journey.
Urbansci 02 00102 g011
Figure 12. Overall Satisfaction.
Urbansci 02 00102 g012
Figure 13. Comparison with English Regions (outside of London).
Urbansci 02 00102 g013

