
Geometric Approach to Analytic Marginalisation of the Likelihood Ratio for Continuous Gravitational Wave Searches


ARC Centre of Excellence for Gravitational Wave Discovery (OzGrav) and Centre for Gravitational Astrophysics, Australian National University, Canberra, ACT 2601, Australia
Universe 2021, 7(6), 174; https://doi.org/10.3390/universe7060174
Submission received: 30 April 2021
/
Revised: 26 May 2021
/
Accepted: 28 May 2021
/
Published: 1 June 2021
(This article belongs to the Special Issue Continuous Gravitational Waves)
Abstract
:The likelihood ratio for a continuous gravitational wave signal is viewed geometrically as a function of the orientation of two vectors; one representing the optimal signal-to-noise ratio, and the other representing the maximised likelihood ratio or -statistic. Analytic marginalisation over the angle between the vectors yields a marginalised likelihood ratio, which is a function of the -statistic. Further analytic marginalisation over the optimal signal-to-noise ratio is explored using different choices of prior. Monte-Carlo simulations show that the marginalised likelihood ratios had identical detection power to the -statistic. This approach demonstrates a route to viewing the -statistic in a Bayesian context, while retaining the advantages of its efficient computation.
1. Introduction
Continuous gravitational waves are, at best, weak signals relative to the sensitivity of current-generation interferometric detectors [1,2,3]. Searches of data from the LIGO and Virgo observatories, most recently from their second [4,5,6,7,8,9,10,11,12,13,14,15,16,17,18,19,20] and third observing runs [21,22], have yet to make a first detection. Theoretical modelling of rapidly-rotating, non-axisymmetric neutron stars—the most likely source of continuous waves—predict a wide range of possible signal strengths [23,24,25,26,27,28,29,30]. Optimally-sensitive data analysis techniques are, therefore, important.
Given an assumed signal model—a quasisinusoid that evolves with the rotation frequency of the neutron star, and is modulated by the relative motion between the star and an Earth-based detector—a matched filter can be constructed to achieve maximum detection power, in the Neyman–Pearson [31] sense of maximising the probability of detection (true positive) at a given probability of false alarm (false positive). Furthermore, as first shown in [32], the matched filter likelihood ratio can be analytically maximised over four amplitude parameters , resulting in the well-known -statistic.
The Bayesian approach to signal detection and parameter inference has become central to gravitational-wave astronomy, e.g., [33]. It was recognised in [34,35] that maximisation over signal parameters can bias detection statistics: from the Bayesian viewpoint, maximisation implicitly assumes prior probabilities for the maximised parameters, which may not be physically motivated.
In [36], the -statistic is shown to possess such a bias due to analytic maximisation over the four amplitude parameters. The are functions of four physical parameters of the continuous wave signal model: the overall signal strength ; the inclination and polarisation angles, which orient the neutron star rotation axis relative to the observer; and the signal phase at some reference time. Given no prior knowledge of the orientation of the neutron star, or the signal phase, one would assume uniform priors on , , and ; and the absence of detections of continuous waves to date is consistent with a choice of prior on , which prefers weaker signals to stronger ones. The -statistic, however, implicitly adopts priors which prefer stronger signals (i.e., larger ) compared to weaker ones. It is also biased in favour of linearly polarised signals where (i.e., the neutron star is viewed “edge-on” with the rotation axis at right angles to the line of sight) compared to circularly polarised signals where (i.e., the neutron star is viewed “face-on” with the rotation axis parallel to the line of sight).
By instead marginalising the likelihood ratio over , , , and with physically-motivated priors, [36] introduced the -statistic, a Bayesian alternative to the -statistic. Monte-Carlo simulations were performed to estimate the receiver–operator curve, which plots the probability of detection against the probability of false alarm. The -statistic was found to be a more powerful detection statistic than the -statistic, assuming a signal population where the distributions of , , and are consistent with the -statistic priors [35].
A practical downside of the -statistic is that, to date, a convenient analytic expression for the marginalised likelihood ratio has not been found, and therefore the marginalisation must be performed by numerical integration. This puts the -statistic at a disadvantage with respect to the -statistic, for which computationally efficient implementations exist [32,37,38,39]. Past work has sought to address this issue though transformation of the amplitude parameters to new coordinate systems, and approximations to the marginalisation integrals in various limits [40,41,42,43].
This paper presents an alternative route to marginalising the likelihood ratio for continuous gravitational wave searches. A geometric view of the likelihood ratio is presented in Section 2, which permits analytic marginalisation over its parameters in Section 3. Receiver–operator curves for the marginalised likelihood ratio are presented in Section 4, and a discussion in Section 5 concludes the paper.
2. Geometric View of the Likelihood Ratio
Gravitational waves detectors measure strain—the differential displacement between test particles due to a passing gravitational wave. The strain due to a continuous wave signal may be written as [32]
where is a vector of the amplitude parameters, and is a vector of time-dependent basis functions.1 Additional parameters p of encode the phase modulation of the continuous wave signal: these typically include Taylor coefficients of the evolution of the gravitational wave frequency, the position of the neutron star in the sky, and if necessary the parameters of the orbit of the neutron star around a companion.
The likelihood ratio for continuous waves arises from considering two hypotheses: that the data consist only of Gaussian stationary noise, with single-sided power spectral density ; or that the data additionally contain a signal specified by Equation (1). The log-likelihood ratio between the two hypotheses is then [32,44]
A search for a continuous wave is performed by repeated computation of Equation (2) for different choices of p, corresponding to different choices of signal hypothesis. Typically, a fixed set of p, called a template bank, is constructed in such a way as to ensure any signal in matches at least one of the signal hypotheses with low loss in signal-to-noise ratio, typically % [45]. A metric on the parameter space of p is often used in constructing template banks [44,46,47,48].
The elements of the vector in Equation (2) are inner products (normalised by ) of the data with the basis functions . The elements of the matrix are inner products of the with each other. The typical time-span of data searched for continuous waves (days to years) far exceeds the time-scale of oscillations in due to the gravitational wave frequency (∼1– Hz); as a result, some inner products between the quickly average to zero. The remaining non-zero elements of are [32,49,50]
The element under the assumption that the gravitational wavelength is much larger than the size of the detector; this holds for terrestrial gravitational-wave interferometers, though not for proposed space-based detectors [49,50]. The elements A, B, and C can be expressed as inner products between two functions and , which are related to the response of the gravitational wave detector to the two fundamental polarisations—“plus” and “cross”—of gravitational waves in general relativity.
The matrix is symmetric and positive definite [32]. It follows that its four leading principal minors , , , and are all strictly positive:
It also follows that possesses a Cholesky decomposition: a lower triangular matrix such that , where is the transpose of . The elements of are given in terms of the elements of and the leading principal minors and :
Define the vectors
The log-likelihood ratio of Equation (2) can then be re-expressed as
where defines the vector norm. The lengths of the vectors and are related to two well-known quantities. The length of is proportional to the optimal signal-to-noise ratio of the matched filter (cf. [44], Equation (24)):
The length of is proportional to the -statistic2 (cf. [44], Equation (19)):
Let
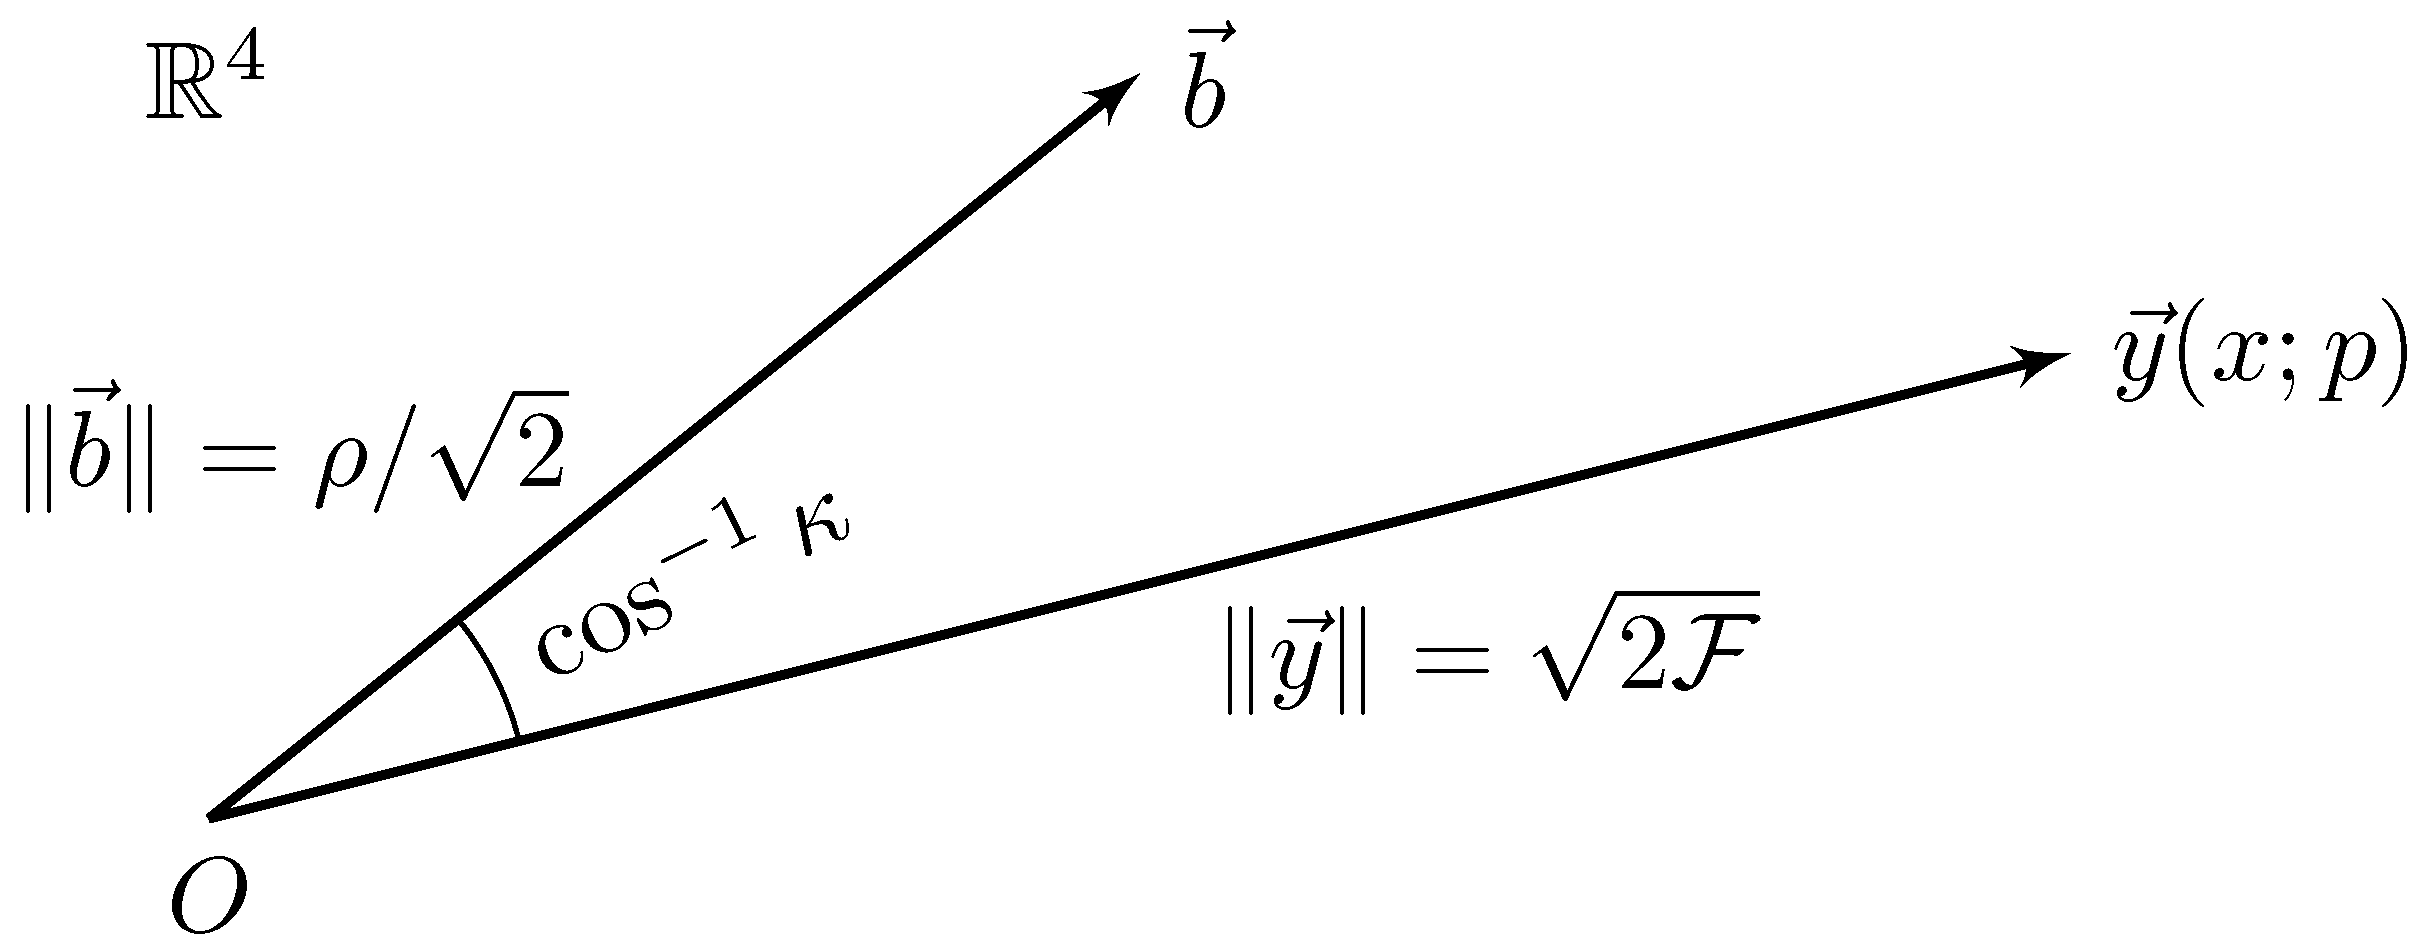
be the cosine of the angle between and . The substitution of Equations (9)–(11) into Equation (8) gives
As shown in Figure 1, the log-likelihood ratio may be viewed geometrically as a function of the relative orientation of two vectors. One vector, , is a function of the data , and represents the matched filter; the other vector, , represents the expected signal-to-noise ratio. Maximisation of the log-likelihood ratio with respect to is equivalent to aligning and : maximising Equation (12) with respect to gives
and Equations (12) and (13) are maximised when , i.e., when and are parallel:
3. Analytic Marginalisation of the Likelihood Ratio
Instead of maximising the likelihood ratio with respect to and , one could marginalise over these parameters with suitable priors. Marginalisation over is performed in Section 3.1, followed by marginalisation over , considering different choices of prior, in Section 3.2.
3.1. Marginalisation over
In the absence of a deeper understanding of the relationship between and , it is not unreasonable to adopt a prior on that assumes no preferred orientation between the two vectors. The prior on is then given by the distribution of , where and are unit vectors uniformly distributed on the 3-sphere .
By invoking spherical symmetry, one can, without a loss of generality, fix one vector, say . The problem then reduces to finding the distribution of . It is well known [51] that a vector uniformly distributed on the -sphere may be found by generating a vector whose elements are independent standard normal variates, then normalising to unit length. Applying this procedure to , the square of its first element is, therefore,
The distributions of and are chi-squared distributions with 1 and 3 degrees of freedom, respectively. It follows that the distribution of is a beta distribution with the parameters , :
To find the distribution of , perform a change of variables and expand the range of the distribution to :
Marginalisation of the likelihood ratio, in the form of Equation (12), over with the prior of Equation (18) gives the analytic expression
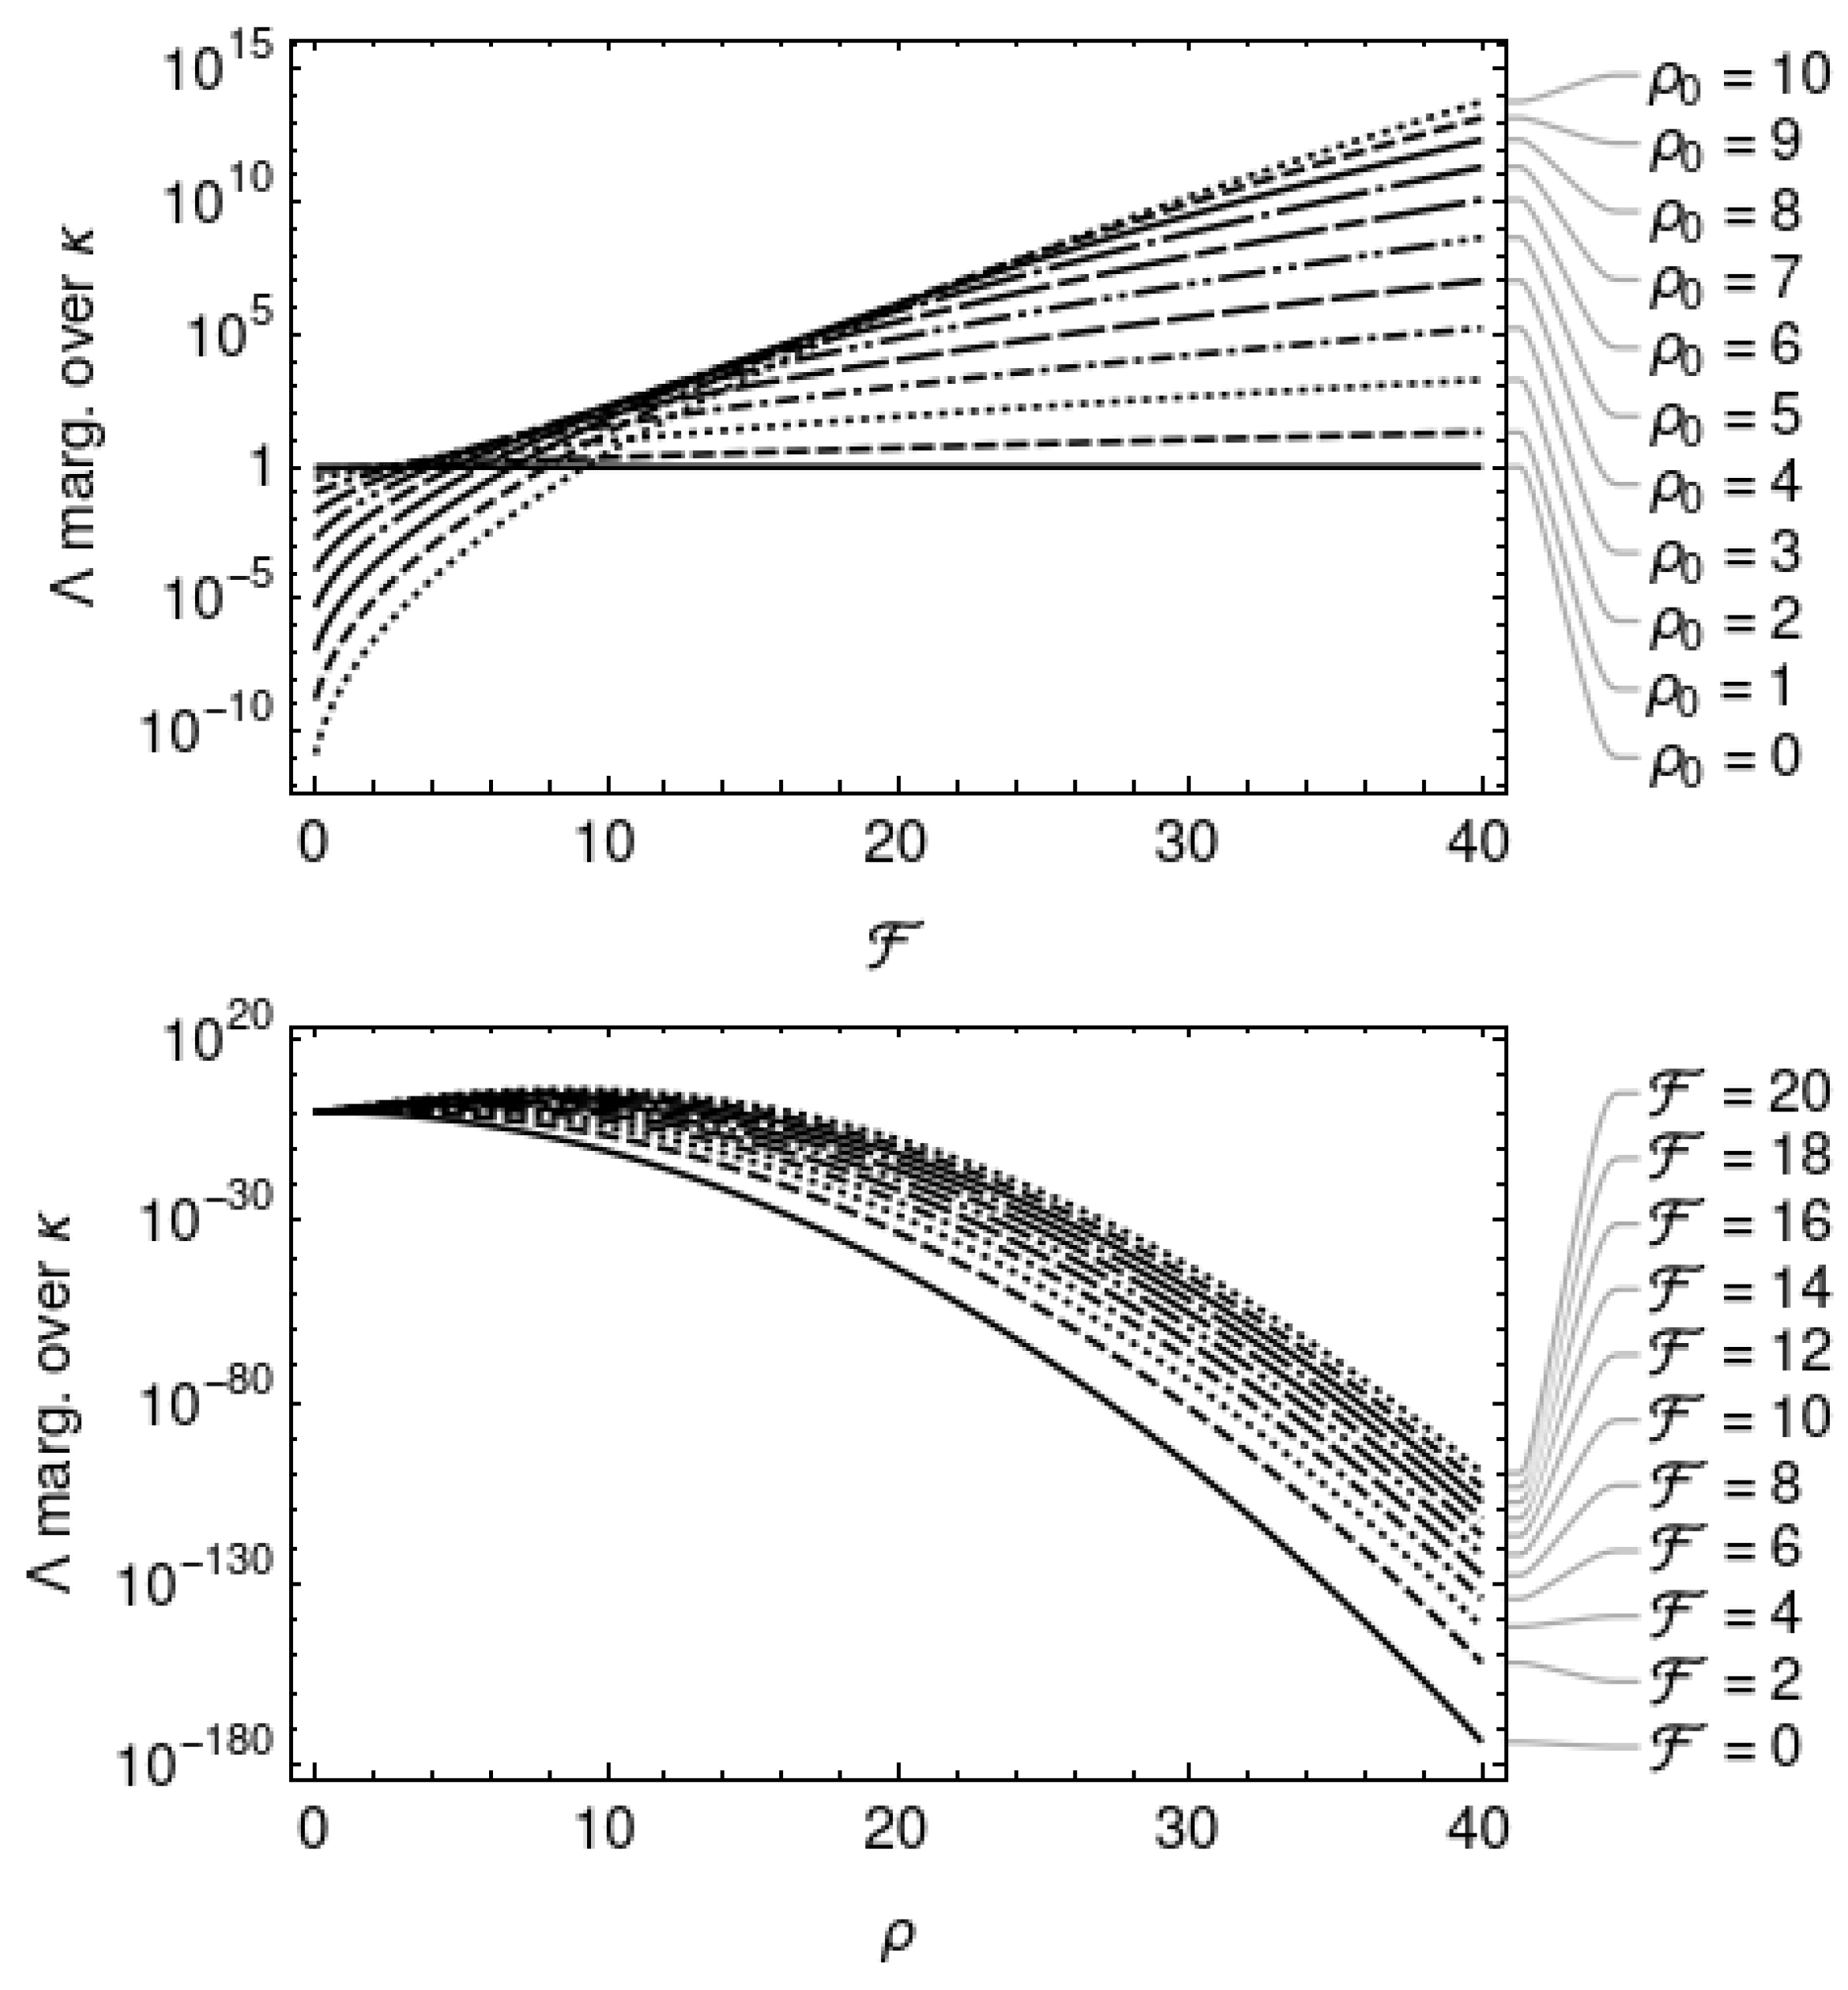
where is the modified Bessel function of the first kind of order n. This function of and is plotted in Figure 2. When is fixed, is a monotonically increasing function of . When is fixed, monotonically decreases as a function of for , but achieves a local maximum at some for .
3.2. Marginalisation over
The marginalised likelihood ratio of Equation (19) may be further analytically marginalised over , depending on its choice of prior. For example, the choice of a uniform (improper) prior on ,
leads to
This is a strictly increasing function of , and is plotted in Figure 3 and Figure 4.
Another possible choice is an exponential prior on :
with parameter . This choice of prior is consistent with the assumption that the signal-to-noise ratio of continuous wave signals is weak, with the most likely value at , and most values at . Figure 3 plots the exponential priors for choices of the parameter ; larger values of lower the peak at and flatten out the distribution. Marginalisation of Equation (19) with the exponential prior on results in
This is a strictly increasing function of and and it is plotted alongside in Figure 3.
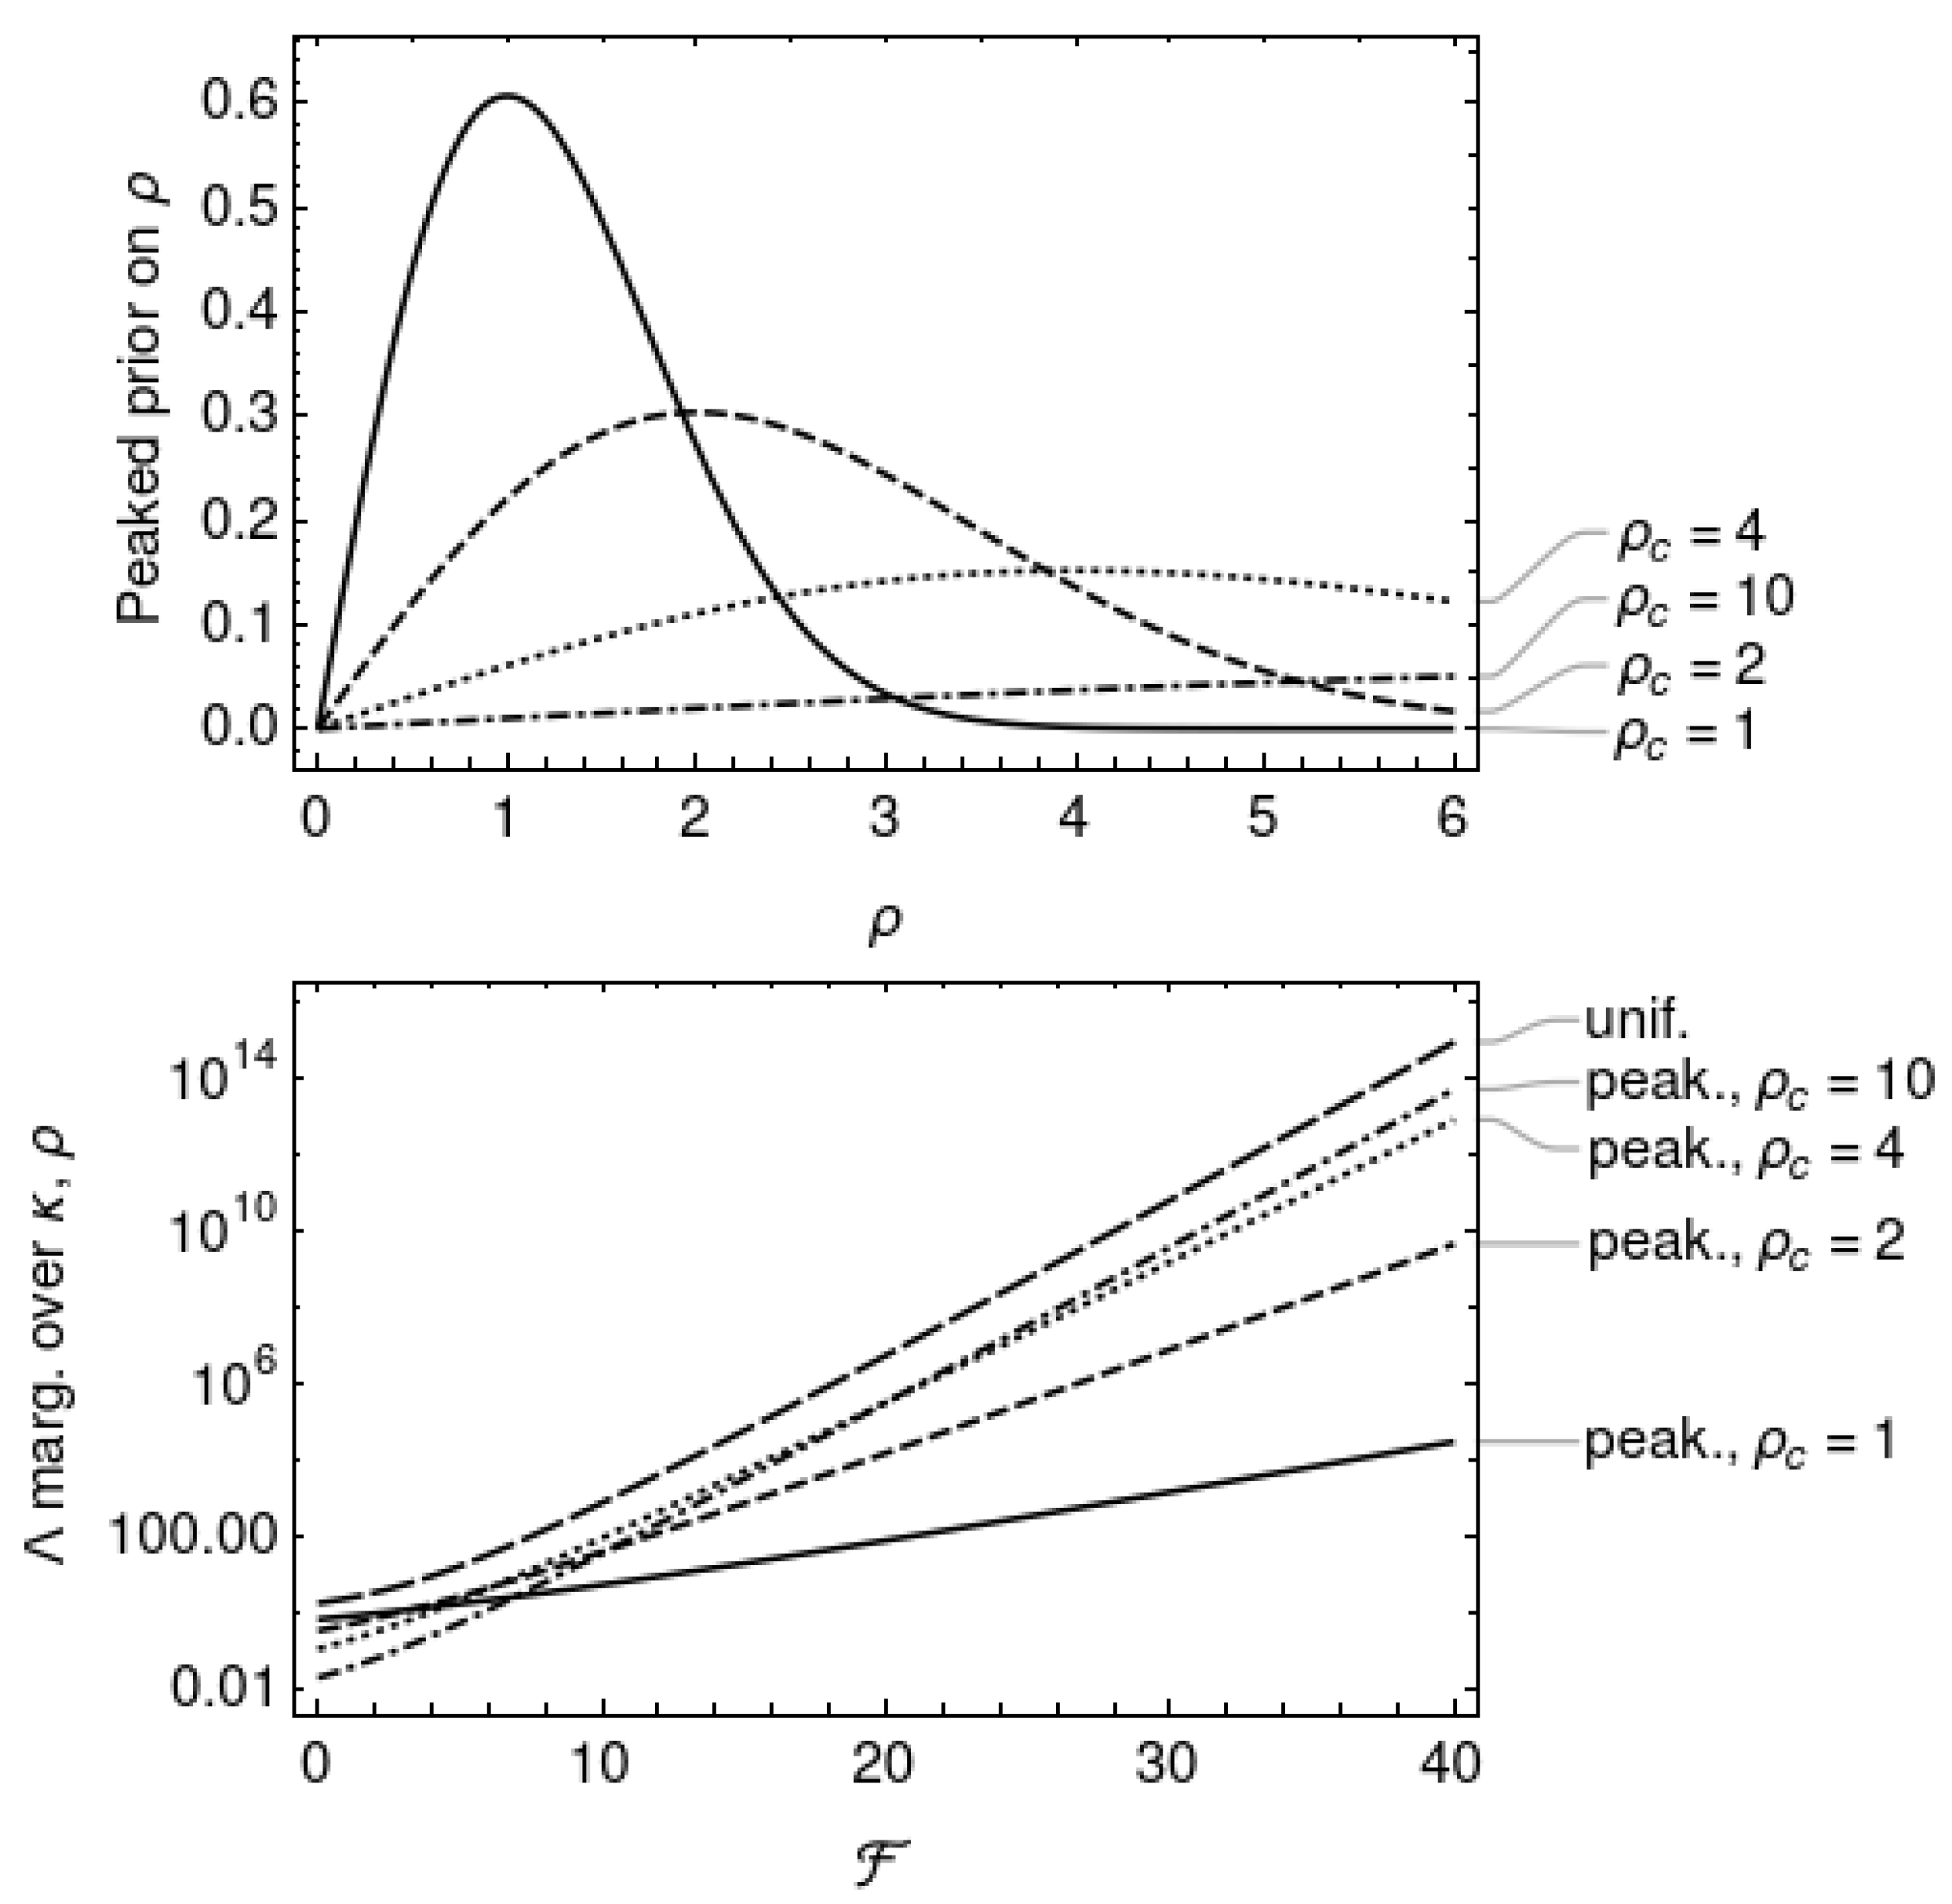
As a third example choice of prior on , consider the function
with parameter . This function is plotted in Figure 3 for choices of ; it has a peaked shape, with the maximum occurring at . This choice of prior is consistent with the assumption that the signal-to-noise ratio of continuous wave signals has some preferred value around , as might be expected if neutron stars possess a minimum ellipticity [29]. Marginalisation of Equation (19) with this peaked prior on leads to
This is a strictly increasing function of and and is plotted alongside in Figure 4.
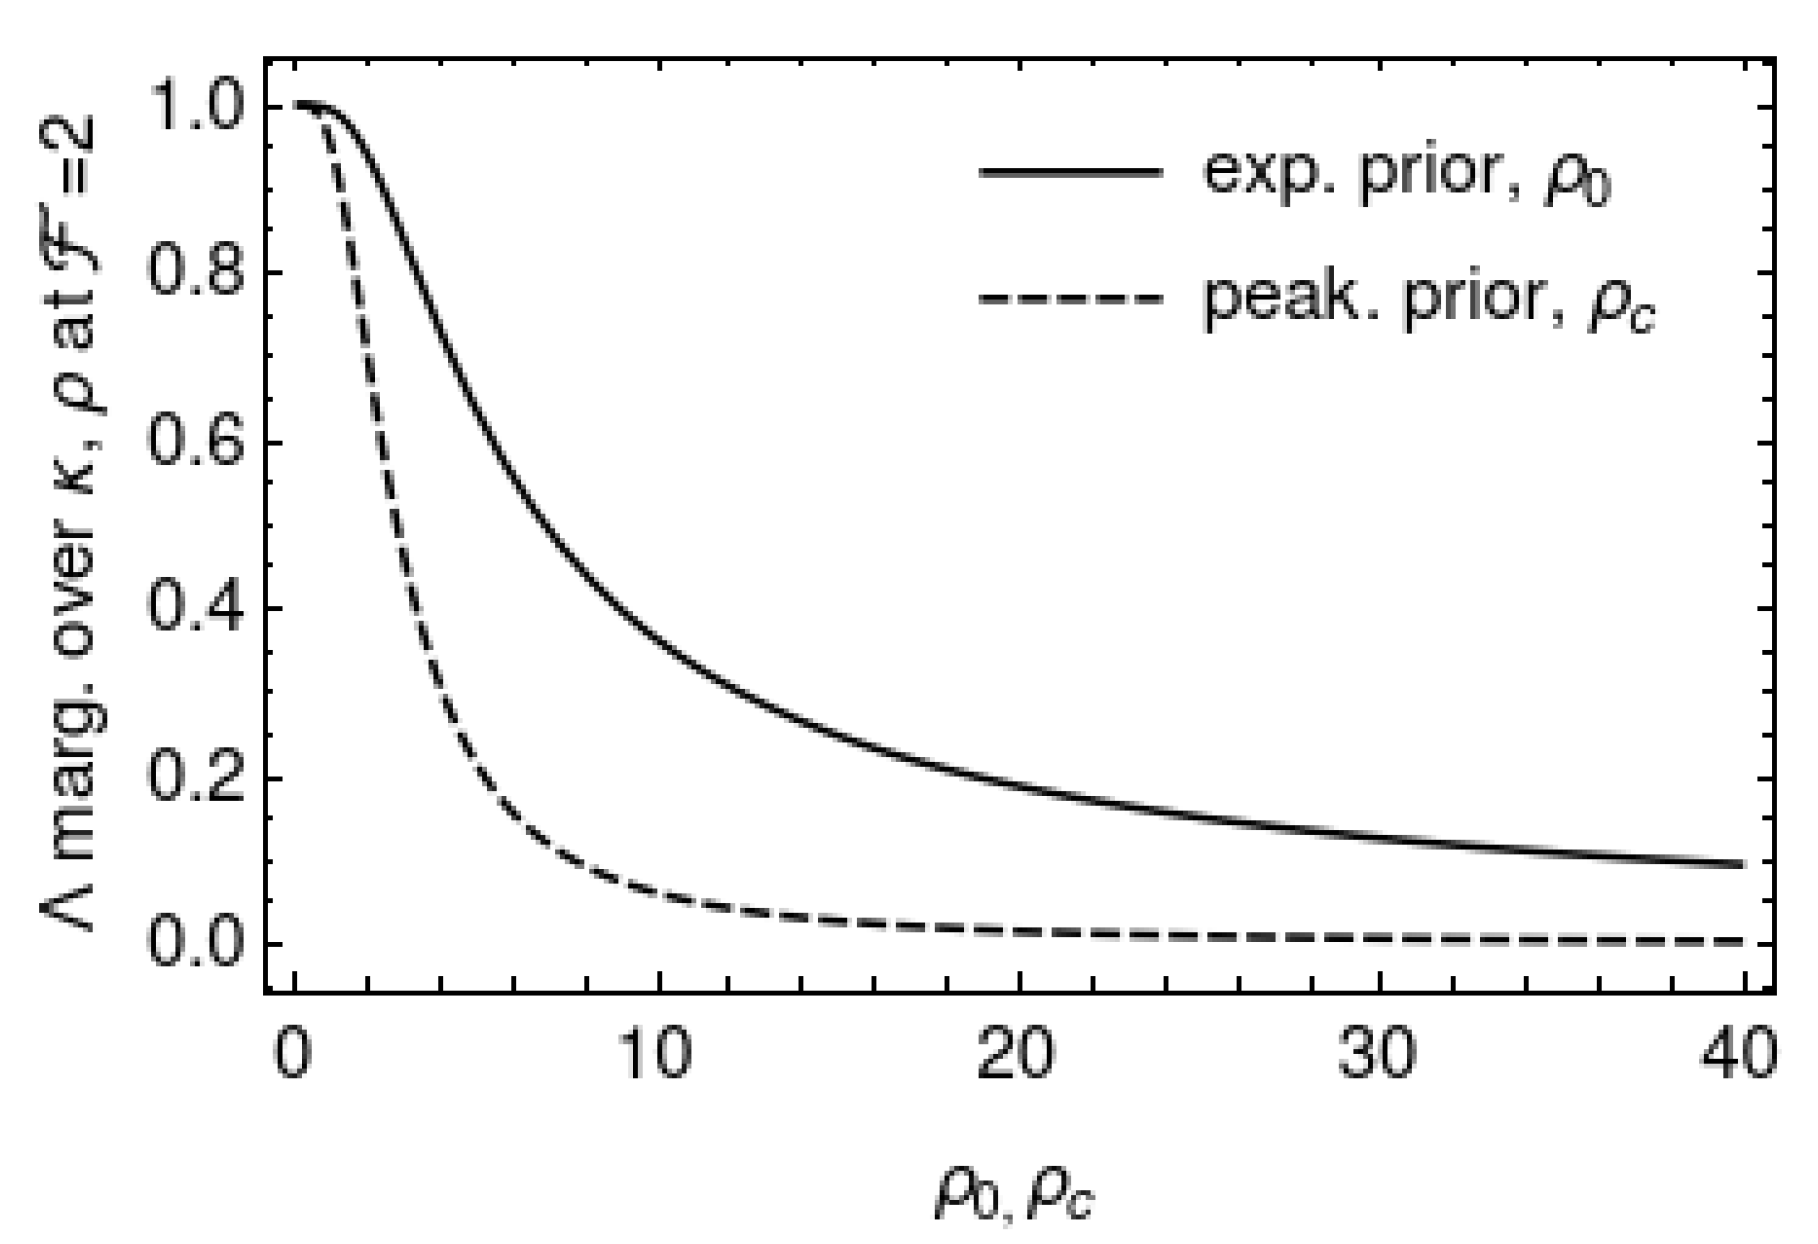
Figure 5 plots the likelihood ratios and marginalised over and with the exponential and peaked priors, respectively, as functions of the priors’ respective parameters and . The likelihoods are evaluated at , the expectation value of assuming no signal is present. The behaviour of the likelihood ratios at gives some indication of which hypothesis is favoured in the absence of evidence for a signal. Both likelihood ratios favour the noise hypothesis () for strictly positive parameter values. The limiting behaviour at zero parameter values are:
4. Receiver–Operator Curves
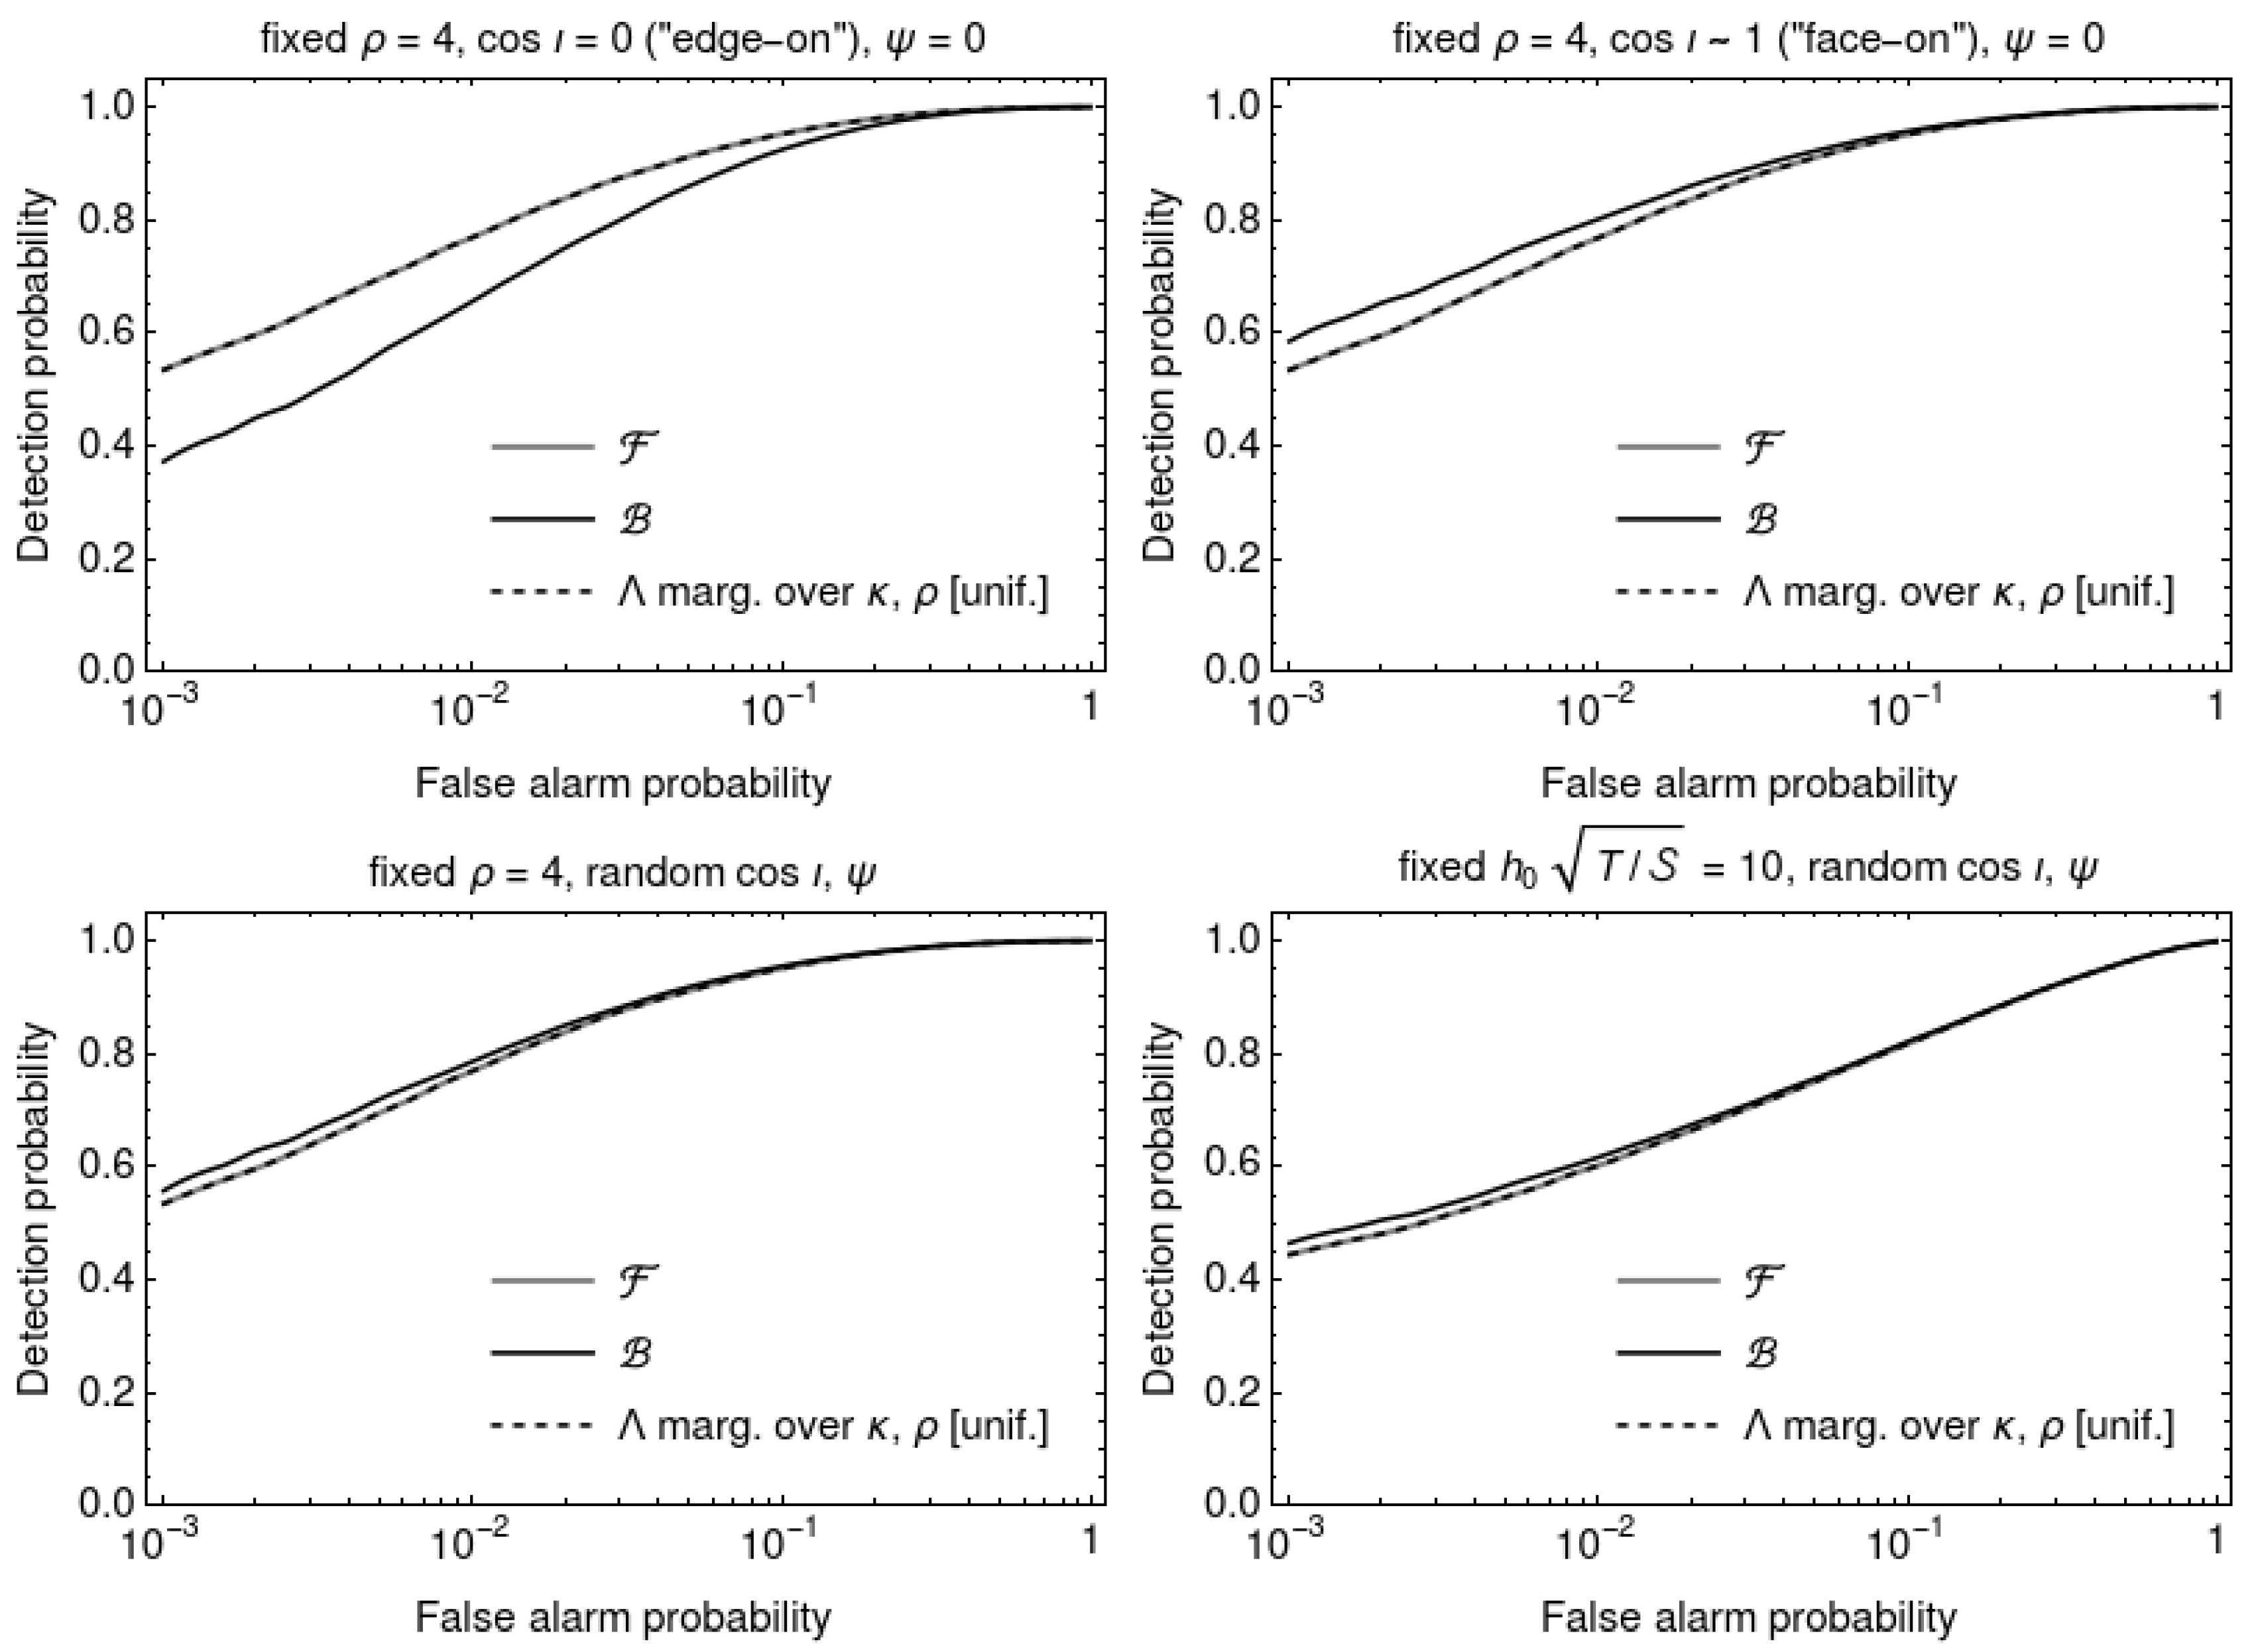
In Section 3.2, all three likelihood ratios marginalised over (Equations (21), (23) and (25)) were found to be strictly increasing functions of . This implies that each marginalised likelihood ratio will have the same detection power as the -statistic.
Detection power is most commonly determined by Monte-Carlo simulations of the detection statistic (e.g., ), in both the absence and presence of a signal. First, a set of random values of is generated, assuming no signal is present. A threshold is determined that gives a chosen false alarm probability, : the fraction of simulated trials where . Then, a second set of random values of is generated, this time assuming the presence of a signal. Finally, the detection probability is determined: the fraction of simulated trials where . The receiver–operator curve is the function . The most powerful detection statistic is that which gives the largest at a given .
If is a strictly increasing function of , then, by definition, implies , and implies . Hence, by applying to all simulated values of , the transformed threshold will yield the same false alarm and detection probabilities, and therefore will have the same detection power as .
To confirm, receiver–operator curves are computed for the -statistic, -statistic, and the likelihood ratio marginalised over and with the uniform prior on . Following [36], the elements of are fixed at , , , and , and four signal populations are chosen:
- (i)
- fixed , (i.e., the neutron star is viewed “edge-on”), ;
- (ii)
- fixed , 3 (i.e., the neutron star is viewed “face-on”), ;
- (iii)
- fixed , randomly drawn , ; and
- (iv)
- fixed , randomly drawn , ;
where h. For all signal populations, was randomly chosen from . For the no-signal population, and for each of the signal populations, random values of and were generated using the program lalapps_synthesizeBstatMC from the software package LALSuite [52]; values of were then computed from using Equation (21).
Figure 6 shows receiver–operator curves for the four signal populations listed above. The curves for the -statistic and -statistic reproduce Figures 2 and 3 of [36]. The curves for overlay the corresponding curves for , confirming that has identical detection power to the -statistic. Receiver–operator curves for , and were computed, for various choices of and , respectively, and were found to be identical to the curve for .
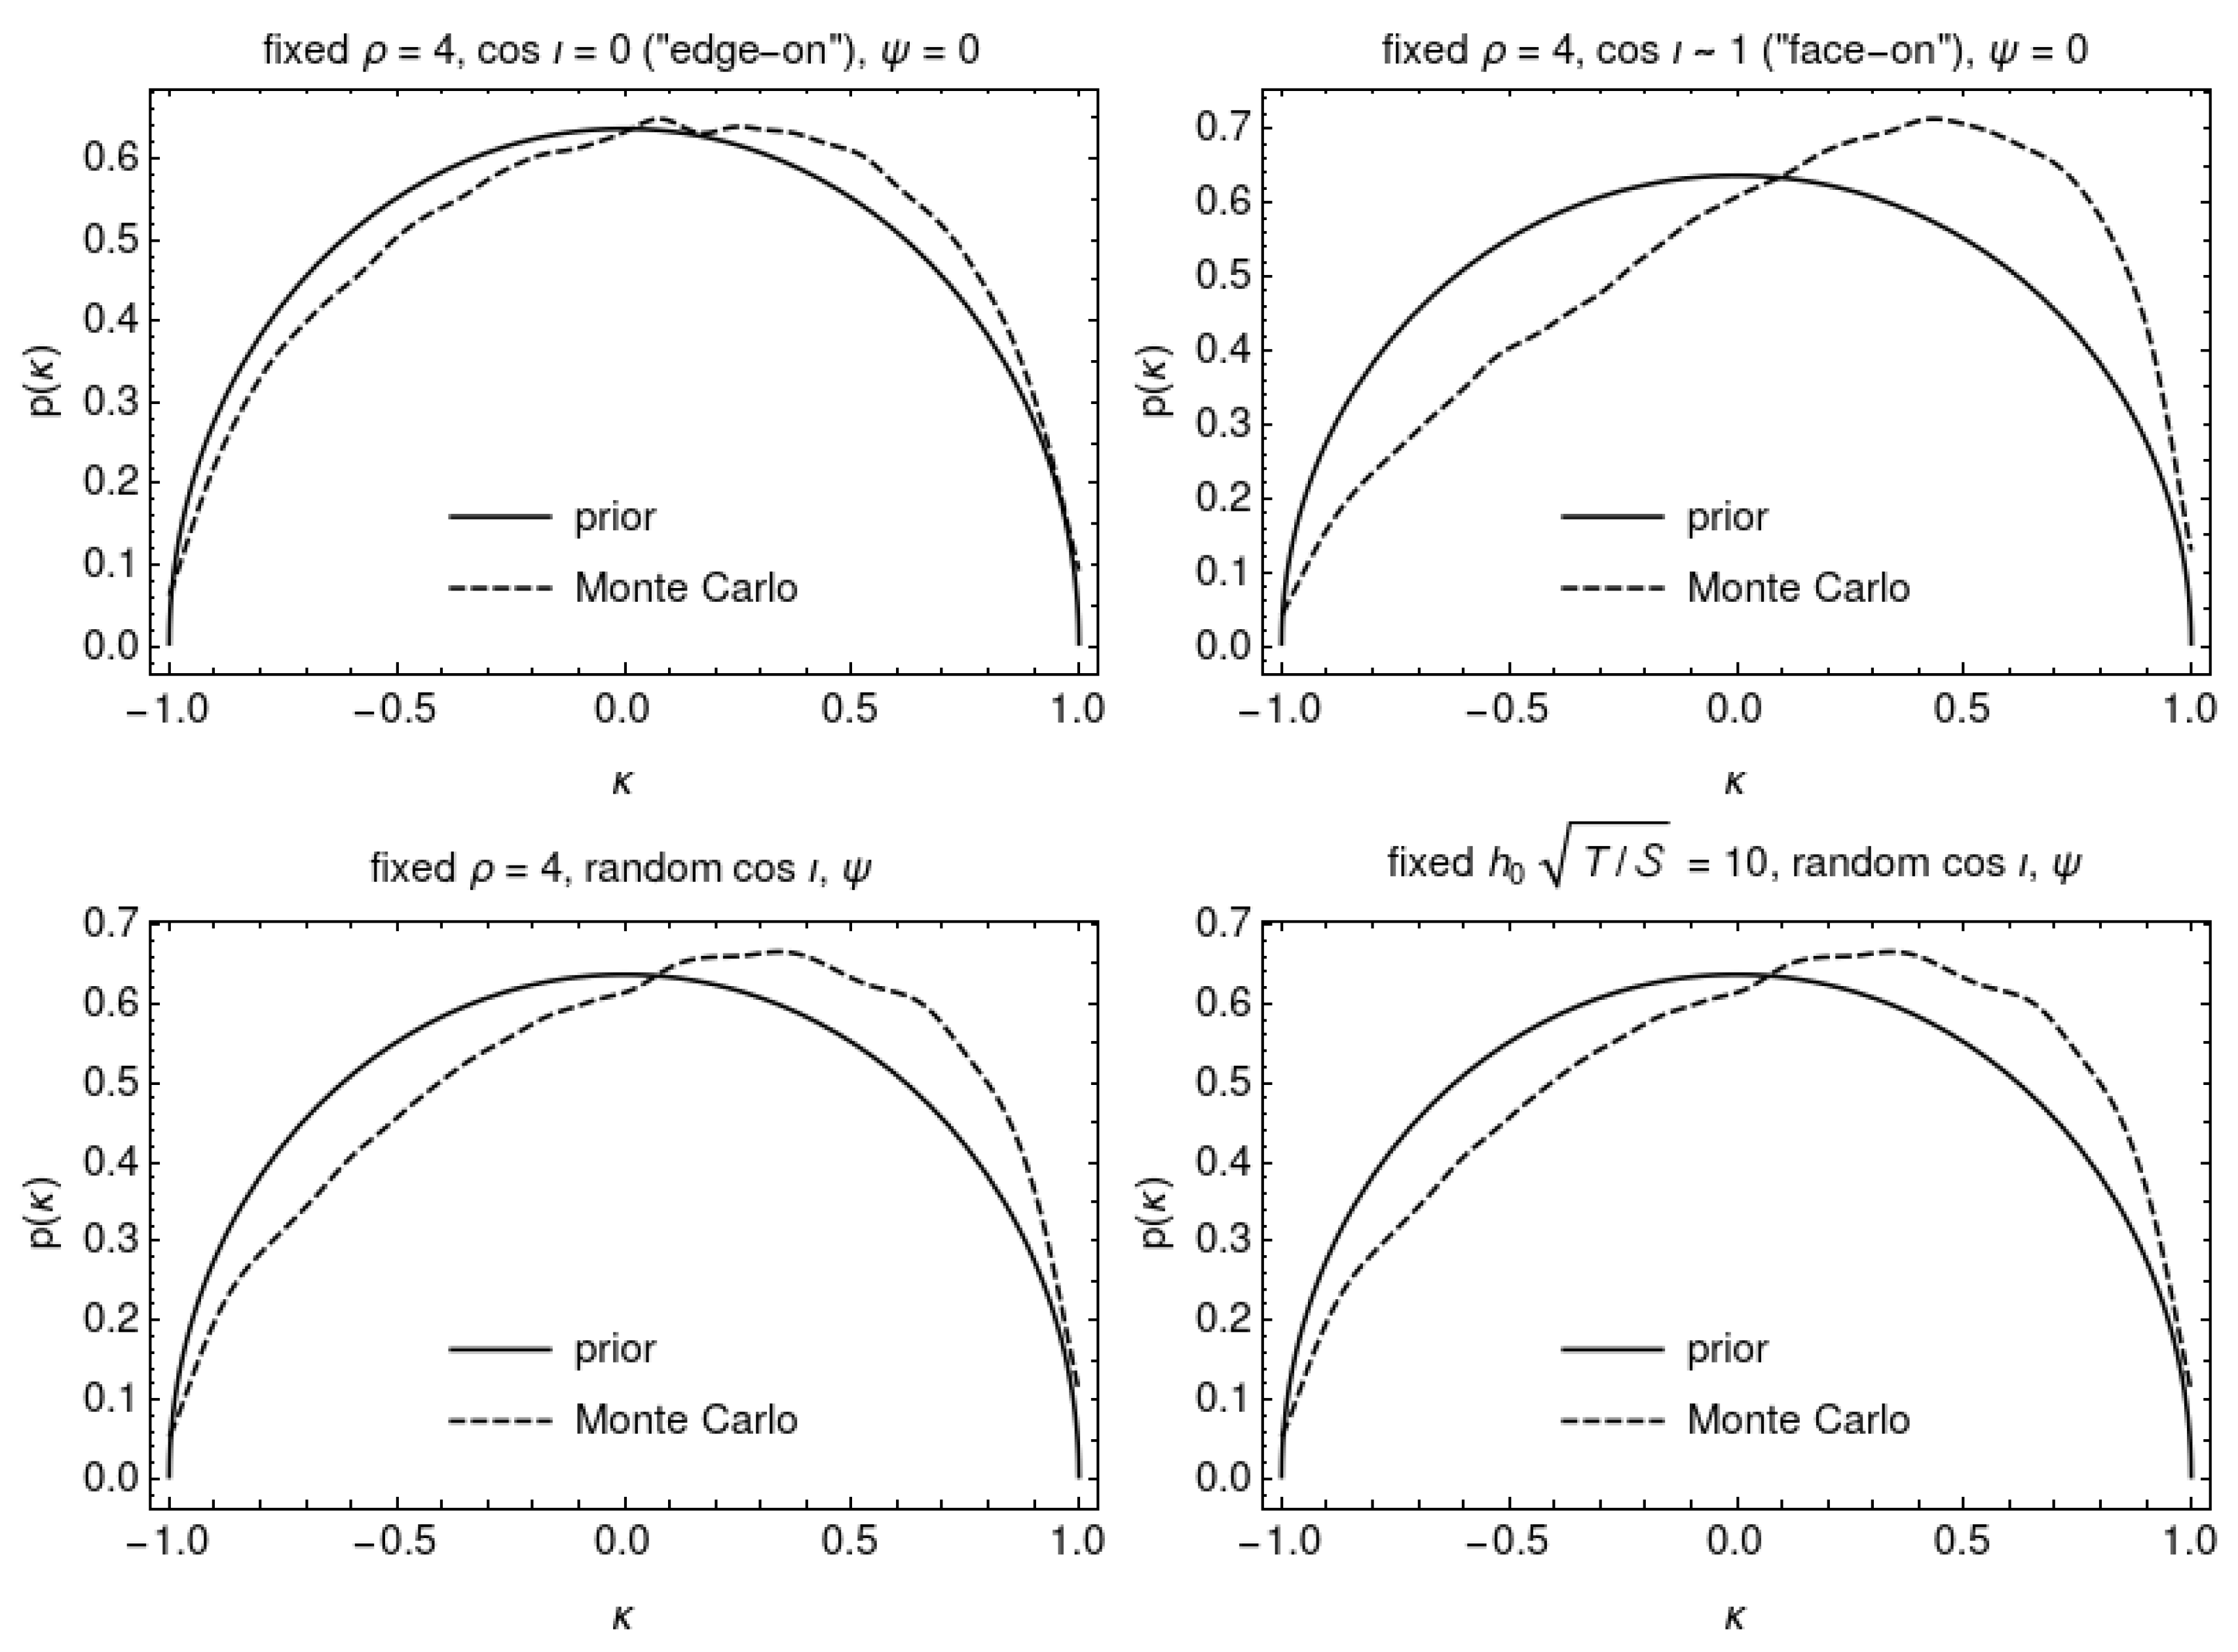
Figure 7 compares the distribution of computed from the Monte-Carlo samples using Equation (11) with the assumed prior of Equation (18). The Monte-Carlo distribution is a good fit to the prior for , and a poor fit for ; for the two signal populations where was randomly drawn, the fit is intermediate between the two extremes. This suggests that the initial choice of prior on , which assumed no preferred orientation between the vectors and , is biased in favour of linearly polarised signals. This is consistent with being of equivalent detection power to the -statistic, which, as noted in [36], is also biased in favour of linearly polarised signals.
5. Discussion
This paper presents an alternative approach (cf. [40,41,42,43]) to analytically marginalising the likelihood ratio used in continuous wave searches. Marginalised likelihood ratios were derived assuming a prior on , and for example priors on . The expressions for the marginalised likelihood ratios are in analytic form, involving only exponential and Bessel functions. Receiver–operator curves show that the marginalised likelihood ratios have the same detection power as the -statistic, being strictly increasing functions of .
The marginalised likelihood ratios fail to capture the additional detection power of the -statistic for signal populations with randomly drawn . That said, as shown in [36] and reproduced in Figure 6, the advantage of the -statistic over the -statistic appears to be slight. A slightly higher detection probability, from using using the -statistic instead of the -statistic, corresponds to slightly smaller at which continuous waves can be detected at a given confidence .
This small difference, however, could well be relatively insignificant; for example, it could be within the error in due to the calibration uncertainty of gravitational wave detectors [53]. Computationally efficient implementations of detection statistics, as exist for the -statistic, are essential for wide-parameter-space, computationally-costly searches. To date, the advantage of the -statistic in terms of detection power have not outweighed its disadvantage in terms of computational efficiency, and no wide-parameter-space search for continuous wave has been performed by computing the -statistic directly.
It should also be noted that the -statistic, as presented in [36], assumes a particular emission model for continuous waves: the triaxial model, where the neutron star radiates at twice its rotation frequency, and the amplitudes of the “plus” and “cross” polarisations are given by and , respectively. In the absence of a continuous wave detection, however, one cannot be certain whether this is the correct emission model. Continuous wave radiation at other frequencies [54,55,56] are modelled by different expressions for the “plus” and “cross” polarisations in terms of , , and other parameters.
It is possible that the detection power of the marginalised likelihood ratios could be improved by a different choice of prior on . As seen in Figure 7, the prior initially assumed in Section 3.1 is not necessarily a good fit, depending on the distribution of . If a simple analytic expression for the distribution of computed from the Monte-Carlo samples could be determined—either from first principles, or simply as an empirical fit—it is possible that the likelihood ratio marginalised over could still be expressed analytically.
In marginalising the likelihood ratio over the parameters and , it was assumed that the priors on these variables, and , were independent. Figure 7, however, shows that the prior on should be a function of , and since also depends on , a joint prior might be needed in order to increase the detection power beyond the -statistic. It is unclear, however, whether a simple but physically motivated joint prior could be found that still permits analytic marginalisation of the likelihood ratio. A joint prior would also make it more difficult to change the prior on , should one wish to consider different models for the population of continuous wave signals.
Even if the parameterisation of the likelihood ratio in terms of , , and does not prove a fruitful route to obtaining an analytic expression for the -statistic, it could nevertheless provide a useful method of incorporating the -statistic into a Bayesian framework. The marginalised likelihood ratios presented in Section 3 are readily computed, as they are a function only of the -statistic and well-known special functions. These are able to harness the computational efficiency of existing implementations of the -statistic, while permitting an assumption of a prior on that is more physically reasonable than the prior implicit in the -statistic, which is biased toward stronger signals [36]. More physically reasonable priors on than the examples explored here, such as the Fermi–Dirac prior of [57], could be amenable to analytic marginalisation through this approach.
An example of where a Bayesian treatment of the -statistic could be interesting is inferring properties of the population of Galactic neutron stars. While methods have been proposed for inferring properties from an ensemble of known pulsars [58,59], a similar framework does not yet exist for wide-parameter-space searches. Traditionally, such searches have computed an upper limit on satisfying the following property: given a false alarm probability (typically 1%, taking into account the trials factor of the search), and assuming a population of signals with constant (and other parameters chosen at random from physical priors), a high fraction of the signal population (typically 90–95%) would have been detected. It is not expected, however, that the population of Galactic neutron stars are all radiating gravitational waves at the same , and it is not clear what may be inferred from the upper limit on .
Perhaps, instead, a framework could be developed to compute posteriors on the parameters of an assumed model for the distribution of ; for example, assuming the exponential prior of of Equation (22), and inferring the posterior on its parameter from a wide-parameter-space search. The approach to marginalisation of the likelihood ratio presented in this paper might provide a route toward constructing this framework.
Funding
This research was supported by the Australian Research Council Centre of Excellence for Gravitational Wave Discovery (OzGrav) through project number CE170100004.
Acknowledgments
Conflicts of Interest
The author declares no conflict of interest.
| 1. | The dot product henceforth denotes the contraction of the last index of the tensor with the first index of the tensor . |
| 2. | It is common in the literature to quote values of twice the -statistic, i.e., . This convention is not followed in this paper, however. |
| 3. | This choice of follows that of [36]. |
References
- LIGO Scientific Collaboration; Aasi, J.; Abbott, B.P.; Abbott, R.; Abbott, T.; Abernathy, M.R.; Ackley, K.; Adams, C.; Adams, T.; Addesso, P.; et al. Advanced LIGO. Class. Quantum Gravity 2015, 32, 074001. [Google Scholar] [CrossRef]
- Acernese, F.; Adams, T.; Agatsuma, K.; Aiello, L.; Allocca, A.; Amato, A.; Antier, S.; Arnaud, N.; Ascenzi, S.; Astone, P.; et al. Status of Advanced Virgo. Eur. Phys. J. Web Conf. 2018, 182, 02003. [Google Scholar] [CrossRef]
- KAGRA Collaboration, LIGO Scientific Collaboration, and Virgo Collaboration; Abbott, B.P.; Abbott, R.; Abbott, T.D.; Abraham, S.; Acernese, F.; Ackley, K.; Adams, C.; Adya, V.B.; Affeldt, C.; et al. Prospects for observing and localizing gravitational-wave transients with Advanced LIGO, Advanced Virgo and KAGRA. Living Rev. Relativ. 2020, 23, 3. [Google Scholar] [CrossRef] [PubMed]
- LIGO Scientific Collaboration and Virgo Collaboration; Abbott, B.P.; Abbott, R.; Abbott, T.D.; Abraham, S.; Acernese, F.; Ackley, K.; Adams, C.; Adhikari, R.X.; Adya, V.B.; et al. All-sky search for continuous gravitational waves from isolated neutron stars using Advanced LIGO O2 data. Phys. Rev. D 2019, 100, 024004. [Google Scholar] [CrossRef] [Green Version]
- LIGO Scientific Collaboration and Virgo Collaboration; Abbott, B.P.; Abbott, R.; Abbott, T.D.; Abraham, S.; Acernese, F.; Ackley, K.; Adams, C.; Adhikari, R.X.; Adya, V.; et al. Narrow-band search for gravitational waves from known pulsars using the second LIGO observing run. Phys. Rev. D 2019, 99, 122002. [Google Scholar] [CrossRef] [Green Version]
- LIGO Scientific Collaboration and Virgo Collaboration; Abbott, B.P.; Abbott, R.; Abbott, T.D.; Abraham, S.; Acernese, F.; Ackley, K.; Adams, C.; Adhikari, R.X.; Adya, V.; et al. Search for gravitational waves from Scorpius X-1 in the second Advanced LIGO observing run with an improved hidden Markov model. Phys. Rev. D 2019, 100, 122002. [Google Scholar] [CrossRef]
- LIGO Scientific Collaboration and Virgo Collaboration; Abbott, B.P.; Abbott, R.; Abbott, T.D.; Abraham, S.; Acernese, F.; Ackley, K.; Adams, C.; Adhikari, R.X.; Adya, V.; et al. Searches for Gravitational Waves from Known Pulsars at Two Harmonics in 2015–2017 LIGO Data. Astrophys. J. 2019, 879, 10. [Google Scholar] [CrossRef] [Green Version]
- Palomba, C.; D’Antonio, S.; Astone, P.; Frasca, S.; Intini, G.; La Rosa, I.; Leaci, P.; Mastrogiovanni, S.; Miller, A.L.; Muciaccia, F.; et al. Direct Constraints on the Ultralight Boson Mass from Searches of Continuous Gravitational Waves. Phys. Rev. Lett. 2019, 123, 171101. [Google Scholar] [CrossRef] [PubMed] [Green Version]
- Covas, P.B.; Sintes, A.M. First All-Sky Search for Continuous Gravitational-Wave Signals from Unknown Neutron Stars in Binary Systems Using Advanced LIGO Data. Phys. Rev. Lett. 2020, 124, 191102. [Google Scholar] [CrossRef] [PubMed]
- Dergachev, V.; Papa, M.A. Results from the First All-Sky Search for Continuous Gravitational Waves from Small-Ellipticity Sources. Phys. Rev. Lett. 2020, 125, 171101. [Google Scholar] [CrossRef]
- Fesik, L.; Papa, M.A. First Search for r-mode Gravitational Waves from PSR J0537-6910. Astrophys. J. 2020, 895, 11. [Google Scholar] [CrossRef]
- Lindblom, L.; Owen, B.J. Directed searches for continuous gravitational waves from twelve supernova remnants in data from Advanced LIGO’s second observing run. Phys. Rev. D 2020, 101, 083023. [Google Scholar] [CrossRef] [Green Version]
- Middleton, H.; Clearwater, P.; Melatos, A.; Dunn, L. Search for gravitational waves from five low mass X-ray binaries in the second Advanced LIGO observing run with an improved hidden Markov model. Phys. Rev. D 2020, 102, 023006. [Google Scholar] [CrossRef]
- Millhouse, M.; Strang, L.; Melatos, A. Search for gravitational waves from 12 young supernova remnants with a hidden Markov model in Advanced LIGO’s second observing run. Phys. Rev. D 2020, 102, 083025. [Google Scholar] [CrossRef]
- Piccinni, O.J.; Astone, P.; D’Antonio, S.; Frasca, S.; Intini, G.; La Rosa, I.; Leaci, P.; Mastrogiovanni, S.; Miller, A.; Palomba, C. Directed search for continuous gravitational-wave signals from the Galactic Center in the Advanced LIGO second observing run. Phys. Rev. D 2020, 101, 082004. [Google Scholar] [CrossRef]
- Sun, L.; Brito, R.; Isi, M. Search for ultralight bosons in Cygnus X-1 with Advanced LIGO. Phys. Rev. D 2020, 101, 063020. [Google Scholar] [CrossRef] [Green Version]
- Zhang, Y.; Papa, M.A.; Krishnan, B.; Watts, A.L. Search for Continuous Gravitational Waves from Scorpius X-1 in LIGO O2 Data. Astrophys. J. Lett. 2021, 906, L14. [Google Scholar] [CrossRef]
- Jones, D.; Sun, L. Search for continuous gravitational waves from Fomalhaut b in the second Advanced LIGO observing run with a hidden Markov model. Phys. Rev. D 2021, 103, 023020. [Google Scholar] [CrossRef]
- Beniwal, D.; Clearwater, P.; Dunn, L.; Melatos, A.; Ottaway, D. Search for continuous gravitational waves from ten H.E.S.S. sources using a hidden Markov model. Phys. Rev. D 2021, 103, 083009. [Google Scholar] [CrossRef]
- Wette, K.; Dunn, L.; Clearwater, P.; Melatos, A. Deep exploration for continuous gravitational waves at 171–172 Hz in LIGO second observing run data. Phys. Rev. D 2021, 103, 083020. [Google Scholar] [CrossRef]
- LIGO Scientific Collaboration and Virgo Collaboration; Abbott, R.; Abbott, T.D.; Abraham, S.; Acernese, F.; Ackley, K.; Adams, A.; Adams, C.; Adhikari, R.X.; Adya, V.B.; et al. Gravitational-wave Constraints on the Equatorial Ellipticity of Millisecond Pulsars. Astrophys. J. 2020, 902, L21. [Google Scholar] [CrossRef]
- LIGO Scientific Collaboration and Virgo Collaboration; Abbott, R.; Abbott, T.D.; Abraham, S.; Acernese, F.; Ackley, K.; Adams, A.; Adams, C.; Adhikari, R.X.; Adya, V.B.; et al. All-sky search in early O3 LIGO data for continuous gravitational-wave signals from unknown neutron stars in binary systems. Phys. Rev. D 2021, 103, 064017. [Google Scholar] [CrossRef]
- Bonazzola, S.; Gourgoulhon, E. Gravitational waves from pulsars: Emission by the magnetic field induced distortion. Astron. Astrophys. 1996, 312, 675. [Google Scholar]
- Ushomirsky, G.; Cutler, C.; Bildsten, L. Deformations of accreting neutron star crusts and gravitational wave emission. Mon. Not. R. Astron. Soc. 2000, 319, 902. [Google Scholar] [CrossRef] [Green Version]
- Owen, B.J. Maximum Elastic Deformations of Compact Stars with Exotic Equations of State. Phys. Rev. Lett. 2005, 95, 211101. [Google Scholar] [CrossRef] [Green Version]
- Haskell, B.; Samuelsson, L.; Glampedakis, K.; Andersson, N. Modelling magnetically deformed neutron stars. Mon. Not. R. Astron. Soc. 2008, 385, 531. [Google Scholar] [CrossRef] [Green Version]
- Glampedakis, K.; Jones, D.I.; Samuelsson, L. Gravitational Waves from Color-Magnetic “Mountains” in Neutron Stars. Phys. Rev. Lett. 2012, 109, 081103. [Google Scholar] [CrossRef] [Green Version]
- Johnson-McDaniel, N.K.; Owen, B.J. Maximum elastic deformations of relativistic stars. Phys. Rev. D 2013, 88, 044004. [Google Scholar] [CrossRef] [Green Version]
- Woan, G.; Pitkin, M.D.; Haskell, B.; Jones, D.I.; Lasky, P.D. Evidence for a Minimum Ellipticity in Millisecond Pulsars. Astrophys. J. 2018, 863, L40. [Google Scholar] [CrossRef]
- Osborne, E.L.; Jones, D.I. Gravitational waves from magnetically induced thermal neutron star mountains. Mon. Not. R. Astron. Soc. 2020, 494, 2839–2850. [Google Scholar] [CrossRef]
- Neyman, J.; Pearson, E.S. On the Problem of the Most Efficient Tests of Statistical Hypotheses. Philos. Trans. R. Soc. A 1933, 231, 289. [Google Scholar] [CrossRef] [Green Version]
- Jaranowski, P.; Królak, A.; Schutz, B.F. Data analysis of gravitational-wave signals from spinning neutron stars: The signal and its detection. Phys. Rev. D 1998, 58, 063001. [Google Scholar] [CrossRef] [Green Version]
- Thrane, E.; Talbot, C. An introduction to Bayesian inference in gravitational-wave astronomy: Parameter estimation, model selection, and hierarchical models. Publ. Astron. Soc. Aust. 2019, 36, e010. [Google Scholar] [CrossRef] [Green Version]
- Searle, A.C.; Sutton, P.J.; Tinto, M.; Woan, G. Robust Bayesian detection of unmodelled bursts. Class. Quantum Gravity 2008, 25, 114038. [Google Scholar] [CrossRef] [Green Version]
- Searle, A.C. Monte-Carlo and Bayesian techniques in gravitational wave burst data analysis. arXiv 2008, arXiv:0804.1161. [Google Scholar]
- Prix, R.; Krishnan, B. Targeted search for continuous gravitational waves: Bayesian versus maximum-likelihood statistics. Class. Quantum Gravity 2009, 26, 204013. [Google Scholar] [CrossRef] [Green Version]
- Prix, R. The F-Statistic and Its Implementation in ComputeFStatistic_v2; Technical Report T0900149-v5; LIGO: Hanford, WA, USA, 21 June 2011. [Google Scholar]
- Patel, P.; Siemens, X.; Dupuis, R.; Betzwieser, J. Implementation of barycentric resampling for continuous wave searches in gravitational wave data. Phys. Rev. D 2010, 81, 084032. [Google Scholar] [CrossRef] [Green Version]
- Poghosyan, G.; Matta, S.; Streit, A.; Bejger, M.; Królak, A. Architecture, implementation and parallelization of the software to search for periodic gravitational wave signals. Comput. Phys. Commun. 2015, 188, 167–176. [Google Scholar] [CrossRef] [Green Version]
- Dergachev, V. Loosely coherent searches for sets of well-modeled signals. Phys. Rev. D 2012, 85, 062003. [Google Scholar] [CrossRef] [Green Version]
- Whelan, J.T.; Prix, R.; Cutler, C.J.; Willis, J.L. New coordinates for the amplitude parameter space of continuous gravitational waves. Class. Quantum Gravity 2014, 31, 065002. [Google Scholar] [CrossRef] [Green Version]
- Dhurandhar, S.; Krishnan, B.; Willis, J.L. Marginalizing the likelihood function for modeled gravitational wave searches. arXiv 2017, arXiv:1707.08163. [Google Scholar]
- Bero, J.J.; Whelan, J.T. An analytic approximation to the Bayesian detection statistic for continuous gravitational waves. Class. Quantum Gravity 2019, 36, 015013. [Google Scholar] [CrossRef] [Green Version]
- Prix, R. Search for continuous gravitational waves: Metric of the multidetector F-statistic. Phys. Rev. D 2007, 75, 023004. [Google Scholar] [CrossRef] [Green Version]
- Brady, P.R.; Creighton, T.; Cutler, C.; Schutz, B.F. Searching for periodic sources with LIGO. Phys. Rev. D 1998, 57, 2101. [Google Scholar] [CrossRef] [Green Version]
- Balasubramanian, R.; Sathyaprakash, B.S.; Dhurandhar, S.V. Gravitational waves from coalescing binaries: Detection strategies and Monte Carlo estimation of parameters. Phys. Rev. D 1996, 53, 3033. [Google Scholar] [CrossRef] [PubMed] [Green Version]
- Owen, B.J. Search templates for gravitational waves from inspiraling binaries: Choice of template spacing. Phys. Rev. D 1996, 53, 6749. [Google Scholar] [CrossRef] [Green Version]
- Wette, K.; Prix, R. Flat parameter-space metric for all-sky searches for gravitational-wave pulsars. Phys. Rev. D 2013, 88, 123005. [Google Scholar] [CrossRef] [Green Version]
- Królak, A.; Tinto, M.; Vallisneri, M. Optimal filtering of the LISA data. Phys. Rev. D 2004, 70, 022003. [Google Scholar] [CrossRef] [Green Version]
- Whelan, J.T.; Prix, R.; Khurana, D. Improved search for galactic white-dwarf binaries in Mock LISA Data Challenge 1B using an F-statistic template bank. Class. Quantum Gravity 2008, 25, 184029. [Google Scholar] [CrossRef]
- Marsaglia, G. Choosing a Point from the Surface of a Sphere. Ann. Math. Stat. 1972, 43, 645. [Google Scholar] [CrossRef]
- LIGO Scientific Collaboration. LIGO Algorithm Library—LALSuite; LIGO Scientific Collaboration: Hanford, WA, USA, 2018. [Google Scholar] [CrossRef]
- Sun, L.; Goetz, E.; Kissel, J.S.; Betzwieser, J.; Karki, S.; Viets, A.; Wade, M.; Bhattacharjee, D.; Bossilkov, V.; Covas, P.B.; et al. Characterization of systematic error in Advanced LIGO calibration. Class. Quantum Gravity 2020, 37, 225008. [Google Scholar] [CrossRef]
- Zimmermann, M.; Szedenits, E., Jr. Gravitational waves from rotating and precessing rigid bodies—Simple models and applications to pulsars. Phys. Rev. D 1979, 20, 351. [Google Scholar] [CrossRef]
- Owen, B.J.; Lindblom, L.; Cutler, C.; Schutz, B.F.; Vecchio, A.; Andersson, N. Gravitational waves from hot young rapidly rotating neutron stars. Phys. Rev. D 1998, 58, 084020. [Google Scholar] [CrossRef] [Green Version]
- Van Den Broeck, C. The gravitational wave spectrum of non-axisymmetric, freely precessing neutron stars. Class. Quantum Gravity 2005, 22, 1825. [Google Scholar] [CrossRef] [Green Version]
- Pitkin, M.; Isi, M.; Veitch, J.; Woan, G. A nested sampling code for targeted searches for continuous gravitational waves from pulsars. arXiv 2017, arXiv:1705.08978. [Google Scholar]
- Cutler, C.; Schutz, B.F. Generalized F-statistic: Multiple detectors and multiple gravitational wave pulsars. Phys. Rev. D 2005, 72, 063006. [Google Scholar] [CrossRef] [Green Version]
- Pitkin, M.; Messenger, C.; Fan, X. Hierarchical Bayesian method for detecting continuous gravitational waves from an ensemble of pulsars. Phys. Rev. D 2018, 98, 063001. [Google Scholar] [CrossRef] [Green Version]
- Mathematica, Version 12.0; Wolfram Research, Inc.: Champaign, IL, USA, 2019.
Figure 1.
Schematic of the vectors (Equation (6)) and (Equation (7)), their lengths (Equations (9) and (10)), and the cosine of the angle between them (Equation (11)).

Figure 2.
The likelihood ratio marginalised over (Equation (19)). Top: as a function of for fixed values of . Bottom: as a function of for fixed values of .
Figure 2.
The likelihood ratio marginalised over (Equation (19)). Top: as a function of for fixed values of . Bottom: as a function of for fixed values of .

Figure 3.
Top: the exponential prior on (Equation (22)) as a function of , for choices of the parameter . Bottom: the likelihood ratio marginalised over and as a function of , with the exponential prior on (Equation (23)) for choices of , and with the uniform prior (Equation (21)).

Figure 4.
Top: the peaked prior on (Equation (24)) as a function of , for choices of the parameter . Bottom: the likelihood ratio marginalised over and as a function of , with the peaked prior on (Equation (25)) for choices of , and with the uniform prior (Equation (21)).

Figure 5.
The likelihood ratios marginalised over and with the exponential (Equation (23)) and peaked (Equation (25)) priors, as functions of the priors’ respective parameters and , at fixed .

Figure 6.
Receiver–operator curves for the -statistic, -statistic, and the likelihood ratio marginalised over and with the uniform prior on (Equation (21)), for four signal populations (see text). The curves for overlay those for .
Figure 6.
Receiver–operator curves for the -statistic, -statistic, and the likelihood ratio marginalised over and with the uniform prior on (Equation (21)), for four signal populations (see text). The curves for overlay those for .

Figure 7.
Distribution of computed from the Monte-Carlo samples compared to the assumed prior (Equation (18)), for four signal populations (see text). For plotting purposes, the Monte-Carlo curves are smoothed with a Gaussian kernel.
Figure 7.
Distribution of computed from the Monte-Carlo samples compared to the assumed prior (Equation (18)), for four signal populations (see text). For plotting purposes, the Monte-Carlo curves are smoothed with a Gaussian kernel.

Publisher’s Note: MDPI stays neutral with regard to jurisdictional claims in published maps and institutional affiliations. |
© 2021 by the author. Licensee MDPI, Basel, Switzerland. This article is an open access article distributed under the terms and conditions of the Creative Commons Attribution (CC BY) license (https://creativecommons.org/licenses/by/4.0/).
Share and Cite
MDPI and ACS Style
Wette, K. Geometric Approach to Analytic Marginalisation of the Likelihood Ratio for Continuous Gravitational Wave Searches. Universe 2021, 7, 174. https://doi.org/10.3390/universe7060174
AMA Style
Wette K. Geometric Approach to Analytic Marginalisation of the Likelihood Ratio for Continuous Gravitational Wave Searches. Universe. 2021; 7(6):174. https://doi.org/10.3390/universe7060174
Chicago/Turabian StyleWette, Karl. 2021. "Geometric Approach to Analytic Marginalisation of the Likelihood Ratio for Continuous Gravitational Wave Searches" Universe 7, no. 6: 174. https://doi.org/10.3390/universe7060174
Note that from the first issue of 2016, this journal uses article numbers instead of page numbers. See further details here.