
Epidemiological Profile and Spatial Patterns of Enterobiasis in Children Aged 3–9 Years in China from 2016 to 2020

 ,
,
Abstract
:1. Introduction
2. Methods
2.1. Sampling
2.2. Detection of Infection
2.3. Database and Statistical Analysis
2.4. Spatial Autocorrelation Analysis
2.5. Spatio-Temporal Analysis
3. Results
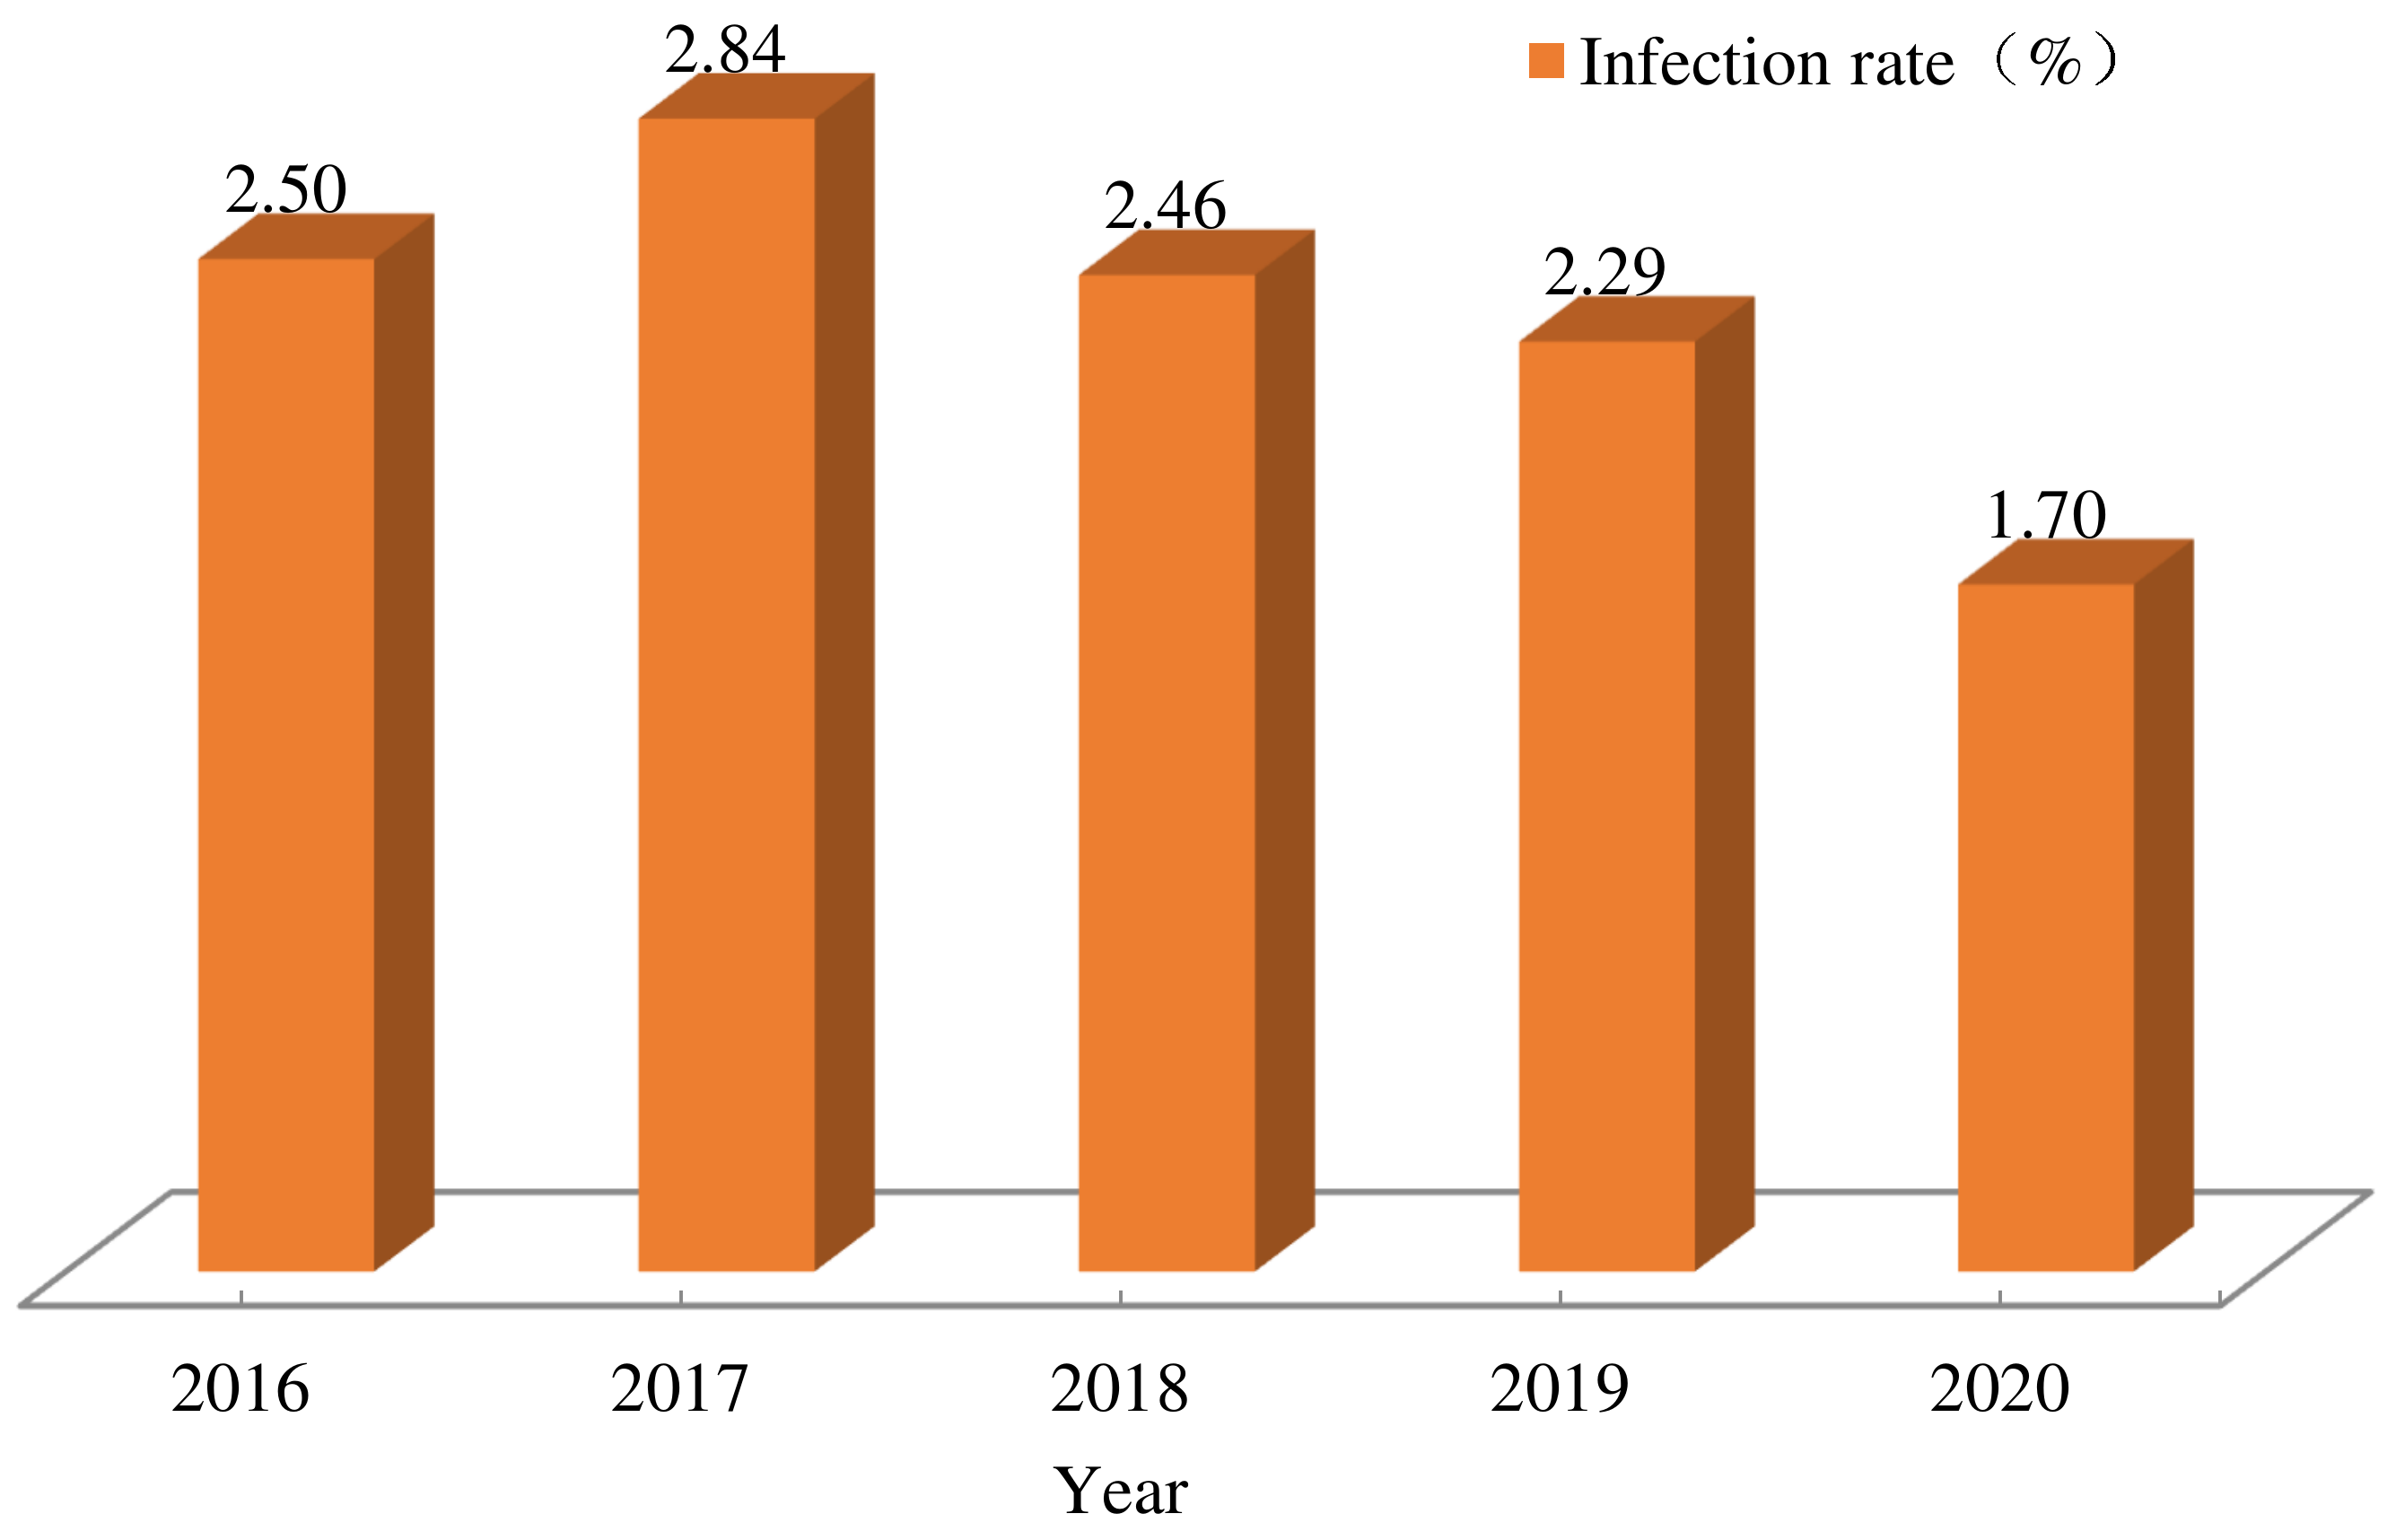
3.1. Overall Infection
3.2. Regional Distribution
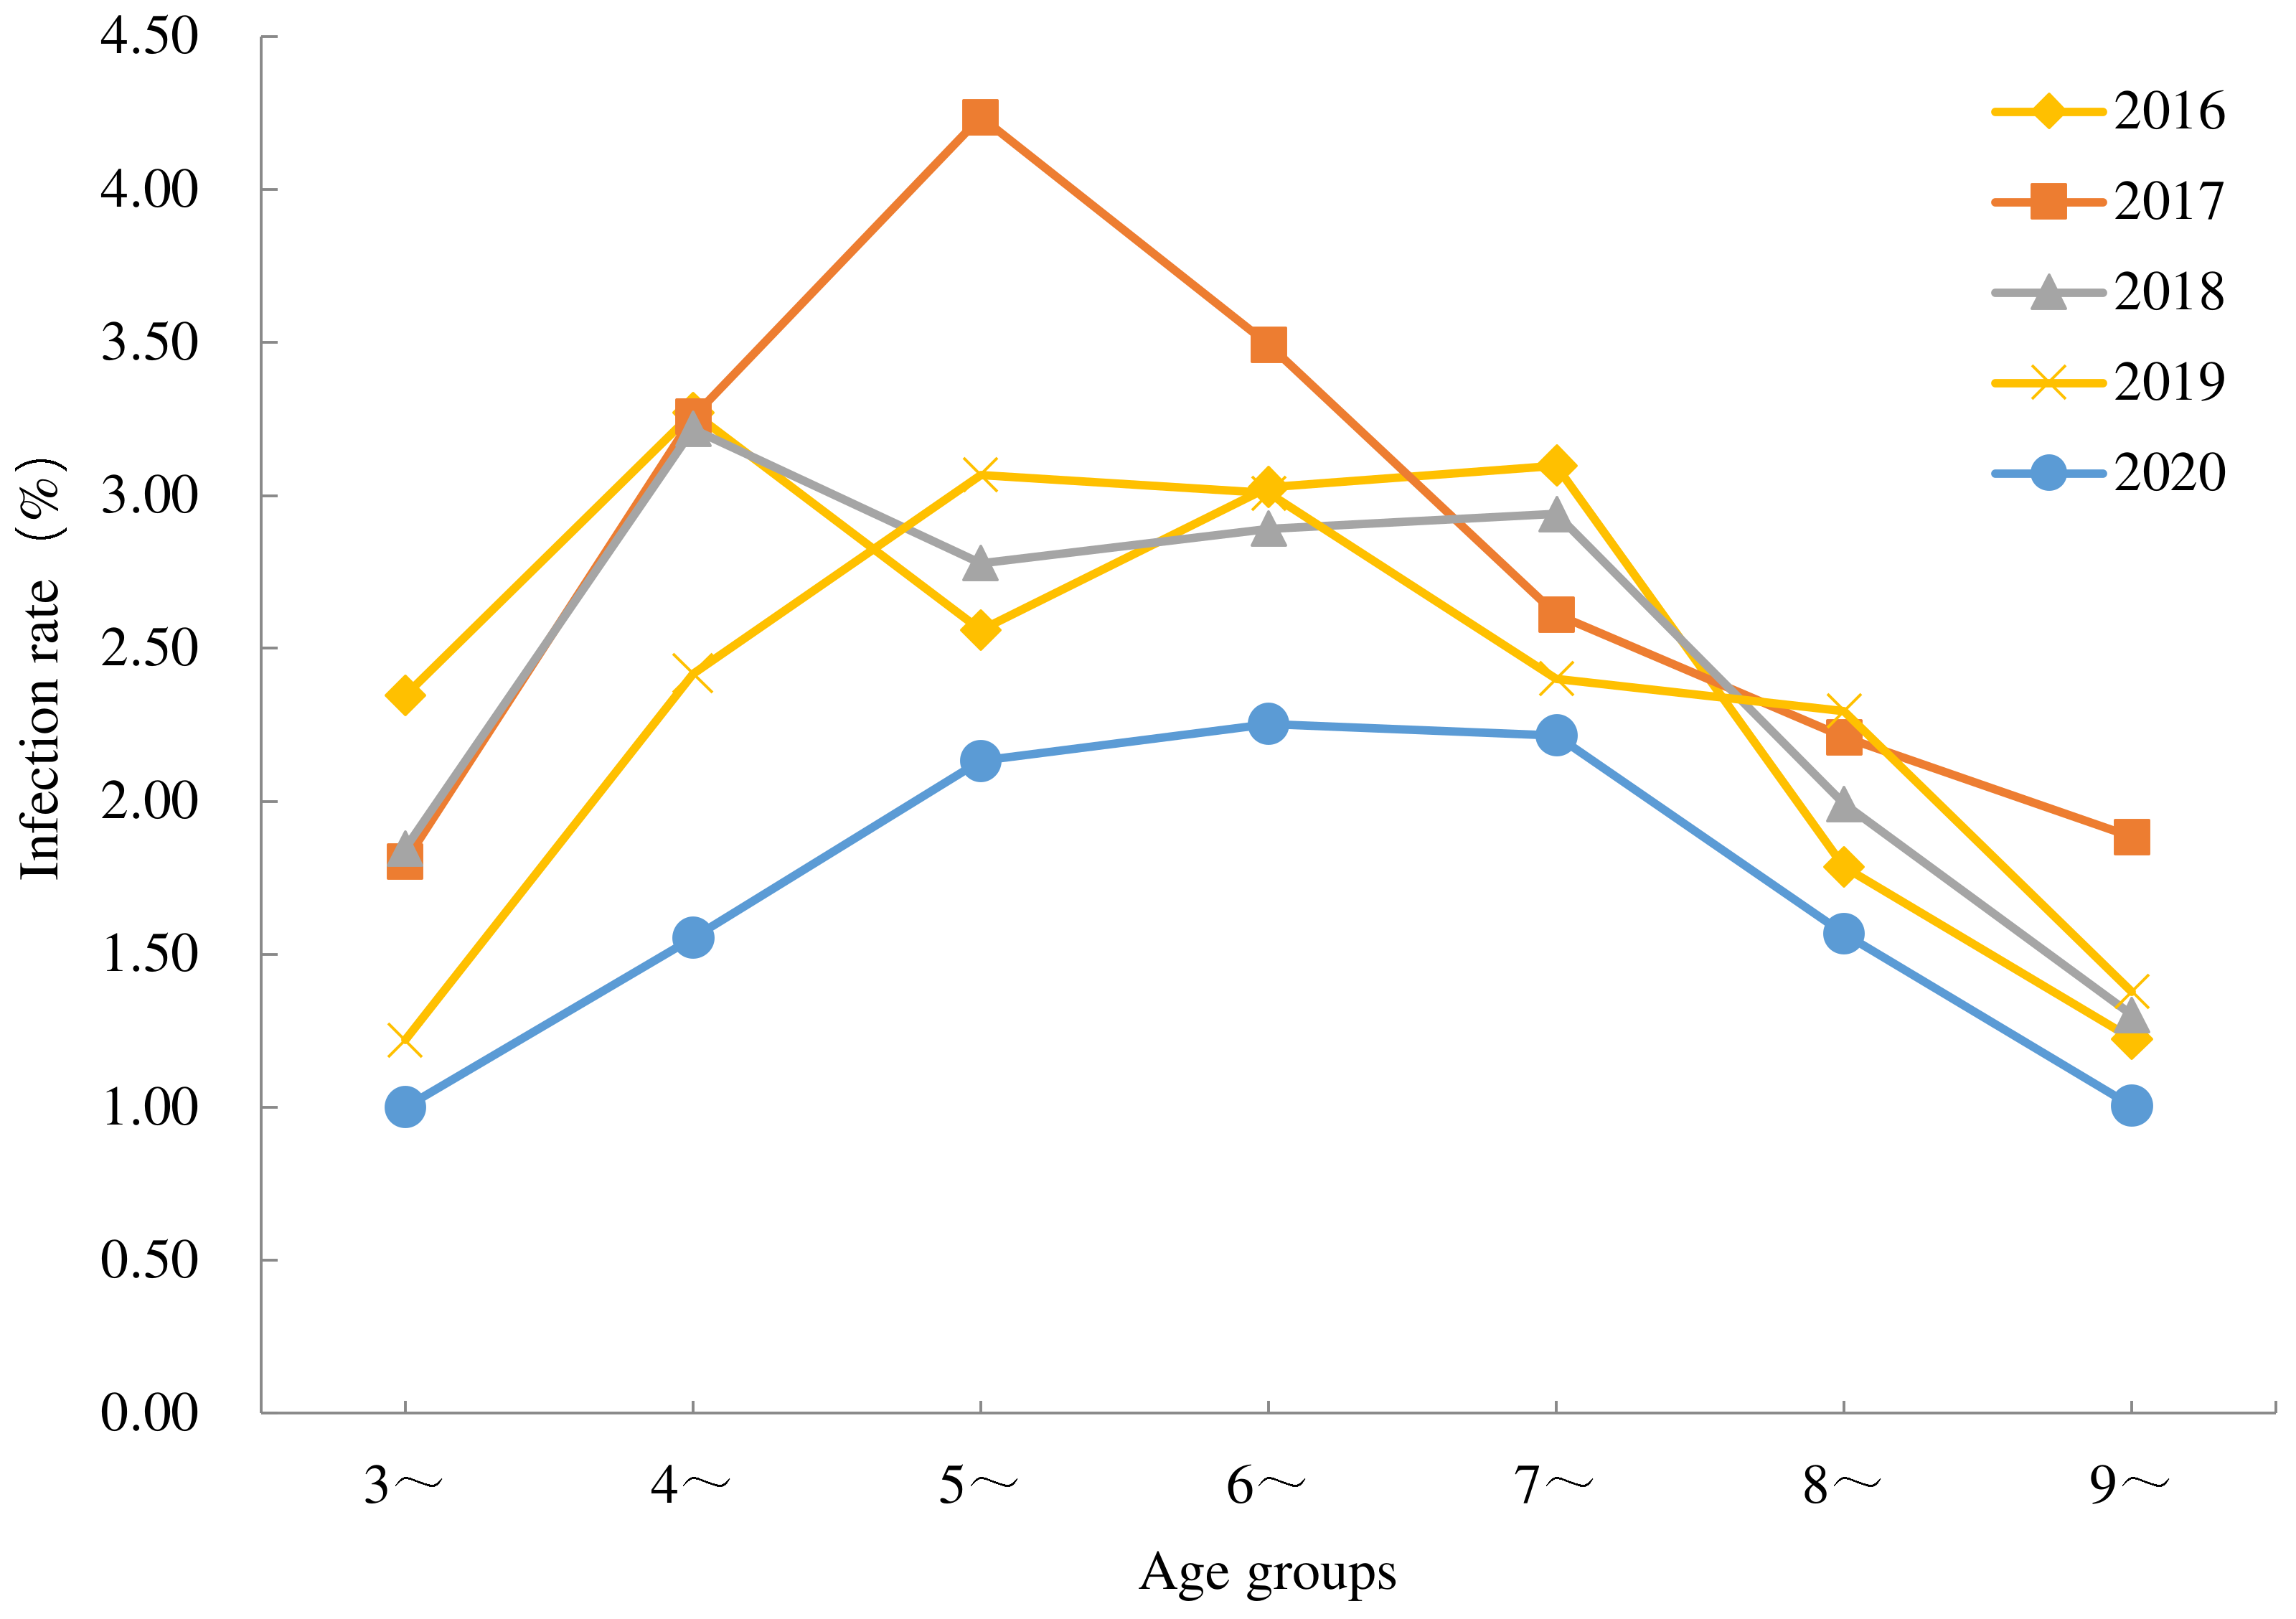
3.3. Population Distribution
3.4. Global Spatial Autocorrelation Analysis
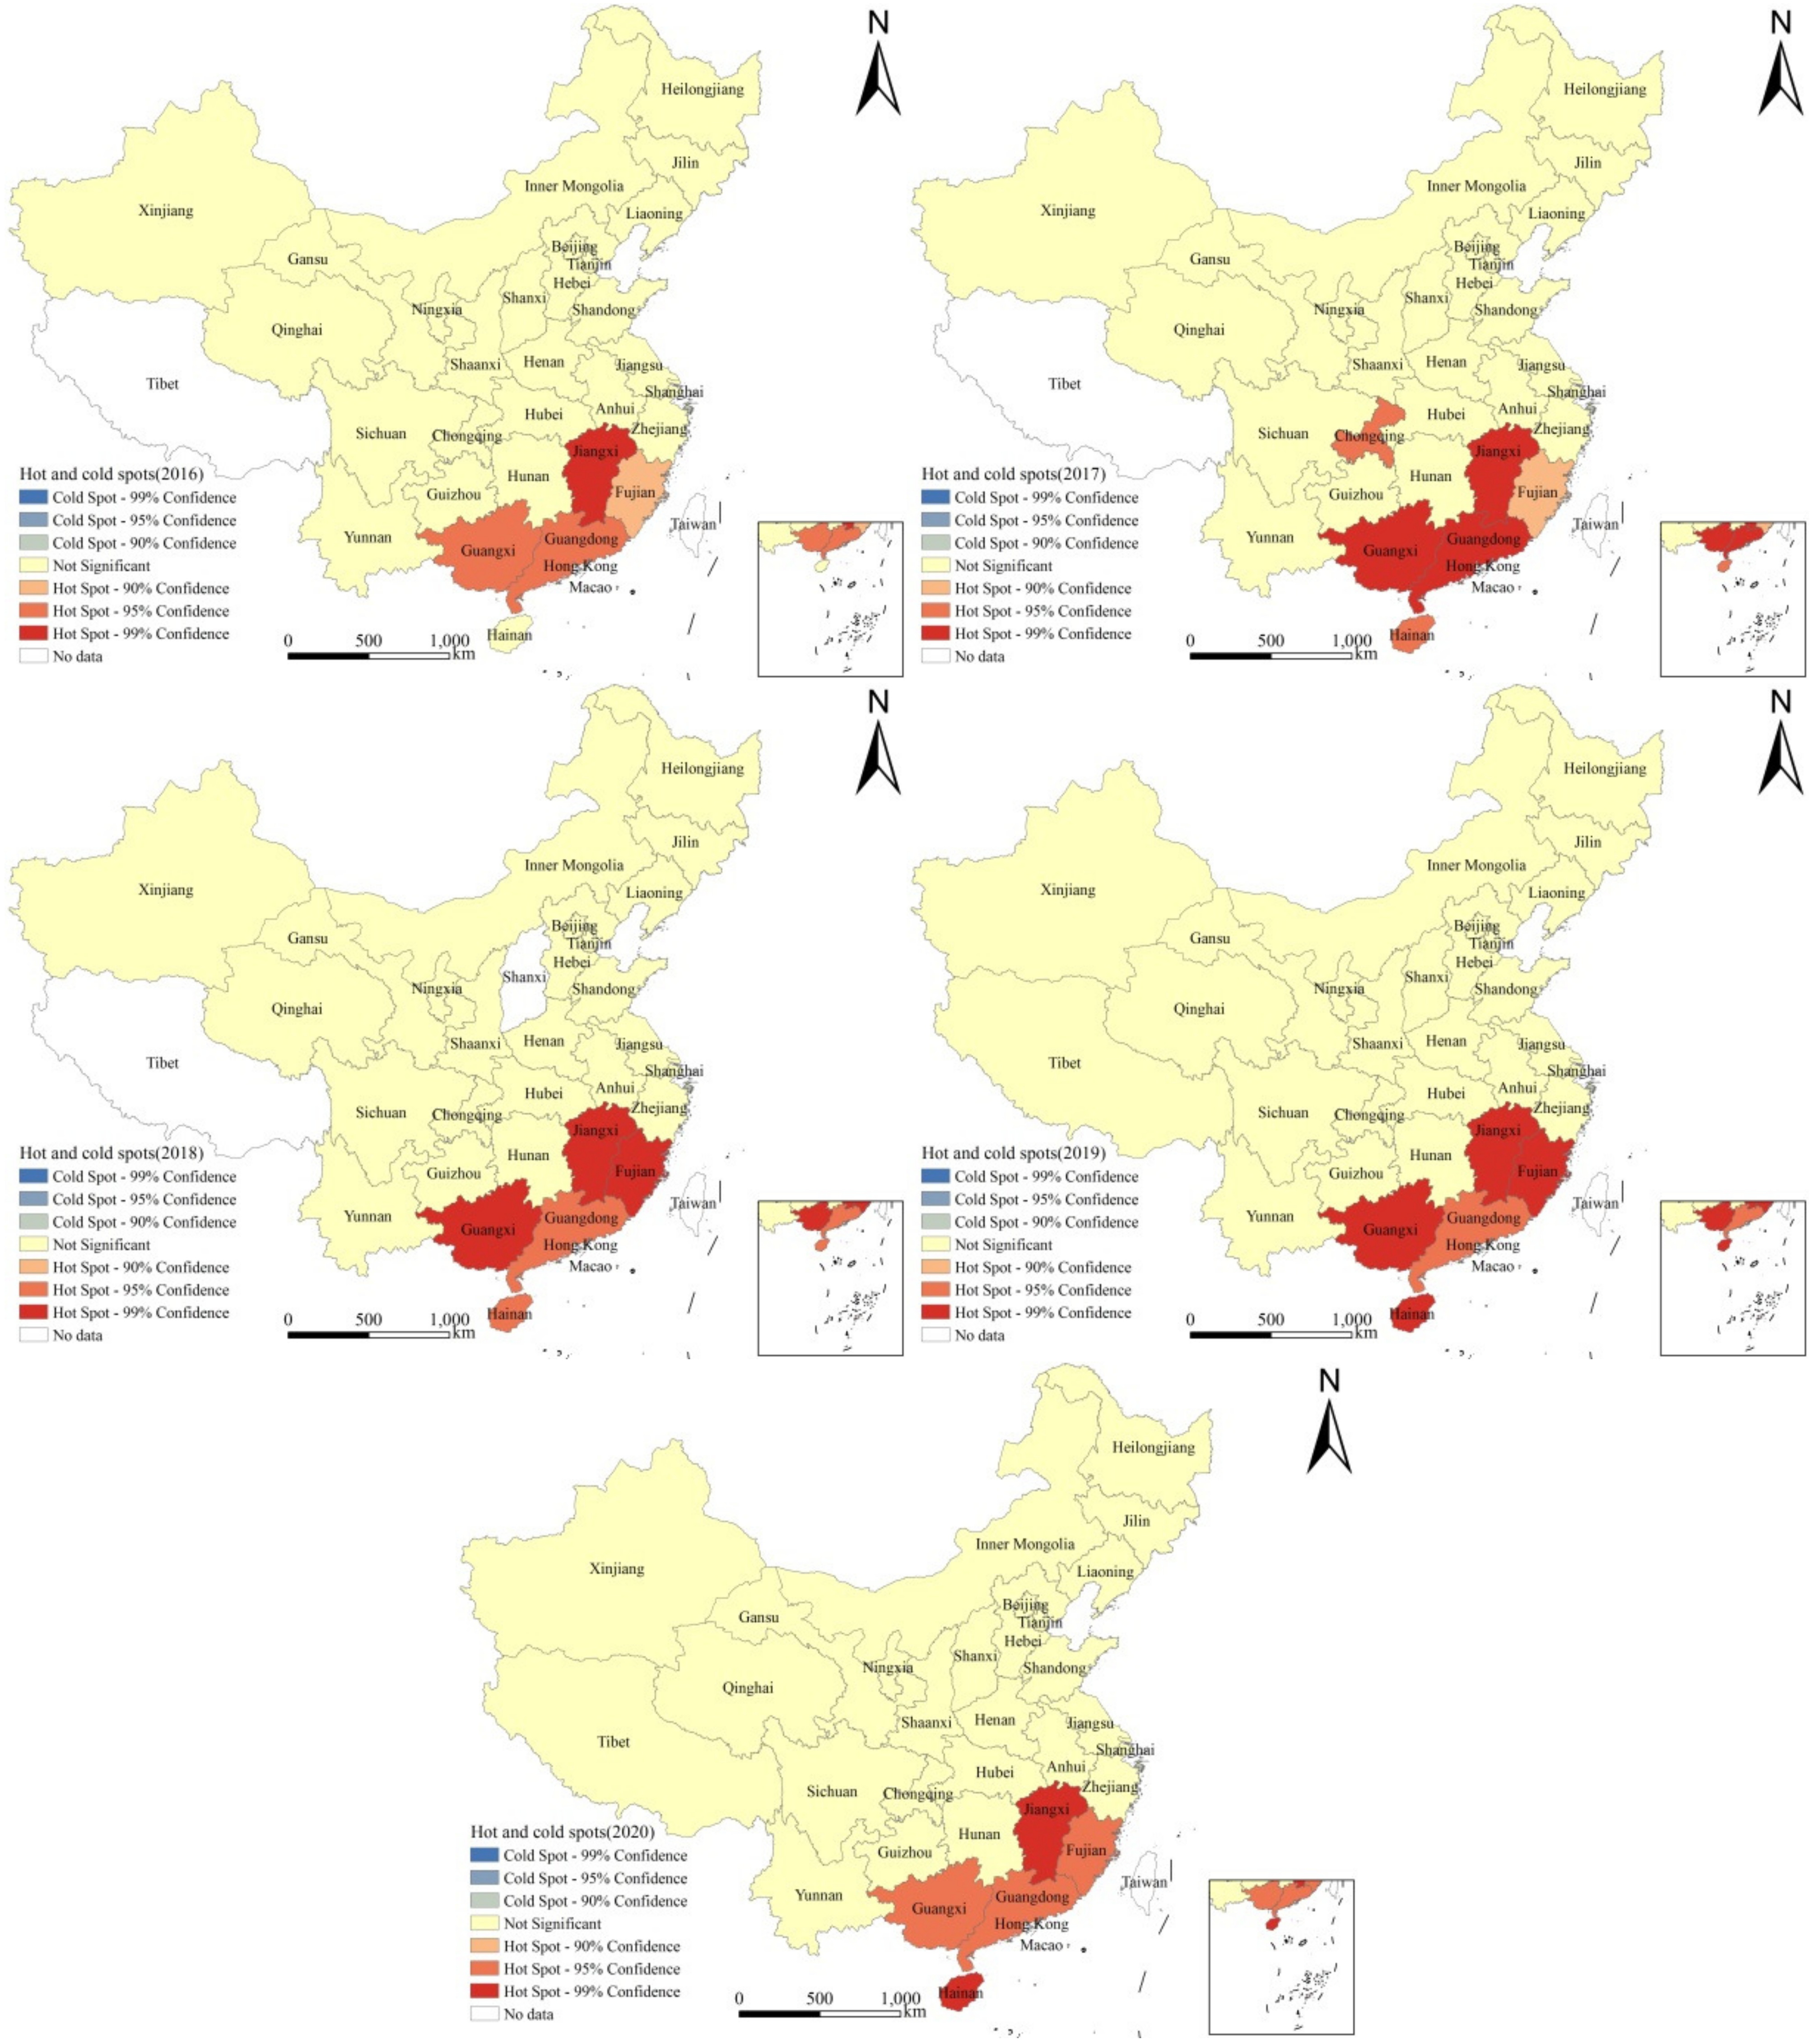
3.5. Hotspot Analysis
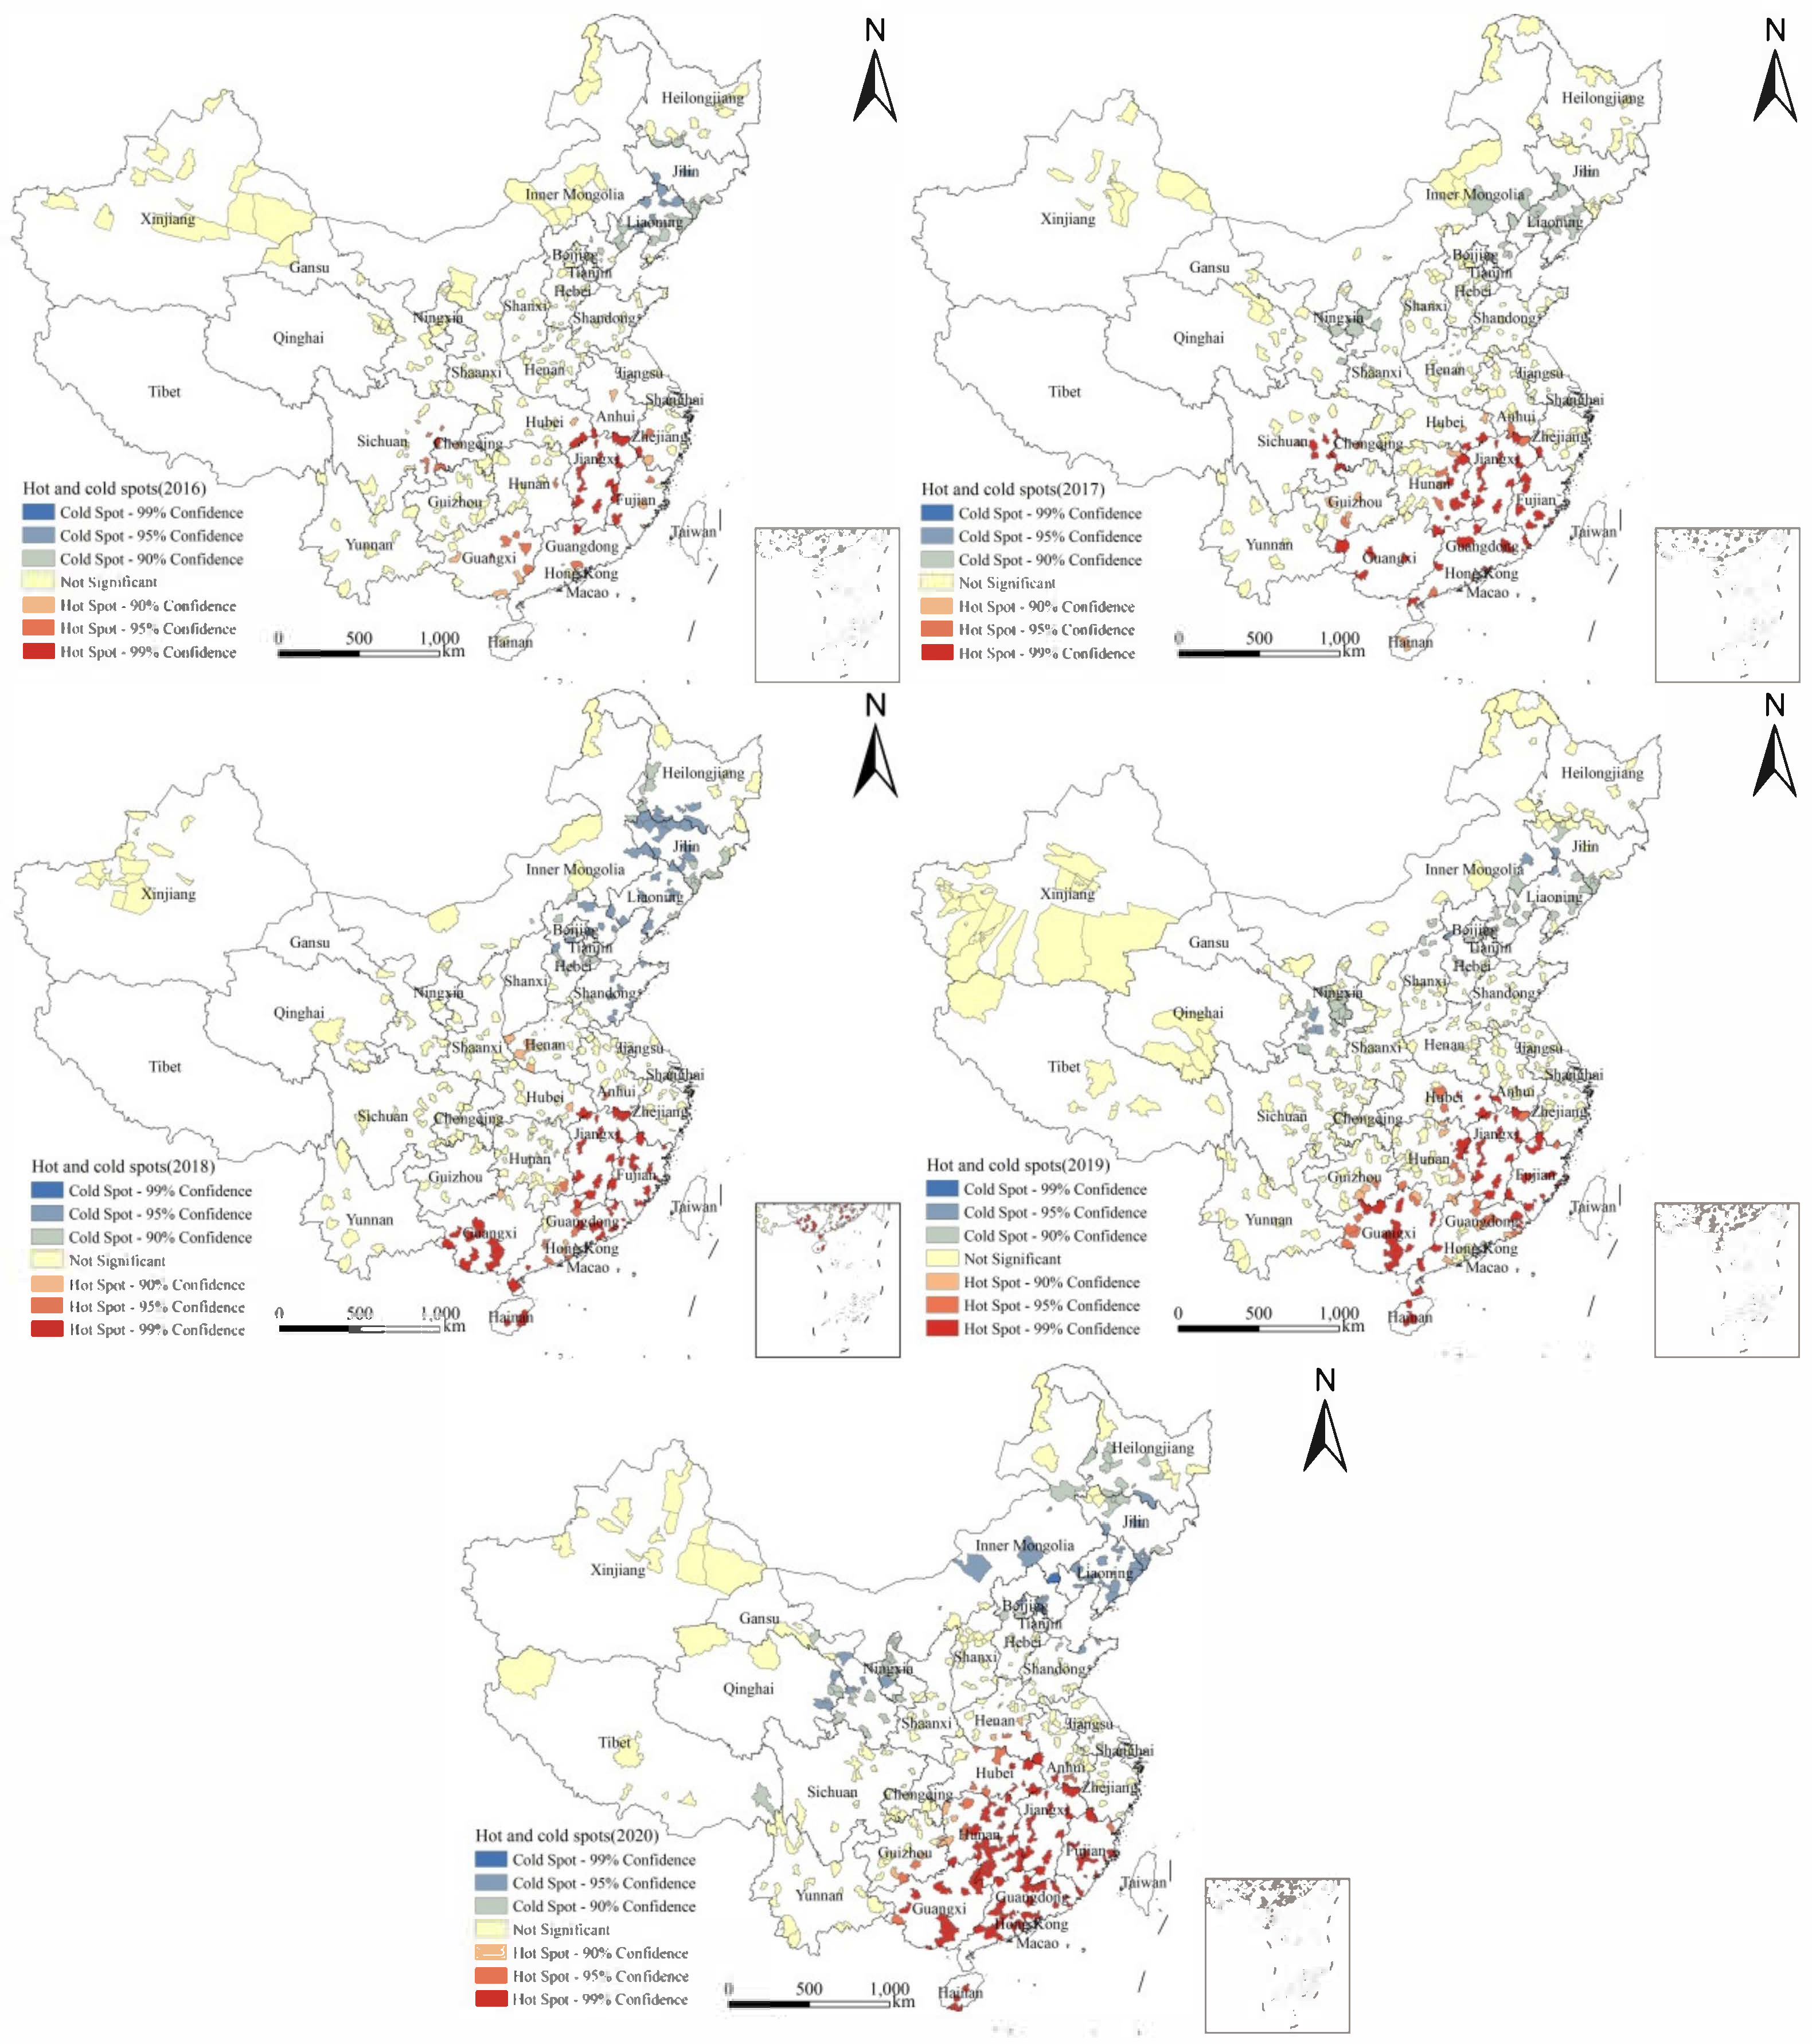
3.6. Spatio-Temporal Analysis
4. Discussion
5. Conclusions
Author Contributions
Funding
Institutional Review Board Statement
Informed Consent Statement
Data Availability Statement
Acknowledgments
Conflicts of Interest
References
- Fan, C.K.; Chuang, T.W.; Huang, Y.C.; Yin, A.W.; Chou, C.M.; Hsu, Y.T.; Kios, R.; Hsu, S.L.; Wang, Y.T.; Wu, M.S.; et al. Enterobius vermicularis infection: Prevalence and risk factors among preschool children in kindergarten in the capital area, Republic of the Marshall Islands. BMC Infect. Dis. 2019, 19, 536. [Google Scholar] [CrossRef] [PubMed] [Green Version]
- Kucik, C.J.; Martin, G.L.; Sortor, B.V. Common intestinal parasites. Am. Fam. Physician 2004, 69, 1161–1168. [Google Scholar] [PubMed]
- Burkhart, C.N.; Burkhart, C.G. Assessment of frequency, transmission, and genitourinary complications of enterobiasis (pinworms). Int. J. Dermatol. 2005, 44, 837–840. [Google Scholar] [CrossRef] [PubMed]
- Al-Daoody, A.A.K.; Al-Bazzaz, E.N.H. Impact of Enterobius vermicularis infection on biochemical parameters in the blood of children in Erbil Province, Iraq. BMC Infect. Dis. 2020, 20, 1–6. [Google Scholar] [CrossRef]
- An, Y.; Pang, X.; Liu, J.; Huang, S. Advances in research on harm and control of Enterobius vermicularis infection in children. Chin. J. Schisto. Control 2012, 24, 598–600. [Google Scholar]
- Tsai, C.Y.; Junod, R.; Jacot-Guillarmod, M.; Beniere, C.; Ziadi, S.; Bongiovanni, M. Vaginal Enterobius vermicularis diagnosed on liquid-based cytology during Papanicolaou test cervical cancer screening: A report of two cases and a review of the literature. Diagn. Cytopathol. 2018, 46, 179–186. [Google Scholar] [CrossRef] [Green Version]
- Altun, E.; Avci, V.; Azatcam, M. Parasitic infestation in appendicitis. A retrospective analysis of 660 patients and brief literature review. Saudi Med. J. 2017, 38, 314–318. [Google Scholar] [CrossRef]
- Li, Y. Human Parasitology, 7th ed.; People’s Medical Publishing House: Beijing, China, 2008; pp. 166–168. [Google Scholar]
- Zhu, X.P.; Su, C. Human Parasitology, 8th ed.; People’s Medical Publishing House: Beijing, China, 2013; pp. 161–163. [Google Scholar]
- Wendt, S.; Trawinski, H.; Schubert, S.; Rodloff, A.C.; Mössner, J.; Lübbert, C. The Diagnosis and Treatment of Pinworm Infection. Dtsch. Ärzteblatt Int. 2019, 116, 213–219. [Google Scholar] [CrossRef]
- Zhou, C.; Zhu, H.; Zang, W.; Zhang, X.; Chen, Y. Monitoring of Enterobius vermicularis infection among children from 2006 to 2010 and SWOT analysis. Chin. J. Schisto. Control 2014, 26, 370–375. [Google Scholar]
- Zhou, X. Report on the National Survey of Important Human Parasitic Diseases in China (2015); People’s Medical Publishing House: Beijing, China, 2018; pp. 2, 64–66. [Google Scholar]
- Gao, F. Annual Report on Surveillance of Infectious Disease in China, 2016; Chinese Center for Disease Control and Prevention: Beijing, China, 2017; pp. 384–392. [Google Scholar]
- Gao, F. Annual Report on Surveillance of Infectious Disease in China, 2020; Chinese Center for Disease Control and Prevention: Beijing, China, 2021; pp. 391–398. [Google Scholar]
- Zhu, H.; Huang, J.; Zhu, T.; Duan, L.; Zhou, C.; Qian, M.; Chen, Y. National surveillance of soil-transmitted helminth infections in 2017. Chin. J. Parasitol. Parasit. Dis. 2019, 37, 12–17. [Google Scholar] [CrossRef]
- Wang, S.; Yu, B.; Fan, B. Introduction of the modified Kato-Katz thick smear method. Dis. Surveill. 1994, 12, 344. [Google Scholar]
- Fang, Y.; Cheng, Y.; Xu, X. Improvement and use of cellophane anal swab. J. Pract. Parasit. Dis. 1997, 01, 23. [Google Scholar]
- Blazquez, C.A.; Picarte, B.; Calderon, J.F.; Losada, F. Spatial autocorrelation analysis of cargo trucks on highway crashes in Chile. Accid. Anal. Prev. 2018, 120, 195–210. [Google Scholar] [CrossRef]
- Adham, D.; Moradi-Asl, E.; Dorosti, A.; Khaiatzadeh, S. Spatial autocorrelation and epidemiological survey of visceral leishmaniasis in an endemic area of Azerbaijan region, the northwest of Iran. PLoS ONE 2020, 15, e236414. [Google Scholar] [CrossRef]
- Ren, H.; Shang, Y.; Zhang, S. Measuring the spatiotemporal variations of vegetation net primary productivity in Inner Mongolia using spatial autocorrelation. Ecol. Indic. 2020, 112, 106108. [Google Scholar] [CrossRef]
- Zhang, Z.; Clark, A.B.; Bivand, R.; Chen, Y.; Carpenter, T.E.; Peng, W.; Zhou, Y.; Zhao, G.; Jiang, Q. Nonparametric spatial analysis to detect high-risk regions for schistosomiasis in Guichi, China. Trans. Roy. Soc. Trop. Med. Hyg. 2009, 103, 1045–1052. [Google Scholar] [CrossRef]
- Mashinini, D.P.; Fogarty, K.J.; Potter, R.C.; Berles, J.D. Geographic hot spot analysis of vaccine exemption clustering patterns in Michigan from 2008 to 2017. Vaccine 2020, 38, 8116–8120. [Google Scholar] [CrossRef]
- Jung, I.; Kulldorff, M.; Klassen, A.C. A spatial scan statistic for ordinal data. Stat. Med. 2007, 26, 1594–1607. [Google Scholar] [CrossRef]
- Xue, J.; Xia, S.; Zhang, X.; Hu, H.; Wang, Q.; Zhou, Y.; Li, S. Pattern analysis of tempo-spatial distribution of schistosomiasis in marshland epidemic areas in stage of transmission control. Chin. J. Schisto. Control 2016, 28, 624–629. [Google Scholar] [CrossRef]
- Anselin, L. Local indicators of spatial association-LISA. Geogr. Anal. 1995, 27, 93–115. [Google Scholar] [CrossRef]
- Huang, J.; Zhang, M.; Zhu, H.; Zhu, T.; Zhou, C.; Qian, M.; Chen, Y. National surveillance on Enterobius vermicularis infections among children at ages of 3 to 9 years in China from 2016 to 2018. Chin. J. Schisto. Control 2020, 32, 54–59. [Google Scholar] [CrossRef]
- Zhu, H.; Huang, J.; Chen, Y.; Zhou, C.; Zhu, T.; Qian, M.; Zhang, M.; Li, S.; Zhou, X. Analysis on endemic status of soil-transmitted nematode infection in China in 2019. Chin. J. Parasitol. Parasit. Dis. 2021, 39, 666–673. [Google Scholar] [CrossRef]
- Bu, X.; Zhao, C.; Yan, G.; Wang, Y.; Wang, L.; Kong, X.; Xu, Y.; Zhang, B. Surveillance of Enterobius vermicularis infections among children in Shandong Province from 2016 to 2020. Chin. J. Schisto. Control 2021, 33, 401–405. [Google Scholar] [CrossRef]
- Wan, X.; Lv, G.; Jiang, Z.; Ou, F.; Wei, H.; Tang, W.; Li, Y.; Zhang, W.; Huang, K.; Shi, Y.; et al. Surveillance on soil-transmitted nematode infections in population in Guangxi Zhuang Autonomous Region during 2016–2020. Chin. J. Parasitol. Parasit. Dis. 2021, 39, 800–806. [Google Scholar] [CrossRef]
- Song, C.; Jiao, X.; Jiang, T.; Liang, G.; Wang, L.; Xu, Y.; Huang, S.; Chen, W.; Deng, Y.; Zhang, Y. Prevalence and influencing factors of Enterobius vermicularis infections among children in Fanxian County of Henan Province in 2019. Chin. J. Schisto. Control 2021, 33, 406–410. [Google Scholar] [CrossRef]
- Chen, Y.; Wang, J.; Zhu, H.; Zhu, T.; Zang, W.; Qian, M.; Li, H.; Zhou, C.; Wang, G.; Xu, L. Enterobius vermicularis Infection Status among Children in 9 Provinces/Autonomous regions/Municipalities of China. Chin. J. Parasitol. Parasit. Dis. 2013, 31, 251–255. [Google Scholar]
- Kuang, C.; Wu, X.; Chen, W.; Wu, F.; Zhuo, F. Prevalence and risk factors of Enterobius vermicularis among preschool children in kindergartens in Luohu District, Shenzhen City. Chin. J. Schisto. Control 2015, 27, 76–78. [Google Scholar] [CrossRef]
- Chen, W.; Li, S.; Zhang, Y.; Deng, Y.; Xu, B.; Zhang, H.; Lin, X.; Li, P.; Zhao, Y.; Yang, C.; et al. Prevalence and influencing factors of intestinal parasitic diseases among rural children in Henan Province. Chin. J. Schisto. Control 2019, 31, 491–497. [Google Scholar] [CrossRef]
- Mao, F.; Yang, Y.; Zhang, Q.; Ding, X.; Xu, X.; Chen, Y.; Dai, Y.; Cao, J. Knowledge and Practice of Pinworm Infection in Preschool Children, Jiangsu Province, China, 2019–2020. Am. J. Public Health 2022, 112, 1716–1720. [Google Scholar] [CrossRef]
- Wang, X.; Zhou, Q.; Sh, A.; Li, L.; Wang, Y.; Hu, S.; Cui, J. A survey on Enterobius vermicularis infection among pre-school children in Guoyang County of Anhui Province. Chin. J. Parasitol. Parasit. Dis. 2018, 36, 139–143. [Google Scholar]
- Chen, Z.; Jiang, W.; Ge, J.; Dai, K.; Li, D.; Liu, K.; Zeng, X. Analysis on the results of surveillance of Enterobius vermicularis infection among children in rural areas in Jiangxi Province during 2016–2019. Chin. J. Parasitol. Parasit. Dis. 2020, 38, 542–547. [Google Scholar] [CrossRef]
- Jiang, L. Investigation of pinworm infection among children in a county of Pingxiang, Jiangxi Province from 2016 to 2019. Shanghai Med. Pharm. J. 2021, 42, 60–62. [Google Scholar]
- Chi, J.; Sun, M. Analysis of enterobius vermicularis infection among children aged from 3 to 7 years in Chuzhou area. J. Qiqihar Med. Univ. 2020, 41, 1131–1133. [Google Scholar]


| Province (Municipality/Autonomous Region) | 2016 N (%) * | 2017 N (%) * | 2018 N (%) * | 2019 N (%) * | 2020 N (%) * | Total N (%) * |
|---|---|---|---|---|---|---|
| Beijing | 0/161 (0.00) | 0/77 (0.00) | 0/449 (0.00) | 3/374 (0.80) | 0/322 (0.00) | 3/1383 (0.22) |
| Tianjing | 0/325 (0.00) | 1/246 (0.41) | 0/210 (0.00) | 0/251 (0.00) | 0/258 (0.00) | 1/1290 (0.08) |
| Hebei | 42/2821 (1.49) | 22/2382 (0.92) | 21/2197 (0.96) | 28/2765 (1.01) | 13/2454 (0.53) | 126/12,619 (1.00) |
| Shanxi (1) | 10/1101 (0.91) | 22/1336 (1.65) | / | 6/2053 (0.29) | 9/1821 (0.49) | 47/6311 (0.74) |
| Inner Mongolia | 0/768 (0.00) | 2/790 (0.25) | 0/1,392 (0.00) | 1/1346 (0.07) | 0/1225 (0.00) | 3/5521 (0.05) |
| Liaoning | 0/1153 (0.00) | 0/1133 (0.00) | 0/677 (0.00) | 0/874 (0.00) | 1/814 (0.12) | 1/4651 (0.02) |
| Jilin | 0/284 (0.00) | 1/277 (0.36) | 2/840 (0.24) | 0/386 (0.00) | 2/411 (0.49) | 5/2198 (0.23) |
| Heilongjiang | 0/1403 (0.00) | 3/904 (0.33) | 0/849 (0.00) | 3/1251 (0.24) | 0/646 (0.00) | 6/5053 (0.12) |
| Shanghai | 0/68 (0.00) | 0/17 (0.00) | 0/55 (0.00) | 3/142 (2.11) | 0/42 (0.00) | 3/324 (0.93) |
| Jiangsu | 0/214 (0.00) | 4/1055 (0.38) | 0/120 (0.00) | 1/863 (0.12) | 10/810 (1.23) | 15/3062 (0.49) |
| Zhejiang | 19/727 (2.61) | 7/804 (0.87) | 2/537 (0.37) | 9/603 (1.49) | 1/476 (0.21) | 38/3147 (1.21) |
| Anhui | 3/73 (4.11) | 26/1849 (1.41) | 16/1640 (0.98) | 31/2229 (1.39) | 24/2305 (1.04) | 100/8096 (1.24) |
| Fujian | 30/1094 (2.74) | 113/2376 (4.76) | 159/2208 (7.20) | 159/2214 (7.18) | 114/2449 (4.65) | 575/10,341 (5.56) |
| Jiangxi | 238/1964 (12.12) | 256/1791 (14.29) | 120/1409 (8.52) | 110/1611 (6.83) | 121/1550 (7.81) | 845/8325 (10.15) |
| Shandong | 27/1153 (2.34) | 16/1526 (1.05) | 8/1858 (0.43) | 48/1941 (2.47) | 21/1783 (1.18) | 120/8261 (1.45) |
| Henan | 137/4235 (3.23) | 162/4846 (3.34) | 176/4664 (3.77) | 136/4596 (2.96) | 132/3807 (3.47) | 743/22,148 (3.35) |
| Hubei | 11/1603 (0.69) | 3/1389 (0.22) | 37/2356 (1.57) | 40/1758 (2.28) | 31/1746 (1.78) | 122/8852 (1.38) |
| Hunan | 15/1598 (0.94) | 113/4160 (2.72) | 83/6598 (1.26) | 120/5269 (2.28) | 73/7070 (1.03) | 404/24,695 (1.64) |
| Guangdong | 50/913 (5.48) | 174/2346 (7.42) | 188/4122 (4.56) | 178/5039 (3.53) | 160/5743 (2.79) | 750/18,163 (4.13) |
| Guangxi | 139/2166 (6.42) | 118/864 (13.66) | 182/2232 (8.15) | 238/3586 (6.64) | 108/2285 (4.73) | 785/11,133 (7.05) |
| Hainan | 6/201 (2.99) | 25/343 (7.29) | 27/514 (5.25) | 38/538 (7.06) | 55/573 (9.60) | 151/2169 (6.96) |
| Chongqing | 13/527 (2.47) | 42/447 (9.40) | 3/560 (0.54) | 1/478 (0.21) | 4/732 (0.55) | 63/2744 (2.30) |
| Sichuan | 67/1293 (5.18) | 49/1301 (3.77) | 68/1421 (4.79) | 77/3118 (2.47) | 29/1194 (2.43) | 290/8327 (3.48) |
| Guizhou | 49/2028 (2.42) | 33/2110 (1.56) | 4/948 (0.42) | 23/2699 (0.85) | 29/2555 (1.14) | 138/10,340 (1.33) |
| Yunnan | 3/1336 (0.22) | 6/1465 (0.41) | 0/1016 (0.00) | 11/2026 (0.54) | 4/1834 (0.22) | 24/7677 (0.31) |
| Tibet (2) | / | / | / | 1/1117 (0.09) | 0/893 (0.00) | 1/2010 (0.05) |
| Shaanxi | 15/1228 (1.22) | 0/1212 (0.00) | 11/1365 (0.81) | 15/1490 (1.01) | 2/1167 (0.17) | 43/6462 (0.67) |
| Gansu | 7/1470 (0.48) | 1/1414 (0.07) | 1/1399 (0.07) | 6/3164 (0.19) | 6/3712 (0.16) | 21/11,159 (0.19) |
| Qinghai | 0/1044 (0.00) | 0/615 (0.00) | 0/893 (0.00) | 0/1069 (0.00) | 1/980 (0.10) | 1/4601 (0.02) |
| Ningxia | 21/853 (2.46) | 1/435 (0.23) | 3/665 (0.45) | 21/2968 (0.71) | 10/2338 (0.43) | 56/7259 (0.77) |
| Xinjiang | 9/2673 (0.34) | 12/3119 (0.38) | 22/2893 (0.76) | 152/5774 (2.63) | 8/3066 (0.26) | 203/17,525 (1.16) |
| Feature | 2016 N (%) * | 2017 N (%) * | 2018 N (%) * | 2019 N (%) * | 2020 N (%) * | Total N (%) * |
|---|---|---|---|---|---|---|
| Gender | ||||||
| Boys | 479/19,497 (2.46) | 650/22,647 (2.87) | 592/24,601 (2.41) | 781/33,666 (2.32) | 513/30,008 (1.71) | 3015/130,419 (2.31) |
| Girls | 432/16,980 (2.54) | 562/19,982 (2.81) | 541/21,486 (2.52) | 678/29,926 (2.27) | 455/27,053 (1.68) | 2668/115,427 (2.31) |
| Ethnicity | ||||||
| Buyi | 1/308 (0.32) | 0/365 (0.00) | 0/193 (0.00) | 1/523 (0.19) | 11/462 (2.38) | 13/1851 (0.70) |
| Dong | 8/128 (6.25) | 6/419 (1.43) | 7/196 (3.57) | 0/96 (0.00) | 7/633 (1.11) | 28/1472 (1.90) |
| Han | 764/28,455 (2.68) | 1034/34,263 (3.02) | 956/38,094 (2.51) | 1091/47,492 (2.30) | 863/45,098 (1.91) | 4708/193,402 (2.43) |
| Hui | 22/1039 (2.12) | 2/997 (0.20) | 5/656 (0.76) | 13/2128 (0.61) | 17/2,269 (0.75) | 59/7089 (0.83) |
| Kazak | 2/461 (0.43) | 4/645 (0.62) | 3/323 (0.93) | 0/103 (0.00) | 4/534 (0.75) | 13/2066 (0.63) |
| Li | 6/197 (3.05) | 19/313 (6.07) | 11/143 (7.69) | 3/238 (1.26) | 20/248 (8.06) | 59/1139 (5.18) |
| Miao | 19/709 (2.68) | 12/937 (1.28) | 10/330 (3.03) | 6/574 (1.05) | 5/924 (0.54) | 52/3474 (1.50) |
| Tujia | 2/833 (0.24) | 3/681 (0.44) | 2/684 (0.29) | 0/516 (0.00) | 1/832 (0.12) | 8/3546 (0.23) |
| Uygur | 3/1,644 (0.18) | 2/963 (0.21) | 17/1787 (0.95) | 152/5020 (3.03) | 1/1046 (0.10) | 175/10,460 (1.67) |
| Yao | 3/65 (4.62) | 16/234 (6.84) | 10/169 (5.92) | 2/78 (2.56) | 11/413 (2.66) | 42/959 (4.38) |
| Zhuang | 77/922 (8.35) | 102/789 (12.93) | 107/1111 (9.63) | 174/1764 (9.86) | 18/637 (2.83) | 478/5223 (9.15) |
| Others | 4/1716 (0.23) | 12/2023 (0.59) | 5/2401 (0.21) | 17/5060 (0.34) | 10/3965 (0.25) | 48/15,165 (0.32) |
| Ages | 2016 N (%) * | 2017 N (%) * | 2018 N (%) * | 2019 N (%) * | 2020 N (%) * | Total N (%) * |
|---|---|---|---|---|---|---|
| 3 | 117/4984 (2.35) | 102/5655 (1.80) | 122/6613 (1.84) | 113/9262 (1.22) | 81/8093 (1.00) | 535/34,607 (1.55) |
| 4 | 180/5505 (3.27) | 199/6111 (3.26) | 221/6868 (3.22) | 213/8809 (2.42) | 133/8551 (1.56) | 946/35,844 (2.64) |
| 5 | 144/5622 (2.56) | 293/6917 (4.24) | 210/7556 (2.78) | 325/10,598 (3.07) | 183/8582 (2.13) | 1155/39,275 (2.94) |
| 6 | 166/5484 (3.03) | 226/6470 (3.49) | 210/7262 (2.89) | 294/9773 (3.01) | 201/8921 (2.25) | 1097/37,910 (2.89) |
| 7 | 154/4971 (3.10) | 154/5899 (2.61) | 175/5953 (2.94) | 208/8663 (2.40) | 172/7764 (2.22) | 863/33,250 (2.60) |
| 8 | 91/5095 (1.79) | 135/6108 (2.21) | 118/5923 (1.99) | 197/8580 (2.30) | 127/8095 (1.57) | 668/33,801 (1.98) |
| 9 | 59/4816 (1.23) | 103/5469 (1.88) | 77/5912 (1.30) | 109/7907 (1.38) | 71/7055 (1.01) | 419/31,159 (1.34) |
| Year | Moran’s I | Expected Moran’s I value | Variance | Z value | P value |
|---|---|---|---|---|---|
| 2016 | 0.154787 | −0.034483 | 0.004674 | 2.768400 | 0.005633 |
| 2017 | 0.235557 | −0.034483 | 0.00531 | 3.705713 | 0.000211 |
| 2018 | 0.226277 | −0.035714 | 0.006286 | 3.304426 | 0.000952 |
| 2019 | 0.314987 | −0.033333 | 0.008858 | 3.700856 | 0.000215 |
| 2020 | 0.230413 | −0.033333 | 0.007734 | 2.999004 | 0.002709 |
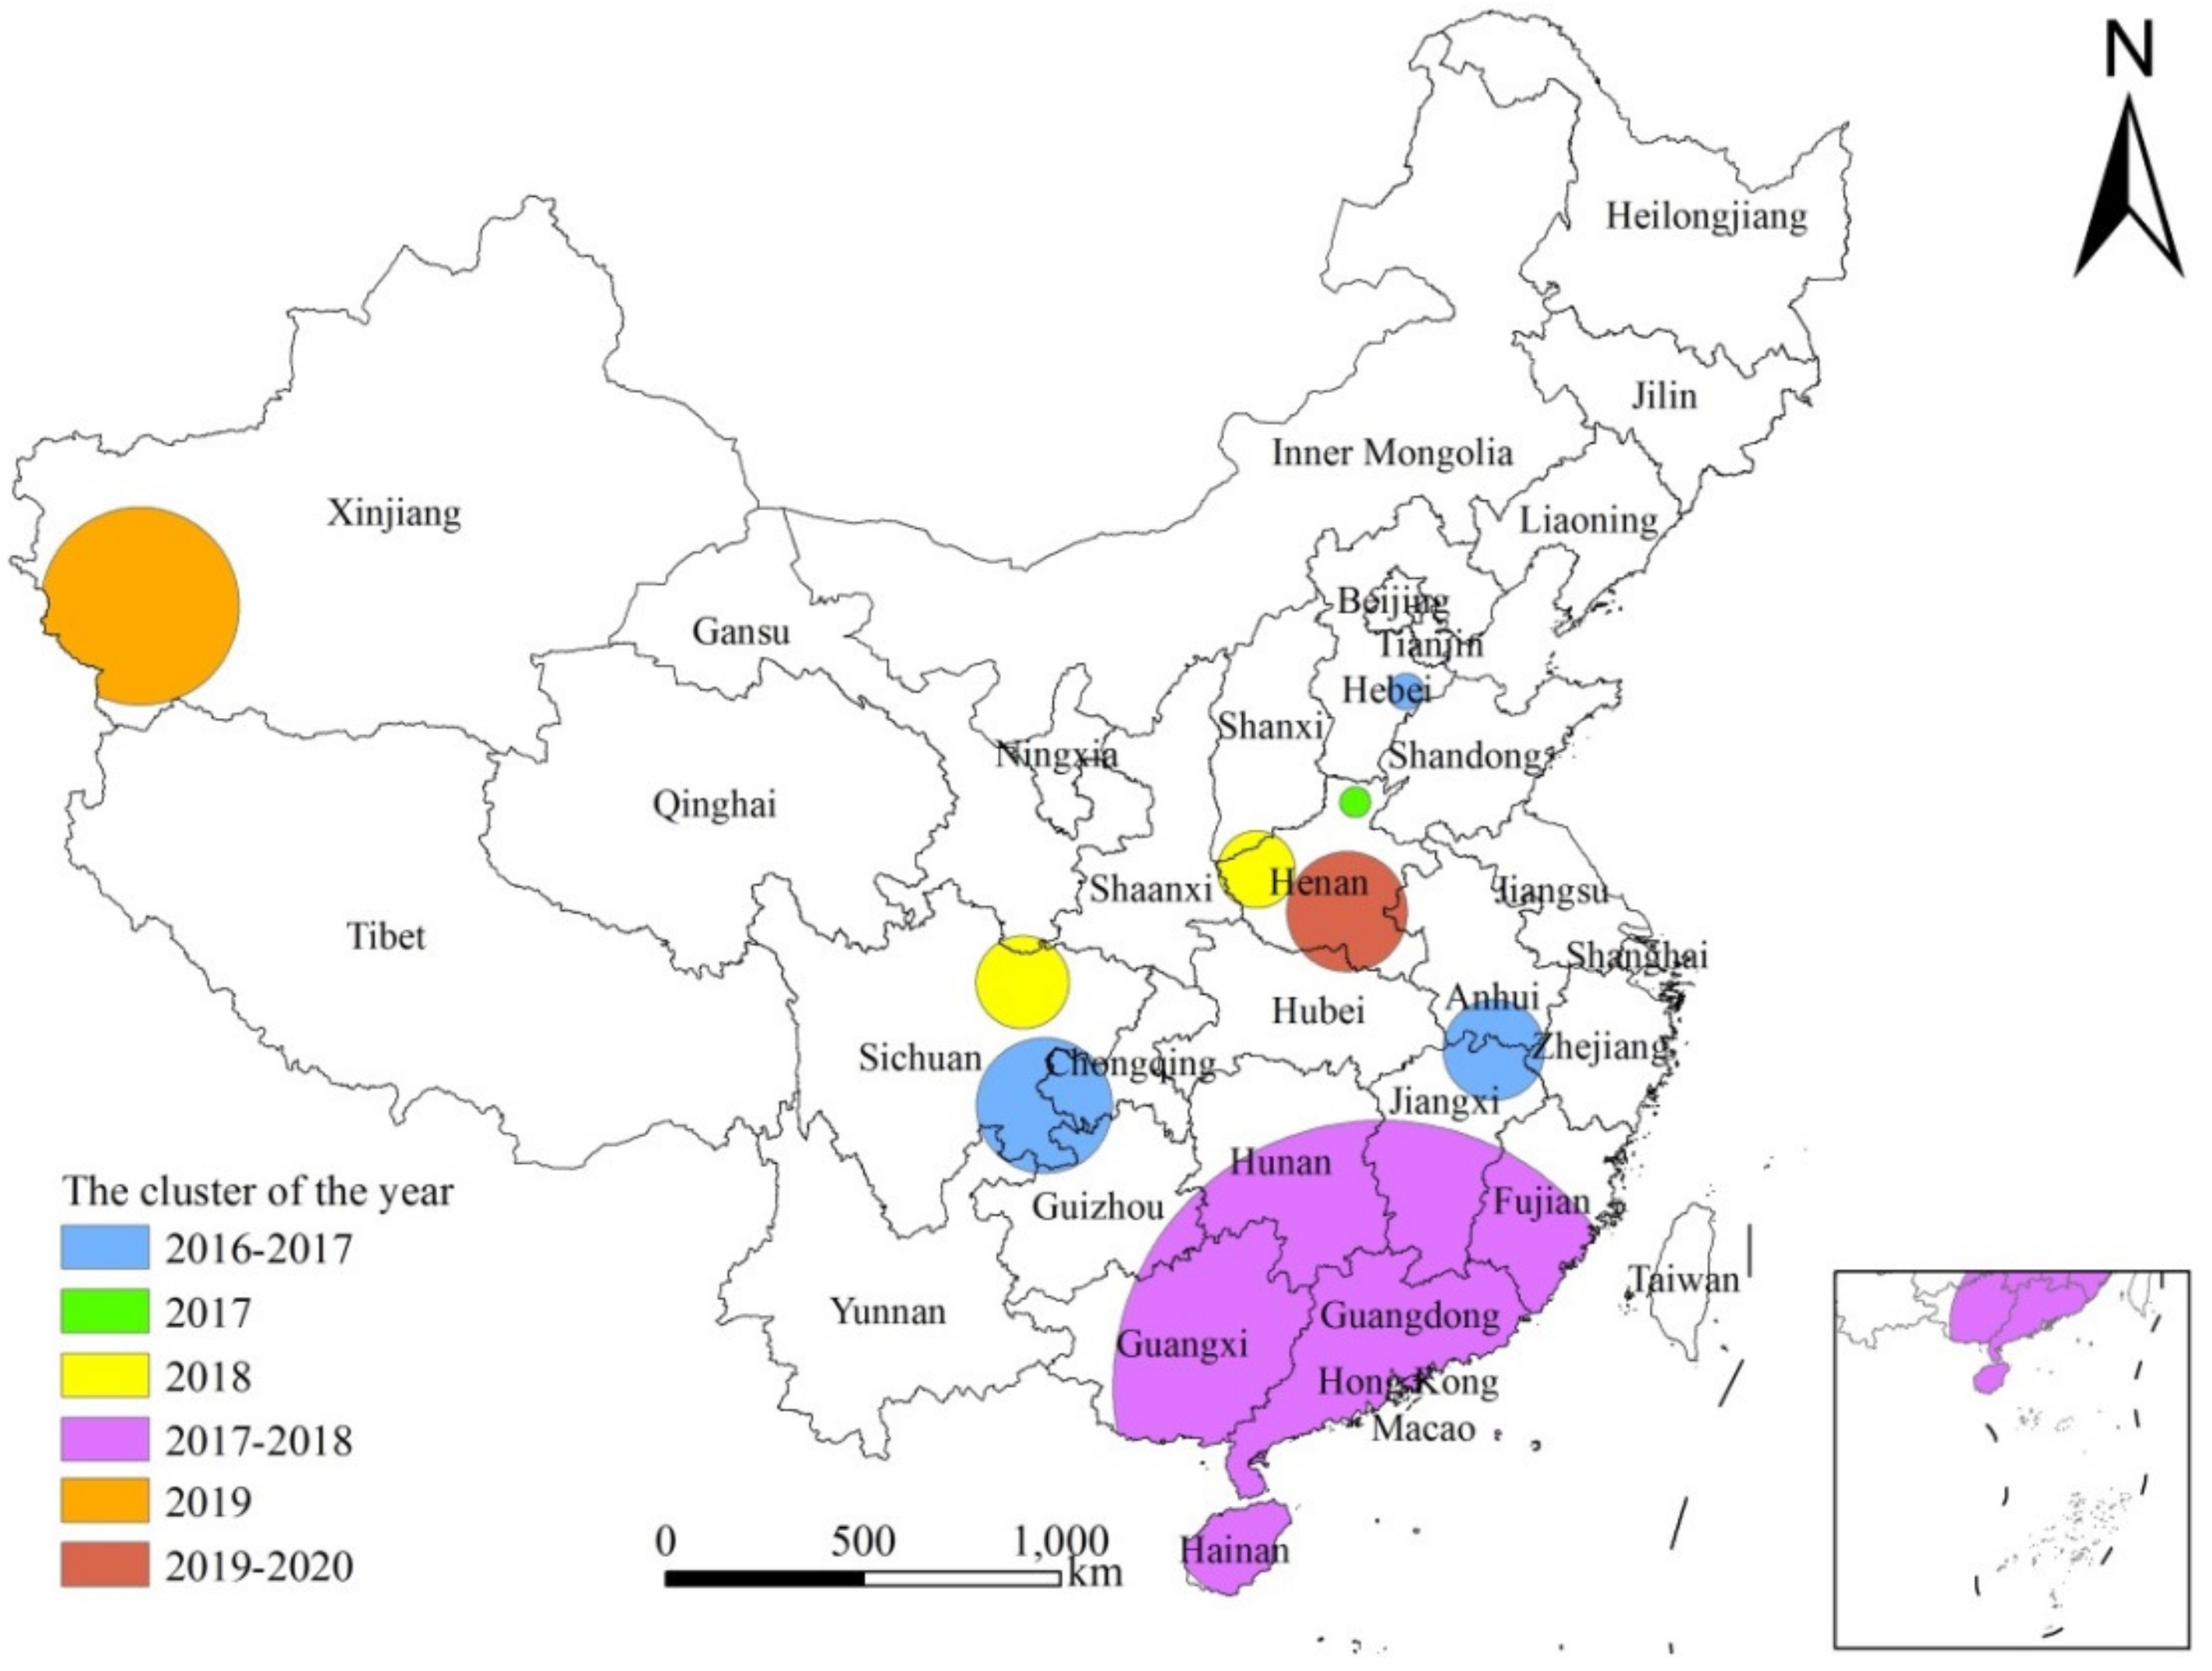
| Year | Cluster Center (°) | Radius (km) | No. of Clustered Counties | LLR | No. of Observed | No. of Expected | P Value | |
|---|---|---|---|---|---|---|---|---|
| Latitude | Longitude | |||||||
| 2017–2018 | 22.5199 | 113.3940 | 647.46 | 234 | 532.57 | 1359 | 523.50 | 0.0000 |
| 2016–2017 | 29.5538 | 117.2960 | 128.07 | 11 | 238.40 | 184 | 21.04 | 0.0000 |
| 2016–2017 | 29.1221 | 105.4950 | 171.33 | 37 | 110.50 | 150 | 33.24 | 0.0000 |
| 2018 | 34.3418 | 111.4940 | 99.94 | 13 | 65.64 | 80 | 15.87 | 0.0000 |
| 2019 | 37.2055 | 78.5104 | 257.96 | 10 | 53.63 | 124 | 41.60 | 0.0000 |
| 2019–2020 | 33.1618 | 113.8890 | 154.52 | 33 | 39.56 | 177 | 84.13 | 0.0000 |
| 2018 | 31.9484 | 104.9240 | 118.98 | 15 | 27.97 | 34 | 6.70 | 0.0000 |
| 2016–2017 | 38.0833 | 116.3760 | 47.61 | 3 | 18.12 | 51 | 19.19 | 0.0001 |
| 2017 | 35.6715 | 114.4770 | 39.42 | 4 | 12.54 | 32 | 11.36 | 0.0190 |
Disclaimer/Publisher’s Note: The statements, opinions and data contained in all publications are solely those of the individual author(s) and contributor(s) and not of MDPI and/or the editor(s). MDPI and/or the editor(s) disclaim responsibility for any injury to people or property resulting from any ideas, methods, instructions or products referred to in the content. |
© 2022 by the authors. Licensee MDPI, Basel, Switzerland. This article is an open access article distributed under the terms and conditions of the Creative Commons Attribution (CC BY) license (https://creativecommons.org/licenses/by/4.0/).
Share and Cite
Huang, J.; Zhu, H.; Zhou, C.; Zhu, T.; Zhang, M.; Chen, Y.; Qian, M.; Li, S. Epidemiological Profile and Spatial Patterns of Enterobiasis in Children Aged 3–9 Years in China from 2016 to 2020. Trop. Med. Infect. Dis. 2023, 8, 25. https://doi.org/10.3390/tropicalmed8010025
Huang J, Zhu H, Zhou C, Zhu T, Zhang M, Chen Y, Qian M, Li S. Epidemiological Profile and Spatial Patterns of Enterobiasis in Children Aged 3–9 Years in China from 2016 to 2020. Tropical Medicine and Infectious Disease. 2023; 8(1):25. https://doi.org/10.3390/tropicalmed8010025
Chicago/Turabian StyleHuang, Jilei, Huihui Zhu, Changhai Zhou, Tingjun Zhu, Mizhen Zhang, Yingdan Chen, Menbao Qian, and Shizhu Li. 2023. "Epidemiological Profile and Spatial Patterns of Enterobiasis in Children Aged 3–9 Years in China from 2016 to 2020" Tropical Medicine and Infectious Disease 8, no. 1: 25. https://doi.org/10.3390/tropicalmed8010025