Article

Transcriptome Analysis Reveals the Algicidal Mechanism of Brevibacillus laterosporus against Microcystis aeruginosa through Multiple Metabolic Pathways

1
Department of Aquaculture, College of Fisheries, Guangdong Ocean University, Zhanjiang 524088, China
2
Guangdong Laboratory of Marine Ecology Environment Monitoring and Warning, Zhanjiang 524088, China
*
Author to whom correspondence should be addressed.
Toxins 2022, 14(7), 492; https://doi.org/10.3390/toxins14070492
Submission received: 9 June 2022 / Revised: 11 July 2022 / Accepted: 13 July 2022 / Published: 15 July 2022
(This article belongs to the Special Issue Ecology and Toxicology of Cyanobacteria and Cyanotoxins)

Abstract

:
It is widely accepted that eutrophication has played an important role in the formation of harmful cyanobacterial blooms in recent decades, which impacts water quality and ecological environment and causes huge economic losses. Algicidal bacteria have a promising application prospect in controlling cyanobacterial blooms in aquaculture water. Here, the process of the algicidal bacterium Brevibacillus laterosporus strain Bl-zj acting on Microcystis aeruginosa was explored using transcriptome analysis to elucidate the algicidal mechanism. The results of the co-culture of bacterium and alga showed a strong alga-lysing effect of B. laterosporus against M. aeruginosa with an extreme morphology deformation of the algal cells. A total of 2744 differentially expressed genes of B. laterosporus were identified, which were mainly involved in the metabolism of amino acid, carbohydrate, and lipid. In the co-cultured group, the expression of genes mainly enriched in valine, leucine and isoleucine degradation, and fatty acid degradation were significantly increased. However, the expression of the genes related to ribosome were mainly inhibited. Transcriptome analysis showed that B. laterosporus obtained ATP and energy by the degradation of valine, leucine, isoleucine, and fatty acids, and destroyed algal cells by efflux pump transporters, secretion of hydrolytic enzymes, antibiotics, proteases, and other secondary metabolites, resulting in algal death and achieving the algicidal effect.
Key Contribution: Brevibacillus laterosporus obtained ATP and energy through the degradation of valine, leucine, isoleucine, and fatty acids, and destroyed algal cells by secreting various secondary metabolites.

1. Introduction

In recent years, the outbreak of cyanobacterial blooms has caused severe water pollution and threatened the health of aquatic animals, resulting in significant economic losses for the aquaculture industry [1]. Microcystis aeruginosa, a common cyanobacteria species in aquatic ecosystems, can release microcystins, endangering the health and quality of cultured fish and shrimps. When a large number of M. aeruginosa accumulates in surface water, the transparency and dissolved oxygen levels of water decrease, which will further cause hypoxia and even the death of the aquatic animals [2]. Therefore, finding an effective method to control cyanobacteria blooms in aquatic ecosystems is crucial.
In comparison to physical and chemical methods for preventing and controlling cyanobacteria, biological methods have the advantage of being low cost and having high specificity and efficiency. Biological control has been recognized as an economic, effective, and ecologically harmless method to eliminate the harmful cyanobacteria [3]. Microorganisms, especially bacteria, play an important role in aquatic ecosystems [4]. As a group of bacteria that can inhibit and kill cyanobacteria, most algicidal bacteria lyse cyanobacteria indirectly by secreting extracellular substances or inhibit the grow through competing with them for limited nutrients. The specific or non-specific extracellular substances secreted by algae-lysing bacteria in the process of metabolism have an algal-lysing activity, which can destroy the structure of algal cells, causing them to disintegrate and die. In addition, some essential physiological functions of cyanobacteria can be destroyed and lead to the death at the later stage, including photosynthesis, reactive oxygen species (ROS) production, antioxidant system, and enzymatic activity [5]. Algicidal bacteria has significant prospects for water quality regulation as well as the prevention and control of cyanobacteria in aquaculture [6]. Lee et al. [7] isolated Pseudoalteromonas sp. strain A28 that can kill Skeletonema costatum strain NIES-324 by producing an extracellular serine protease. In vivo and in situ experiments conducted by Kim et al. [8] showed that the algae-lysing bacterium, Xanthobacter autotrophicus strain HYS0201-SM02, isolated from the surface water of a eutrophic lake displayed an algal-lytic activity against both cultured strain and natural colonial morphs of the M. aeruginosa. Yan et al. [9] screened Streptomyces amritsarensis HG-16, an actinomycete with high algicidal activity against M. aeruginosa, and found that S. amritsarensis could kill M. aeruginosa by secreting active substances, causing oxidative stress in algal cells, and strongly inhibiting microcystin synthesis of M. aeruginosa.
At present, research on the mechanism of algicidal bacteria against M. aeruginosa mainly focuses on the changes in cyanobacteria during the algae-lysis process. However, there are few studies on the changes in algicidal bacteria, particularly their transcriptome. Han et al. [10] investigated the gene expression and regulation of the algicidal fungus Bjerkandera adusta T1 using time-course transcriptomic analysis and speculated that the endopeptidase of polysaccharide lyases 8 (PL8) in this fungus might be the reason for the strong algicidal ability of B. adusta T1 and Trametes versicolor F21a. Dai et al. [11] analyzed the gene expression and regulation at time courses of T. versicolor F21a in the algae-killing process, which showed that the algae-killing mode of T. versicolor F21a might be related to enzyme decomposition and multiple metabolic pathways. Gao et al. applied proteomic analysis to investigate the algicidal process of T. versicolor F21a and found that some fungal enzymes may degrade lipopolysaccharides, peptidoglycans, and alginic acid of the algal cells [12]. Krachkovskii et al. [13] isolated a cyclic decapeptide cyclo peptide antibiotic loloatin A from the IGM52 strain of the Gram-positive spore-forming bacteria B. laterosporus that inhibits the growth of cyanobacteria.
B. laterosporus strain Bl-zj was isolated from intertidal soil and has been demonstrated to have algicidal activities against cyanobacteria [14,15,16]. In this work, the algicidal mechanism of the B. laterosporus strain Bl-zj against M. aeruginosa was investigated. By co-cultivating B. laterosporus and M. aeruginosa for 4 days, the changes in the algal morphology were observed. We also analyzed the differential gene expression of B. laterosporus during algal lysis and its role in the algicidal process from the transcriptome perspective. The algicidal mechanism of B. laterosporus was ascertained more comprehensively at the molecular level, providing a theoretical basis for water bloom control and a reference for the development of alternative microbial control agents for the prevention and control of cyanobacteria.

2. Results

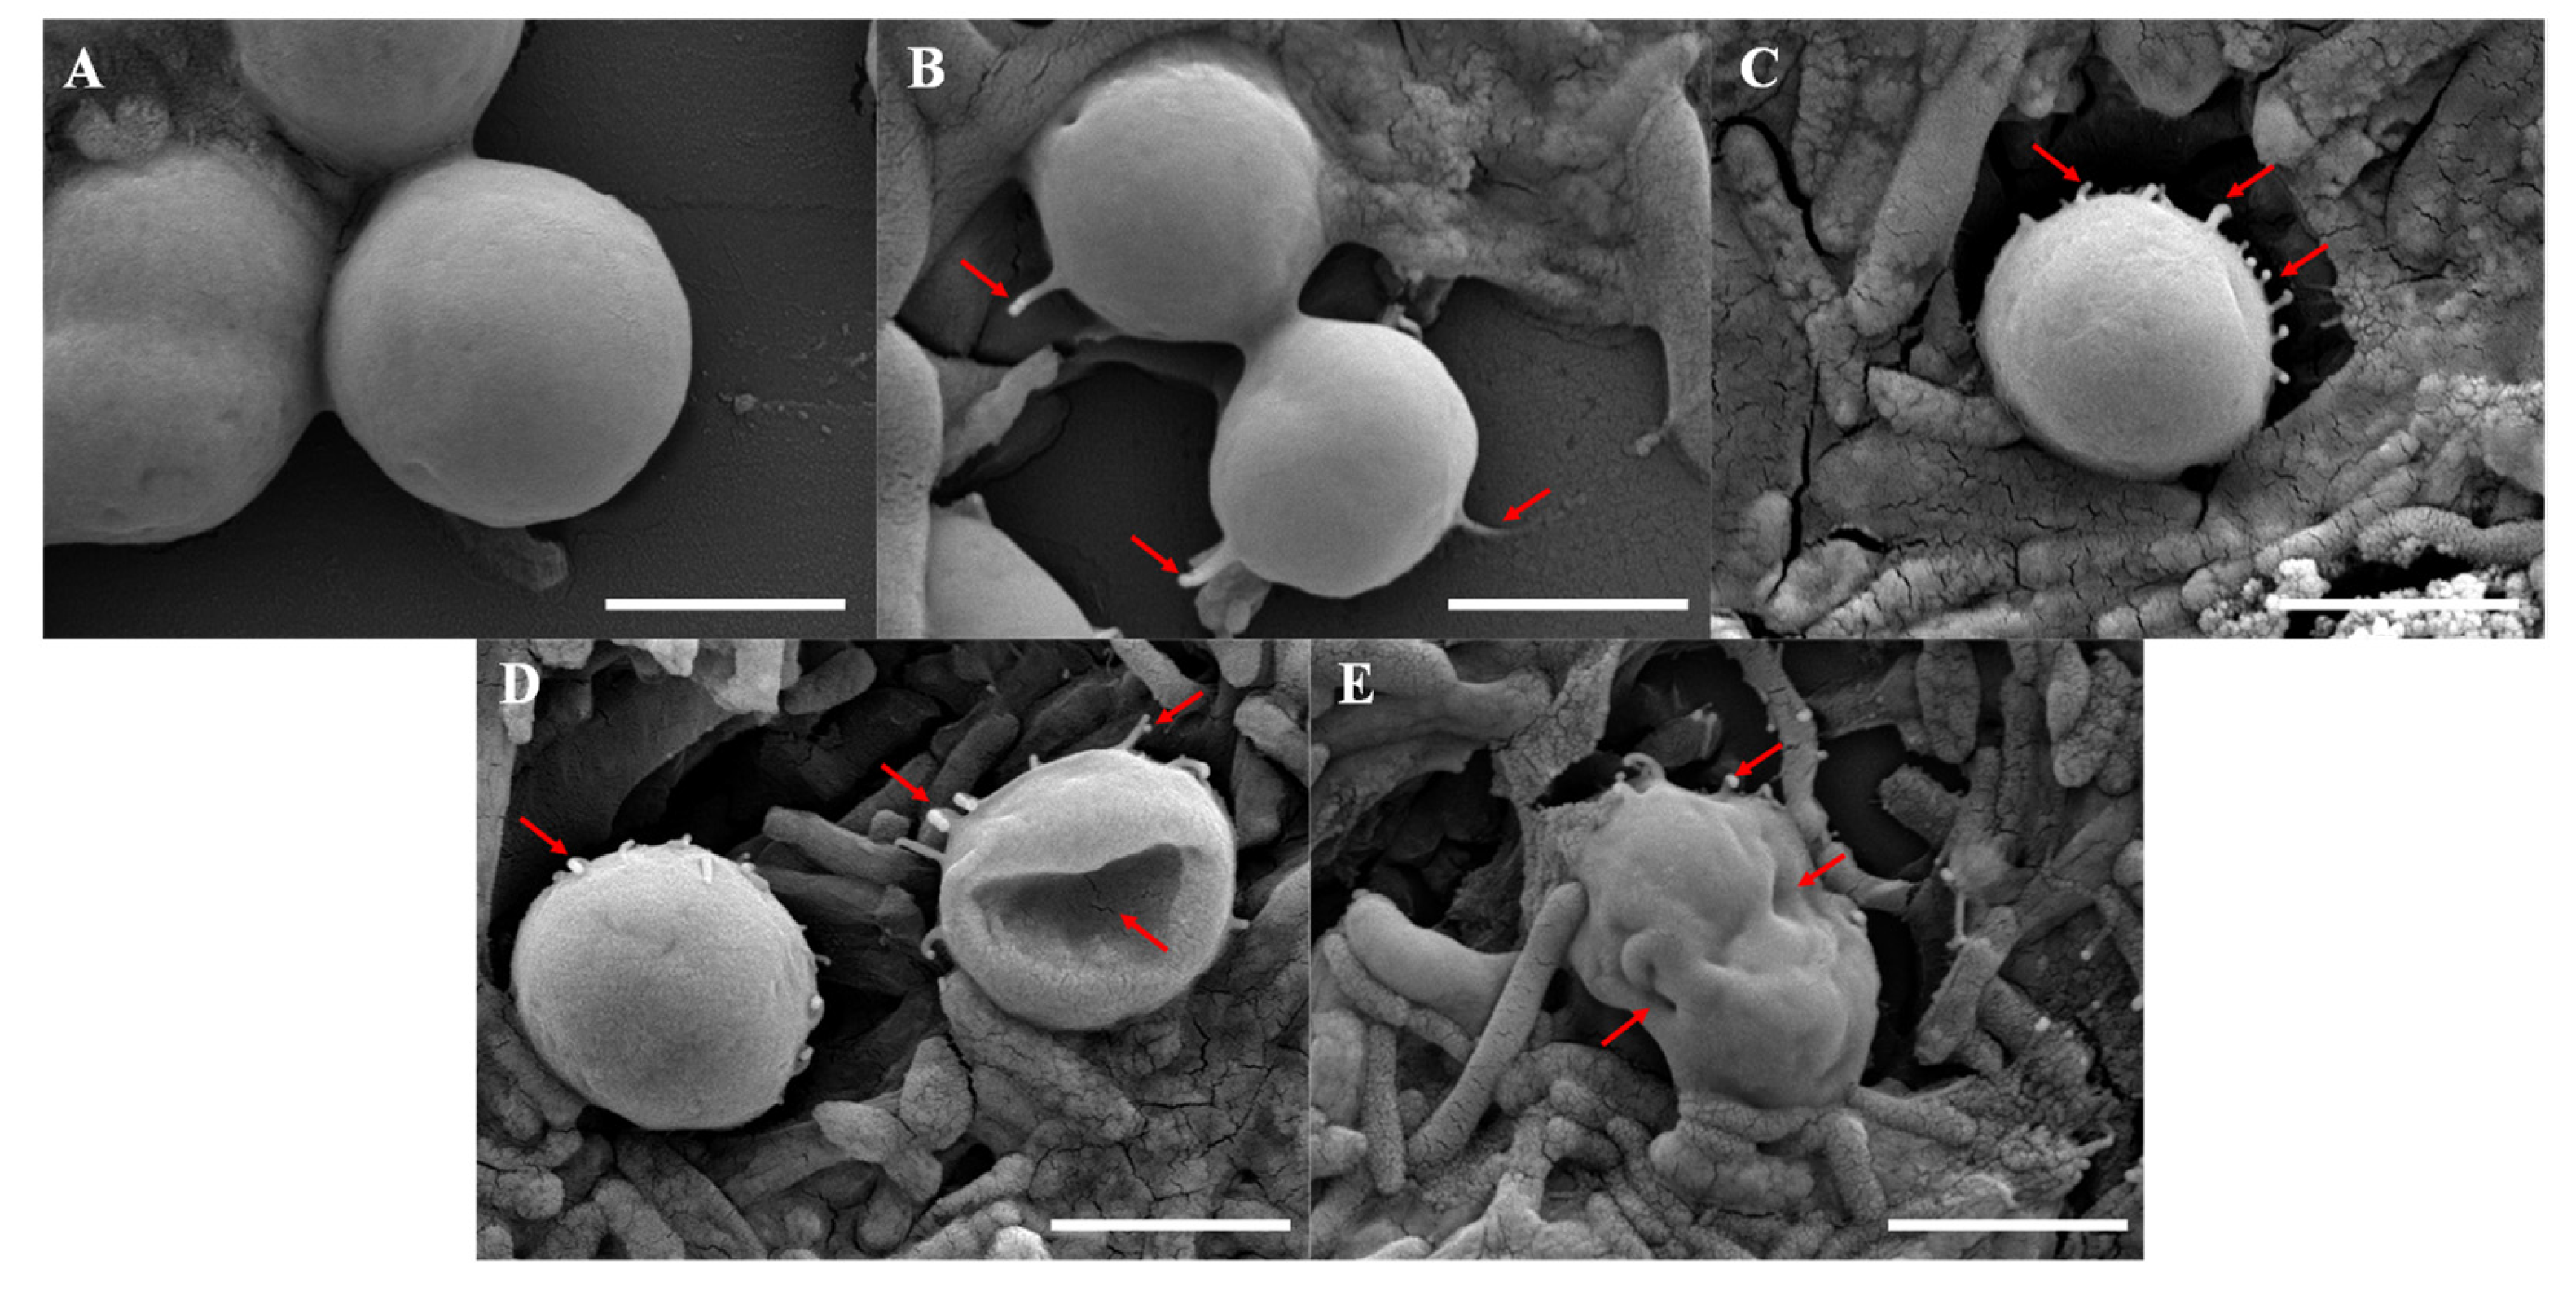
2.1. Effect of B. laterosporus on the Cell Morphology of M. aeruginosa

Figure 1 showed the morphology of M. aeruginosa, as well as that of M. aeruginosa and B. laterosporus co-cultured for four days. The M. aeruginosa cells cultured solely had a regular morphology with smooth surface (Figure 1A). When M. aeruginosa was co-cultured with B. laterosporus for one day, there were still numerous algal cells and the bacteria adhered to the algal cells (Figure 1B). There were no significant morphological changes in the algal cells with a few antenna-like mucus presented (Figure 1B). On the second day, the surface of the algal cells had many antenna-like mucus and numerous bacteria gathered around (Figure 1C). However, the algal cells began to rupture or appeared deep depressions on the third day, making a gradually incomplete morphology (Figure 1D). Finally, the number of algal cells decreased sharply on the fourth day, and the cell surface shrank and deformed severely, with many mucus substances appearing on and around it (Figure 1E).

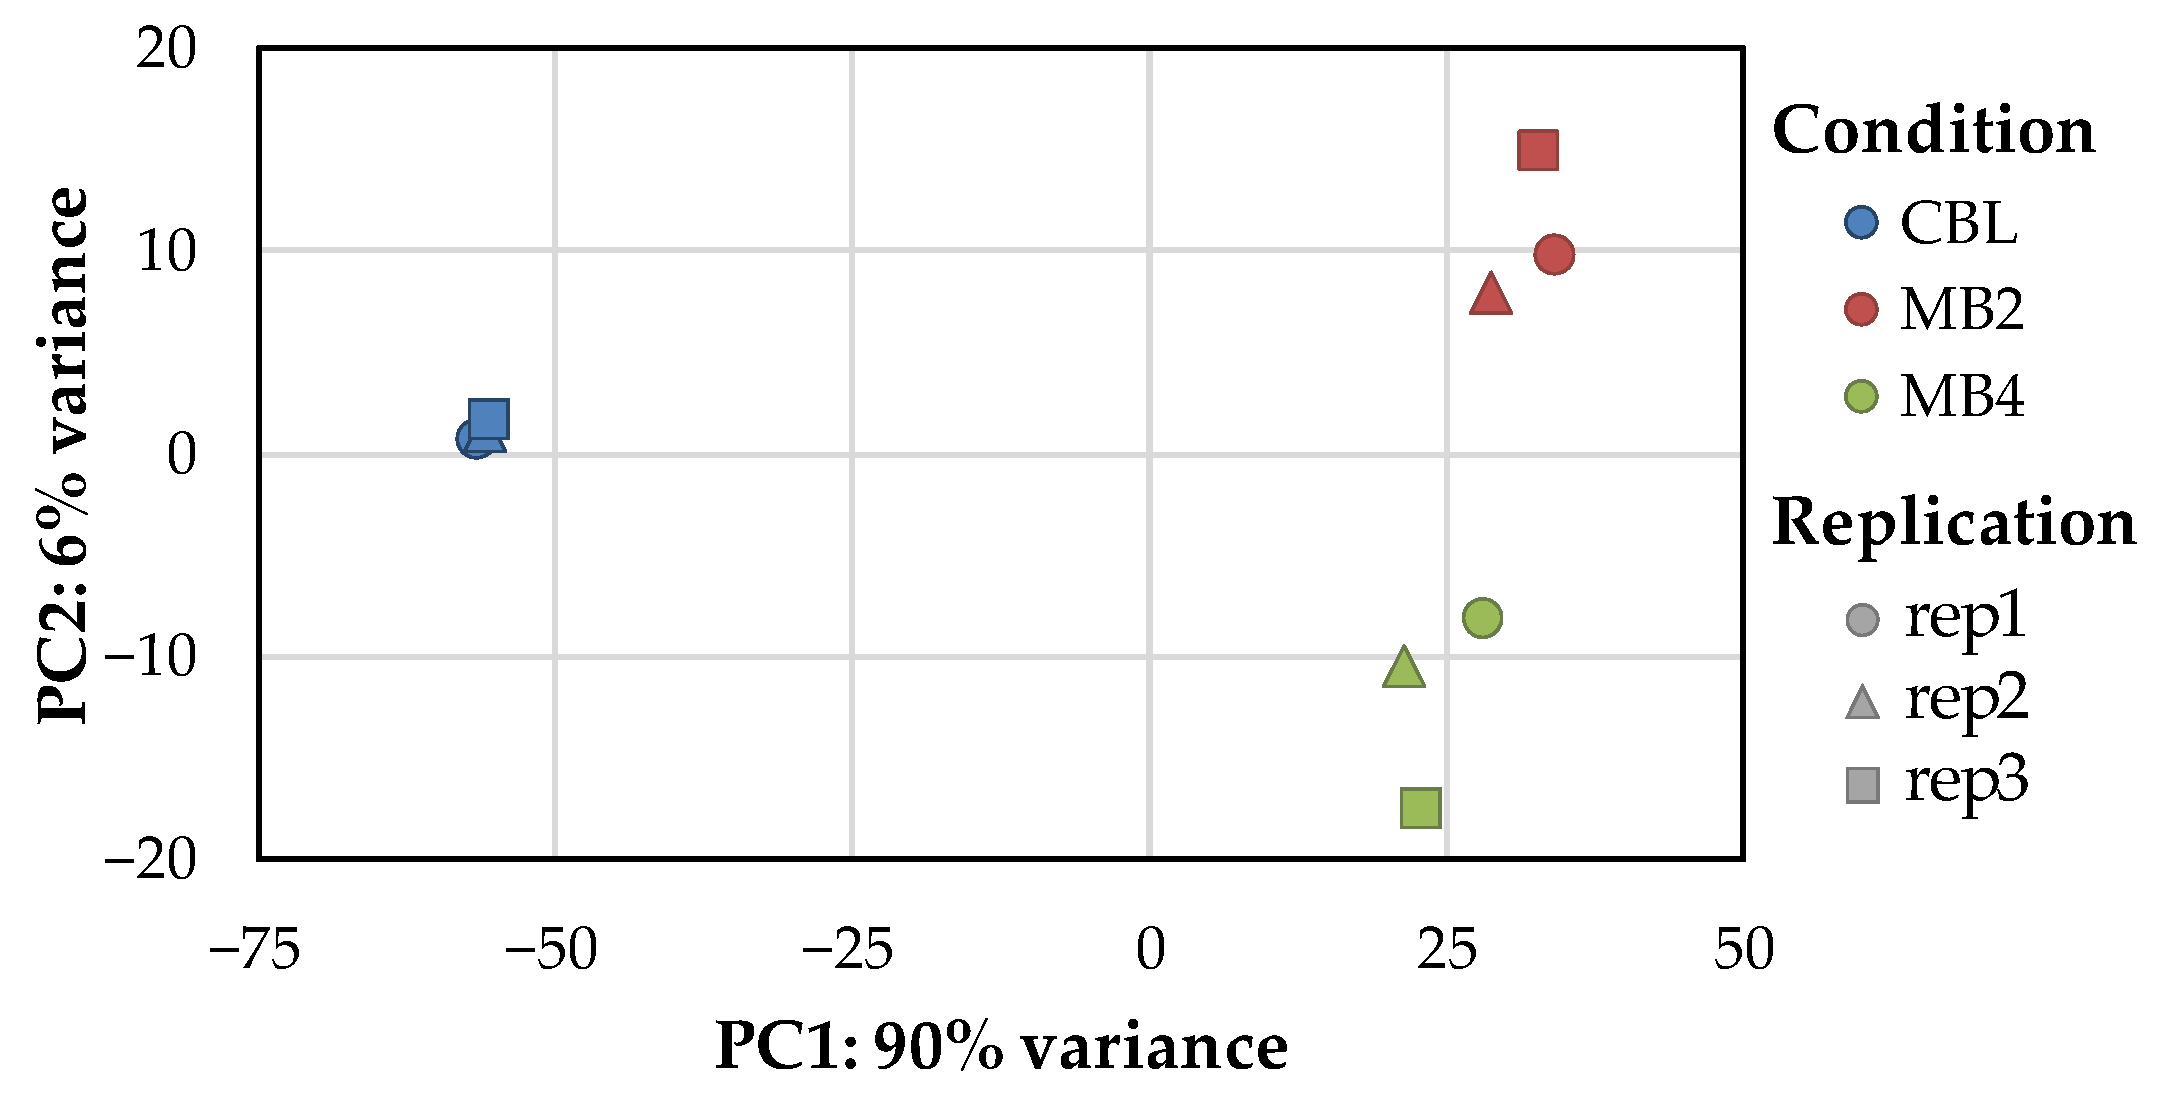
2.2. Transcriptome Sequencing, Assembly and Data Quality Analysis

Nine cDNA libraries were sequenced in three groups (Table 1). An average of 9,492,785,267 bp raw data and 63,285,235 raw reads were obtained from each sample. After filtering the adaptors and low-quality sequences from raw data, an average of 7,706,561,467 bp clean data and 51,377,076 clean reads were screened. After mapping to the reference genome, an average of 28,557,768 mapped reads were obtained. The base percentages of Q20 and Q30 in each sample were higher than 96.94% and 92.9%, respectively, indicating good assemble quality.
Principal components analysis (PCA) was performed according to the expression of each sample to group similar samples. The closer the distance, the higher the similarity between the samples. As shown in Figure 2, the three biological replicates in each treatment group (CBL, MB2, MB4) were densely distributed, but different treatment groups were separated from others at a long distance, indicating good repeatability data.

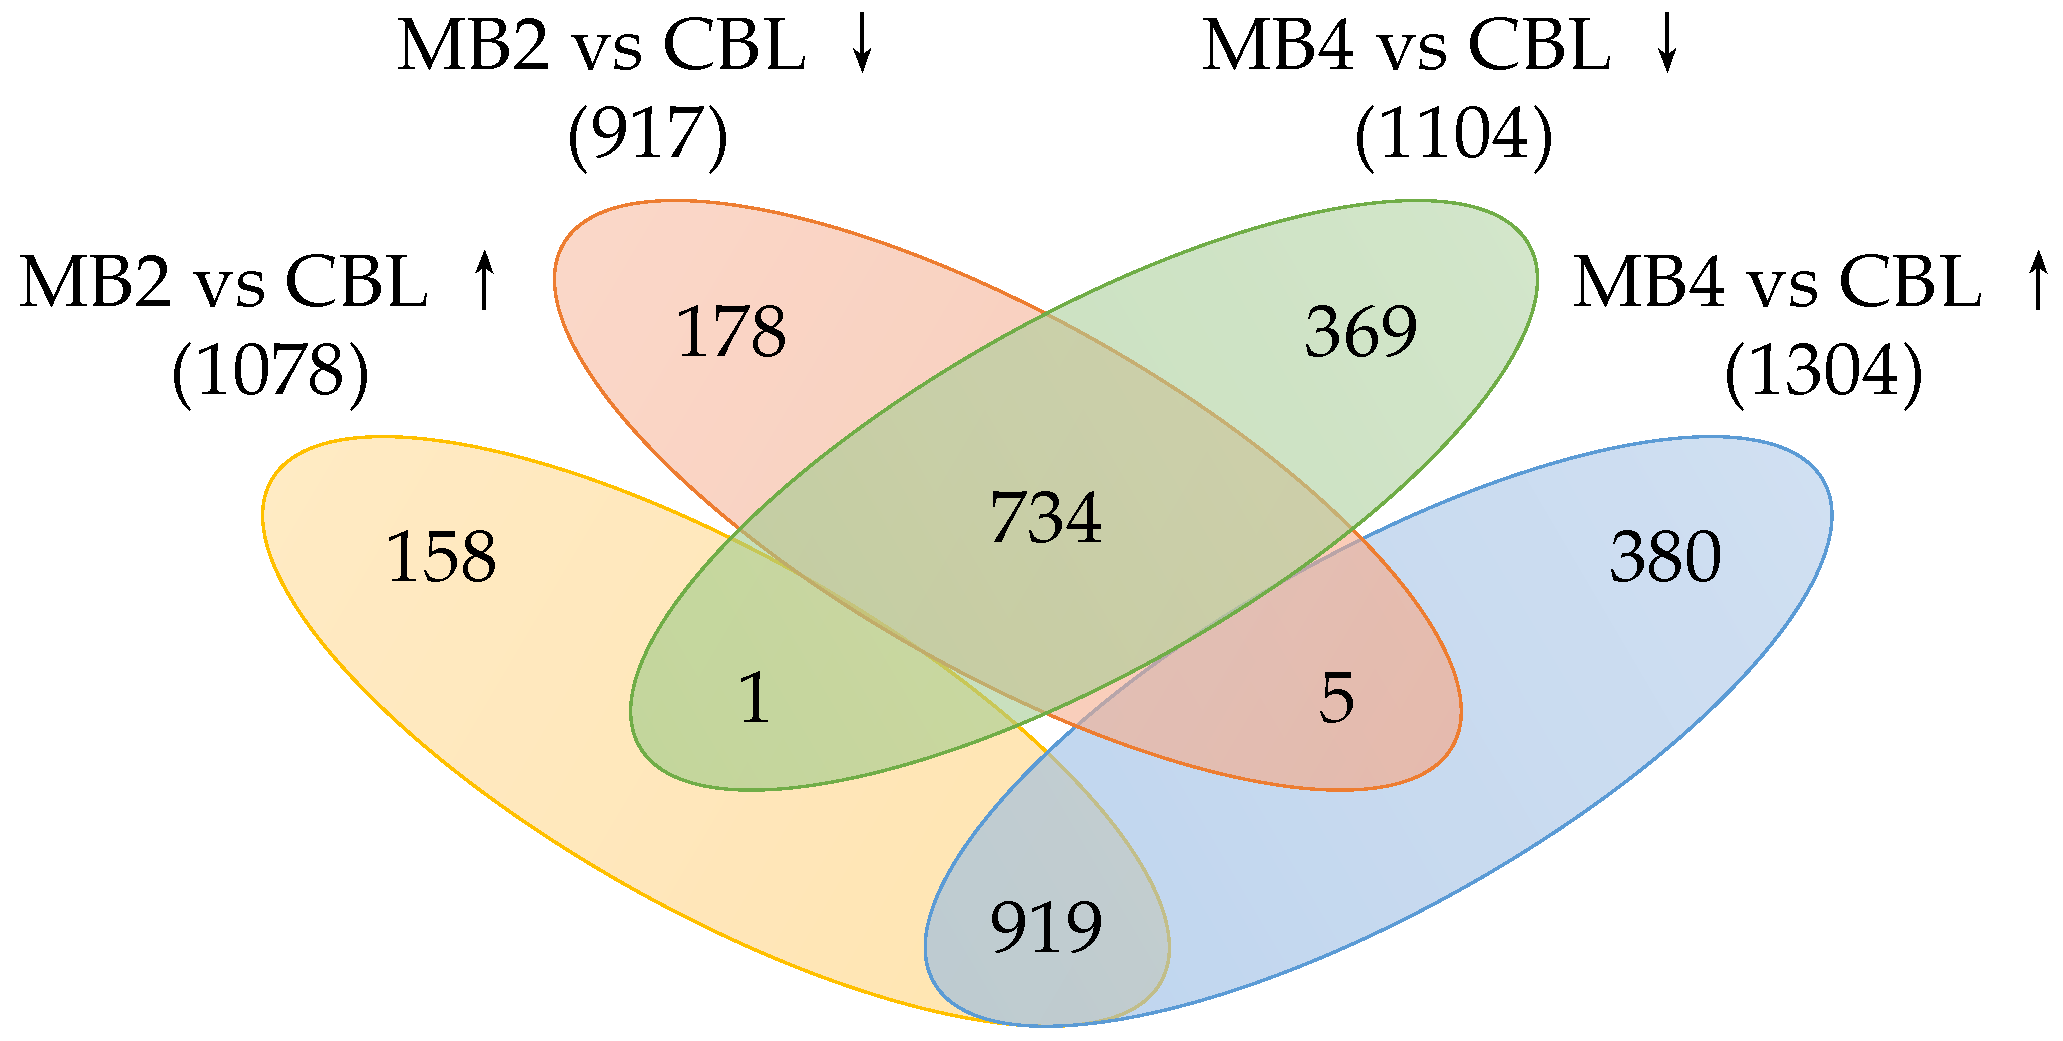
2.3. Identification of Differentially Expressed Genes

A total of 1995 differentially expressed genes (DEGs) were detected in MB2 vs. CBL, with 1078 being up-regulated and 917 being down-regulated (Figure 3). A total of 2408 DEGs were found in MB4 vs. CBL, with 1304 being up-regulated and 1104 being down-regulated (Figure 3). Both in MB2 vs. CBL and MB4 vs. CBL comparison, a total of 2744 DEGs were identified, of which 919 were up-regulated and 734 were down-regulated (Figure 3).

2.4. Enrichment Analysis of Differentially Expressed Gene Function

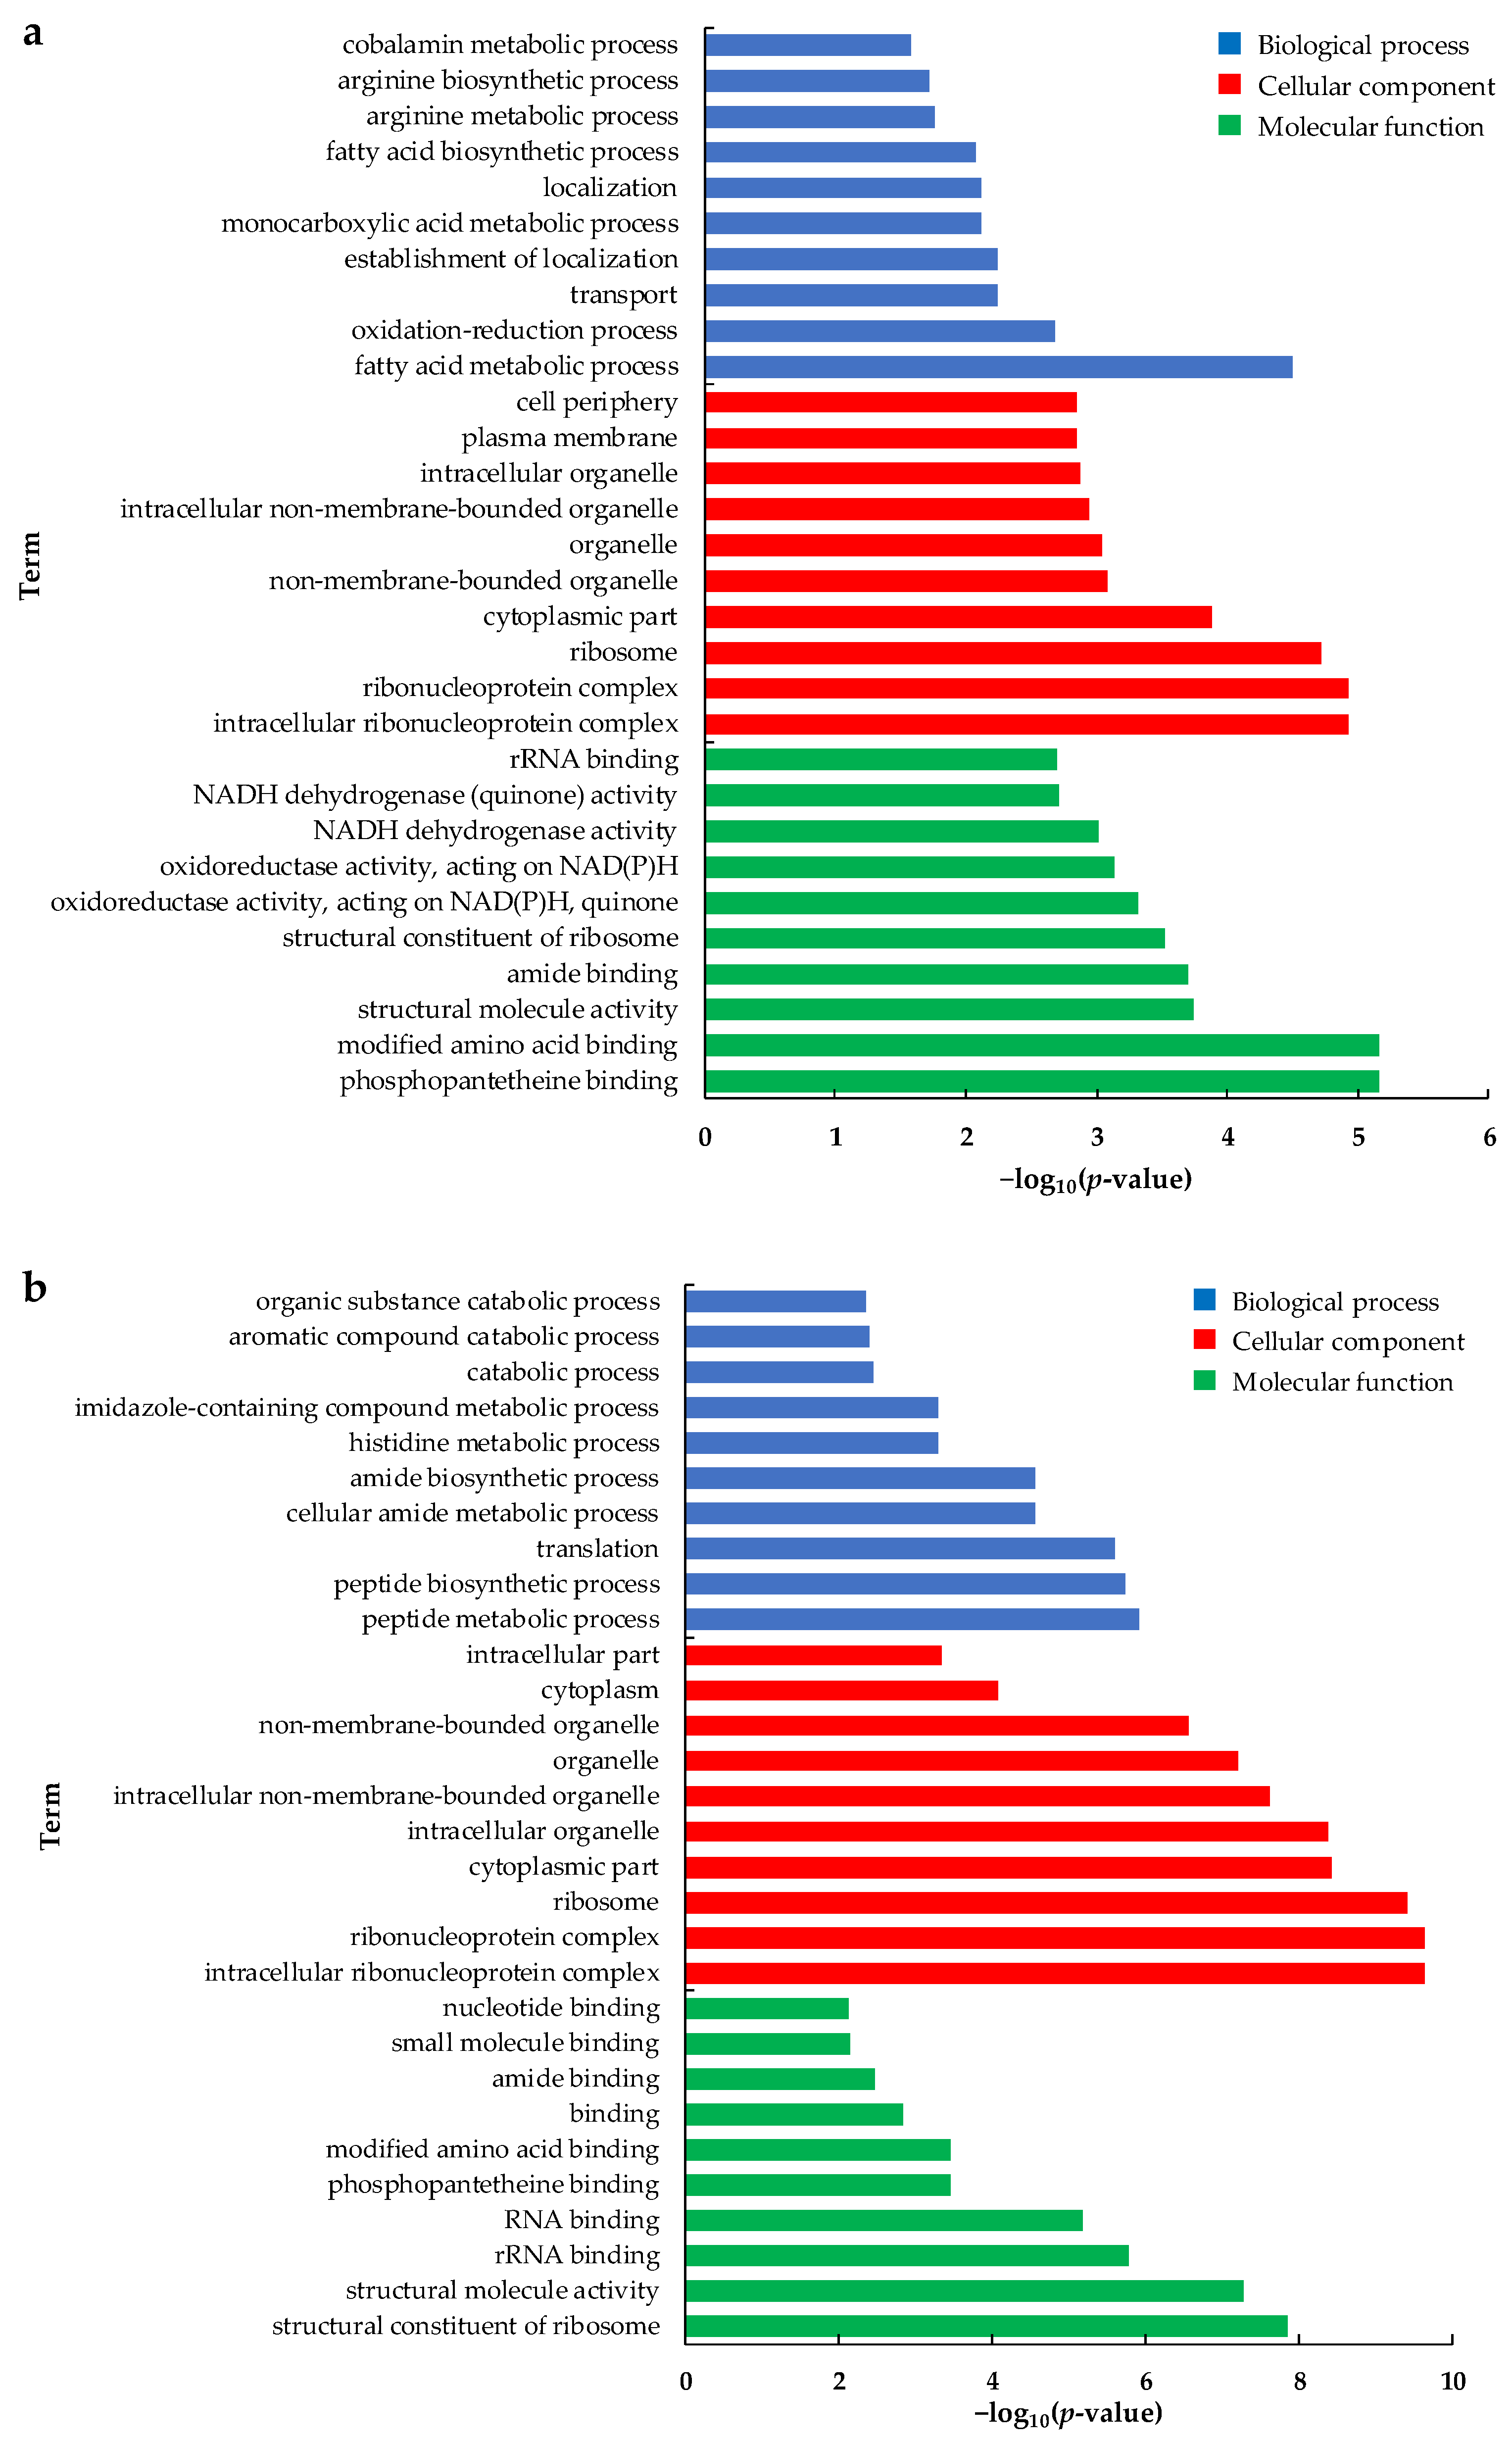
2.4.1. Gene Ontology (GO) Pathway Analysis

GO pathway analysis results of the DEGs were classified according to biological processes (BP), cellular components (CC), and molecular functions (MF) (Figure 4). In MB2 vs. CBL, fatty acid metabolism process, oxidation-reduction process, and transport were significantly enriched in biological processes (Figure 4a). Intracellular ribonucleoprotein complex, ribonucleoprotein complex, ribosome, and cytoplasmic part were enriched in cell components. Phosphopantetheine binding, modified amino acid-binding, and structural molecule activity were all significantly enriched in molecular functions. Peptide metabolic process, peptide biosynthesis process, and translation were significantly enriched in biological processes in MB4 vs. CBL (Figure 4b). Intracellular ribonucleoprotein complex, ribonucleoprotein complex, ribosome, and cytoplasmic part were enriched in cell components. The structural constituent of ribosome, structural molecule activity, rRNA binding, and RNA binding was remarkably enriched in molecular functions.

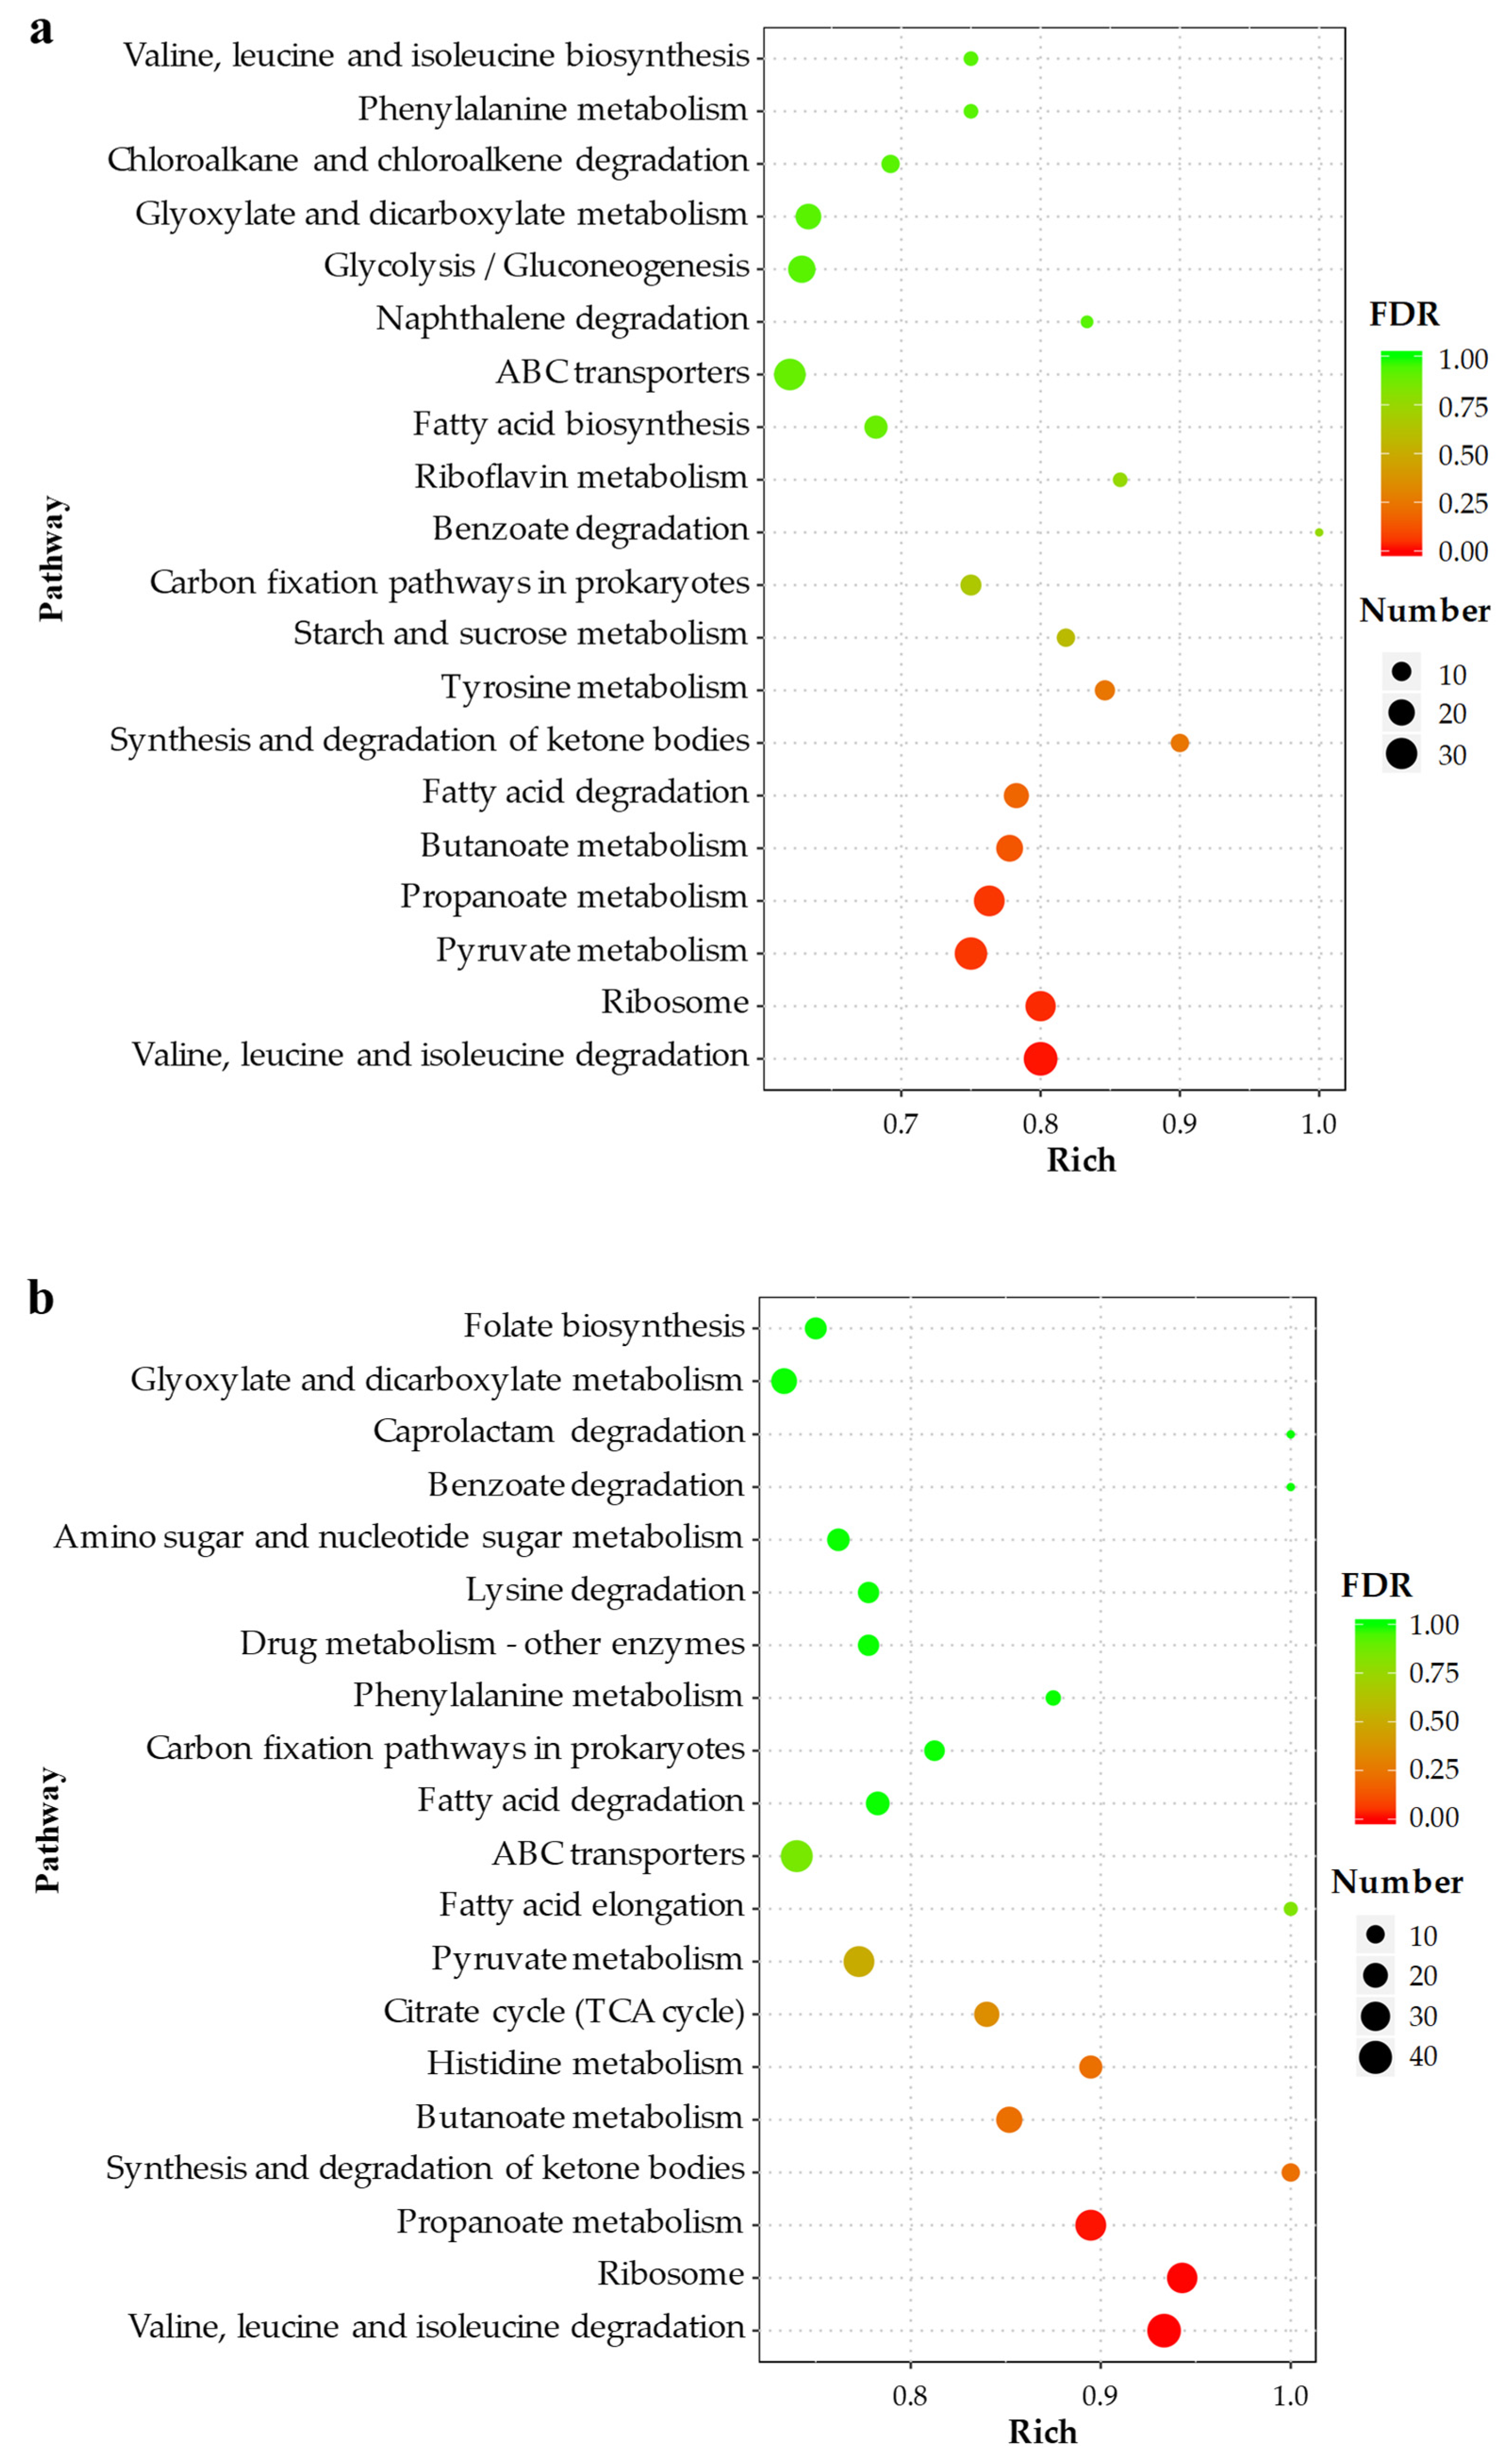
2.4.2. KEGG Pathway Analysis

KEGG pathway analysis revealed that the DEGs were enriched in 113 pathways in MB2 vs. CBL and 114 pathways in MB4 vs. CBL. Table 2 shows that the two groups were mainly enriched in amino acid metabolism, carbohydrate metabolism, and lipid metabolism at level 2. The first 20 pathways with the most significant difference between the two groups are shown in Figure 5. Except for ribosomes being involved in genetic information processing, and ABC transporters being involved in environmental information processing, all the other pathways were associated with metabolism. The degradation of valine, leucine, and isoleucine were the pathways with the most significant difference between the two groups and had the largest number of DEGs. In addition, there were significant differences in ribosome and propanoate metabolism between the two groups, and more DEGs were enriched.

2.5. Analysis of Differentially Expressed Genes

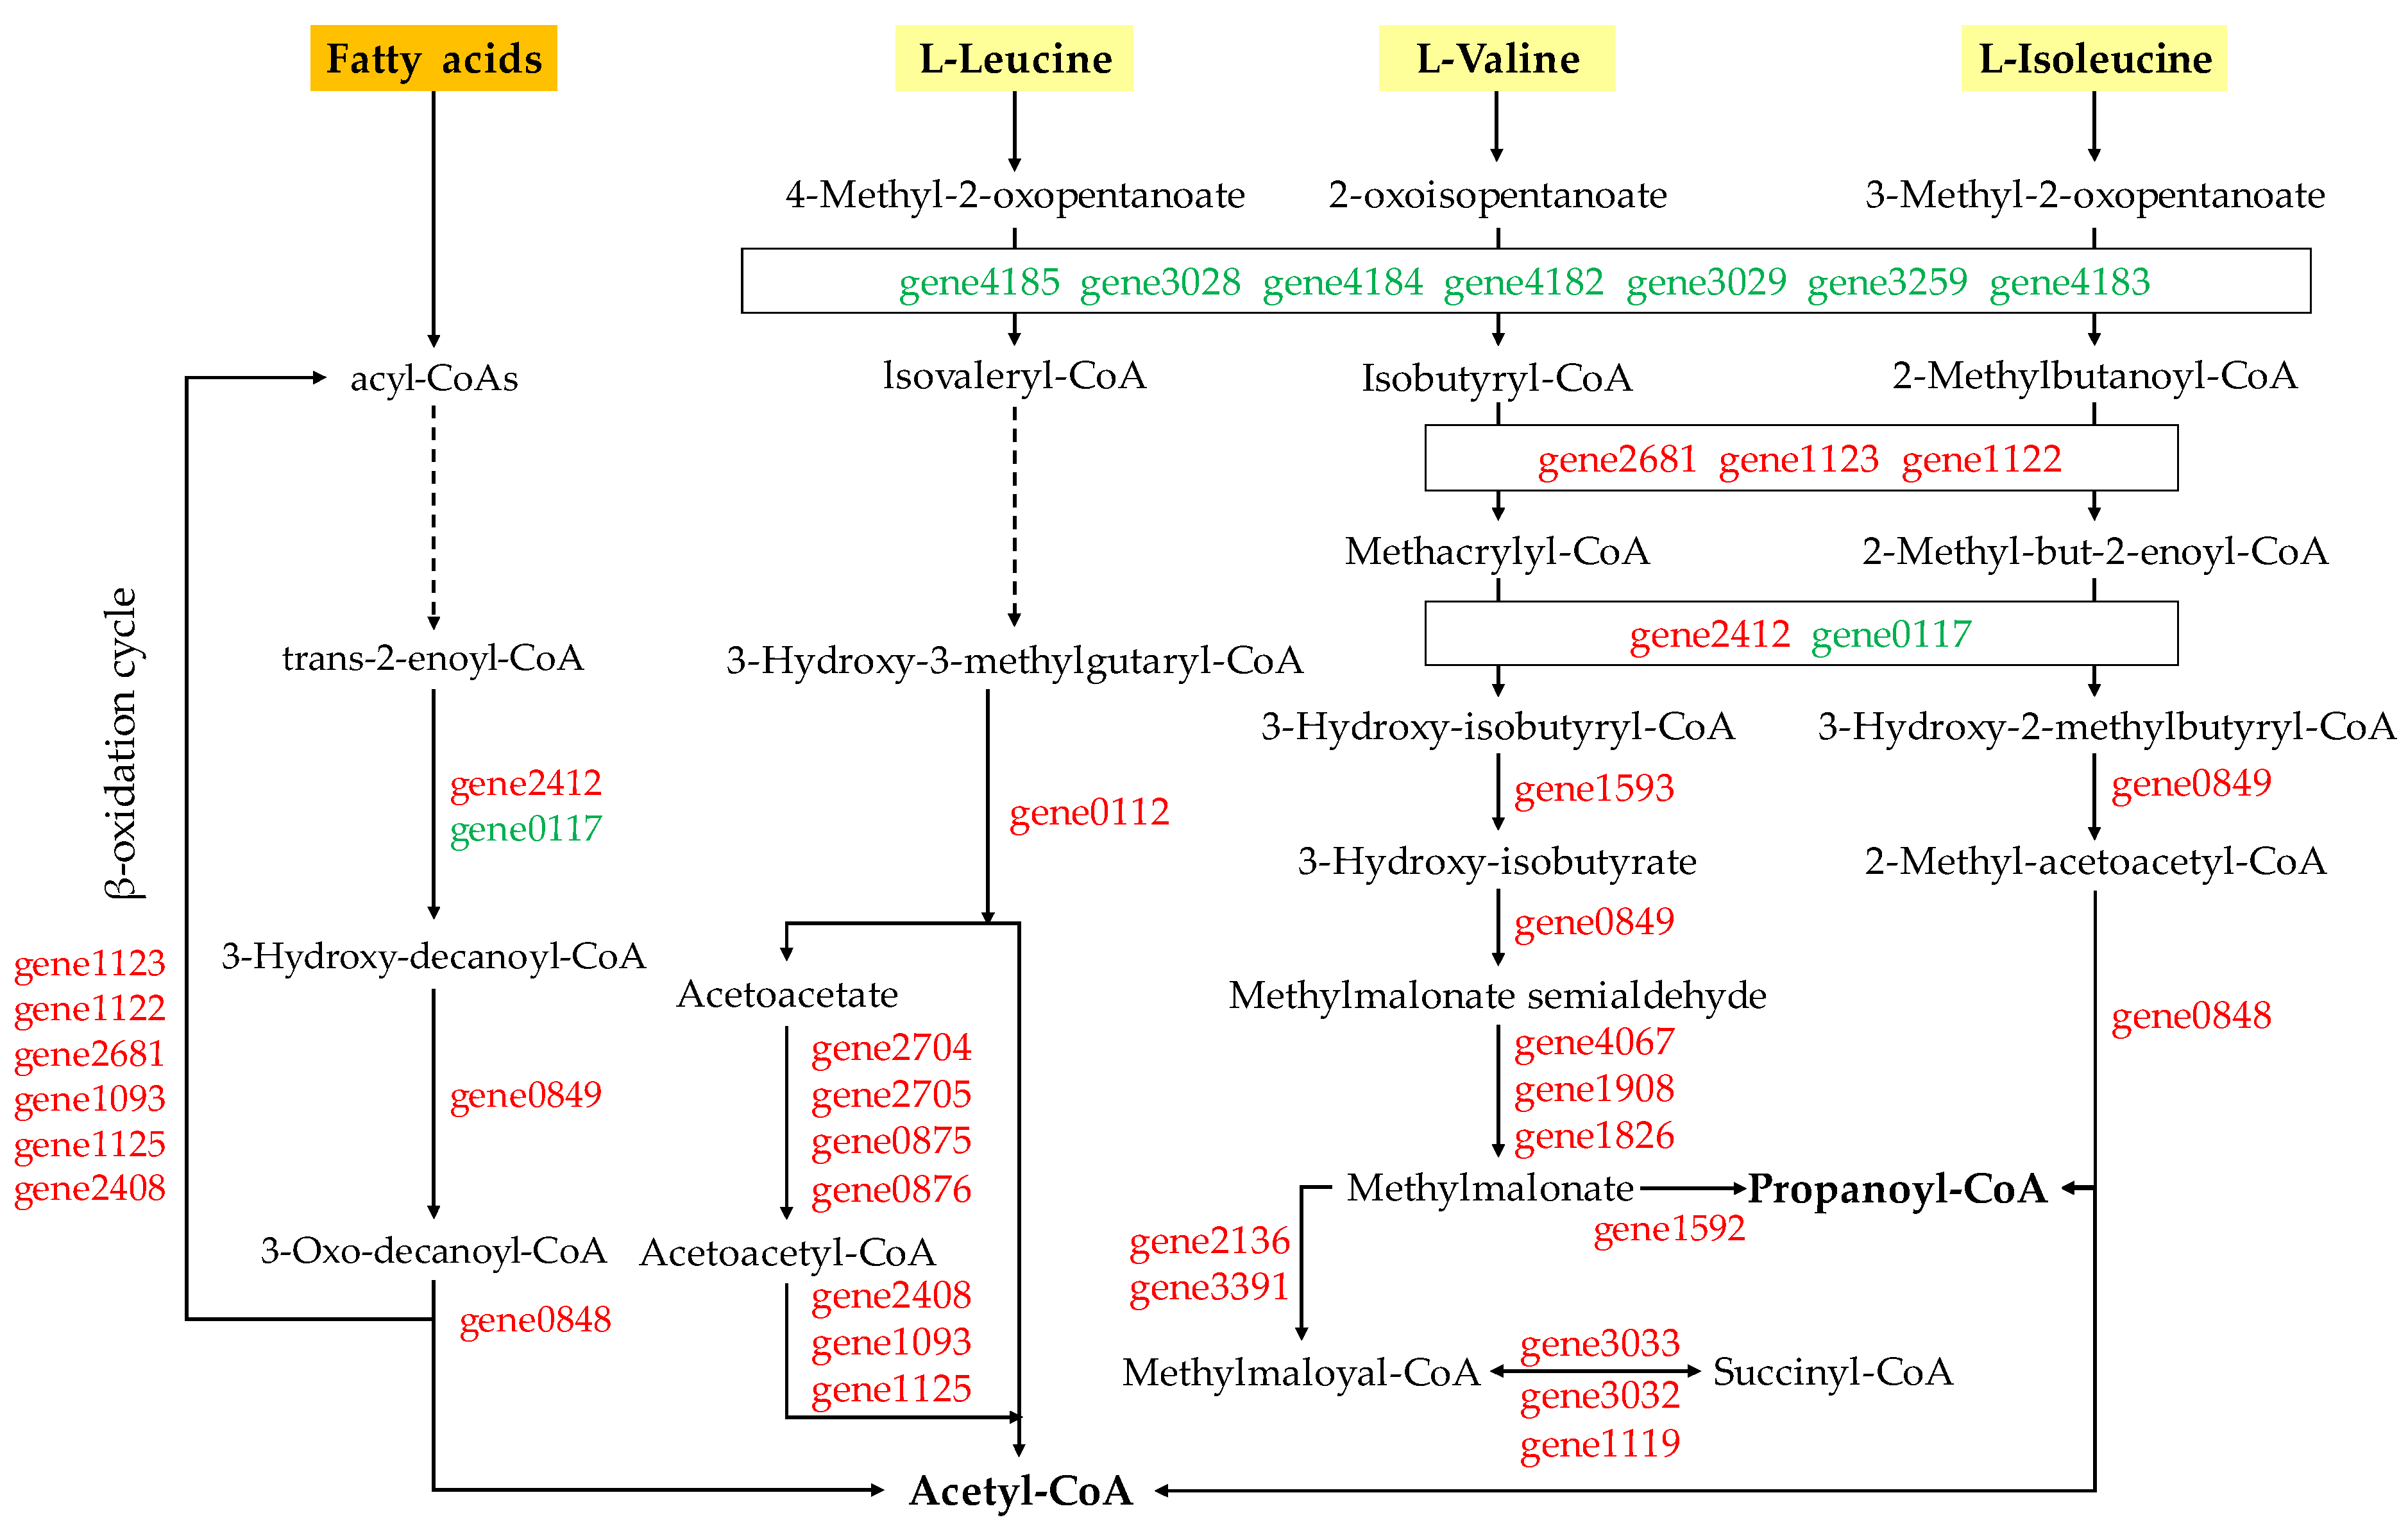
2.5.1. Degradation of Valine, Leucine, and Isoleucine and Fatty Acids

The enrichment analysis of differential genes showed that differential genes in the two groups were significantly enriched in the degradation pathways of valine, leucine, and isoleucine, as well as fatty acid degradation pathways, and the differential genes in the pathways were further analyzed (Table S1). In valine, leucine, and isoleucine degradation pathways, there were 36 DEGs in MB2 vs. CBL, with 27 DEGs up-regulated and 9 DEGs down-regulated. There were 42 DEGs in MB4 vs. CBL, in which 29 and 13 DEGs were up- and down-regulated, respectively. In the fatty acid degradation pathway, there were 18 DEGs in MB2 vs. CBL, with 14 and 4 DEGs being up- and down-regulated, respectively. There were 18 DEGs in MB4 vs. CBL, including 13 up-regulated and 5 down-regulated. Moreover, 36 genes related to valine, leucine, and isoleucine degradation and 17 genes related to fatty acid degradation were differentially expressed in both groups. In addition, 14 genes were involved in these two pathways (i.e., gene2408, gene0848, gene2681, gene4067, gene1093, gene2412, gene1125, gene1123, gene1908, gene0849, gene1122, gene1826, gene0117, and gene2964).
The degradation processes of valine, leucine, and isoleucine were mainly divided into three reactions (Figure 6). Transamination occurred in branched-chain amino acid, started with the removal of the amino group by aminotransferase or leucine dehydrogenase, giving alpha-keto acid. Then, oxidative decarboxylation was followed by the coupling dehydrogenation of the corresponding acyl-coenzyme A (acyl-CoA) derivative by a branch-ketoate dehydrogenase complex. Finally, the acyl-CoA derivatives of branched-chain amino acids were further converted to acetyl-CoA and propionyl-CoA through a separate branched-chain amino acid decomposition pathway. The expression of oxidative decarboxylation-related genes was down-regulated at 2nd day and 4th day but up-regulated in the subsequent generation of acetyl-CoA and propionyl-CoA. Most of the differential genes in fatty acid degradation pathway were also up-regulated.

2.5.2. Transporter-Related Differential Genes

The efflux pump is an important transporter. Three families, namely ABC transporter, MFS, and RND, were identified in the genome of B. laterosporus strain Bl-zj. The transporters in the up-regulated genes were screened (Table 3). There were 28 transporter-related DEGs in MB2 vs. CBL and 24 transporter-related DEGs in MB4 vs. CBL, most of which were ABC transporter-related genes, with some MFS and RND genes up-regulated. The efflux transporter protein, MFP subunit (gene3336) was significantly up-regulated on 4th day, with log2(fold change) of 5.41. In addition, some transporter genes were up-regulated, such as oligopeptide transporter, OPT family (gene1164), cyclic peptide transporter family protein (gene3098), proton-coupled thiamine transporter ThiT (gene2438), inner membrane transporter ycaM (gene1184), etc.

2.5.3. Hydrolase and Protease Related Differential Genes

Decomposition enzymes play an important role in the degradation of M. aeruginosa by T. versicolor F21a [11]. Hydrolases and proteases in the up-regulated genes were screened out in this work (Table 4). Cell wall hydrolase CwlJ (gene2308) exhibited ultra-high up-regulation in both groups, with log2(Fold Change) values on 2nd day and 4th day of 10.39 and 8.98, respectively. Furthermore, the expression levels of glycoside hydrolase, family 18 (gene3428) and glycosyl hydrolas (gene0800) were also up-regulated in the two groups. In addition, peptidase M23 (gene0479, gene1871), M23/37 (gene3430), M20 (gene0291) family proteins, minor extracellular protease Vpr domain (gene1081) and serine protease HtrA (gene0588) were also up-regulated in the two groups, with log2(Fold Change) values ranged from 3.48 to 8.58.

2.5.4. Biosynthesis-Related Differential Genes of Other Secondary Metabolites

Genes in the biosynthesis pathway of other secondary metabolites were screened out from DEGs (Table 5). As can be seen, the genes related to novobiocin biosynthesis, prodigiosin biosynthesis, acarbose and validamycin biosynthesis, streptomycin biosynthesis, monobactam biosynthesis, carbapenem biosynthesis, and phenazine biosynthesis changed significantly. Among them, the genes related to prodigiosin biosynthesis, acarbose and validamycin biosynthesis, streptomycin biosynthesis, and monobactam biosynthesis were up-regulated, while the genes related to carbapenem biosynthesis were down-regulated.

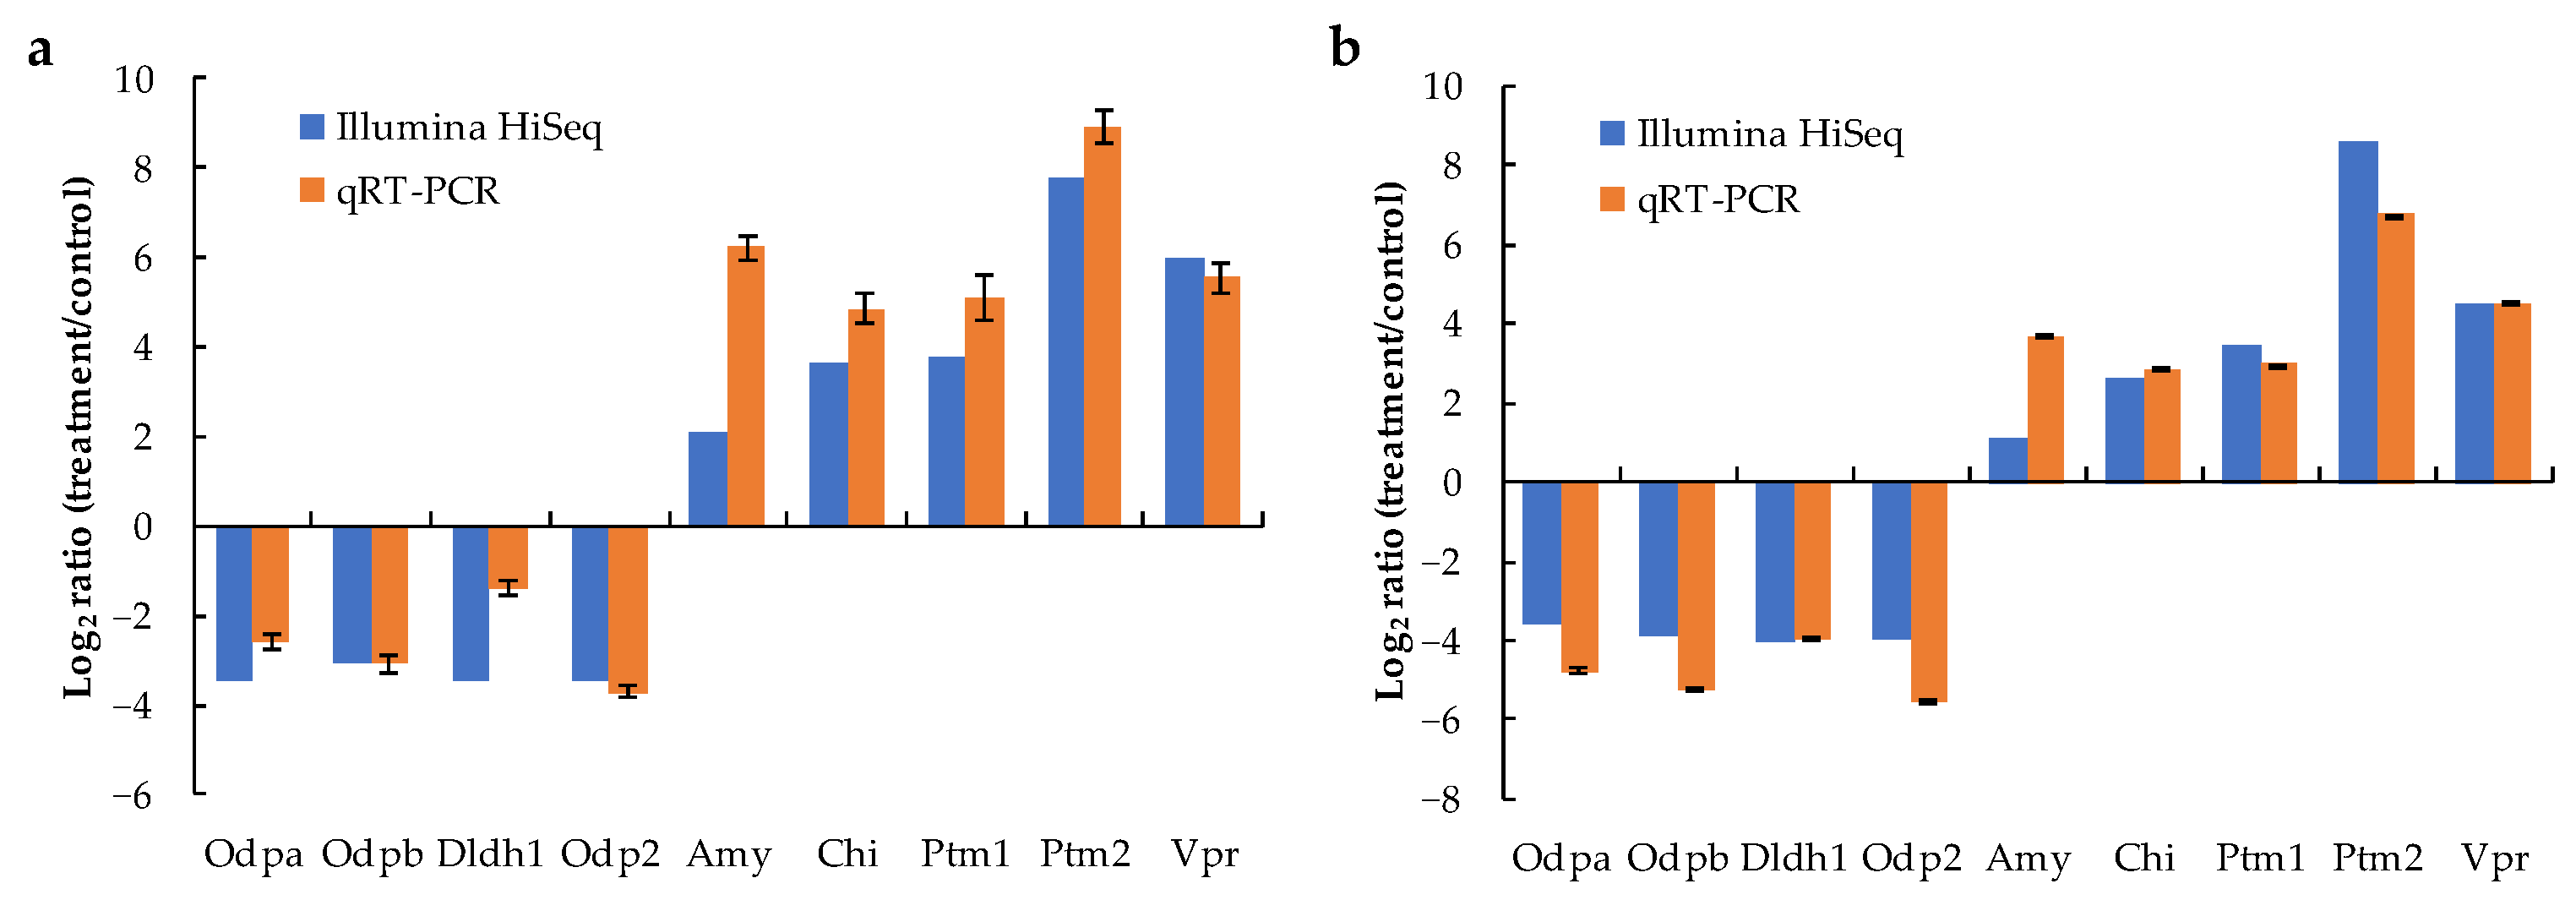
2.6. Results of qRT-PCR

Nine genes were selected for validating RNA-seq results using qRT-PCR assay (Figure 7). Although the fold changes were not identical, the up- and down-regulation patterns of the nine genes presented the same trend in RNA-seq and qRT-PCR results, indicating that the transcriptome results were reliable.

3. Discussion

We found that metabolism and ribosome-related pathways through enrichment of GO and KEGG pathways was mainly involved in the algicidal effect of B. laterosporus strain Bl-zj against M. aeruginosa. The genes related to amino acid metabolism, carbohydrate metabolism, lipid metabolism, energy metabolism, biodegradation of harmful substances, and biosynthesis of other secondary metabolites were mainly up-regulated. The up-regulation of the first four pathways may indicate that B. laterosporus needs energy to secrete extracellular substances and grow. The up-regulation of genes in the latter two pathways may indicate that B. laterosporus secretes substances to inhibit cyanobacteria while resisting the possible harmful effects by M. aeruginosa. Morphology and ultrastructure of microbial cells were prone to modification or even destruction when exposed to toxic substances [17]. The cells of M. aeruginosa began gradually to rupture after one day of co-culture, which was largely affected by the toxic substances released by B. laterosporus.
Bacteria can degrade branched-chain amino acids (valine, leucine, and isoleucine) and fatty acids into small molecules and use them as carbon and energy sources to obtain ATP and energy. Differential genes are mainly involved in these two degradation pathways in the enrichment analysis of differential proteins showing that T. versicolor F21a decomposes M. aeruginosa [11]. Acetyl-CoA is an important cofactor in microbial cells and also an important intermediate metabolite of energy metabolism that plays a key role in the metabolic process. Acetyl-CoA can enter the tricarboxylic acid cycle and oxidative phosphorylation, releasing energy and producing ATP. The genes related to fatty acid degradation were mainly up-regulated on 2nd day and 4th day of co-culture, while the genes related to oxidative decarboxylation in the degradation of valine, leucine, and isoleucine were down-regulated, but the genes related to acetyl-CoA and propionyl-CoA were up-regulated in the subsequent generation. This indicates that the process of producing acetyl-CoA is not hindered, which may be due to the high content of chain acyl-CoA derivatives of branched-chain amino acids in cells, allowing them to avoid deamination and oxidative decarboxylation of branched-chain amino acids to ensure that the subsequent process acetyl-CoA production is normal. Acetaldehyde dehydrogenase (gene4067) can convert acetaldehyde into acetic acid, which is further converted into acetyl-CoA. On 2nd day and 4th day of co-cultivation, the log2(fold change) of gene4067 was 6.45 and 4.51, respectively. Acetyl-CoA content may be increased by overexpressing acetaldehyde dehydrogenase in Saccharomyces cerevisiae [18], which implies that the production of ATP may increase.
The efflux pump participates in a variety of physiological functions in bacteria and is crucial for the pathogenic process of bacteria. The ABC transporter family plays the most important and extensive role in the efflux pump system [19]. Environmental adaptability and bacterial viability are both dependent on ABC family transporters. The up-regulation of the expression of ABC transporters indicates an increase in the transport of substances inside and outside the cell. The transporters transfer the compounds extracellularly secreted by the bacteria during the process of Bl-zj algal degradation; on the other hand, the bacterium absorb the nutrients decomposed and released by the cyanobacteria after death, transporting and using them in the cells. Moreover, ABC transporters require ATP for material transport, which may also be the reason for strengthening the decomposition of branched-chain amino acids and fatty acids to produce acetyl-CoA and generate more energy. In a study on the algae-killing mode and stability of ZFX1 [20], it has been shown that the supernatant of ZFX1 could destroy the structure of the algal cell membrane, making the membrane system hard, and thus destroying the function of the membrane system. B. laterosporuswas has been shown to secrete bioactive metabolites that destroy the Oscillatoria’ system of membrane, photosynthesis, and antioxidant enzyme, which would deprive its normal physiological and metabolic function [14]. This observation also indicates that transporters play an important role in algae-lysing bacteria by releasing algae-lysing substances.
During the algae-lysing process of Tramates versicolor F21a, the activities of glycoside hydrolase, coenzyme, carbohydrate esterase, and polysaccharide lyases were significantly up-regulated, suggesting that these enzymes may degrade lipopolysaccharide, peptidoglycan, and alginate in algal cells [12]. In our work, the high up-regulated glycoside hydrolase family 18 (GH18) was chitinase, which is an antagonistic substance against pathogenic bacteria with an inhibitory effect on cyanobacteria. Hydrolases in algae-lysing bacteria can dissolve the cell wall of cyanobacteria and kill the algal cells. Hu et al. [21] found a β1,3-glucanase in the marine bacteria Microbulbifer sp. ALW1 can digest laminarin in the cell wall of brown algae. On the second day and fourth day, GH18 and cell wall hydrolase of B. laterosporus were significantly up-regulated. During the algae degradation, B. laterosporus releases hydrolases into the extracellular space, which may destroy the living algal cells or hydrolyze dead algal cells. Whatever function the hydrolases play, they are all important substances required by B. laterosporus in the process of algal degradation. Moreover, B. laterosporus secretes hydrolase extracellularly, which also requires the use of efflux pumps to facilitate the flow of material.
Antibiotics are secondary metabolites produced during bacterial growth that have an anti-pathogen effect and further activities, which can interfere with the development of other live cells. The expression of some genes related to antibiotic biosynthesis in Bl-zj was up-regulated during the algal degradation, suggesting that the released antibiotics may increase during this process [22]. Many antibiotics are cytotoxic, and the up-regulated antibiotics in these biosynthetic pathways are potential algae-lysing substances of B. laterosporus. Among them, the expression of prodigiosin biosynthesis pathway is up-regulated. Prodigiosin (PG) is a kind of natural pigment with insecticidal activity [23], bactericidal [24], and algicidal [25] effects. In addition to inhibiting Heterosigma akashiwo [26] and Phaeocystis globosa [27], PG isolated from Hahella sp. KA22 displays excellent algacidal action against M. aeruginosa [28]. PG causes the production of reactive oxygen species (ROS) by M. aeruginosa and lipid peroxidation of the algal cells, as well as destroys the function of the membrane system and the light system of the algal cells, resulting in the death of M. aeruginosa. Serratia marcescens LTH-2 secreted PG of strong degradation activity on M. aeruginosa strains TH1, TH2, and FACHB 905 [29]. In addition, the biosynthesis-related genes of acarbose and validamycin, streptomycin, monobactam, and novobiocin were also up-regulated. Streptomycin is toxic to M. aeruginosa and Chlorella vulgaris, affecting the transcription of photosynthesis-related genes in these two algae and preventing electron transport and excessive production of ROS [30]. Novobiocin induces DNA damage and apoptosis in CBL cells by activating ROS production [31].
In addition to hydrolytic enzymes and antibiotics, extracellular proteases may be involved in the degradation of cyanobacteria. M23 family peptidase and Vpr were up-regulated on 2nd day and 4th day. The M23 family includes amide enzymes or endopeptidases that can degrade bacterial cell walls. These peptidases can specifically cleave the link between N-acetylmuramoyl-L-alanine amidase and peptide bridges in the bacterial cell wall peptidase network. Bacteria secrete M23 family proteases to degrade the cell wall of other bacteria in order to perform defensive and offensive functions. The cell wall of M. aeruginosa is also composed of peptidoglycan. M23 family proteins may destroy the cell wall of M. aeruginosa [32]. Vpr is an extracellular alkaline serine protease. Bhaskar et al. reported that Bacillus proteolyticus CFR3001 can secrete an alkaline protease to degrade the cell wall of pathogenic bacteria and lyse the cells [33]. According to the results of Du et al. [34] extracellular proteases released by T. versicolor F21a may be the key to Microcystis degradation, whose rate was positively correlated with the activities of these enzymes. Zeng et al. [35] found that P. chrysosporium could degrade soluble proteins in algal cells, block nutritional supply, and effectively inhibit algal growth. Barbieri et al. [36] studied a transcription regulatory factor CodY in low-G+C Gram-positive bacteria and reported that Vpr became one of the most abundant proteins in the exoproteome of Bacillus subtilis in the CodY-null mutant strain.
Competition or synergy often exits between organisms in a common environment [37]. Previous study analyzed the transcriptional changes of M. aeruginosa co-cultured with B. laterosporus [16], which suggested that B. laterosporus could block the electron transport by attacking the PSI system and complex I of M. aeruginosa, affecting the energy acquisition and causing oxidative damage. This further led to the lipid peroxidation of the microalgal cell membrane, resulting in algal death. In this study, under the stimulation of M. aeruginosa, B. laterosporus could inhibit the growth of cyanobacteria and even destroy its cells by regulating the transcription levels. By increasing the secretion of functional substances such as antibiotics, hydrolases and proteases, B. laterosporus would cope with the competition brought by cyanobacteria in the living environment. In addition, as protein synthesis/turnover in ribosomes is an energy-intensive cellular process, the decline in ribosomal biogenesis may serve as an alternative mechanism to achieve energy-saving and healthy aging [38]. There were significantly enriched in ribosome pathway between the two groups, and most genes related in nucleotide metabolism and translation were down-regulated. Therefore, it is speculated that B. laterosporus may delay its life cycle to improve the survival ability and competitiveness by saving energy, to take an advantage in niche competition.

4. Conclusions

The mechanism of algal lysis of B. laterosporus against M. aeruginosa was investigated in this study based on the analysis of morphology and transcription level. B. laterosporus inhibits the growth of M. aeruginosa, causing serious damage to its cell morphology. GO enrichment analysis showed that the group MB2 vs. CBL exhibited the largest enrichment in intracellular ribonucleoprotein complex, ribonucleoprotein complex, phosphopantetheine binding, and fatty acid metabolic process. MB4 vs. CBL was the most enriched in intracellular ribonucleoprotein complex, ribonucleoprotein complex, structural constituent of ribosome, and peptide metabolic process. In the KEGG pathway, the two groups were mainly enriched in amino acid metabolism, carbohydrate metabolism, lipid metabolism, and energy metabolism. Transcriptome analysis showed that B. laterosporus produced ATP and energy by degrading valine, leucine, isoleucine, and fatty acids, and destroyed the algal cells using efflux pump transporters, secretion of hydrolytic enzymes, antibiotics, proteases, and other secondary metabolites such as prodigiosin, resulting in cyanobacteria death and achieving the effect of algae lysis.

5. Materials and Methods

5.1. Co-Cultivation of B. laterosporus and M. aeruginosa

M. aeruginosa FACHB 905 was purchased from the Freshwater Algae Culture Collection at the Institute of Hydrobiology, Wuhan, China. It was cultured on BG11 media [39] at 28 ± 1 °C under 50 µmol·m−2·s−1, and a light–dark cycle of 12 h: 12 h for seven days to reach the exponential growth stage. B. laterosporus strain Bl-zj was isolated from intertidal soil, activated and expanded in beef extract peptone liquid medium, then cultured at 30 °C and shaken at 150 rpm for 12–18 h to reach the exponential growth stage.
The cell concentrations of M. aeruginosa and B. laterosporus Bl-zj were adjusted to 1 × 10⁷ cells·mL−1. A total of 50 mL of M. aeruginosa and 50 mL of the bacterium (cell density ratio = 1:1) were added to 400 mL of the BG11 medium. The control group (CBL) consisted of 50 mL of B. laterosporus added to 450 mL of the BG11 medium. Three parallel experiments were set up in each group. The treatments were placed in a 28 °C incubator, under 50 µmol·m−2·s−1, and a light–dark cycle of 12 h: 12 h for static culture, with three times manually shaken a day. The experiment lasted 4 days when the co-cultured group was turned yellow and the cyanobacteria biomass was at a low proportion.

5.2. Specimen Preparation for Scanning Electron Microscopy

A total of 20 mL of the samples were obtained from each group every other day, and then the supernatant was removed after centrifugation. After three times of rinse, 1 mL of 2.5% glutaraldehyde solution was added for fixation. Gradient dehydration was subsequently performed by a series of ethanol solutions (30, 50, 70, and 80%). The specimens were centrifuged to remove the supernatant after 15 min. After two washes with 100% ethanol, 500 μL of 100% ethanol was added to resuspend. Droplets of 10 μL of the resuspended sample were deposited on the surface of the microscope slide and frozen at −80 °C for 2 h. Using a freeze dryer (CryoStar NX50 HOVPD, Thermo Fisher Scientific, Waltham, MA, USA), the droplets were dried and fixed on the slide for observation using a scanning electron microscope (Tescan MIRA, 3XMH, Brno, s.r.o, Czech Republic).

5.3. Transcriptome Sample Processing and Sequencing

The cell concentrations of M. aeruginosa and B. laterosporus were adjusted to 1 × 10⁷ cells/mL and co-cultured at a ratio of 1:1. A single culture of B. laterosporus was set as the control group (CBL group). Bacterial specimens were collected from the culture medium on second day (MB2 group) and fourth day (MB4 group) of the experiment, immediately frozen using liquid nitrogen, and stored in a refrigerator at −80 °C. Three parallels were set for each group.
Total RNA was extracted from the samples using RNAprep Pure Plant Plus Kit (Polysaccharides & Polyphenolics-rich, TANGEN, Beijing, China). Following RNA concentration, purity and integrity were detected, rRNA in total RNA was removed, and the rRNA product was interrupted to synthesize double-stranded cDNA and complete cDNA repair. The product joints were connected, the connector was purified, the enriched fragment library was amplified by PCR, and the sequencing library was constructed. The high-throughput sequencing part of this experiment was conducted by Shanghai Parsono Biotechnology Co., Ltd. (Shanghai, China) using Illumina HiSeq 2500 platform for transcriptome sequencing.

5.4. Analysis of Differential Expressed Genes

The high-quality data filtered from original data with reference genome was compared and annotated. HTSeq 0.6.1p2 (http://www.huber.embl.de/users/anders/HTSeq, accessed on 30 October 2019) was used to count the number of reads on each gene as the original gene expression, and FPKM (Fragments Per Kilobase of exon model per Million mapped fragments) was used to standardize the expression. The fold change between the experimental group and the control group was calculated, and the conditions for screening differentially expressed genes were as follows: log2| Fold Change | > 1, significant p < 0.05, the number of unique differential genes between each comparison group was counted according to the different analysis results. Principal components analysis was executed with PCAtools in R language (vision 4.0.0).
GO (http://geneontology.org/, accessed on 30 October 2019) and KEGG databases (https://www.kegg.jp/, accessed on 30 October 2019) were used to annotate the differential genes. The gene groups that potentially have an algicidal effect were screened for analysis.

5.5. Quantitative PCR Verification

The results of the mRNA-seq analysis were verified by fluorescence quantitative PCR (qPCR). RNA was reverse-transcribed into cDNA using HiScriptR III RT SuperMix for qPCR (+gDNA wiper) (R323-01, Vazyme Biotech, Nanjing, China). qPCR was performed using ChamQ Universal SYBR qPCR Master Mix (Q711-02/03, Vazyme Biotech, Nanjing, China). The primers were designed according to the whole genome sequence of Bl-zj with 16S rRNA gene used as the reference gene and were synthesized by Jinweizhi Biotechnology Co., Ltd. (Suzhou, China) (Table S2).

Supplementary Materials

The following supporting information can be downloaded at: https://www.mdpi.com/article/10.3390/toxins14070492/s1, Table S1: DEGs related to valine, leucine and isoleucine degradation and fatty acid degradation.; Table S2: qPCR primer pairs used in this study.

Author Contributions

Conceptualization, Y.Z.; investigation, D.C.; data curation, J.L. and D.C.; writing—original draft preparation, Y.Z. and J.L.; writing—review and editing, Y.Z., Z.H., and C.L.; funding acquisition, Y.Z., Z.H., X.H. and C.L.; methodology, Y.Z. and F.L. All authors have read and agreed to the published version of the manuscript.

Funding

This research was funded by the National Key R & D Plan “Blue Granary Science and Technology Innovation” (2020YFD0900205); the Guangdong Provincial Key Area Research and Development Plan Projects (2020B0202010009); and the Program for Scientific Research Start-up Funds of Guangdong Ocean University (060302022102, 060302022201).

Institutional Review Board Statement

Not applicable.

Informed Consent Statement

Not applicable.

Data Availability Statement

All data are presented in the manuscript or Supplementary Tables, no data uploaded elsewhere.

Conflicts of Interest

The authors declare no conflict of interest.

References

  1. Sidabutar, T.; Srimariana, E.S.; Wouthuyzen, S. Phytoplankton species potentially harmful algal blooms (HABs) in Jakarta Bay. IOP Conf. Ser. Earth Environ. Sci. 2021, 744, 012077. [Google Scholar] [CrossRef]
  2. Melaram, R.; Newton, A.R.; Chafin, J. Microcystin contamination and toxicity: Implications for agriculture and public health. Toxins 2022, 14, 350. [Google Scholar] [CrossRef] [PubMed]
  3. Sun, R.; Sun, P.; Zhang, J.; Esquivel-Elizondo, S.; Wu, Y. Microorganisms-based methods for harmful algal blooms control: A review. Bioresour. Technol. 2018, 248, 12–20. [Google Scholar] [CrossRef] [PubMed]
  4. Ren, H.; Zhang, P.; Liu, C.; Xue, Y.; Lian, B. The potential use of bacterium strain R219 for controlling of the bloom-forming cyanobacteria in freshwater lake. World J. Microbiol. Biotechnol. 2009, 26, 465–472. [Google Scholar] [CrossRef]
  5. Yang, C.; Hou, X.; Wu, D.; Chang, W.; Zhang, X.; Dai, X.; Du, H.; Zhang, X.; Igarashi, Y.; Luo, F. The characteristics and algicidal mechanisms of cyanobactericidal bacteria, a review. World J. Microbiol. Biotechnol. 2020, 36, 188. [Google Scholar] [CrossRef]
  6. Shao, J.; Li, R.; Lepo, J.E.; GU, J. Potential for control of harmful cyanobacterial blooms using biologically derived substances: Problems and prospects. J. Environ. Manag. 2013, 125, 149–155. [Google Scholar] [CrossRef]
  7. Lee, S.O.; Kato, J.; Takiguchi, N.; Kuroda, A.; Ikeda, T.; Mitsutani, A.; Ohtake, H. Involvement of an extracellular protease in algicidal activity of the marine bacterium Pseudoalteromonas sp. strain A28. Appl. Environ. Microbiol. 2000, 66, 4334–4339. [Google Scholar] [CrossRef] [Green Version]
  8. Kim, B.H.; Sang, M.; Hwang, S.J.; Han, M.S. In situ bacterial mitigation of the toxic cyanobacterium Microcystis aeruginosa: Implications for biological bloom control. Limnol. Oceanogr. Methods 2008, 6, 513–522. [Google Scholar] [CrossRef]
  9. Yu, Y.; Zeng, Y.; Li, J.; Yang, C.; Zhang, X.; Luo, F.; Dai, X. An algicidal Streptomyces amritsarensis strain against Microcystis aeruginosa strongly inhibits microcystin synthesis simultaneously. Sci. Total Environ. 2018, 650, 34–43. [Google Scholar] [CrossRef]
  10. Han, G.; Ma, H.; Ren, S.; Gao, X.; He, X.; Zhu, S.; Deng, R.; Zhang, S. Insights into the mechanism of cyanobacteria removal by the algicidal fungi Bjerkandera adusta and Trametes versicolor. MicrobiologyOpen 2020, 9, e1042. [Google Scholar] [CrossRef]
  11. Dai, W.; Chen, X.; Wang, X.; Xu, Z.; Gao, X.; Jiang, C.; Deng, R.; Han, G. The algicidal fungus Trametes versicolor F21a eliminating blue algae via genes encoding degradation enzymes and metabolic pathways revealed by transcriptomic analysis. Front. Microbiol. 2018, 9, 826. [Google Scholar] [CrossRef] [PubMed]
  12. Gao, X.; Wang, C.; Dai, W.; Ren, S.; Tao, F.; He, X.; Han, G.; Wang, W. Proteomic analysis reveals large amounts of decomposition enzymes and major metabolic pathways involved in algicidal process of Trametes versicolor F21a. Sci. Rep. 2017, 7, 3907. [Google Scholar] [CrossRef] [PubMed]
  13. Krachkovskii, S.A.; Sobol’, A.G.; Ovchinnikova, T.V.; Tagaev, A.A.; Yakimenko, Z.A.; Azizbekyan, R.R.; Kuznetsova, N.I.; Shamshina, T.N.; Arseniev, A.S. Isolation, biological properties, and spatial structure of antibiotic loloatin A. Russ. J. Bioorg. Chem. 2002, 28, 298–302. [Google Scholar] [CrossRef] [PubMed]
  14. Jia, W.; Huang, X.; Li, C. A preliminary study of the algicidal mechanism of bioactive metabolites of Brevibacillus laterosporus on Oscillatoria in prawn ponds. Sci. World J. 2014, 2041, 869149. [Google Scholar]
  15. Zhang, Y.; Chen, D.; Cai, J.; Zhang, N.; Li, F.; Li, C.; Huang, X. Complete genome sequence analysis of Brevibacillus laterosporus Bl-zj reflects its potential algicidal response. Curr. Microbiol. 2021, 78, 1409–1417. [Google Scholar] [CrossRef] [PubMed]
  16. Zhang, Y.; Chen, D.; Zhang, N.; Li, F.; Luo, X.; Li, Q.; Li, C.; Huang, X. Transcriptional analysis of Microcystis aeruginosa co-cultured with algicidal bacteria Brevibacillus laterosporus. Int. J. Environ. Res. Public Health 2021, 18, 8615. [Google Scholar] [CrossRef]
  17. Bruins, M.R.; Kapil, S.; Oehme, F.W. Microbial resistance to metals in the environment. Ecotoxicol. Environ. Saf. 2000, 45, 198–207. [Google Scholar] [CrossRef]
  18. Oh, E.J.; Bae, Y.H.; Kim, K.H.; Park, Y.C.; Seo, J.H. Effects of overexpression of acetaldehyde dehydrogenase 6 and acetyl-CoA synthetase 1 on xylitol production in recombinant Saccharomyces cerevisiae. Biocatal. Agric. Biotechnol. 2012, 1, 15–19. [Google Scholar] [CrossRef]
  19. Liu, X. ABC family transporters. Adv. Exp. Med. Biol. 2019, 1141, 13–100. [Google Scholar]
  20. Zhang, F.; Fan, Y.; Zhang, D.; Chen, S.; Bai, X.; Ma, X.; Xie, Z.; Xu, H. Effect and mechanism of the algicidal bacterium Sulfitobacter porphyrae ZFX1 on the mitigation of harmful algal blooms caused by Prorocentrum donghaiense. Environ. Pollut. 2020, 263 Pt A, 114475. [Google Scholar] [CrossRef]
  21. Hu, Q.; Yin, X.; Li, H.; Wang, X.; Jiang, Z.; Li, L.; Ni, H.; Li, Q.; Zhu, Y. Characterisation of a novel laminarinase from Microbulbifer sp. ALW1 and the antioxidant activity of its hydrolysates. Int. J. Food Sci. Technol. 2021, 56, 4129–4138. [Google Scholar] [CrossRef]
  22. Redhead, K.; Wright, S.J. Isolation and properties of fungi that lyse blue-green algae. Appl. Environ. Microbiol. 1978, 35, 962–969. [Google Scholar] [CrossRef] [PubMed] [Green Version]
  23. Genes, C.; Baquero, E.; Echeverri, F.; Maya, J.D.; Triana, O. Mitochondrial dysfunction in Trypanosoma cruzi: The role of Serratia marcescens prodigiosin in the alternative treatment of chagas disease. Parasite Vectors 2011, 4, 66. [Google Scholar] [CrossRef] [Green Version]
  24. Clements, T.; Ndlovu, T.; Khan, W. Broad-spectrum antimicrobial activity of secondary metabolites produced by Serratia marcescens strains. Microbiol. Res. 2019, 229, 126329. [Google Scholar] [CrossRef] [PubMed]
  25. Zhang, B.; Yang, Y.; Xie, W.; He, W.; Xie, J.; Liu, W. Identifying algicides of Enterobacter hormaechei F2 for control of the harmful alga Microcystis aeruginosa. Int. J. Environ. Res. Public Health 2022, 19, 7556. [Google Scholar] [CrossRef] [PubMed]
  26. Su, Z.; Wei, Z.; Hui, W. Physiological response and morphological changes of Heterosigma akashiwo to an algicidal compound prodigiosin. J. Hazard. Mater. 2020, 385, 121530. [Google Scholar]
  27. Zhang, H.; Peng, Y.; Zhang, S.; Cai, G.; Li, Y.; Yang, X.; Yang, K.; Chen, Z.; Zhang, J.; Wang, H.; et al. Algicidal effects of prodigiosin on the harmful alga Phaeocystis globosa. Front. Microbiol. 2016, 7, 602. [Google Scholar]
  28. Yang, K.; Chen, Q.; Zhang, D.; Zhang, H.; Lei, X.; Chen, Z.; Li, Y.; Hong, Y.; Ma, X.; Zheng, W.; et al. The algicidal mechanism of prodigiosin from Hahella sp. KA22 against Microcystis aeruginosa. Sci. Rep. 2017, 7, 7750. [Google Scholar] [CrossRef] [Green Version]
  29. Yang, F.; Wei, H.; Li, X.; Li, Y.; Li, X.; Yin, L.; Pu, Y. Isolation and characterization of an algicidal bacterium indigenous to Lake Taihu with a red pigment able to lyse Microcystis aeruginosa. Biomed. Environ. Sci. 2013, 26, 148–154. [Google Scholar]
  30. Qian, H.; Li, J.; Pan, X.; Sun, Z.; Ye, C.; Jin, G.; Fu, Z. Effects of streptomycin on growth of algae Chlorella vulgaris and Microcystis aeruginosa. Environ. Toxicol. 2012, 27, 229–237. [Google Scholar] [CrossRef]
  31. Wu, L.; Chen, X.; Huang, L.; Tian, J.; Ke, F.; Xu, J.; Chen, Y.; Zheng, M. A novobiocin derivative, XN4, inhibits the proliferation of chronic myeloid leukemia cells by inducing oxidative DNA damage. PLoS ONE 2015, 10, e0123314. [Google Scholar] [CrossRef] [PubMed]
  32. Wang, D.; Zhang, N.; Guo, S. Structure and function analysis of protein HD73_0859 produced by Bacillus thuringiensis. Bio-Med. Mater. Eng. 2014, 24, 3891–3896. [Google Scholar] [CrossRef] [PubMed] [Green Version]
  33. Bhaskar, N.; Sudeepa, E.S.; Rashmi, H.N.; Selvi, A.T. Partial purification and characterization of protease of Bacillus proteolyticus CFR3001 isolated from fish processing waste and its antibacterial activities. Bioresour. Technol. 2007, 98, 2758–2764. [Google Scholar] [CrossRef] [PubMed]
  34. Du, J.; Pu, G.; Shao, C.; Cheng, S.; Cai, J.; Zhou, L.; Jia, Y.; Tian, X. Potential of extracellular enzymes from Trametes versicolor F21a in Microcystis spp. degradation. Mater. Sci. Eng. C 2015, 48, 138–144. [Google Scholar] [CrossRef] [PubMed]
  35. Zeng, G.; Wang, P.; Wang, Y. Algicidal efficiency and mechanism of Phanerochaete chrysosporium against harmful algal bloom species. Algal Res. 2015, 12, 182–190. [Google Scholar] [CrossRef]
  36. Barbieri, G.; Voigt, B.; Albrecht, D.; Hecker, M.; Albertini, A.M.; Sonenshein, A.L.; Ferrari, E.; Belitsky, B.R. CodY regulates expression of the Bacillus subtilis extracellular proteases Vpr and Mpr. J. Bacteriol. 2015, 197, 1423–1432. [Google Scholar] [CrossRef] [Green Version]
  37. Yang, X.; Chen, S. Microorganisms in sediment microbial fuel cells: Ecological niche, microbial response, and environmental function. Sci. Total Environ. 2020, 756, 144145. [Google Scholar] [CrossRef]
  38. Xiao, F.H.; Yu, Q.; Deng, Z.L.; Yang, K.; Ye, Y.; Ge, M.X.; Yan, D.; Wang, H.T.; Chen, X.Q.; Yang, L.Q.; et al. ETS1 acts as a regulator of human healthy aging via decreasing ribosomal activity. Sci. Adv. 2022, 8, eabf2017. [Google Scholar] [CrossRef]
  39. Rippka, R.; Deruelles, J.; Waterbury, J.B.; Herdman, M.; Stanier, R.Y. Generic assignments, strain histories and properties of pure cultures of cyanobacteria. J. Gen. Microbiol. 1979, 111, 1–61. [Google Scholar] [CrossRef] [Green Version]
Figure 1. Morphology of M. aeruginosa (A), M. aeruginosa co-cultured with B. laterosporus for 1 d (B), 2 d (C), 3 d (D), and 4 d (E) by scanning electron microscopy (Scale bars = 2 μm). The red arrows showed the antenna-like mucus or cell depression and deformation.
Toxins 14 00492 g001
Figure 2. The principal component analysis (PCA) of each sample. The blue, red and green labels represent the treatment group of CBL, MB2 and MB4, respectively. The circle, triangle and square labels represent replication 1, replication 2 and replication 3 samples in each group, respectively.
Toxins 14 00492 g002
Figure 3. The number of differentially expressed genes (DEGs) at MB2 and MB4 groups compared with CBL group. “↑” and “↓” represent up- and down-regulated genes, respectively.
Toxins 14 00492 g003
Figure 4. Gene ontology (GO) enrichment analysis of the differently expressed genes at two groups compared with CBL group. (a) MB2 vs. CBL comparison, (b) MB4 vs. CBL comparison.
Toxins 14 00492 g004
Figure 5. KEGG pathway enrichment analysis. (a) MB2 vs. CBL comparison, (b) MB4 vs. CBL comparison.
Toxins 14 00492 g005
Figure 6. Pathways of valine, leucine, isoleucine and fatty acids degradation. (Red and green represent up-regulated and down-regulated genes, respectively.)
Toxins 14 00492 g006
Figure 7. Comparison of the expressions of nine DEGs determined by Illumina HiSeq 2500 sequencing and qRT-PCR (The qRT-PCR data of up-regulated genes were redrawn from Zhang et al., 2021 [15]). (a) MB2 vs. CBL comparison, (b) MB4 vs. CBL comparison.
Toxins 14 00492 g007
Table 1. Overview of B. laterosporus transcriptome sequencing data.
SampleRaw Data (bp)Raw Reads No.Clean Data (bp)Clean Reads No.Mapped Reads No.Q20 (%)Q30 (%)
CBL18,378,192,10055,854,6147,357,141,20049,047,60848,325,15498.1494.54
CBL28,746,394,40058,309,2967,617,902,10050,786,01449,954,12198.0794.42
CBL37,970,677,50053,137,8507,125,755,10047,505,03446,792,17998.0594.30
MB2_111,260,710,90075,071,4069,110,216,70060,734,77815,744,40097.7394.22
MB2_29,961,599,30066,410,6627,954,650,90053,031,00612,159,96797.6293.88
MB2_39,498,113,10063,320,7547,660,962,00051,073,08012,936,07797.6593.90
MB4_110,501,108,50070,007,3908,108,475,90054,056,50615,140,88897.7294.15
MB4_29,475,501,50063,170,0107,402,896,60049,352,64442,864,39697.2993.41
MB4_39,642,770,10064,285,1347,021,052,70046,807,01813,102,73396.9492.90
Average9,492,785,26763,285,2357,706,561,46751,377,07628,557,76897.6993.97
Table 2. Distribution of up- and down-regulated genes in KEGG pathways.
Level 2MB2 vs. CBLMB4 vs. CBL
UpDownTotalUpDownTotal
Amino acid metabolism1224716913176207
Carbohydrate metabolism939018393116209
Lipid metabolism511566522274
Metabolism of cofactors and vitamins283664264167
Energy metabolism341640322153
Nucleotide metabolism6323874350
Translation0333314748
Xenobiotics biodegradation and metabolism241438242145
Membrane transport132134132841
Metabolism of other amino acids18927131629
Replication and repair191071421
Folding, sorting and degradation4101461319
Biosynthesis of other secondary metabolites1151610717
Metabolism of terpenoids and polyketides1141511617
Cellular community—prokaryotes4596612
Infectious diseases: Bacterial134224
Signal transduction303314
Immune system112112
Transcription011022
Environmental adaptation101101
Cell growth and death000033
Glycan biosynthesis and metabolism101000
Table 3. DEGs related to transporters.
Gene IDMB2 vs. CBLMB4 vs. CBLDescription
log2 (Fold Change)p-Valuelog2 (Fold Change)p-Value
gene22177.041.04 × 10172.291.80 × 1011ABC transporter
gene37913.081.12 × 1032.091.31 × 103ABC transporter family protein
gene27883.562.60 × 1051.681.13 × 108ABC transporter family protein
gene40417.421.34 × 1081.961.33 × 102ABC transporter permease protein
gene27873.407.31 × 1061.632.79 × 102ABC transporter permease protein
gene02143.531.37 × 1055.086.01 × 1014ABC transporter permease protein
gene38374.192.00 × 10151.481.64 × 103ABC transporter ATP-binding/permease protein TycE
gene38384.421.73 × 1072.332.00 × 103ABC transporter ATP binding/permease protein TycD
gene34932.687.63 × 1066.012.16 × 104ABC transporter substrate-binding protein
gene20043.422.74 × 1073.011.19 × 1020ABC transporter ATP-binding protein
gene19462.475.55 × 1064.623.49 × 1023ABC-2 type transporter family protein
gene19472.155.42 × 1063.013.80 × 1022Putative ABC transporter ATP-binding protein
gene05176.509.88 × 1091.121.45 × 102Oligopeptide/dipeptide ABC transporter, ATP-binding, C-terminal domain protein
gene07142.151.09 × 1021.451.66 × 102Peptide permease, major facilitator family transporter
gene11647.782.54 × 10415.611.46 × 1057Oligopeptide transporter, OPT family
gene29543.434.50 × 1032.821.82 × 106Putative bacteriocin export ABC transporter, lactococcin group
gene30983.311.67 × 10101.854.72 × 106Cyclic peptide transporter family protein
gene12101.833.92 × 1034.715.95 × 1043Uncharacterized MFS-type transporter YdgK
gene12233.713.11 × 1083.231.02 × 1024Glycerol-3-phosphate transporter
gene11601.335.63 × 103Putative multidrug resistance ABC transporter ATP-binding/permease protein YheH
gene11611.601.44 × 102Putative multidrug resistance ABC transporter ATP-binding/permease protein YheI
gene11741.124.87 × 102ABC transporter family protein
gene17142.704.84 × 102Phosphate ABC transporter, permease protein PstA
gene02163.442.08 × 102ABC transporter substrate binding protein
gene30531.052.63 × 102Oligopeptide ABC transporter permease protein
gene30551.742.24 × 102Oligopeptide ABC transporter ATP binding protein
gene30561.393.32 × 102Oligopeptide ABC transporter ATP binding protein
gene04921.891.72 × 103Citrate transporter family protein
gene11846.922.76 × 1044Inner membrane transporter ycaM
gene24385.099.13 × 1012Proton-coupled thiamine transporter ThiT
gene27611.854.33 × 1010Formate/nitrite transporter
gene33365.411.44 × 105Efflux transporter, RND family, MFP subunit
gene40371.411.03 × 102ABC transporter family protein
Table 4. DEGs related to hydrolase.
Gene IDMB2 vs. CBLMB4 vs. CBLDescription
log2 (FoldChange)p-Valuelog2 (FoldChange)p-Value
gene22811.474.43 × 1031.541.24 × 106Cof-like hydrolase family protein
gene230810.391.83 × 1098.986.29 × 1027Cell wall hydrolase CwlJ
gene26562.727.69 × 1053.272.63 × 1013Dienelactone hydrolase family protein
gene27411.978.71 × 1041.186.71 × 103Putative hydrolase
gene27751.302.05 × 1021.873.04 × 107HAD-superfamily hydrolase YhcW
gene34285.315.85 × 1054.897.79 × 108Glycoside hydrolase, family 18
gene35642.654.09 × 1044.511.49 × 1034Putative polyketide biosynthesis zinc-dependent hydrolase PksB
gene36162.374.74 × 1041.711.30 × 104Alpha/beta hydrolase fold family protein
gene37974.408.05 × 10123.602.13 × 1012Amidohydrolase family protein
gene05104.409.63 × 10174.253.45 × 1033Fumarylacetoacetate (FAA) hydrolase family protein
gene08004.041.44 × 1026.092.09 × 104Glycosyl hydrolase
gene17022.739.47 × 1064.612.82 × 1025Metal dependent phosphohydrolase
gene19173.103.78 × 1055.277.59 × 1048Membrane-bound metal-dependent hydrolase
gene20861.213.56 × 1021.253.42 × 104Alpha/beta hydrolase fold family protein
gene21402.103.17 × 1021.092.07 × 103Amylopullulanase
gene39783.626.60 × 1042.595.05 × 1016Chitinase A1
gene04793.741.88 × 1083.481.75 × 105Peptidase M23 family protein
gene18717.771.15 × 10178.585.53 × 1018Peptidase M23 family protein
gene34305.069.12 × 1073.751.63 × 107Peptidase M23/M37 family protein
gene02915.002.48 × 1053.737.53 × 106Peptidase M20 family protein
gene10815.988.93 × 10174.502.08 × 103Minor extracellular protease Vpr domain protein
gene20992.441.79 × 1062.322.70 × 1012Intracellular protease
gene05887.015.70 × 1055.262.53 × 1017Serine protease HtrA
gene20964.377.44 × 103Alpha/beta hydrolase fold family protein
gene13961.123.49 × 102Peptidyl-tRNA hydrolase
gene22932.273.88 × 103Oligoendopeptidase F
gene29961.521.58 × 102Peptidase SpoIVB
gene27631.607.96 × 104Metalloprotease YpwA
gene12644.101.38 × 102Acetyltransferases and hydrolases with the alpha/beta hydrolase fold
gene19501.709.00 × 105MazG nucleotide pyrophosphohydrolase domain protein
gene19741.639.93 × 104Glycoside hydrolase family 18
Table 5. DEGs related to biosynthesis of other secondary metabolites.
Gene IDMB2 vs. CBLMB4 vs. CBLDescription
log2(Fold Change)p-Valuelog2(Fold Change)p-Value
Novobiocin biosynthesis
gene32802.011.82 × 1021.181.39 × 103Histidinol-phosphate aminotransferase
gene3516−4.177.39 × 1018−2.849.13 × 1017Threonine-phosphate decarboxylase
Prodigiosin biosynthesis
gene39244.366.65 × 1073.831.70 × 106Short chain dehydrogenase family protein
gene18675.089.86 × 10144.622.10 × 10303-oxoacyl-[acyl-carrier-protein] reductase
gene37346.014.80 × 10114.527.65 × 1020Malonyl CoA-acyl carrier protein transacylase
gene33946.552.29 × 10335.966.87 × 1066Malonyl CoA-acyl carrier protein transacylase
gene44121.376.10 × 103Putative 3-oxoacyl-[acyl-carrier protein] reductase
gene4621−2.018.40 × 106−3.578.84 × 10253-oxoacyl-[acyl-carrier-protein] reductase
gene4622−2.303.87 × 107−3.555.31 × 1025Malonyl CoA-acyl carrier protein transacylase
gene2031−2.142.97 × 1010Enoyl-[acyl-carrier-protein] reductase
gene3922−1.854.54 × 105Malonyl CoA-acyl carrier protein transacylase
Acarbose and validamycin biosynthesis
gene16203.308.16 × 1032.254.18 × 104CDP-glucose 4,6-dehydratase
Streptomycin biosynthesis
gene16203.308.16 × 1032.254.18 × 104CDP-glucose 4,6-dehydratase
gene36432.424.89 × 105Myo-inositol-1-phosphate synthase family protein
gene06371.819.29 × 107Inositol monophosphatase family protein
Monobactam biosynthesis
gene24201.971.33 × 1031.751.95 × 105Aspartokinase 2
gene23422.411.91 × 105Sulfate adenylyltransferase
gene3298−1.434.14 × 103Dihydrodipicolinate reductase
Carbapenem biosynthesis
gene0853−1.043.28 × 102−1.097.42 × 103Glutamate-5-semialdehyde dehydrogenase
gene0853−1.751.93 × 107Glutamate-5-semialdehyde dehydrogenase
Phenazine biosynthesis
gene32745.347.17 × 109Anthranilate synthase component
Publisher’s Note: MDPI stays neutral with regard to jurisdictional claims in published maps and institutional affiliations.

