
Deep Learning Framework to Detect Ischemic Stroke Lesion in Brain MRI Slices of Flair/DW/T1 Modalities


1
Department of Electronics and Instrumentation Engineering, St. Joseph’s College of Engineering, Chennai 600 119, Tamilnadu, India
2
Department of Information Technology, College of Computing and Information Sciences, Majmaah University, Al Majmaah 11952, Saudi Arabia
3
Department of Applied Data Science, Noroff University College, 4612 Kristiansand, Norway
*
Author to whom correspondence should be addressed.
Symmetry 2021, 13(11), 2080; https://doi.org/10.3390/sym13112080
Submission received: 19 September 2021
/
Revised: 11 October 2021
/
Accepted: 14 October 2021
/
Published: 3 November 2021
(This article belongs to the Section Computer)
Abstract
:Ischemic stroke lesion (ISL) is a brain abnormality. Studies proved that early detection and treatment could reduce the disease impact. This research aimed to develop a deep learning (DL) framework to detect the ISL in multi-modality magnetic resonance image (MRI) slices. It proposed a convolutional neural network (CNN)-supported segmentation and classification to execute a consistent disease detection framework. The developed framework consisted of the following phases; (i) visual geometry group (VGG) developed VGG16 scheme supported SegNet (VGG-SegNet)-based ISL mining, (ii) handcrafted feature extraction, (iii) deep feature extraction using the chosen DL scheme, (iv) feature ranking and serial feature concatenation, and (v) classification using binary classifiers. Fivefold cross-validation was employed in this work, and the best feature was selected as the final result. The attained results were separately examined for (i) segmentation; (ii) deep-feature-based classification, and (iii) concatenated feature-based classification. The experimental investigation is presented using the Ischemic Stroke Lesion Segmentation (ISLES2015) database. The attained result confirms that the proposed ISL detection framework gives better segmentation and classification results. The VGG16 scheme helped to obtain a better result with deep features (accuracy > 97%) and concatenated features (accuracy > 98%).
1. Introduction
Recent developments in the healthcare sector helped to employ several improvements in disease diagnosis. Even though the healthcare sector is equipped with modern facilities, disease detection, treatment planning, and patient recovery still pose challenges to the doctors; the hospitals execute a mass screening of the disease. Due to various reasons, the disease occurrence rates in humans are gradually increasing irrespective of gender and race [1,2,3].
Stroke is one of the common abnormalities in people’s brains irrespective of age and gender, and the major cause of stroke is the reduced/irregular blood supply. Stroke is classified as ischemic stroke (caused due to blockage in the blood vessels) and hemorrhagic stroke (HS) [4,5,6]. When a brain section does not receive sufficient blood/oxygen, it leads to stroke, which may create a temporary or permanent disability in humans, and the untreated stroke could cause death. Compared with HS, ischemic stroke has more occurrence rate, and hence, a considerable number of stroke diagnostic methods are suggested by researchers using biosignals [7] and bioimages [8].
The biosignal (electroencephalogram)-supported detection needs complex preprocessing and computation techniques due to its nonlinear nature. The earlier research on stroke diagnosis confirmed that bioimage (MRI)-supported detection provides vital information compared with biosignal-supported stroke detection. The MRI-supported detection can be implemented using two-dimensional (2D) or 3D images, and it also has the flexibility to choose the image registering modalities, such as T1, flair, and diffused weight (DW). Furthermore, the MRI-supported diagnosis will help to obtain details such as the severity, location, and volume of the affected brain section, which playmajor roles in treatment planning and execution. Furthermore, the modality fusion also helps to obtain an enhanced diagnosis, when the MRI is considered.
This research proposed a DL framework to support the segmentation and classification of the ischemic stroke lesion (ISL) from 2D MRI slices. The proposed research implements the following phases to achieve better disease detection:
- i.
- Segmentation of ISL using VGG-SegNet;
- ii.
- Extraction of handcrafted features, such as Hu moments, gray-level co-occurrence matrix (GLCM), and local-binary-pattern (LBP);
- iii.
- Deep feature extraction with pretrained DL schemes;
- iv.
- Feature ranking and serial concatenation;
- v.
- Classification and validation.
In this work, the necessary test images (normal/stroke) were collected from the benchmark Ischemic Stroke Lesion Segmentation (ISLES2015) challenge dataset.
The ISLES2015 includes3D brain MRI of T1, Flair, and DW modalities, and every volunteer image is assorted with two ground-truth (GT) images provided by the disease experts. In this work, initially, the performance of the VGG-SegNet was confirmed with a qualified assessment between GT and segmented ISL. Every MRI slice was examined using the proposed approach, which helps to detect the symmetry in features among the normal and the stroke-infected section. When a normal region is considered, the feature value is almost the same in every part of the slice. However, in the ISL case, these features will have random variation around the image pixel group, which belongs to the stroke section. By simply evaluating the symmetry in features, it is possible to classify the normal and stroke class MRI slices.
In the literature, a number of early stroke detection procedures are implemented by researchers using biomedical data. The work by Johnson et al. (2016) [4] confirmed that cerebrovascular accidents (stroke) are the second chief reason for death and the third principle reason of disability in humans. This research also pointed out that the occurrence rate of stroke is gradually rising in low- and middle-income countries. Furthermore, this article confirmed that >85% of stroke-caused deaths and disabilities occur in low- and middle-income countries.
The earlier research work also confirmed that MRI-supported stroke detection is widely recommended to detect the location and harshness accurately. The work of Maier et al. [9] presented a detailed assessment of the mining of ISL in multispectral MRI using SVM. Similar work by the researchers presents a comparison of semi-automated/automated segmentation procedures for ISL using the images of the ISLES2015 database. The related works of Maier et al. [10,11,12] presented segmentation of stroke lesion in MRI of chosen modality using different techniques. Subbanna et al. [13] demonstrated the evaluation of ISL in Flair MRI using the modifier Markov random field. Zhang et al. [14] presented multiplane information fusion-based segmentation from various MRI modalities. Singh et al. [15] discussed deep learning (DL)-supported ISL detection. The work by Rajinikanth and Satapathy [16] presented joint thresholding and segmentation-based ISL assessment, and a similar attempt was presented in the research by Lin et al. [17]. The recent work by Hemanth et al. [18] implemented a multi-modality fusion-based ISL examination. The review by Zhang et al. [19] confirmed the following limitations in earlier works: (i) modality-specific detection, (ii) in most of the modalities, automated extraction and evaluation are quite difficult, and (iii) less detection accuracy for T1 modality case.
To overcome the limitations in the existing works, this proposed research aimed to implement DL-based segmentation and classification tasks on the brain MRI recorded using Flair/DW/T1 modalities. In this research, vital features were extracted from each image, and the classifier performance was separately tested with DL features and concatenated features. The performance of the binary classifier was confirmed using fivefold cross-validation, and the best result attained among the trials was chosen as the final result.
2. Materials and Methods
In the literature, several AI schemes are proposed to examine the ISL from the brain MRI slices and the merit of the proposed scheme depends mainly on the stages we employed. In this work, VGG16-supported segmentation and classification were proposed to detect the ISL with better accuracy. This section of the research demonstrates the methodology employed.
2.1. DeepLearning Framework
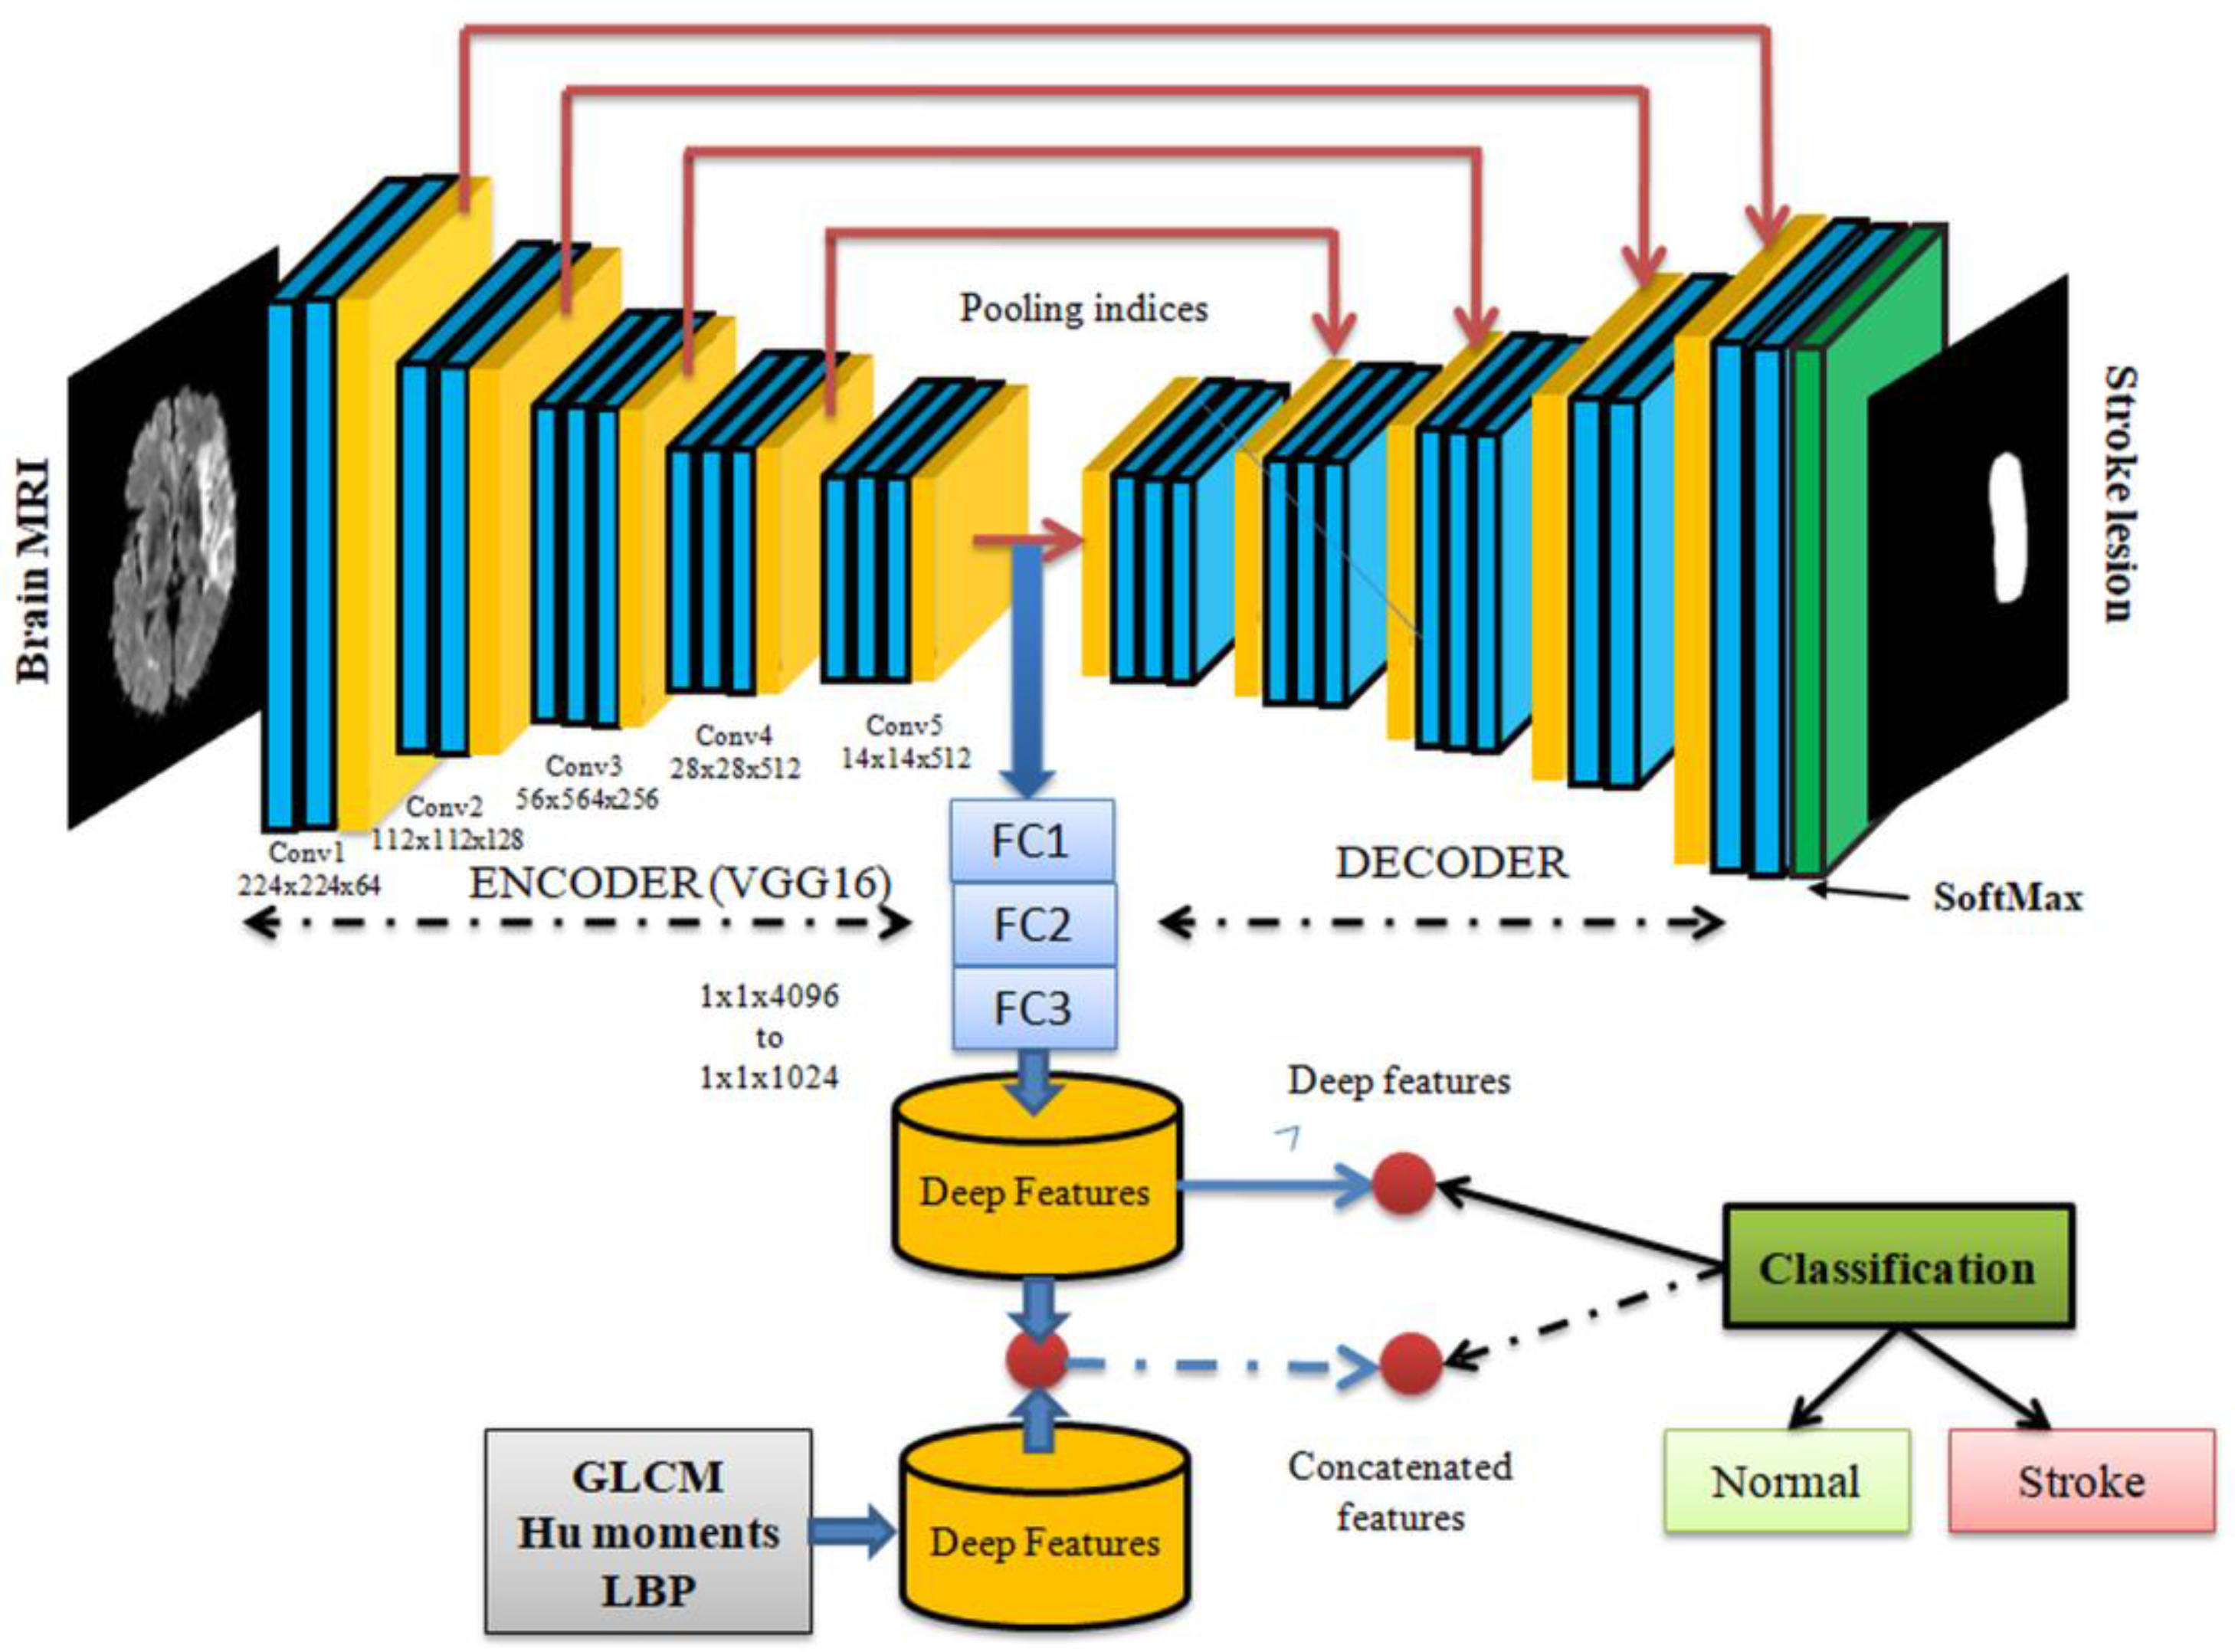
This feature considered in this research is associated with image symmetry. Figure 1 depicts the structure of the proposed ISL diagnostic scheme. In this work, a pretrained VGG16 was considered to examine the stroke section in the brain MRI. Initially, the segmentation was implemented using the pretrained VGG-SegNet scheme. This pipeline consists of an encoder (traditional VGG16) and a decoder section, as depicted in the figure. The SoftMax layer employs the final part of the VGG, with a binary classifier to separate the identified ISL from the background.
The outcome of this scheme is the binary image in which its background is depicted as a binary zero (0), and ISL is presented as a binary one (1). The encoder section obtains the features from the image, and the decoder section rebuilds the image from features. Hence, the deep features are extracted from the final layer of the encoder, and the existing features are reduced by using three numbers of fully connected (FC) layers, such as FC1, FC2, and FC3, with 50% dropout in every stage. During the first task, the available deep features were then considered to train, test, and validate the binary classifier. After assessing the classification performance of DL with deep features, the classification task was repeated once again using the concatenated features, as shown in the figure. To obtain the concatenated feature, the handcrafted features, such as GLCM, Hu moments, and LBP were combined with the existing deep features. The proposed work was separately executed for every MRI modality (Flair/DW/T1), and the outcomes were individually assessed.
2.2. Image Database
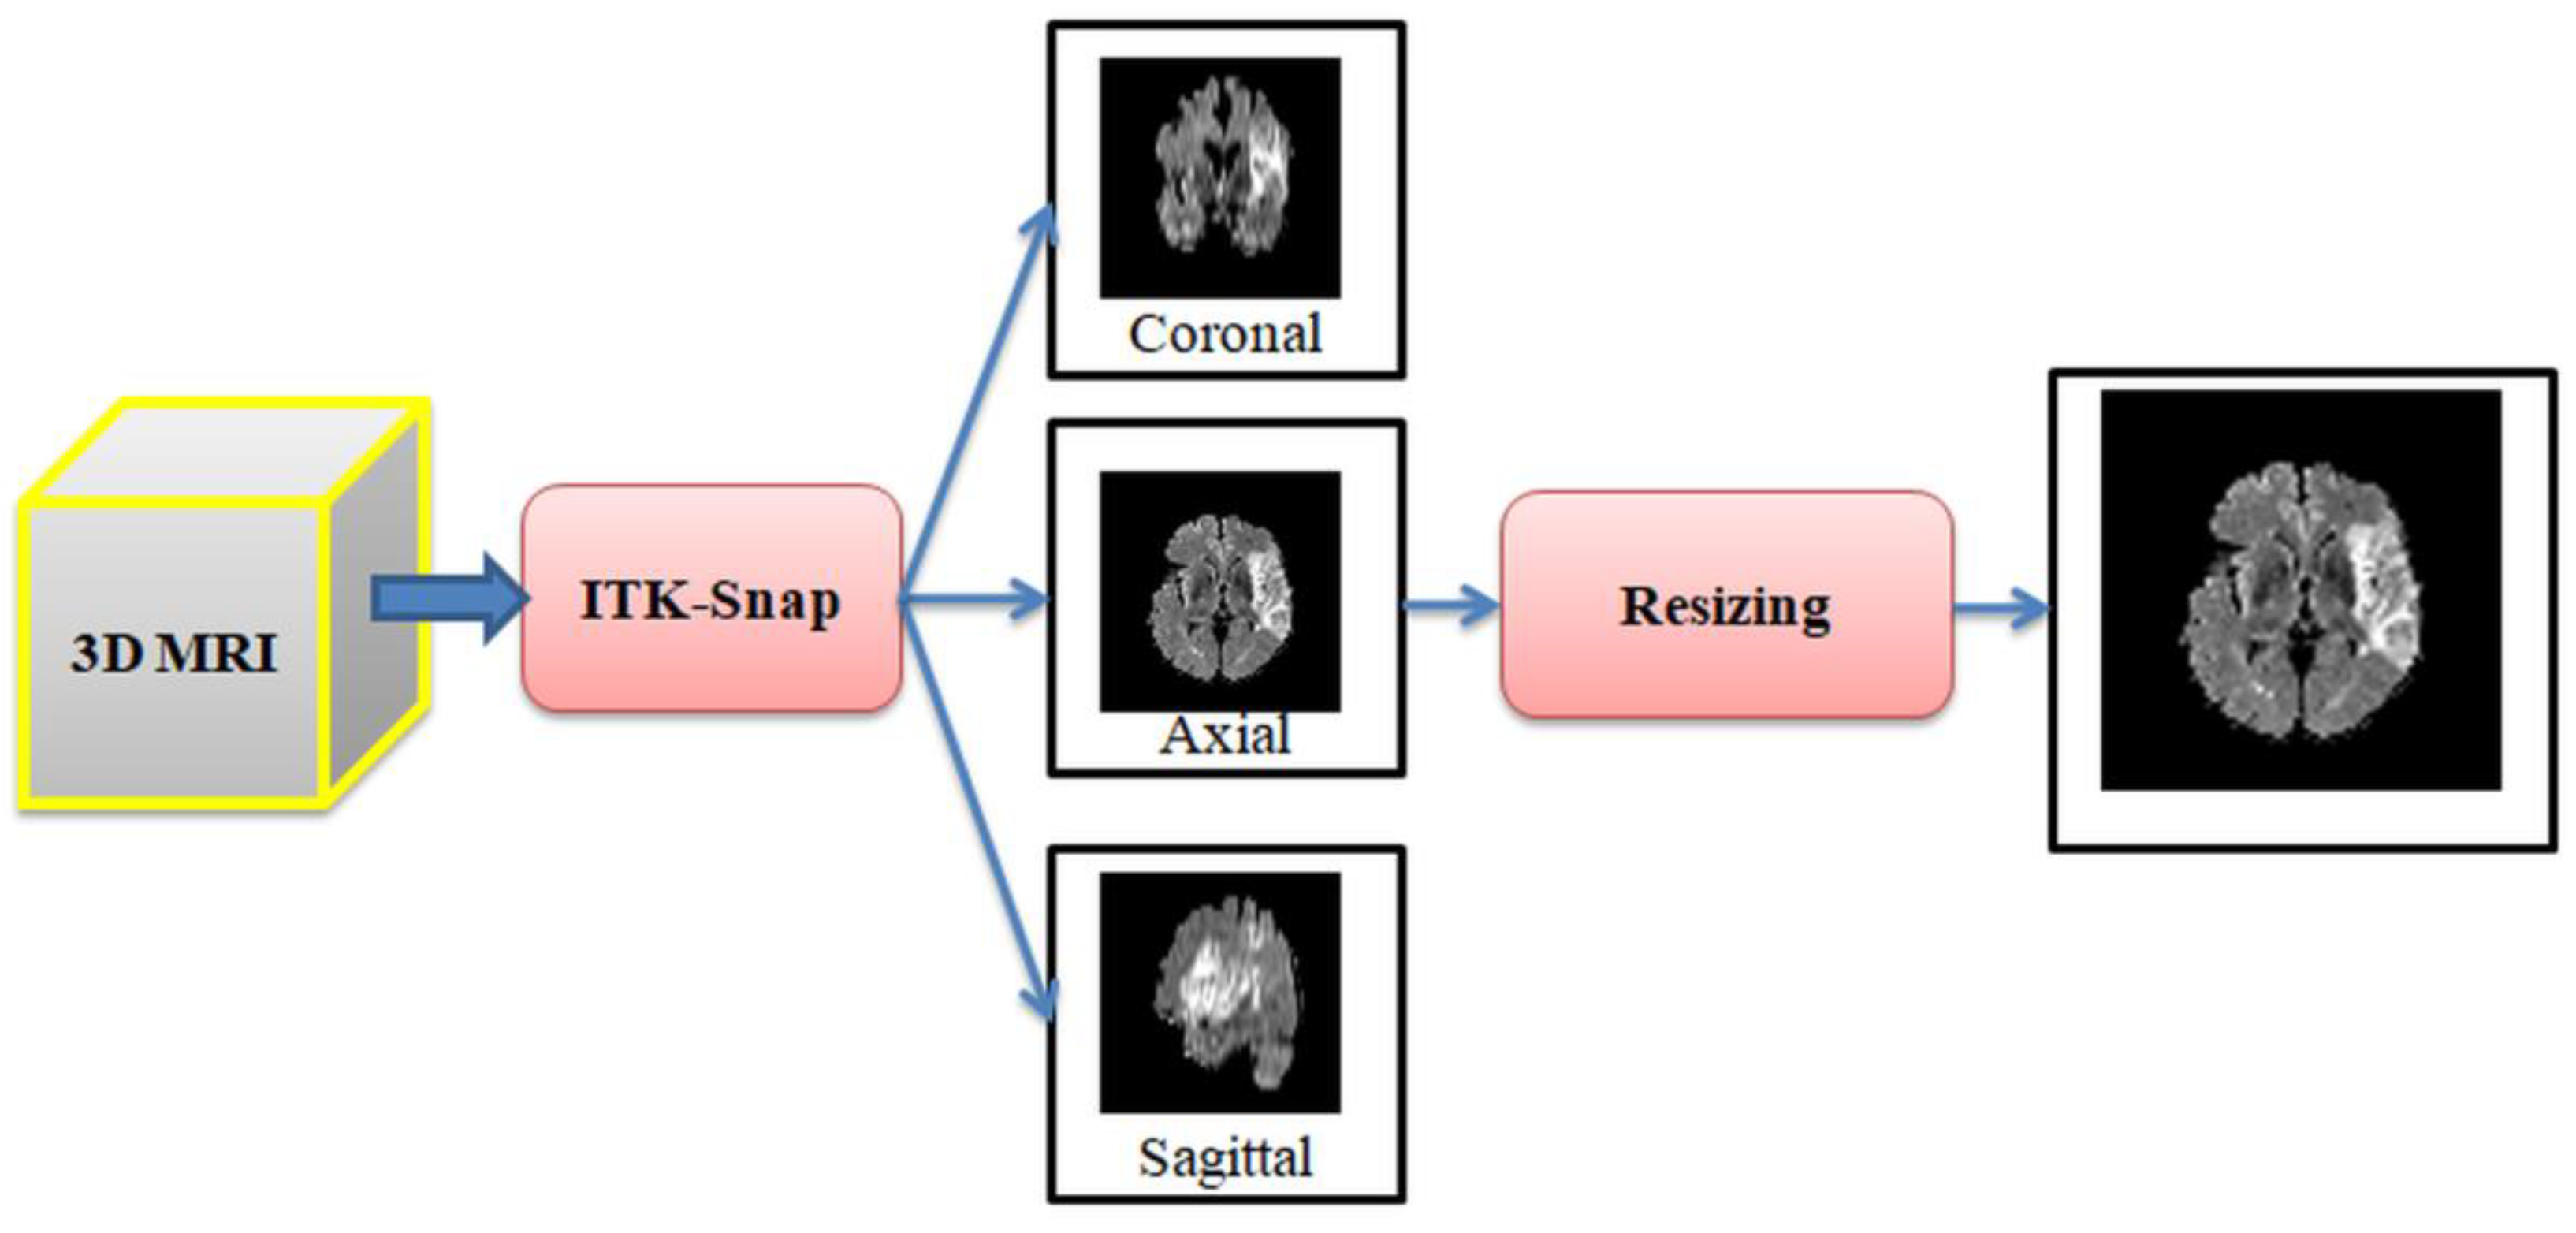
The performance of the developed disease detection system must be evaluated using real clinical images or benchmark images. Clinical images are limitedly available for research, and most of these images are protected due to ethical constraints. Hence, in this work, ISLES2015 challenge benchmark images were considered for the examination. ISLES2015 is one of the widely adopted datasets in the literature to test the performance of the proposed computerized algorithms [19]. For every patient, this dataset consists of the 3D reconstructed images of Flair/DW/T1 modalities, and every patient’s image is assorted with two ground truths, such as ground-truth low (GTL) and as ground-truth high (GTH), to confirm the segmentation result of the computer algorithm. The conversion from 3D to 2D is achieved with ITK-Snap [20,21], and in this study, only the axial view of the brain was considered for the examination. The 2D test image was available in a dimension; pixels and image resizing were employed to obtain pixels. Other related information on ISLES2015 can be found in [17,18,19]. Figure 2 depicts the employed procedure to extract and resize the 2D MRI in axial view. In this work, brain MRIs of Flair/DW/T1 modalities with pixel dimension was considered for evaluation. In each modality, a considerable number of images (600 training and 200 testing images in the normal case, and 1200 training and 400 testing images in stroke class) were used to demonstrate the performance of the proposed scheme.
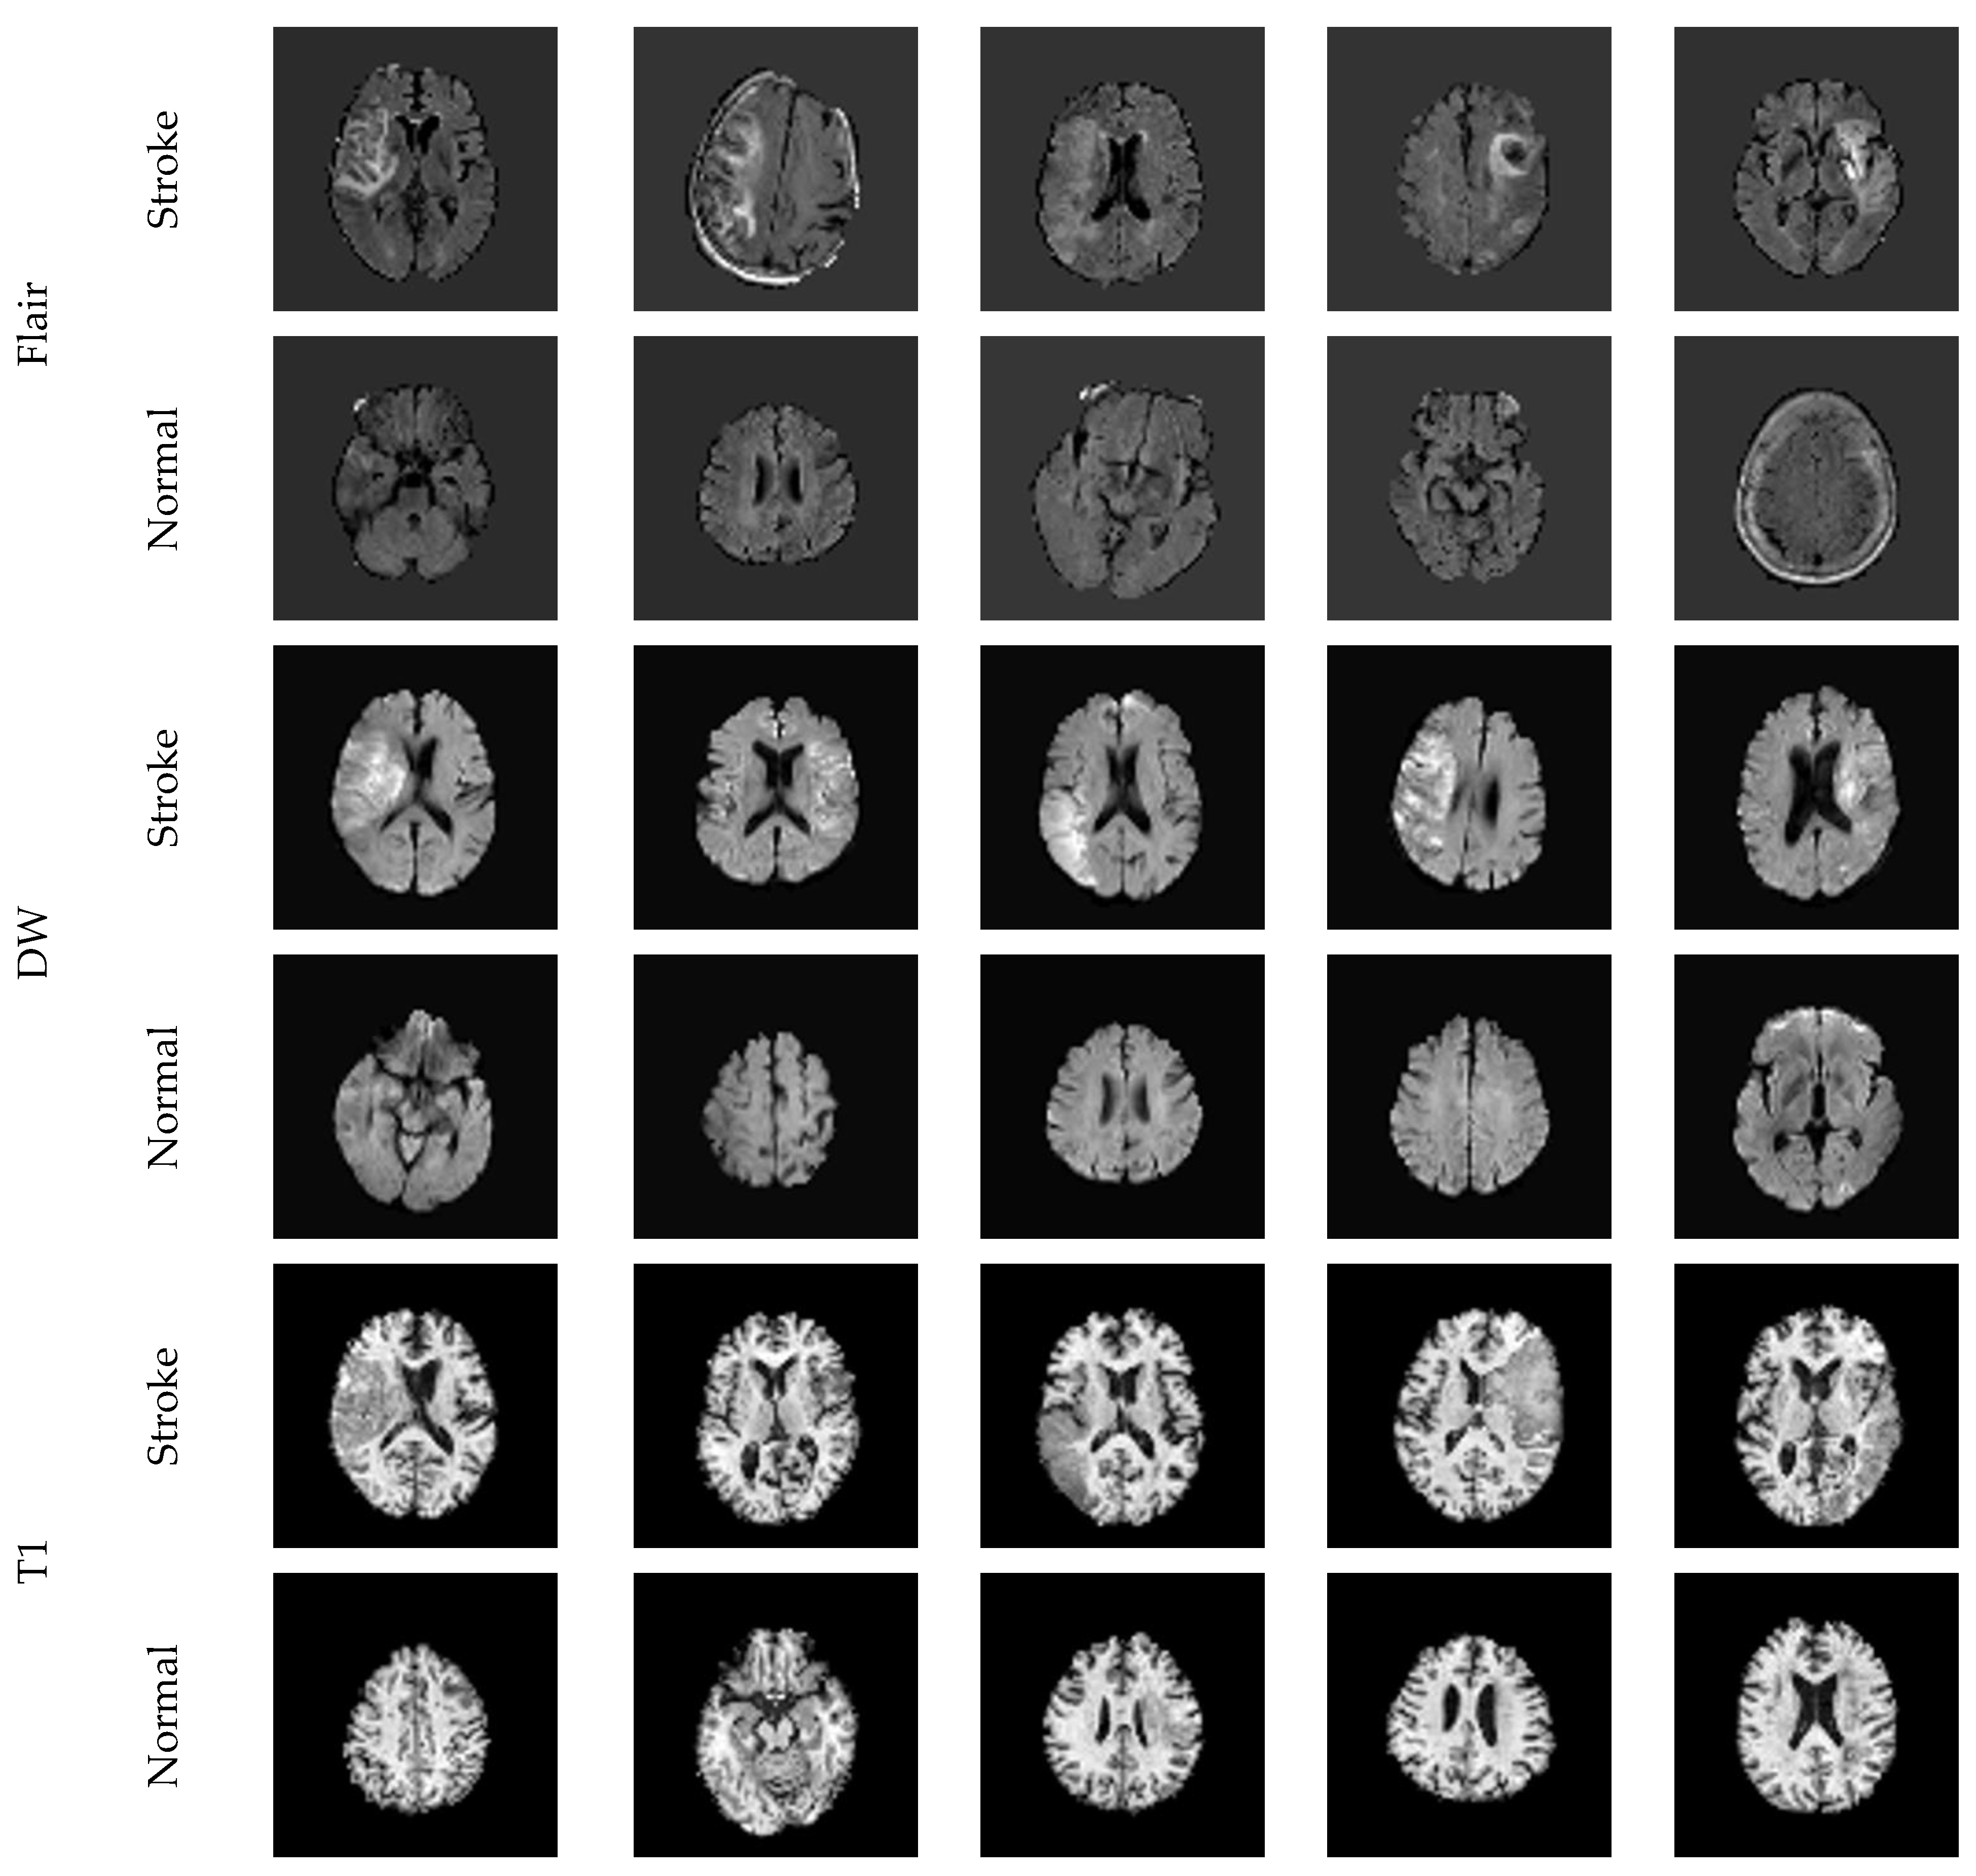
Figure 3 presents the sample test images (Flair/DW/T1) considered for experimental investigation. Every image was separately examined using the proposed framework, and the performance was confirmed.
2.3. VGG-SegNet
Recently, the convolutional neural network (CNN)-supported segmentation is proposed and implemented to extract the region of interest (RoI) from a range of images, and based on the area under the curve (AUC), its merit is verified [22]. SegNet is a CNN scheme proposed in 2015 [23], and due to its merit, researchers widely adopted traditional and modified schemes [24,25]. In this research, a CNN scheme called VGG-SegNet was employed to extract the RoI in brain MRI slices. The VGG-SegNet has an encoder–decoder assembly, as shown in Figure 1, to extract the RoI from the test image. In this work, the first five layers (encoder) are the pretrained VGG16 scheme, and pretuning of this architecture for brain MRI was achieved separately using Flair, DW, and T1 slices. A twofold pretraining process was executed to improve the segmentation performance. The initial parameters of VGG-SegNet were consigned as follows: an identical batch dimension for the encoder–decoder unit was assigned, initialization was executed using standard weight, the learning rate was fixed as 1e-5, linear dropout rate (LDR) was allocated, and the stochastic gradient descent (SGD) adaptive learning was selected. The final layer of the decoder was equipped with a SoftMax with a sigmoid activation function, which finally provided the segmented binary ISL.
The merit of the VGG-SegNet was confirmed with a comparison between the RoI with existing GTs. A pixel-level comparison was executed during this task, and the necessary quality measure (QM) was computed. Based on the eminence of the QM, the performance of the VGG-SegNet was confirmed.
2.4. Image Features
Image feature-supported medical data classification is one of the approved methodologies among researchers, and the performance depends mainly on the features extracted from the test images. In this proposed work, deep features were extracted using the pretrained schemes, such as AlexNet, VGG16, VGG19, ResNet18, and ResNet50, and classification was performed using the SoftMax unit. The initial results achieved with this technique confirmed that the result of VGG16 is superior for Flair, DW, and T1 modalities. Hence, VGG16-based ISL detection was considered for the demonstration; related information on DL schemes can be found in [25].
2.4.1. Deep Features
This framework was employed to extort the deep features (DF) existing at the final layer of the encoder section, as presented in Figure 1. These features were then reduced using the FC layers, with an assigned dropout rate of 50%. This section helped to obtain the features depicted in Equation (1) as follows:
This feature was initially considered to classify the MRI slices using the chosen binary classifiers; other related information about the VGG based classification can be accessed from [26].
2.4.2. Handcrafted Features
The earlier works confirmed that combining deep and handcrafted features helped to achieve better results on medical images [9,10]. In this work, the necessary handcrafted features, such as GLCM [26,27,28], Hu Moments [29], and LBP [22,30], were extracted and combined with deep features. GLCM features were extensively considered due to theirgreater performance. The complete information about these features can be found in recent related work. Along with these features, LBP (with weight = 4) was also extracted; the related information can be found in [30].
Handcrafted features (HF) considered in this research is depicted in Equations (2)–(4), respectively, and the combined feature is presented in Equation (5).
2.4.3. Feature Concatenation
A serial feature concatenation was employed to combine DF and HF, and this method improves the feature vector to a higher dimension. The final feature vector after concatenation can be found in Equation (6).
This feature vector was then considered to train, test, and substantiate the classifier performance.
2.5. Classification
The clinical significance of the automated disease classification system is normally assessed by considering many classifiers. The choice of the classifier depends on the image class to be categorized. A binary classification (normal/stroke) was employed to classify the brain MRI of different modalities in this work. Initially, the classification was performed using the default classifier called SoftMax. Later, other classifiers, such as decision tree (DT), K-nearest neighbor (KNN), random forest (RF), support vector machine (SVM) with linear (SVM-L), and radial basis function (SVM-RBF) kernel were also adopted. In the literature, many discussions are made on the classifiers that were considered in this study, and these classifiers were widely adopted in ML- and DL-based classification tasks. Every classifier performance was individually verified on the chosen modality with fivefold cross-validation, and the best-attained result was considered to confirm the performance.
2.6. Computation of Quality Measures and Validation
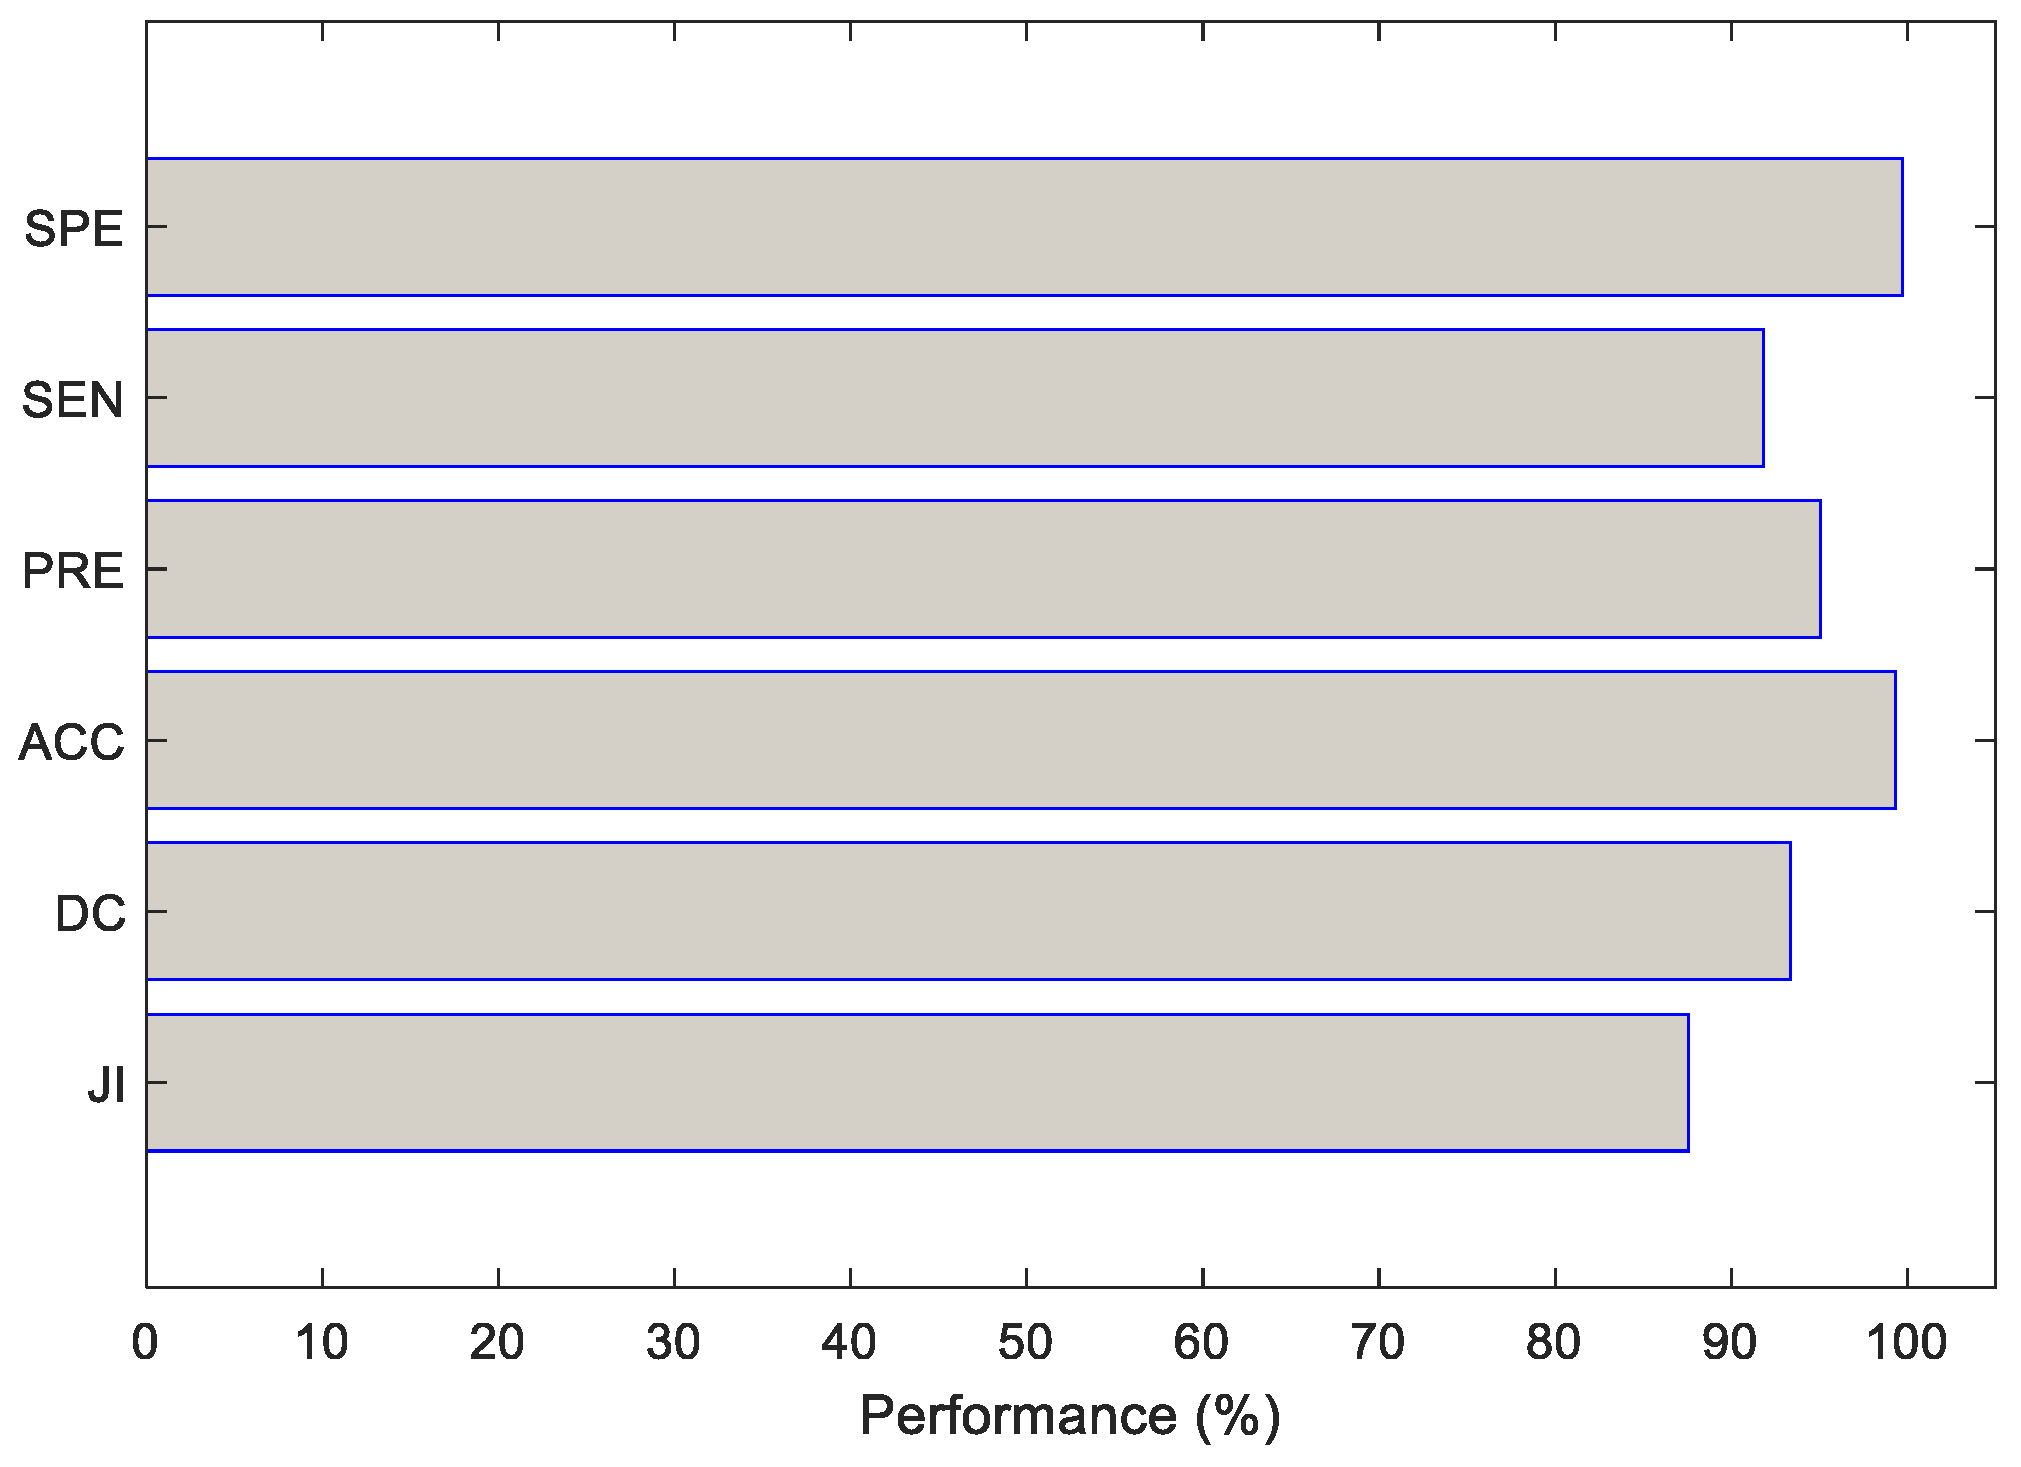
The overall performance of the image-supported disease diagnostic scheme depends on the QM attained during the segmentation and validation. In this work, the necessary QM was computed based on the attained values of true positive (TP), true negative (TN), false positive (FP), and false negative (FN). From these values, other measures, such as Jaccard Index (JI) dice coefficient (DC), accuracy (ACC), precision (PRE), sensitivity (SEN), specificity (SPE), F1 score (F1S), and negative predictive value (NPV) were derived.
3. Experimental Result and Discussions
This section shows the experimental outcome using the workstation Intel i7 2.9 GHz processor with 20 GB RAM and 4 GB VRAM equipped with MATLAB®.
This research aimed to develop a DL framework to support both segmentation and classification with better QM. The proposed work was implemented using 2D MRI slices of ISLES2015. Initially, the performances of VGG-SegNet were assessed using the considered brain MRI slices. After the necessary pretraining process using the training images, the RoI extraction performance of this framework was tested individually with testing images of Flair, DW, and T1 modalities.
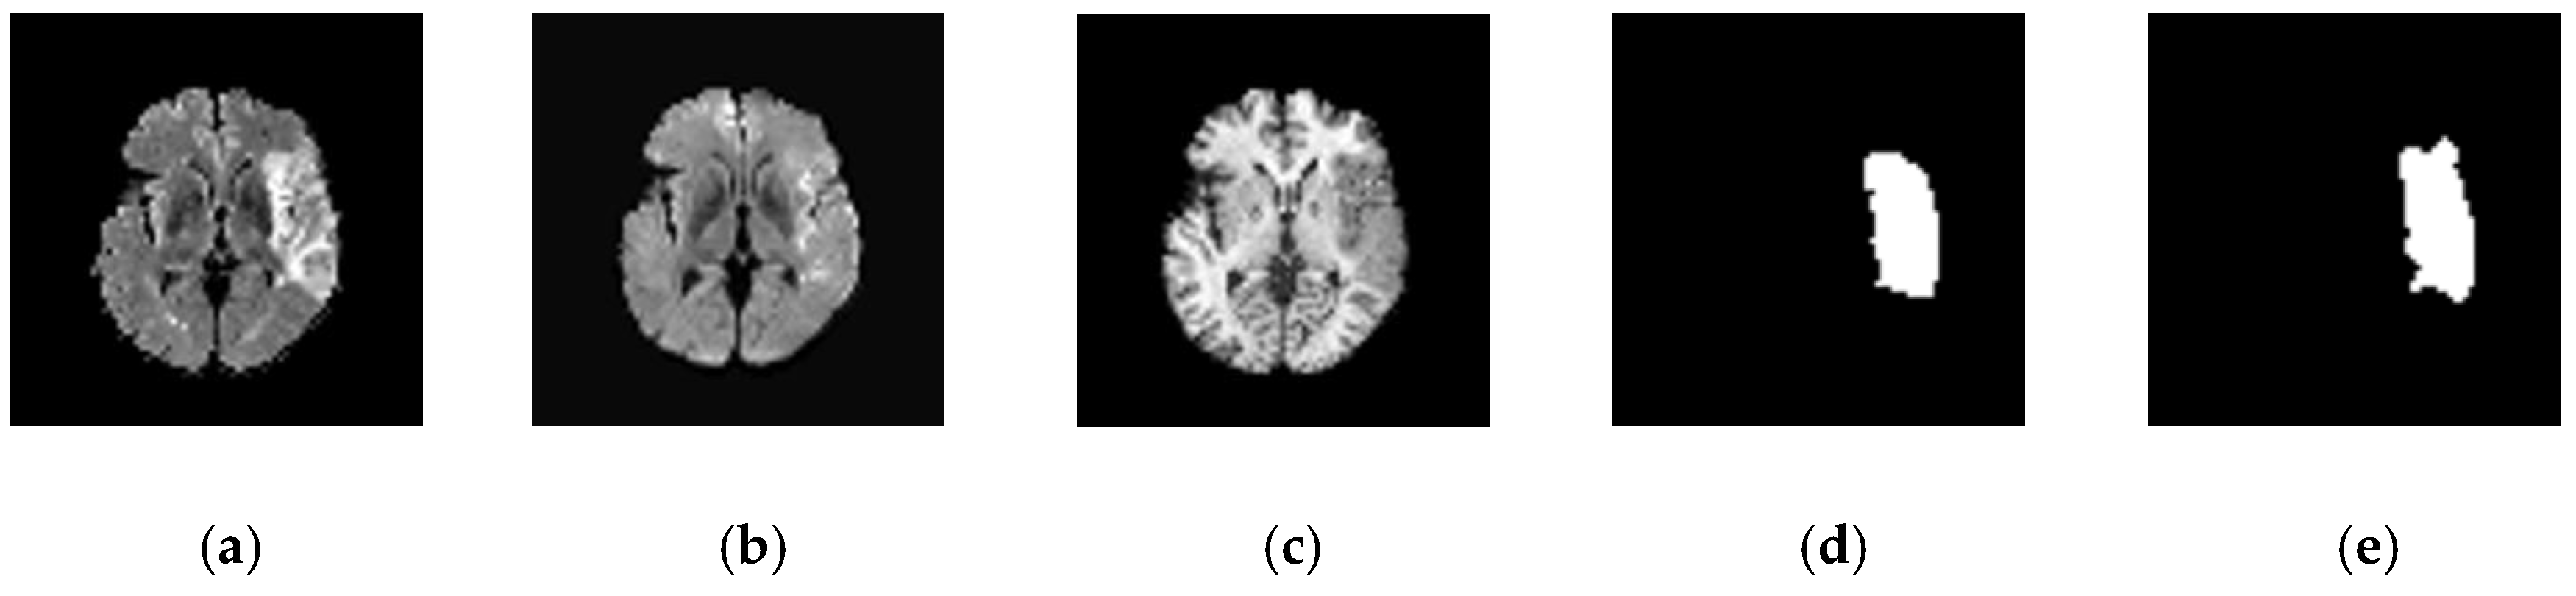
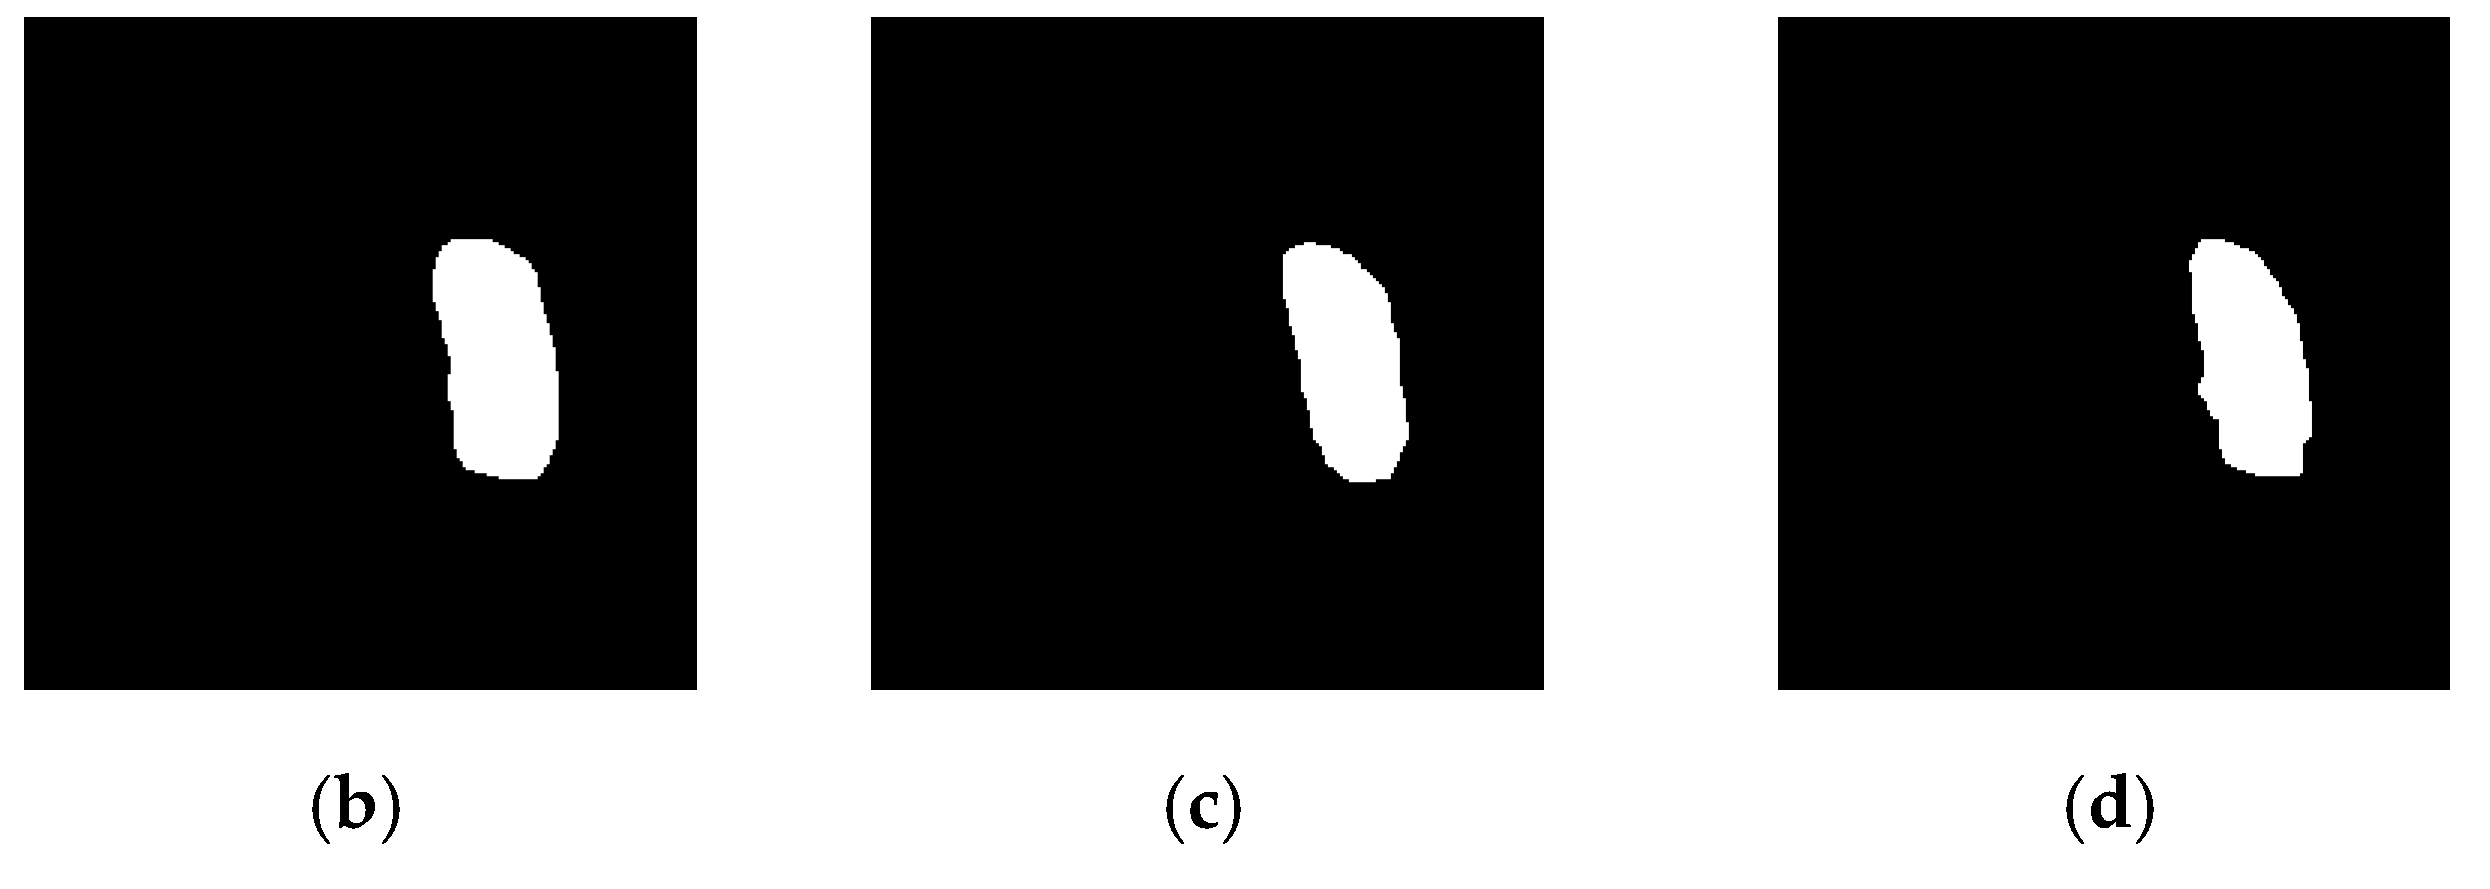
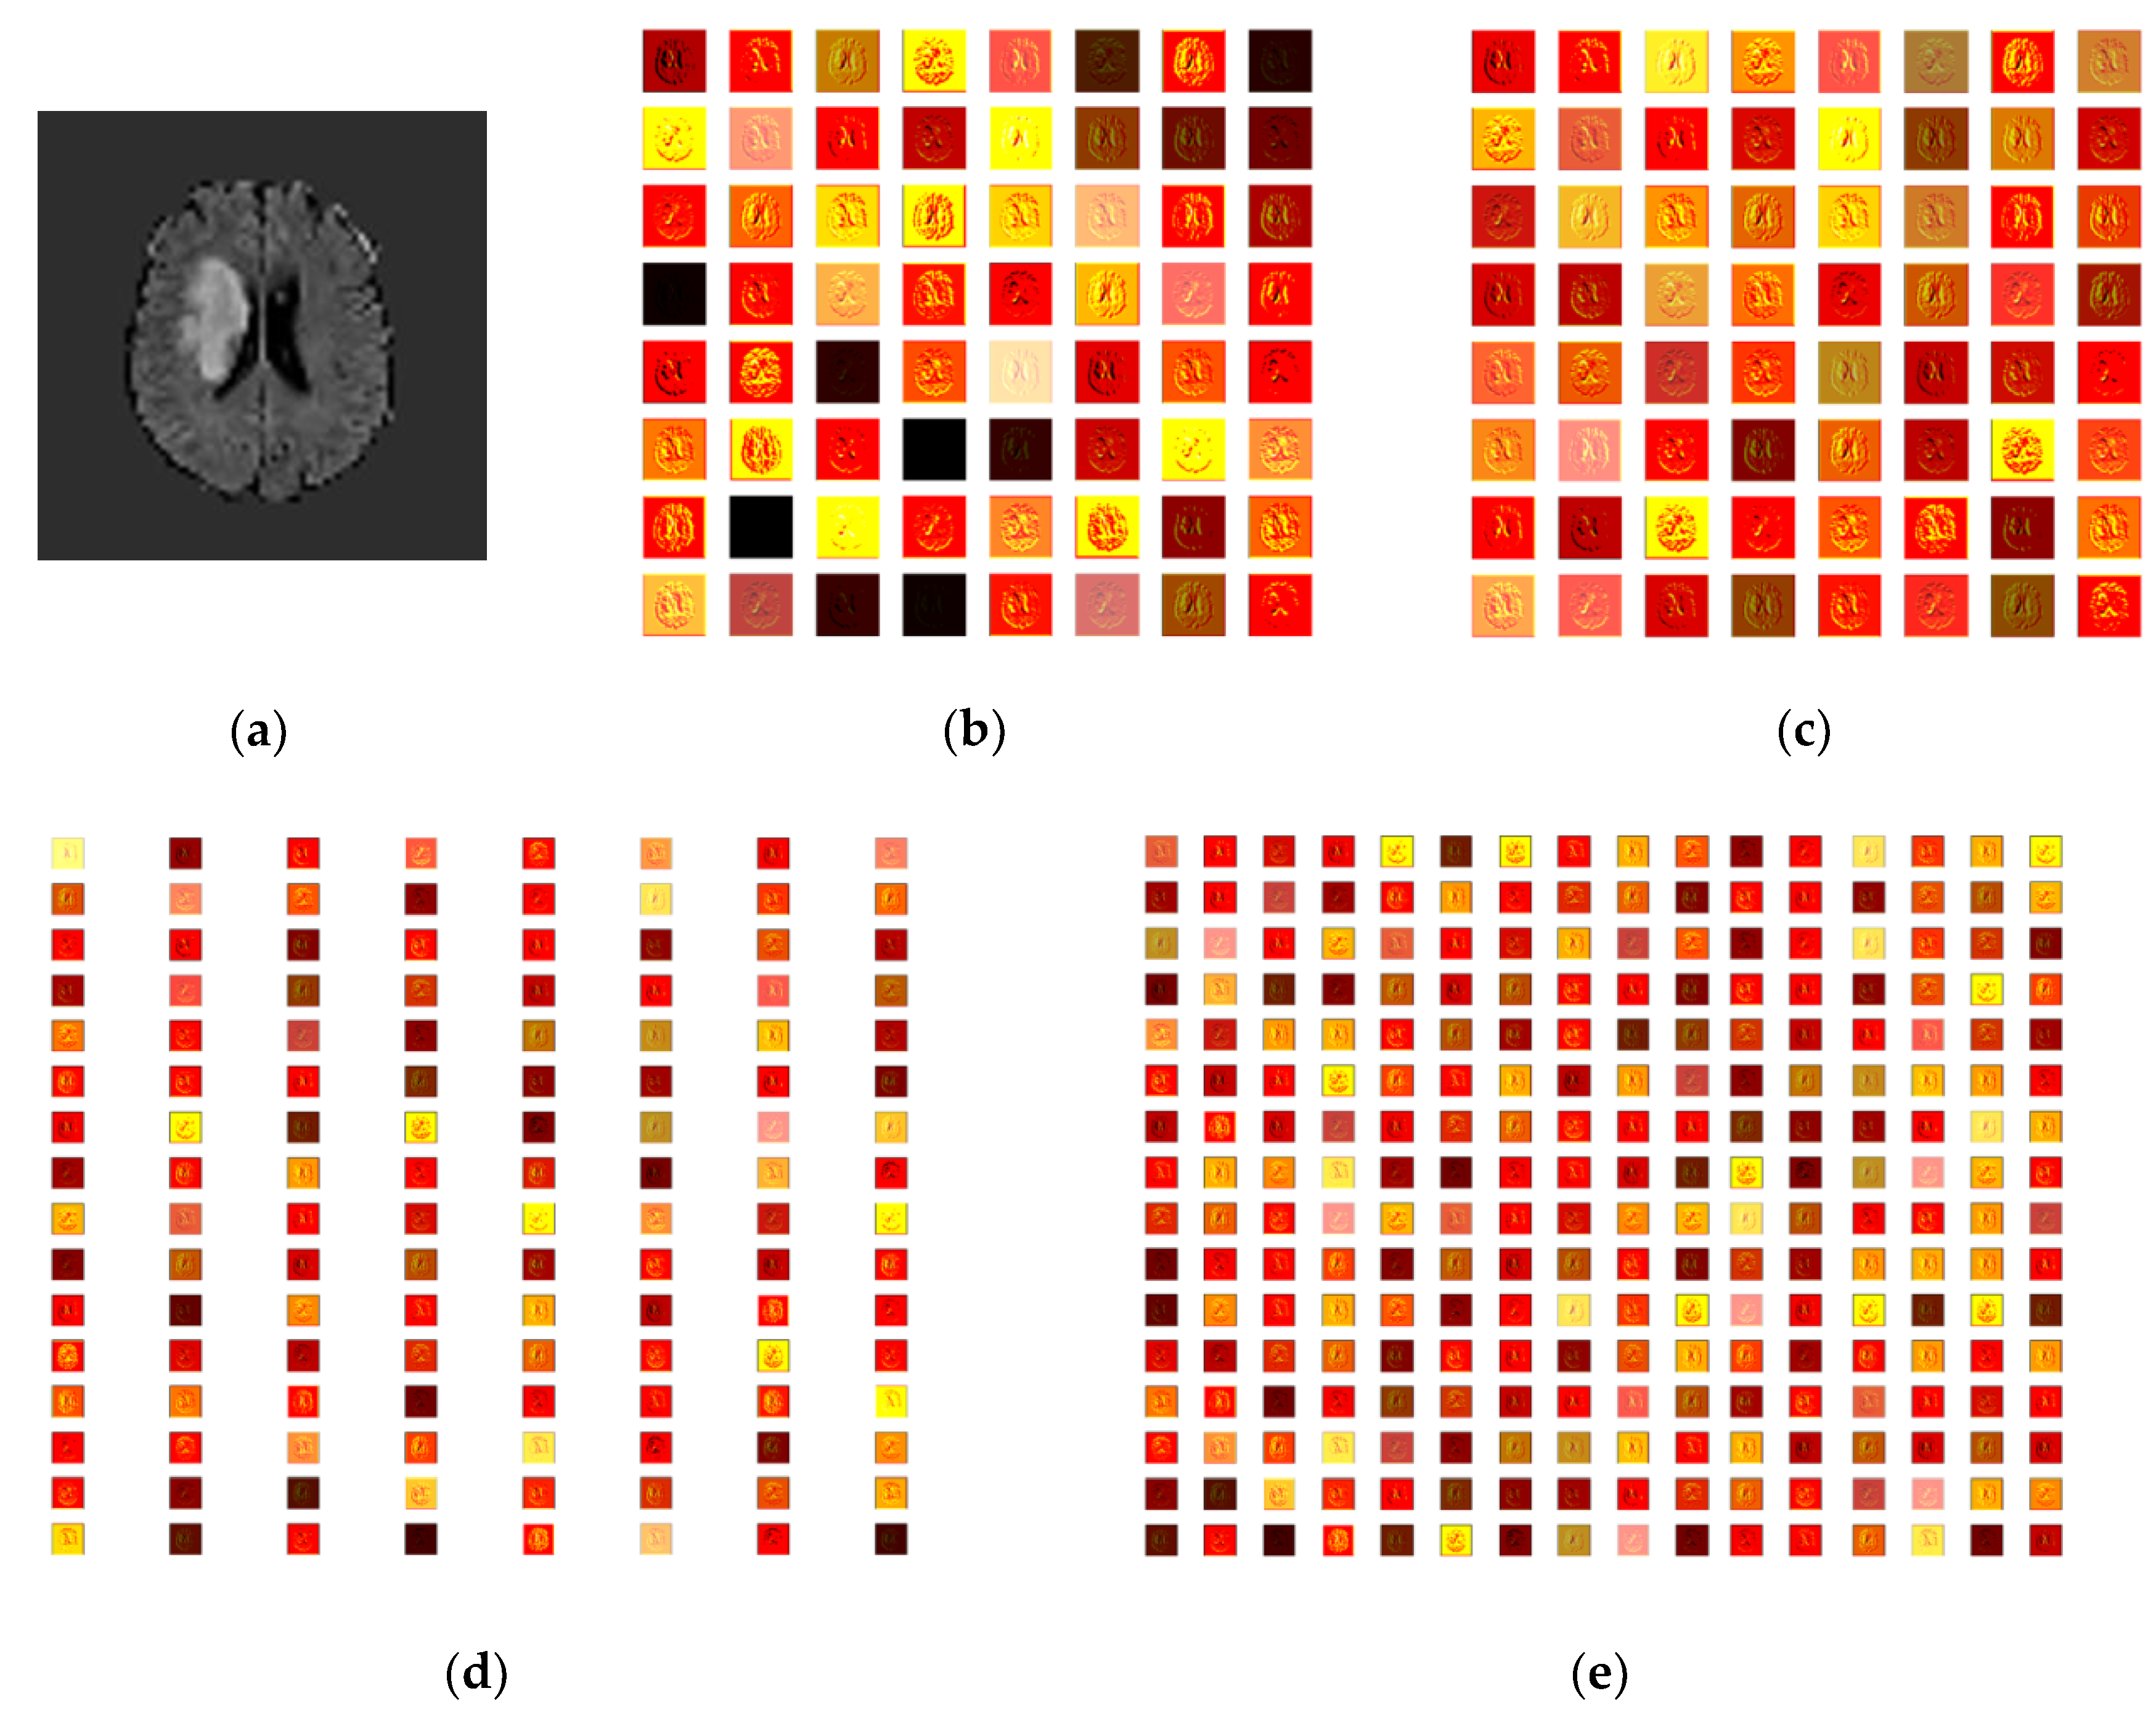
Figure 4 presents the sample test image considered to demonstrate the performance of VGG Segments. Figure 4a–c presents the 2D slices with various modalities, and Figure 4d,e depicts the collected ground truths with class low (GTL) and high (GTH).
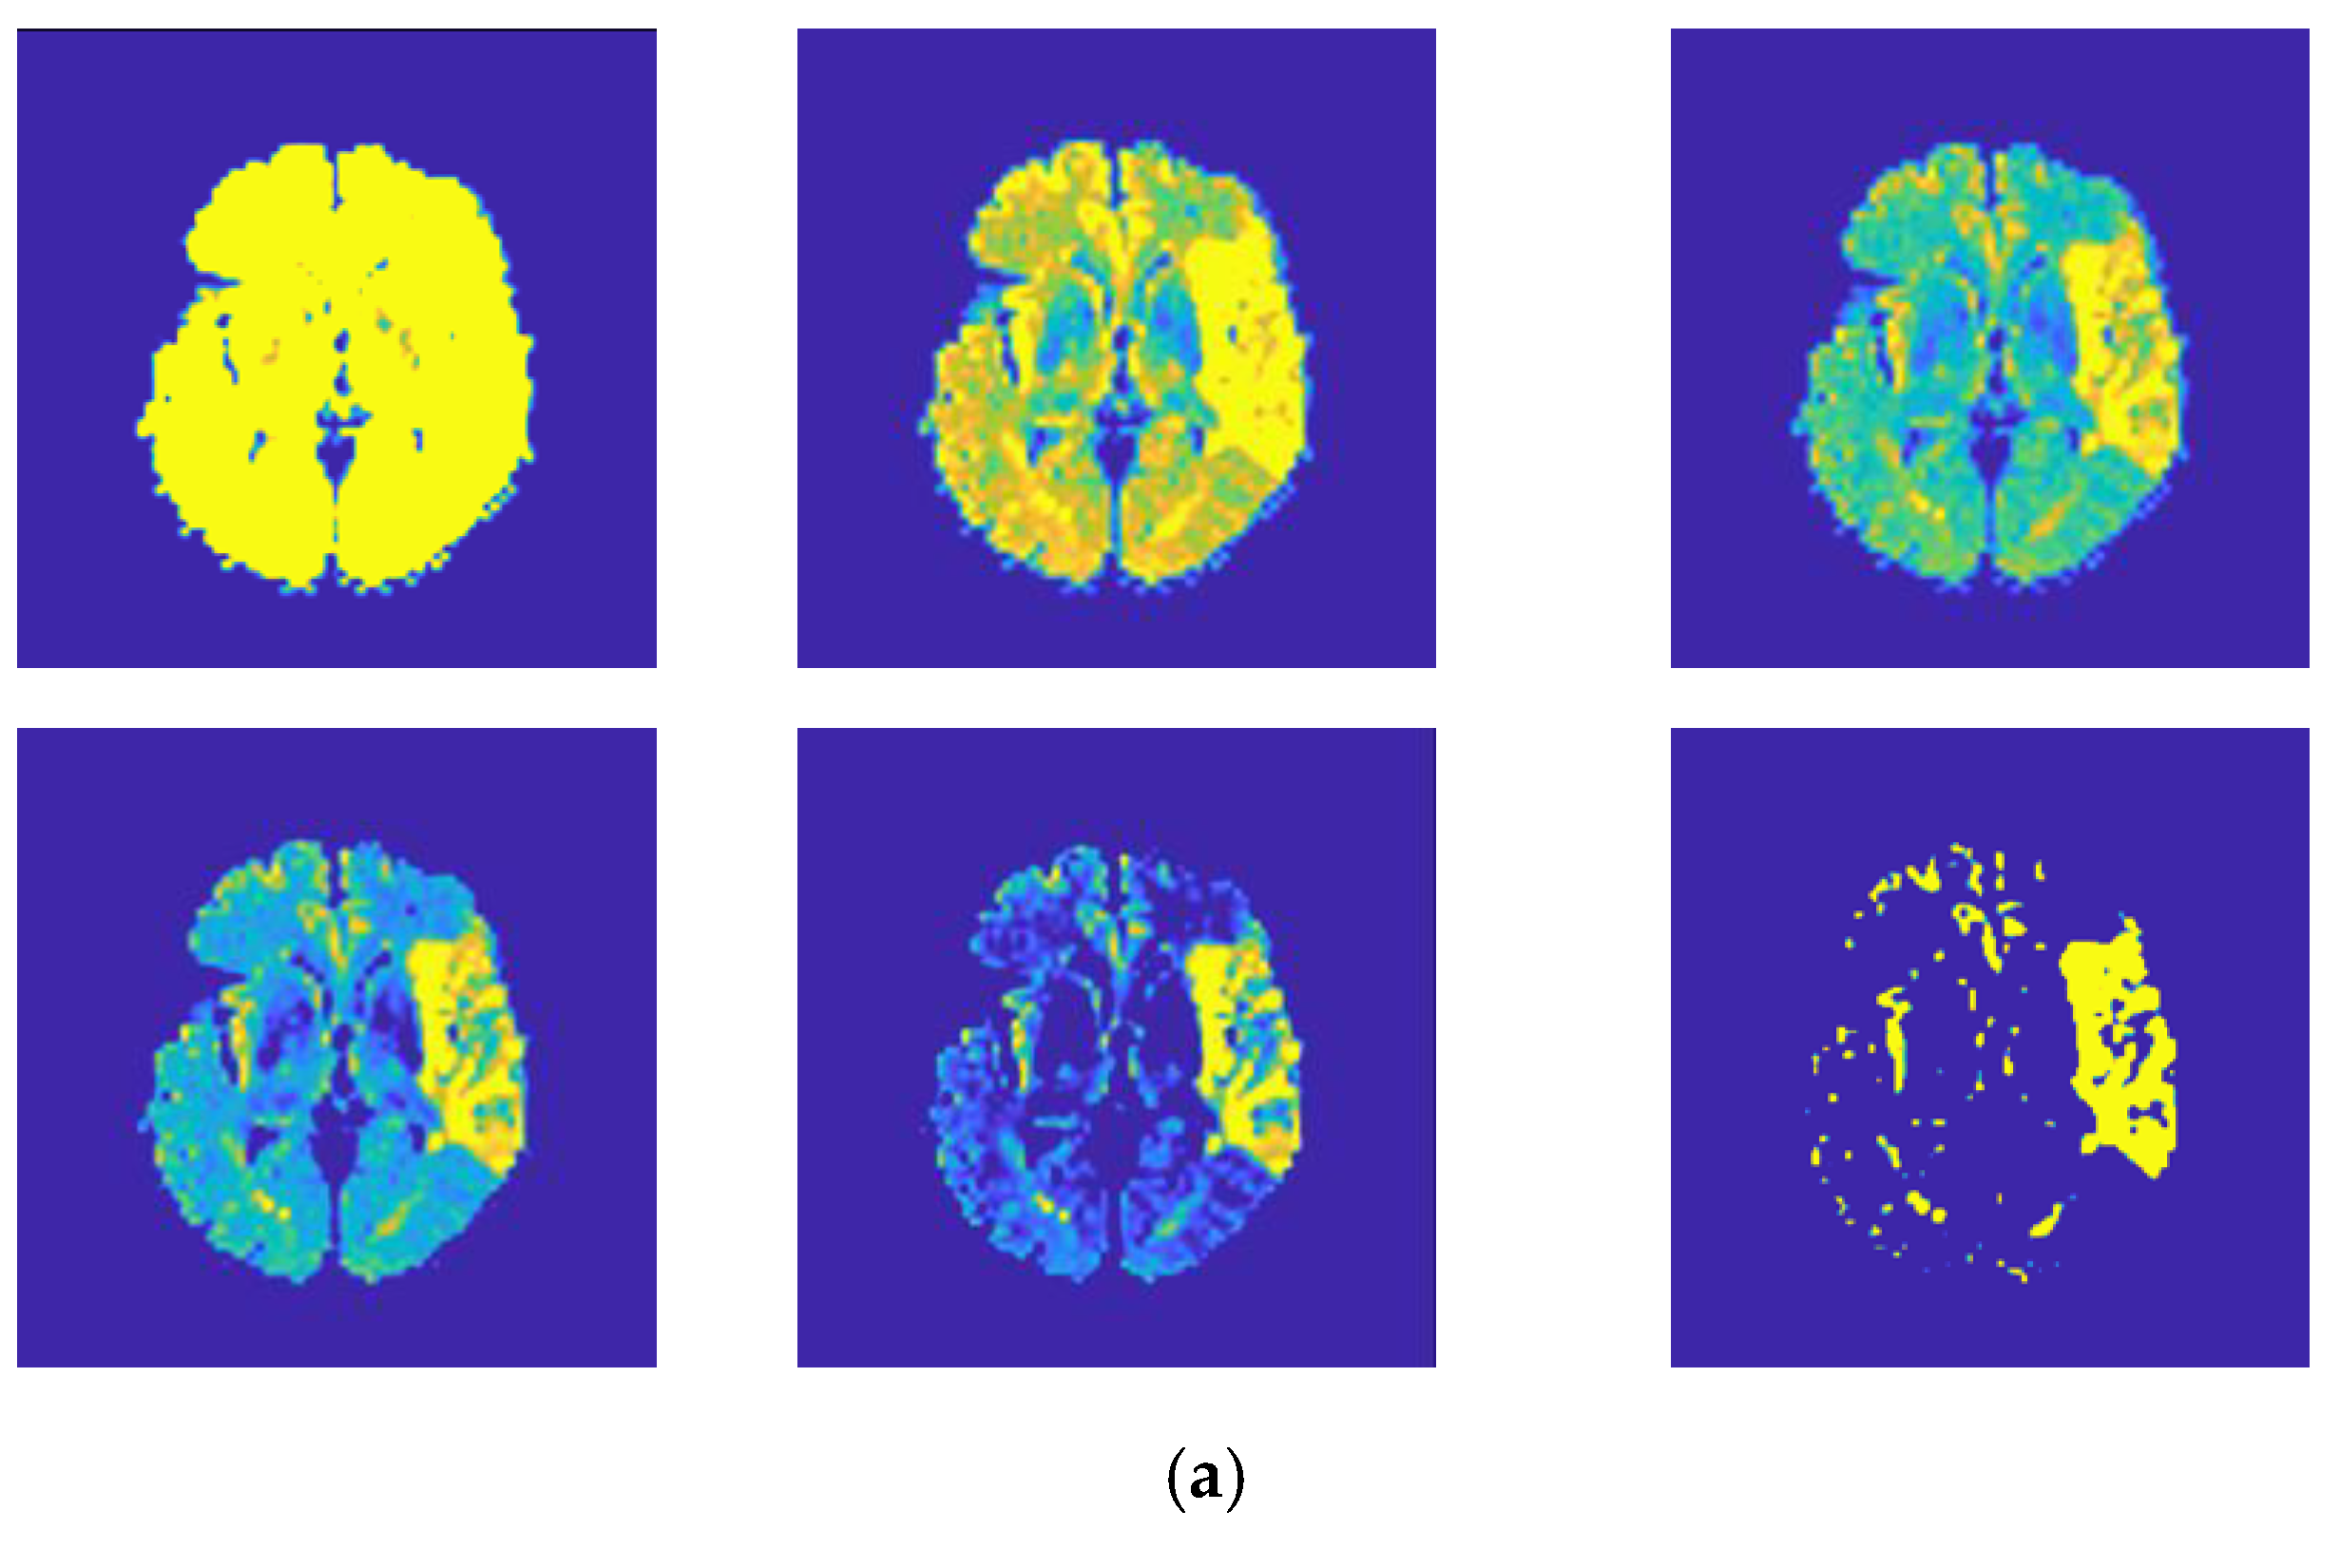
The VGG-SegNet was executed using the Flair modality images, and the various level outcomes are presented in Figure 5. For a better visibility, the encoder output is depicted using the Parula colormap, and this confirms that the encoder section helps to enhance the abnormal section in the considered MRI slice. Figure 5a presents the results attained at the different layers (MaxPool) of the encoder, and Figure 5b–d presents the outcome attained at the SoftMax layer of the decoder for Flair, DW, and T1 modalities, respectively. After extracting the RoI, a relative study was separately executed on GTL and GTH, and the results are depicted in Table 1.
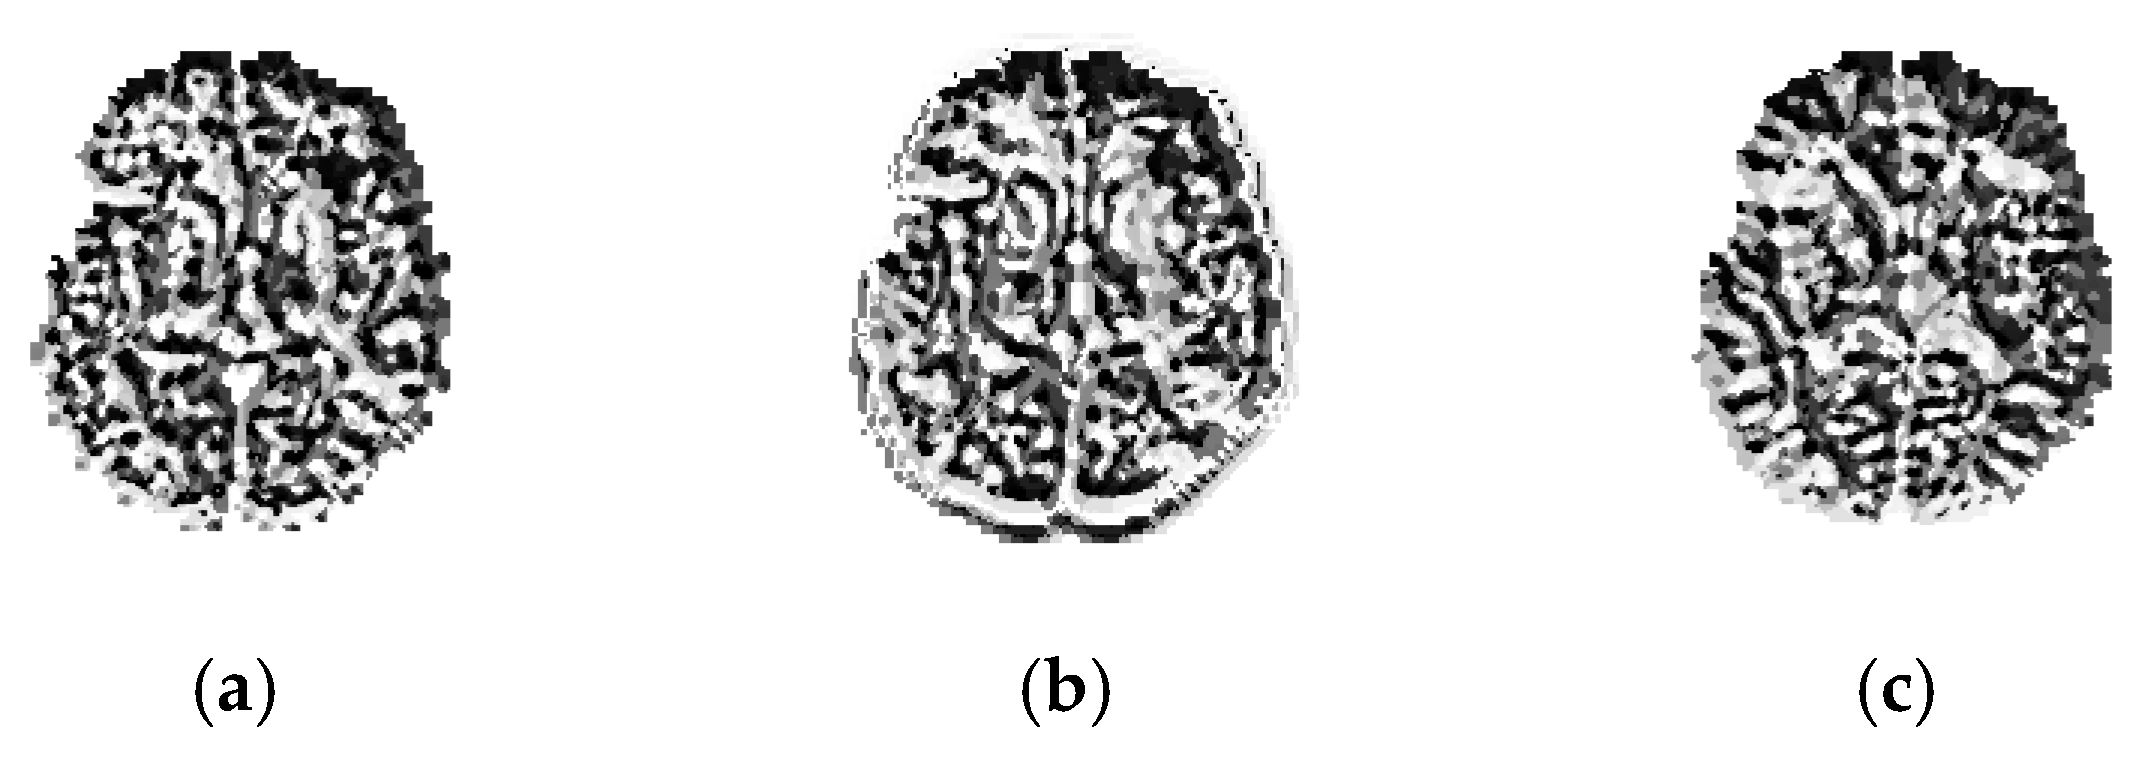
Table 1 presents the individual results attained for GTL and GTH of Flair, DW, and T1. This result confirms that the QM attuned to T1 is poor, compared with Flair and DW. However, the average QM shown in Table 1 and Figure 6 confirms that the proposed scheme exactly mines the ISL section. A similar procedure was employed for the considered test images, and from the extracted RoI, the essential GLCM features were extracted.LPB features were also extracted from these test images for a chosen LBP weight of 4, and the sample LBP pattern is depicted in Figure 7. Figure 7a–c shows the LBP of Flair, DW, and T1, respectively. After performing this task, the considered test images were then separately classified using pretrained DL schemes.
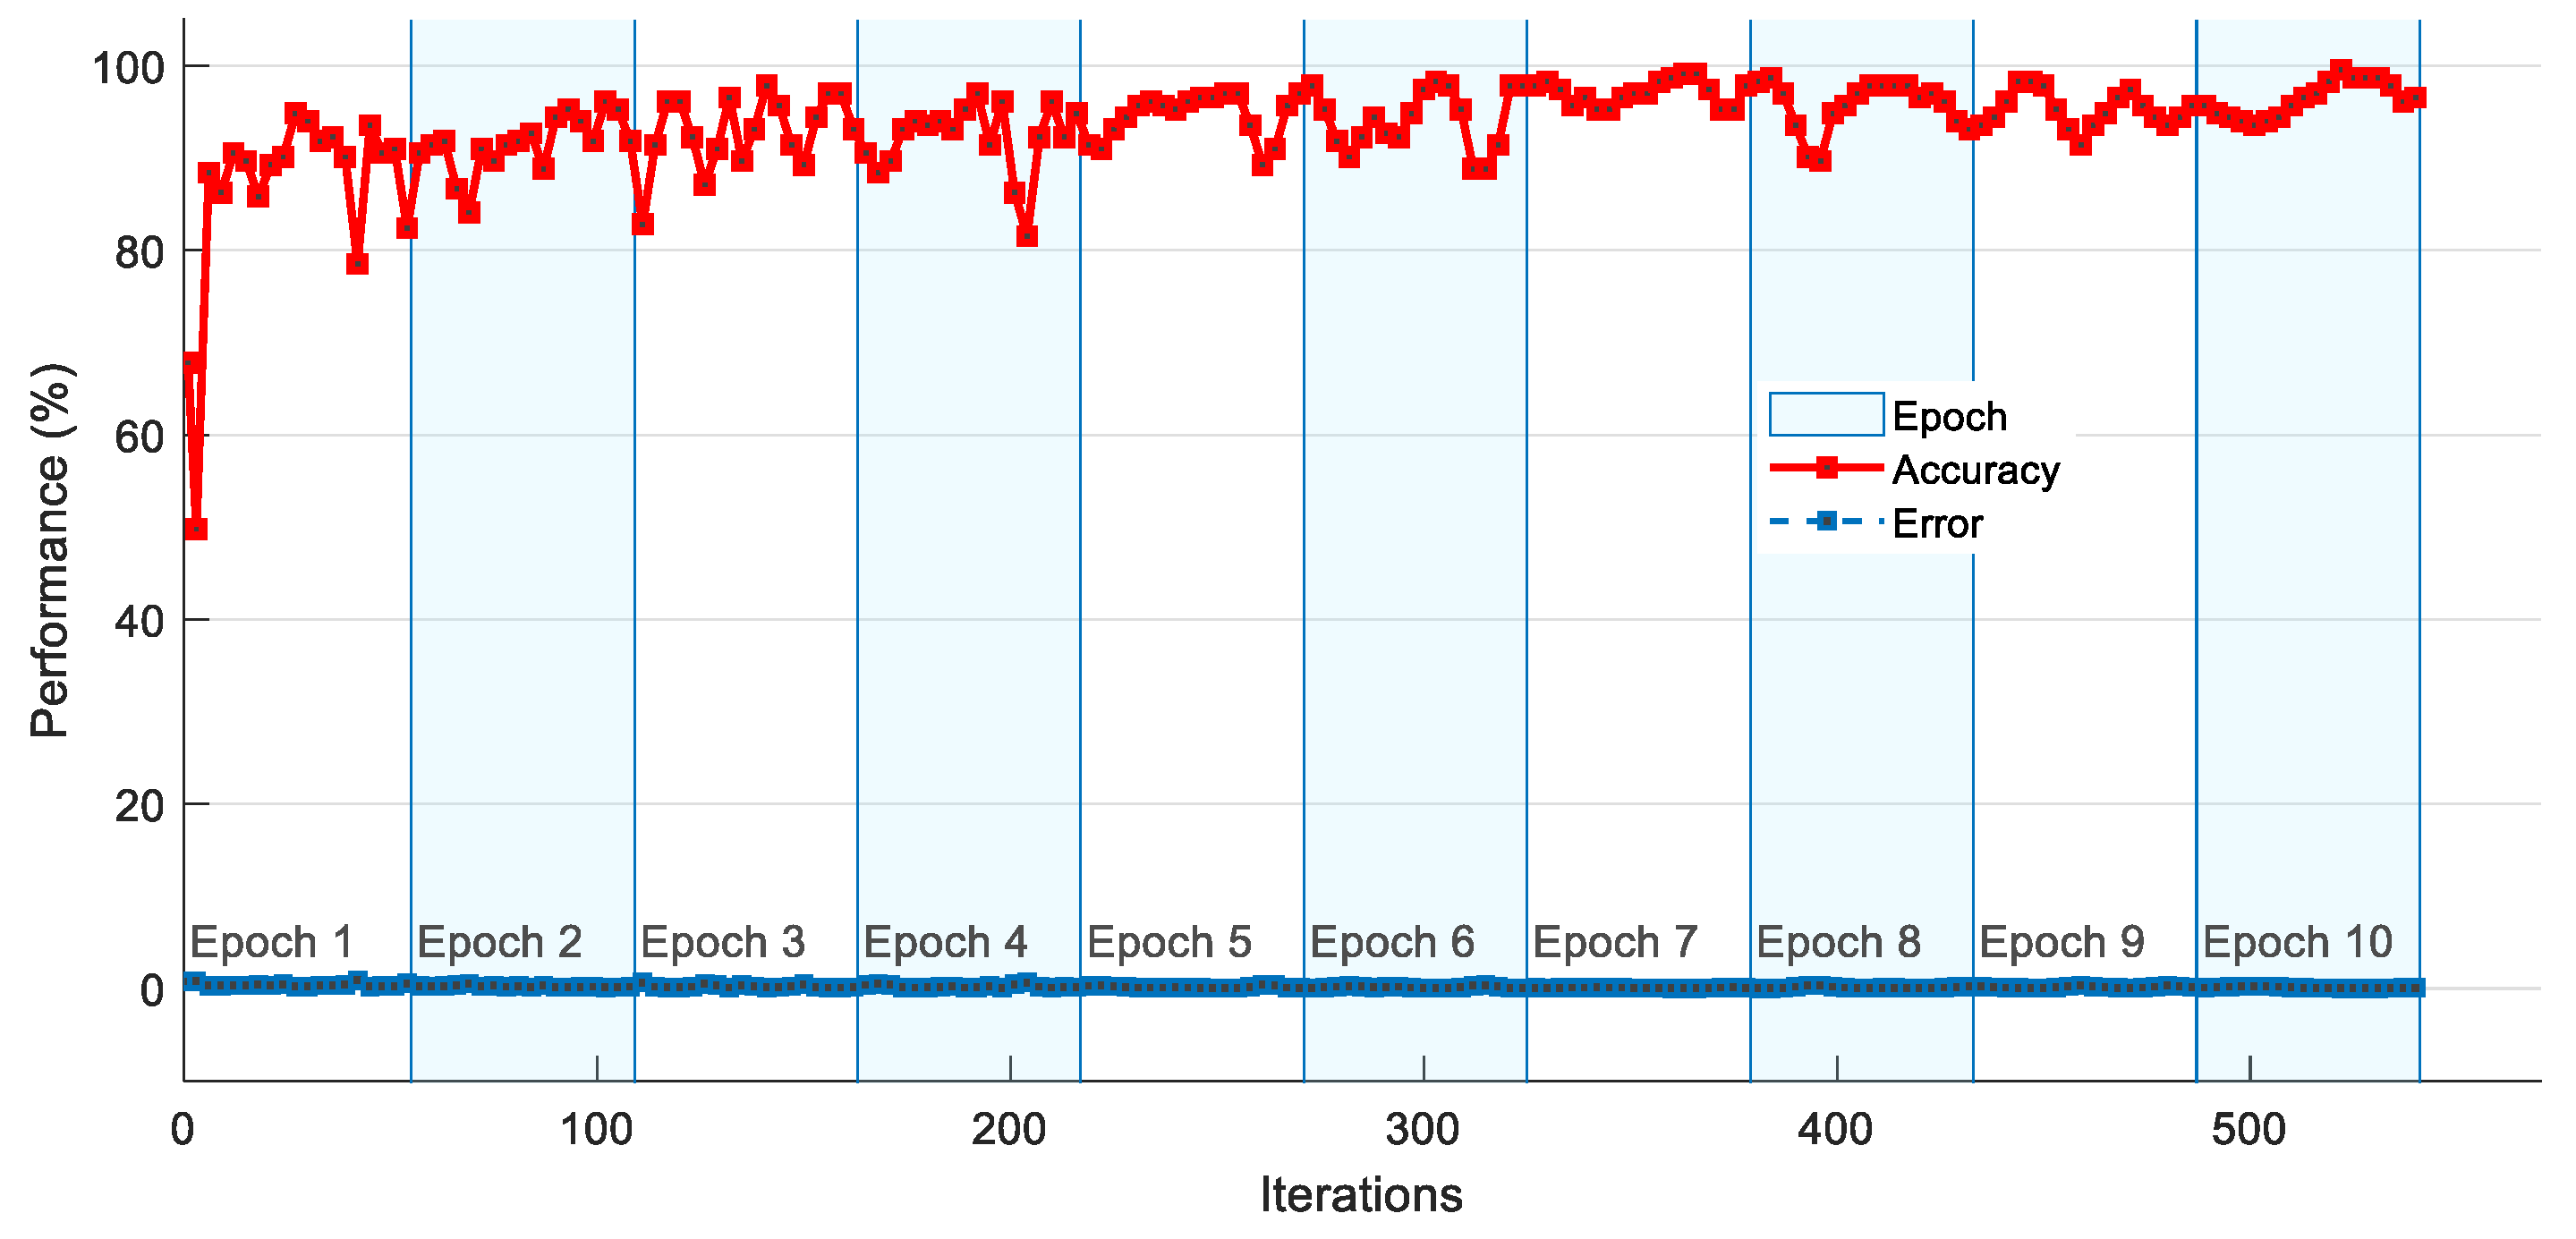
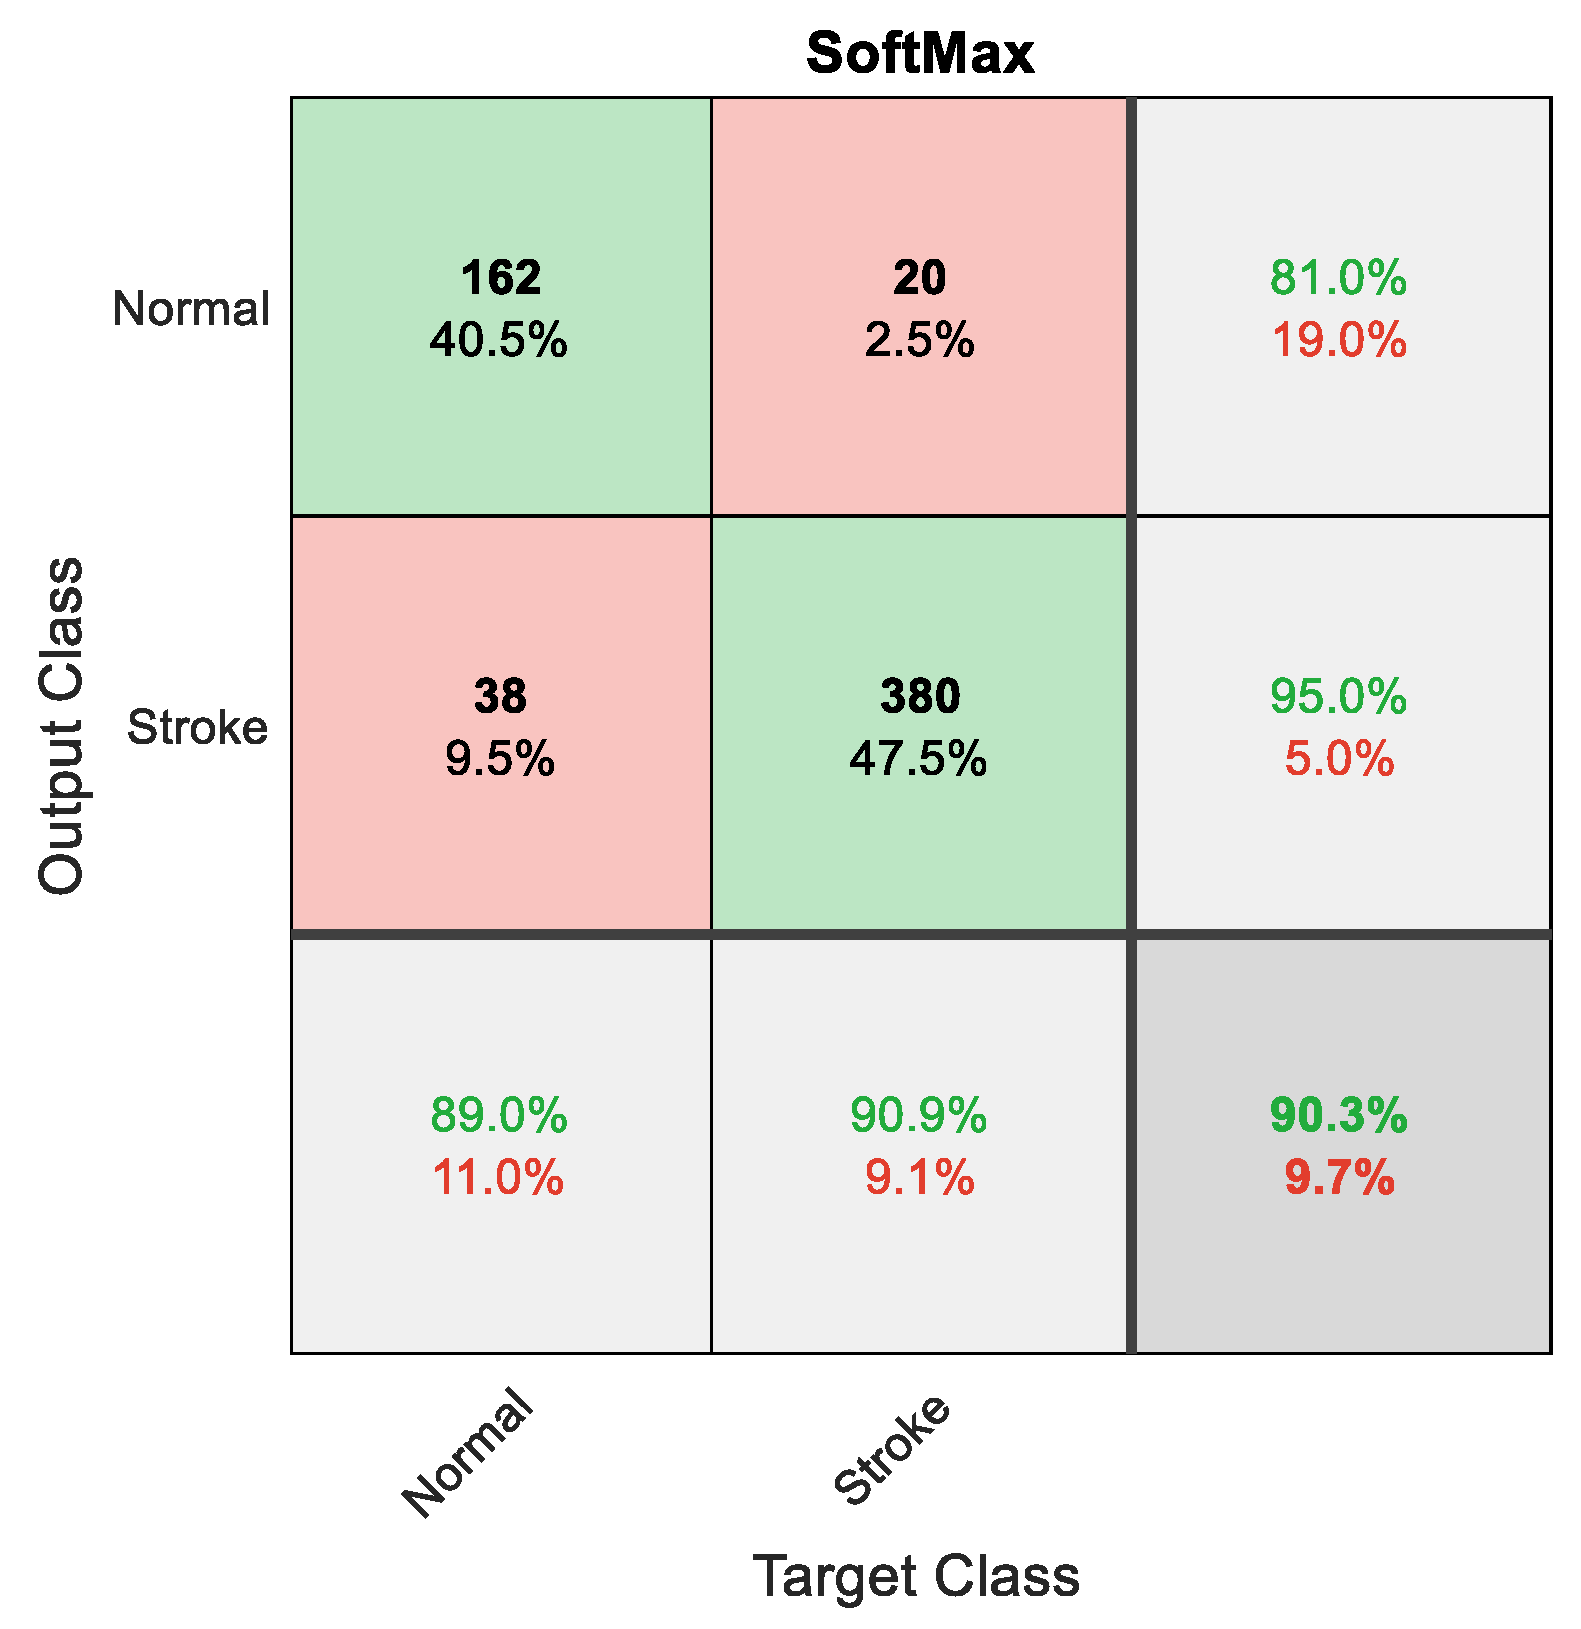
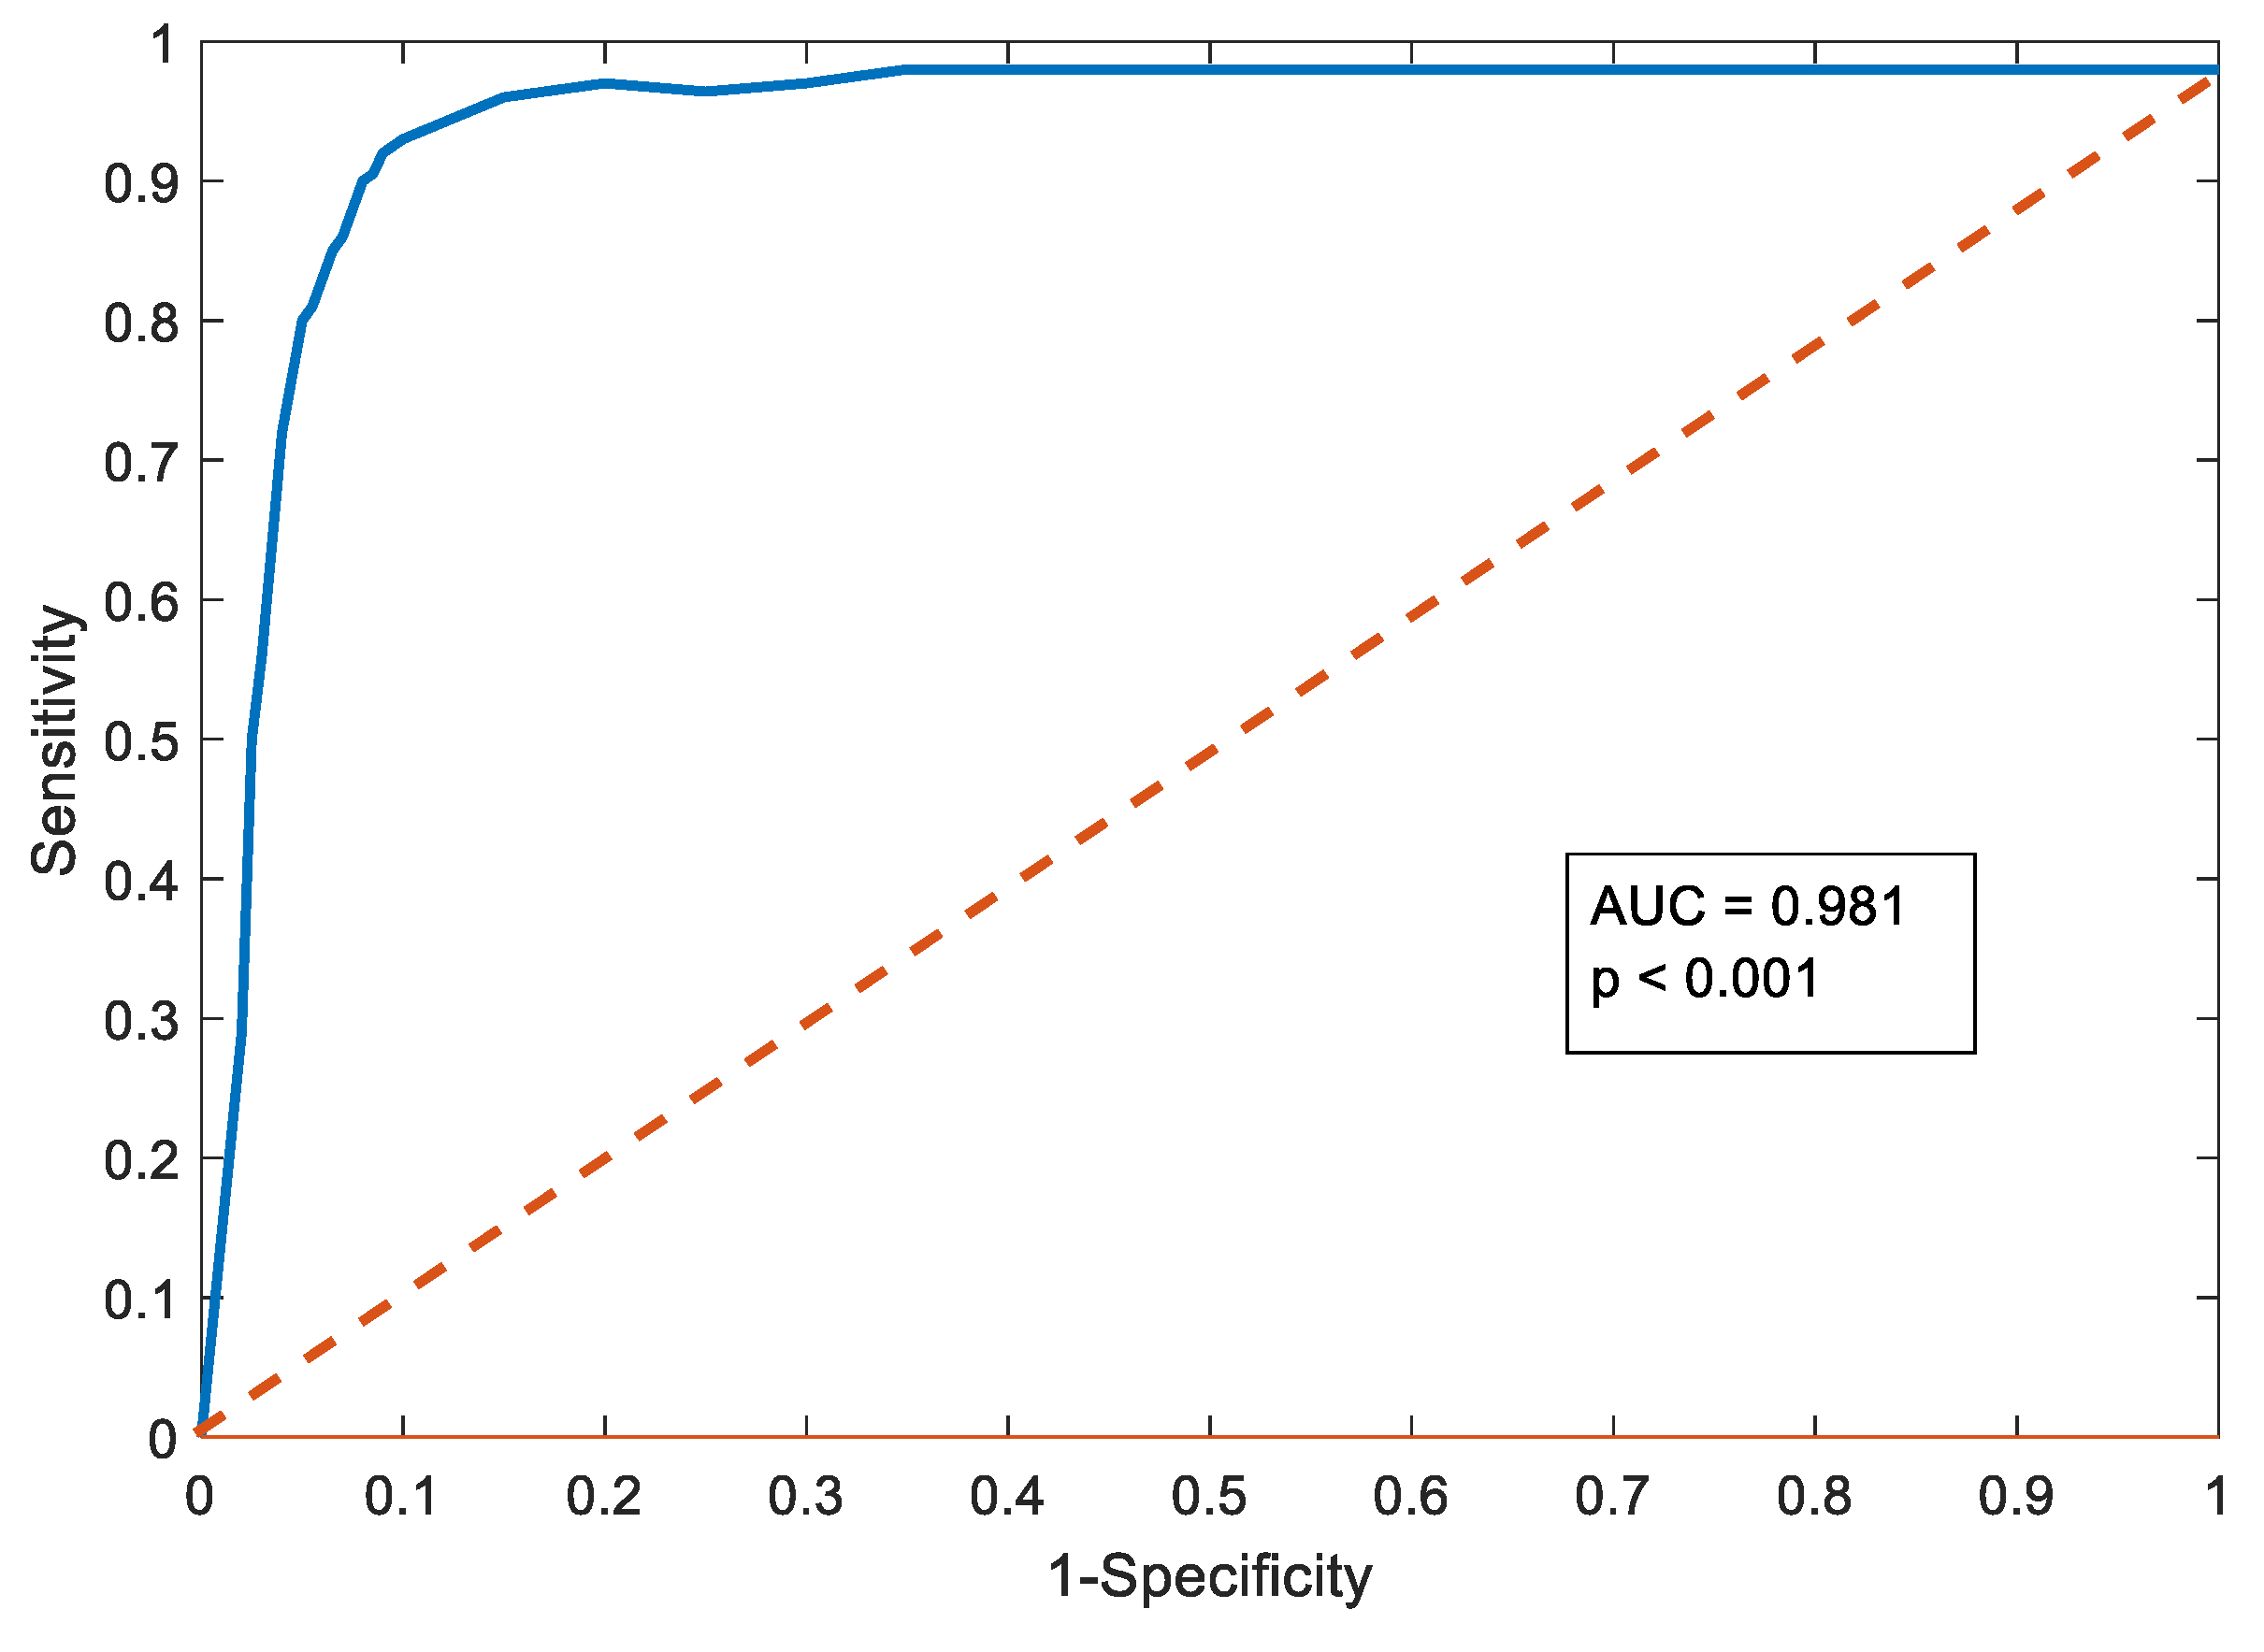
The result achieved with the VGG16 scheme is depicted in Figure 8, Figure 9, Figure 10 and Figure 11. Figure 8 presents the results of each convolutional layer for a chosen test image. Figure 8a shows the chosen test image, and Figure 8b–f presents the corresponding outcome of the chosen layers. For a better visibility, a hot colormap was chosen for these intermediate layer results. The training and testing convergence, and the necessary details, such as iteration value, epoch size, and simulation time, are presented in Figure 9. Figure 10 presents the sample confusion matrix attained with VGG16 for the Flair MRI, and the corresponding AUC is depicted in Figure 11. A similar procedure was repeated with other pretrained models, and the attained QM for every MRI modality is presented in Table 2. All these results were obtained with only DF using the SoftMax classifier, and from the table, it can be confirmed that the result obtained for the T1 modality is poor, compared with Flair and DW.
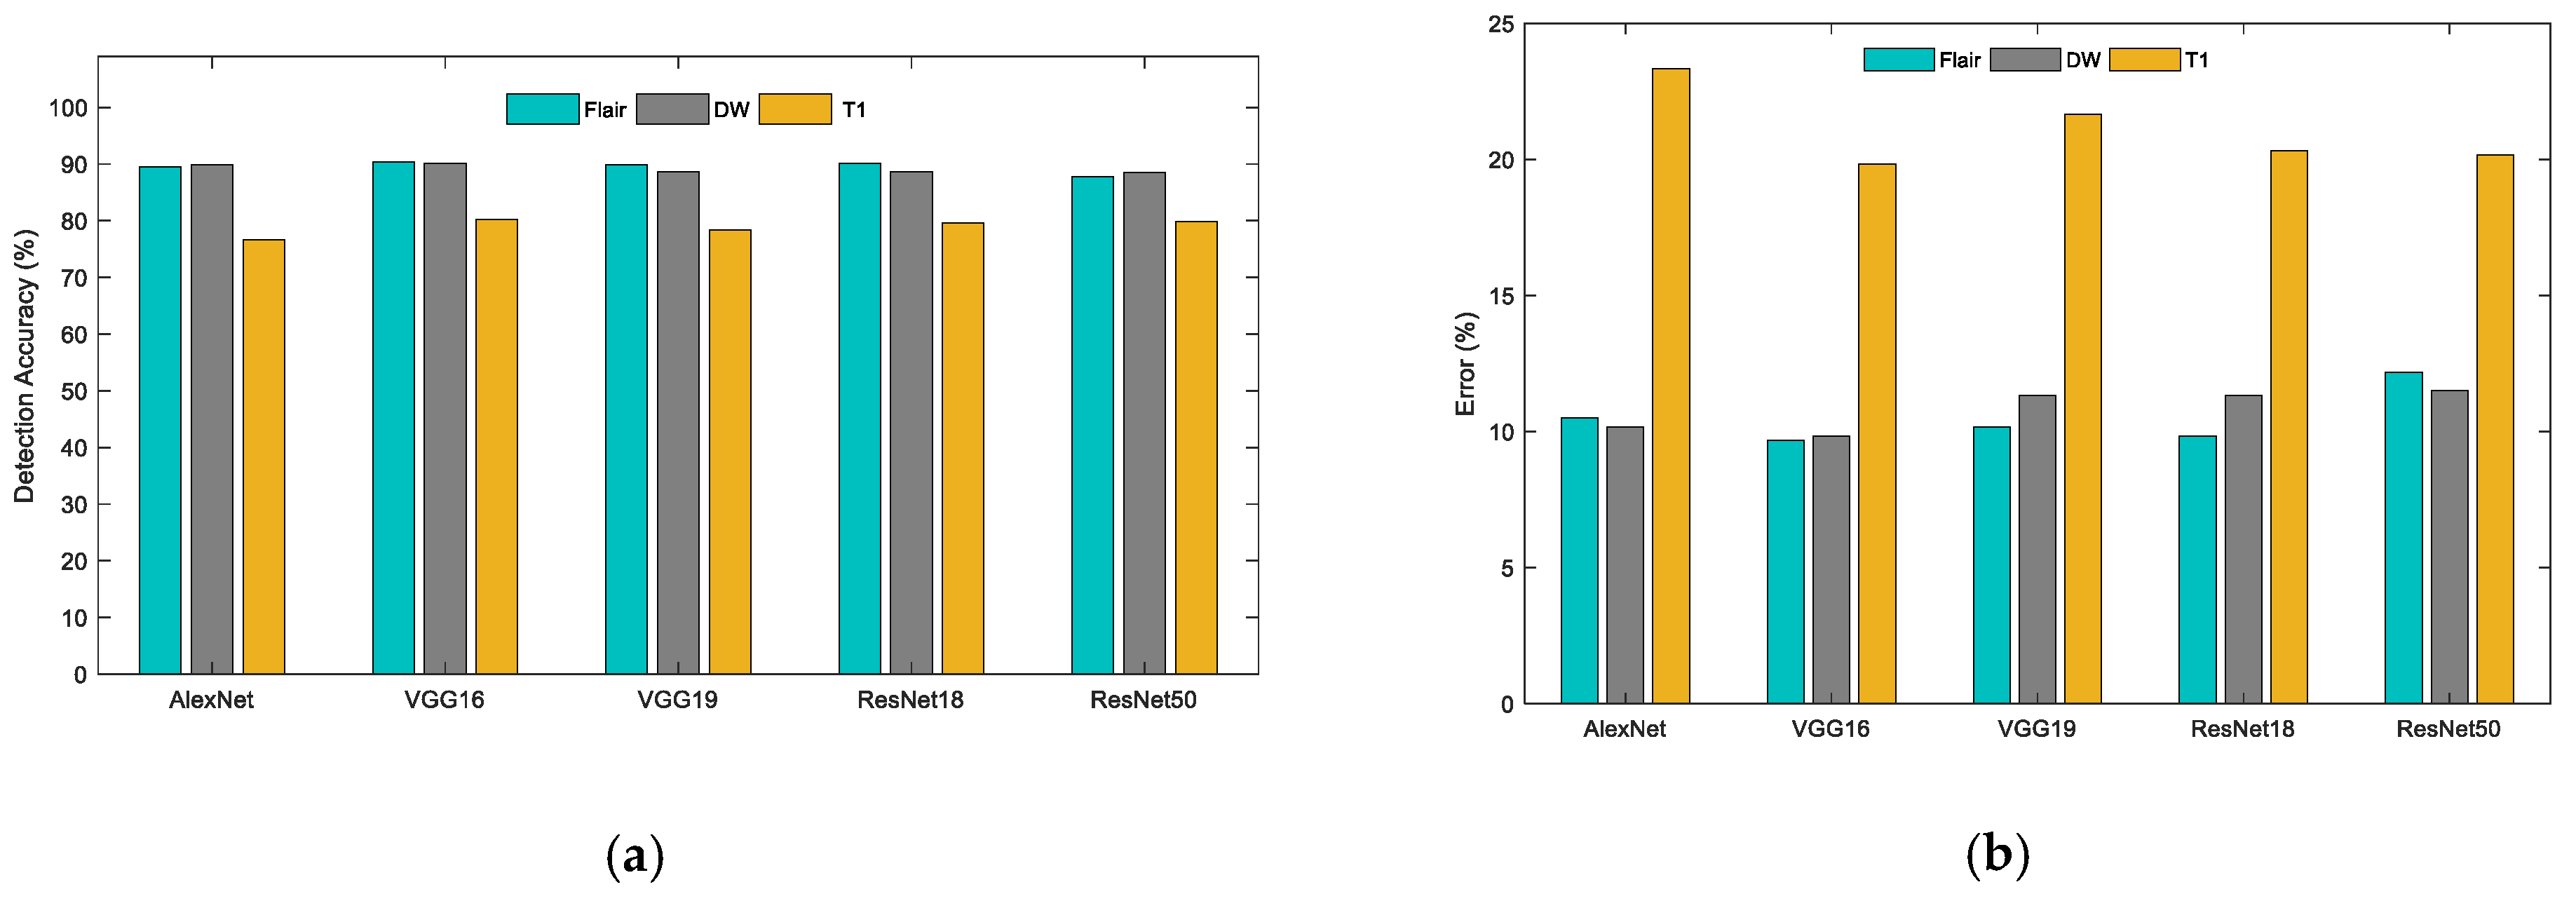
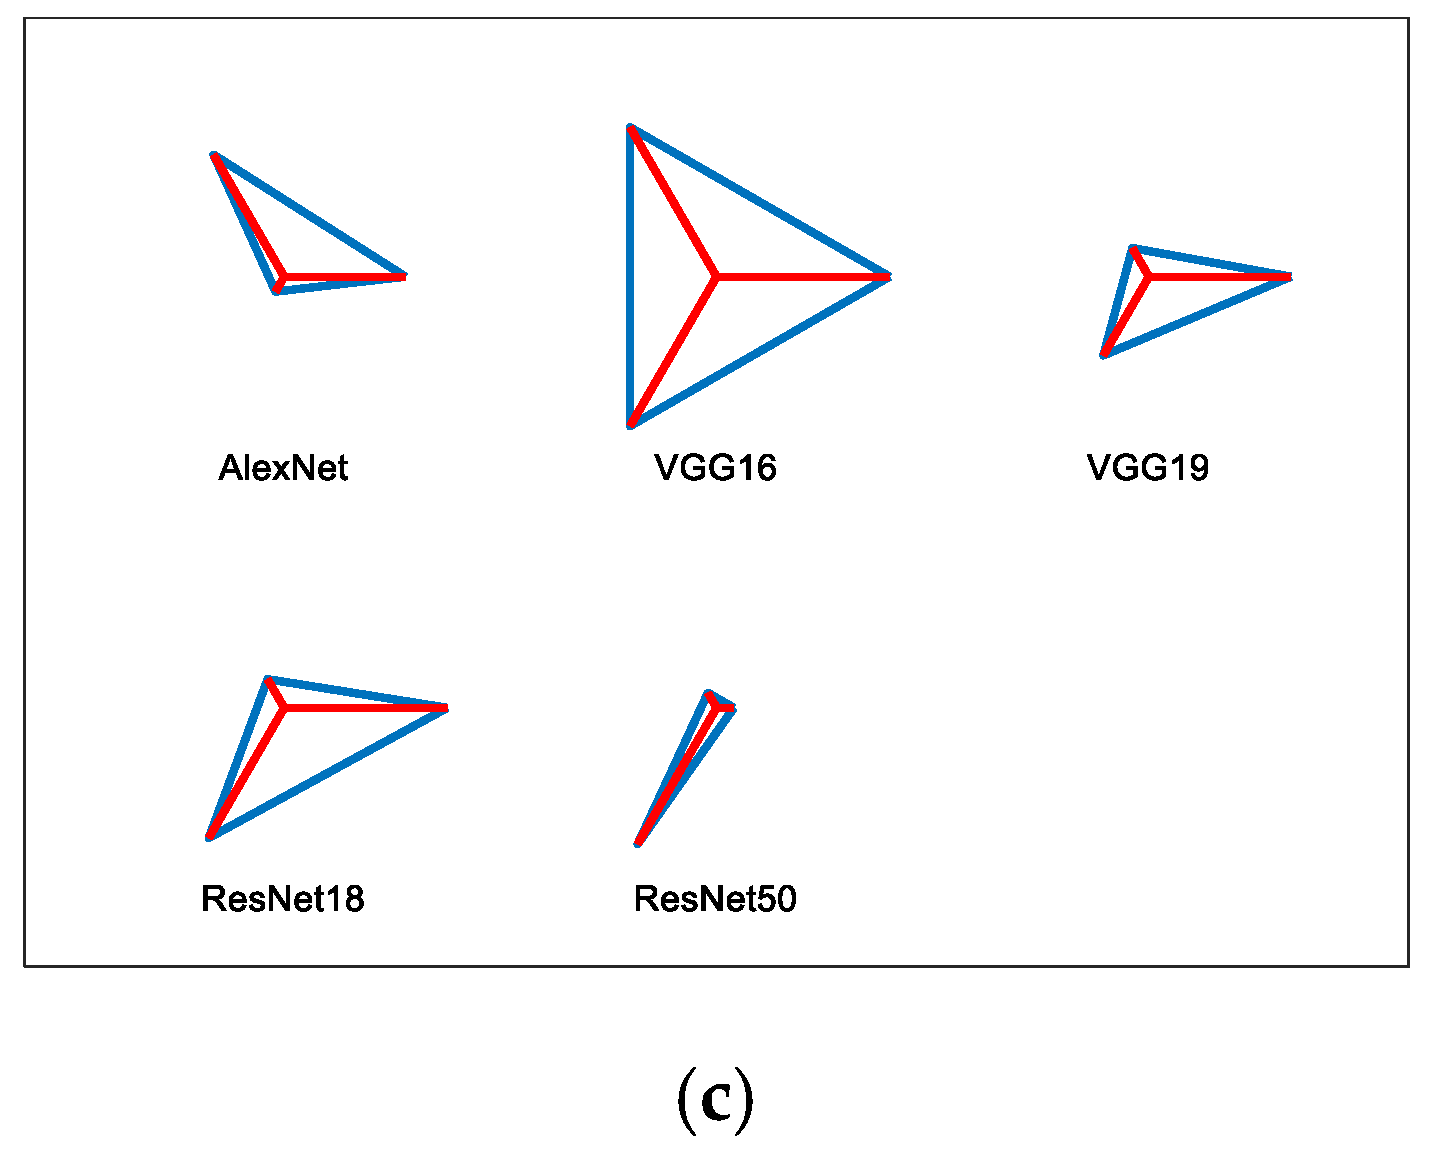
Figure 12 presents the graphical evaluation for the results shown in Table 2, in which Figure 12a presents the comparison of classification accuracies, Figure 12b presents the corresponding error values, and Figure 12c shows the overall QM in the form of a glyphplot. From these figures, it can be noted that the individual accuracy and the overall QM attained with VGG16 is better, compared with other DL systems. The performance of the VGG16 was further tested by replacing the SoftMax with DT, KNN, RF, SVM-L, and SVM-RBF; the corresponding outcome is presented in Table 3, and its graphical comparison is shown in Figure 13. Figure 13a shows the accuracy of various classifiers for the Flair modality case, and Figure 13b presents the accuracy of Flair, DW, and T1 as a glyphplot. These images confirm that the classification results achieved by VGG16 with KNN are better, compared with other binary classifiers. All these results were achieved only by considering the DF and further; the experimental investigation was implemented with the concatenated (HF + DF) features presented in Equation (6).
This work was also performed using fivefold cross-validation, and the result was recorded. The classification result obtained with the concatenated feature is presented in Table 4, and it also confirms that the overall QM attained by Flair is better, compared with DW and T1. This result confirms that the SVM-RBF classifier helps to obtain better results, compared with other techniques. Additionally, this result is better, compared with the classification result with the DL in every case.
In this work, a DL-based joint segmentation and classification were implemented using the VGG16 scheme. The future scope of this scheme includes (i) the proposed scheme can be tested and validated with other CNN based segmentation procedures and other DL schemes existing in the literature, (ii) the ISL detection scheme can be used to examine2D brain MRI slices having the tumor, and (iii) the clinical significance of this approaches can be confirmed using the real clinical images collected from hospitals.
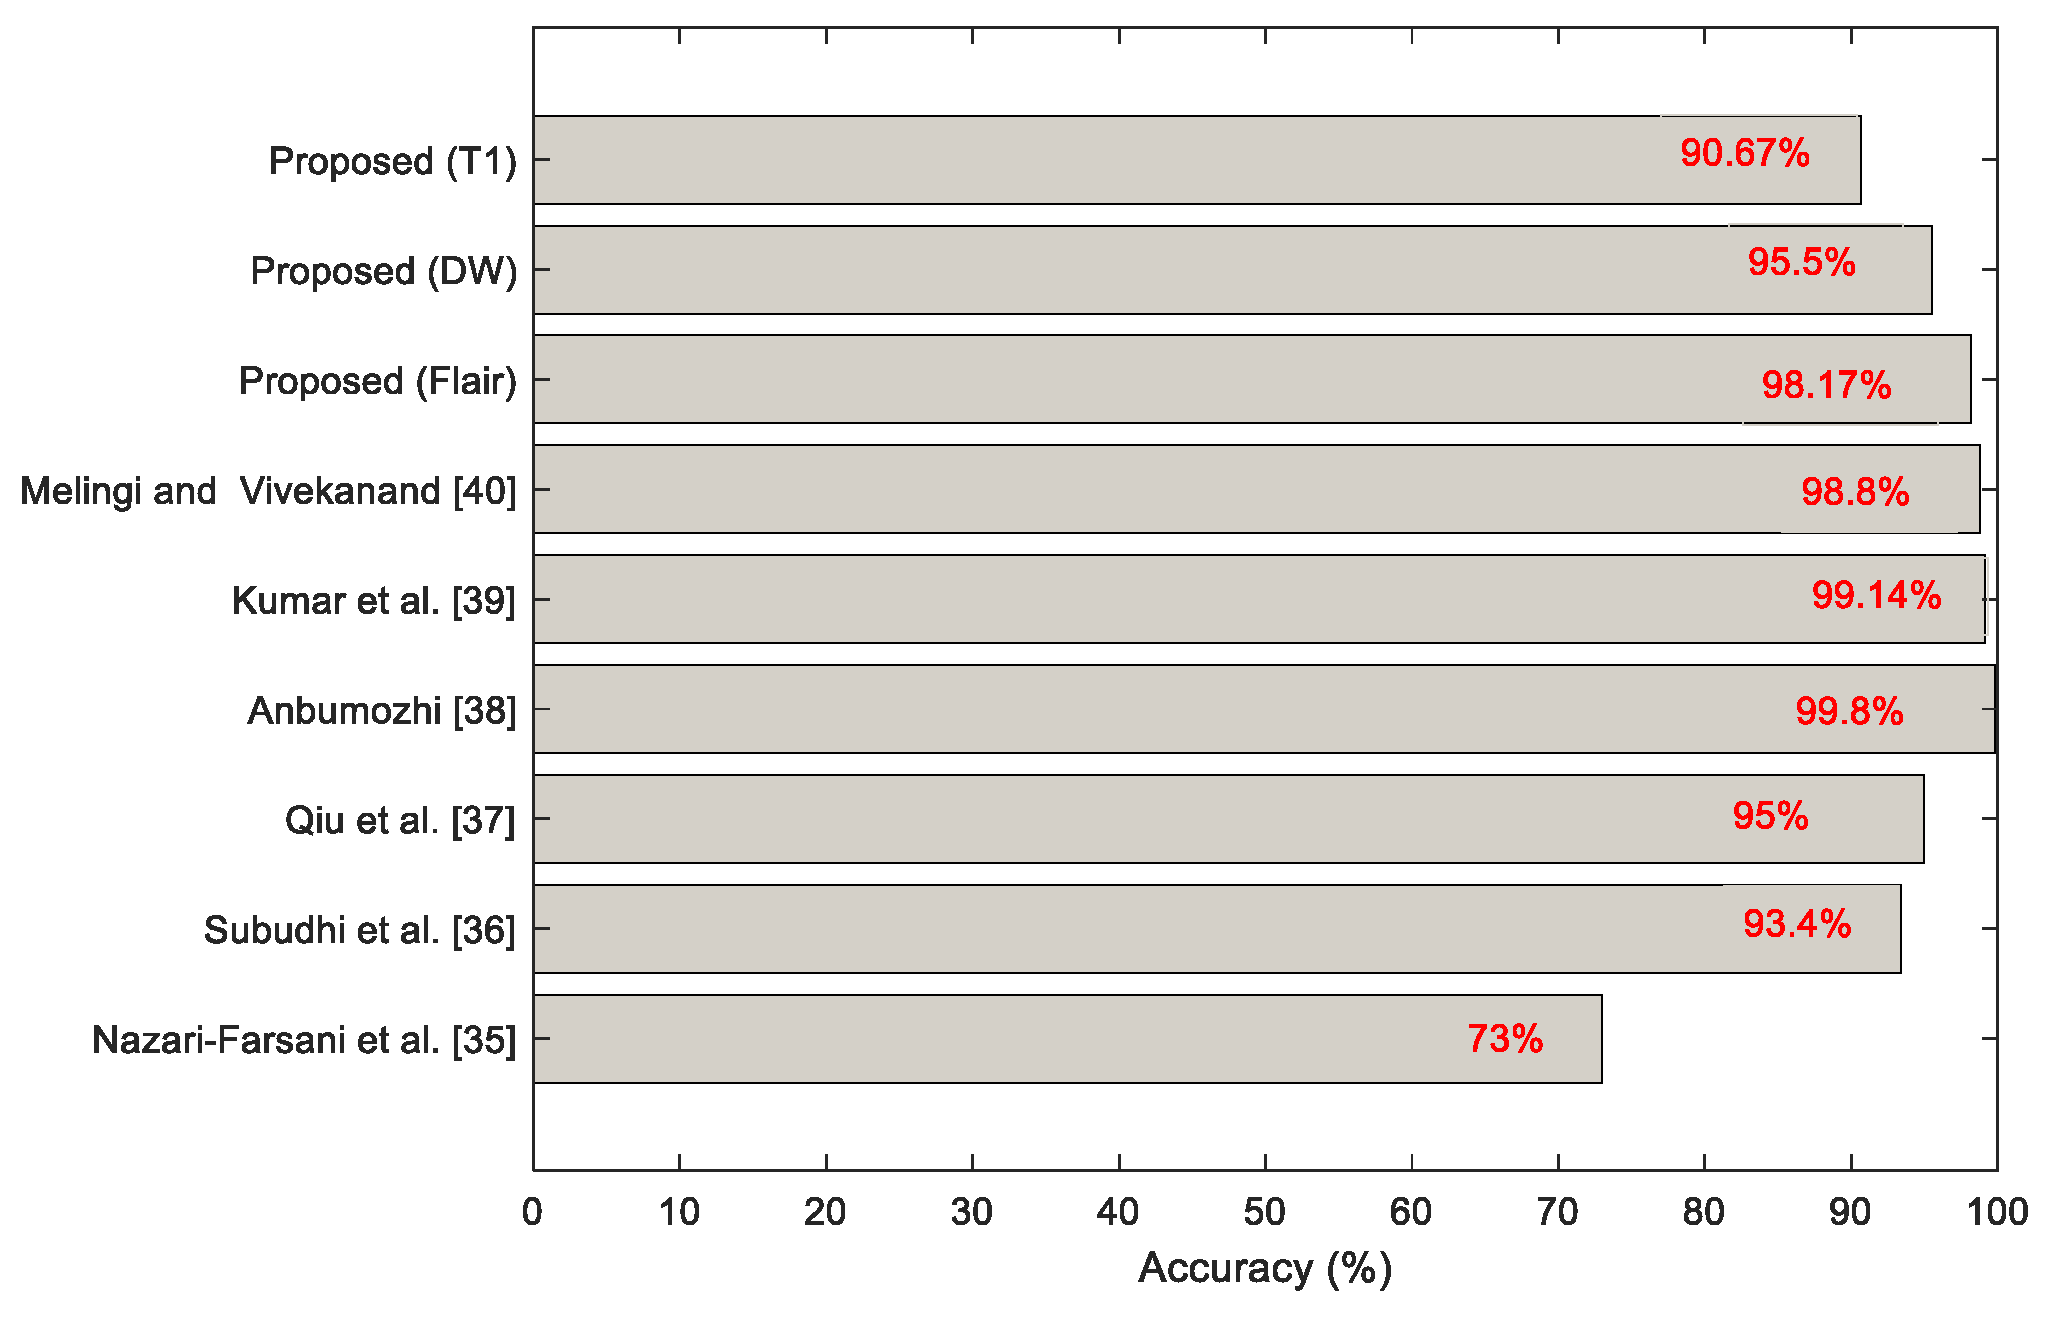
The merit of the proposed scheme on Flair/DW/T1 modality MRI slices is shown in Table 4, which confirms that this scheme presents better values of classification accuracy. Recently, Castillo et al. (2021) [34] presented a detailed assessment on combined segmentation- and classification-based evaluation of MRI slices [35,36,37]. The ISL detection procedure discussed in this work was considered to validate the classification performance of the proposed scheme. The best result achieved with the proposed work was then compared with the existing methods, and the outcome is presented in Figure 14.
The earlier works presented in the literature considered only a single MRI modality for the examination, and hence, the previous results show improved accuracy in [38,39,40]. However, compared with the works in [35,36,37], the results achieved with the proposed technique are better for the Flair and DW modalities. The chief limitation of the proposed scheme is that its detection accuracy is less when a T1 modality MRI is examined.
In the future, the performance of the proposed technique can be improved by implementing the classification using a heuristic algorithm optimized with deep and handcrafted features. Further, the performance of the proposed scheme can be verified using the brain MRI slice with the skull section.
4. Conclusions
In the current era, brain abnormalities are gradually rising in humans due to various causes. Ischemic Stroke is one of the major brain abnormalities, which causes temporary/permanent disability in humans and death.
Bioimage-assisted stroke detection is essential for appropriate treatment planning, and the complexity of stroke detection will increase when the number of patients’ information to be examined is more. Hence, this work proposed a DL-supported segmentation and classification scheme to provide the preliminary diagnostic report to the doctor to support the timely detection of ISL. Based on the report, the doctor performs a visual check on the patient’s data that need immediate attention.
The proposed scheme employed the pretrained VGG16 scheme to achieve the task. This work initially executed the VGG-SegNet-supported ISL mining and achieved better results on the MRI modalities Flair, DW, and T1.After obtaining the better segmentation result, the classification task was then executed by considering some well-known DL schemes, and the result of VGG16 proved to be better than other DL methods considered in this study.
Finally, the performances of VGG16 were tested and validated with DF and concatenated features using DT, KNN, RF, SVM-L, and SVM-RBF, and the attained results confirmed that the KNN provided a classification accuracy of >97% with DF and SVM-RBF helped to achieve an accuracy of >98% with concatenated features. In the future, the proposed framework’s performance can be improved by considering other handcrafted features existing in the literature.
Author Contributions
Conceptualization, V.R.; methodology, S.K.; software, S.M.A.; validation, V.R., S.K. and S.M.A. All authors have read and agreed to the published version of the manuscript.
Funding
This research received no external funding.
Institutional Review Board Statement
Not applicable.
Informed Consent Statement
Not applicable.
Data Availability Statement
Publicly available datasets were analyzed in this study. This data can be found here http://www.isles-challenge.org/ISLES2015/.
Acknowledgments
Shabnam Mohamed Aslam would like to thank the Deanship of Scientific. Research at Majmaah University for supporting this work under Project No. R-2021-250.
Conflicts of Interest
The authors declare no conflict of interest.
References
- Fernandes, S.L.; Tanik, U.J.; Rajinikanth, V.; Karthik, K.A. A reliable framework for accurate brain image examination and treatment planning based on early diagnosis support for clinicians. Neural Comput. Appl. 2020, 32, 15897–15908. [Google Scholar] [CrossRef]
- Prabhu Das, I.; Baker, M.; Altice, C.; Castro, K.M.; Brandys, B.; Mitchell, S.A. Outcomes of multidisciplinary treatment planning in US cancer care settings. Cancer 2018, 124, 3656–3667. [Google Scholar] [CrossRef] [PubMed] [Green Version]
- Ambrosini, R.D.; Wang, P.; O’Dell, W.G. Computer-aided detection of metastatic brain tumors using automated three-dimensional template matching. J. Magn. Reson. Imaging 2010, 31, 85–93. [Google Scholar] [CrossRef] [PubMed] [Green Version]
- Johnson, W.; Onuma, O.; Owolabi, M.; Sachdev, S. Stroke: A global response is needed. Bull. World Health Organ. 2016, 94, 634. [Google Scholar] [CrossRef]
- Salucci, M.; Gelmini, A.; Vrba, J.; Merunka, I.; Oliveri, G.; Rocca, P. Instantaneous brain stroke classification and localization from real scattering data. Microw. Opt. Tech. Lett. 2019, 61, 805–808. [Google Scholar] [CrossRef]
- Amarenco, P.; Bogousslavsky, J.; Caplan, L.R.; Donnan, G.A.; Hennerici, M.G. Classification of stroke subtypes. Cerebrovasc. Dis. 2009, 27, 493–501. [Google Scholar] [CrossRef]
- Zhang, S.; Xu, S.; Tan, L.; Wang, H.; Meng, J. Stroke lesion detection and analysis in MRI images based on deep learning. J. Healthc. Eng. 2021, 2021. [Google Scholar] [CrossRef]
- Krishnan, P.T.; Balasubramanian, P.; Krishnan, C. Segmentation of brain regions by integrating meta heuristic multilevel threshold with Markov random field. Curr. Med. Imaging 2016, 12, 4–12. [Google Scholar] [CrossRef]
- Maier, O.; Wilms, M.; von der Gablentz, J.; Krämer, U.; Handels, H. Ischemic stroke lesion segmentation in multi-spectral MR images with support vector machine classifiers. In Medical Imaging 2014: Computer-Aided Diagnosis; International Society for Optics and Photonics: Bellingham, WA, USA, 2014; Volume 9035, p. 903504. [Google Scholar]
- Maier, O.; Schröder, C.; Forkert, N.D.; Martinetz, T.; Handels, H. Classifiers for ischemic stroke lesion segmentation: A comparison study. PLoS ONE 2015, 10, e0145118. [Google Scholar] [CrossRef] [Green Version]
- Maier, O.; Wilms, M.; von der Gablentz, J.; Krämer, U.M.; Münte, T.F.; Handels, H. Extra tree forests for sub-acute ischemic stroke lesion segmentation in MR sequences. J. Neurosci. Meth. 2015, 240, 89–100. [Google Scholar] [CrossRef]
- Maier, O.; Menze, B.H.; von der Gablentz, J.; Häni, L.; Heinrich, M.P.; Liebrand, M.; Reyes, M. ISLES 2015-A public evaluation benchmark for ischemic stroke lesion segmentation from multispectral MRI. Med. Image Anal. 2017, 35, 250–269. [Google Scholar] [CrossRef] [PubMed] [Green Version]
- Subbanna, N.K.; Rajashekar, D.; Cheng, B.; Thomalla, G.; Fiehler, J.; Arbel, T.; Forkert, N.D. Stroke lesion segmentation in Flair MRI datasets using customized Markov random fields. Front. Neuroanat. 2019, 10, 541. [Google Scholar] [CrossRef] [Green Version]
- Zhang, L.; Song, R.; Wang, Y.; Zhu, C.; Liu, J.; Yang, J.; Liu, L. Ischemic stroke lesion segmentation using multi-plane information fusion. IEEE Access 2020, 8, 45715–45725. [Google Scholar] [CrossRef]
- Singh, S.P.; Wang, L.; Gupta, S.; Goli, H.; Padmanabhan, P.; Gulyás, B. 3D deep learning on medical images: A review. Sensors 2020, 20, 5097. [Google Scholar] [CrossRef] [PubMed]
- Rajinikanth, V.; Satapathy, S.C. Segmentation of ischemic stroke lesion in brain MRI based on social group optimization and Fuzzy-Tsallis entropy. Arab. J. Sci. Eng. 2018, 43, 4365–4378. [Google Scholar] [CrossRef]
- Lin, D.; Rajinikanth, V.; Lin, H. Hybrid image processing-based examination of 2D brain MRI slices to detect brain tumor/stroke section: A study. In Signal and Image Processing Techniques for the Development of Intelligent Healthcare Systems; Springer: Singapore, 2021; pp. 29–49. [Google Scholar]
- Hemanth, D.J.; Rajinikanth, V.; Rao, V.S.; Mishra, S.; Hannon, N.M.; Vijayarajan, R.; Arunmozhi, S. Image fusion practice to improve the ischemic-stroke-lesion detection for efficient clinical decision making. Evol. Intell. 2021, 14, 1089–1099. [Google Scholar] [CrossRef]
- Zhang, Y.; Liu, S.; Li, C.; Wang, J. Application of deep learning method on ischemic stroke lesion segmentation. J. Shanghai Jiaotong Univ. 2021. [Google Scholar] [CrossRef]
- Yushkevich, P.A.; Pashchinskiy, A.; Oguz, I.; Mohan, S.; Schmitt, J.E.; Stein, J.M.; Gerig, G. User-guided segmentation of multi-modality medical imaging datasets with ITK-SNAP. Neuroinformatics 2019, 17, 83–102. [Google Scholar] [CrossRef]
- Yushkevich, P.A.; Gerig, G. ITK-SNAP: An intractive medical image segmentation tool to meet the need for expert-guided segmentation of complex medical images. IEEE Pulse 2017, 8, 54–57. [Google Scholar] [CrossRef]
- Suh, S.; Park, Y.; Ko, K.; Yang, S.; Ahn, J.; Shin, J.K.; Kim, S. Weighted mask R-CNN for improving adjacent boundary segmentation. J. Sens. 2021, 2021. [Google Scholar] [CrossRef]
- Kendall, A.; Badrinarayanan, V.; Cipolla, R. Bayesian Segnet: Model uncertainty in deep convolutional encoder-decoder architectures for scene understanding. arXiv 2015, arXiv:1511.02680. [Google Scholar]
- Badrinarayanan, V.; Kendall, A.; Cipolla, R. Segnet: A deep convolutional encoder-decoder architecture for image segmentation. IEEE Trans. Pattern Anal. 2017, 39, 2481–2495. [Google Scholar] [CrossRef] [PubMed]
- Khagi, B.; Kwon, G.R. Pixel-label-based segmentation of cross-sectional brain MRI using simplified SegNet architecture-based CNN. J. Healthc. Eng. 2018, 2018, 3640705. [Google Scholar] [CrossRef] [PubMed] [Green Version]
- Ahuja, S.; Panigrahi, B.K.; Dey, N.; Rajinikanth, V.; Gandhi, T.K. Deep transfer learning-based automated detection of COVID-19 from lung CT scan slices. Appl. Intell. 2021, 51, 571–585. [Google Scholar] [CrossRef]
- Garg, M.; Dhiman, G. A novel content-based image retrieval approach for classification using GLCM features and texture fused LBP variants. Neural Comput. Appl. 2020, 33, 1311–1328. [Google Scholar] [CrossRef]
- Xing, Z.; Jia, H. An improved thermal exchange optimization based GLCM for multi-level image segmentation. Multimed. Tools Appl. 2020, 79, 12007–12040. [Google Scholar] [CrossRef]
- Lv, C.; Zhang, P.; Wu, D. Gear fault feature extraction based on fuzzy function and improved Hu invariant moments. IEEE Access 2020, 8, 47490–47499. [Google Scholar] [CrossRef]
- Gudigar, A.; Raghavendra, U.; Devasia, T.; Nayak, K.; Danish, S.M.; Kamath, G.; Acharya, U.R. Global weighted LBP based entropy features for the assessment of pulmonary hypertension. Pattern Recognit. Lett. 2019, 125, 35–41. [Google Scholar] [CrossRef]
- Dey, N.; Zhang, Y.D.; Rajinikanth, V.; Pugalenthi, R.; Raja, N.S.M. Customized VGG19 architecture for pneumonia detection in chest X-rays. Pattern Recognit. Lett. 2021, 143, 67–74. [Google Scholar] [CrossRef]
- Kassem, M.A.; Hosny, K.M.; Damaševičius, R.; Eltoukhy, M.M. Machine learning and deep learning methods for skin lesion classification and diagnosis: A systematic review. Diagnostics 2021, 11, 1390. [Google Scholar] [CrossRef] [PubMed]
- Priya, S.J.; Rani, A.J.; Subathra, M.S.P.; Mohammed, M.A.; Damaševičius, R.; Ubendran, N. local pattern transformation based feature extraction for recognition of Parkinson’s disease based on gait signals. Diagnostics 2021, 11, 1395. [Google Scholar] [CrossRef] [PubMed]
- Castillo, D.; Lakshminarayanan, V.; Rodríguez-Álvarez, M.J. MR images, brain lesions, and deep learning. Appl. Sci. 2021, 11, 1675. [Google Scholar] [CrossRef]
- Nazari-Farsani, S.; Nyman, M.; Karjalainen, T.; Bucci, M.; Isojärvi, J.; Nummenmaa, L. Automated segmentation of acute stroke lesions using a data-driven anomaly detection on diffusion weighted MRI. J. Neurosci. Methods 2020, 333, 108575. [Google Scholar] [CrossRef]
- Subudhi, A.; Dash, M.; Sabut, S. Automated segmentation and classification of brain stroke using expectation-maximization and random forest classifier. Biocybern. Biomed. Eng. 2020, 40, 277–289. [Google Scholar] [CrossRef]
- Qiu, W.; Kuang, H.; Teleg, E.; Ospel, J.M.; Sohn, S.I.; Almekhlafi, M.; Goyal, M.; Hill, M.D.; Demchuk, A.M.; Menon, B.K. Machine learning for detecting early infarction in acute stroke with non–contrast-enhanced CT. Radiology 2020, 294, 638–644. [Google Scholar] [CrossRef] [PubMed]
- Anbumozhi, S. Computer aided detection and diagnosis methodology for brain stroke using adaptive neuro fuzzy inference system classifier. Int. J. Imaging Syst. Technol. 2019, 30, 196–202. [Google Scholar] [CrossRef]
- Kumar, A.; Upadhyay, N.; Ghosal, P.; Chowdhury, T.; Das, D.; Mukherjee, A.; Nandi, D. CSNet: A new DeepNet framework for ischemic stroke lesion segmentation. Comput. Methods Programs Biomed. 2020, 193, 105524. [Google Scholar] [CrossRef] [PubMed]
- Melingi, S.; Vivekanand, V. A crossbred approach for effective brain stroke lesion segmentation. Int. J. Intell. Eng. Syst. 2018, 11, 286–295. [Google Scholar] [CrossRef]
Figure 1.
Proposed framework to segment and classify brain MRI slices.

Figure 2.
Methodology employed to extract 2D slice from 3D MRI.

Figure 3.
Sample brain MRI slices were considered for the investigation.

Figure 4.
Sample test images and linked ground truth: (a) Flair; (b) DW; (c) T1; (d) GTL; (e) GTH.

Figure 5.
Results attained using the encoder of VGG-SegNet: (a) outcome of various layers ofVGG-SegNet; (b) Flair; (c) DW; (d) T1.
Figure 5.
Results attained using the encoder of VGG-SegNet: (a) outcome of various layers ofVGG-SegNet; (b) Flair; (c) DW; (d) T1.


Figure 6.
Graphical representation of the average quality measure for sample image.

Figure 7.
LPB pattern of test image for W = 4: (a) Flair; (b) DW; (c) T1.

Figure 8.
Sample results obtained from various convolutional layers of VGG16: (a) test image; (b) 8 × 8 = 64; (c) 8 × 8 = 64; (d) 16 × 8 = 128; (e) 16 × 16 = 256; (f) 16 × 32 = 512.
Figure 8.
Sample results obtained from various convolutional layers of VGG16: (a) test image; (b) 8 × 8 = 64; (c) 8 × 8 = 64; (d) 16 × 8 = 128; (e) 16 × 16 = 256; (f) 16 × 32 = 512.


Figure 9.
Accuracy and loss function attained with VGG16.

Figure 10.
Confusion matrix obtained forVGG16 with Flair MRI.

Figure 11.
AUC attained forVGG16 with SoftMax for Flair MRI.

Figure 12.
Performance analysis for pretrained deep learning systems: (a) detection accuracy for various brain MRI modalities; (b) error value achieved for the considered MRI slices; (c) glyphplot for the overall performance evaluation.
Figure 12.
Performance analysis for pretrained deep learning systems: (a) detection accuracy for various brain MRI modalities; (b) error value achieved for the considered MRI slices; (c) glyphplot for the overall performance evaluation.


Figure 13.
Performance validation of the proposed VGG16 network with various classifiers: (a) detection accuracy attained for various brain MRI modalities; (b) overall performance of the implemented classifiers.
Figure 13.
Performance validation of the proposed VGG16 network with various classifiers: (a) detection accuracy attained for various brain MRI modalities; (b) overall performance of the implemented classifiers.

Figure 14.
Comparison of proposed technique with existing methods.


Table 1.
Quality measures computed by comparing RoI with GT.
| Modality | JI | DC | ACC | PRE | SEN | SPE | |
|---|---|---|---|---|---|---|---|
| GTL | Flair | 90.80 | 95.18 | 99.51 | 91.90 | 98.70 | 99.55 |
| GTH | 85.82 | 92.37 | 99.19 | 92.20 | 92.55 | 99.56 | |
| GTL | DW | 90.99 | 95.28 | 99.54 | 96.94 | 93.68 | 99.85 |
| GTH | 83.44 | 90.97 | 99.09 | 95.85 | 86.57 | 99.79 | |
| GTL | T1 | 89.95 | 94.71 | 99.49 | 96.71 | 92.79 | 99.84 |
| GTH | 84.50 | 91.60 | 99.16 | 96.88 | 86.87 | 99.84 | |
| Average | 87.58 | 93.35 | 99.33 | 95.08 | 91.86 | 99.74 | |
Table 2.
Initial validation results attained with the pretrained deep learning system.
| Network | Modality | TP | FN | TN | FP | ACC | PRE | SEN | SPE | F1S | NPV |
|---|---|---|---|---|---|---|---|---|---|---|---|
| AlexNet | Flair | 171 | 29 | 366 | 34 | 89.50 | 83.41 | 85.50 | 91.50 | 84.44 | 92.66 |
| DW | 175 | 25 | 364 | 36 | 89.83 | 82.94 | 87.50 | 91.00 | 85.16 | 93.57 | |
| T1 | 141 | 59 | 319 | 81 | 76.67 | 63.51 | 70.50 | 79.75 | 66.82 | 84.39 | |
| VGG16 | Flair | 162 | 38 | 380 | 20 | 90.33 | 89.01 | 81.00 | 95.00 | 84.82 | 90.91 |
| DW | 157 | 43 | 384 | 16 | 90.17 | 90.75 | 78.50 | 96.00 | 84.18 | 89.93 | |
| T1 | 157 | 43 | 324 | 76 | 80.17 | 67.38 | 78.50 | 81.00 | 72.52 | 88.28 | |
| VGG19 | Flair | 168 | 32 | 371 | 29 | 89.83 | 85.28 | 84.00 | 92.75 | 84.63 | 92.06 |
| DW | 173 | 27 | 359 | 41 | 88.67 | 80.84 | 86.50 | 89.75 | 83.57 | 93.00 | |
| T1 | 138 | 62 | 332 | 68 | 78.33 | 66.99 | 69.00 | 83.00 | 67.98 | 84.26 | |
| ResNet18 | Flair | 169 | 31 | 372 | 28 | 90.17 | 85.79 | 84.50 | 93.00 | 85.14 | 92.31 |
| DW | 157 | 43 | 375 | 25 | 88.67 | 86.26 | 78.50 | 93.75 | 82.20 | 89.71 | |
| T1 | 132 | 68 | 346 | 54 | 79.67 | 70.97 | 66.00 | 86.50 | 68.39 | 83.57 | |
| ResNet50 | Flair | 168 | 32 | 359 | 41 | 87.83 | 80.38 | 84.00 | 89.75 | 82.15 | 91.82 |
| DW | 163 | 37 | 368 | 32 | 88.50 | 83.59 | 81.50 | 92.00 | 82.53 | 90.86 | |
| T1 | 155 | 45 | 324 | 76 | 79.83 | 67.10 | 77.50 | 81.00 | 71.93 | 87.80 |
Table 3.
Performance assessment of the proposed VGG16 with various classifiers.
| Classifier | Modality | TP | FN | TN | FP | ACC | PRE | SEN | SPE | F1S | NPV |
|---|---|---|---|---|---|---|---|---|---|---|---|
| DT | Flair | 182 | 18 | 377 | 23 | 93.17 | 88.78 | 91.00 | 94.25 | 89.88 | 95.44 |
| DW | 188 | 12 | 373 | 27 | 93.50 | 87.44 | 94.00 | 93.25 | 90.60 | 96.88 | |
| T1 | 164 | 36 | 347 | 53 | 85.17 | 75.58 | 82.00 | 86.75 | 78.66 | 90.60 | |
| KNN | Flair | 189 | 11 | 387 | 13 | 96.00 | 93.56 | 94.50 | 96.75 | 94.03 | 97.24 |
| DW | 194 | 6 | 389 | 11 | 97.17 | 94.63 | 97.00 | 97.25 | 95.80 | 98.48 | |
| T1 | 157 | 43 | 361 | 39 | 86.33 | 80.10 | 78.50 | 90.25 | 79.29 | 89.36 | |
| RF | Flair | 189 | 11 | 366 | 34 | 92.50 | 84.75 | 94.50 | 91.50 | 89.36 | 97.08 |
| DW | 186 | 14 | 368 | 32 | 92.33 | 85.32 | 93.00 | 92.00 | 88.99 | 96.34 | |
| T1 | 158 | 42 | 356 | 44 | 85.67 | 78.22 | 79.00 | 89.00 | 78.61 | 89.45 | |
| SVM-L | Flair | 192 | 8 | 371 | 29 | 93.83 | 86.88 | 96.00 | 92.75 | 91.21 | 97.89 |
| DW | 181 | 19 | 388 | 12 | 94.83 | 93.78 | 90.50 | 97.00 | 92.11 | 95.33 | |
| T1 | 143 | 57 | 374 | 26 | 86.17 | 84.61 | 71.50 | 93.50 | 77.51 | 86.77 | |
| SVM-RBF | Flair | 184 | 16 | 390 | 10 | 95.67 | 94.84 | 92.00 | 97.50 | 93.40 | 96.06 |
| DW | 186 | 14 | 391 | 9 | 96.17 | 95.38 | 93.00 | 97.75 | 94.18 | 96.54 | |
| T1 | 162 | 38 | 355 | 45 | 86.17 | 78.26 | 81.00 | 88.75 | 79.61 | 90.33 |
Table 4.
Classification results of VGG16 with concatenated features.
| Classifier | Modality | TP | FN | TN | FP | ACC | PRE | SEN | SPE | F1S | NPV |
|---|---|---|---|---|---|---|---|---|---|---|---|
| DT | Flair | 185 | 15 | 381 | 19 | 94.33 | 90.69 | 92.50 | 95.25 | 91.58 | 96.21 |
| DW | 193 | 7 | 377 | 23 | 95.00 | 89.35 | 96.50 | 94.25 | 92.79 | 98.18 | |
| T1 | 169 | 31 | 351 | 49 | 86.67 | 77.52 | 84.50 | 87.75 | 80.86 | 91.88 | |
| KNN | Flair | 191 | 9 | 389 | 11 | 96.67 | 94.55 | 95.50 | 97.25 | 95.02 | 97.74 |
| DW | 192 | 8 | 384 | 16 | 96.00 | 92.31 | 96.00 | 96.00 | 94.12 | 97.96 | |
| T1 | 164 | 36 | 370 | 30 | 89.00 | 84.54 | 82.00 | 92.50 | 83.25 | 91.13 | |
| RF | Flair | 190 | 10 | 368 | 32 | 93.00 | 85.59 | 95.00 | 92.00 | 90.05 | 97.35 |
| DW | 188 | 12 | 371 | 29 | 93.17 | 86.64 | 94.00 | 92.75 | 90.17 | 96.87 | |
| T1 | 167 | 33 | 366 | 34 | 88.83 | 83.08 | 83.50 | 91.50 | 83.29 | 91.73 | |
| SVM-L | Flair | 193 | 7 | 374 | 26 | 94.50 | 88.13 | 96.50 | 93.50 | 92.12 | 98.16 |
| DW | 183 | 17 | 390 | 10 | 95.50 | 94.82 | 91.50 | 97.50 | 93.13 | 95.82 | |
| T1 | 155 | 45 | 384 | 16 | 89.83 | 90.64 | 77.50 | 96.00 | 83.56 | 89.51 | |
| SVM-RBF | Flair | 196 | 4 | 393 | 7 | 98.17 | 96.55 | 98.00 | 96.55 | 97.27 | 98.99 |
| DW | 191 | 9 | 391 | 9 | 97.00 | 95.50 | 95.50 | 97.75 | 95.50 | 97.75 | |
| T1 | 181 | 19 | 363 | 37 | 90.67 | 83.03 | 90.50 | 90.75 | 86.60 | 95.03 |
Publisher’s Note: MDPI stays neutral with regard to jurisdictional claims in published maps and institutional affiliations. |
© 2021 by the authors. Licensee MDPI, Basel, Switzerland. This article is an open access article distributed under the terms and conditions of the Creative Commons Attribution (CC BY) license (https://creativecommons.org/licenses/by/4.0/).
Share and Cite
MDPI and ACS Style
Rajinikanth, V.; Aslam, S.M.; Kadry, S. Deep Learning Framework to Detect Ischemic Stroke Lesion in Brain MRI Slices of Flair/DW/T1 Modalities. Symmetry 2021, 13, 2080. https://doi.org/10.3390/sym13112080
AMA Style
Rajinikanth V, Aslam SM, Kadry S. Deep Learning Framework to Detect Ischemic Stroke Lesion in Brain MRI Slices of Flair/DW/T1 Modalities. Symmetry. 2021; 13(11):2080. https://doi.org/10.3390/sym13112080
Chicago/Turabian StyleRajinikanth, Venkatesan, Shabnam Mohamed Aslam, and Seifedine Kadry. 2021. "Deep Learning Framework to Detect Ischemic Stroke Lesion in Brain MRI Slices of Flair/DW/T1 Modalities" Symmetry 13, no. 11: 2080. https://doi.org/10.3390/sym13112080
Note that from the first issue of 2016, this journal uses article numbers instead of page numbers. See further details here.