Linear and Non-Linear Middle Infrared Spectra of Penicillin G in the CO Stretching Mode Region
by
 , , , and
Elena Ragnoni
1,* ,
,
Sara Catalini
1,
Maurizio Becucci
1,2,
Andrea Lapini
1,3 and
Paolo Foggi
1,3,4 1
LENS, European Laboratory for Non-Linear Spectroscopy, via N. Carrara 1, 50019 Sesto Fiorentino, Italy
2
Department of Chemistry “U. Schiff ”, University of Florence, via della Lastruccia 13, 50019 Sesto Fiorentino, Italy
3
INRIM (Istituto Nazionale di Scienza Metrologica), Strada delle Cacce 91, 10135 Torino, Italy
4
Department of Chemistry, Biology and Biotechnology, University of Perugia, via Elce di Sotto 8, 06100 Perugia, Italy
*
Author to whom correspondence should be addressed.
Symmetry 2021, 13(1), 106; https://doi.org/10.3390/sym13010106
Submission received: 11 December 2020
/
Revised: 4 January 2021
/
Accepted: 5 January 2021
/
Published: 8 January 2021
(This article belongs to the Special Issue Symmetry and Molecular Spectroscopy)
Abstract
:In this work we report the linear and non-linear IR spectral response characterization of the CO bonds of G sodium salt in and in solutions. In order to better characterize the spectral IR features in the CO stretching region, broadband middle infrared pump-probe spectra are recorded. The role of hydrogen bonds in determining the inhomogeneous broadening and in tuning anharmonicity of the different types of oscillators is exploited. Narrow band pump experiments, at the three central frequencies of , amide and carboxylate CO stretching modes, identify the couplings between the different types of CO oscillators opening the possibility to gather structural dynamic information. Our results show that the strongest coupling is between the and the carboxylate CO vibrational modes.
1. Introduction
Infrared spectroscopy and its evolution based on non-linear laser techniques achieved with ultrashort middle infrared (MIR) pulses are successfully used for the detection and the characterization of molecular systems with various degrees of complexity. Nonetheless their potential in routine analytical diagnosis is not yet well established and this is especially true for the non-linear techniques [1,2]. The effort to disentangle specific structural information from complex spectra of complex molecular systems is still a challenge [3]. Many studies are presently reported on short medium and even large molecular systems [3,4]. The aim is to disentangle homogeneous pieces of information out of broad inhomogeneous signals. Inhomogeneity of the solvent cage and distribution of conformations make hard the task in the linear spectra.
In systems, the ring limits internal rotations; therefore, molecules like G containing different groups of carbonyl moieties are a good benchmark to test the potentiality of linear and non-linear MIR techniques. In the last decades non-linear infrared spectroscopy like bidimensional infrared (2DIR) spectroscopy [5,6] has been largely exploited in the structural dynamic characterization of several molecular systems of increasing complexity. Particular attention has been devoted to the study of peptides [7,8,9,10,11,12] thanks to the large sensitivity of the CO stretching mode around 6 m wavelength. The high localization of this mode makes it a good probe for molecular conformation analysis. However, the number and types of CO oscillators, the shape and the position of the related transitions are really dependent on the size of the molecule, on the structures assumed in solution and on specific interactions with the surroundings. In order to get unambiguous information from spectra, the choice of the investigated molecular system is crucial. On molecules with medium/large size such as oligopeptides self-organization makes the systems more uniformly structured and it is easier to find spectroscopic studies [6,9,13,14,15,16,17]. However the large number of amino acids make necessary some isotopical substitution: the investigation becomes quite difficult and expensive. On the opposite, in di- and tri-peptides different CO oscillators are easily distinguishable by isotope labelling with or , but the recorded signals are averaged on several conformations of the molecules in solution [12]. More straightforward is the data interpretation of bigger oligopeptides organized in secondary structures. In and amide units are repeated in space with almost the same orientation, resulting in restrict possible values for dihedral angles between amides [18,19]. In , thanks to the constraint imposed by the ring, the distribution of conformations at equilibrium is limited, reducing the inhomogeneity of the sample and allowing a more straightforward assignment of the spectral features. It is worth noticing that the study of these systems might help in the assignment of transitions and in the analysis of couplings among amides CO in larger proteins, where and turn sequences are usually characterized by the presence of a ring such that of prolines. 2DIR experiments on amino acid sequences containing proline have already been performed [20] but more insights may be provided by similar systems. This work represents an original study on a system by means of linear and ultrafast non-linear MIR technique.
2. Experimental Section
2.1. Materials
G sodium salt, 99% purity, is purchased from Sigma Aldrich, as well as deuterated solvents, and used without further purification. All solutions are prepared at M concentration, at neutral , in and . Since of G is found to be [21], at neutral the carboxylic group is present in its anionic form. Vials of of 1 mL are used anytime at once in order to avoid proton exchange with air humidity. The samples for linear and non-linear experiments are prepared by squeezing a small amount of solution (∼40 L) between 2 mm thick windows separated by a 50 m teflon spacer. The average absorbance at the peak is . All experiments are run at laboratory temperature (22 C).
2.2. Instrumental Setup
Stationary IR spectra are recorded on the same sample cell in a Bruker Alpha FT-IR spectrometer, with a resolution of 2 cm. Pump-probe experiments are conducted on an home-built setup based on the ultra-short emission of a amplified Ti:Sapphire laser system (Coherent Legend), described in details elsewhere [6,9,12,22,23,24]. Briefly, the laser output has pulse duration of ∼40 fs, centred at 800 nm, with repetition rate of 1 KHz and average power around 3 W. Part of the output power, about 700 mW, is split half toward a commercial optical parametric generator (Light Conversion TOPAS) to generate the MIR pump, half toward an home-made OPA in order to create the probe/reference beams. In the present experiment pump and probe/reference beams cover the same frequency range with a bandwidth of ∼200 cm. However, the system allows us to perform experiments opening the investigation to larger frequency intervals, covering the MIR region from μm to μm. Broadband experiments are performed with spectrally broad pump and probe pulses. A total energy (pump + probe) of μJ/pulse impinges on the sample. 2DIR spectra have been acquired in the frequency-domain, following the dynamic hole-burning experimental scheme [5]. In this approach the pump been is narrowed down to ∼15 cm thanks to a Fabry-Pérot filter. Fine piezoelectric adjustments of the distance between the mirrors of the Fabry-Pérot allow us to tune the pump central frequency within the proper spectral interval. Probe and reference are vertically displaced and focused, along with the pump, on the sample by a off-axis parabolic mirror (beam waist of pump and probe are ∼150 μm and ∼100 μm respectively). The probe and reference beams are then dispersed in a flat field spectrometer (TRIAX 180, Edison, NJ, USA) and detected by a double 32 element MCT array detector (InfraRed Associates Inc., Stuart, FL, USA). Transient absorption spectra, in both broad-pump and narrow-pump excitation, are recorded at increasing delay times between pump and probe using a motorized translation stage, while for each delay time transient spectra are acquired with the relative polarization between pump and probe in parallel and perpendicular configuration. Elements of the MCT array are mm wide and separated by an inactive area of mm. With a 100 grooves/mm grating each element collects a spectrum of ∼6 cm and the separation corresponds to ∼1 cm. Therefore, the limiting resolution factor is given by the dimensions of the array elements. However, in the present case, bands are at least three times larger than the resolution limit. In other cases, when the infrared bands are narrower [11], a narrower spectral range is achieved by utilising a more dispersive grating.
2.3. Signal Acquisition, Data Treatment and Calculations
Linear IR spectra where analysed with standard fitting procedures and programs (OPUS Bruker). Non linear spectra data where acquired and analysed by a home made acquisition program. As to this data handling part it is necessary to give a short description of pump/probe experiments. Pump intensity is constantly monitored to record its fluctuations (normally below 0.05%). If during the acquisition process fluctuations overpass that threshold, signals can either be renormalized or discarded. Transient signals are obtained as the ratio between the intensity of the probe with the pump on and off, both renormalized by reference signal. In this way significant variations of the optical density (OD) measured on the probe can reach easily values of the order of . Transient signal are constituted by positive and negative parts: the formers are due to excited state absorption ( transitions), the latters are due to ground state bleaching and stimulated emission (). Band shape analysis derived by linear spectra is utilized to fit the non-linear data. In addition by recording intensity of the transient features as a function of the delay between pump and probe it is possible to measure the dynamics of the CO vibrations. Signal decay plots are reported by measuring pump/probe in both parallel (‖) and perpendicular (⊥) relative polarizations. Vibrational relaxation is obtained by the following formula:
where the subscript MAS indicates the Magic Angle Signal, i.e., the signal free from any orientational dynamics, whatever the cause.
Ab-initio calculations are performed with the Gaussian03-C01 program-package at the DFT B3LYP /6-311 ++ G (d, p) level of theory. The effects of the solvent ( and ) are taken into account using the polarizable continuum model (PCM) implemented in Gaussian03. [25] Once the vibrational frequencies have been calculated, the IR spectra are reconstructed imposing a Lorentzian line-shape for each transition with area proportional to the calculated intensity.
3. Results and Discussion
3.1. FT-IR Spectra
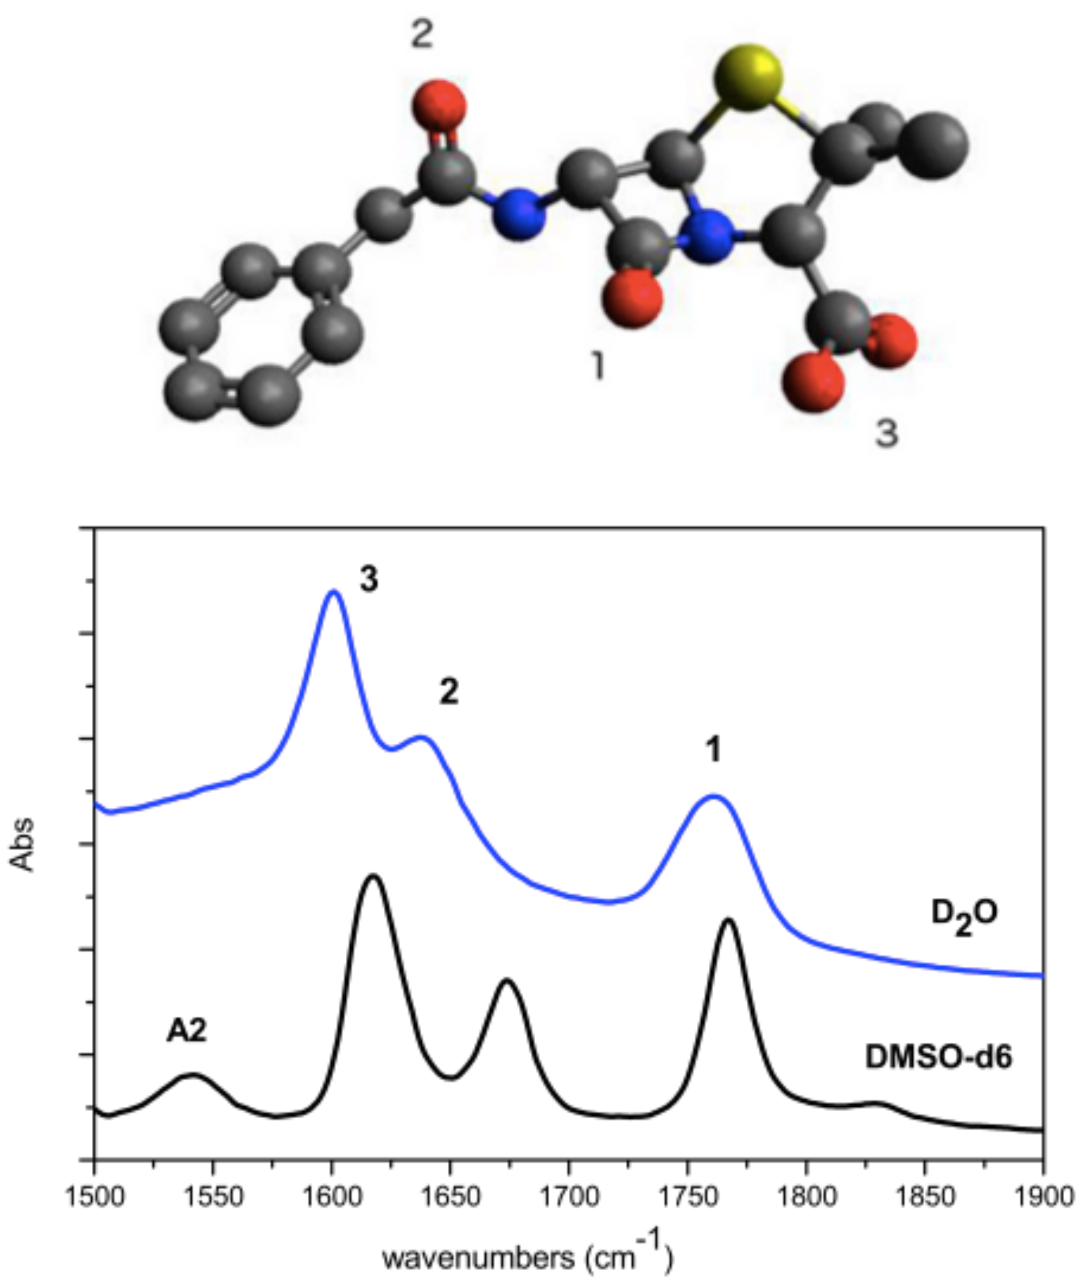
In Figure 1 the experimental FTIR spectra of Penicillin G in and are reported. The scheme of the molecular structure is also given with numbering of the CO bonds. Spectra are characterized by the presence of three intense bands. Additionally a fourth weaker band below 1550 cm is observed in . Upon deuteration of the N-H bond occurring in the coupling between CN stretching and CND bending is lost: the amide II (A2) band around 1500 cm downshifts.
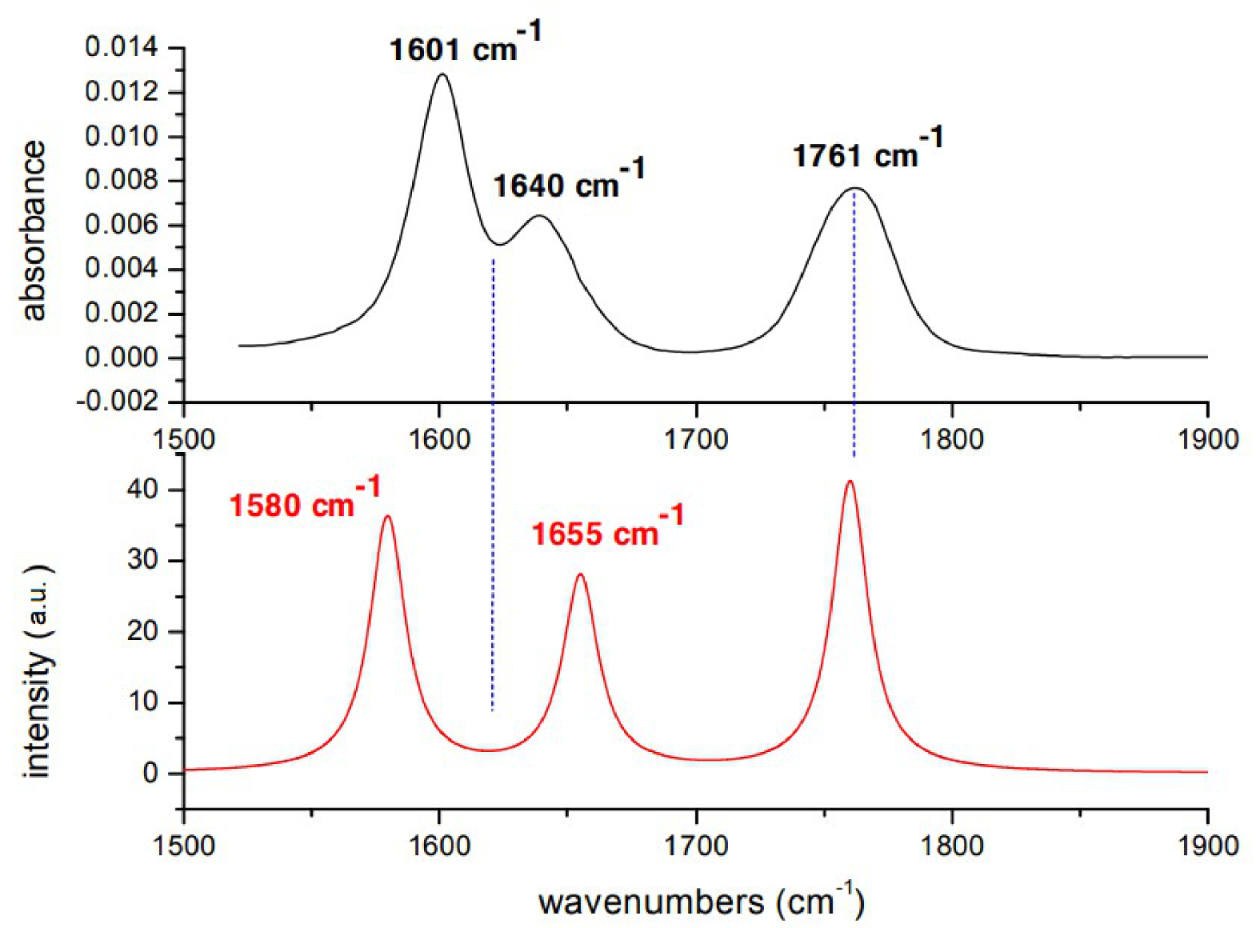
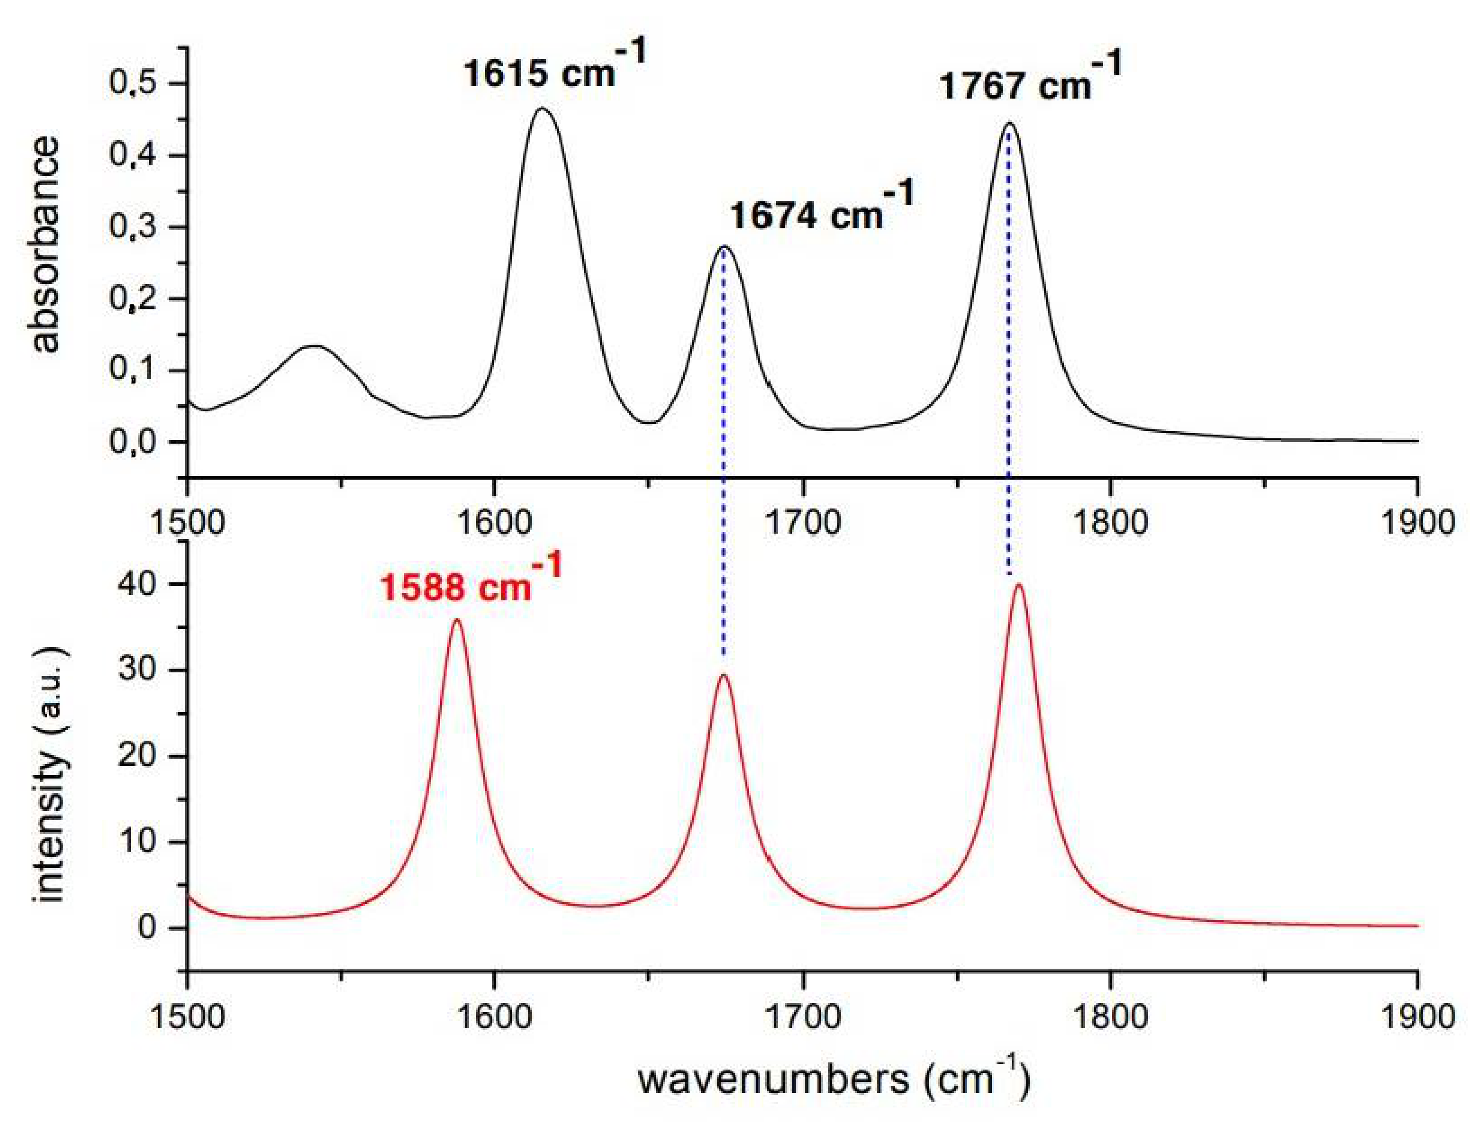
Assignment of Penicillin IR bands is obtained by comparing the experimental FTIR spectrum with previous spectra [26] and with the spectrum obtained from ab-initio calculations. The comparisons between experimental and calculated spectra in and are reported, respectively in Figure 2 and Figure 3. Calculated frequencies are corrected by a factor 0.98 providing the exact matching between the experimental and calculated value of vibrational mode. Experimental and calculated frequencies are reported in Table 1.
We observe that bands are narrower and more symmetric in in comparison to those observed in . In this latter case H-bonding (D-bonding) produces inhomogeneous broadening due to different distributions of molecules around the oxygen atoms. The downshift effect of Amide I and carboxylate moiety in is much larger than that of CO as a consequence of the differences in hydration of the carbonyl groups. The low frequency parts of the three bands are ascribed to multiple hydrogen bond while the high frequency part is due to molecules which are only bonded to one molecule.
Concerning the spectra, the band experimentally observed at 1761 cm is associated with the stretching of the CO bond of the : it is the most localized mode, due to the constraint given by the ring, and therefore the highest in energy. The peaks at 1640 and 1601 cm are associated with Amide I and asymmetric stretching of the carboxylate, respectively. Calculations provide the following results:1655 and 1680 cm associated with Amide I and asymmetric stretching of the carboxylate, respectively. Calculations for DMSO spectra are in better agreement with the experiment. The band at 1767 cm is associated with the stretching of the CO bond of the , while that at 1674 cm to Amide I mode and at 1588 cm the asymmetric stretching of the group. It is worth to mention that DFT calculation takes into account only the electrostatic interactions between solute and solvent and not the hydrogen bonds that each carbonyl forms with one or two molecules of water. Furthermore, even the electrostatic contribution is underestimated since the cavity in which the solute is housed is very large in order to have good convergence margins in geometry optimization. The frequencies of the normal modes are calculated in harmonic approximation and do not take into account the intramolecular couplings. However, given the approximation of the computational method, the agreement between experimental and calculated IR spectra is very good.
3.2. Broadband Pump/Probe Experiments
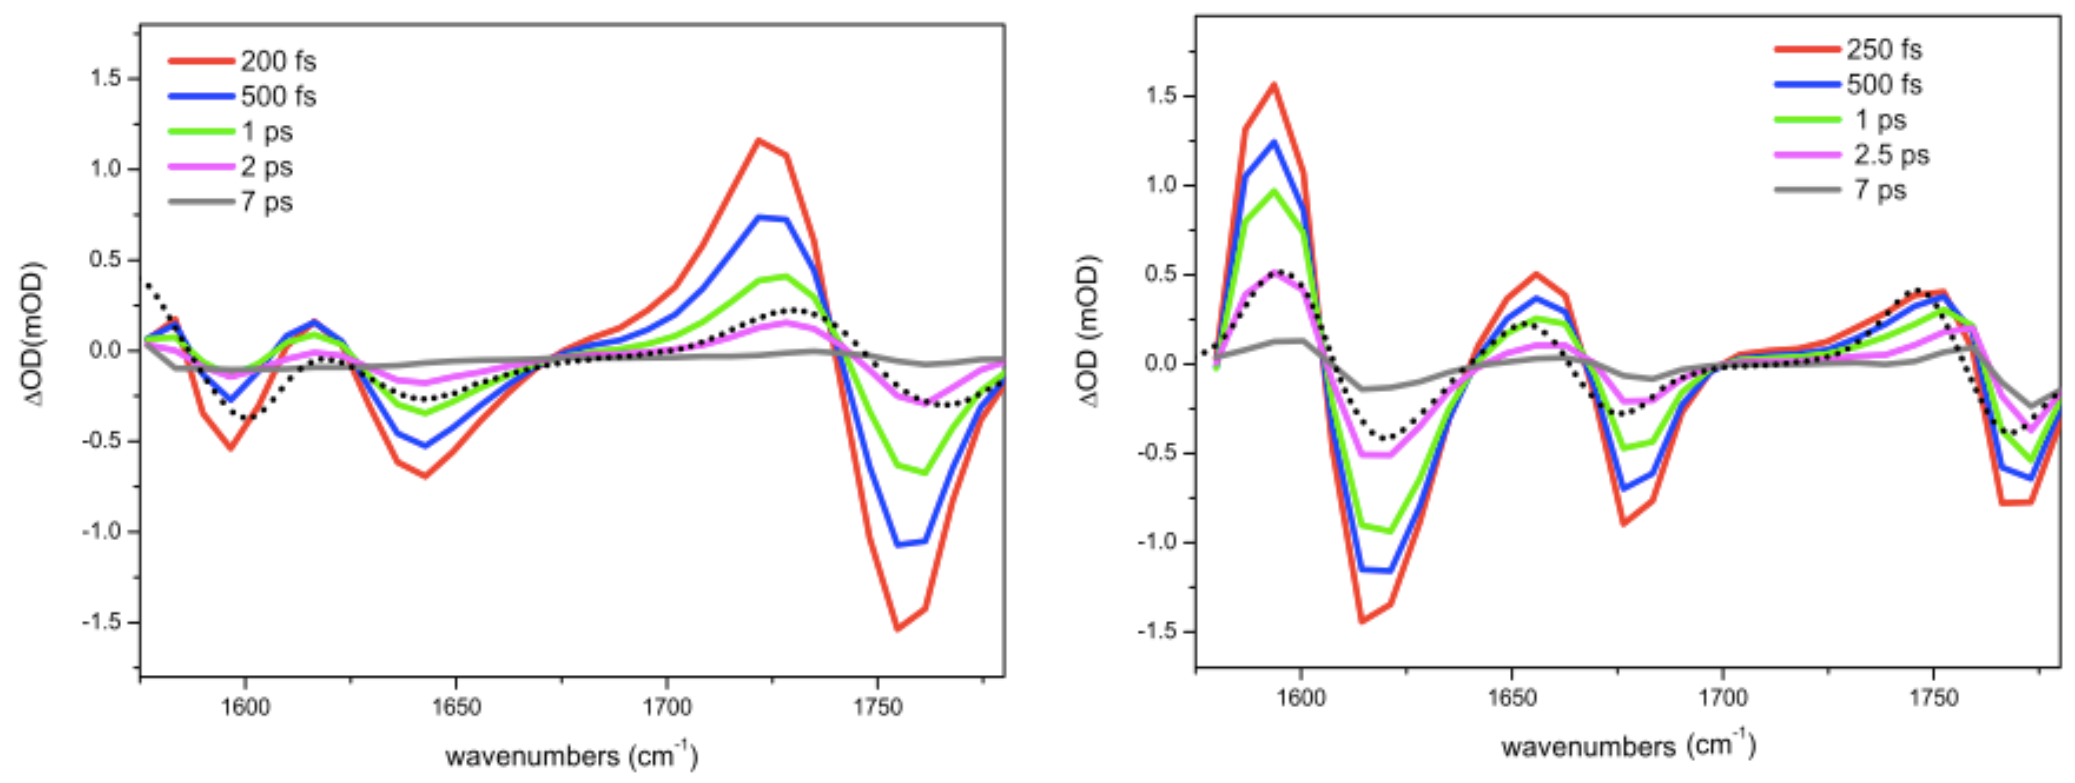
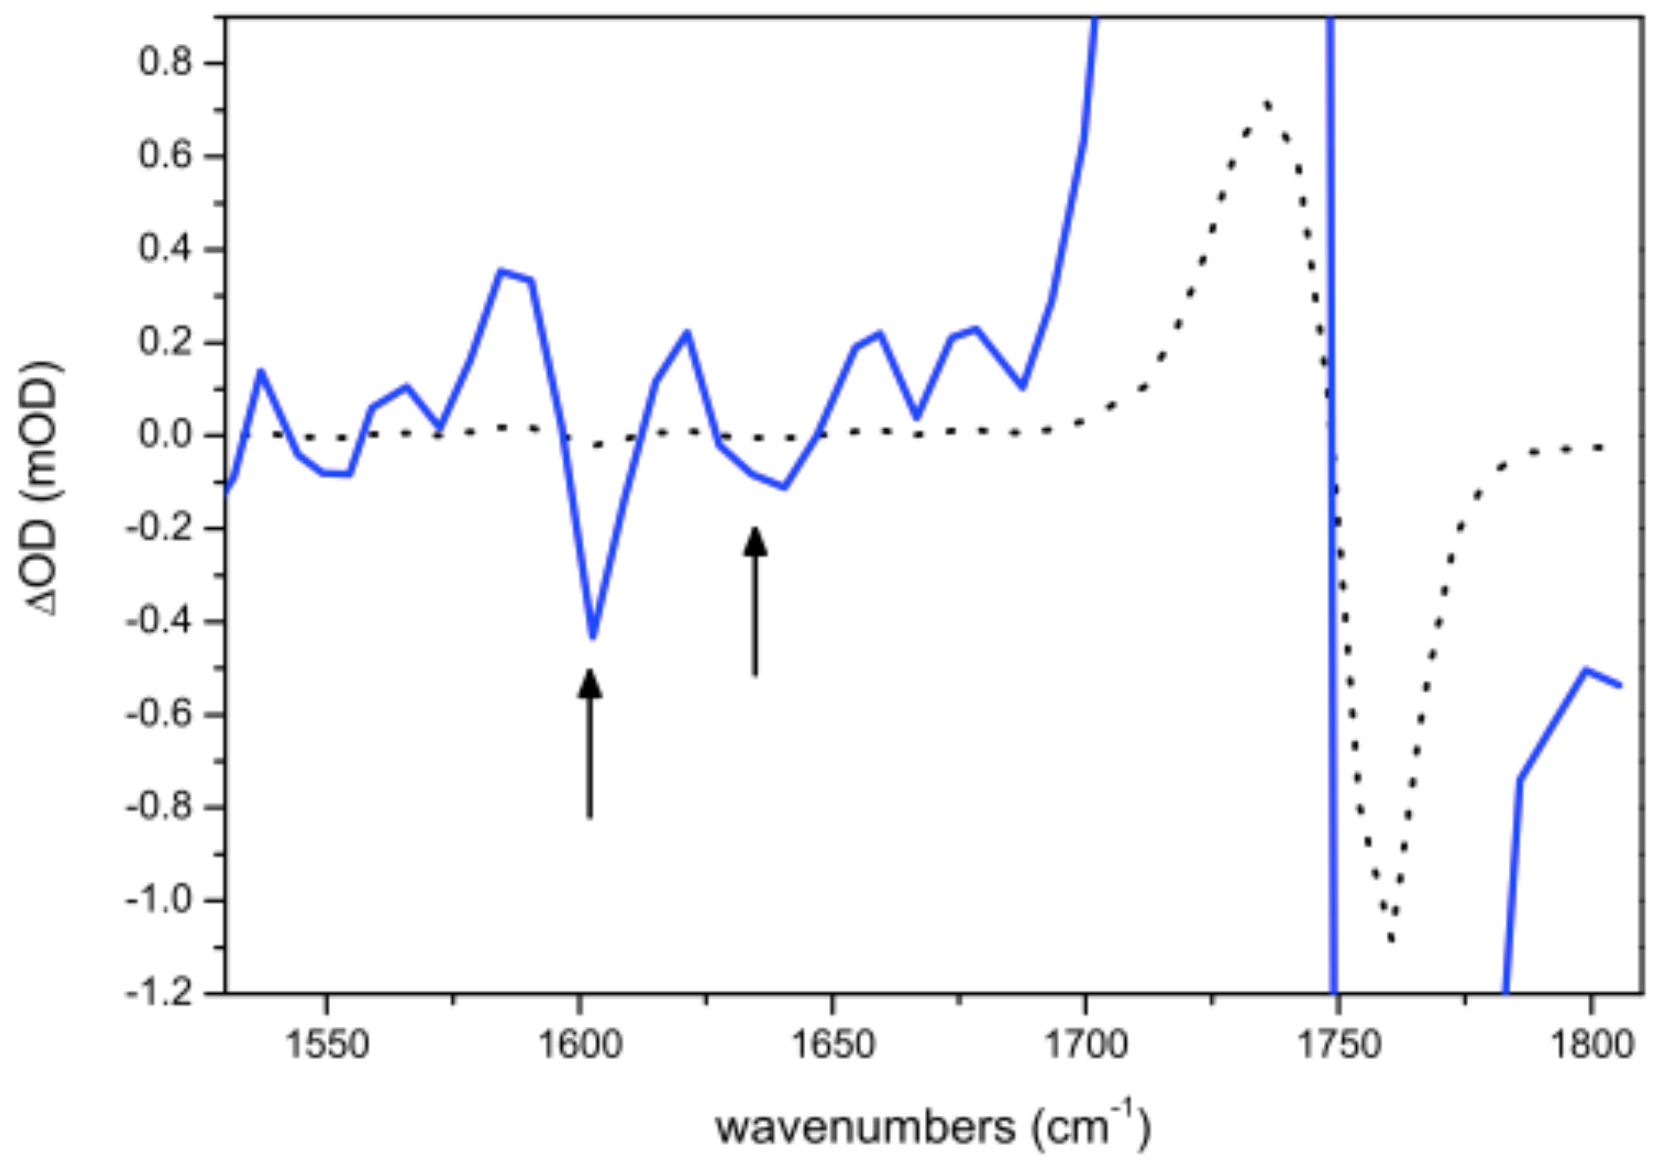
The linear data requires a clear and adequate view on the nature of the vibrational states under study: degree of delocalization of the excitation, orientation of the transition dipole moments, anharmonicity. In this respect, non-linear MIR spectroscopy represents a powerful tool for probing such properties. On one hand, it allows us to disentangle the homogeneous and inhomogeneous contributions to the band profile; on the other hand, it provides the femtosecond time resolution to access the dynamical properties of the system [5,6]. In Figure 4 the transient broad-pump/broad-probe spectra are reported. The central FTIR frequency of each transition corresponds to the absorption and should correspond to the minima central frequencies in the transient spectra. However the presence of the excited state absorption bands, shifted by anharmonicity to lower frequency values, move to higher values the minima central position in respect of that of the FTIR bands. Therefore it is important to use linear spectral data to fit non-liner spectra. The distance between the maximum and the minimum of each spectral feature can be roughly taken as an estimate of the vibration anharmonicity . The correct value is obtained starting from linear spectra: the minimum of the negative peak is derived from the linear spectra, while the maximum of positive peak is calculated as a fitting parameter. By comparing linear and transient spectra differences in relative intensities between the three CO modes are observed. These effects are easily explained as due to two factors: anharmonicity and inhomogeneous broadening acting differently on the three modes and being also different in the two solvents. A general observation is that lesser the anharmonicity bigger the compensation effect between the positive and negative signal which reduces the intensity of both the positive and negative features. However, also inhomogeneous broadening produces a similar effect. In fact broader is the line width, in comparison to anharmonicity, larger is the compensating effect between the negative and the positive bands. From this qualitative considerations it is possible to conclude that the vibrational mode involving the CO is less anharmonic than the other two vibrational modes and its anharmonicity increases from to solution. Anharmonicity is always larger in than in . This effect has been observed in other systems and ascribed to hydrogen bond [9,27,28]. The fitting of the broadband spectrum in (Figure 4 on the left) of the and of the Amide I provide an anharmonicity of 27 cm. In the has an anharmonicity of 14 cm, while the amide I and the carboxylate around 20 cm.
3.3. Vibrational Relaxation
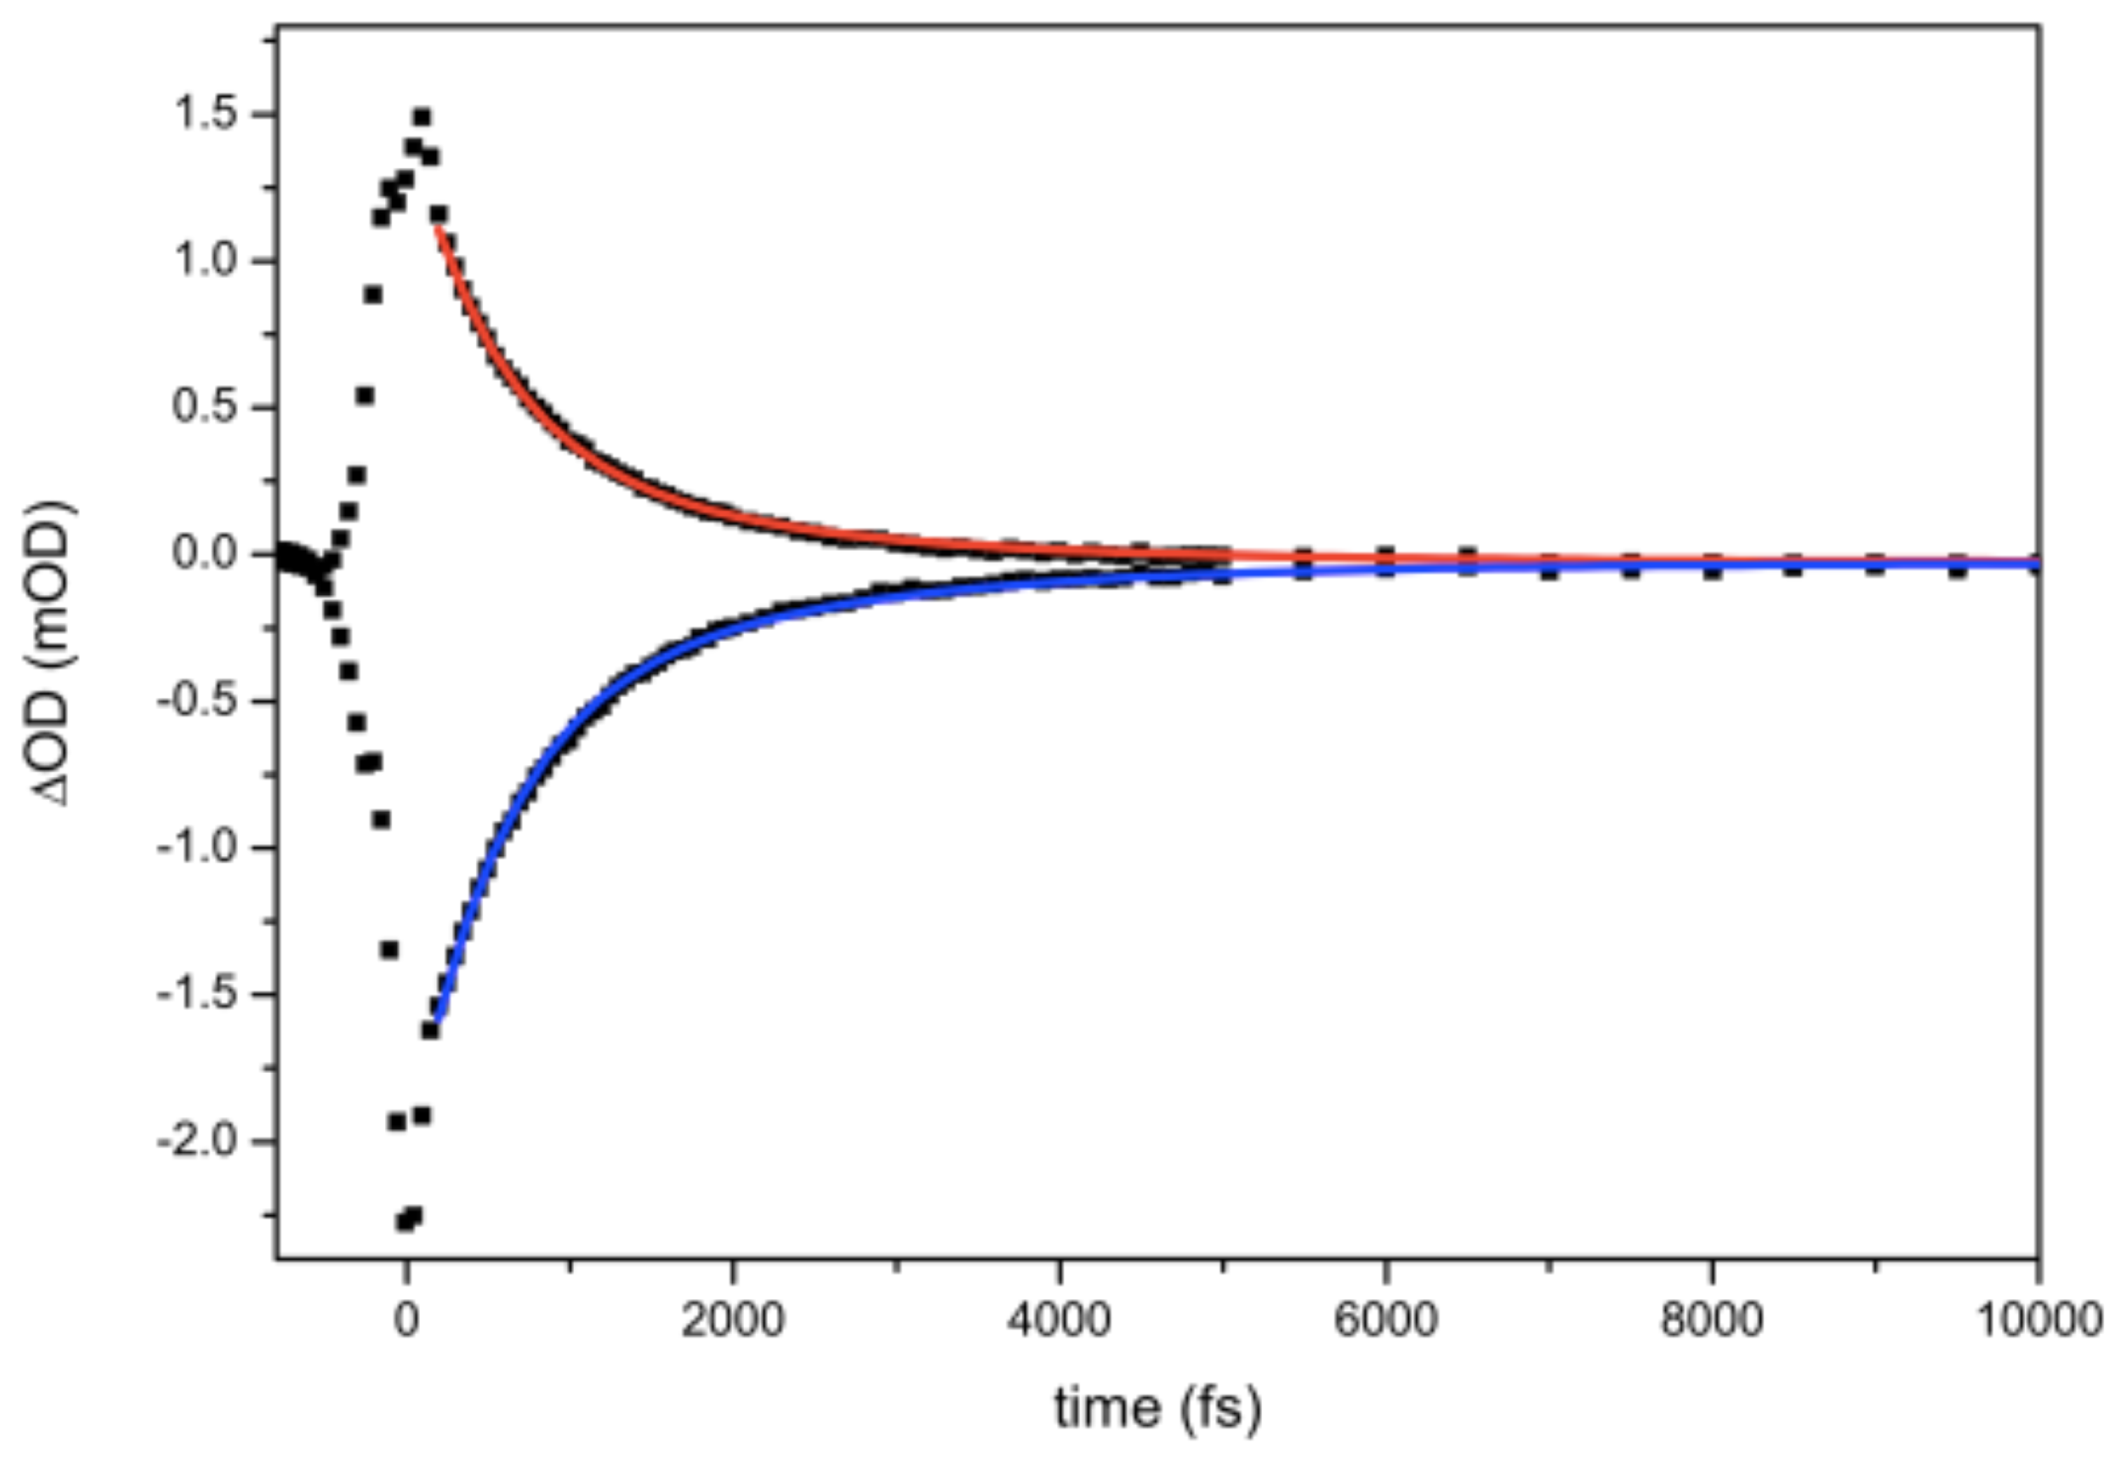
Broad-pump broad-probe spectra are recorded up to 10 ps in parallel and perpendicular polarization. The signal at the magic angle, calculated following Equation (1), gives access to the vibrational lifetime: the excited state absorption (ESA) decay time and the ground state recovery (GSR) (from the bleaching/stimulated emission signals) time constants. In only CO kinetics are reported (Figure 5). The Amide I and the carboxylate CO are largely overlapped among them and superimposed to a weaker signal around 1600 cm, which make unfeasible the estimation of the lifetime due to a strong thermal signal.
Both the ESA and the GSR decay signals of the fits are bi-exponential. It is difficult to provide a physical meaning to the bi-exponential nature of the decay. We observe that on the FTIR spectrum the band shape is Gaussian with a bandwidth of 37 cm (FWHM) resulting from a inhomogeneous broadening mechanism corresponding to a distribution of central frequencies originating from the inhomogeneity of the surroundings.
The bi-exponential decay can be taken as the simplest curve fitting of a more complex decay due to a large distribution of CO families. Similar time constant values for ESA and GSR lifetimes are obtained (see Table 2) and are the marker that vibrational relaxation processes due to other intermediate states are too fast or ineffective in . A much proper way to extract a meaningful value of the time constant is to report its average, calculated as:
where and are the relative weights of the two exponentials. The averaged lifetime of the signal in water is 0.9 ± 0.1 ps (see Table 2). This is a typical value of CO lifetimes in water [12,14,15,16,17,18] and must ascribed to the fast modulation of hydrogen bond formation and break, allowing a fast efficient relaxation pathway.
In all CO resonances are well separated in frequency and their linewidth is narrower, so that it is possible to extract vibrational lifetime for each transition at magic angle. As in water, a bi-exponential function has been utilized to fit data (see Table 2). DMSO is more than twice viscous than water at room temperature: slower dynamics than in water are expected. This means that modulation of solvent cage is slower. An averaged vibrational lifetime of 1.5 ps for all three bands is obtained. The slow and the fast component have the same weight, as shown by the pre-exponential factors. All dynamics present a contribution at long time scales, evaluated to be around the 5% of the intensity of the signal. In the fitting process the values before 200 fs are not considered because affected by cross-phase modulation [29]. An averaged vibrational lifetime of 1.5 ps for all three bands is calculated. The slow-down of ground state recovery (GSR) could be ascribed to the presence of and intermediate state between the vibrational excited and the ground state.
3.4. Evaluation of the Coupling Constants
CO oscillators have almost the same vibrational frequency within ±6%. Therefore it must be expected that these oscillators are coupled. The amount of coupling is modulated by the distance and the relative orientation according to the transition dipole coupling (TDC) model [5]. In narrow pump/broad probe spectra it is possible to evaluate the coupling constant by measuring the relative intensity of the peaks appearing in the non-linear spectra when only one of the oscillators is excited. If a coupling occurs an excitation transfer takes place and a signal appears at the proper frequency (cross peak). All coupling constants are evaluated with parallel polarization and at 200 fs pump-probe delay time. It must be stressed that pump pulses are narrow (15 cm) and this correspond to a pulse duration of almost 1 ps. In order to analyse the data, the coupled anharmonic normal mode picture [5,7] is applied. Briefly, in this model modes are highly localized and weak coupling constants are expected around 10–20 cm. The localization limit is respected when the frequency separation between IR modes named and is higher than their coupling constant and than their diagonal anharmonicity and . These latter values are extracted from the spectra of Figure 6 and Figure 7. Equation (3) connects the off-diagonal anharmonicity to the intensities of the two diagonal peaks and of the off diagonal one.
is the bandwidth of the probed transition [7].
can be derived by Equation (4). The intrinsic anharmonicity of the coupled states is taken as the average value of the two modes anharmonicity:
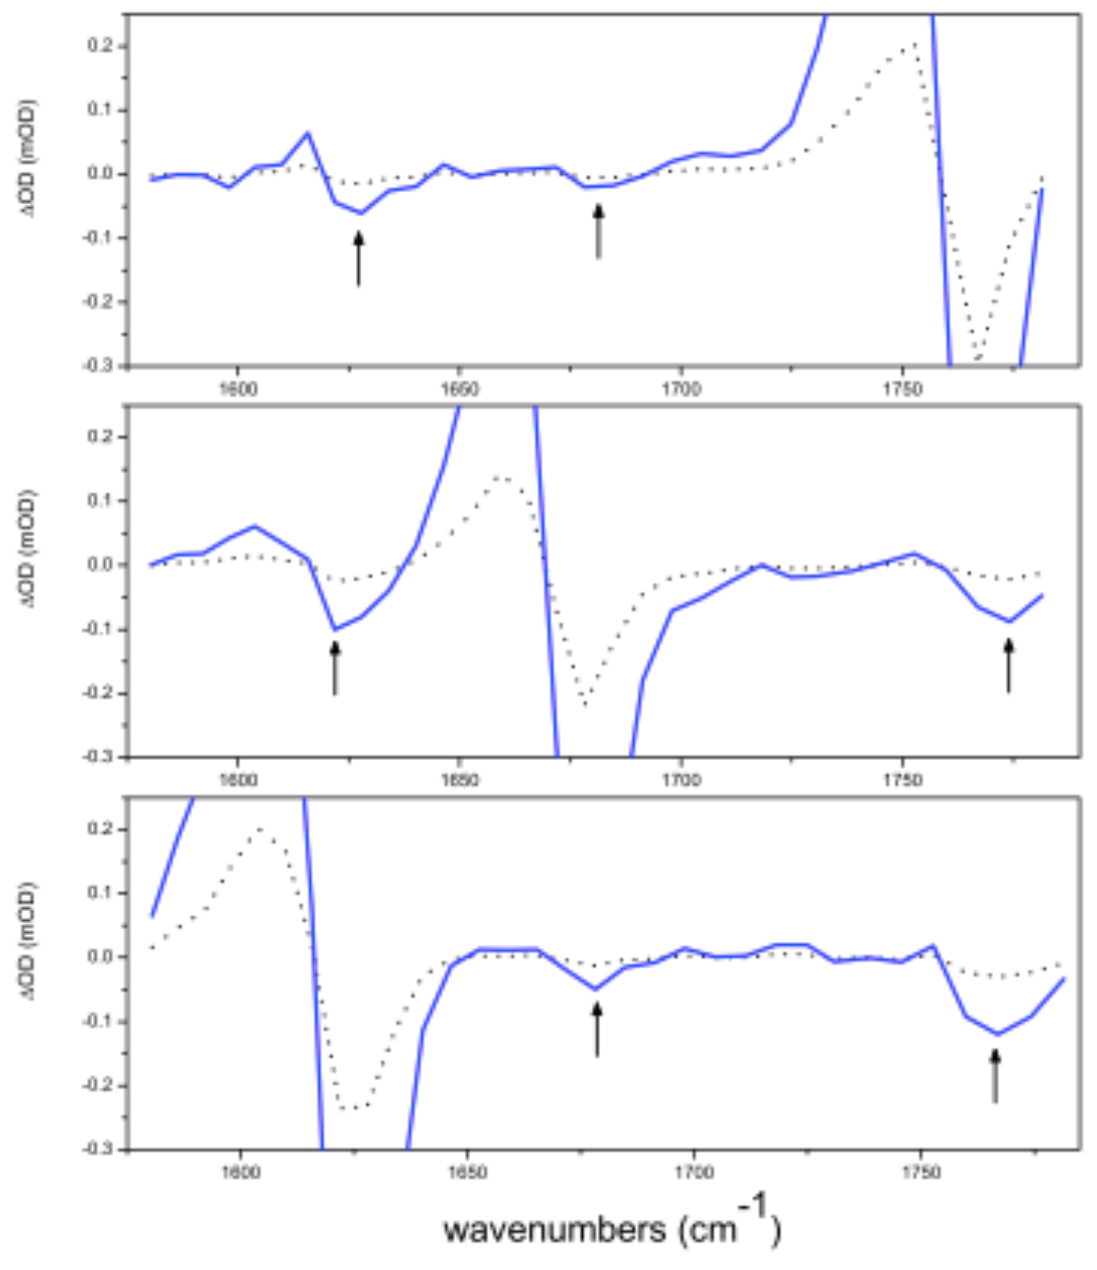
The coupling between two transitions is symmetric. It means that coupling constants are expected to be . Since the overlap of Amide I and carboxylate transitions in makes unfeasible a selective excitation, only the couplings observed by exciting have been characterized. The cross peak with Amide I is hardly noticeable from noise while that due to the coupling with the carboxylate is clearly observed (see Figure 6). The value of the coupling applying Equations (3) and (4) are reported in Table 3. In signals are twice more intense (see Figure 7) and the separation between bands allows us to acquire both and values of couplings to provide a more accurate averaged value.
In both solvents the strongest coupling is found to be between the and the carboxylate CO stretching mode. Such result is an indication that the most abundant conformation is that where a more close proximity of -lactam CO to one of the two oxygens of the carboxylate is favoured. Preliminary results from ab-initio calculations show that the molecular structure reported in Figure 1 is one of the stable configurations in respect to carboxylate rotation. The two CO bonds are almost coplanar and parallel thus maximising their mutual interaction. In order to derive distances we must carry on more accurate calculations in order to determine the transition dipole moment strength.
4. Conclusions
The CO stretching of carboxylate, and Amide I vibrational modes in penicillin G sodium salt are characterized in terms of inhomogeneous broadening and anharmonicity by linear and non-linear MIR spectroscopic techniques. Hydrogen bonds in affect differently the linewidth and anharmonicity of the three modes. The mode is the least broadened (34 cm) with an anharmonic constant of 27 cm in . Such value reduces to 14 cm in showing that hydrogen bond plays a fundamental role in modulating the anharmonicity of the mode. In both solvents CO vibration has a smaller anharmonicity than that of the other modes involving CO stretching. Narrow band pump experiments at the three central frequencies of the -lactam, Amide I and carboxylate CO stretching modes allow us to measure the coupling constants between the three CO oscillators. Results show that the strongest coupling is between the -lactam and the carboxylate CO vibrational modes probably as a consequence of a higher probability to have the two oscillators in a pseudo-parallel configuration. The present results reinforce the ideas that non-linear MIR techniques are the right tools to gather structural dynamic information at the picosecond time scale. As stated in the introduction of Hamm and Zanni book [5], a 2DIR spectrometer is still far to be a routine instrument and performing such experiments requires “a very broad skill set”. However, we believe that working on specific model systems such penicillin G will allow us to identify the subtleties hidden in these experiments and will help to transform these spectroscopic techniques into routine tools for molecular dynamics investigation.
Author Contributions
Conceptualization, P.F.; Data curation, E.R., S.C.and P.F.; Formal analysis, E.R.; Investigation, E.R. and S.C.; Methodology, A.L.; Software, M.B. and A.L.; Supervision, P.F. All authors have read and agreed to the published version of the manuscript.
Funding
Laserlab-Europe : 654148 and 871124.
Data Availability Statement
The data presented in this study are available on request from the corresponding author.
Acknowledgments
The research leading to these results has received funding from LASERLAB EUROPE (grant agreement no. 654148 and no. 871124, European Union Horizon 2020 research and innovation programme).
Conflicts of Interest
The authors declare no conflict of interest.
References
- Le Sueur, A.L.; Horness, R.E.; Thielges, M.C. Applications of two-dimensional infrared spectroscopy. Analyst 2015, 140, 4336–4349. [Google Scholar] [CrossRef] [PubMed] [Green Version]
- Fritzsch, R.; Hume, S.; Minnes, L.; Baker, M.J.; Burley, G.A.; Hunt, N.T. Two-dimensional infrared spectroscopy: An emerging analytical tool? Analyst 2020, 145, 2014–2024. [Google Scholar] [CrossRef] [PubMed]
- Petti, M.K.; Lomont, J.P.; Maj, M.; Zanni, M.T. Two-Dimensional Spectroscopy Is Being Used to Address Core Scientific Questions in Biology and Materials Science. J. Phys. Chem. B 2018, 122, 1771–1780. [Google Scholar] [CrossRef] [PubMed]
- Kuhs, C.T.; Luther, B.M.; Krummel, A.T. Biomolecular and bioanalytical applications of infrared spectroscopy—A review. IEEE J. Sel. Top. Quantum Electron. 2019, 25, 3100313. [Google Scholar]
- Hamm, P.; Zanni, M.T. Concepts and Methods of 2D Infrared Spectroscopy; Cambridge University Press: New York, NY, USA, 2011. [Google Scholar]
- Lima, M.; Candelaresi, M.; Foggi, P. 2D-IR spectroscopy: An additional dimension to investigate ultrafast structural dynamics. J. Raman. Spectr. 2013, 44, 1470–1477. [Google Scholar] [CrossRef]
- Hamm, P.; Lim, M.; DeGrado, W.F.; Hochstrasser, R.M. The two-dimensional IR nonlinear spectroscopy of a cyclic penta-peptide in relation to its three-dimensional structure. Proc. Natl. Acad. Sci. USA 1999, 96, 2036–2041. [Google Scholar] [CrossRef] [Green Version]
- Chelli, R.; Volkov, V.V.; Righini, R. Retrieval of spectral and dynamic properties from two-dimensional infrared pump-probe experiments. J. Comput. Chem. 2008, 29, 1507–1516. [Google Scholar] [CrossRef]
- Ragnoni, E.; Palombo, F.; Green, E.; Winlove, C.P.; Di Donato, M.; Lapini, A. Coacervation of α-elastin studied by ultrafast nonlinear infrared spectroscopy. Phys. Chem. Chem. Phys. 2016, 18, 27981–27990. [Google Scholar] [CrossRef]
- Volkof, V.; Hamm, P. A Two-Dimensional Infrared Study of Localization, Structure, and Dynamics of a Dipeptide in Membrane Environment. Biophys. J. 2004, 87, 4213–4225. [Google Scholar] [CrossRef] [Green Version]
- Gironi, B.; Lapini, A.; Ragnoni, E.; Calvagna, C.; Paolantoni, M.; Morresi, A.; Sassi, P. Free volume and dynamics in a lipid bilayer. Phys. Chem. Chem. Phys. 2019, 21, 23169–23178. [Google Scholar] [CrossRef]
- Candelaresi, M.; Ragnoni, E.; Cappelli, C.; Corozzi, A.; Lima, M.; Monti, S.; Mennucci, B.; Nuti, F.; Papini, A.M.; Foggi, P. Conformational Analysis of Gly–Ala–NHMe in D2O and DMSO Solutions: A Two-Dimensional Infrared Spectroscopy Study. J. Phys. Chem. B 2013, 117, 14226–14237. [Google Scholar] [CrossRef] [PubMed]
- Moran, S.D.; Zanni, M.T. How to Get Insight into Amyloid Structure and Formation from Infrared Spectroscopy. J. Phys. Chem. Lett. 2014, 5, 1984–1993. [Google Scholar] [CrossRef] [PubMed]
- Woutersen, S.; Hamm, P. Structure Determination of Trialanine in Water Using Polarization Sensitive Two-Dimensional Vibrational Spectroscopy. J. Phys. Chem. B 2000, 104, 11316–11320. [Google Scholar] [CrossRef]
- Woutersen, S.; Hamm, P. Time-resolved two-dimensional vibrational spectroscopy of a short α-helix in water. J. Chem. Phys. 2001, 115, 7737–7743. [Google Scholar] [CrossRef]
- Woutersen, S.; Pfister, R.; Hamm, P.; Kosov, D.S.; Stock, G. Peptide conformational heterogeneity revealed from nonlinear vibrational spectroscopy and molecular-dynamics simulations. J. Chem. Phys. 2002, 117, 6833–6840. [Google Scholar] [CrossRef] [Green Version]
- Bredenbeck, J.; Helbing, J.; Sieg, A.; Schrader, T.; Zinth, W.; Renner, C.; Behrendt, R.; Moroder, L.; Wachtveitl, J.; Hamm, P. Picosecond conformational transition and equilibration of a cyclic peptide. Proc. Natl. Acad. Sci. USA 2003, 10, 6452–6457. [Google Scholar] [CrossRef] [Green Version]
- Backus, E.H.G.; Bloem, R.; Pfister, R.; Moretto, A.; Crisma, M.; Toniolo, C.; Hamm, P. Dynamical Transition in a Small Helical Peptide and Its Implication for Vibrational Energy Transport. J. Phys. Chem. B 2009, 113, 13405–13409. [Google Scholar] [CrossRef]
- Backus, E.H.G.; Bloem, R.; Donaldson, P.M.; Ihalainen, J.A.; Pfister, R.; Paoli, B.; Caflisch, A.; Hamm, P. 2D-IR Study of a Photoswitchable Isotope-Labeled α-Helix. J. Phys. Chem. B 2010, 114, 3735–3740. [Google Scholar] [CrossRef] [Green Version]
- Roy, S.; Lessing, J.; Meisl, G.; Ganim, Z.; Tokmakoff, A.; Knoester, J.; Jansen, T.L. Solvent and conformation dependence of amide I vibrations in peptides and proteins containing proline. J. Chem. Phys. 2011, 135, 234507. [Google Scholar] [CrossRef] [Green Version]
- Newton, D.W.; Kluza, R.B. pKa Values of Medical Compounds in Pharmacy Practice. Ann. Pharmacother. 1978, 12, 546–554. [Google Scholar]
- Lapini, A.; Pagliai, M.; Fanetti, S.; Citroni, M.; Scandolo, S.; Bini, R.; Righini, R. Pressure Dependence of Hydrogen-Bond Dynamics in Liquid Water Probed by Ultrafast Infrared Spectroscopy. J. Phys. Chem. Lett. 2016, 7, 3579–3584. [Google Scholar] [CrossRef] [PubMed]
- Fanetti, S.; Lapini, A.; Pagliai, M.; Citroni, M.; Di Donato, M.; Scandolo, S.; Righini, R.; Bini, R. Structure and Dynamics of Low-Density and High-Density Liquid Water at High Pressure. J. Phys. Chem. Lett. 2014, 5, 235–240. [Google Scholar] [CrossRef] [PubMed]
- Di Donato, M.; Segado Centellas, M.; Lapini, A.; Lima, M.; Avila, F.; Santoro, F.; Cappelli, C.; Righini, R. Combination of transient 2D-IR experiments and ab-initio calculations sheds light on the formation of the charge transfer state in photoexcited carbonyl carotenoids. J. Phys. Chem. B 2014, 118, 9613–9630. [Google Scholar] [CrossRef] [PubMed]
- Frisch, M.J.; Trucks, G.W.; Schlegel, H.B.; Scuseria, G.E.; Robb, M.A.; Cheeseman, J.R.; Montgomery, J.A., Jr.; Vreven, T.; Kudin, K.N.; Burant, J.C.; et al. Gaussian 03, R Evision C.02; Gaussian, Inc.: Wallingford, CT, USA, 2004; Available online: https://gaussian.com/g03citation/ (accessed on 11 October 2020).
- Barnes, R.B.; Gore, R.C.; Williams, E.F.; Linsley, S.G.; Petersen, E.M. Infrared Analysis of Crystalline Penicillins. Anal. Chem. 1947, 19, 620–627. [Google Scholar] [CrossRef]
- Volkov, V.V.; Nuti, F.; Takaoka, Y.; Chelli, R.; Papini, A.M.; Righini, R. Hydration and Hydrogen Bonding of Carbonyls in Dimyristoyl-Phosphatidylcholine Bilayer. J. Am. Chem. Soc. 2006, 128, 9466–9471. [Google Scholar] [CrossRef] [PubMed]
- Wang, J.; Hochstrasser, R.M. Anharmonicity of Amide Modes. J. Phys. Chem. B 2006, 110, 3798–3807. [Google Scholar] [CrossRef]
- Lapini, A.; Vázquez, S.M.; Touceda, P.T.; Lima, M. Cross-phase modulation in visible-pump/mid-infrared-probe spectroscopy. J. Mol. Struct. 2011, 993, 470–473. [Google Scholar] [CrossRef]
Figure 1.
Penicillin G molecule (A) and its IR spectra (B) in (blue line) and in (black line). Assignments are given: (1) stretching; (2) ; (3) asymmetric stretching of carboxylate group. A large red shift of (A2), out of the frequency window, is observed upon proton exchange in .
Figure 1.
Penicillin G molecule (A) and its IR spectra (B) in (blue line) and in (black line). Assignments are given: (1) stretching; (2) ; (3) asymmetric stretching of carboxylate group. A large red shift of (A2), out of the frequency window, is observed upon proton exchange in .

Figure 2.
Experimental (black) and calculated (red) IR spectra of Penicillin G in .

Figure 3.
Experimental (black) and calculated (red) IR spectra of Penicillin G in .

Figure 4.
Transient broadband parallel spectra in (on the left) and in (on the right). The black dot lines represent simulations of the transient spectra obtained by summing the linear IR spectrum with its reversed one, shifted by the averaged value of anharmonicity (27 cm for and 20 cm for ).
Figure 4.
Transient broadband parallel spectra in (on the left) and in (on the right). The black dot lines represent simulations of the transient spectra obtained by summing the linear IR spectrum with its reversed one, shifted by the averaged value of anharmonicity (27 cm for and 20 cm for ).

Figure 5.
Bi-exponential decay of excited state absorption and ground state recovery of CO in . Fitting is done starting from 200 fs. In the first 200 fs cross phase modulation phenomena due to temporal overlap between pump and probe occur.
Figure 5.
Bi-exponential decay of excited state absorption and ground state recovery of CO in . Fitting is done starting from 200 fs. In the first 200 fs cross phase modulation phenomena due to temporal overlap between pump and probe occur.

Figure 6.
Narrowband experiment in : the dot line show the scaled intensities to the most intense signal recorded when the at 1762 cm is excited. In order to highlight cross peaks (black arrows) the spectrum has been 20 times enlarged. The presence of the cross peak due to the coupling between the and the carboxylate is clearly visible while the cross peak with the amide I mode is hidden in the noise.

Figure 7.
Cross peaks in the CO stretching region of Penicillin G in DMSO-d6. Excitation frequencies are centred at 1767 cm, 1678 cm and 1622 . Black arrows indicate the position of cross peaks (four times enlarged).
Figure 7.
Cross peaks in the CO stretching region of Penicillin G in DMSO-d6. Excitation frequencies are centred at 1767 cm, 1678 cm and 1622 . Black arrows indicate the position of cross peaks (four times enlarged).


Table 1.
Experimental and calculated FT-IR frequencies (cm) of the three investigated vibrational modes and their assignment.
Table 1.
Experimental and calculated FT-IR frequencies (cm) of the three investigated vibrational modes and their assignment.
| 1762 | 1762 | 1767 | 1767 | carbonyl stretching |
| 1640 | 1655 | 1674 | 1674 | amide I |
| 1601 | 1580 | 1615 | 1588 | carboxylate asymmetric stretching |
Table 2.
Excited state absorption (ESA) and ground state recovery (GSR) lifetimes in and . A thermal contribution of 0.05/0.1 m optical density (OD) is measured in . Time values of the exponentials are in .
Table 2.
Excited state absorption (ESA) and ground state recovery (GSR) lifetimes in and . A thermal contribution of 0.05/0.1 m optical density (OD) is measured in . Time values of the exponentials are in .
| Amide I | Carboxylate | |||
|---|---|---|---|---|
| ESA | 1.1 exp(-t/550) | 0.2 exp(-t/324) | 0.3 exp(-t/490) | 0.9 exp(-t/136) |
| 0.4 exp(-t/1750) | 0.3 exp(-t/2040) | 0.3 exp(-t/2125) | 1.2 exp(-t/2195) | |
| = 0.9 ± 0.1 ps | = 1.4 ± 0.1 ps | = 1.3 ± 0.1 ps | = 1.3 ± 0.1 ps | |
| GSR | 1.5 exp(-t/550) | 0.4 exp(-t/512) | 0.5 exp(-t/580) | 0.5 exp(-t/154) |
| 0.5 exp(-t/1850) | 0.4 exp(-t/2940) | 0.5 exp(-t/2100) | 1.3 exp(-t/2200) | |
| = 0.9 ± 0.1 ps | = 1.7 ± 0.1 ps | = 1.3 ± 0.1 ps | = 1.6 ± 0.1 ps | |
Table 3.
Experimental values for coupling constant (in cm) evaluated in the weak coupled anharmonic mode model (see text).
Table 3.
Experimental values for coupling constant (in cm) evaluated in the weak coupled anharmonic mode model (see text).
| /Amide I | 6.7 | |
| /carboxylate | 9.2 | 19 |
| Amide I/carboxylate | 8.3 |
Publisher’s Note: MDPI stays neutral with regard to jurisdictional claims in published maps and institutional affiliations. |
© 2021 by the authors. Licensee MDPI, Basel, Switzerland. This article is an open access article distributed under the terms and conditions of the Creative Commons Attribution (CC BY) license (http://creativecommons.org/licenses/by/4.0/).
Share and Cite
MDPI and ACS Style
Ragnoni, E.; Catalini, S.; Becucci, M.; Lapini, A.; Foggi, P. Linear and Non-Linear Middle Infrared Spectra of Penicillin G in the CO Stretching Mode Region. Symmetry 2021, 13, 106. https://doi.org/10.3390/sym13010106
AMA Style
Ragnoni E, Catalini S, Becucci M, Lapini A, Foggi P. Linear and Non-Linear Middle Infrared Spectra of Penicillin G in the CO Stretching Mode Region. Symmetry. 2021; 13(1):106. https://doi.org/10.3390/sym13010106
Chicago/Turabian StyleRagnoni, Elena, Sara Catalini, Maurizio Becucci, Andrea Lapini, and Paolo Foggi. 2021. "Linear and Non-Linear Middle Infrared Spectra of Penicillin G in the CO Stretching Mode Region" Symmetry 13, no. 1: 106. https://doi.org/10.3390/sym13010106
Note that from the first issue of 2016, this journal uses article numbers instead of page numbers. See further details here.