1. Introduction
The study of cosmic rays and radioactive decays has import in a range of scientific areas as diverse as cosmology, astrophysics and human safety. Several large detectors are operating in sites across Earth (e.g., The Pierre Auger Observatory in Argentina [
1], IceCube in Antarctica [
2]) which are very effective and high-precision devices, but for all their vast extent are still localized to a relatively small area compared to the Earth’s surface. Unlike other observatories, Cosmic Ray Extremely Distributed Observatory (CREDO) [
3,
4,
5] collects data from detectors scattered over the entire Earth. This is particularly important for the study of extensive air showers, i.e., cascades of millions of particles reaching the Earth’s surface that may result from the collision of even a single particle of cosmic radiation (the so-called primary radiation) with particles of the atmosphere of the Earth. With detectors distributed all over Earth, CREDO will be able to examine the shower’s actual physical extent and energy, and thus obtain the information about the original particle that collided in the Earth’s atmosphere.
Such charged particles can leave detectable in the cameras of mobile phones, and there have been previous attempts to use such devices as particle detectors, e.g., the DECO experiment [
6,
7]. The appeal of such an experimental tool is the ubiquitous nature of the device and ease of deployment of the measurement software making for a widespread and low cost detector array with minimal engagement required of the participants. For all the promise, these previous efforts have never taken the experiment to that worldwide scale. CREDO aims at just such a scale of deployment, to facilitate the detection of the rarest and most energetic of particles.
The highest recorded energy of a cosmic ray particle so far is approximately 10
eV [
8]. By comparison, the mass of an electron is only 5 × 10
eV, the muon is 10
eV, and the proton and neutron are almost 10
eV. The highest attainable energies in CERN’s Large Hadron Collider particle accelerator are 10
eV. Due to the huge differences between energies achievable in accelerator experiments and the highest energies of observed cosmic rays, the cosmic rays are the only available source of particles with ultrahigh energies in the decades to follow. Due to the rarity of such particles, an enormous collecting areas is required to achieve significant count rates.
The CREDO project aligns to the Global Network of cosmic ray detectors, available to all interested parties in our embrace of the citizen science philosophy. Therefore, the detectors must comply with certain social and scientific requirements:
they must be cheap, easy to build and use by participants,
should effectively detect cosmic radiation and natural local (i.e., Earth-based) radiation as well as the radiation caused by radioactive contamination,
should send the registered radiation data to the CREDO project server,
the data must comply with temporal and spatial resolution requirements.
The first requirement is easy to fulfil as we can use the camera sensor available in almost all modern smartphones. This development effort commenced in 2017 and resulted in an application (or app) for widely used smartphones. This app was able to register cosmic rays and radioactive decay particles that impacted the smartphone’s camera sensor. To turn their smartphone into a cosmic ray detector, the participant need only install the app (available on the Android app store-Google Play) and entirely cover the camera to acquire the needed dark frame (i.e., taking a picture in complete darkness). The app then automatically analyzes the noise in the image from the camera [
9], detects any radiation event that leaves a charged trail on the camera sensor and sends the information about the detected tracks of particles [
10] to the CREDO server. Each project participant has access to data collected this way. The analysis of signals, taking into account their registration time, location of detection and direction, is currently underway. The CREDO project is open to participation in these works also by all interested parties.
The paper is organized as follows. In
Section 2 (“Scientific requirements and challenges”) we discuss the general requirements underpinning the particle detecting application. In
Section 3 (“Current status of particle detection”) and
Section 4 (“Preliminary conclusions after 2 years of application use”) we describe the current version of the CREDO Detector application and discuss main issues encountered during 2 years of the application operation. In
Section 5 (“Enhanced registration procedure”) we discuss the solutions to issues bound to the current version of the application.
Section 6 (“Future unified codebase”) covers the design of the unified application codebase enabling its use on various operating systems. In
Section 7 (“Data collecting and sharing”) we discuss some qualitative and quantitative properties of the accumulated dataset and describe the web application available for retrieving the data. In
Section 8 (“Summary and outlook”) we give the summary and discuss the outlook of the research.
2. Scientific Requirements and Challenges
The use of commodity-based smartphone sensors has challenges when applying them for scientific purposes. Electromagnetic noise registered by analogue sensors is clearly visible. Conversion of such data to the digital signal transfers the noise. The problem is even more apparent when we are dealing with an array of such sensors. An example of such an array is the RGB sensor of a digital camera. Each sensor cell may receive the visible radiation quanta and convert them into an electric signal, which is then integrated and stored in the memory of the electronic device in the form of a bitmap-an array of rows and columns of pixels. Each pixel stores the information about the color and the brightness of a single point in the array. The brightness of the pixel is usually stored on a scale of 0 to 255, where 0 is total blackness and 255-full maximum brightness for a given sensor and work conditions. When the sensor is completely covered, the radiation of visible light should be at a level 0. In practice, however, the brightness of each of the pixels is at the level in a range from 5 to 20, because of common electromagnetic noise.
The camera sensors are constructed to detect visible light, so to register the corpuscular or gamma radiation, it is necessary to eliminate the noise from this visible light. Fortunately, it is easy to achieve by simply covering the camera lens. We then measured the noise level in an image from a digital camera of a smartphone with the sensor tightly covered:
The average (both in time and across the sensor surface) value of the noise is constant but increases slightly with the temperature of the device. For most smartphone models, it is about 5–15 but some models generate a noise level above 40.
Some sensors have the so-called hot pixels, i.e., areas on the array whose noise level is much higher than on the rest of the image.
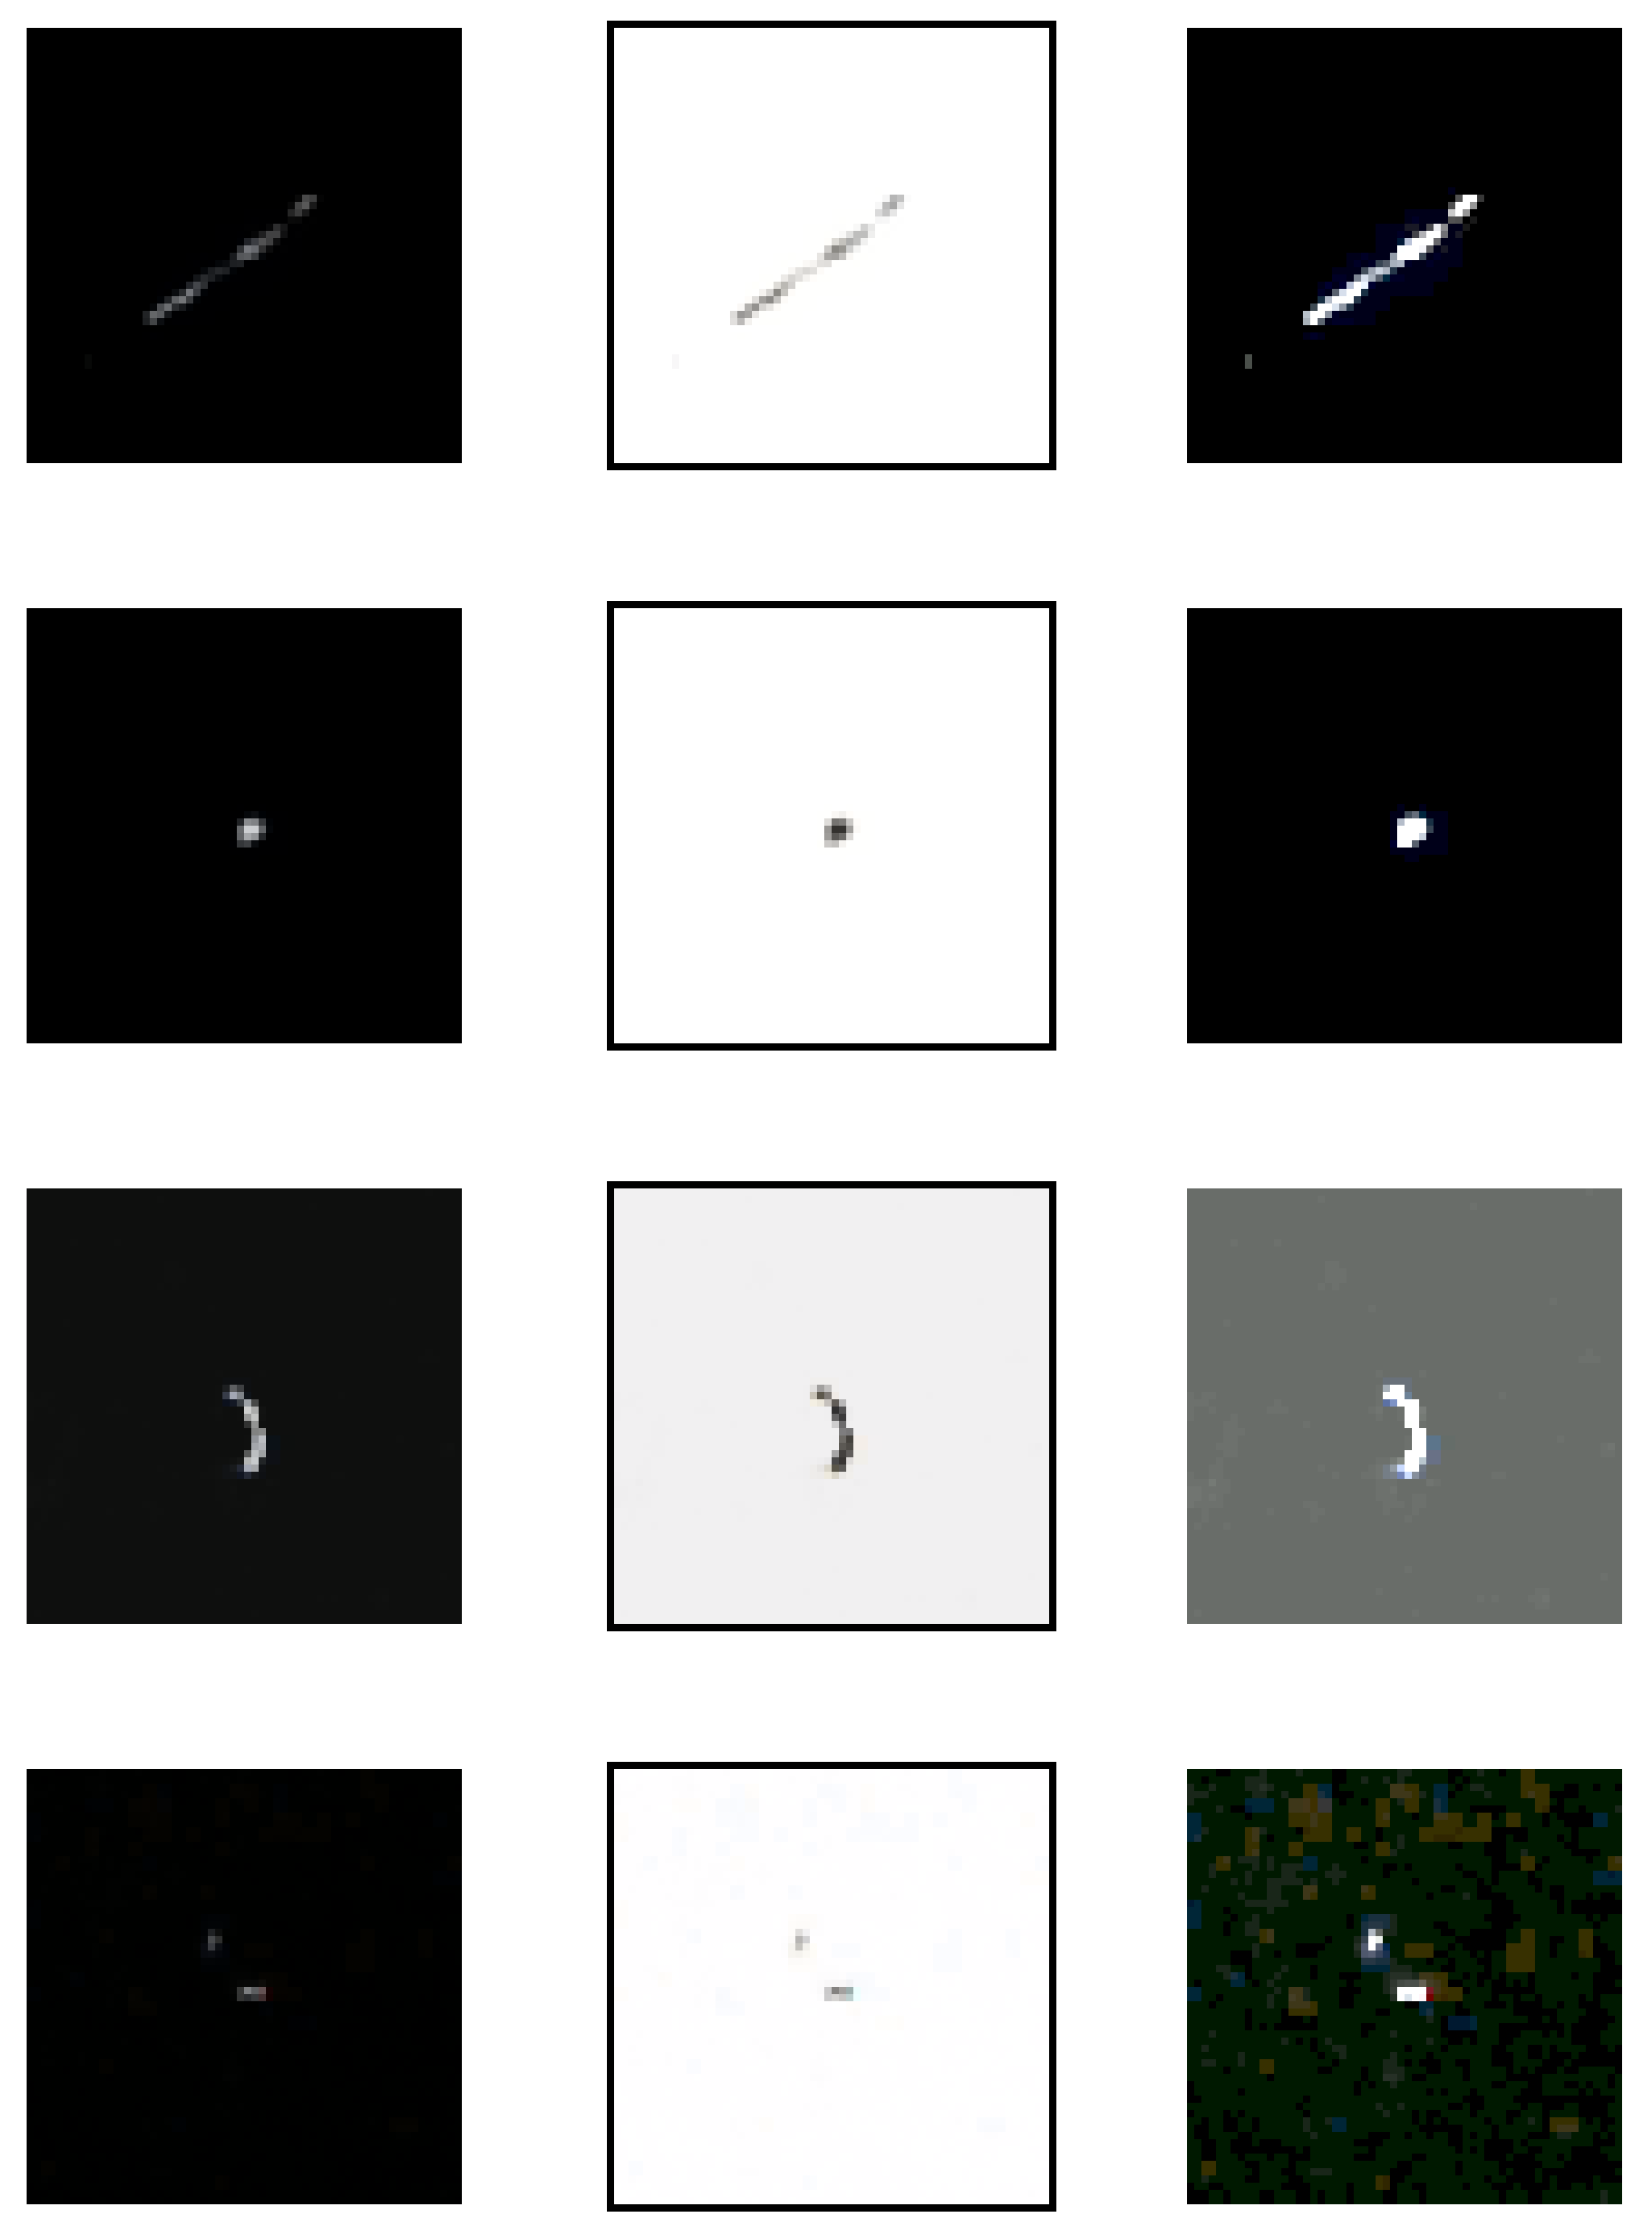
With the noise of the smartphone camera now characterized we were confident in our detection of signal-these were occasional, about once an hour, bright flashes in the image frame with magnitudes much higher than the noise level. These flashes were recorded as either elliptical in shape (up to about 10 pixels in diameter) or longitudinal with a width of several pixels and up to 30 pixels in length. The nature and the frequency of these flashes suggests that they may result from the collisions of particles of cosmic radiation with cells of the digital camera. The shape then reveals the orientation of the camera-cosmic ray collision. If the flash has an oval shape then it is likely the result of a particle colliding whose momentum was almost perpendicular to the surface of the sensor array. If the flash has a longitudinal shape, then most likely the particle traversed the array diagonally. A more detailed explanation of the recorded signals is shown in
Figure 1, where four classes of tracks are shown in (left to right columns) original, negative and brightened image versions. We note, however, the only original track image is the basis for further analysis by the CREDO pipeline.
The experiment used widely available mobile phones operating on the Android system. Each event collected by the app consisted of the following recorded dataset:
segment of the image comprising a burst together with the position of that segment on the image,
event time of the phone internal clock,
total detector operation time,
orientation of the phone’s position in relation to the Earth’s surface based on the accelerometer,
phone location based on GPS,
orientation of the phone in relation to the Earth’s poles based on a digital compass (supported by some models),
operating temperature measured by internal thermometer (supported by some models)
statistics on the average brightness of the pixels in the image frame and the average brightness of the brightest pixel in the image frame.
Two versions of the detecting algorithm are currently being tested. The first version uses the standard Android API [
11] to retrieve the particle image. The second version relies on the low-level camera API which enables direct access to the hardware functionality for retrieval of images in the RAW format [
12]. We describe both approaches in
Section 3 and
Section 5, respectively.
3. Current Status of Particle Detection
In this Section we will explore the current status of particle detection using the CREDO Detector Application, as well as the algorithm and the flow of information between the smartphone and the server. At its core, the basic version of the app has two operational modes, the initial calibration mode and the ongoing detection mode, both of which will be described in turn in the following subsections.
3.1. Calibration Mode
In the calibration mode, the application collects statistics from 500 frames and calculates the thresholds of the detection. We can distinguish three types of thresholds calculated from the formulas listed below:
average threshold = , but not less than 10 and not greater than 60,
max threshold = , but not less than 80 and not greater than 160,
black threshold = (by default).
3.2. Detection Mode
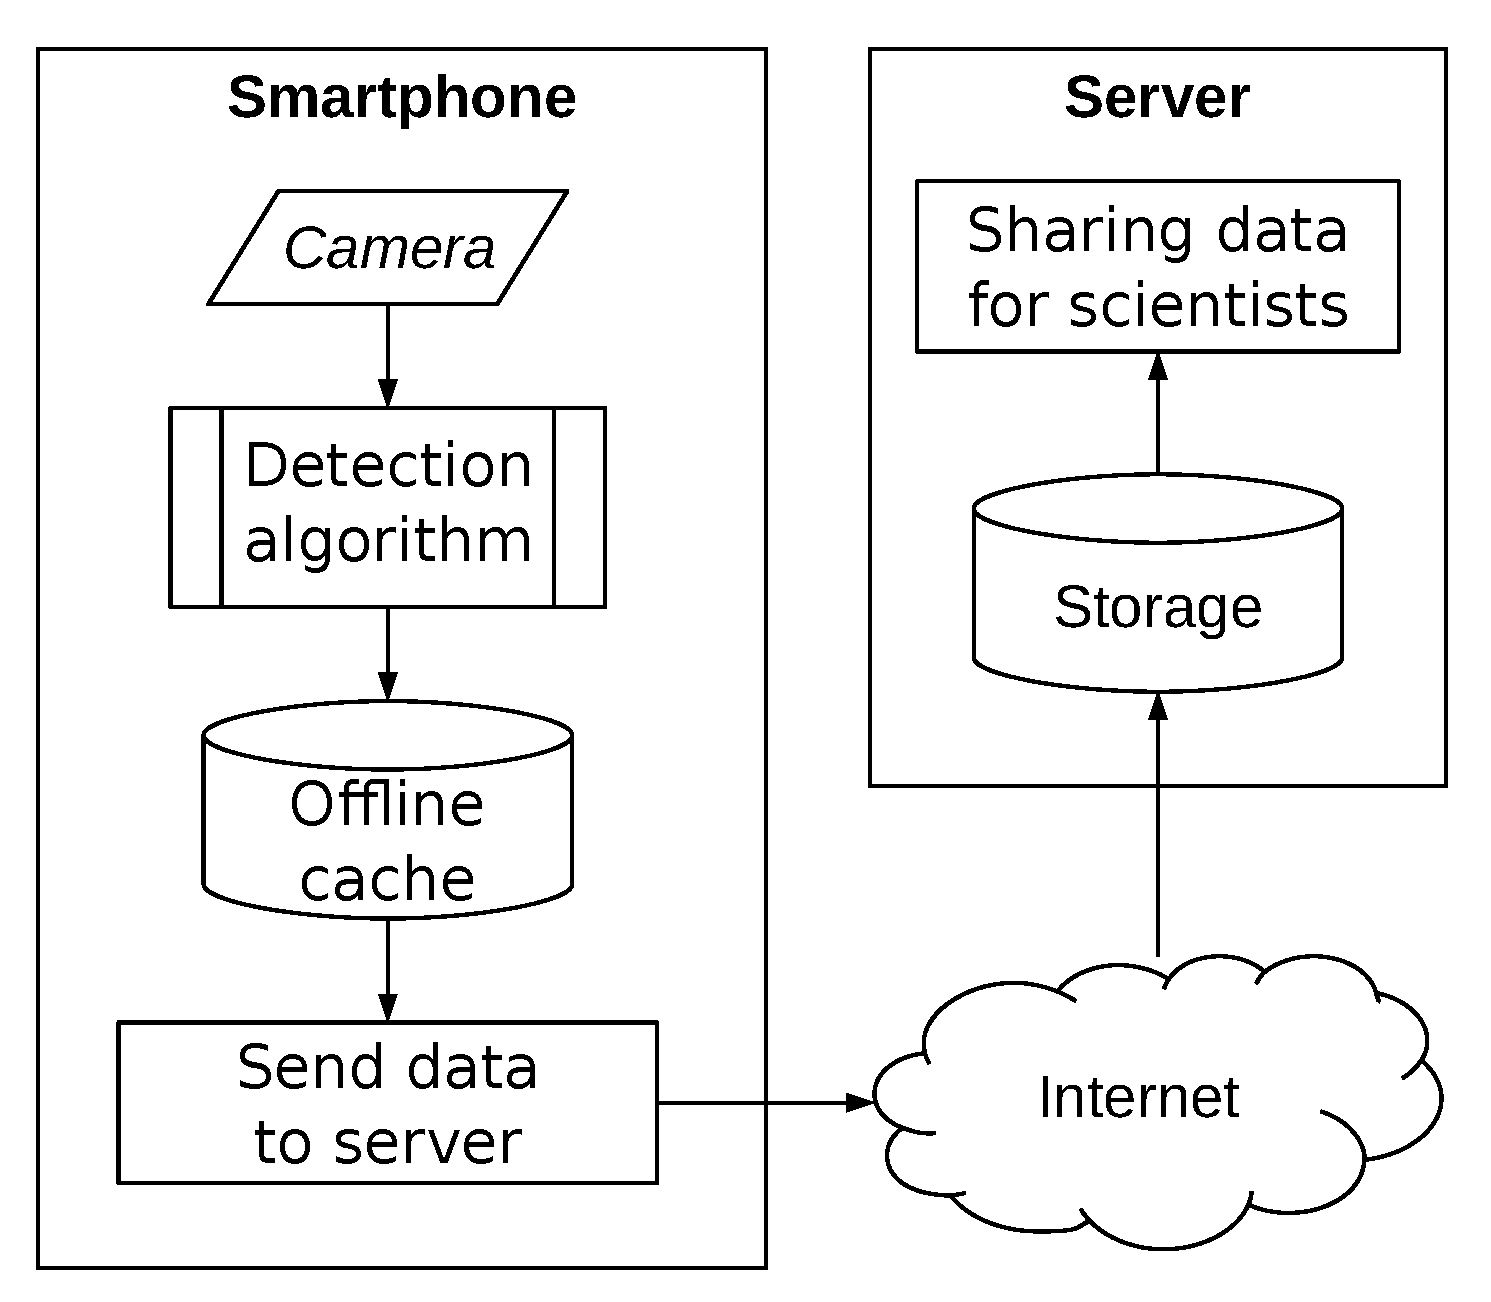
In the detection mode, which technically is the preview mode (live view) of the device, the application processes each image frame according to the algorithm presented below, and schematic diagram of the process of acquiring, collecting and analyzing data from detectors is presented in
Figure 2.
Phase 1-verification of the proper camera covering:
Calculation of the and the number of pixels darker than the black threshold .
If the or the percentage of is greater than 0.1% then the algorithm omits the frame and continues the processing.
Phase 2-Signal detection and sending information about the detection to the server:
The time difference between saving the frame and saving the previous frame is added to the detector work time.
Calculation of the , and recording the coordinates of the first pixel with value.
If the condition is met, the part of the image than contains these pixels (60 × 60 area centered at ) is cut out and sent to the server along with other data collected by the application. Otherwise, end of algorithm.
Fill by 0 value (black) all pixels in cut area in the original image frame and jump to 2.
The choice of threshold in Phase 1, Step 2, is informed by the following logic. A bright signal recorded by an HD camera (1280 × 720) usually consists of no more than 100 pixels (single flash) or 300 pixels (multiple flashes) brighter than the black threshold which is equivalent to 0.01% and 0.03% of such a frame, respectively. Preliminary analysis shows that if the camera is not sufficiently tightly covered a ratio of brighter pixels is at least a few per mille. On the basis of these observations, the threshold was set to , which effectively confirms the light-tight covering of the camera and then accepts bursts as caused by cosmic rays.
4. Preliminary Conclusions after 2 Years of Application Use
Our use of a smartphone cosmic ray detector on the Android operating system has had both advantages, as well as disadvantages, over the last two-year deployment phase. We will explore some of these opportunities, as well as restrictions, in this Section structured by the scientific, technical and functional requirements of the citizen science nature of the project.
From the scientific point of view, the most desired mode of the camera operation is a mode in which the image is delivered in a RAW format (as described in
Section 5). In this format, the smartphones do not undertake any treatment to improve the image quality, such as the automatic noise removal. Also, no lossy compression is performed. In addition, the signal should be collected from all sensors in the array and in a continuous manner, i.e., the array should be irradiated without breaks, because only such a mode guarantees the registration of all particles of cosmic radiation. Additional scientific value is provided by the readings from the accelerometer, GPS, digital compass and system clock sensors, which are automatically synchronized by the operating system.
Android provides access to several options of the camera operation. The camera may work in the recording mode and preview mode. In the recording mode, the image is saved to a file using lossy compression and the built-in algorithms improve image quality and remove the noise. As our signal would be considered noise, this recording mode of the camera is scientifically useless. This mode of operation would also be difficult to implement for technical reasons, because the file would have to be stored in the phone memory until it is processed by the detection algorithm. Then it would have to be discarded while the phone memory has a limited number of write cycles.
In the preview mode, the application receives the binary image frames in real time. Additionally, to save energy, the preview frames are not processed by the operating system. Unfortunately, they may yet be subjected to algorithms installed directly in the camera, especially in the high-end models manufactured after 2016. Therefore, especially in older and lower-end models, it is possible to use this operating mode for effective detection of particle radiation.
In most phone models, the camera operates with a frequency of 30 frames per second. Unfortunately, the operating system does not provide information about the frame exposure time. Therefore, no information is available as to the intervals in which the camera sensor did not collect information about the collisions of particles with the array. However, if the camera is covered tightly by the user, one can be relatively confident that the ‘dead time’ is as short as possible for that given phone model.
Typically, the system enables the camera to work with a maximum resolution of HD (1280 × 720), or Full HD (1920 × 1080) when the camera records the video or images in 4 K resolution. However, the camera in the preview mode does not work with the full resolution. Our preliminary studies showed that this did not pose a problem. The diameter of a typical camera sensor array is around 5–6 mm and has an aspect ratio of 4:3. Because the hitting particle illuminates several adjacent pixels, the use of the only ¼ of the full camera resolution does not cause a deterioration of detector accuracy, but happily does dramatically reduce the amount of data to be processed. This is even more important as the camera stores the binary content of the image frames in buffers that must be released after the application has processed them. If the buffer is not released before the registration of the next frame, its contents are lost. To optimize the frame processing it is distributed across several threads, so all processor cores are employed.
During operations, it is important to keep in mind that smartphones do not have an active cooling system. Therefore, even if it is powered by a charger, energy-saving steps are necessary to prevent overheating. Overheating of the phone should not cause damage because it has several mechanisms to prevent it (although these will interfere with the usage of the device as a cosmic ray detector). They include slowing down the CPU, automatically switching off some devices (e.g., the camera) or even the entire phone. Overheating of the phone also uses up the battery faster. For this reason, the CREDO application, as far as technically possible, lowers the computational (and hence heating) demands by using the only ¼ of the full resolution of the camera. In addition, the application uses a system function that allows the operation of the camera after turning off the screen. This feature consists of the fact that the window is displayed on top of the other application windows (topmost). Then the camera preview is redirected to this window. As a result, the camera remains on, despite the user switching to another application or even turning off the screen. The switched off screen is an additional, important, energy-saving effort by the Application.
If the phone has an internal thermometer, the detection process will be suspended when the phone reaches a threshold temperature and will resume when the temperature falls below the appropriate level. Despite connecting the phone to a charger, the battery can still be discharged as the power of the charger may be insufficient to cover the phone’s demand for energy. Therefore, if the charge level falls below a low value threshold, the detection process will also be suspended until the charge level of the battery power reaches a sufficient threshold. Thresholds of the temperature and battery charging can be set from the application settings.
There are several technical problems related to the use of smartphones by the general public, which we list in turn along with the solutions CREDO employs to address them:
Problem-participants do not always cover the camera properly.
Solution-apply brightness thresholds and auto-calibrate these thresholds. If the camera is not properly covered, the user is informed in a clear way.
Problem-camera and image processing algorithm uses a lot of power, which can quickly drain the battery and overheat the phone.
Solution-it is recommended to connect the phone to the charger when running the CREDO app. In addition, the application itself pauses the detection if the phone temperature has reached a value higher than the set value, or the battery level has dropped below the set value. In Android systems up to version 9.0 it is possible to operate the camera despite turning off the screen, significantly reducing the heating of the phone.
Problem-newer and more expensive smartphone models have better hardware noise reduction mechanisms that can effectively eliminate glare from the picture frame [
13].
Solution: Such phones with advanced noise reduction mechanism are currently not suitable for detection with this algorithm and user is informed.
Despite the latter technical difficulty, the current version of the deployed application can provide data of scientific value. The smartphone clock automatically synchronizes with the NTP server, so provides a registered event time with an accuracy of up to one second. The track in the image is often longitudinal in shape and if the phone is equipped with a compass, one can determine the direction from which the particle came. These two quantities: time and direction, are sufficient for a given observation by a citizen scientist to be of value in our broader scientific mission.
5. Enhanced Registration Procedure
The previously described particles track detection application is currently in use by a large group of () users. The experience from over two years of running the CREDO Application, and related analysis of the collected data, allow us to define several main problems with such a distributed citizen science-based experimental program, namely:
the noticeable lack of detections on modern smartphones,
reliability of obtained data from a scientific point of view requires further confirmation,
application performance is a key challenge for effective long-term data acquisition.
A thorough analysis of the problem allows us to conclude that most of the indicated issues result from accessing the image in the smartphone’s camera, i.e., CMOS array. Obtaining the image using standard mechanisms provided by the phone’s system causes the frame to be pre-processed by advanced hardware image correction mechanisms, e.g., noise elimination, contrast manipulation, white balance adjustment, etc. These types of mechanisms can cause difficulties in particle detection on such modern smartphone models.
Therefore, a decision was made to prepare an improved version of the detection algorithm, which should use an image as close as possible to the original response of the charged ray-sensitive array. This type of image is possible to obtain new types of phones using the RAW format. An improved version of the application is currently developed and user-tested. This version is described below and will complement the standard CREDO detector application in the near future.
5.1. Calibration Algorithm
Although the RAW format has advantages, there are negative consequences to be addressed from directly accessing it, particularly from the disabled automatic frame processing and handling of full-resolution frames. Frames acquired in this configuration have a higher noise level and it is impossible to use the calibration algorithm with assumed thresholds as described previously in
Section 3.
The first step to address this problem is to acquire several dozen frames. Based on these frames, the average brightness of each pixel of the array is calculated. For pixels that have a high brightness value, despite covering of the lens, the standard deviation is also calculated. Each pixel for which the standard deviation has a small value is interpreted as damaged. The positions of such pixels are saved so that in the future operation of the application they may be ignored. Then the average brightness of the entire frame is calculated. If the lens is properly covered, this value should not be more than , which varies from device to device but in typical situations has a value of ∼20.
The calculated average frames brightness is saved so that during its operation the application can control whether the method and effectiveness of the lens coverage has changed. In the case where after a certain time, the average brightness of the frame changes, but still does not exceed the acceptable threshold, it is necessary to repeat the calibration in order to adjust the thresholds to the possibly changed conditions. The re-calibration can be performed without informing the user.
The algorithm that sets the threshold for detections works as follows:
Initialization of scaling factors. The frame length and width scaling factor is a number that determines how many physical pixels (vertically and horizontally, respectively) will be used to create one pixel of the final frame. The initial value of both scaling factors is 1.
A frame with a size that matches the scaling factors is created from the RAW format frame. The brightness value of the individual pixels in the new frame is the average value of the corresponding pixels in the original frame.
For 100 frames, the maximum values of pixel brightness from rescaled frames are recorded.
For these brightness values the means and standard deviations are calculated and stored.
Calculation of the standard deviation and comparison with a fixed threshold value (This value was empirically determined. If a higher threshold was used, the noise present in the frames was too high. A lower threshold, on the other hand, caused too much averaging of the frames, which led to a lack of detection.) . Depending on the result of this comparison, the following actions are taken:
If the standard deviation is greater than or equal to , the new values of the scaling factors are computed:
The factor with the lower value is changed or, if both factors are equal, the width scaling factor is changed. The new factor is equal to the smallest frame dimension divisor that has not yet been used (of length or width, depending on which scaling factor is to be changed).
If the product of the scaling factors is less than 64, the algorithm goes back to point 2, otherwise, the configuration used to capture the original raw frame will be considered invalid and the application will have to go through the auto-configuration process again taking this event into account.
If the standard deviation is less than , the average maximum pixel brightness value is increased by 10% and saved. This value is treated as the threshold according to which a decision is made whether the event of hitting the radiation particle with the array was recorded in the frame. The average brightness of the original frames based on which the detection threshold was determined, as well as the current scaling factors are also recorded.
5.2. Detection Algorithm
After successful device configuration and calibration, the application may enter the operational mode of cosmic ray detection. In this mode, the frames are delivered from the camera to the detection algorithm. The average brightness
is calculated for each frame and if it is above the brightness threshold (
, the message about the need to cover the lens is displayed. Otherwise, the condition is checked whether this value deviates from the average brightness of the frames
by more than
according to
If so there is a need to re-calibrate.
A change in the level of the frame brightness may take place as a result of several events. The most common reasons are: changing the position of the device, increasing the temperature of the device or changing the intensity of light reaching the place where the phone is located.
When the condition of the correct covering of the camera and the condition of validity of the calibration are met, on the basis of the raw frame, an auxiliary, smaller frame is created with dimensions resulting from the scaling factors. The process of creating the frame is the same as during the calibration algorithm. In the newly formed auxiliary frame, the brightest pixel is searched for. The case of exceeding the detection threshold by the value of this pixel is interpreted as a potential radiation particle hitting the matrix. Pixel coordinates are converted, using scaling factors, to the coordinates of the original frame where this event was recorded. This area, which is the segment of the full-size frame, is saved as a bitmap. Additionally, metadata including the time of the detection, information about the device and its location, and the general frame information is saved.
5.3. Phone Configuration
As discussed above, there are two algorithms available which may run on a given device, depending on its technical capabilities. It is worth stressing that the development of the algorithm based on the RAW format is related to general trends in the smartphone market rather than to deficiencies of the basic algorithm. In particular, for devices which are not affected by the loss of events due to noise reduction mechanisms, it provides a simple and effective means of particle event collection. Moreover, this algorithm has a very low false negative ratio, i.e., the fraction of real particles treated as noise.
Since the number of possible phone and operating system combinations is prohibitively large it is not possible to pre-compile the application so that it will run a proper algorithm on each possible device. Rather, the new version of the application will, after installation, go through the auto-configuration phase. During that phase, the application will check if the hardware and APIs available on the device are sufficient for running in the enhanced mode, i.e., with the RAW format. If this is not the case, as a fallback, the app will proceed in the basic mode.
6. Future Unified Codebase
The challenges of supporting multiple operating systems have meant that at present only the Android OS has been released, but with a desire to see evermore smartphones, tablets and indeed all CCD/CMOS capable devices join CREDO we have explored a new unified codebase based on the Flutter UI Toolkit [
14]. This system is coded in the Dart programming language and facilitates a single CREDO app that is then automatically compiled to other operating systems.
Moving to a unified codebase to support more than one operating system would increase the number of potential users while requiring virtually the same amount of maintenance as the original codebase. The migration to a unified codebase was undertaken by Astronomy Data and Compute Services, ADACS as part of the 2020A call for software support. In the allocated time the goal was to transfer the core of the CREDO application to flutter test it on multiple operating systems before, time permitting, adding non-critical features. The features chosen to prioritise were:
streaming images from the camera
calibrating the camera pre-detections
checking for and recording events
Moving to a unified codebase was not without its challenges. Most were in relation to avoiding any operating system specific code. An example of a minor problem was the requirement to convert the original C code processing images into Dart as using a C library would necessitate implementing it through operating system specific code. A more pressing concern was that depending on the operating system the image format varies between RGBA and YUV. Therefore, it was unavoidable that the app distinguishes between operating systems and versions of operating system to run the appropriate processing code. Although this issue was solved in Dart by a simple check of the operating system, there is a large number of possible color formats that would need to be processed and converted to the RGB format. In the allocated time ADACS converted the base functionality of the CREDO application into a flutter and ran tests on both Android and iOS phones, where it was determined that the core functionality was running as expected. The remaining time was spent on transferring the not yet publicly released version of the processing code that targets more recent phone APIs and circumvent the problem of image pre-processing and noise reduction by using raw image frames. Throughout the process of setting up the unified codebase, the structure and naming conventions were modelled closely on the existing Android code. Future development efforts will continue in this unified codebase to improve the scale and reach of CREDO to citizen scientists worldwide.
7. Data Collecting and Sharing
Data collection and sharing is an integral part of the project. In this Section, we present general statistics for the CREDO database, present examples of detection and explain how we encourage others to join the project.
Furthermore, we list three important aspects from the user’s point of view. This includes the key statistics on the CREDO data, how to download detections and also an example of detection and the basic determination of whether the detection image is a good candidate for further analysis.
7.1. Data Statistics
Detections collected by the CREDO project from the beginning of the project’s existence are stored in a database administered by IT specialists from ACC Cyfronet AGH [
15]. In
Table 1 we share summary statistics after more than two years of active data collection. Moreover, we allow citizen scientists to explore ‘visible’ detections on a dedicated website [
16], while detections with the status invisible (i.e., “visible” attribute is set to false) are cases where at least one of the conditions is true:
It was submitted using the old version of the API.
There is no image data associated with the detection (detectors without camera matrices CCD/CMOS such as Cosmic Watch).
Average pixel brightness () is above 15%.
Original sensor coordinates of the brightest pixel () for the user submitting it are repeated (“hot pixels”).
Timestamp of the detection is from before the user sent their first ping.
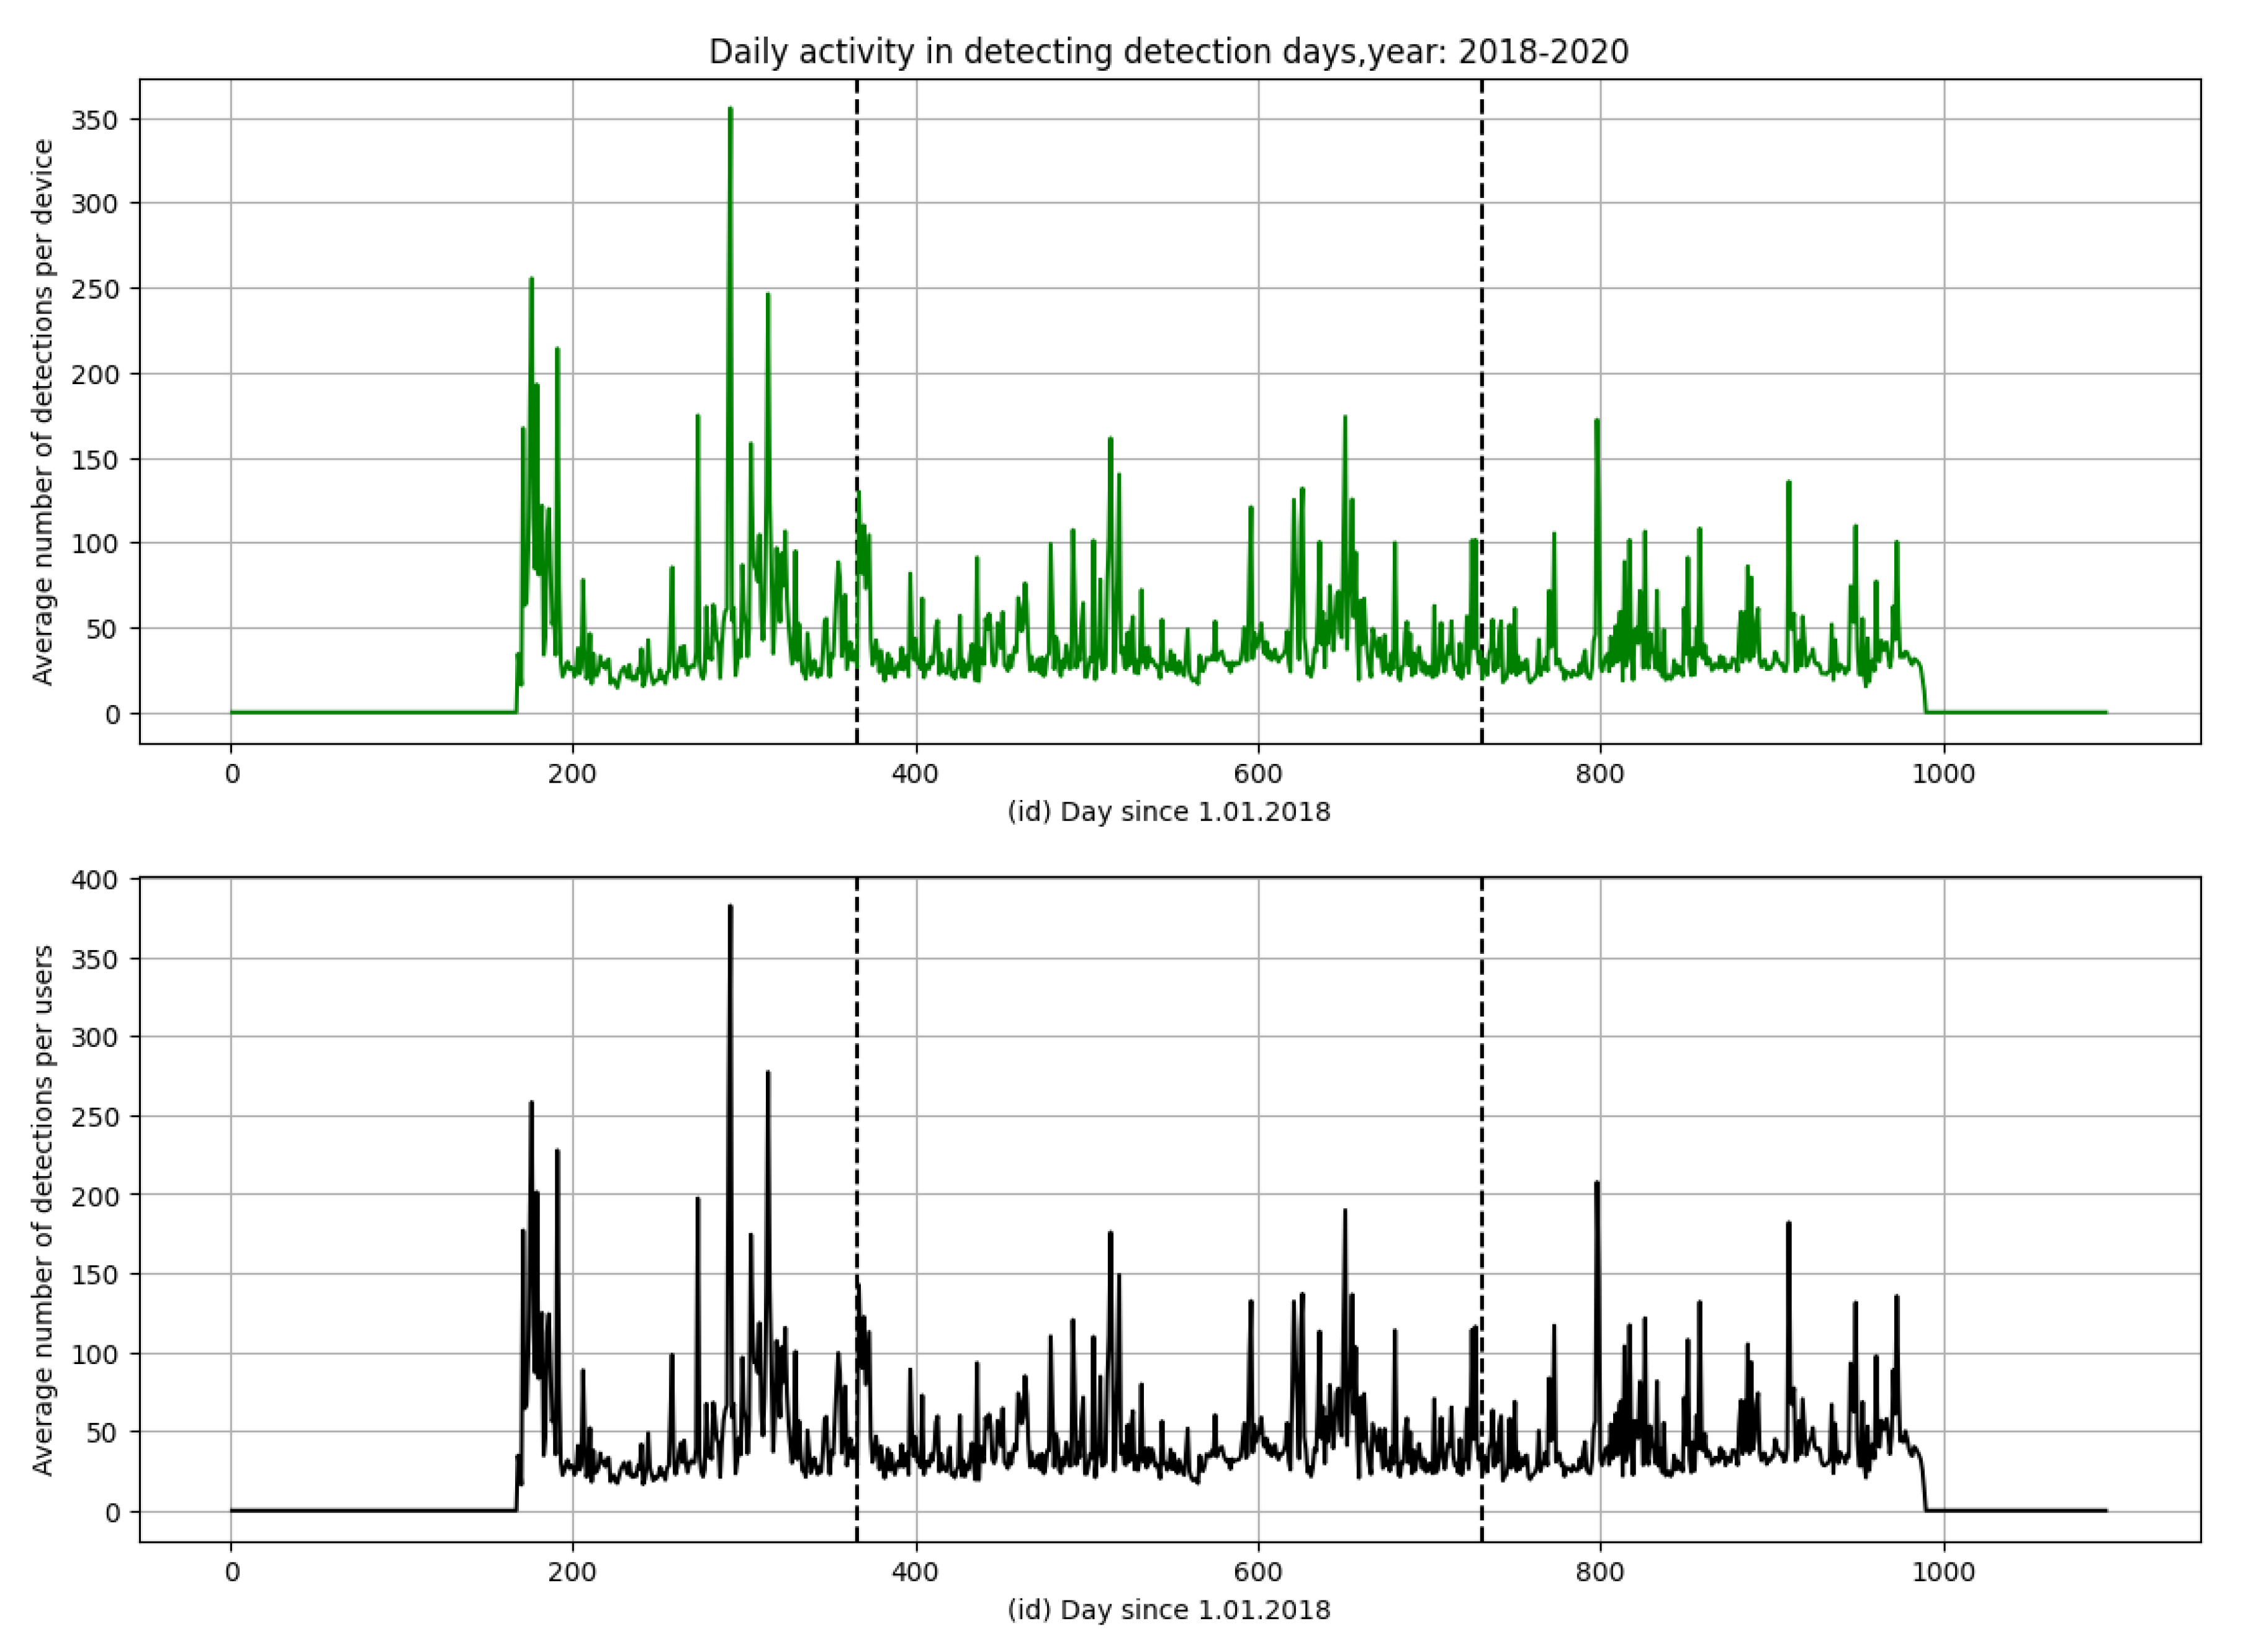
Users’ activity varies considerably and depends on various factors, such as the season (vacations or school year). Recently the pandemic has significantly reduced users’ activity. This is clearly seen in
Figure 3 and
Figure 4.
7.2. Open Data Repository
Each detection that is sent to the database creates one record. Records stored in the database include among other things the information on the time elapsed from the last detection, detector working time as well as information on users, groups and devices. A detailed description of the data stored can be found in CREDO GitHub [
17] in the sections
https://github.com/credo-science/credo-webapp/tree/master/credoapiv2. Single records are grouped into JSON [
18] packages that are available for download by everyone. To download the data users are required to contact the administration via credo support. It is required to send an e-mail to
[email protected], the reason for the request for access (willingness to analyze the detection, use in research-university, etc.) is purely informative, allowing the person from the project to find out what interests users have. The user is then required to have installed Python3 for downloading detection packages.
Python3 ./credo-data-exporter.py –user yourusername –password ‘userr_password’
In the future, it is planned to create several datasets so that users can download specific data without the need to contact the CREDO support.
7.3. Example Detections
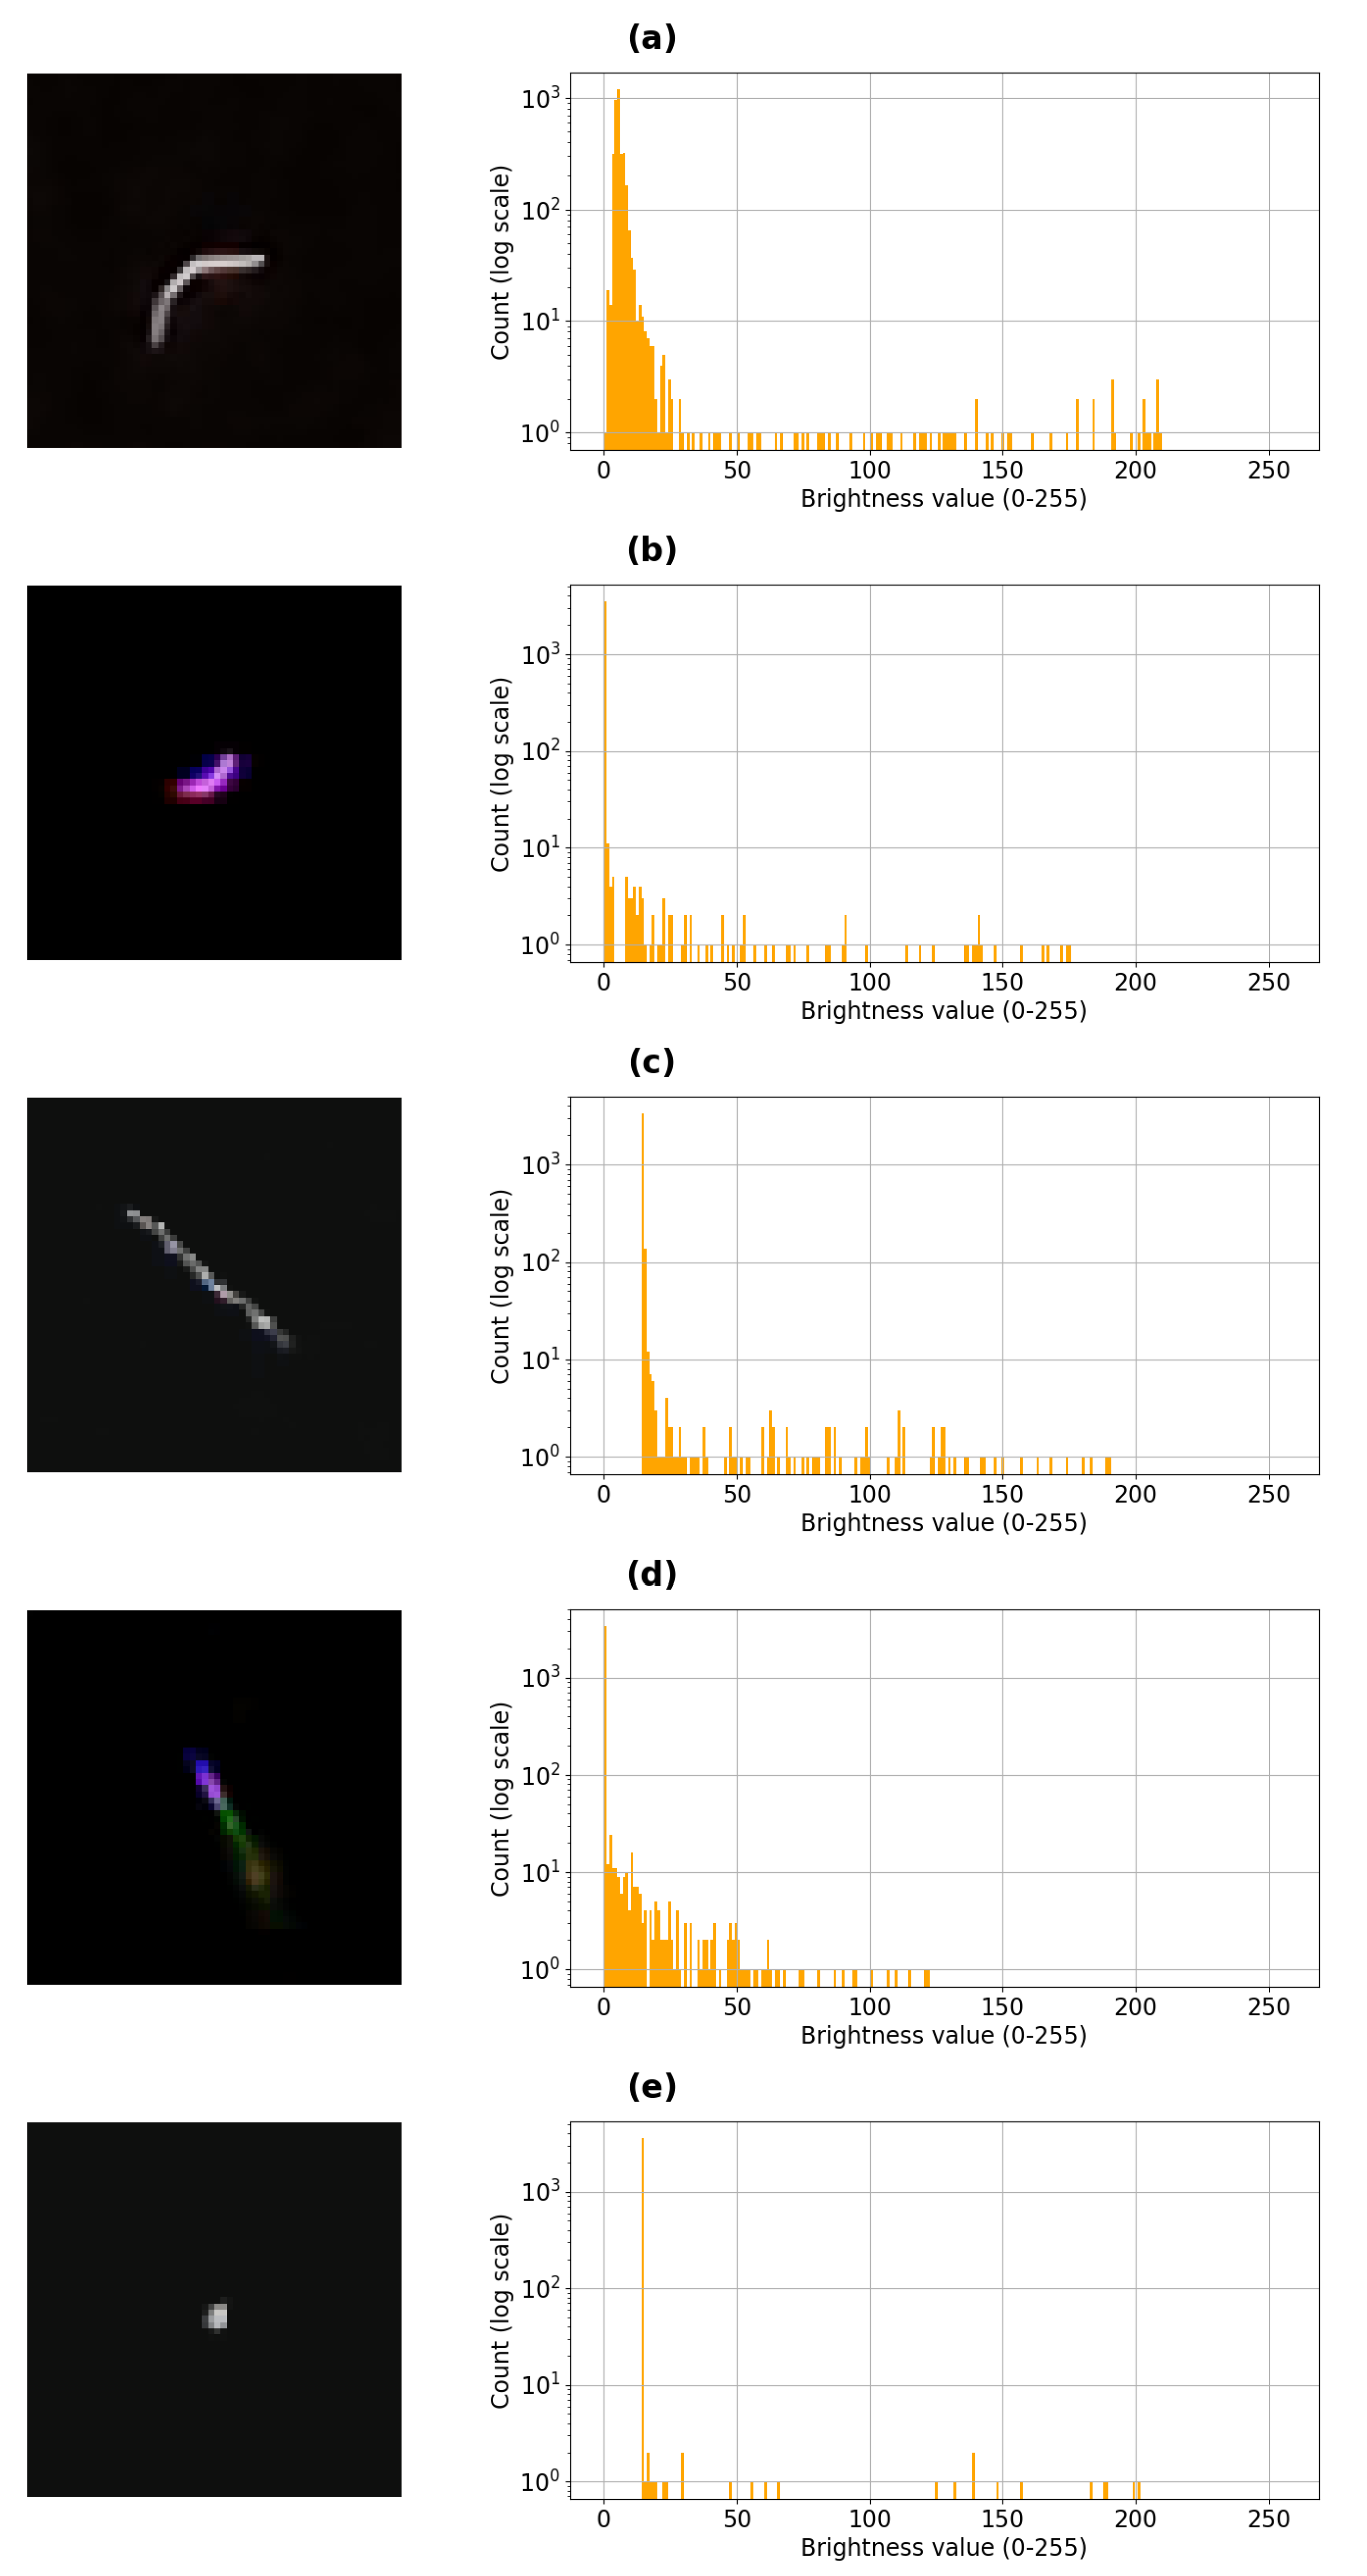
Each detection is saved as a 60 × 60 pixels image encoded in the base64 standard [
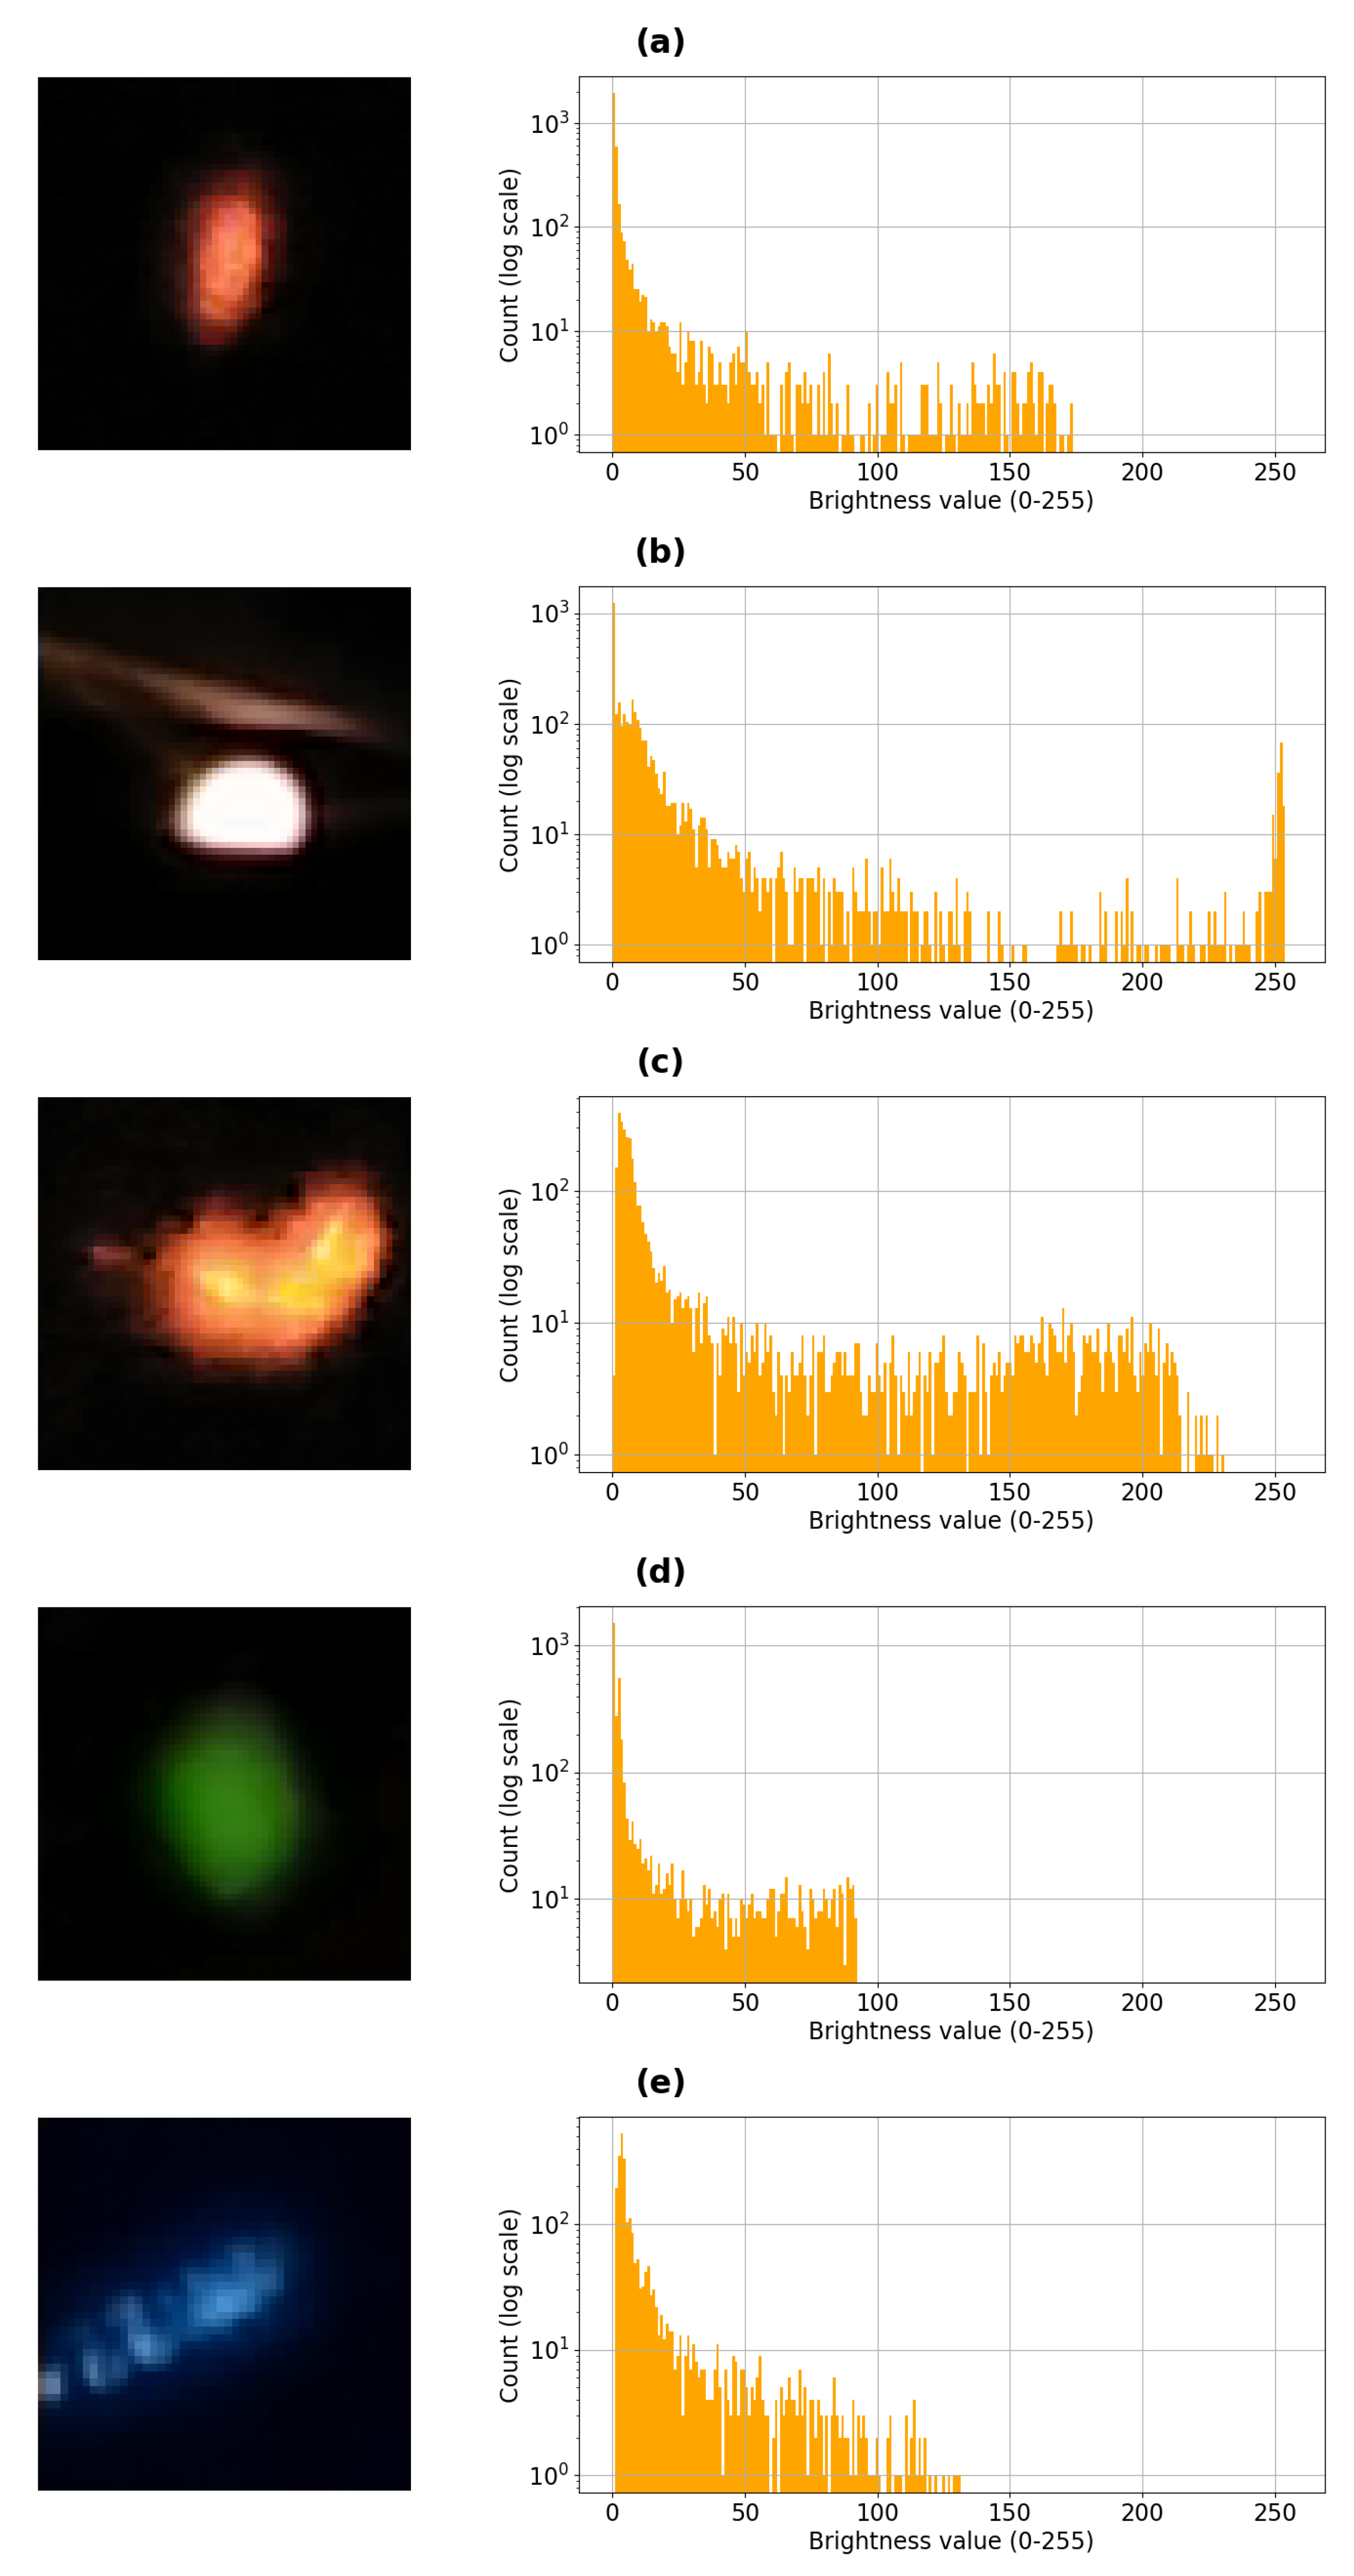
19]. The detections that the user takes are raw (without filters that reject bad cases), so one can find various images there. In
Figure 5 and
Figure 6 we present examples of good and bad detections with a simple example of pixel value analysis. The examples show just how pronounced the differences between good and bad particle candidates are to the eye. Such easily discernible differences in the shapes, for example, a
dot (
Figure 5e) and a line (
Figure 5c,d), allow many filters to be created. An example of such a filter to reject bad cases is the anti-artefact filter described in CREDO Internal Report: CIR_2019_03 [
20]. Currently, work is underway on a more advanced detection filter, which is being developed jointly by scientists and computer scientists.
8. Summary and Outlook
In this paper, we have discussed the motivation, scientific requirements, technical challenges as well as preliminary results and future prospects of the CREDO Detector application. Over 3.5 billion smartphones operating around the world [
21] provide enormous research potential. Apart from their ability to register the cosmic ray tracks, their internet connectivity enables the easy and rapid transmission of such events to a central data store for further scientific elaboration. The downside of a smartphone-based research network is the great variety of phone models and working conditions which must be accounted for in application design and development. Currently, the CREDO Detector has over 10,000 active users who have sent several million images to the CREDO database. However, to achieve proper data statistics and sufficient area coverage the CREDO Collaboration aims for a user population of
. The present collaboration activities are focused on developing the CREDO Detector to run on all major operating systems and further expand upon methods of artefact reduction and image analysis.
Author Contributions
Conceptualization, Ł.B., P.H., A.R.D.; methodology, Ł.B., K.R.; software, M.N., D.B., L.C., E.A., L.L., G.B.P.; validation, P.H.; formal analysis, M.N.; investigation, D.B., K.R.; data analysis, J.S., S.S., M.P., T.W.; data curation, M.N., S.S.; data science, K.R., M.P.; writing—original draft preparation, Ł.B., M.P.; writing—review and editing, B.H., A.R.D., P.H., K.R., A.T., B.H., K.S., J.Z.-S., T.W.; visualization, S.S., M.N.; supervision, P.H., D.E.A.C.; project administration, P.H.; funding acquisition, P.H. All authors have read and agreed to the published version of the manuscript.
Funding
This research was partly funded by the International Visegrad grant No. 21920298.
Acknowledgments
This research has been supported in part by PLGrid Infrastructure, the Astronomical Data and Compute Services (ADACS) team for Flutter development and we warmly thank the staff at ACC Cyfronet AGH-UST for their always helpful supercomputing support.
Conflicts of Interest
The authors declare no conflict of interest.
References
- The Pierre Auger Collaboration. The Pierre Auger Cosmic Ray Observatory. Nucl. Instr. Meth. A 2015, 798, 172–213. [Google Scholar] [CrossRef]
- Aartsen, M.G.; Ackermann, M.; Adams, J.; Aguilar, J.A.; Ahlers, M.; Ahrens, M.; Altmann, D.; Andeen, K.; Anderson, T.; Ansseau, I.; et al. The IceCube Neutrino Observatory: Instrumentation and online systems. JINST 2017, 12, P03012. [Google Scholar] [CrossRef]
- CREDO Collab. Cosmic-Ray Extremely Distributed Observatory: Status and perspectives, Universe. arXiv 2018, arXiv:1810.10410. [Google Scholar]
- CREDO Collab. Cosmic Ray Extremely Distributed Observatory: Status and perspectives of a global cosmic ray detection framework. arXiv 2019, arXiv:1908.04139. [Google Scholar]
- CREDO Collab. Cosmic Ray Extremely Distributed Observatory, Review Article in Symmetry, Special Issue on Cosmic Rays. arXiv 2020, arXiv:2010.08351. [Google Scholar]
- Vandenbroucke, J.; Bravo, S.; Karn, P.; Meehan, M.; Peacock, J.; Plewa, M.; Ruggles, T.; Schultz, D.; Simons, A.L. Detecting particles with cell phones: The Distributed Electronic Cosmic-ray Observatory. arXiv 2015, arXiv:1510.07665. [Google Scholar]
- Winter, M.; Bourbeau, J.; Bravo, S.; Campos, F.; Meehan, M.; Peacock, J.; Ruggles, T.; Schneider, C.; Simons, A.L.; Vandenbroucke, J. Particle identification in camera image sensors using computer vision. Astropart. Phys. 2019, 104, 42–53. [Google Scholar] [CrossRef] [Green Version]
- Bird, D.J.; Corbato, S.C.; Dai, H.Y.; Elbert, J.W.; Green, K.D.; Huang, M.A.; Kieda, D.B.; Ko, S.; Larsen, C.G.; Loh, E.C.; et al. Detection of a cosmic ray with measured energy well beyond the expected spectral cutoff due to cosmic microwave radiation. Astrophys. J. 1995, 441, 144. [Google Scholar] [CrossRef] [Green Version]
- Lim, S. Characterization of noise in digital photographs for image processing. In Digital Photography II; International Society for Optics and Photonics: Bellingham, DC, USA, 2006; Volume 6069, p. 60690O. [Google Scholar] [CrossRef] [Green Version]
- Waltham, N. CCD and CMOS sensors. In Observing Photons in Space; ISSI Scientific Report Series; Huber, M.C.E., Pauluhn, A., Culhane, J.L., Timothy, J.G., Wilhelm, K., Zehnder, A., Eds.; Springer: New York, NY, USA, 2013; Volume 9, pp. 423–442. [Google Scholar] [CrossRef]
- Camera API-Documentation. Available online: https://developer.android.com/guide/topics/media/camera (accessed on 30 September 2020).
- Android Hardware-Camera2-Documentation. Available online: https://developer.android.com/reference/android/hardware/camera2/package-summary (accessed on 30 September 2020).
- Lee, J.W.; Kim, S.J.; Han, S.K. Adaptive window thresholding for noise-robust photo detection in OCC. Opt. Commun. 2018, 426, 623–628. [Google Scholar] [CrossRef]
- Flutter-Official Website. Available online: https://flutter.dev (accessed on 30 September 2020).
- ACC Cyfronet AGH. Available online: http://www.cyfronet.krakow.pl/en/4421,main.html (accessed on 30 September 2020).
- Online Preview of CREDO Detection. Available online: https://api.credo.science/web/ (accessed on 30 September 2020).
- Github of the CREDO Project. Available online: https://github.com/credo-science (accessed on 30 September 2020).
- RFC 7159, The JavaScript Object Notation (JSON) Data Interchange Format. Available online: https://tools.ietf.org/html/rfc7159 (accessed on 30 September 2020).
- RFC 4648: The Base16, Base32, and Base64 Data Encodings. Available online: https://tools.ietf.org/html/rfc4648 (accessed on 30 September 2020).
- Stuglik, S.; Homola, P. CIR_2019_003-Histogram Analysis of Detections Based on Pixel Values in the Grayscale. 2019. Available online: https://credo2.cyfronet.pl/redmine/documents/28 (accessed on 30 September 2020).
- Number of Smartphone Users Worldwide from 2016 to 2021. Available online: https://www.statista.com/statistics/330695/number-of-smartphone-users-worldwide/ (accessed on 30 September 2020).
| Publisher’s Note: MDPI stays neutral with regard to jurisdictional claims in published maps and institutional affiliations. |
© 2020 by the authors. Licensee MDPI, Basel, Switzerland. This article is an open access article distributed under the terms and conditions of the Creative Commons Attribution (CC BY) license (http://creativecommons.org/licenses/by/4.0/).

 ,
, 


