Article

Integrated Decision-Making Approach Based on SWARA and GRA Methods for the Prioritization of Failures in Solar Panel Systems under Z-Information

by
Saeid Jafarzadeh Ghoushchi
1,
Mohd Nizam Ab Rahman
2,*,
Diba Raeisi
1,
Elnaz Osgooei
3 and
Majid Jafarzadeh Ghoushji
4,*
1
Faculty of Industrial Engineering, Urmia University of Technology, Urmia 57166, Iran
2
Department of Mechanical and Manufacturing Engineering, Faculty of Engineering and Built Environment,Universiti Kebangsaan Malaysia, Bangi 43600, Malaysia
3
Faculty of Science, Urmia University of Technology, Urmia 57166, Iran
4
Department of Engineering, Sanmina Corporation, Carrollton, TX 75006, USA
*
Authors to whom correspondence should be addressed.
Symmetry 2020, 12(2), 310; https://doi.org/10.3390/sym12020310
Submission received: 21 January 2020 / Revised: 12 February 2020 / Accepted: 17 February 2020 / Published: 21 February 2020
(This article belongs to the Special Issue Uncertain Multi-Criteria Optimization Problems)

Abstract

:
Encountering a problem or error in the final stages of providing products or services increases costs and delays scheduling. The key task is to ensure quality and reliability in the early stages of the production process and prevent errors from occurring from the beginning. Failure mode and effect analysis (FMEA) is one of the tools for identifying potential problems and their impact on products and services. The conventional FMEA technique has been criticized extensively due to its disadvantages. In this study, the concepts of uncertainty and reliability are considered simultaneously. The processes of weighting risk factors, prioritizing failures by using the stepwise weight assessment ratio analysis (SWARA)–gray relational analysis (GRA) integrated method based on Ζ-number theory and complete prioritization of failures are implemented. Crucial management indices, such as cost and time, are considered in addition to severity, occurrence and detection factors along with assigning symmetric form of the weights to them. This, in turn, increases the interpretability of results and reduces the decision-maker’s subjectivity in risk prioritization. The developed model is implemented on solar panel data with 19 failure modes determined by the FMEA team. Results show that the proposed approach provides a more complete and realistic prioritization of failures than conventional FMEA and fuzzy GRA methods do.

1. Introduction

In manufacturing and services, several factors, such as competition, customer expectations and changes and technological developments, encourage producers to increase their commitment to fixing product defects and eliminating performance deficiencies. Otherwise, market share will be lost due to reduced customer satisfaction [1,2,3,4]. To maintain market share, companies use different procedures to deliver unflawed products to the market. They use risk evaluation techniques to identify potential risks and determine their causes and effects. Various methods for risk assessment have been developed in recent years [5]. One of these methods is failure mode and effect analysis (FMEA). This method was first used to systematically analyze failure modes and their subsequent effects on military products, especially in the aviation industry [6]. One of the best features of FMEA is adopting proactive measures instead of reactive ones. If an accident occurs, large sums of money will be spent on solving problems and eliminating failures and if a failure occurs during the design process, the damage will be maximized [7]. Design modifications result in changes in production tools, templates and fixtures and additional costs in process and product redesign. FMEA is implemented before the design and process failure factor enters production to maximize work efficiency. Spending time and money on a complete and accurate implementation of FMEA allows for easy modifications during process or product design at a minimal cost. FMEA minimizes the problems associated with implementing such changes [8]. It is a systematic approach that identifies evident and hidden errors, deficiencies and failures in systems, products and processes then applies proper measures to eliminate these problems. Thus, FMEA can be utilized as a tool for the continuous improvement of the quality of products and services in companies.
The main purposes of applying the FMEA technique are to identify potential failure modes in system components, determine their causes, evaluate their effects on system performance, identify ways to reduce the possibility of their occurrence and alleviate consequences and increase the capability to detect failure modes [9]. Risk priority number (RPN) is used in the conventional FMEA technique to calculate the risk of various system failure modes. RPN is the product of three factors, namely, occurrence (O), severity (S) and detection (D) [10]. The higher RPN is, the higher the risk associated with the failure mode is. The purpose of RPN calculation is to prioritize failure modes. Despite the widespread use of FMEA, the technique has major drawbacks that limit its application, especially when used for critical analysis in the calculation of RPNs.
This paper presents a new score to improve the deficiencies of conventional RPNs. This score is obtained by developing an FMEA approach based on gray relational analysis (GRA) and stepwise weight assessment ratio analysis (SWARA) methods. The first section identifies the failure modes. In the second section, the SWARA method is used to determine the weights of RPN factors via the proposed approach to keep symmetrical property of their weights. In the third section, the GRA method is applied to consider the uncertainty in RPN factors and the unreliability in these values by using Z-number theory. Time (T) and cost (C) are considered in addition to S, O and D. In this approach, the identified failures are considered the decision-making alternatives and the SODCT factors weighted by SWARA are considered the criteria for evaluating these failures. The advantages of this theory over conventional fuzzy methods are as follows—it considers the uncertainty in experts’ opinions and allocates the credit in their opinions for estimating fuzzy parameters [11]. The following shows the contributions of this study:
  • Consideration of crucial management indices, such as cost and time, in the process of prioritizing risks with SOD factors
  • Assignation of different weights to risk factors according to the uncertainty of decision-makers’ preferences and the symmetric form of the weights with the aim of overcoming the deficiencies of traditional RPN score and making results more interpretable
  • Simultaneous consideration of the concepts of uncertainty (U) and reliability (R) in the processes of weighting risk factors and prioritizing failures by using Z-number theory
  • Complete prioritization of failures and distinction between failure ranks by using the SWARA–GRA integrated method based on -number theory.

2. Literature Review

This section reviews related literature. The first subsection presents a review of published studies that applied the FMEA technique and hybrid approaches (two or more techniques) based on this method. The second subsection examines GRA and SWARA methods and the research conducted using these methods.

2.1. Hybrid FMEA Approach

The development of multi-criteria decision making (MCDM) methods with the approaches for continuous risk assessment has resulted in the establishment of new quantitative and qualitative tools and methods [12,13,14]. Among the various techniques for risk assessment, FMEA is one of the most powerful ones in identifying defects. The simplicity and applicability of this technique make it suitable for use in different fields, such as solar energy, automotive, chemical, medical, pharmaceutical and food industries [15,16,17,18,19].
Despite the shortcomings of the FMEA technique, it is still considered one of the most widely used approaches for prioritizing failures. In this technique, failure prioritization is accomplished based on conventional RPN indices, which are a product of three factors, namely, O, S and D [20,21]. Numerous researchers, including Liu [9], attempted to combine this technique with MCDM approaches to resolve the disadvantages of conventional RPN indices. Braglia and Bevilacqua [22] combined the analytic hierarchy process with FMEA and prioritized the failure modes in a refrigerator company. Liu et al. [23] proposed a new risk prioritization model for risk assessment in FMEA on the basis of D-numbers and the improved GRA method and called the model GRP. Safari et al. [24] used the fuzzy VIKOR method to evaluate FMEA and facilitate the deployment of EA in an organization. Emovon et al. [25] proposed an improved FMEA model that uses the VIKOR technique to prioritize the risk of different failures in a marine machinery system. Liu [26] utilized a hybrid GRA-TOPSIS method for risk assessment in FMEA under uncertainty. The author showed that using this integrated approach is superior to other methods in risk assessment and prioritization. Ghoushchi, Yousefi and Khazaeili [5] used Z-MOORA and fuzzy BWM to prioritize and evaluate risks in the FMEA method. They utilized fuzzy BWM to calculate factor weights and the Z-MOORA method to analyze and prioritize failure risks. Table 1 presents several alternative hybrid approaches of the hybrid FMEA approach based on MCDM methods.

2.2. GRA Application

GRA is an MCDM method developed by Deng [47]. This decision-making technique is applied to solve various MCDM problems, such as employment decision-making [48], power distribution system reconstruction planning [49], integrated spiral process inspection [50], quality function modeling [51] and silicon wafer chip defect detection [52]. This method is also used to improve other decision-making methods, such as TOPSIS, VIKOR and ELECTRE, which use only positive and negative criteria to rank alternatives. Certain cases have neither positive nor negative criteria but they are presented as a number or a linguistic variable in the problem. The original GRA method translates the functions of all alternatives in a comparable order. This process is called the gray relation-generating step. Afterward, a set of ideal goals is defined in accordance with this sequence. Then, the gray correlation coefficient between all compatible and target sequences is calculated and the relative gray value between the ideal target and each comparable sequence is calculated based on these coefficients. The alternative with a high gray coefficient degree is selected [53]. The gray decision matrix comprises the following criteria—The larger, the better (positive criteria in TOPSIS and VIKOR techniques); The smaller, the better (negative criteria in TOPSIS and VIKOR techniques); The closer to the desired value, the better (not included in TOPSIS and VIKOR techniques) [53]. In fact, The GRA method distinguishes between different levels of criteria and can thus be used as a powerful decision-making method in MCDM issues. This method is adopted in the result analysis of this study because of its advantage over other decision-making methods, such as TOPSIS, VIKOR and ELECTRE. The GRA MCDM method has been applied to various problems. Among the studies conducted on the GRA method and solar energy data is the work of Kou et al. [54] on the optimization of the collection process of flat plates with multiple qualitative characteristics in the production of solar energy collectors. Acır et al. [55] identified the optimal parameters influencing the energy efficiency of solar air heaters by using the GRA method. Tiwari et al. [56] used GRA to examine the effects of four controllable parameters (fuel blend, boiling point, inlet temperature and bending point temperature) of a solar organic Rankine cycle on energy efficiency. Narendranathan et al. [57] applied GRA to optimize CI engine parameters.

2.3. SWARA

SWARA is an MCDM method that aims to calculate criterion and sub-criterion weights. The performance of this method in weighing criteria is similar to that of Best-Worst Method (BWM) and the linear programming technique for multidimensional analysis of preference (LINMAP) The linear programming technique for multidimensional analysis of preference (LINMAP) methods. This method was developed by Keršuliene et al. [58]. SWARA is generally used to solve various complicated MCDM problems, such as deciding on machinery tools [59], recruitment [60,61], corporate social responsibility and sustainability [62,63], product design [64], packaging design [65], logistics [66] and utilization of clean technology [67]. The most important criterion in this method is listed as number one and the least important one is listed as the last. Experts (respondents) have an important role in determining criterion weights. This method allows experts to estimate the importance ratio of criteria in the process of determining their weight. It is effective in collecting and coordinating data obtained from experts [68]. Experts also have an important role in assessing the calculated weights. Each expert identifies the importance of each criterion based on his or her tacit knowledge, information and experience. Then, the weight of each criterion is determined in accordance with the average value of group ratings obtained from the experts. Keršuliene, Zavadskas and Turskis [58] suggested using a group of experts and discussing their views as a group; meanwhile, a researcher takes notes, sums up the experts’ opinions and determines the relative weights of criteria by ranking them.
The SWARA method is used in determining criterion weights in this study because of this method’s capability to rank criteria and determine criterion weights. Research has been conducted on the SWARA method in consideration of solar energy systems. Ijadi Maghsoodi, Ijadi Maghsoodi, Mosavi, Rabczuk and Zavadskas [67] studied the selection of renewable energy technology by applying the SWARA method along with the multi-MOORA approach. Ghasempour et al. [69] employed the SWARA MCDM method in selecting solar cell manufacturers and production technology. Siksnelyte et al. [70] conducted a review of MCDM methods, including SWARA, in the context of sustainable energy development.

3. Methodology

3.1. Fuzzy Sets Theory

The fuzzy theory introduces the concept of membership function to discuss various linguistic variables [71]. There is a certain degree of uncertainty in terms of people’s thoughts, deduction and perception. Fuzzy set (fuzzy logic) works with the sources of uncertainty and imprecision which are vague and non-statistical, in nature. Basic definitions for the fuzzy numbers are provided below.
Definition 1.
A fuzzy set A , defined in reference X , is as Equation (1).
A ˜ = { ( x , μ A ˜ ( x ) ) | x X }
In Equation (1), μ A ˜ ( x ) : X [ 0 , 1 ] is the membership function of set A . Membership value μ A ( x ) shows the dependence degree x X at A . The degree of membership of each element like x R to the fuzzy set A ˜ , in the form of the degree of our acceptance or belief in accepting x, is defined as a member of the fuzzy set A ˜ or the degree of conformity of member x with the considered concept of set A ˜ .
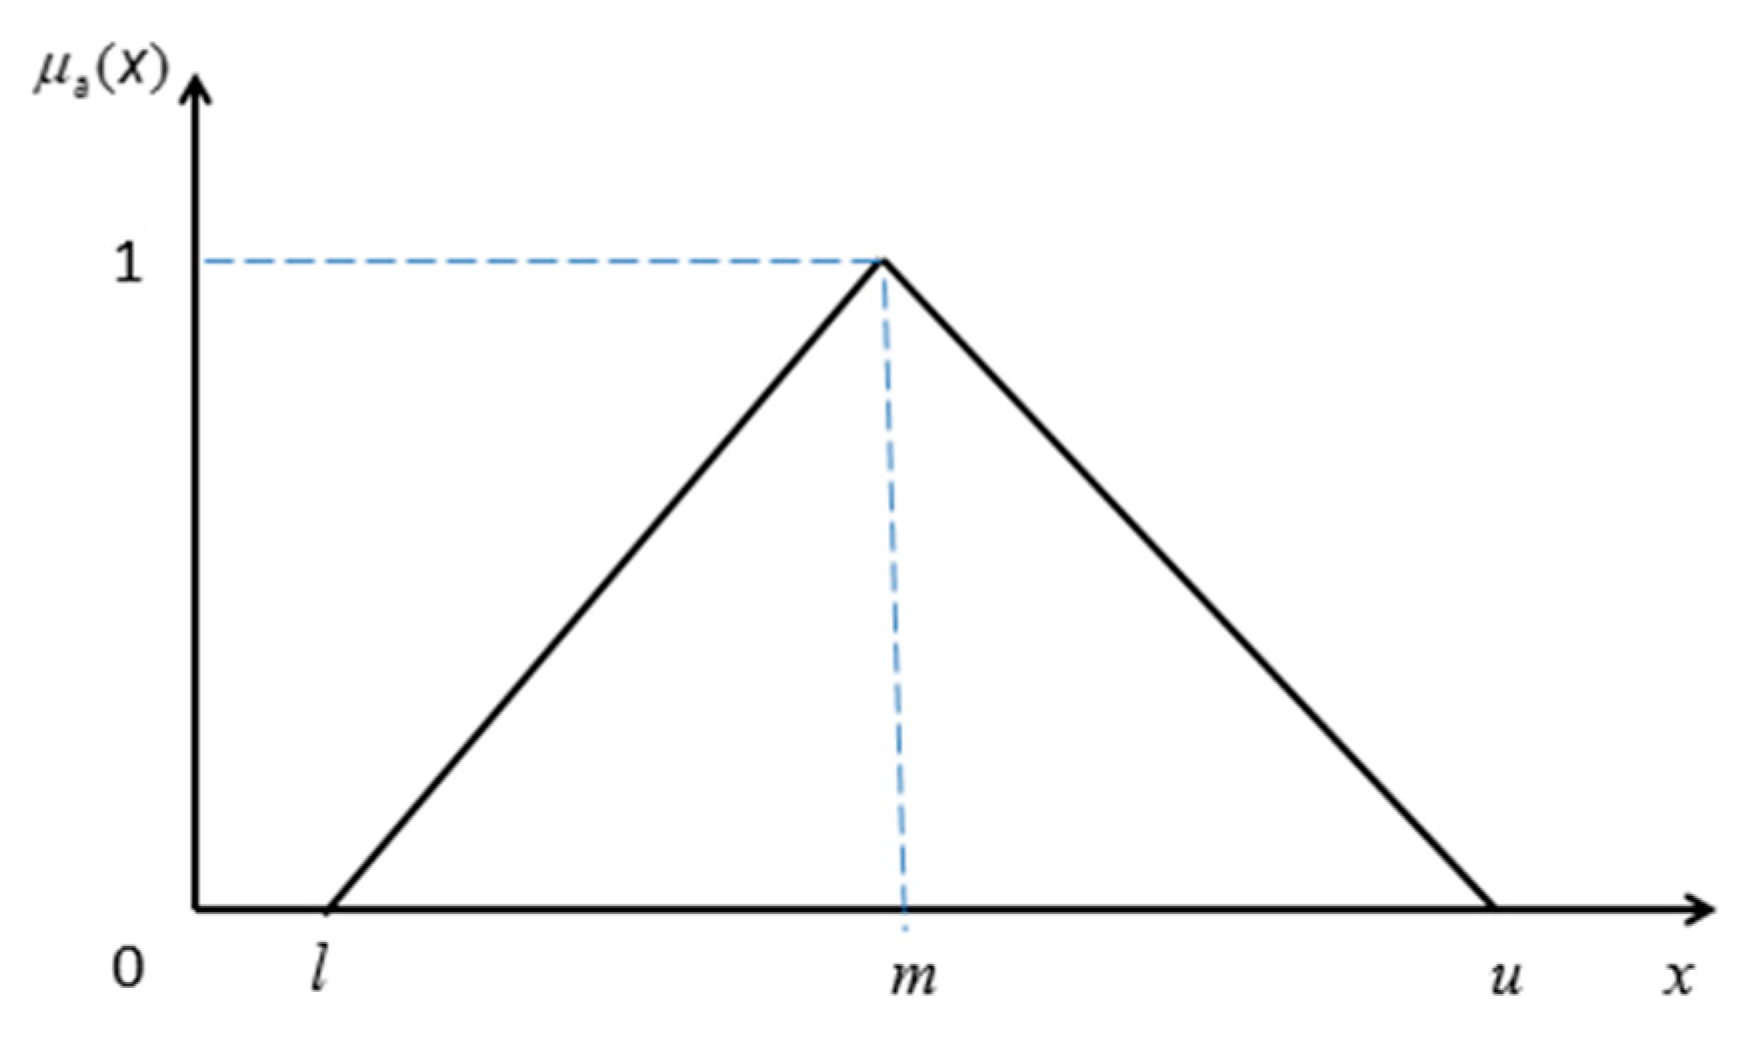
Definition 2.
A symmetric triangular fuzzy number A ˜ is represented as a triplex of ( l , m , u ) and the membership function is according to Equation (2) and the diagram is as in Figure 1.
{ 0                                             x < l x l m l                         l x m u x u m                         m x u 0                                                 x > u
Definition 3.
Assume that A ˜ = ( l 1 , m 1 , u 1 ) , B ˜ = ( l 2 , m 2 , u 2 ) are symmetric triangular fuzzy numbers. Math operations are done as follow:
A ˜ B ˜ = ( l 1 + l 2 , m 1 + m 2 , u 1 + u 2 )
A ˜ B ˜ = ( l 1 l 2 , m 1 m 2 , u 1 u 2 )
A ˜ B ˜ = ( l 1 u 2 , m 1 m 2 , u 1 l 2 )
A ˜ B ˜ = ( l 1 / u 2 , m 1 / m 2 , u 1 / l 2 )
λ A ˜ = λ ( l 1 , m 1 , u 1 ) = ( λ l 1 , λ m 1 , λ u 1 ) , λ > 0
Definition 4.
Assume that A ˜ = ( l 1 , m 1 , u 1 ) , B ˜ = ( l 2 , m 2 , u 2 ) are two positive triangular fuzzy numbers. The distance between A , B is defined as in Equation (8).
d ( A , B ) = ( ( l 1 l 2 ) 2 + ( m 1 m 2 ) 2 + ( u 1 u 2 ) 2 ) 3
Definition 5.
Assume that the triangular fuzzy number A ˜ is represented a triplex of ( l , m , u ) . Equation (9) is used to convert it into a crisp number according to the Best Non fuzzy Performance (BNP):
B N P ( A ˜ ) = ( u l ) + ( m l ) 3 + l

3.2. Z-Number Theory

Zadeh [11] defined a Z-number associated with an uncertain variable as an ordered pair of fuzzy numbers denoted as Z = ( A , B ) . A is a fuzzy constraint on values of X and B is defined as a partial reliability of a probability criterion of A . According to Kang, et al. [72], Z-number is to solve problems in controlling, decision making, modeling and other problems. This method is based on the conversion of a Z-number to a fuzzy number on the basis of the expectation of a fuzzy set. However, converting the Z-number to fuzzy numbers will lead to the loss of the original information. Aliev, et al. [73], Aliev, et al. [74], Aliev, et al. [75] presented an effective general and computational approach to calculate the Z-number.
Triple (X, A, B), known as Z-VALUATION, which is equivalent to an assignment statement and is defined as a general constraint on X as in Equation (10).
P r o b ( X   i s   A )   i s   B
This constraint is referred to as a probability restriction that shows a probability distribution function. In particular, it can be explained in Equation (11).
R ( X ) : X   i s poss ( X = u ) = μ A ( u )
where, μ A is the membership function of A and u is a generic value of X. μ A may be viewed as a constraint which is associated with R ( X ) . It means that how much the constraint that covers μ A ( u ) , can satisfy u. when, X is a random variable, the probability distribution of the X acts as the probabilistic restriction on X. Possible restriction and a probability density function are described in Equations (12) and (13):
R ( X ) : X   i s   p
R ( X ) : X   i s   p p r o b ( u X u + d u ) = p ( u ) d u
In Equation (13), d u shows the components of U derivations.

3.3. Z-SWARA

Keršuliene, Zavadskas and Turskis [58] proposed the step-wise weight assessment ratio analysis (SWARA) method for the first time.
Different factors, such as non-assessable information, incomplete information and non-accessible information cause uncertainty in decision-making. Since conventional MADM methods cannot solve problems with such ambiguous information, fuzzy multi-criteria decision-making methods have been developed because of ambiguity in evaluating the relative importance of criteria and ranking the alternatives according to the criteria. The process of determining the relative weight of criteria using Z-SWARA, like SWARA method, is as following steps:
Step 1. Sort the evaluation factors in descending order of expected importance.
Step 2. Switch Z-numbers linguistic variables to symmetric triangular fuzzy variables.
In this step, the verbal variables for factors, in the form of Z-Numbers, are transformed into triangular fuzzy verbal variables. The process of this transformation is as follows:
Assume that Z = ( A , B ) , which A is the verbal variable presented in Table 2 and B is the verbal variable presented in Table 3 and assume that, A ˜ = { ( x , μ A ˜ ( x ) ) | x [ 0 , 1 ] } and B ˜ = { ( x , μ B ˜ ( x ) ) | x [ 0 , 1 ] } are triangular membership functions. According to Equations (14) and (15), reliability of Z-Number is transferred to crisp number
α = x μ B ˜ ( x ) d x μ B ˜ ( x ) d x
Z ˜ α = { ( X , μ A ˜ α ) | μ A ˜ α ( x ) = α μ A ˜ α , X [ 0 , 1 ] }
In these Equations, α expresses the weight of reliability, μ B ˜ α ( x ) indicates the degree of dependence x X in B and μ A ˜ α ( x ) indicates the degree of dependence x X in A α . Then, by combining the Linguistics variable for evaluating the factors (see Table 2) and the Transformation rules of linguistics variables of reliability (see Table 3), the roles of transforming verbal variables of decision makers, used for maintaining the symmetry of the response, are obtained for the Z-SWARA method.
For instance, assume that Z = ( A , B ) , which is A ˜ = ( M O L ) and R ˜ = ( H ) , so it is described as Z = [ ( 2 3 , 1 , 3 2 ) , ( 0.50 , 0.65 , 0.80 ) ] . Firstly, reliability component of Z-Number converts to a crisp number by using Equations (14) and (15). According to Equation (15), the value of α is 0.5, then, this value is used in Equation (14) Z ˜ α = ( 2 3 , 1 , 3 2 ; 0.65 ) . Now, the Z-number weight is converted to the triangular fuzzy number using Equation (15) Z ˜ = ( 2 3 0.65 , 1 0.65 , 3 2 0.65 ) = ( 0.54 , 0.81 , 1.21 ) . Other conversions are presented in Table 4 according to Table 2 and Table 3.
Step 3. According to Table 4, state the relative importance of the factor j in relation to the previous factor ( j 1 ) according by z-number, which has higher importance and follow to the last factor. After determining all relative importance scores by all experts, the geometric mean of the corresponding scores is obtained, to aggregate their judgments.
Step 4. Obtain the coefficient k ˜ j as (16):
k ˜ j = { 1 ˜                     j = 1 s ˜ j + 1 ˜ j > 1
Step 5. Calculate the fuzzy weight q ˜ j as (17):
q ˜ j = { i ˜           j = 1 x ˜ j 1 k ˜ j j > 1
Step 6. Calculate the relative weights of the evaluation criteria as (18):
W ˜ j = q ˜ j k = 1 n q ˜ k
where W ˜ j = ( w j l , w j m , w j u ) is the relative fuzzy weight of j , the criterion and n shows the number of evaluation criteria.

3.4. Z-GRA

Z-GRA approach, is described as follow steps:
Step 1: Decision-making matrix with Z-Number elements is indicated as a matrix, where m and n , respectively, show the number of alternatives and criteria. Also, x i j and y i j , respectively, indicate the value of the i th criterion for the j th alternative and the i th reliability for the jth alternative.
Z ˜ = [ [ ( x 11 l , x 11 m , x 11 u ) , ( y 11 l , y 11 m , y 11 u ) ] [ ( x 12 l , x 12 m , x 12 u ) , ( y 12 l , y 12 m , y 12 u ) ] [ ( x 1 n l , x 1 n m , x 1 n u ) , ( y 1 n l , y 1 n m , y 1 n u ) ] [ ( x m 1 l , x m 1 m , x m 1 u ) , ( y m 1 l , y m 1 m , y m 1 u ) ] [ ( x m 2 l , x m 2 m , x m 2 u ) , ( y m 2 l , y m 2 m , y m 2 u ) ] [ ( x m n l , x m n m , x m n u ) , ( y m n l , y m n m , y m n u ) ] ]
Step 2: Switch Z-numbers linguistic variables to symmetric triangular fuzzy variables.
The elements of above matrix are converted into symmetric triangular fuzzy numbers and a decision-making matrix is obtained with elements of symmetric triangular fuzzy numbers.
Assume that Z = ( A , B ) where A ˜ = { ( x , μ A ˜ ( x ) ) | x [ 0 , 1 ] } and B ˜ = { ( x , μ B ˜ ( x ) ) | x [ 0 , 1 ] } are triangular membership functions. Equations (20) and (21) show their transformation to the crisp numbers.
α = x μ B ˜ ( x ) d x μ B ˜ ( x ) d x
Z ˜ α = { ( X , μ A ˜ α ) | μ A ˜ α ( x ) = α μ A ˜ α , X [ 0 , 1 ] }
In the Equations above, α represents the reliability weight, μ B ˜ ( x ) indicates the dependence degree of x X in B and μ A ˜ α ( x ) indicates the dependence degree of x X in A α .
Then, by combining linguistic variables presented in Table 5 and the rules of converting linguistic variables, the components of conversion of linguistic variables by decision makers’ for Z-GRA method are obtained. For example, assume that Z = ( A , B ) where A ˜ = ( M H ) and the R ˜ = ( M ) , then it is converted to Z = [ ( 5 , 7 , 9 ) , ( 0.35 , 0.50 , 0.65 ) ] . According to Equations (20) and (21), Z ˜ α = ( 5 0.5 , 7 0.5 , 9 0.5 ) = ( 3.54 , 4.95 , 6.36 ) . According to the Table 5 and Table 6, other conversions are brought in Table 7.
Step 3: in this step, the decision-making matrix with symmetric triangular fuzzy numbers is formed and it is normalized. In this matrix, d m n demonstrates the value that the alternative takes in n criteria and m alternative (performance measurement).
D ˜ = [ ( d 11 l , d 11 m , d 11 n ) ( d 12 l , d 12 m , d 12 n ) ( d 1 n l , d 1 n m , d 1 n n ) ( d m 1 l , d m 1 m , d m 1 n ) ( d m 2 l , d m 2 m , d m 2 n ) ( d m n l , d m n m , d m n n ) ]
Step 4: In this step, fuzzy GRA works as follows:
Decision matrix (22) is converted into the normalized decision matrix ̃. Given ̃ (23), the normalized performance rating can be calculated as (Gumus et al., 2013; Zhang and Liu, 2011):
d ˜ i j = ( d i j l d j + , d i j m d j + , d i j u d j + )   a n d   i j :   i = 1 , 2 , ... m ,   j = 1 , 2 , ... n d j + = max i { d i j }   i     i = 1 , 2 , ... m

3.5. Proposed Approach

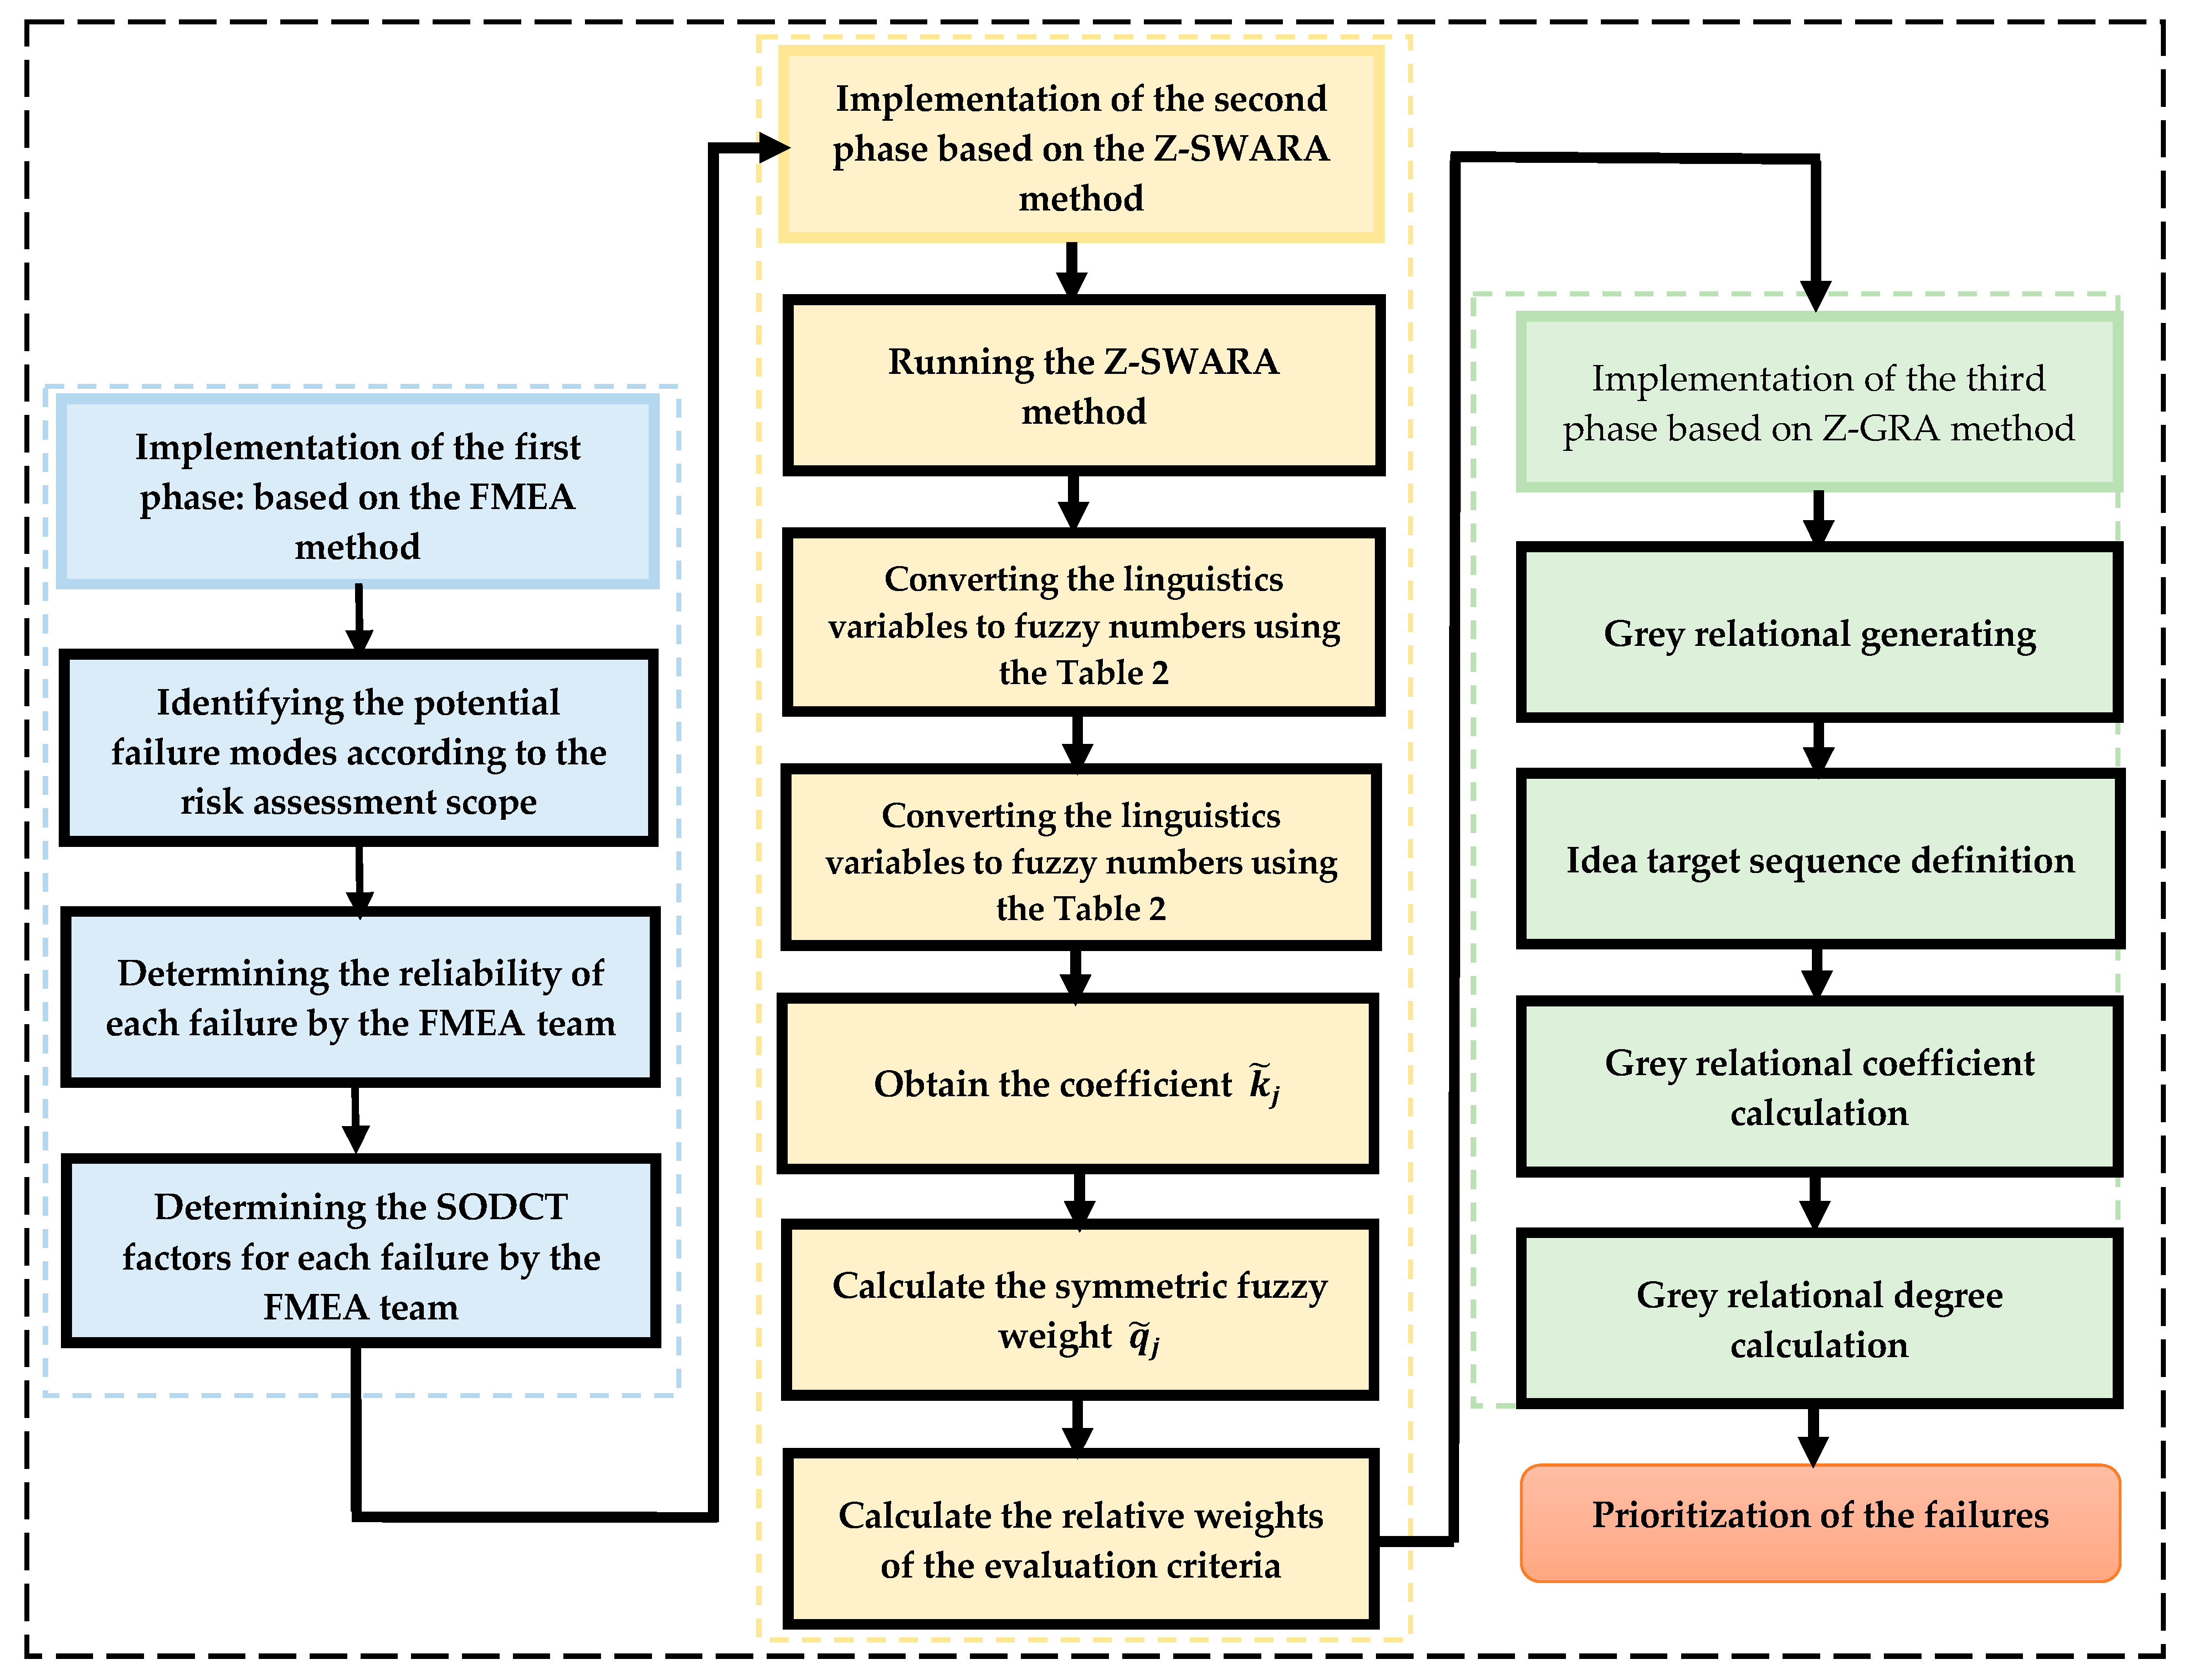
A combination of FMEA, Z-SWARA and Z-GRA is used to evaluate and prioritize failure modes in this study. In the first phase of the research method, the failure modes and reliability of each of mode are determined by the FMEA team. In the second phase, the failure modes are weighted in the symmetric form and the criteria are ranked by decision makers (DMs) via the Z-SWARA method. In the third phase, the primary matrix Z-GRA is formed in consideration of the failure modes identified in the first phase and the final symmetric weights assigned in the second phase of the study. Figure 2 shows the steps in prioritizing the FMs of solar panels.

4. Analysis of the Results

In accordance with the methodology of this study, 19 failures of solar panels are detected using FMEA and the factor values for each failure are determined by the team. Z-number theory is used to convert uncertain data into fuzzy numbers because of the uncertainty in the factors. The uncertainty in the factors and their reliability values are considered. The Z-number values obtained from the conversion of linguistic numbers based on the team’s opinion are indicated in Table 8.
Then, in the second phase of the research method and also according to the SWARA method expressed, the values of coefficient k and the weight of q and w are calculated on the basis of Equations (16) to (18) for each decision-maker in examining the failures of solar panels as in table (10). In this step, the linguistic variables are converted into triangular fuzzy numbers, based on the Equations shown in Table 2 and Table 3. For example, the fuzzy numbers corresponding to the linguistic variable MOL-M are ( 0.47 , 0.71 , 1.06 ) , respectively. After the conversion of linguistic variables into fuzzy numbers, the coefficient k j from Equation (16), the fuzzy weight q j from Equation (17) and the final weight of the factors in the form of fuzzy numbers w j from Equation (18) are obtained. Final symmetric fuzzy weight of main criteria by each decision maker shown in Table 9.
Table 10 shows the average of the final symmetric weight, obtained from all the opinions of decision-makers for evaluating and prioritizing the risk of failures in FMEA method. This table consists of the average weight W for each factor of FMEA in all decision-makers’ opinions.
According to Table 10, the final symmetric weight, obtained in the form of triangular fuzzy numbers, is for each failure factor in FMEA method. The final factor weight for factors are calculated as w s = ( 0.278 , 0.332 , 0.403 ) , w c = ( 0.221 , 0.278 , 0.354 ) , w d = ( 0.103 , 0.157 , 0.230 ) , w o = ( 0.077 , 0.121 , 0.182 ) and w t = ( 0.069 , 0.111 , 0.169 ) , respectively. Then the failure modes are prioritized, using the developed Z-GRA method.
Table 11 shows the decision-making matrix Z-GRA in the form of Z-number elements for failure factors of FMEA. The lines in Table 12 show the failure modes identified in the first phase of the research method by the team.
After the normalization of the primary matrix presented in Table 11, the normalized weighted matrix, considering the weights of the factor used in FMEA method, is obtained for all the failure modes as in Table 12.
Now, after normalizing the final symmetric weights, the identified failures are prioritized based on the Z-GRA approach and also a comparison between the outputs of this approach and conventional methods such as Fuzzy GRA and traditional RPN has been presented in Table 13.
Table 13 implies that failures FM2 with a score of 18,144, FM3 with a score of 11,200 and FM8 and FM15 with a score of 7840 are ranked from 1 to 3, respectively. Consideration of the different weights of risk factors (SODET) demonstrates that although failure FM8 with the FGRA approach ranks fifth, it ranks third based on traditional RPN indices. This change indicates the application of the weights of risk factors in the process of prioritizing failures.
FM2 with a score of 0.815, FM3 with a score of 0.799 and FM15 with a score of 0.797 are ranked from 1 to 3 based on fuzzy GRA, respectively. The fuzzy GRA index has a more substantial impact on distinguishing priorities (complete prioritization of failures) compared with the RPN indices.
On the basis of the Z-GRA approach, FM15 with a score of 0.781, FM2 with a score of 0.773 and FM3 with a score of 0.753 are ranked from 1 to 3, respectively. Further investigation of this index shows that the recommended approach not only considers uncertainty and reliability simultaneously in the processes of prioritizing failures and assigning different weights to risk factors but can also prioritize the failures completely and assign distinct ranks to each risk properly.
A simultaneous comparison of critical failures in the two approaches of Z-GRA and traditional RPN shows that although failures FM8 and FM15 share the third rank based on the RPN indices, they have distinct ranks of seventh and first, respectively, based on the suggested approach. The reason for the lower rank of FM8 compared with that of FM15 is the difference in the values of symmetric weights assigned to the risk factors. For example, FM15, which is ranked first based on the Z-GRA approach, assigns large values to crucial risk factors, such as cost and detection (Table 11).
C F M 15 = ( 4.177 , 5.807 , 7.127 ) > C F M 8 = ( 2.35 , 3.923 , 5.490 ) D F M 15 = ( 4.240 , 5.873 , 7.197 ) > C F M 8 = ( 2.287 , 3.767 , 5.250 )
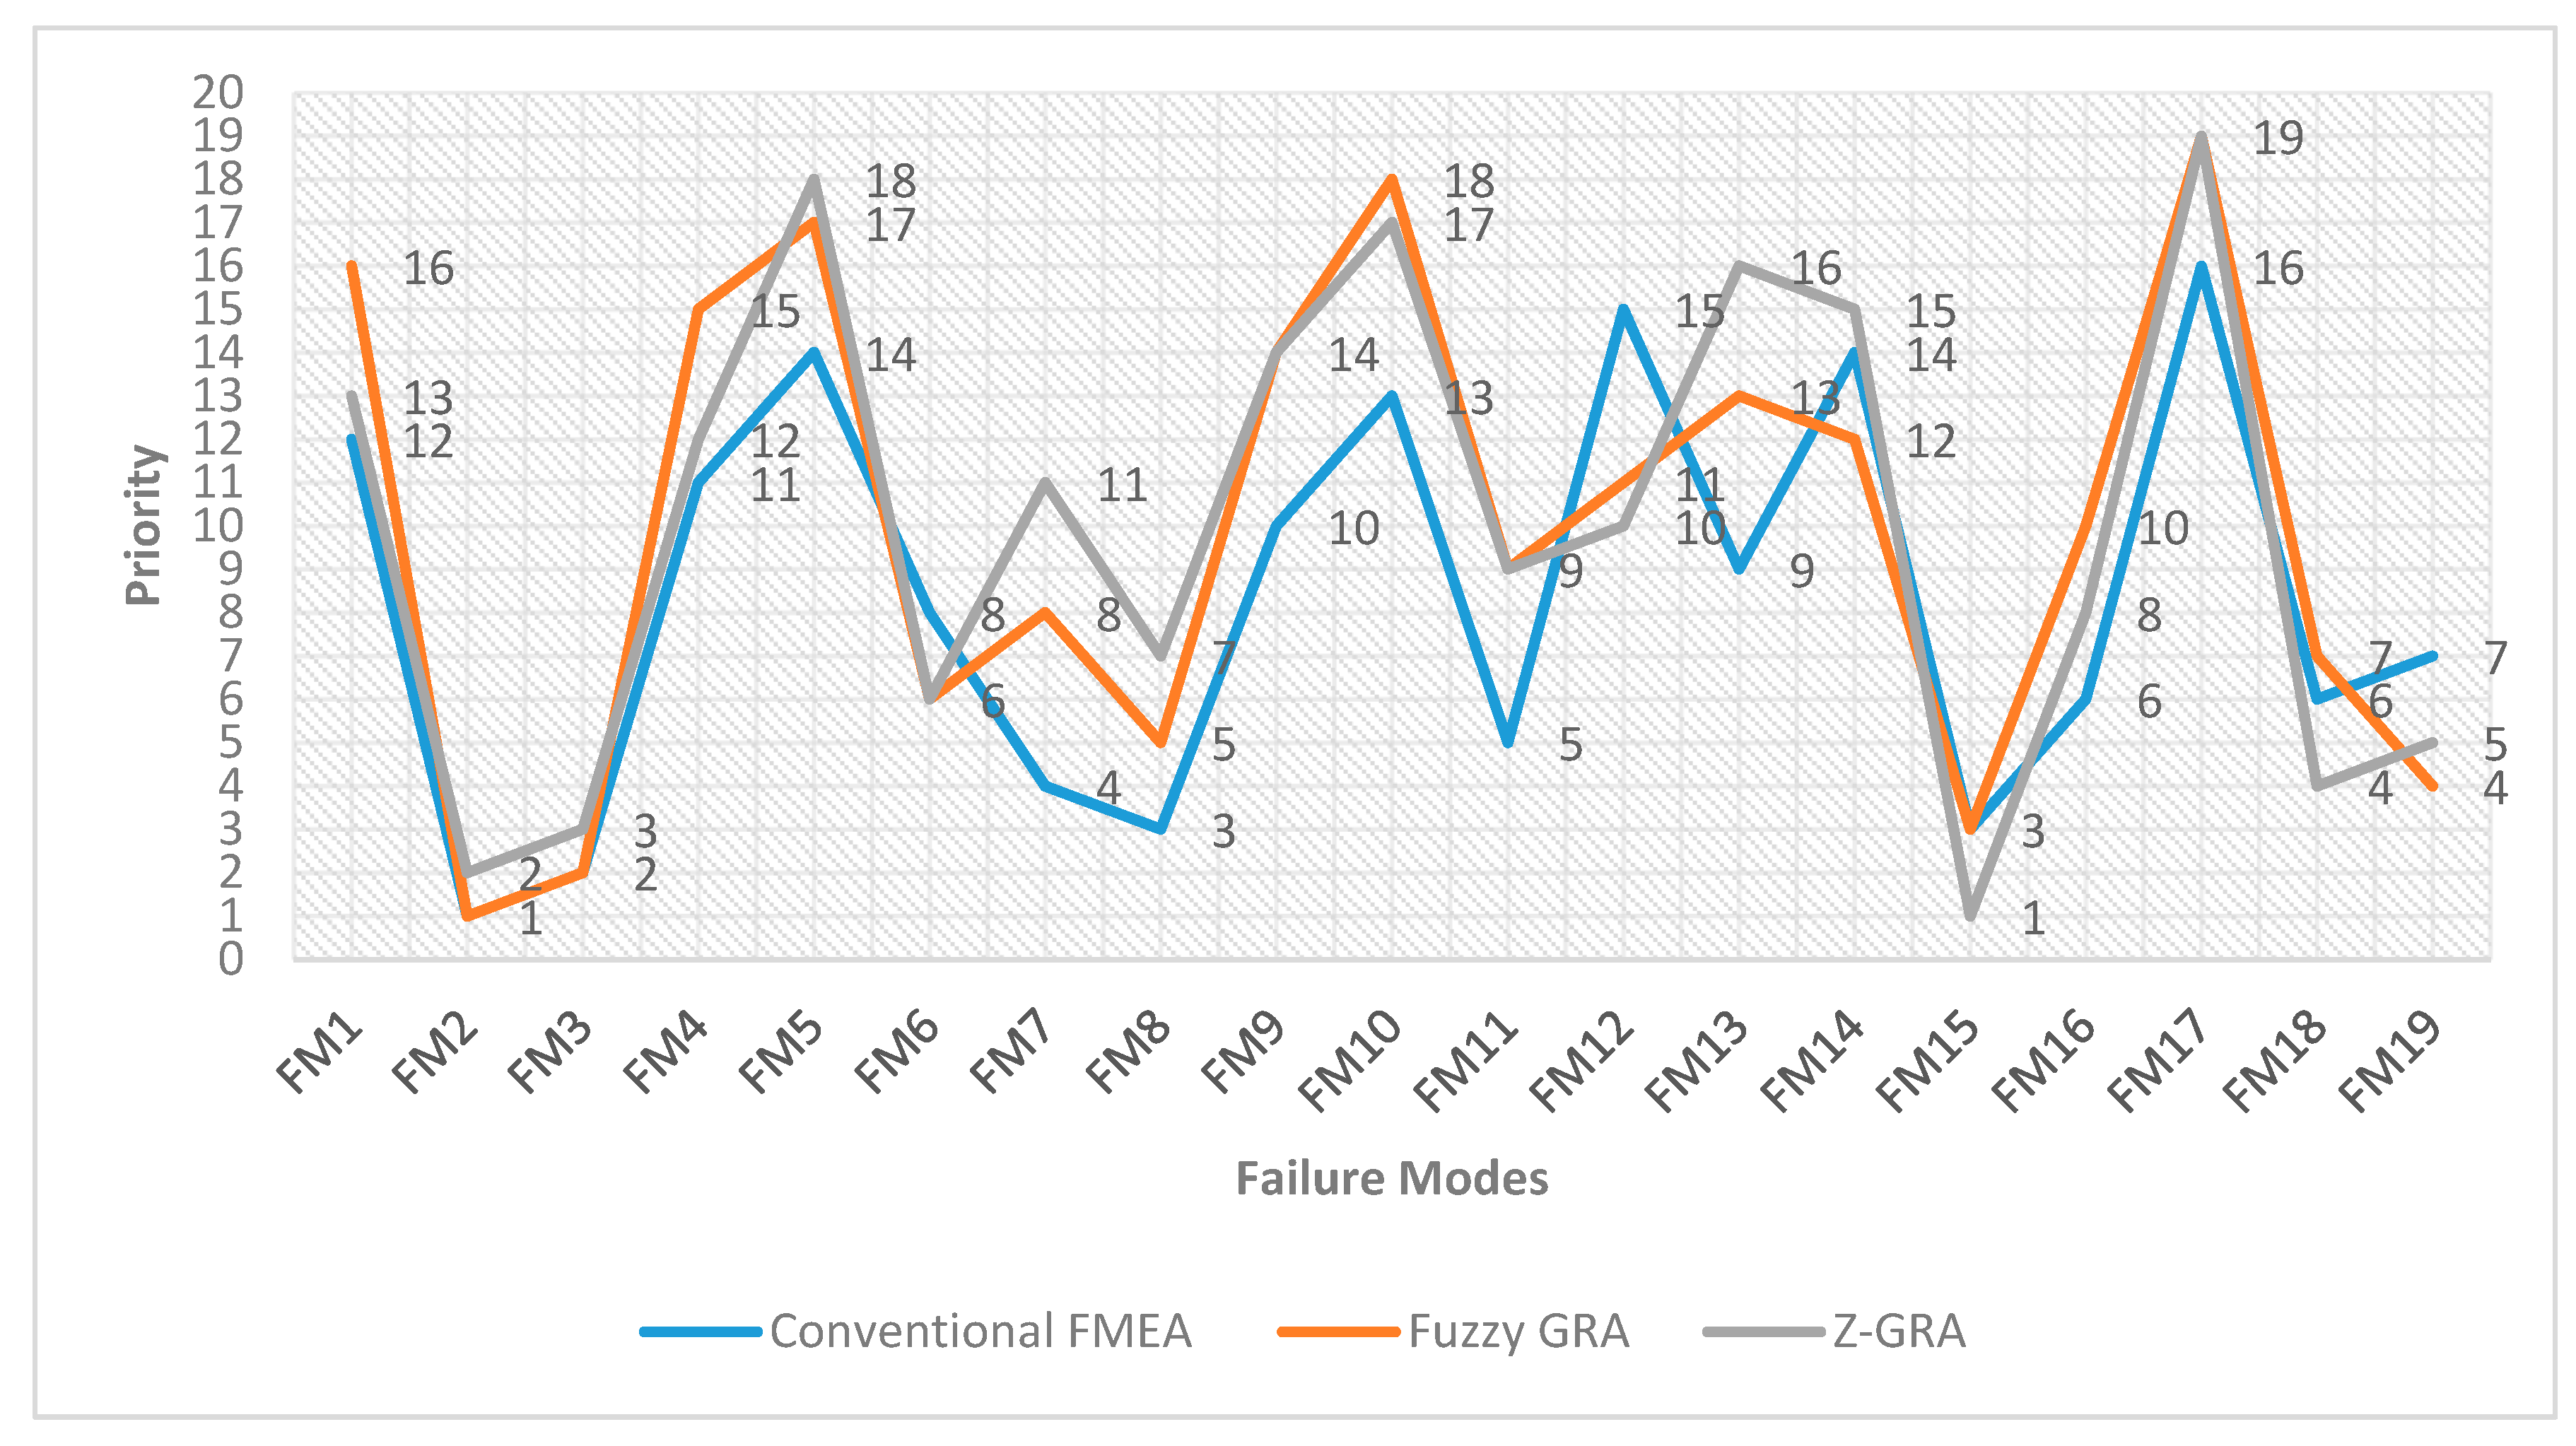
Figure 3 shows the resolution of ranks assigned to failures based on traditional FMEA, fuzzy GRA and Z-GRA methods. The conventional FMEA performs an incomplete prioritization of failures by placing 19 risks in 15 categories. By contrast, fuzzy GRA and Z-GRA conduct a complete prioritization by assigning distinct ranks to identified failures. The advantage of this ranking over incomplete prioritization is that it can increase the ability of DMs to discern critical failures and plan corrective actions in accordance with the limitations of sources. Although, the fuzzy GRA method provides DMs with a complete ranking, reliability is disregarded in this ranking. Consequently, the results of the Z-GRA method are more coincident with the FMEA team’s opinion compared with those of the fuzzy GRA method.

5. Sensitivity Analysis

Sensitivity is calculated with the risk factor weights in accordance with the information in 
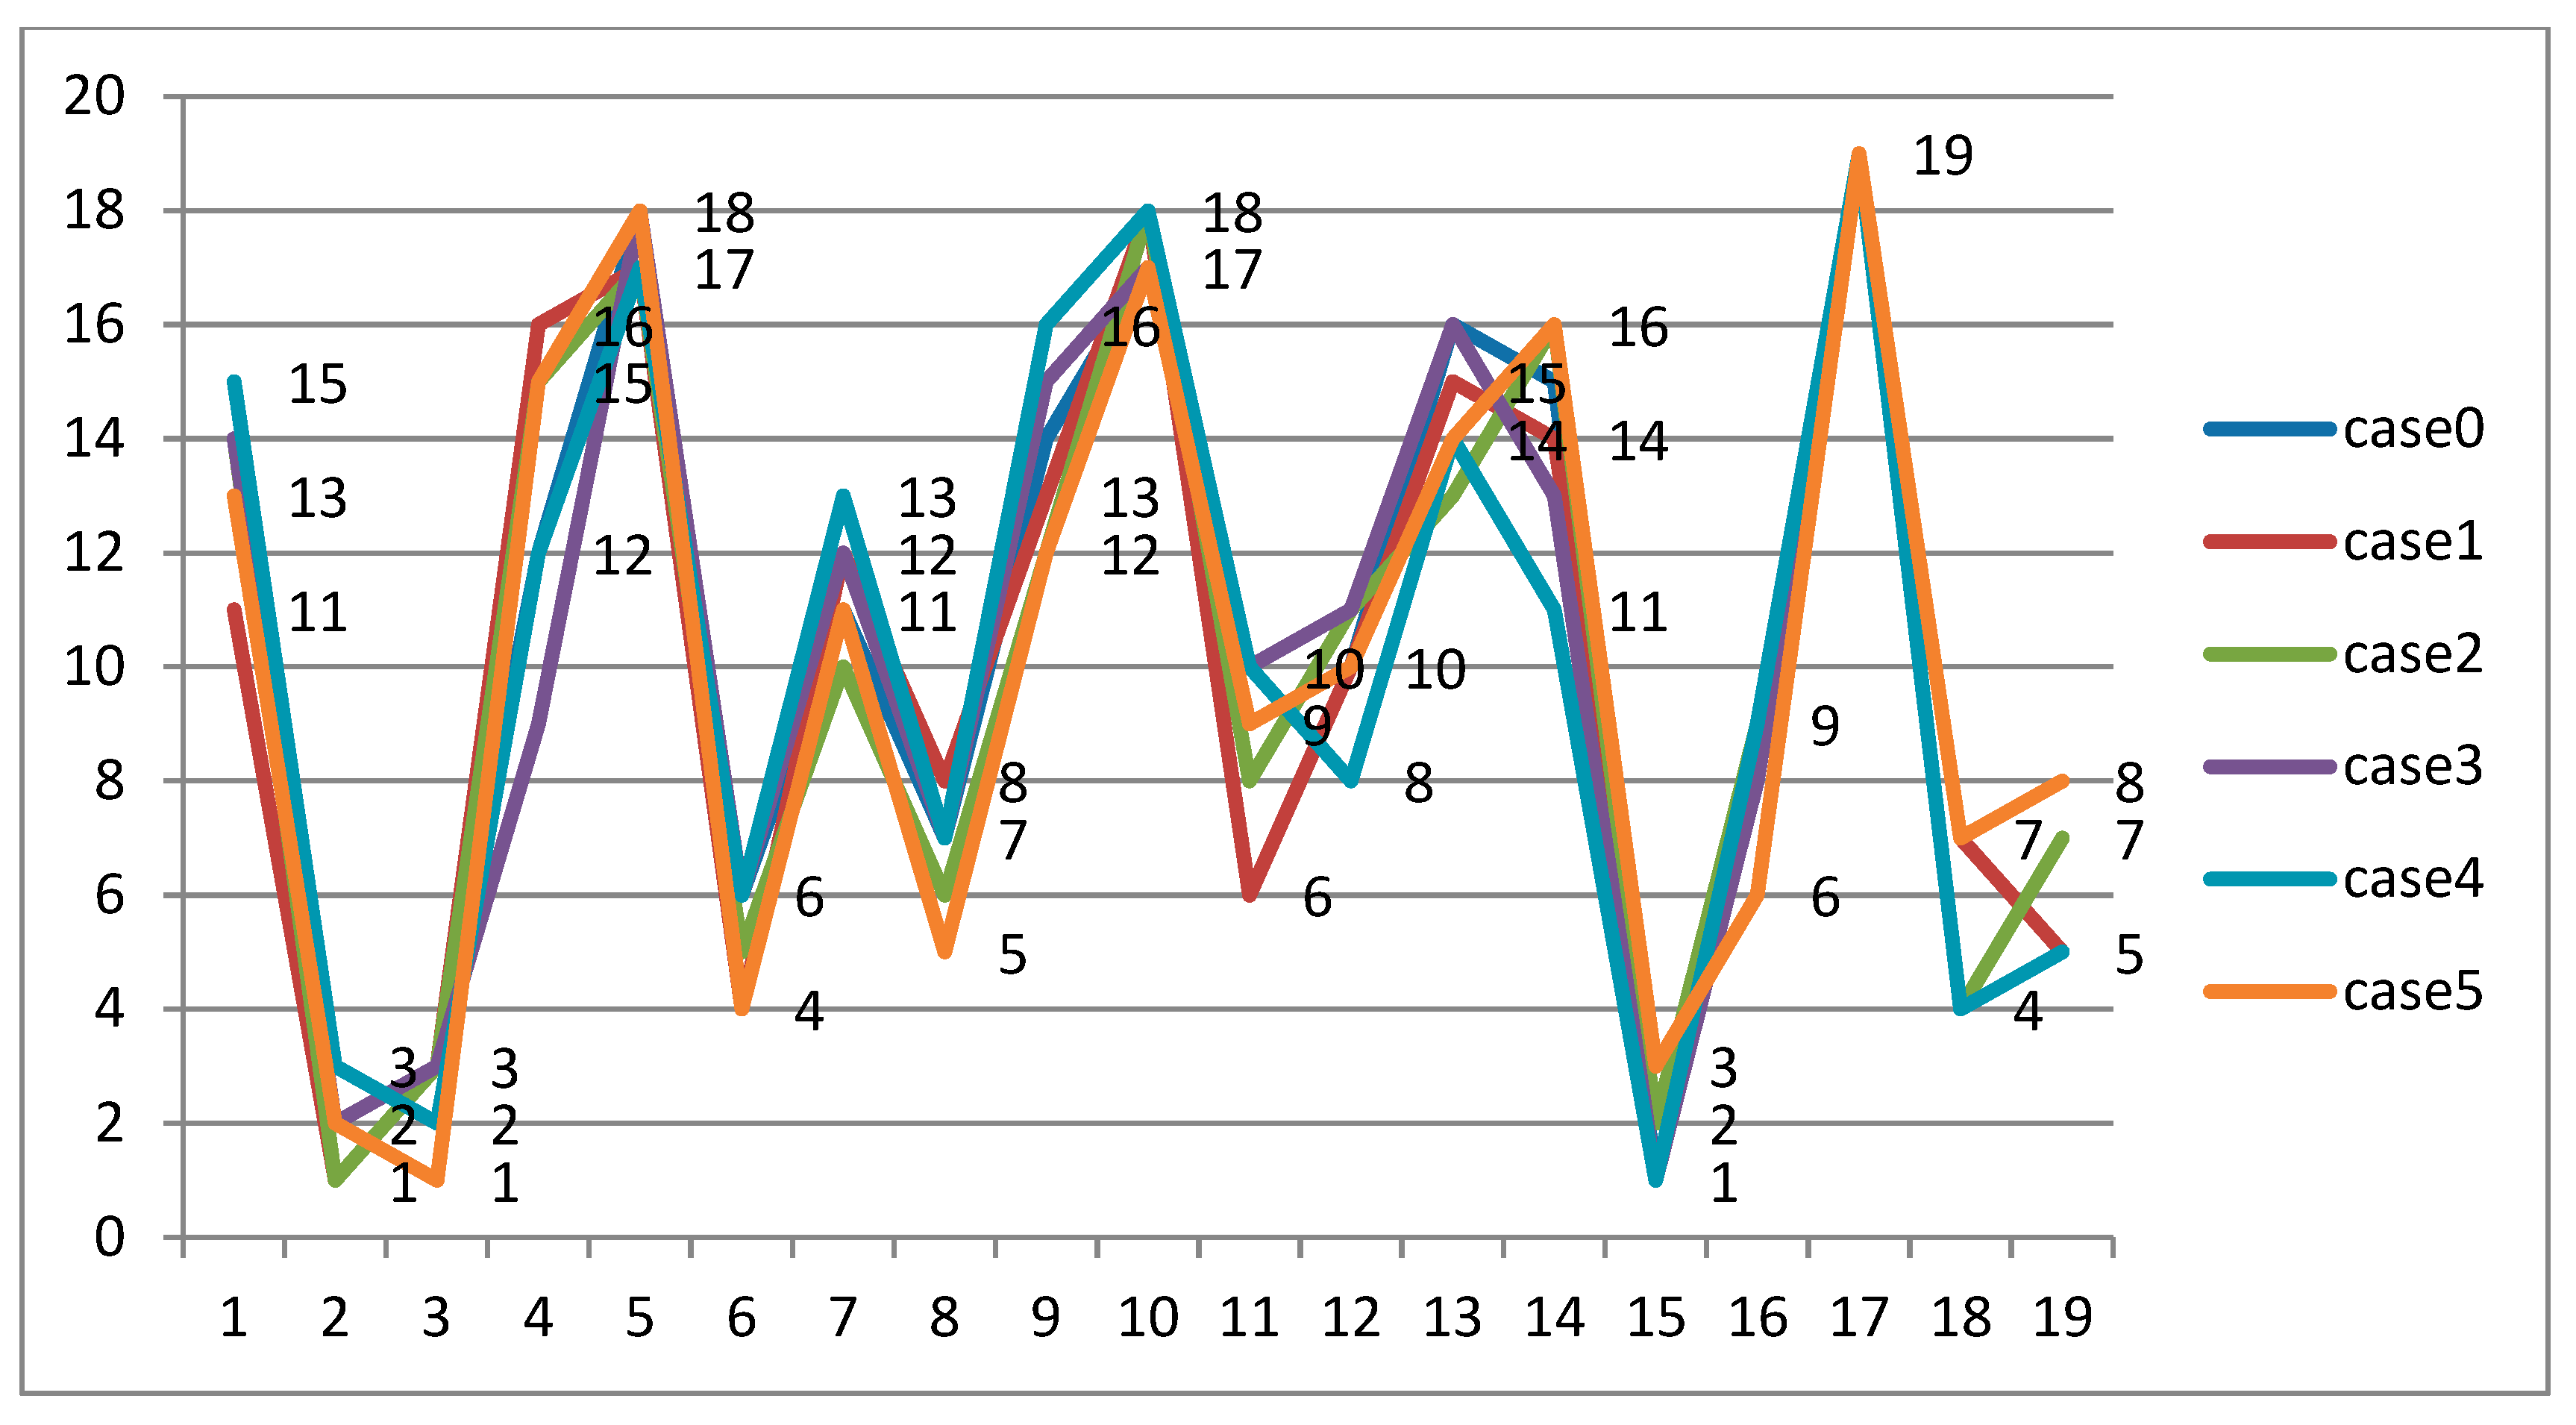
Table 14. For example, the original weight values of the risk factors are shown in Case 0. In Case 1, 0.1 is added to the weight of S and 0.025 is deducted from the weight of O, D, C and T. Similarly, 0.1 is added to the weight of O in Case 2, to the weight of D in Case 3, to the weight of C in case 4 and to the weight of T in Case 5; meanwhile, 0.025 is deducted from the initial weight of the others. The results of the rating sensitivity analysis of solar panels are shown in Table 15 and Figure 4. In Case 1, by increasing the weight of S, FM2 (Dust) is upgraded from the second position to the first position, whereas FM15 (Wiring) is downgraded from the first position to the second position. In Case 2, by increasing the weight of O, FM2 (Dust) is upgraded from the second position to the first position, whereas FM15 (Wiring) is downgraded from the first position to the second position. In Case 4, by increasing the weight of C, FM2 (Dust) is downgraded from the second position to the third position. In Case 5, by increasing the weight of T, FM15 (Wiring) is downgraded from the first position to the third position. FM3 (Orientation) is upgraded from the third position to the first one. In all cases, FM17 (Labeling and warning signs) is selected as the last failure mode.

6. Conclusions

The FMEA technique is widely used in various fields but it has deficiencies and limitations, which have pushed researchers to improve the technique. In this study, an FMEA approach is developed using Z-SWARA and Z-GRA. A new approach is recommended to address several of the defects of conventional RPN. After identifying failures via the FMEA technique, the Z-SWARA method is used to weigh RPN determining factors because not considering the symmetric weights of these factors is one of the disadvantages of conventional RPN indices. Applying the Z-GRA method also helps DMs incorporate uncertainty into the determinants of RPN and consider reliability in failure modes in accordance with Z-number theory. Under this condition, prioritization is close to reality because reliability is considered, and a complete prioritization is provided. DMs can thus execute a set of precautionary actions for important failures and re-evaluate the new system condition and the effectiveness of these actions. In general, wiring should be examined and dust should be removed from solar panels. The orientation of panels should be set and sensors and boxes or conduit bodies must be arranged properly; the other components can be controlled based on the prioritization obtained. In the case of failure, the quality control department or laboratory should be informed for repairs. In future studies, the prioritization of failure modes can be evaluated using the G-number.

Author Contributions

Conceptualization, M.N.A.R. and M.J.G.; Data curation, D.R. and M.J.G.; Formal analysis, E.O. and M.J.G.; Funding acquisition, M.N.A.R.; Methodology, E.O., M.N.A.R., D.R. and S.J.G.; Software, S.J.G.; Supervision, E.O., M.N.A.R. and S.J.G.; Validation, E.O., M.N.A.R. and D.R.; Visualization, D.R.; Writing—original draft, S.J.G.; Writing—review & editing, M.J.G. and M.N.A.R. All authors have read and agree to the published version of the manuscript.

Funding

The authors also greatly appreciate the support of the Universiti Kebangsaan Malaysia, Malaysia under grant No. FRGS/2/2014/TK01/UKM/02/2 and FRGS/1/2018/TK08/UKM/02/1 for financing this research.

Acknowledgments

The authors wish to express their sincere thanks to the academic editor and reviewers for their detailed comments and many valuable suggestions that have significantly improved the quality of this paper.

Conflicts of Interest

The authors declare no conflict of interest.

References

  1. Jafarzadeh, S.G.; Ab Rahman, M.N.; Wahab, D.A. Forecasting capabilities of spare part production with artificial neural networks model in a supply chain. World Appl. Sci. J. 2012, 20, 674–678. [Google Scholar]
  2. Jafarzadeh-Ghoushchi, S.; Ab Rahman, M.N. Performance study of artificial neural network modelling to predict carried weight in the transportation system. Int. J. Logist. Syst. Manag. 2016, 24, 200–212. [Google Scholar] [CrossRef]
  3. Jainury, S.M.; Ramli, R.; Ab Rahman, M.N.; Omar, A. Integrated Set Parts Supply system in a mixed-model assembly line. Comput. Ind. Eng. 2014, 75, 266–273. [Google Scholar] [CrossRef]
  4. Rose, A.N.M.; Deros, B.M.; Ab Rahman, M.N. Critical success factors for implementing lean manufacturing in Malaysian automotive industry. Res. J. Appl. Sci. Eng. Technol. 2014, 8, 1191–1200. [Google Scholar] [CrossRef]
  5. Ghoushchi, S.J.; Yousefi, S.; Khazaeili, M. An extended FMEA approach based on the Z-MOORA and fuzzy BWM for prioritization of failures. Appl. Soft Comput. 2019, 81, 105505. [Google Scholar] [CrossRef]
  6. Bowles, J.B.; Peláez, C.E. Fuzzy logic prioritization of failures in a system failure mode, effects and criticality analysis. Reliab. Eng. Syst. Saf. 1995, 50, 203–213. [Google Scholar] [CrossRef]
  7. Rezaee, M.J.; Yousefi, S.; Eshkevari, M.; Valipour, M.; Saberi, M. Risk analysis of health, safety and environment in chemical industry integrating linguistic FMEA, fuzzy inference system and fuzzy DEA. Stoch. Environ. Res. Risk Assess. 2020, 34, 201–218. [Google Scholar] [CrossRef]
  8. Rezaee, M.J.; Salimi, A.; Yousefi, S. Identifying and managing failures in stone processing industry using cost-based FMEA. Int. J. Adv. Manuf. Technol. 2017, 88, 3329–3342. [Google Scholar] [CrossRef]
  9. Liu, H.-C. FMEA Using Uncertainty Theories and MCDM Methods. In FMEA Using Uncertainty Theories and MCDM Methods; Springer: Berlin/Heidelberg, Germany, 2016; pp. 13–27. [Google Scholar]
  10. Rezaee, M.J.; Yousefi, S.; Valipour, M.; Dehdar, M.M. Risk analysis of sequential processes in food industry integrating multi-stage fuzzy cognitive map and process failure mode and effects analysis. Comput. Ind. Eng. 2018, 123, 325–337. [Google Scholar] [CrossRef]
  11. Zadeh, L.A. A note on Z-numbers. Inf. Sci. 2011, 181, 2923–2932. [Google Scholar] [CrossRef]
  12. Jafarzadeh Ghoushchi, S.; Khazaeili, M.; Sabri-Laghaie, K. An extended Multi-Criteria Green Supplier Selection based on Z-Numbers for Fuzzy Multi-Objective Linear Programming Problem. Int. J. Ind. Eng. Manag. Sci. 2019, 6, 74–96. [Google Scholar]
  13. Jafarzadeh Ghoushchi, S.; Khazaeili, M.; Amini, A.; Osgooei, E. Multi-criteria sustainable supplier selection using piecewise linear value function and fuzzy best-worst method. J. Intell. Fuzzy Syst. 2019, 37, 2309–2325. [Google Scholar] [CrossRef]
  14. Mardani, A.; Jusoh, A.; Zavadskas, E.K. Fuzzy multiple criteria decision-making techniques and applications–Two decades review from 1994 to 2014. Expert Syst. Appl. 2015, 42, 4126–4148. [Google Scholar] [CrossRef]
  15. Mustaffa, N.F.; Hishamuddin, H.; Ropi, N.M.; Saibani, N.; Ab Rahman, M.N. Assessing Supply Chain Risk Management Practices in Manufacturing Industries in Malaysia. J. Kejuruter. 2018, 6, 17–22. [Google Scholar]
  16. Baghery, M.; Yousefi, S.; Rezaee, M.J. Risk measurement and prioritization of auto parts manufacturing processes based on process failure analysis, interval data envelopment analysis and grey relational analysis. J. Intell. Manuf. 2018, 29, 1803–1825. [Google Scholar] [CrossRef]
  17. Yousefi, S.; Alizadeh, A.; Hayati, J.; Baghery, M. HSE risk prioritization using robust DEA-FMEA approach with undesirable outputs: A study of automotive parts industry in Iran. Saf. Sci. 2018, 102, 144–158. [Google Scholar] [CrossRef]
  18. Leuveano, R.A.C.; Ab Rahman, M.N.; Mahmood, W.M.F.W.; Saleh, C. Integrated Vendor–Buyer Lot-Sizing Model with Transportation and Quality Improvement Consideration under Just-in-Time Problem. Mathematics 2019, 7, 944. [Google Scholar] [CrossRef] [Green Version]
  19. Ab Rahman, M.N.; Doroodian, M.; Kamarulzaman, Y.; Muhamad, N. Designing and validating a model for measuring sustainability of overall innovation capability of small and medium-sized enterprises. Sustainability 2015, 7, 537–562. [Google Scholar] [CrossRef] [Green Version]
  20. Mandal, S.; Maiti, J. Risk analysis using FMEA: Fuzzy similarity value and possibility theory based approach. Expert Syst. Appl. 2014, 41, 3527–3537. [Google Scholar] [CrossRef]
  21. Dabbagh, R.; Yousefi, S. A hybrid decision-making approach based on FCM and MOORA for occupational health and safety risk analysis. J. Saf. Res. 2019, 71, 111–123. [Google Scholar] [CrossRef]
  22. Braglia, M.; Bevilacqua, M. Fuzzy modelling and analytical hierarchy processing as a means of quantifying risk levels associated with failure modes in production systems. Technol. Law Insur. 2000, 5, 125–134. [Google Scholar] [CrossRef]
  23. Liu, H.-C.; You, J.-X.; Fan, X.-J.; Lin, Q.-L. Failure mode and effects analysis using D numbers and grey relational projection method. Expert Syst. Appl. 2014, 41, 4670–4679. [Google Scholar] [CrossRef]
  24. Safari, H.; Faraji, Z.; Majidian, S. Identifying and evaluating enterprise architecture risks using FMEA and fuzzy VIKOR. J. Intell. Manuf. 2016, 27, 475–486. [Google Scholar] [CrossRef]
  25. Emovon, I.; Norman, R.A.; Alan, J.M.; Pazouki, K. An integrated multicriteria decision making methodology using compromise solution methods for prioritising risk of marine machinery systems. Ocean Eng. 2015, 105, 92–103. [Google Scholar] [CrossRef]
  26. Liu, H.-C. FMEA Using Uncertain Linguistic GRA-TOPSIS and Its Application to Endotracheal Suctioning. In Improved FMEA Methods for Proactive Healthcare Risk Analysis; Springer: Berlin/Heidelberg, Germany, 2019; pp. 173–193. [Google Scholar]
  27. Tian, Z.-P.; Wang, J.-Q.; Wang, J.; Zhang, H.-Y. A multi-phase QFD-based hybrid fuzzy MCDM approach for performance evaluation: A case of smart bike-sharing programs in Changsha. J. Clean. Prod. 2018, 171, 1068–1083. [Google Scholar] [CrossRef]
  28. Melani, A.H.A.; Murad, C.A.; Netto, A.C.; de Souza, G.F.M.; Nabeta, S.I. Criticality-based maintenance of a coal-fired power plant. Energy 2018, 147, 767–781. [Google Scholar] [CrossRef]
  29. Nie, R.-X.; Tian, Z.-P.; Wang, X.-K.; Wang, J.-Q.; Wang, T.-L. Risk evaluation by FMEA of supercritical water gasification system using multi-granular linguistic distribution assessment. Knowl. Based Syst. 2018, 162, 185–201. [Google Scholar] [CrossRef]
  30. Galehdar, E.; Saghih, A.M.F.; Pooya, A. A compilation model for the selection of quality management system based on the benefits of their application in the automotive industry by using dematel fuzzy and analytic network process. Int. J. Qual. Res. 2018, 12, 317–336. [Google Scholar]
  31. Hu, Y.-P.; You, X.-Y.; Wang, L.; Liu, H.-C. An integrated approach for failure mode and effect analysis based on uncertain linguistic GRA–TOPSIS method. Soft Comput. 2019, 23, 8801–8814. [Google Scholar] [CrossRef]
  32. Kumar, A.M.; Rajakarunakaran, S.; Pitchipoo, P.; Vimalesan, R. Fuzzy based risk prioritisation in an auto LPG dispensing station. Saf. Sci. 2018, 101, 231–247. [Google Scholar] [CrossRef]
  33. Arabsheybani, A.; Paydar, M.M.; Safaei, A.S. An integrated fuzzy MOORA method and FMEA technique for sustainable supplier selection considering quantity discounts and supplier’s risk. J. Clean. Prod. 2018, 190, 577–591. [Google Scholar] [CrossRef]
  34. Panchal, D.; Srivastava, P. Qualitative analysis of CNG dispensing system using fuzzy FMEA–GRA integrated approach. Int. J. Syst. Assur. Eng. Manag. 2019, 10, 44–56. [Google Scholar] [CrossRef]
  35. Nazeri, A.; Naderikia, R. A new fuzzy approach to identify the critical risk factors in maintenance management. Int. J. Adv. Manuf. Technol. 2017, 92, 3749–3783. [Google Scholar] [CrossRef]
  36. Bian, T.; Zheng, H.; Yin, L.; Deng, Y. Failure mode and effects analysis based on D numbers and TOPSIS. Qual. Reliab. Eng. Int. 2018, 34, 501–515. [Google Scholar] [CrossRef]
  37. Battirola Filho, J.C.; Piechnicki, F.; Loures, E.d.F.R.; Santos, E.A.P. Process-aware FMEA framework for failure analysis in maintenance. J. Manuf. Technol. Manag. 2017, 28, 822–848. [Google Scholar] [CrossRef]
  38. Mangeli, M.; Shahraki, A.; Saljooghi, F.H. Improvement of risk assessment in the FMEA using nonlinear model, revised fuzzy TOPSIS and support vector machine. Int. J. Ind. Ergon. 2019, 69, 209–216. [Google Scholar] [CrossRef]
  39. Liu, H.-C.; You, J.-X.; Shan, M.-M.; Su, Q. Systematic failure mode and effect analysis using a hybrid multiple criteria decision-making approach. Total Qual. Manag. Bus. Excell. 2019, 30, 537–564. [Google Scholar] [CrossRef]
  40. Ak, M.F.; Gul, M. AHP–TOPSIS integration extended with Pythagorean fuzzy sets for information security risk analysis. Complex Intell. Syst. 2019, 5, 113–126. [Google Scholar] [CrossRef] [Green Version]
  41. Dorosti, S.; Fathi, M.; Ghoushchi, S.J.; Khakifirooz, M.; Khazaeili, M. Patient waiting time management through fuzzy based failure mode and effect analysis. J. Intell. Fuzzy Syst. 2020, 38, 1–12. [Google Scholar] [CrossRef]
  42. Liu, H.-C. FMEA Using ITL-ELECTRE Approach and Its Application to Proton Beam Radiotherapy. In Improved FMEA Methods for Proactive Healthcare Risk Analysis; Springer: Berlin/Heidelberg, Germany, 2019; pp. 97–124. [Google Scholar]
  43. Lo, H.-W.; Liou, J.J.; Huang, C.-N.; Chuang, Y.-C. A novel failure mode and effect analysis model for machine tool risk analysis. Reliab. Eng. Syst. Saf. 2019, 183, 173–183. [Google Scholar] [CrossRef]
  44. Wang, L.; Hu, Y.P.; Liu, H.C.; Shi, H. A linguistic risk prioritization approach for failure mode and effects analysis: A case study of medical product development. Qual. Reliab. Eng. Int. 2019, 35, 1735–1752. [Google Scholar] [CrossRef]
  45. Li, Z.; Chen, L. A novel evidential FMEA method by integrating fuzzy belief structure and grey relational projection method. Eng. Appl. Artif. Intell. 2019, 77, 136–147. [Google Scholar] [CrossRef]
  46. Fattahi, R.; Khalilzadeh, M. Risk evaluation using a novel hybrid method based on FMEA, extended MULTIMOORA and AHP methods under fuzzy environment. Saf. Sci. 2018, 102, 290–300. [Google Scholar] [CrossRef]
  47. Deng, J. Introduction to grey system theory. J. Grey Syst. 1989, 1, 1–24. [Google Scholar]
  48. Olson, D.L.; Wu, D. Simulation of fuzzy multiattribute models for grey relationships. Eur. J. Oper. Res. 2006, 175, 111–120. [Google Scholar] [CrossRef]
  49. Chen, W.-H.; Tsai, M.-S.; Kuo, H.-L. Distribution system restoration using the hybrid fuzzy-grey method. IEEE Trans. Power Syst. 2005, 20, 199–205. [Google Scholar] [CrossRef]
  50. Jiang, B.C.; Tasi, S.-L.; Wang, C.-C. Machine vision-based gray relational theory applied to IC marking inspection. IEEE Trans. Semicond. Manuf. 2002, 15, 531–539. [Google Scholar] [CrossRef]
  51. Wu, H.-H. A comparative study of using grey relational analysis in multiple attribute decision making problems. Qual. Eng. 2002, 15, 209–217. [Google Scholar] [CrossRef]
  52. Lin, C.-T.; Chang, C.-W.; Chen, C.-B. The worst ill-conditioned silicon wafer slicing machine detected by using grey relational analysis. Int. J. Adv. Manuf. Technol. 2006, 31, 388–395. [Google Scholar] [CrossRef]
  53. Wei, G.-W. GRA method for multiple attribute decision making with incomplete weight information in intuitionistic fuzzy setting. Knowl. Based Syst. 2010, 23, 243–247. [Google Scholar] [CrossRef]
  54. Kuo, C.-F.J.; Su, T.-L.; Jhang, P.-R.; Huang, C.-Y.; Chiu, C.-H. Using the Taguchi method and grey relational analysis to optimize the flat-plate collector process with multiple quality characteristics in solar energy collector manufacturing. Energy 2011, 36, 3554–3562. [Google Scholar]
  55. Acır, A.; Canlı, M.E.; Ata, İ.; Çakıroğlu, R. Parametric optimization of energy and exergy analyses of a novel solar air heater with grey relational analysis. Appl. Therm. Eng. 2017, 122, 330–338. [Google Scholar] [CrossRef]
  56. Tiwari, D.; Sherwani, A.F.; Asjad, M.; Arora, A. Grey relational analysis coupled with principal component analysis for optimization of the cyclic parameters of a solar-driven organic Rankine cycle. Grey Syst. Theory Appl. 2017, 7, 218–235. [Google Scholar] [CrossRef]
  57. Narendranathan, S.; Sudhagar, K.; Karthikeyan, R. Optimization of engine operating parameters suitable for punnai oil application in CI engine using Grey relational method. Energy Environ. 2019, 30, 732–751. [Google Scholar] [CrossRef]
  58. Keršuliene, V.; Zavadskas, E.K.; Turskis, Z. Selection of rational dispute resolution method by applying new step-wise weight assessment ratio analysis (SWARA). J. Bus. Econ. Manag. 2010, 11, 243–258. [Google Scholar] [CrossRef]
  59. Aghdaie, M.H.; Zolfani, S.H.; Zavadskas, E.K. Decision making in machine tool selection: An integrated approach with SWARA and COPRAS-G methods. Eng. Econ. 2013, 24, 5–17. [Google Scholar]
  60. Keršulienė, V.; Turskis, Z. Integrated fuzzy multiple criteria decision making model for architect selection. Technol. Econ. Dev. Econ. 2011, 17, 645–666. [Google Scholar] [CrossRef]
  61. Zolfani, S.H.; Banihashemi, S.S.A. Personnel Selection Based on a Novel Mmodel of Game Theory and MCDM Approaches. In Proceedings of the 8th International Scientific Conference Business and Management, Vilinus, Lithuania, 5–16 May 2014; pp. 15–16. [Google Scholar]
  62. Zolfani, S.H.; Chatterjee, P. Comparative evaluation of sustainable design based on Step-wise Weight Assessment Ratio Analysis (SWARA) and best worst method (BWM) methods: A perspective on household furnishing materials. Symmetry 2019, 11, 74. [Google Scholar] [CrossRef] [Green Version]
  63. Karabašević, D.; Paunkovic, J.; Stanujkić, D. Ranking of companies according to the indicators of corporate social responsibility based on SWARA and ARAS methods. Serb. J. Manag. 2016, 11, 43–53. [Google Scholar] [CrossRef]
  64. Zolfani, S.H.; Saparauskas, J. New application of SWARA method in prioritizing sustainability assessment indicators of energy system. Eng. Econ. 2013, 24, 408–414. [Google Scholar] [CrossRef] [Green Version]
  65. Zolfani, S.H.; Salimi, J.; Maknoon, R.; Kildiene, S. Technology foresight about R&D projects selection; application of SWARA method at the policy making level. Eng. Econ. 2015, 26, 571–580. [Google Scholar]
  66. Zavadskas, E.K.; Stević, Ž.; Tanackov, I.; Prentkovskis, O. A novel multicriteria approach–rough step-wise weight assessment ratio analysis method (R-SWARA) and its application in logistics. Stud. Inform. Control 2018, 27, 97–106. [Google Scholar] [CrossRef]
  67. Ijadi Maghsoodi, A.; Ijadi Maghsoodi, A.; Mosavi, A.; Rabczuk, T.; Zavadskas, E. Renewable energy technology selection problem using integrated h-swara-multimoora approach. Sustainability 2018, 10, 4481. [Google Scholar] [CrossRef] [Green Version]
  68. Shahsavar, S.; Rad, A.J.; Afzal, P.; Nezafati, N.; Aghdam, M.A. Prospecting for polymetallic mineralization using step-wise weight assessment ratio analysis (SWARA) and fractal modeling in Aghkand Area, NW Iran. Arab. J. Geosci. 2019, 12, 248. [Google Scholar] [CrossRef]
  69. Ghasempour, R.; Nazari, M.A.; Ebrahimi, M.; Ahmadi, M.H.; Hadiyanto, H. Multi-Criteria Decision Making (MCDM) Approach for Selecting Solar Plants Site and Technology: A Review. Int. J. Renew. Energy Dev. 2019, 8, 15–25. [Google Scholar] [CrossRef] [Green Version]
  70. Siksnelyte, I.; Zavadskas, E.; Streimikiene, D.; Sharma, D. An overview of multi-criteria decision-making methods in dealing with sustainable energy development issues. Energies 2018, 11, 2754. [Google Scholar] [CrossRef] [Green Version]
  71. Zadeh, L.A. Fuzzy sets. Inf. Control 1965, 8, 338–353. [Google Scholar] [CrossRef] [Green Version]
  72. Kang, B.; Wei, D.; Li, Y.; Deng, Y. A method of converting Z-number to classical fuzzy number. J. Inf. Comput. Sci. 2012, 9, 703–709. [Google Scholar]
  73. Aliev, R.A.; Alizadeh, A.V.; Huseynov, O.H. The arithmetic of discrete Z-numbers. Inf. Sci. 2015, 290, 134–155. [Google Scholar] [CrossRef]
  74. Aliev, R.; Alizadeh, A.; Huseynov, O. An introduction to the arithmetic of Z-numbers by using horizontal membership functions. Procedia Comput. Sci. 2017, 120, 349–356. [Google Scholar] [CrossRef]
  75. Aliev, R.A.; Huseynov, O.H.; Serdaroglu, R. Ranking of Z-numbers and its application in decision making. Int. J. Inf. Technol. Decis. Mak. 2016, 15, 1503–1519. [Google Scholar] [CrossRef]
Figure 1. Symmetric triangular Fuzzy Number.
Symmetry 12 00310 g001
Figure 2. Proposed approach for prioritizing the failures of the solar panels.
Symmetry 12 00310 g002
Figure 3. Comparison of failure prioritization based on conventional FMEA, fuzzy GRA, Z-GRA approaches.
Symmetry 12 00310 g003
Figure 4. Sensitivity analysis for Z-GRA.
Symmetry 12 00310 g004
Table 1. Hybrid approaches of the hybrid failure mode and effect analysis (FMEA) approach based on multi-criteria decision making (MCDM) methods.
Author(s)ApproachesSpecification-CharacteristicsAuthor(s)ApproachesSpecification-Characteristics
WeightingRankingWeightingRanking
URURURUR
Tian et al. [27]Fuzzy best-worst (BWM), relative entropy, VIKOR Melani et al. [28]ANP
Nie et al. [29]BWM, COPRAS Galehdar et al. [30]ANP and Fuzzy DEMATEL
Nie et al. [31]GRA–TOPSIS Kumar et al. [32]GRA
Arabsheybani et al. [33]Fuzzy MOORA Panchal and Srivastava [34]GRA
Nazeri and Naderikia [35]ANP and DEMATEL Bian et al. [36]TOPSIS
Battirola Filho et al. [37]BPMS and AHP Mangeli, et al. [38]LFPP method and Fuzzy TOPSIS
Liu [26]GRA and TOPSIS Liu et al. [39]DEMATEL and AHP
Safari et al. [24]VIKOR Ak and Gul [40]AHP and TOPSIS
Dorosti et al. [41]Fuzzy BWM and MOORA Liu [42]ITL-ELECTRE
Lo et al. [43]R-BWM and R-TOPSIS Liu et al. [39], Wang et al. [44]Regret theory and TODIM
Li and Chen [45]FGRP Ghoushchi et al. [5]Z-MOORA and Fuzzy BWM
Fattahi and Khalilzadeh [46]MULTIMOORA and AHP fuzzy Proposed approachZ-GRA and Z-SWARA
Table 2. Linguistics variable for evaluating the factors.
Linguistics TermsMembership Function
Equally Important (EI)(1,1,1)
Moderately less important (MOL)(2/3,1,3/2)
Less important (LI)(2/5,1/2,2/3)
Very less Important (VLI)(2/7,1/3,2/5)
Much less important (MUL)(2/9,1/4,2/7)
Table 3. Transformation rules of linguistics variables of reliability.
Linguistic VariablesVery Low (VL)Low (L)Medium (M)High (H)Very High (VH)
TFNs(0,0,0.35)(0.2,0.35,0.50)(0.35,0.50,0.65)(0.50,0.65,0.80)(0.65,1.0,1.0)
Table 4. Transformation rules of linguistics variables to z-number of Z-stepwise weight assessment ratio analysis (SWARA).
Linguistics TermsMembership FunctionLinguistics TermsMembership Function
(EI,VL)(1,1,1)(EI,L)(1,1,1)
(EI,M)(1,1,1)(EI,H)(1,1,1)
(EI,VH)(1,1,1)(MOL,VL)(0.23,0.35,0.52)
(MOL,L)(0.40,0.59,0.89)(MOL,M)(0.47,0.71,1.06)
(MOL,H)(0.54,0.81,1.21)(MOL,VH)(0.63,0.94,1.41)
(LI,VL)(0.14,0.17,0.23)(LI,L)(0.24,0.30,0.40)
(LI,M)(0.28,0.35,0.47)(LI,H)(0.32,0.40,0.54)
(LI,VH)(0.38,0.47,0.63)(VLI,VL)(0.10,0.11,0.14)
(VLI,L)(0.17,0.20,0.24)(VLI,M)(0.21,0.23,0.28)
(VLI,H)(0.23,0.27,0.32)(VLI,VH)(0.27,0.31,0.38)
(MUL,VL)(0.08,0.09,0.10)(MUL,L)(0.13,0.15,0.17)
(MUL,M)(0.16,0.18,0.21)(MUL,H)(0.18,0.20,0.23)
(MUL,VH)(0.21,0.23,0.27)
Table 5. Linguistic variables for rating the failure modes.
Linguistic VariablesVery Low (VL)Low (L)Medium Low (ML)Medium (M)Medium High (MH)High (H)Very High (VH)
TFNs(0,0,1)(0,1,3)(1,3,5)(3,5,7)(5,7,9)(7,9,10)(9,10,10)
Table 6. Transformation rules of linguistics variables of reliability.
Linguistic VariablesVery Low (VL)Low (L)Medium (M)High (H)Very High (VH)
TFNs(0,0,0.35)(0.2,0.35,0.50)(0.35,0.50,0.65)(0.50,0.65,0.80)(0.65,1,1)
Table 7. Transformation rules for Z-number linguistic variables to Z-gray relational analysis (GRA).
Linguistics TermsMembership FunctionLinguistics TermsMembership Function
(VL,VL)(0,0,0.35)(M,H)(2.42,4.03,5.64)
(VL,L)(0,0,0.59)(M,VH)(2.81,4.69,6.57)
(VL,M)(0,0,0.71)(MH,VL)(1.73,2.42,3.12)
(VL,H)(0,0,0.81)(MH,L)(2.96,4.14,5.32)
(VL,VH)(0,0,0.94)(MH,M)(3.54,4.95,6.36)
(L,VL)(0,0.35,1.04)(MH,H)(4.03,5.64,7.26)
(L,L)(0,0.59,1.77)(MH,VH)(4.69,6.57,8.44)
(L,M)(0,0.71,2.12)(H,VL)(2.42,3.12,3.46)
(L,H)(0,0.81,2.42)(H,L)(4.14,5.32,5.92)
(L,VH)(0,0.94,2.81)(H,M)(4.95,6.36,7.07)
(ML,VL)(0.35,1.04,1.73)(H,H)(5.64,7.26,8.06)
(ML,L)(0.59,1.77,2.96)(H,VH)(6.57,8.44,9.38)
(ML,M)(0.71,2.12,3.54)(VH,VL)(3.12,3.46,3.46)
(ML,H)(0.81,2.42,4.03)(VH,L)(5.32,5.92,5.92)
(ML,VH)(0.94,2.81,4.69)(VH,M)(6.36,7.07,7.07)
(M,VL)(1.04,1.73,2.42)(VH,H)(7.26,8.06,8.06)
(M,L)(1.77,2.96,4.14)(VH,VH)(8.44,9.38,9.38)
(M,M)(2.12,3.54,4.95)
Table 8. The score of ach failure mode in Z-number format.
Symb-olFailure ModesSODCT
TM1TM2TM3TM1TM2TM3TM1TM2TM3TM1TM2TM3TM1TM2TM3
FM1Shading(MH,H)(M,VH)(H,VH)(MH,M)(M,VH)(M,VH)(ML,H)(L, H)(M,VH)(M,H)(ML,H)(L,M)(MH,M)(M,VH)(ML,H)
FM2Dust(MH, H)(H,M)(H,VH)(VH,VH)(H,H)(MH,M)(H,H)(MH,H)(M,M)(M,H)(ML,M)(M,M)(M,VH)(MH,H)(M,M)
FM3Orientation(MH,VH)(H,H)(M,H)(ML,VH)(M,VH)(MH,VH)(ML,H)(MH,VH)(M,M)(M,M)(MH,H)(H,M)(H,VH)(MH,M)(H,H)
FM4Corrosion(M,M)(L,H)(ML,VH)(MH,VH)(M,H)(ML,M)(H,VH)(MH,H)(M,M)(M,M)(ML,H)(MH,VH)(M,M)(ML,VH)(L,H)
FM5fire(MH,VH)(MH,H)(M,M)(ML,H)(L,M)(M,VH)(ML,M)(ML,H)(ML,VH)(M,H)(L,VH)(ML,M)(M,VH)(M,H)(M,VH)
FM6Incorrect energy yield prediction(VH,VH)(H,H)(MH,M)(MH,VH)(M,VH)(ML,H)(M,VH)(ML,M)(L,H)(M,H)(ML,H)(L,VH)(H,H)(M,H)(MH,H)
FM7Stability(H,M)(M,M)(MH,H)(H,M)(VH,M)(MH,H)(M,VH)(MH,M)(ML,M)(ML,VH)(L,VH)(M,M)(H,M)(M,M)(MH,M)
FM8Sizing(MH,H)(H,M)(MH,H)(M,H)(MH,VH)(MH,H)(M,M)(MH,H)(ML,M)(M,M)(M,VH)(M,M)(H,VH)(MH,H)(M,H)
FM9Electrical connections(M,M)(MH,VH)(H,H)(H,VH)(MH,M)(M,VH)(ML,H)(L,VH)(M,M)(L,VH)(ML,H)(VL,VH)(MH,M)(H,H)(M,H)
FM10Lightning/groundi-ng(MH,M)(ML,VH)(M,H)(ML,H)(L,H)(M,VH)(MH,VH)(ML,M)(M,VH)(ML,M)(ML,VH)(L,VH)(MH,H)(H,H)(M,VH)
FM11grid connection(H,H)(H,VH)(MH,M)(MH,VH)(H,H)(M,M)(L,H)(ML,H)(M,H)(L,VH)(ML,H)(M,H)(M,M)(ML,H)(MH,H)
FM12not compliant with IEC standard(M,H)(ML,VH)(MH,VH)(M,M)(ML,VH)(L,VH)(M,VH)(L,H)(ML,H)(MH,H)(M,M)(H,H)(ML,H)(MH,M)(M,VH)
FM13Equipment(M,H)(ML,VH)(MH,H)(H,VH)(MH,H)(M,M)(M,H)(L,VH)(ML,H)(M,H)(M,M)(MH,M)(M,M)(ML,VH)(MH,H)
FM14Structure Damage(M,H)(ML,H)(M,VH)(ML,VH)(L,VH)(VL,VH)(ML,M)(M,H)(M,VH)(M,M)(MH,H)(H,M)(ML,H)(L,M)(M,VH)
FM15Wiring(M,H)(H,M)(MH,VH)(MH,VH)(M,H)(ML,M)(MH,H)(H,VH)(M,M)(MH,M)(M,H)(H,VH)(ML,VH)(L,H)(M,M)
FM16Batteries(M,M)(MH,VH)(H,H)(MH,VH)(M,H)(ML,H)(M,VH)(M,H)(M,M)(MH,H)(M,M)(ML,VH)(H,H)(MH,VH)(M,VH)
FM17Labelling and warning signs(L,H)(VL,VH)(ML,H)(MH,M)(M,VH)(ML,VH)(MH,VH)(ML,H)(M,M)(M,VH)(M,H)(M,M)(ML,VH)(L,M)(VL,H)
FM18Sensors(MH,H)(M,VH)(ML,M)(M,H)(H,M)(MH,VH)(M,M)(ML,H)(MH,VH)(H,VH)(MH,M)(M,H)(M,H)(ML,VH)(MH,M)
FM19Boxes or conduit bodies(H,VH)(MH,M)(M,H)(M,VH)(L,VH)(ML,H)(MH,VH)(M,VH)(ML,H)(M,VH)(H,M)(MH,M)(ML,H)(ML,VH)(L,VH)
Table 9. Symmetric fuzzy weight of main criteria by each decision maker.
DM1 KqWj
lmulmulmulmu
S 1111.0001.0001.0000.3575950.4185050.495377
CMOL-M0.470.711.061.471.712.060.4850.5850.6800.173590.244740.336991
DMOL-H0.540.811.211.541.812.210.2200.3230.4420.0785470.1352150.218826
OMUL-VH0.210.230.271.211.231.270.1730.2630.3650.0618480.1099310.180848
TMUL-H0.180.20.231.181.21.230.1410.2190.3090.0502830.0916090.153261
Sum2.0192.3892.796
DM2 KqWj
lmulmulmulmu
C 1111.0001.0001.0000.3293760.3714810.428399
SMOL-H0.540.811.211.541.812.210.4520.5520.6490.1490390.2052380.278181
DMUL-M0.160.180.211.161.181.210.3740.4680.5600.1231730.173930.239811
OMUL-VH0.210.230.271.211.231.270.2940.3810.4630.0969860.1414070.198191
TVLI-VH0.270.310.381.271.311.380.2130.2910.3640.070280.1079440.156056
Sum2.3342.6923.036
DM3 KqWj
lmulmulmulmu
S 1111.0001.0001.0000.3277690.3731650.435067
CMOL-M0.470.711.061.471.712.060.4850.5850.6800.1591110.2182250.295964
DLI-M0.280.350.471.281.351.470.3300.4330.5310.1082390.1616480.231222
TVLI-H0.170.20.241.171.21.240.2660.3610.4540.0872890.1347070.197626
OMUL-H0.180.20.231.181.21.230.2170.3010.3850.0709670.1122560.167479
Sum2.2982.6803.051
Table 10. Final symmetric weight of main criteria with Fuzzy SWARA method.
FactorDM1DM2DM3Final WeightCrisp
lmulmulmulmu
S0.3580.4190.4950.1490.2050.2780.3280.3730.4350.2780.3320.4030.338
C0.1740.2450.3370.3290.3710.4280.1590.2180.2960.2210.2780.3540.284
D0.0790.1350.2190.1230.1740.2400.1080.1620.2310.1030.1570.2300.163
O0.0620.1100.1810.0970.1410.1980.0710.1120.1670.0770.1210.1820.127
T0.0500.0920.1530.0700.1080.1560.0870.1350.1980.0690.1110.1690.117
Table 11. Z-GRA initial decision matrix for failure modes of FMEA.
FailureSODCT
lmulmulmulmulmu
FM14.4706.2577.7373.0534.7776.5001.2072.6404.3401.0772.1503.4602.3874.0205.653
FM25.1836.8137.9035.8737.1977.9333.9305.4806.7571.7503.2304.7102.9874.6236.260
FM34.2505.9537.3802.8134.6906.5672.5404.1775.8073.7005.1806.4275.2506.8837.933
FM41.0202.3874.0202.6074.2405.8734.2405.8737.1972.5404.1775.8071.0202.3874.020
FM53.6135.2506.8831.2072.6074.2400.8202.4504.0871.0432.3633.9972.6804.4706.260
FM65.8737.1977.9332.7704.5606.3471.1732.5404.1771.0772.4634.1604.0305.6436.987
FM73.7005.1806.4275.1136.3577.1332.3533.9205.4901.0202.4304.1503.5374.9506.127
FM84.3375.8807.1973.7135.4137.1132.2873.7675.2502.3503.9235.4904.3406.0377.427
FM94.1505.7907.1504.3076.0277.4370.9772.3003.9300.2701.1202.5933.8675.4136.687
FM102.3003.9305.5631.2072.6404.3402.7374.4606.1830.5501.9573.6804.1605.8637.297
FM115.2506.8837.9334.1505.7907.1501.0772.4204.0301.0772.4634.1602.3203.8675.413
FM122.6834.4706.2571.0202.4304.1501.2072.6404.3403.9305.4806.7572.3874.0205.653
FM132.4634.1605.8634.2405.8737.1971.0772.4634.1602.6934.1735.6502.3633.9975.633
FM142.0133.7135.4130.3131.2502.8131.9803.6135.2503.7005.1806.4271.2072.6074.240
FM154.0205.6537.0502.6074.2405.8734.2405.8737.1974.1775.8077.1271.0202.3874.020
FM164.1505.7907.1502.6404.3406.0372.4504.0875.7202.3633.9975.6334.3806.1737.690
FM170.2701.0772.4632.4304.1505.8732.5404.1775.4732.4504.0875.7200.3131.1732.540
FM182.5174.1505.7904.0205.6537.0502.5404.1775.8074.1775.8077.1272.3003.9305.563
FM194.1775.8077.1271.2072.6834.4702.7704.5606.3473.7675.3336.6670.5832.0573.843
Table 12. Normalized weighted matrix.
Failure/FactorSODCT
FM10.7450.5550.4610.4250.517
FM20.8631.0000.8710.5100.579
FM30.7010.5430.6190.8091.000
FM40.3870.5051.0000.6270.405
FM50.6110.3980.4390.4430.560
FM61.0000.5320.4530.4510.715
FM70.5990.7820.5840.4480.612
FM80.6980.6300.5650.5910.787
FM90.6780.7110.4360.3700.677
FM100.4800.4000.6620.4140.754
FM110.8770.6780.4440.4510.503
FM120.5240.3900.4610.8900.517
FM130.4980.6900.4480.6270.515
FM140.4620.3410.5460.8090.417
FM150.6590.5051.0001.0000.405
FM160.6780.5130.6060.6010.812
FM170.3330.4970.6040.6130.349
FM180.4980.6590.6191.0000.509
FM190.6800.4030.6770.8520.387
WEIGHT0.3380.1270.1630.2840.117
Table 13. New approach results with existing methods.
FailureRPNRankFuzzy GRARankZ-GRARank
FM11890120.570160.57813
FM218,14410.81510.7732
FM311,20020.79920.7533
FM42100110.576150.58312
FM51152140.525170.52018
FM6283580.70660.6916
FM7768040.66780.59611
FM8784030.71050.6677
FM92352100.581140.57414
FM101680130.518180.52717
FM11460850.66390.6419
FM12840150.645110.61510
FM13262590.593130.56716
FM141152140.610120.56715
FM15784030.79730.7811
FM16420060.661100.6598
FM17600160.490190.48919
FM18420060.70270.6964
FM19352870.72540.6795
Table 14. Weights of the risk factors with respect to considered cases.
SODCT
Case 00.3380.1270.1630.2840.117
Case 10.4380.1020.1380.2590.092
Case 20.3130.2270.1380.2590.092
Case 30.3130.1020.2630.2590.092
Case 40.3130.1020.1380.3840.092
Case 50.3130.1020.1380.2590.217
Table 15. Ranking results of failure modes with respect to the considered cases.
FailuresRank
Case 0Case 1Case 2Case 3Case 4Case 5
FM1131114141513
FM2211232
FM3333321
FM412161591215
FM5181717181718
FM6645664
FM7111210121311
FM8786775
FM9141312151612
FM10171818171817
FM1196810109
FM1210101111810
FM13161513161414
FM14151416131116
FM15122113
FM16899896
FM17191919191919
FM18474447
FM19557558

