Article

Statistic-Driven Proton Transfer Affecting Nanoscopic Organization in an Ethylammonium Nitrate Ionic Liquid and 1,4-Diaminobutane Binary Mixture: A Steamy Pizza Model

by
Alessandro Mariani
1,2,3,*,
Matteo Bonomo
1,4 and
Stefano Passerini
2,3,*
1
Department of Chemistry, La Sapienza University of Rome, piazzale Aldo Moro 5, 00185 Rome, Italy
2
Helmholtz Institute Ulm (HIU), Helmholtzstrasse 11, 89081 Ulm, Germany
3
Karlsruhe Institute of Technology (KIT), P.O. Box 3640, 76021 Karlsruhe, Germany
4
Department of Chemistry and NIS Interdepartmental Centre and INSTM Reference Centre, University of Turin, via Pietro Giuria 7, 10125 Turin, Italy
*
Authors to whom correspondence should be addressed.
Symmetry 2019, 11(11), 1425; https://doi.org/10.3390/sym11111425
Submission received: 8 October 2019 / Revised: 13 November 2019 / Accepted: 15 November 2019 / Published: 19 November 2019
(This article belongs to the Special Issue Materials Science and X-Ray Diffraction)

Abstract

:
Herein, we report on the theoretical and experimental investigation of the chemical equilibrium in a Ethylammonium Nitrate (EAN)/1,4-Diaminobutane (DAB) binary mixture displaying a significant excess of the latter component (namely, a 1:9 mole ratio). Both the neutral compounds, i.e., ethylamine (EtNH2) and DAB, present very similar chemical properties, especially concerning their basic strength, resulting in a continuous jump of the proton from the ethylammonium to the diamine (and vice-versa). Due to the significant excess of DAB, the proton is (statistically) expected to be bound to one of its nitrogen atoms, leading to the formation of a new (ternary) mixture containing DAB (ca. 80%), ethylamine (ca. 10%) and 4-amino-1-butylammonium nitrate (ABAN, ca. 10%). This is probed by means of SAXS measurements, showing LqE (low q excess) that increases over time. This feature tends to stabilize after approximately one day. When the measurement is repeated after one year, the LqE feature shows an increased intensity. Based on the results of our simulations, we suggest that this phenomenon is likely due to partial ethylamine evaporation, pushing the equilibrium toward the formation of ABAN.

Graphical Abstract

1. Introduction

Ionic liquids (ILs) are organic salts with a melting point lower than their decomposition temperature. ILs are usually composed of relatively bulky and asymmetric ions whose charge is often spread over a large portion of the ion, leading to a thermodynamically unfavorable aggregation into the solid phase [1,2]. The first known IL was obtained as a side product of Friedel-Craft reactions [3]. It has been deeply characterized by means of NMR, proving that its structure was typical of salts, however, being in the liquid phase at room temperature. In 1914, Peter Walden thoughtfully synthesized an ionic liquid (i.e., Ethylammonium Nitrate) by a simple reaction between a Brønsted acid (nitric acid) and base (ethylamine). Throughout his pivotal work, Walden defined ILs as “anhydrous salts with a melting point lower than 100 °C” [4].
Historically, ILs are classified into four different generations [5]: the first generation, developed for electrochemical applications, involves AlCl4- anion yielding salts with rather low melting points. For the second generation, the scientific attention focused on the study of less reactive anions offering stability in the presence of both oxygen and water. In the first decades of the 2000s, new ILs were proposed in order to minimize their environmental impact by avoiding the use of halogens, defining the third generation [6,7,8]. Finally, environmentally friendly and bio-compatible ionic liquids have been proposed and they represent the fourth generation [9,10,11].
Due to their intrinsic features, ILs have rather low vapor pressure and volatility, but relatively low melting points too. These two properties result from the various interactions (i.e., Van der Waals, dipole–dipole, hydrogen-bond, and Coulombic) established between anions and cations in the bulk liquid. Among the different applications [12], ILs could be used as (relatively) green solvent [13,14,15] in a plethora of different reactions [16,17]. Recently, they have been mostly employed in electrochemistry [18,19], being characterized by a large electrochemical window and thermal stability, moderate conductivity, and a tunable viscosity [6].
Ionic liquids are classified into two different groups by means of the origin of their ionicity: aprotic and protic ILs [20]. Aprotic ionic liquids are usually obtained by quite complex reactions (e.g., nucleophilic addition) with multiple synthetic steps and the formation of a covalent bond between heavy atoms. On the other hand, in protic ILs, the ions are generated by a partially reversible proton transfer from a Brønsted acid to a Brønsted base [20,21]. For this reason, they have an intrinsic tendency to promote proton mobility [22,23]. It is worth mentioning that they are slightly less stable than their aprotic counterparts. Nevertheless, protic ILs’ straightforward preparation makes them appealing for industrial applications. Mixing ILs with molecular compounds can generate a plethora of unusual phenomena not observed in the pure starting components [24,25,26]. One of their most exciting and unexpected emerging property is the nanoscale supramolecular organization, which is detected in the extreme low q region of their SAXS pattern. This feature, called Low q Excess (LqE), is currently attributed to significant and stable density fluctuations within the system [27,28,29,30]. This means that the mixture, albeit transparent to the naked eye, is far from being homogeneous, and large ionic regions are floating into the molecular co-solvent, or vice versa [31]. A considerable role seems to be played by molecular affinity [28], but a complete understanding of this phenomenon is still due. To better understand what the role of proton mobility in this observation is, we performed a long-term experiment on the EAN/DAB (1:9 mol) binary mixture. We selected this system because of the structural similarity of ethylamine and DAB, as the latter can be seen as the dimer of the former.

2. Experimental Methods

Ethylammonium Nitrate was purchased from IoLiTec at the highest available purity (≥98% wt.). It was subjected to high vacuum under heating (328 K) treatment for 48 h with the aim of moisture removal. The final water content was undetectable with 1H-NMR (≤0.02% wt.). 1,4-Diaminobutane was purchased from Sigma-Aldrich at the highest available purity (≥98% wt.) and used without further treatment. The samples were prepared by mixing appropriate amounts of the pure compounds to achieve the desired mole fraction. The preparation was done in dry N2 atmosphere. SWAXS patterns were collected at the ID02 small-angle beamline of the European Synchrotron ESRF-Grenoble [32]. The samples were measured in a flow-through 2 mm o.d. quartz capillary to facilitate background subtraction. The temperature of the cell was kept constant at 298 K through a Peltier stage. The sample to detector distance for SAXS was set to 1 m and for WAXS, 14 cm. The X-ray energy was set to 12.46 keV. The simultaneous collection of SAXS (q range 0.08 nm−1 to 6.83 nm−1) and WAXS (5.65 nm−1 to 42.80 nm−1) was possible using two detectors: Rayonix MX-HS170 and Rayonix LX-HS170, respectively. The overlapping region was used to rescale the curves. Data treatment solely involved subtraction of the empty capillary background. Five different samples with the same composition were prepared and measured each time to check reproducibility. Every sample was stored in a glass vial wrapped with Parafilm™ in a vacuum desiccator in a cold room (5 °C). Density measurements were performed in a dry room (dew point −75 °C) with an Anton-Paar DMA 4100M density-meter kept at 25 °C. 1H-NMR spectroscopy was performed in a 200 MHz Bruker Avance 100 NMR spectrometer. The sample for NMR characterization was prepared as described by Mariani et al. elsewhere [31].

3. Computational Methods

For this work, we carried out some large classical molecular dynamics simulations. All the calculations were performed using Amber18 [33] with the GAFF [34] force field. Atomic charges were computed using Gaussian09 [35] at the B3LYP/6-311++G** level of theory and then applying the RESP [36] algorithm. The random starting coordinates for the molecules in a ~200 Å sided box were obtained via Packmol [37]. The compositions and dimensions of the four simulated boxes are reported in Table 1; the products of the proton transfer from EAN to DAB were EtNH2 and ABAN, respectively.
The simulation protocol is comprised of (i) 1010 minimization cycles; (ii) NVT pre-heating step from 0 to 50 K, 5 K every 100 ps, for a total of 1 ns; (iii) NPT heating from 50 to 300 K, 1.25 K every 100 ps, for a total of 20 ns (iv) NPT equilibration at 300 K. 100 ns; (v) NVT equilibration at 300 K. 100 ns; (vi) NVT production phase at 300 K. 10 ns. It is worth mentioning that for all the steps, a multiplicative dielectric constant of 1.8 was used since it was proven to provide good results when protic ILs are involved [38]. The use of the Langevin thermostat assured a better stability of the system. The analysis of the models was carried out using the Travis [39] software. Ancillary DFT calculations to obtain the proton transfer energy barrier value, were made using Gaussian09 at the B3LYP/6-311++G** level of theory. Since the proton transfer is a very fast process itself, we calculated the energy difference for a rigid proton transfer, i.e., not allowing conformational relaxation.

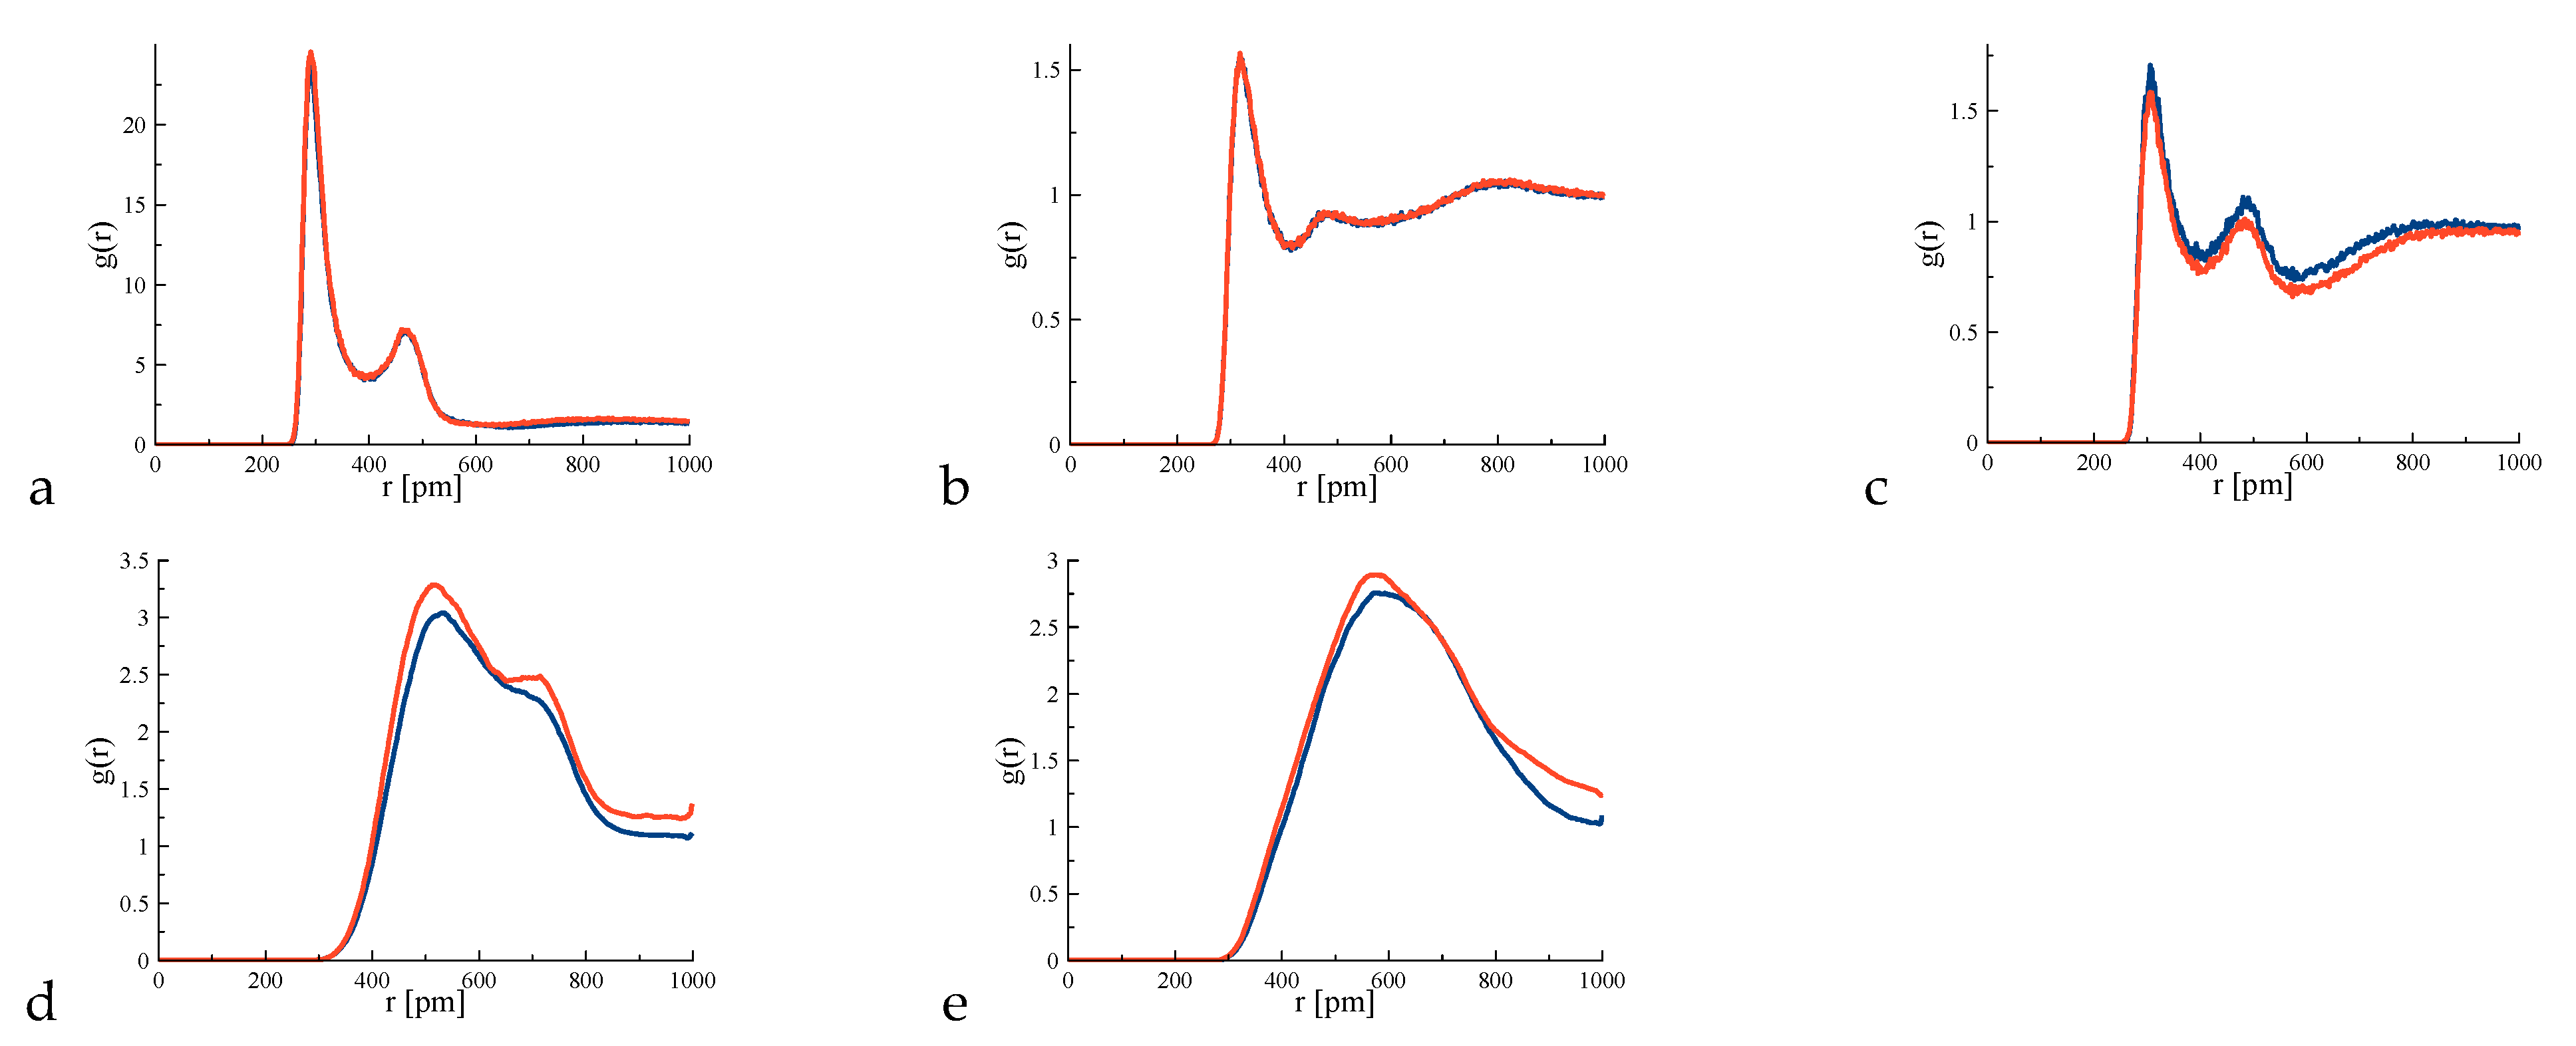
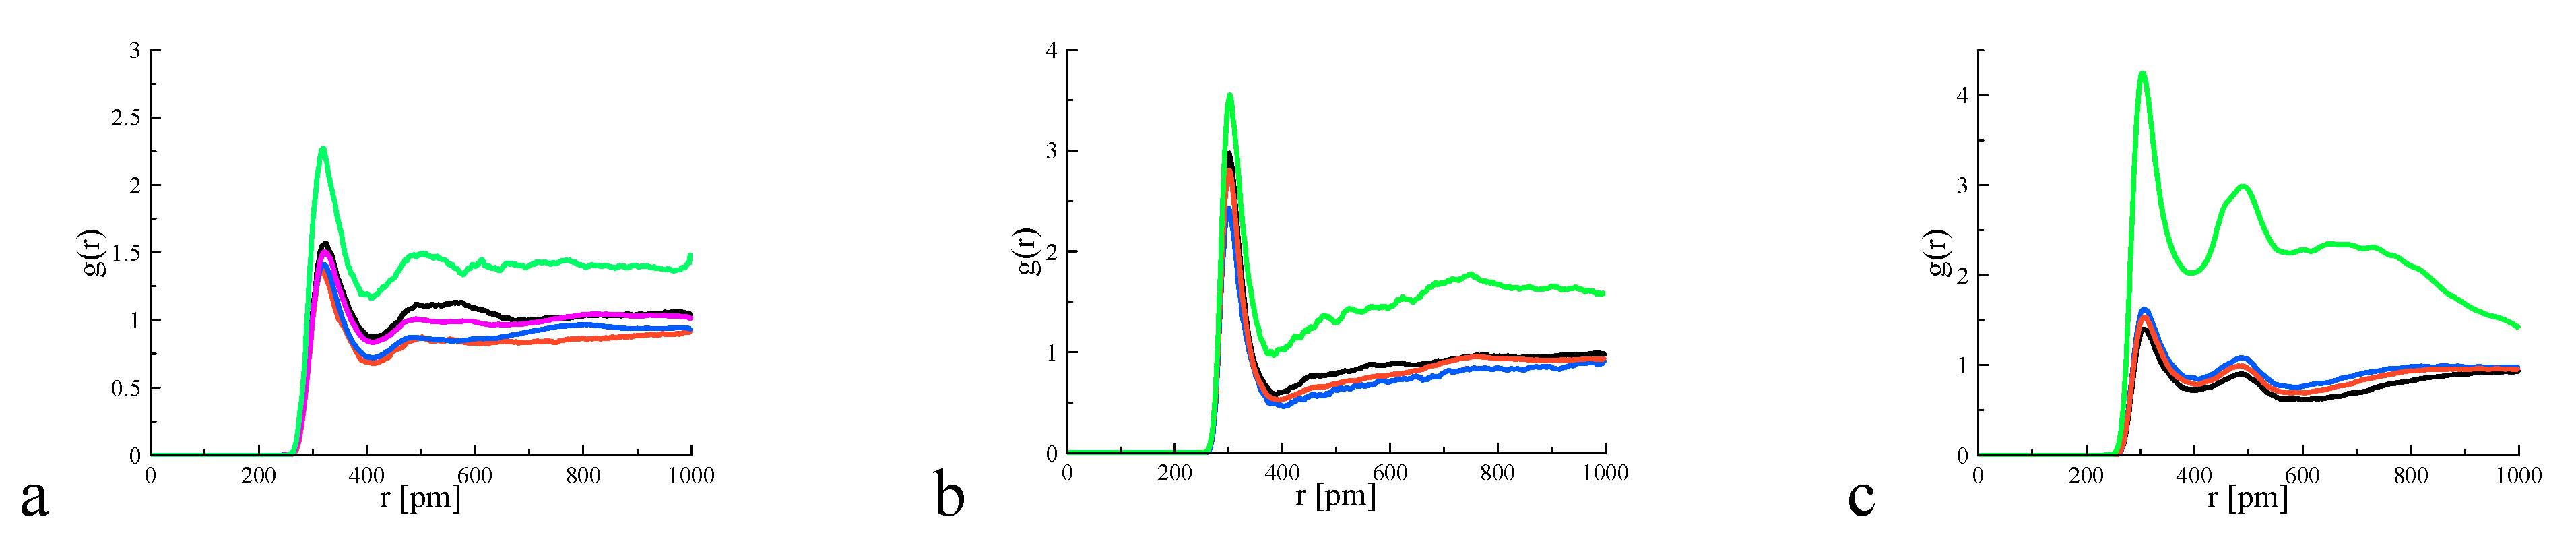
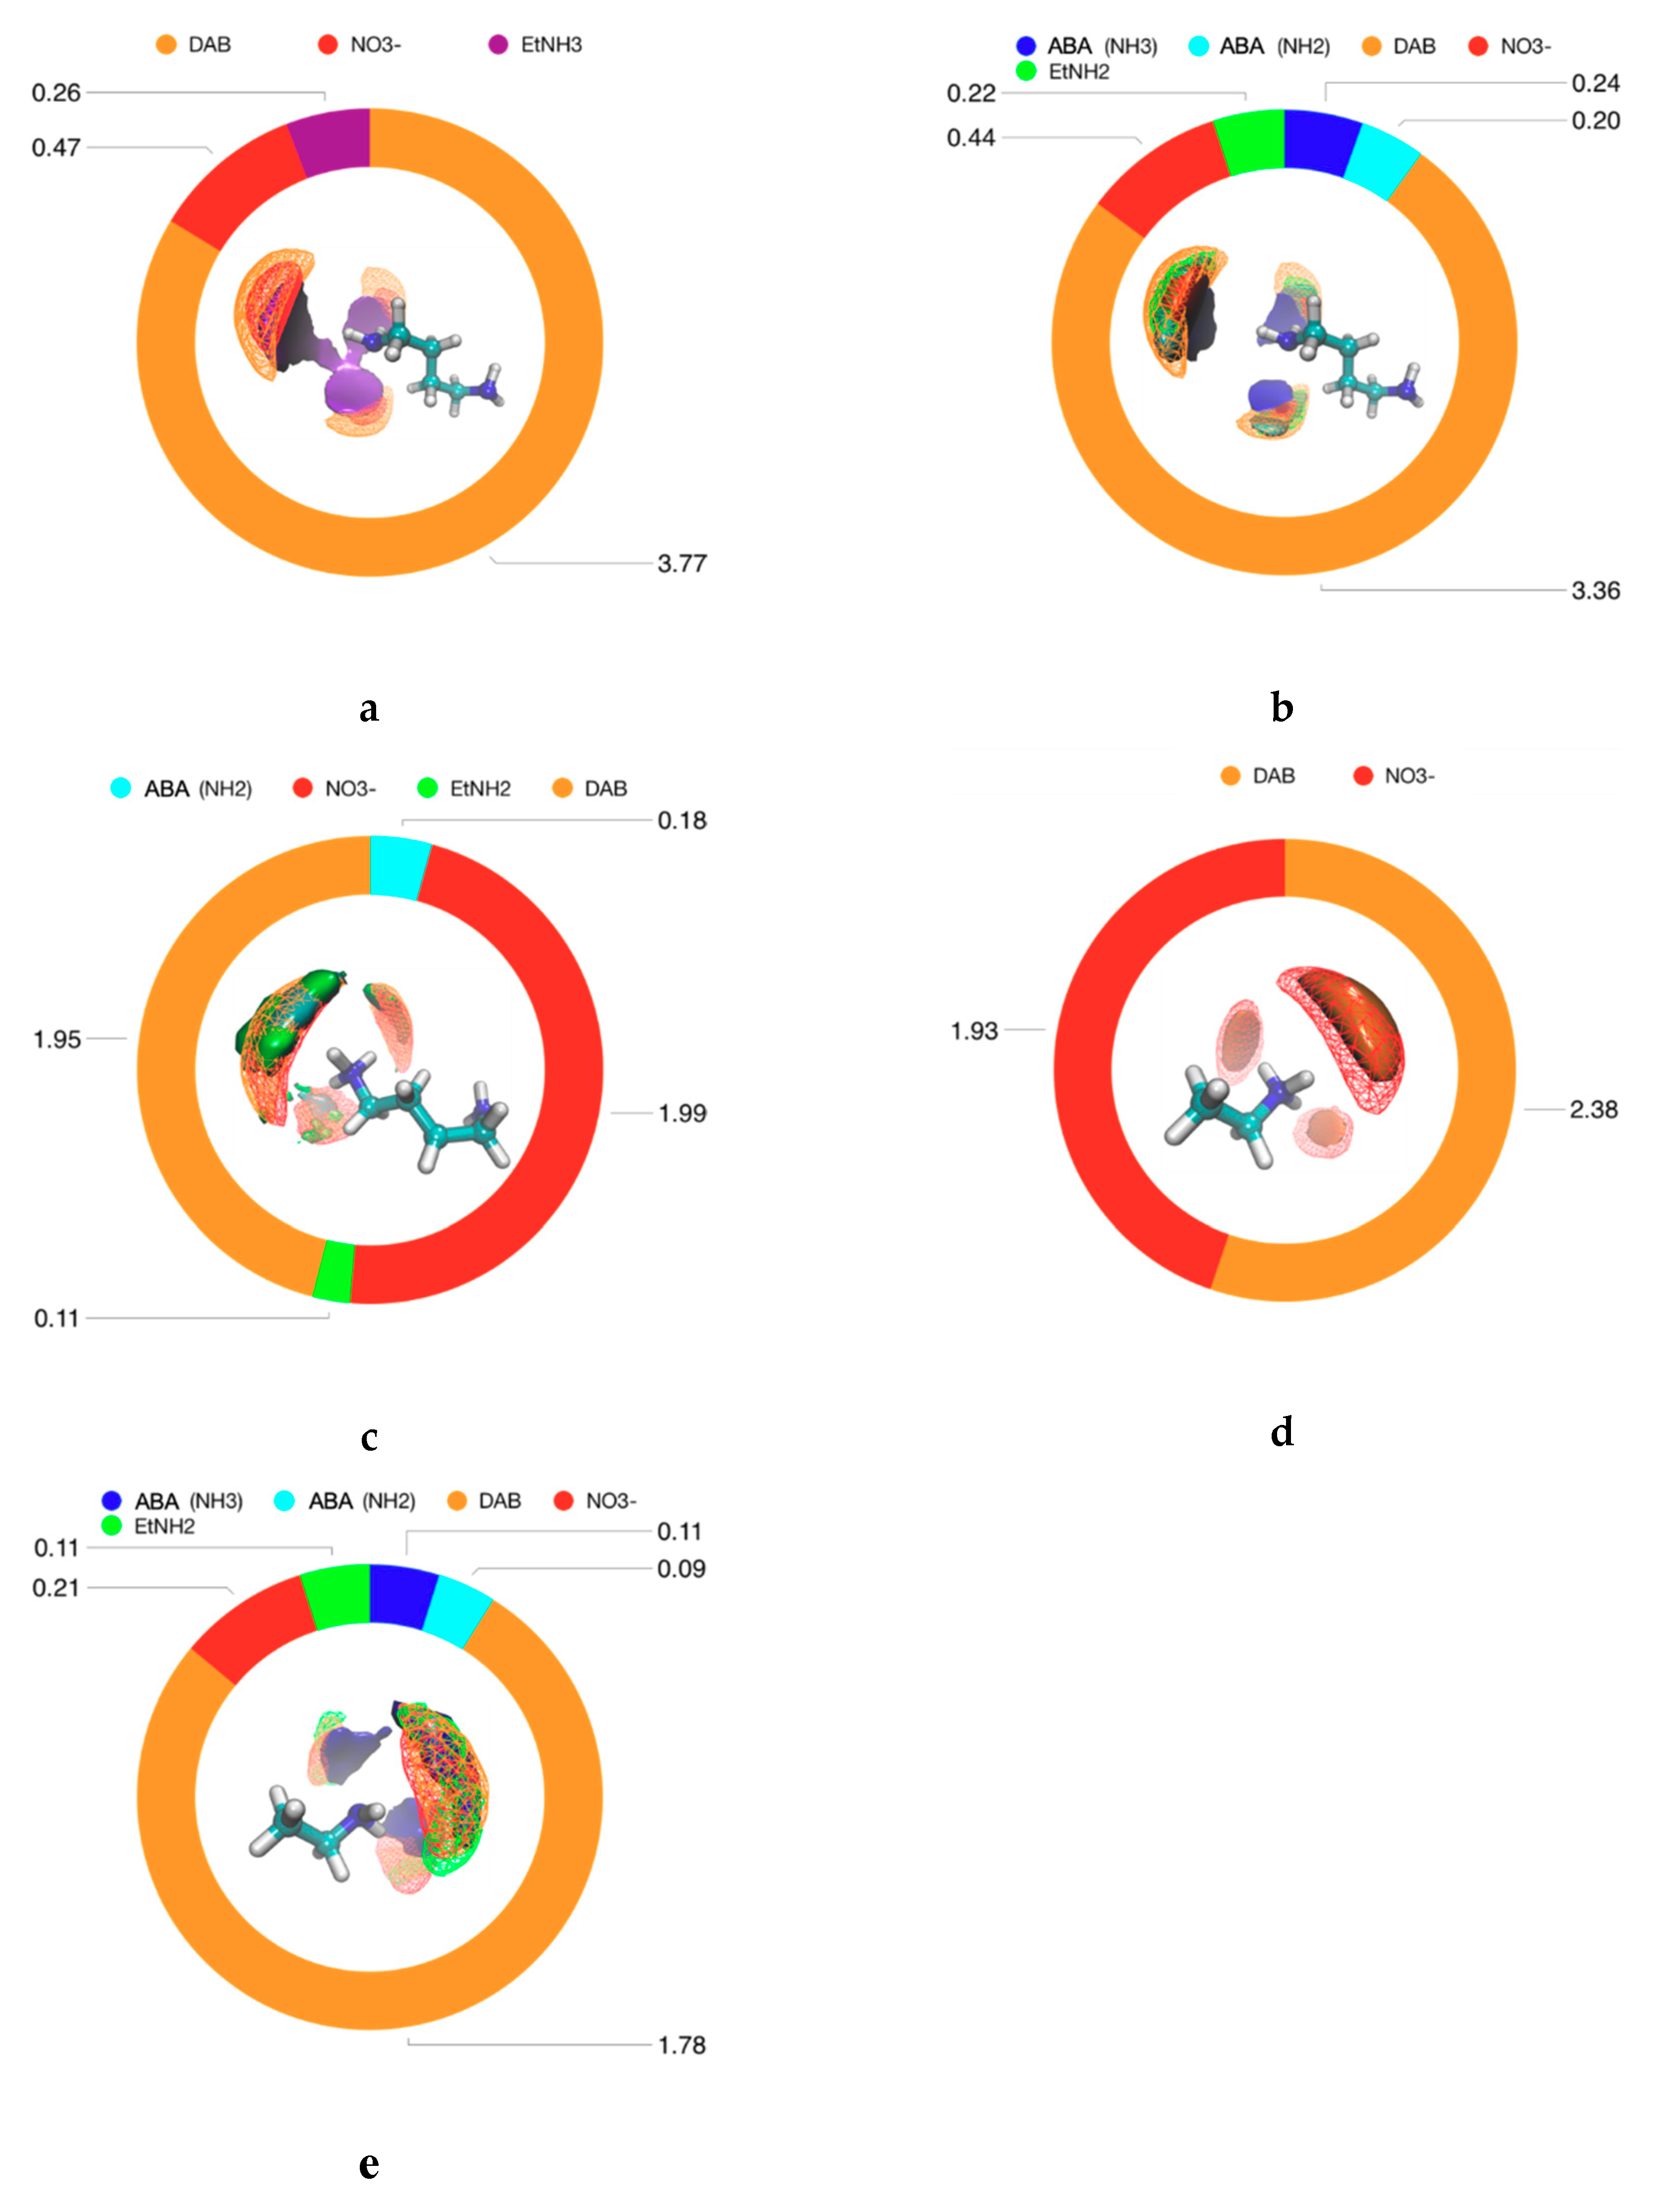
4. Results and Discussion

The experimental SAXS patterns for the EAN+DAB system with 0.1 EAN mole fraction are herein reported (Figure 1).
It appears evident from the experimental data that as the sample ages, an intense and broad band develops in the extreme low q region of the diffractograms. Mariani et al. [29] attributed this peculiar feature to nanoscale density fluctuations. Unlike previously reported similar behaviors, the time-dependent trend hints at a slow chemical reaction, which results in a more pronounced heterogeneity of the system as time passes. Over one year of observations, the LqE develops in a monotonic way, steadily increasing over time. It is interesting to note that after a relatively rapid evolution over the first day, the observed feature stays almost unchanged for one month, only to dramatically increase after a year. This peculiar trend could be explained with a two-stage process involving statistics, proton transfer, and vapor pressure. As they are structurally similar, EtNH2 and DAB have almost the same pKa ~10.8, and this makes the energy barrier for the proton transfer minimal. Strictly speaking, although the concept of pKa is fully meaningful in aqueous systems, it might be somehow useful to provide a rough estimation of the X-H bond strength even in organic media. The pKa similarity indicates that the proton transfer is possible; in fact, DFT calculations have shown that the energy barrier for the proton transfer is only ~1.5 kJ/mol, well below the thermal energy kBT at ambient temperature. In this scenario, the proton can jump from one nitrogen atom to another almost freely, but with the significant excess of DAB molecules, the chances that a proton coming from an ethylammonium cation will “land” on an ethylamine molecule are limited. Furthermore, EtNH2 has a vapor pressure of ~116 kPa at 20 °C, meaning that even if some molecules are trapped in the liquid system, a non-negligible amount will evaporate over time, pushing the reaction even more toward the formation of ABAN due to the Le Chatelier principle. To validate our interpretation, we took advantage of some large-sized classical molecular dynamics simulations. Due to the non-reactive nature of the method and given the ultra-long time of the observation (one year), we propose four different systems assuming certain characteristics. The first model shows the appearance of the system in the moment it gets mixed when no proton transfer has yet occurred, that is, a mixture of solely EAN and DAB. The second model accounts for a partial proton transfer to form the new IL, consisting of 0.5%mol EAN, 9.75%mol EtNH2, 9.75%mol ABAN and 80%mol DAB. The third one was built on the basis of 1H-NMR spectroscopy conducted for the one-year old sample.
As evident from the integral values in Figure 2, about 8.4%mol of EtNH2 evaporated, with an integral of only 2.75 for the -CH3 triplet at ~0.6 ppm, whereas it should be 3.00. This loss is also confirmed by the -NH2 peak at ~1.9 ppm, where the signals from DAB and EtNH2 superimpose, giving 37.78 whereas it should be 38.00. The same is true for the –CH2 peak at ~2.1 ppm where the signals for the -CH2 protons in α position respect to the amine group(s) are located. The last model is based on the extreme condition of complete evaporation of EtNH2, leaving a system made of DAB+ABAN.
We did not take into account the possible formation of 1,4-Diammoniumbutane because the double protonation of DAB is an unlikely event for two reasons: (i) there is a strong competition for a limited amount of acidic protons, i.e., there are 18 DAB amino-groups for each ammonium in EAN; (ii) two sharply localized net positive charges on such a small molecule are not very stable in a basic environment, i.e., even if 1,4-Diammoniumbutane is formed, it would quickly lose one of its acidic protons, transferring it into a neutral DAB molecule. The corresponding computed SAXS patterns are shown in Figure 3.
Although the qmin that can be reached by the simulation is much higher than the experimental one, the LqE can be easily observed. As can be seen, the quantitative proton transfer (purple to red curve) has a dramatic effect on the LqE intensity, indeed, passing from a shallow bump in the EAN-containing system to a very intense band when ABAN is considered. This difference reflects what has been experimentally observed, pointing at a model in which statistical proton transfer is involved. For the system with incomplete protonation, the curve is very similar to the one for complete transfer, as expected for a composition that differs for 0.5% mol only, but interestingly, the very last few low q points make the overall LqE less intense, suggesting a less extended clustering taking place (see below). This means that the presence of EAN, even in very small amounts, effectively interferes with the clustering. For the last, most extreme model in which we considered complete proton transfer and quantitative EtNH2 evaporation, the LqE is overall less intense than in the case of retained EtNH2. A comparison between the experimental and computed densities is reported in Table 2.
The experimental density shows a minor change over time, witnessing that the overall inter-molecular interactions are not strongly affected by the structural evolution. On the other hand, for the computed system with quantitative EtNH2 evaporation, the density is sensibly higher, whereas only minor changes can be observed for the other three models. It is interesting to note that the density change from the EAN+DAB model to the ones where the proton transfer is accounted, although small, follows the trend of the experimental values, becoming slightly smaller. Based on the density considerations, the NMR results, and on the relative intensities of the experimental LqEs, the model consisting of EtNH2+DAB+ABAN (10% mol EtNH2, 10% mol ABAN) is the one that is most likely to describe the one-year aged system. On this basis, herein we continue the analysis for the “no transfer” model mimicking the “fresh” sample and comparing it to the selected “total transfer” model in spite of the “aged” sample. As expected, the high-q part of the computed SAXS patterns is utterly unaffected by the proton transfer because that region is characterized by the medium-short range interactions, which are supposed to be almost unchanged after the transfer. Following this, we report some selected radial distribution functions to better understand the medium-short range molecular organization in both the simulated systems.
No differences were found in the DAB-DAB correlation, while for the other RDFs, only minor changes are observed, since the interacting functional groups are, in both cases, the same, leading to similar correlations with the surrounding molecules. Other interactions, tough, show the clear sign of large-scale heterogeneity in the system, as reported in Figure 4.
Figure 5a reports the amine-amine functional groups correlations in the ABAN-containing system. All the RDFs exhibit the same peaks at the same distance, meaning that all these hydrogen bonds have roughly the same strength. The same is also valid for Figure 5b, where amine-ammonium (both ethylammonium and 4-amino-1-butylammonium) are displayed, and for Figure 5c, i.e., the amine-nitrate correlation. Albeit the similarities, the correlations ABA(NH2)-ABA(NH2), ABA(NH2)-ABA(NH3), and ABA(NH2)-NO3 show a peculiar long-range behavior, where g(r) is sensibly larger than 1 even at 10 nm, pointing to the persistent heterogeneity of the system even in an equilibrium state, and it is the source of the LqE in the SAXS patterns To have a better picture of the 3D space around the molecules, we computed some spatial distribution functions and we extracted the coordination numbers from the RDFs.
The chemical environment of DAB (Figure 6a,b) is only slightly affected by the composition change in the system, and the only change is the statistical interaction with the new species formed after the proton transfer, i.e., ABAN-DAB interaction. Nevertheless, it is worth noting that the distribution of ethylammonium cations is more extended than the distribution of 4-amino-1-butylammonium cations, probably due to the more significant steric hindrance of ABA, which is almost twice the other. All the fragments are competing for the same positions in the proximity of the amine protons, as expected. Noteworthily, the two cations (ABA and ethylammonium) interact with DAB at a slightly different angle compared to all the other molecular entities, an effect that is easily explained considering that they are interacting with the amine lone pair, and not with its protons. Comparing Figure 6b,c, i.e., the charged and uncharged states of the diamine, the solvation shell change is evident, with nitrate anions replacing half of the DAB molecules. Remarkably, all the correlations are oriented towards the ammonium protons, with a clear preponderance of DAB molecules and NO3- anions. When considering the charged and uncharged states of the mono-amine, the conclusions are similar to the ones discussed above. Noteworthily, the coordination number of the cation–anion interaction is 1.93, whereas for ABAN, it is 1.99. This sensible change could be attributed to the extra stabilization effect coming from the simultaneous hydrogen bond of the anion with the ammonium and amine heads of the same cation, as shown in Figure 7.
This extra stabilization is observed in ~5% of the ABAN ion pairs, compatible with the difference in the coordination number. So far, we discussed how the local structure of the two systems is substantially the same, with small differences that cannot explain the long-range structural change observed experimentally and confirmed by the simulations. We pointed out that an RDF converging slowly to 1 (and from above) is a symptom of large-scale heterogeneity, which is attributed to the LqE. The density fluctuations responsible for this are easily individuated by looking at the snapshots of the simulation boxes.
The “no transfer” model consisting of EAN+DAB is shown in Figure 8a. There EAN ion pairs are shown as red and green Van der Waals beads, respectively highlighting the polar (cation’s polar head and nitrate anion) and apolar (cation’s aliphatic tail) parts of the ion pairs. Even if a sort of polar/apolar self-segregation can be seen, the ions are too dispersed to form proper domains, which would have resulted in a SAXS peak of around ~6.7 nm−1 [38]. In fact, as seen in Figure 1 and Figure 3, such a feature is not observed. The “total transfer” model is depicted in Figure 8b. Here, is not possible to define an apolar part for the ABA cation, since it has a polar functional group at both ends (NH2 and NH3+). As a result, the IL consists of only one domain made up of the entire cation and the anion, both indicated in red. The blue beads are the neutral ethylamine molecules formed after the proton transfer. Figure 8c shows the “partial transfer” model, where 10% mol of EAN ion pairs retain their protons. Here residual ethylammonium cation are represented in cyan, while the other colors are the same as in panel b. Finally, in Figure 8d, the “no EtNH2” model is depicted, with the same color scheme as panels b and c. It is easy to immediately spot the ionic regions’ different sizes in each model, as the ones in Figure 8b are the largest. These regions are in turn responsible for the LqE, in agreement with experimental and computed SAXS patterns, once again pointing to the “total transfer” model as the most appropriate to interpret the experimental results. In all the panels of Figure 8, the DAB molecules are rendered as an orange-transparent continuum. The uncanny resemblance between Figure 8 and a typical roman style “teglia di pizza”, along with the tendency to lose ethylamine over time inspired the three Roman authors for the manuscript title. Albeit in both systems, one can observe nanoscale clusters of ionic liquid floating in the DAB solvent; the clusters in the “no transfer” model are a meager part of the overall system volume, resulting in a smaller density fluctuation, and thus, in a less intense LqE. On the other hand, ABAN clusters are much bulkier, leading to the experimental and computed SAXS patterns observed. To quantify the clusters size, we defined two criteria to determine if an ion pair is part of a cluster: it must be hydrogen-bonded to at least two other ion pairs and if an ion pair A is in a cluster with ion-pair B and ion pair B is in a cluster with ion-pair C, then straightforwardly, A, B, and C are in the same cluster. The number of molecules composing each cluster is almost equal in both the systems (on average, 22.3 ion pairs for the EAN-containing system and 24.9 for the ABAN-containing system). This explains why the coordination numbers and the local structure seem very similar in the two cases. Nevertheless, the longer cation and its ability to form hydrogen bonds on both ends, resulting in overall bulkier clusters, generate more significant density fluctuations when ABAN is formed [40].

5. Conclusions

In summary, we reported the first-ever evidence of time-evolving nanoscale density fluctuations in a mixture of protic substances. The correlation with time is due to the slow kinetics of quantitative proton transfer driven solely by statistics and the long-term ethylamine evaporation, which pushes the whole reaction towards the formation of ABAN. This interpretation is supported by large-sized classic molecular dynamics simulations, which clearly show how the short-range structure and the numerosity of the observed ionic clusters are almost unaffected by the proton transfer. On the other hand, the clusters in the ABAN-containing systems end up being much larger and denser than their EAN counterparts, resulting in a higher LqE. In the proposed “steamy pizza” model, the LqE time evolution is due to the progressive loss of EtNH2 due to statistical proton transfer and the consequent shift of the equilibrium towards ABAN, which, in turn, results in more ethylamine being formed. The dynamic process described is responsible for the growth of larger and larger ABAN clusters which are directly responsible for the increased intensity of the LqE over time.

Author Contributions

Conceptualization, A.M. and M.B.; methodology, A.M.; validation, S.P.; formal analysis, A.M.; investigation, M.B.; resources, A.M. and M.B.; data curation, A.M.; writing—original draft preparation, A.M.; writing—review and editing, A.M, M.B. and S.P..; visualization, A.M.; supervision, S.P.; project administration, A.M.

Funding

This research received no external funding.

Acknowledgments

The small- and wide-angle scattering experiments were performed on beamline ID02 at ESRF. The authors gratefully acknowledge Dr. Roberto Buscaino for his assistance in NMR measurements, and Ms. Giorgia Tradico for the design of the table of content.

Conflicts of Interest

The authors declare no conflict of interest.

References

  1. Li Chum, H.; Koch, V.R.; Miller, L.L.; Osteryoung, R.A. An Electrochemical Scrutiny of Organometallic Iron Complexes and Hexamethylbenzene in a Room Temperature Molten Salt. J. Am. Chem. Soc. 1975, 97, 3264–3265. [Google Scholar] [CrossRef]
  2. Wilkes, J.S.; Levisky, J.A.; Wilson, R.A.; Hussey, C.L. Dialkylimidazolium Chloroaluminate Melts: A New Class of Room-Temperature Ionic Liquids for Electrochemistry, Spectroscopy, and Synthesis. Inorg. Chem. 1982, 21, 1263–1264. [Google Scholar] [CrossRef]
  3. Friedel, A.; Crafts, J.; Ador, E. Synthese der Benzoësäure und des Benzophenons mit Hülfe des Chlorkohlenoxyds. Ber. Der Dtsch. Chem. Ges. 1877, 10, 1854–1858. [Google Scholar] [CrossRef]
  4. Walden, P. Ueber die Molekulargr¨osse und elektrische Leitf¨ahigkeit einiger geschmolzenen Salze. Bull. I’Acad. Imp. Des. Sci. St.-Petersbg. 1914, 8, 405–422. [Google Scholar]
  5. De Santis, S.; Masci, G.; Casciotta, F.; Caminiti, R.; Scarpellini, E.; Campetella, M.; Gontrani, L. Cholinium-amino acid based ionic liquids: A new method of synthesis and physico-chemical characterization. Phys. Chem. Chem. Phys. 2015, 17, 20687–20698. [Google Scholar] [CrossRef]
  6. Ohno, H. Functional Design of Ionic Liquids. Bull. Chem. Soc. Jpn. 2006, 79, 1665–1680. [Google Scholar] [CrossRef]
  7. Totolin, V.; Minami, I.; Gabler, C.; Dörr, N. Halogen-free borate ionic liquids as novel lubricants for tribological applications. Tribol. Int. 2013, 67, 191–198. [Google Scholar] [CrossRef]
  8. Kuhlmann, E.; Himmler, S.; Giebelhaus, H.; Wasserscheid, P. Imidazolium dialkylphosphates - A class of versatile, halogen-free and hydrolytically stable ionic liquids. Green Chem. 2007, 9, 233–242. [Google Scholar] [CrossRef]
  9. Wasserscheid, P.; Van Hal, R.; Bösmann, A. 1-n-butyl-3-methylimidazolium ([bmim]) octylsulfate–An even “greener” ionic liquid. Green Chem. 2002, 4, 400–404. [Google Scholar] [CrossRef]
  10. Thuy Pham, T.P.; Cho, C.W.; Yun, Y.S. Environmental fate and toxicity of ionic liquids: A review. Water Res. 2010, 44, 352–372. [Google Scholar] [CrossRef]
  11. Mallakpour, S.; Dinari, M. Ionic liquids as green solvents: Progress and Prospects. In Green Solvents II: Properties and Applications of Ionic Liquids; Springer Science & Business Media: Berlin, Germany, 2012; pp. 1–32. ISBN 978-940-072-891-2. [Google Scholar]
  12. Plechkova, N.V.; Seddon, K.R. Applications of ionic liquids in the chemical industry. Chem. Soc. Rev. 2008, 37, 123–150. [Google Scholar] [CrossRef] [PubMed]
  13. Scarpellini, E.; Ortolani, M.; Nucara, A.; Baldassarre, L.; Missori, M.; Fastampa, R.; Caminiti, R. Stabilization of the Tensile Strength of Aged Cellulose Paper by Cholinium-Amino Acid Ionic Liquid Treatment. J. Phys. Chem. C 2016, 120, 24088–24097. [Google Scholar] [CrossRef]
  14. Ke, M.; Zhou, A.; Song, Z.; Jiang, Q. Toxicity of ionic liquids. Prog. Chem. 2007, 19, 671–679. [Google Scholar]
  15. Visser, A.E.; Swatloski, R.P.; Reichert, W.M.; Mayton, R.; Sheff, S.; Wierzbicki, A.; Davis, J.H.; Rogers, R.D. Task-specific ionic liquids incorporating novel cations for the coordination and extraction of Hg 2+ and Cd 2+ : Synthesis, characterization, and extraction studies. Environ. Sci. Technol. 2002, 36, 2523–2529. [Google Scholar] [CrossRef] [PubMed]
  16. Rogers, R.D.; Seddon, K.R. Ionic Liquids - Solvents of the Future? Science 2003, 302, 792–793. [Google Scholar] [CrossRef] [PubMed]
  17. Chiappe, C.; Pieraccini, D. Ionic liquids: Solvent properties and organic reactivity. J. Phys. Org. Chem. 2005, 18, 275–297. [Google Scholar] [CrossRef]
  18. Galiński, M.; Lewandowski, A.; Stępniak, I. Ionic liquids as electrolytes. Electrochim. Acta 2006, 51, 5567–5580. [Google Scholar] [CrossRef]
  19. Armand, M.; Endres, F.; MacFarlane, D.R.; Ohno, H.; Scrosati, B. Ionic-liquid materials for the electrochemical challenges of the future. Nat. Mater. 2009, 8, 621–629. [Google Scholar] [CrossRef]
  20. Greaves, T.L.; Drummond, C.J. Protic Ionic Liquids: Evolving Structure–Property Relationships and Expanding Applications. Chem. Rev. 2015, 115, 11379–11448. [Google Scholar] [CrossRef]
  21. Greaves, T.L.; Weerawardena, A.; Fong, C.; Krodkiewska, I.; Drummond, C.J. Protic Ionic Liquids: Solvents with Tunable Phase Behavior and Physicochemical Properties. J. Phys. Chem. B 2006, 110, 22479–22487. [Google Scholar] [CrossRef]
  22. Campetella, M.; Montagna, M.; Gontrani, L.; Scarpellini, E.; Bodo, E. Unexpected proton mobility in the bulk phase of cholinium-based ionic liquids: New insights from theoretical calculations. Phys. Chem. Chem. Phys. 2017, 19, 11869–11880. [Google Scholar] [CrossRef] [PubMed]
  23. Bodo, E.; Mangialardo, S.; Ramondo, F.; Ceccacci, F.; Postorino, P. Unravelling the Structure of Protic Ionic Liquids with Theoretical and Experimental Methods: Ethyl-, Propyl- and Butylammonium Nitrate Explored by Raman Spectroscopy and DFT Calculations. J. Phys. Chem. B 2012, 116, 13878–13888. [Google Scholar] [CrossRef] [PubMed]
  24. Greaves, T.L.; Kennedy, D.F.; Kirby, N.; Drummond, C.J. Nanostructure changes in protic ionic liquids (PILs) through adding solutes and mixing PILs. Phys. Chem. Chem. Phys. 2011, 13, 13501. [Google Scholar] [CrossRef] [PubMed]
  25. Russina, O.; Macchiagodena, M.; Kirchner, B.; Mariani, A.; Aoun, B.; Russina, M.; Caminiti, R.; Triolo, A. Association in ethylammonium nitrate–dimethyl sulfoxide mixtures: First structural and dynamical evidences. J. Non. Cryst. Solids 2015, 407, 333–338. [Google Scholar] [CrossRef]
  26. Marsh, K.; Boxall, J.; Lichtenthaler, R. Room temperature ionic liquids and their mixtures—A review. Fluid Phase Equilib. 2004, 219, 93–98. [Google Scholar] [CrossRef]
  27. Jiang, H.J.; FitzGerald, P.A.; Dolan, A.; Atkin, R.; Warr, G.G. Amphiphilic Self-Assembly of Alkanols in Protic Ionic Liquids. J. Phys. Chem. B 2014, 118, 9983–9990. [Google Scholar] [CrossRef]
  28. Mariani, A.; Dattani, R.; Caminiti, R.; Gontrani, L. Nanoscale Density Fluctuations in Ionic Liquid Binary Mixtures with Nonamphiphilic Compounds: First Experimental Evidence. J. Phys. Chem. B 2016, 120, 10540–10546. [Google Scholar] [CrossRef]
  29. Mariani, A.; Caminiti, R.; Ramondo, F.; Salvitti, G.; Mocci, F.; Gontrani, L. Inhomogeneity in Ethylammonium Nitrate—Acetonitrile Binary Mixtures: The Highest “Low q Excess” Reported to Date. J. Phys. Chem. Lett. 2017, 8, 3512–3522. [Google Scholar] [CrossRef]
  30. Campetella, M.; Mariani, A.; Sadun, C.; Wu, B.; Castner, E.W.; Gontrani, L. Structure and dynamics of propylammonium nitrate-acetonitrile mixtures: An intricate multi-scale system probed with experimental and theoretical techniques. J. Chem. Phys. 2018, 148, 134507. [Google Scholar] [CrossRef]
  31. Mariani, A.; Bonomo, M.; Wu, B.; Centrella, B.; Dini, D.; Castner, E.W.; Gontrani, L. Intriguing transport dynamics of ethylammonium nitrate–Acetonitrile binary mixtures arising from nano-inhomogeneity. Phys. Chem. Chem. Phys. 2017, 19, 27212–27220. [Google Scholar] [CrossRef]
  32. Van Vaerenbergh, P.; Léonardon, J.; Sztucki, M.; Boesecke, P.; Gorini, J.; Claustre, L.; Sever, F.; Morse, J.; Narayanan, T. An upgrade beamline for combined wide, small and ultra small-angle x-ray scattering at the ESRF. In Proceedings of the 12th International Conference on Synchrtron Radiation Instrumentation, AIP Conference Proceedings, New York, NY, USA, 6–10 July 2015; Volume 1741, p. 030034. [Google Scholar]
  33. Case, D.A.; Cheatham, T.E.; Darden, T.; Gohlke, H.; Luo, R.; Merz, K.M.; Onufriev, A.; Simmerling, C.; Wang, B.; Woods, R.J. The Amber biomolecular simulation programs. J. Comput. Chem. 2005, 26, 1668–1688. [Google Scholar] [CrossRef] [PubMed]
  34. Sprenger, K.G.; Jaeger, V.W.; Pfaendtner, J. The General AMBER Force Field (GAFF) Can Accurately Predict Thermodynamic and Transport Properties of Many Ionic Liquids. J. Phys. Chem. B 2015, 119, 5882–5895. [Google Scholar] [CrossRef] [PubMed]
  35. Frisch, M.J.; Trucks, G.W.; Schlegel, H.B.; Scuseria, G.E.; Robb, M.A.; Cheeseman, J.R.; Scalmani, G.; Barone, V.; Mennucci, B.; Petersson, G.A.; et al. Gaussian 09, version D.01; Gaussian; Inc.: Wallingford, CT, USA, 2009. [Google Scholar]
  36. Dupradeau, F.Y.; Pigache, A.; Zaffran, T.; Savineau, C.; Lelong, R.; Grivel, N.; Lelong, D.; Rosanski, W.; Cieplak, P. The R.E.D. tools: Advances in RESP and ESP charge derivation and force field library building. Phys. Chem. Chem. Phys. 2010, 12, 7821. [Google Scholar] [CrossRef] [PubMed] [Green Version]
  37. Martínez, L.; Andrade, R.; Birgin, E.G.; Martínez, J.M. PACKMOL: A package for building initial configurations for molecular dynamics simulations. J. Comput. Chem. 2009, 30, 2157–2164. [Google Scholar] [CrossRef]
  38. Mariani, A.; Caminiti, R.; Campetella, M.; Gontrani, L. Pressure-induced mesoscopic disorder in protic ionic liquids: First computational study. Phys. Chem. Chem. Phys. 2016, 18, 2297–2302. [Google Scholar] [CrossRef]
  39. Brehm, M.; Kirchner, B. TRAVIS—A Free Analyzer and Visualizer for Monte Carlo and Molecular Dynamics Trajectories. J. Chem. Inf. Model. 2011, 51, 2007–2023. [Google Scholar] [CrossRef] [Green Version]
  40. Bodo, E.; Mangialardo, S.; Capitani, F.; Gontrani, L.; Leonelli, F.; Postorino, P. Interaction of a long alkyl chain protic ionic liquid and water. J. Chem. Phys. 2014, 140, 204503. [Google Scholar] [CrossRef] [Green Version]
Figure 1. Experimental SAXS patterns for the EAN+DAB (10%mol EAN) mixture. Data were collected at room temperature at ID02 beamline of ESRF. Five minutes after preparation (purple); 1 h (cyan); 1 day (dark green); 1 week (light green); 1 month (orange); 1 year (red).
Symmetry 11 01425 g001
Figure 2. Normalized 1H spectrum of the one-year old sample.
Symmetry 11 01425 g002
Figure 3. Computed SAXS patterns for EAN+DAB (10% mol EAN) (purple); ABAN+DAB (10% mol ABAN) (gray); EAN+EtNH2+DAB+ABAN (0.5% mol EAN, 9.75% mol EtNH2, 9.75% mol ABAN) (black); EtNH2+DAB+ABAN (10% mol EtNH2, 10% mol ABAN) (red).
Symmetry 11 01425 g003
Figure 4. Radial distribution functions for selected hydrogen bonded pairs. Anion-cation (a); DAB-DAB (b); DAB-anion (c); cation-cation (d); anion-anion (e). In all the panels EAN-containing system (black); ABAN-containing system (red).
Symmetry 11 01425 g004
Figure 5. Radial distribution functions for selected hydrogen-bonded pairs. Amine-amine (a), where ethylamine-ethylamine (black); ethylamine-ABA(NH2) (red); DAB-ABA(NH2) (blue); ethylamine-DAB (purple); ABA(NH2)-ABA(NH2) (green). Amine-ammonium (b), where DAB-ethylammonium (black); ethylamine-ABA(NH3) (blue); DAB-ABA(NH3) (red); ABA(NH2)-ABA(NH3) (green). Amine-anion (c), where ethylamine-anion (black); DAB-anion in the “no transfer” model (blue); DAB-anion in the “total transfer” model (red); ABA(NH2)-anion (green).
Symmetry 11 01425 g005
Figure 6. Coordination numbers and spatial distribution functions. For all the panels, the color of the diagram and the isosurface is the same for a given fragment. All the isosurfaces are plotted for a value of twice the average density. DAB in EAN-containing system (a); DAB in ABAN-containing system (b); ABA (c); Ethylammonium (d); Ethylamine (e).
Symmetry 11 01425 g006
Figure 7. Schematics of the end-to-end bridging hydrogen bond responsible for the stabilization of the ABAN ion pair.
Symmetry 11 01425 g007
Figure 8. Snapshots of the simulated systems. (a) EAN+DAB (10% mol EAN); (b) EtNH2+DAB+ABAN (10% mol EtNH2, 10% mol ABAN); (c) EAN+EtNH2+DAB+ABAN (0.5% mol EAN, 9.75% mol EtNH2, 9.75% mol ABAN); (d) ABAN+DAB (10% mol ABAN). Polar part (red); apolar part (green); DAB (transparent-orange); ethylamine (blue); for panel c ethylammonium (cyan). For all the panels, only a 20 Å thick slice is shown for clarity.
Symmetry 11 01425 g008
Table 1. Composition of the two simulated systems.
CompositionModelEANDABEtNH2ABANSide [Å]
EAN+DABNo Transfer528047524N/AN/A208.41
EtNH2+ABAN+DABTotal TransferN/A4224448375280208.68
EAN+EtNH2+ABAN+DABPartial Transfer2674251150135013208.66
ABAN+DABNo EtNH2N/A42244N/A5280203.30
Table 2. Comparison between experimental and computed densities.
Experimental [g/mL]Computed [g/mL]
System1 Day Old1 Year OldNo TransferTotal TransferPartial TransferNo EtNH2
Density0.868850.861440.87160.86830.86850.8920

