A Novel Tool for Supervised Segmentation Using 3D Slicer


Department of Theoretical and Experimental Electrical Engineering, Brno University of Technology, Technická 3082/12, 616 00 Brno, Czech Republic
*
Author to whom correspondence should be addressed.
Symmetry 2018, 10(11), 627; https://doi.org/10.3390/sym10110627
Submission received: 15 October 2018
/
Revised: 31 October 2018
/
Accepted: 7 November 2018
/
Published: 12 November 2018
(This article belongs to the Special Issue Symmetry in Engineering Sciences)
Abstract
:The rather impressive extension library of medical image-processing platform 3D Slicer lacks a wide range of machine-learning toolboxes. The authors have developed such a toolbox that incorporates commonly used machine-learning libraries. The extension uses a simple graphical user interface that allows the user to preprocess data, train a classifier, and use that classifier in common medical image-classification tasks, such as tumor staging or various anatomical segmentations without a deeper knowledge of the inner workings of the classifiers. A series of experiments were carried out to showcase the capabilities of the extension and quantify the symmetry between the physical characteristics of pathological tissues and the parameters of a classifying model. These experiments also include an analysis of the impact of training vector size and feature selection on the sensitivity and specificity of all included classifiers. The results indicate that training vector size can be minimized for all classifiers. Using the data from the Brain Tumor Segmentation Challenge, Random Forest appears to have the widest range of parameters that produce sufficiently accurate segmentations, while optimal Support Vector Machines’ training parameters are concentrated in a narrow feature space.
1. Introduction
3D Slicer [1] is a free open-source platform for medical image visualization and processing. Its main functionality comes from the Extension Library, which consists of various modules that allow specific analyses of the input data, such as filtering, artefact suppression, or surface reconstruction. There is a lack of machine-learning extensions except for the open-source DeepInfer [2]. This deep-learning deployment kit uses 3D convolutional neural networks to detect and localize the target tissue. The development team demonstrated the use of this kit on the prostate segmentation problem for image-guided therapy. Researchers and practitioners are able to select a publicly available task-oriented network through the module without the need to design or train it.
To enable the use of other machine-learning techniques, we developed the Supervised Segmentation Toolbox as an extensible machine-learning platform for 3D Slicer. Currently, Support Vector Machine (SVM) and Random Forest (RF) classifiers are included. These classifiers are well-researched and often used in image-processing tasks, as demonstrated in References [3,4,5,6,7,8].
SVMs [9] train by maximizing the distance between marginal samples (also referred to as support vectors) and a discriminative hyperplane by maximizing f in the equation:
where y is defined as +1 for a class A sample and –1 for a class B sample, is a Lagrangian multiplier, and is the feature vector of the individual sample. On real data, this is often too strict because of noisy samples that might cross their class boundary. This is solved by using a combination of techniques known as the kernel trick and soft margining. The kernel trick uses a kernel function to remap the original feature space to a higher-dimensional one by replacing the dot product in Equation (1) with . This allows linear separation of the data as required by the SVM. An example of the kernel function is the radial basis function used in this study. Incorporating a soft margin allows some samples to cross their class boundary. Examples of such soft-margin SVMs are the C-SVM [10] and N-SVM [11]. The C parameter of the C-SVM modifies the influence of each support vector on the final discriminatory hyperplane. The larger the C, the closer the soft-margin C-SVM is to a hard-margin SVM. The N parameter of the N-SVM defines a minimum number of support vectors and, consequently, an upper bound of the guaranteed maximum percentage of misclassifications. Further modifications to the SVM can also be done, such as using fuzzy-data points for the training dataset, as demonstrated in References [5,6].
RF uses a voting system on the results of the individual decision trees. Each decision tree is created on the basis of a bootstrapped sample of the training data [12].
2. Materials and Methods
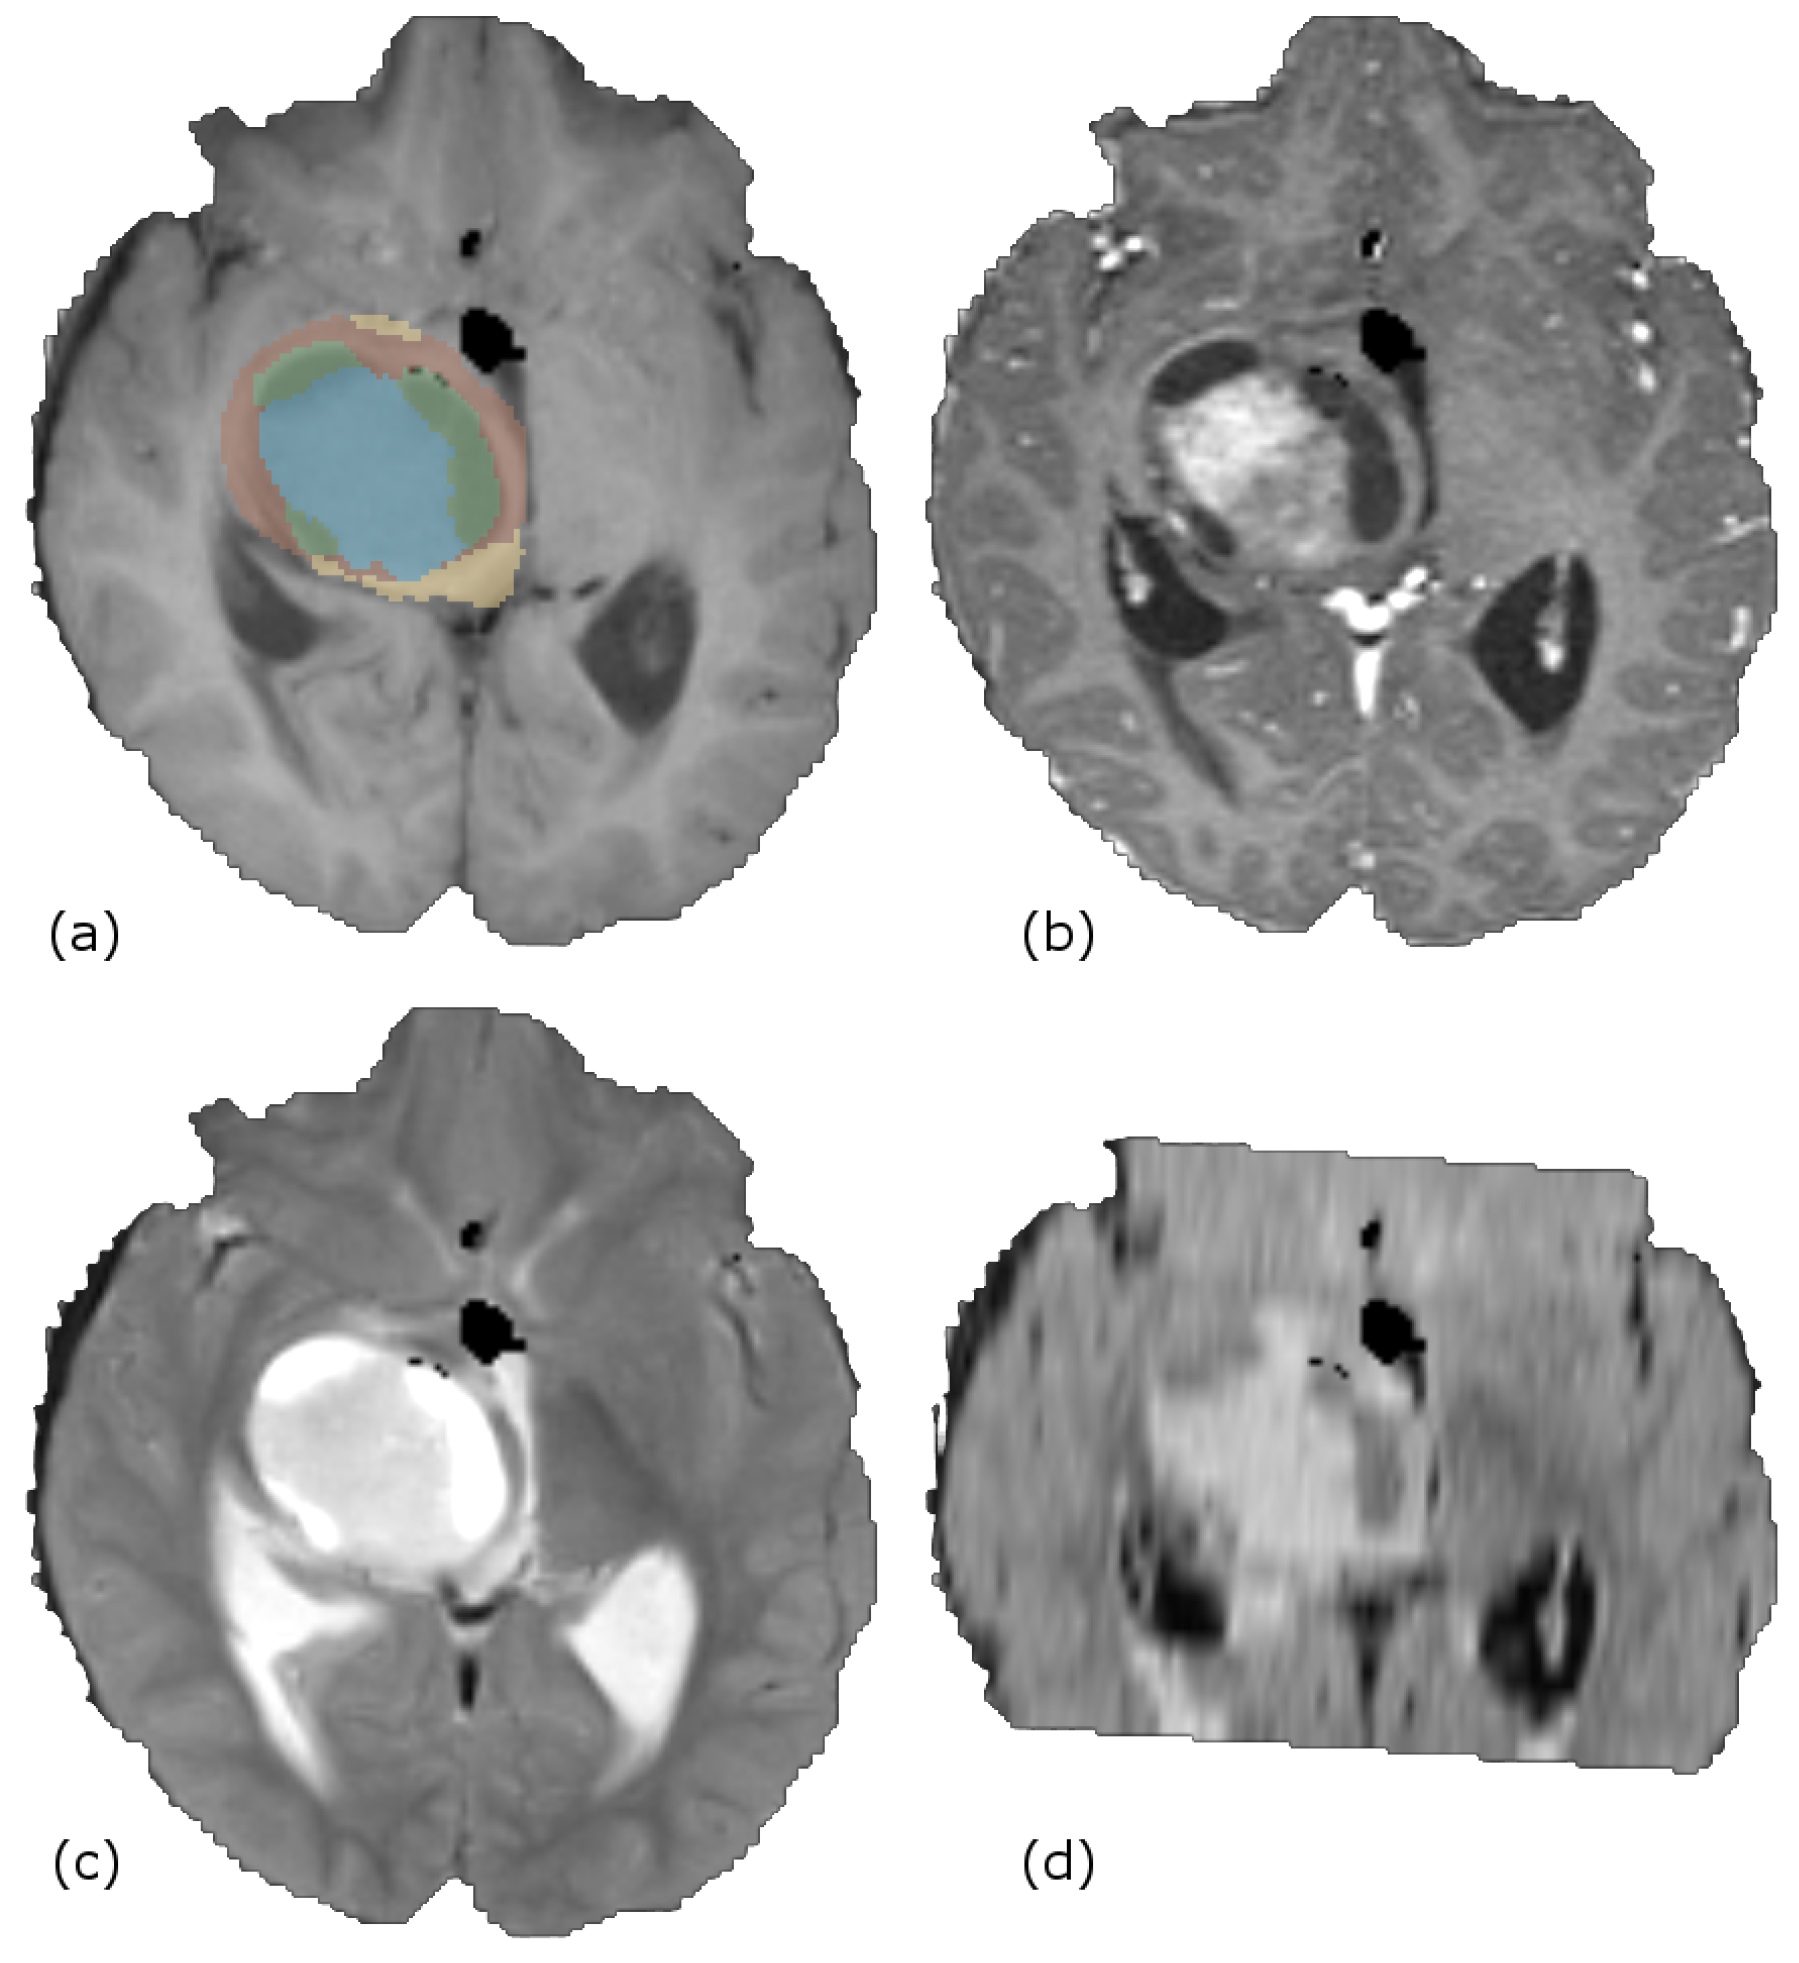
The data used in this study describe Low Grade Glioma (LGG) obtained by MRI. The dataset consists of four images of one patient (LG_0001, Figure 1): T1- and T2-weighted, contrast-enhanced T1C, and Fluid Attenuated Inversion Recovery (FL). These data are part of the training set featured in the Brain Tumor Segmentation (BraTS) 2012 Challenge.
The free and open-source Supervised Segmentation Toolbox extension [13] of the 3D Slicer was used throughout this study. The extension allows the user to train a range of classifiers using labeled data. The user is also able to perform a grid search to select the optimal parameters for the classifier. To achieve this, the extension uses either an already available function or a cross-validation algorithm developed by the author of the extension, depending on the classifier library used. Currently, N-SVM and C-SVM from the dlib library [14] and C-SVM and Random Forest from Shark-ml library [15] are incorporated. The extension takes care of the parallelizable parts of the training and classification subtasks, thus significantly reducing computation times. A preprocessing algorithm selection is also a part of the extension. This allows for artefact correction or feature extraction. The extension workflow is depicted in Figure 2.
3. Results and Discussion
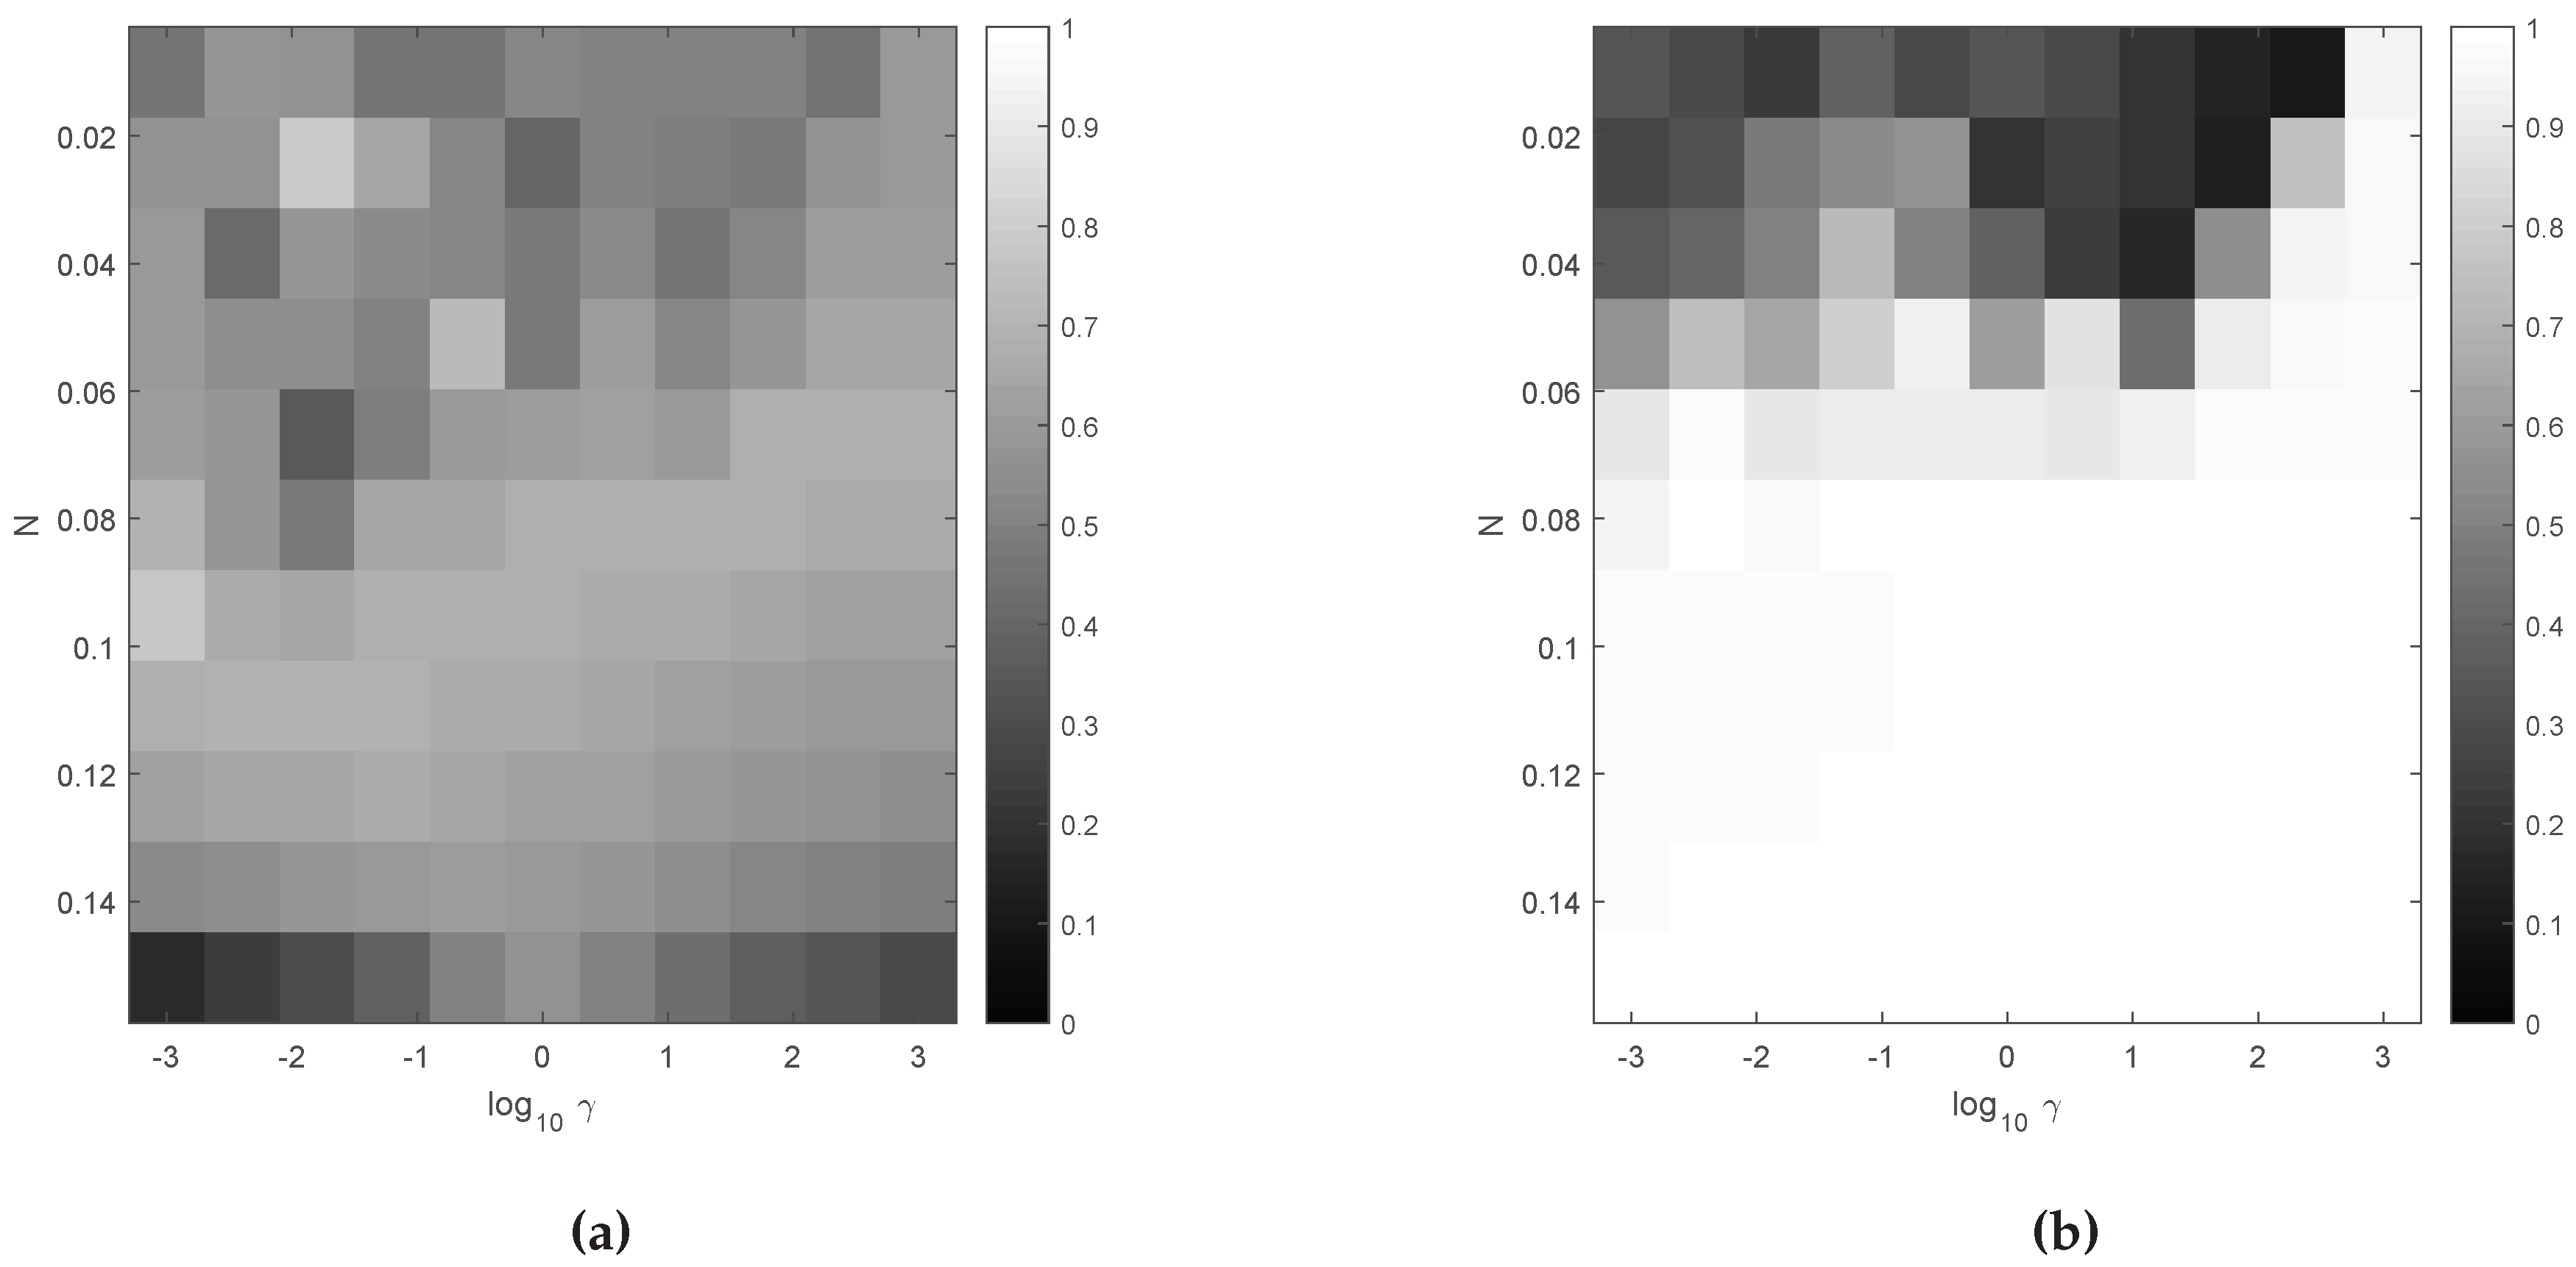
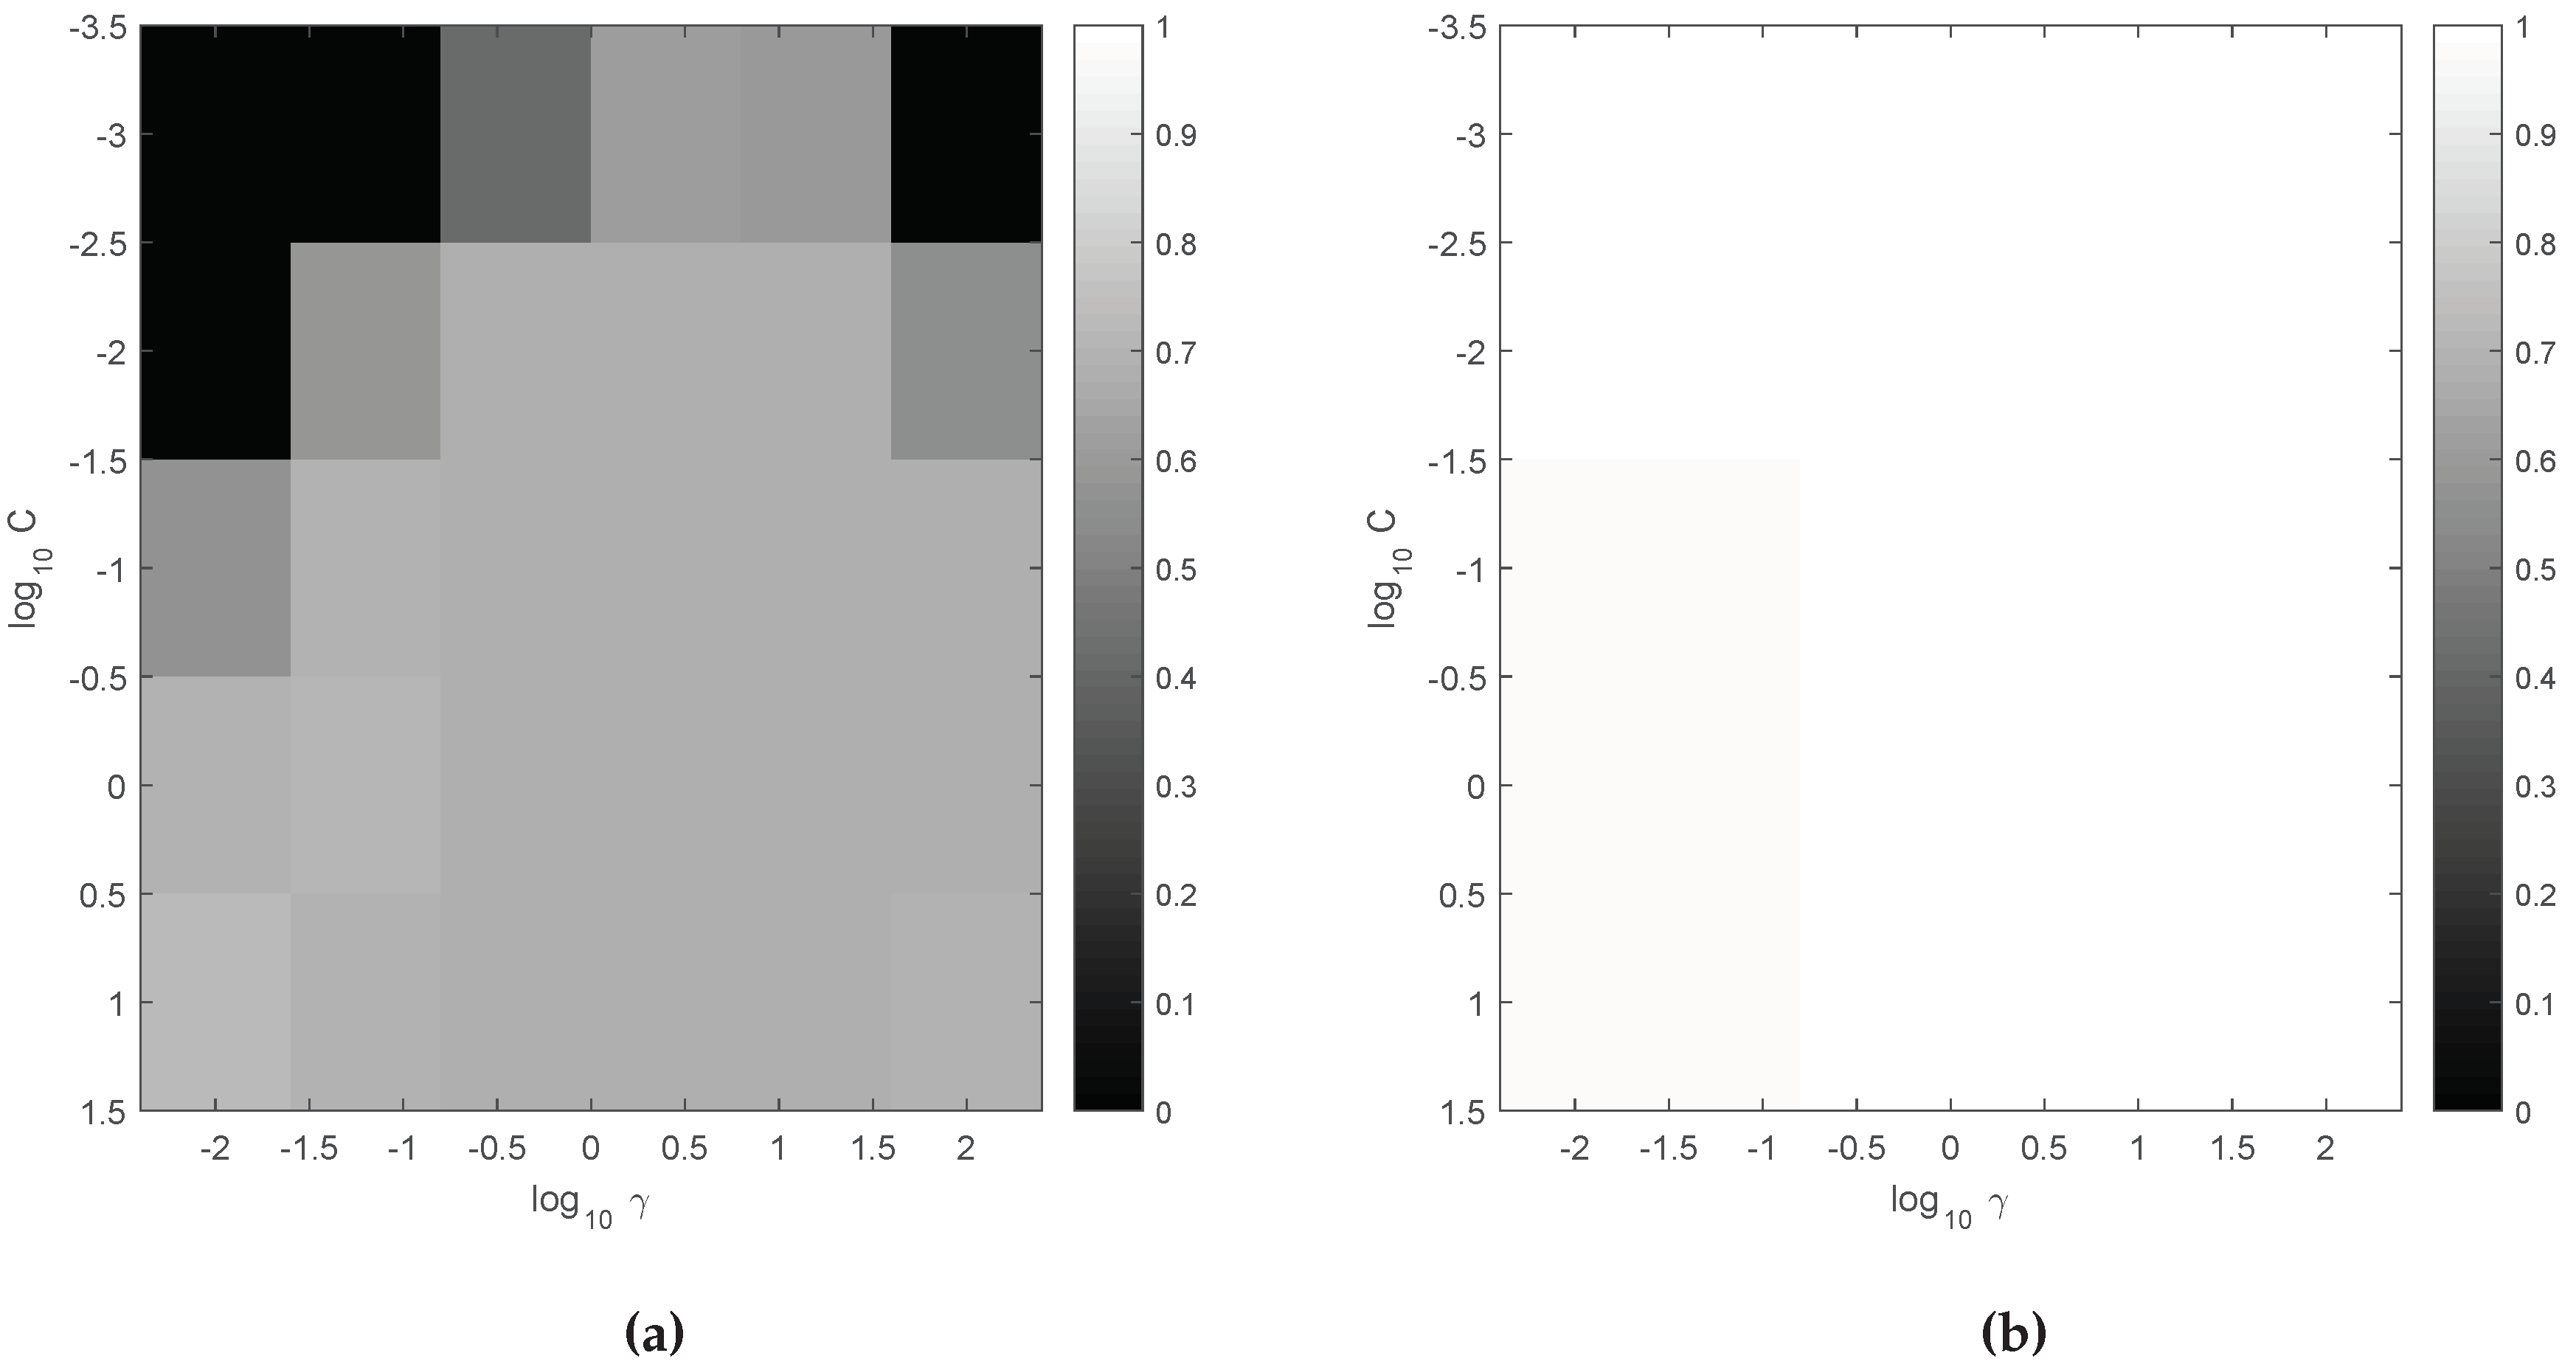
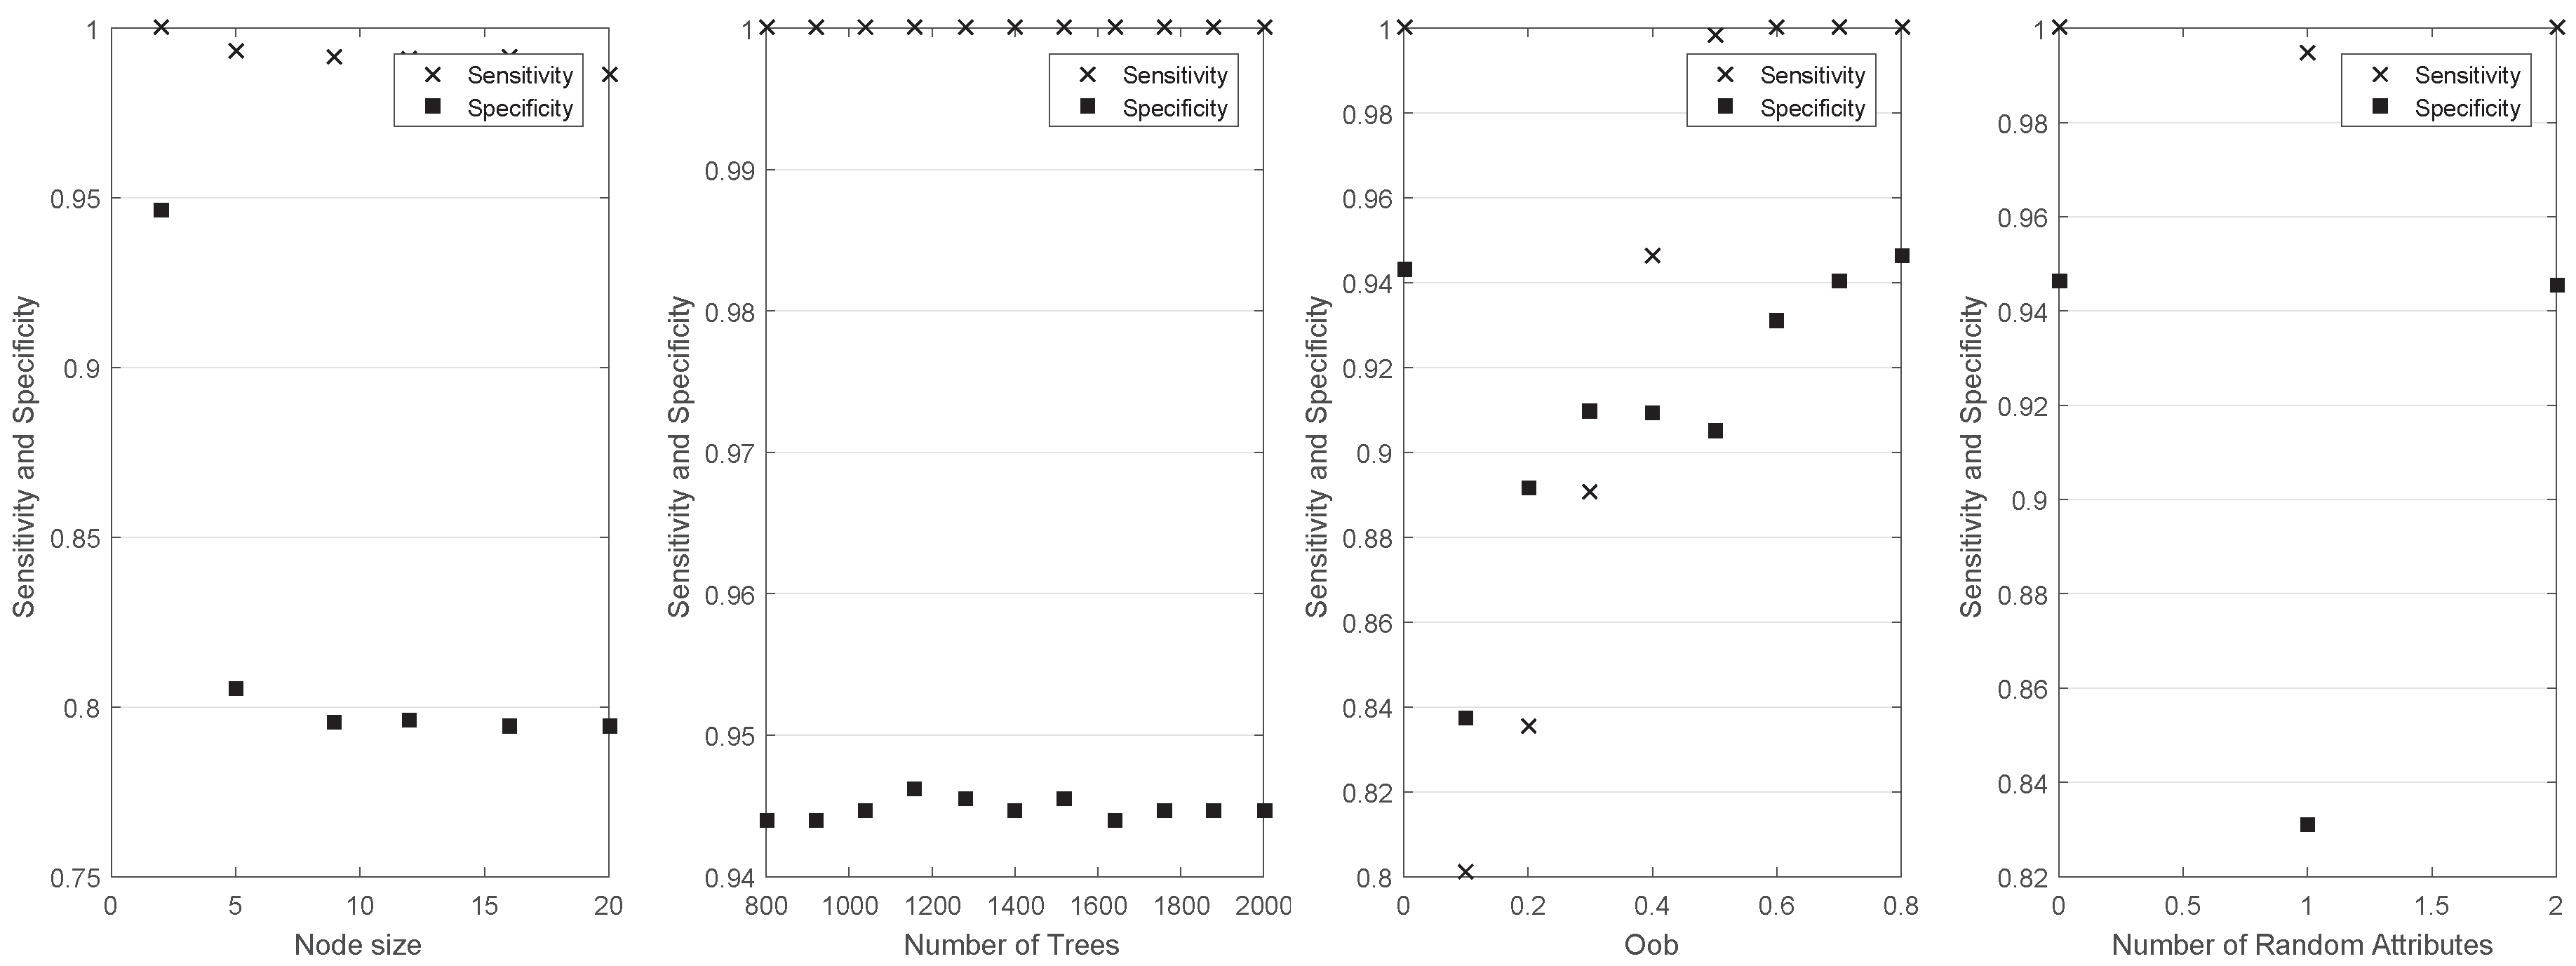
A series of tests were performed in order to provide a sense of the speed and accuracy of the provided classifiers. Sensitivity and specificity metrics were used to evaluate the results. A classifier that had a larger sum of specificity and sensitivity (or their respective means, when cross-validation was used) was considered a better classifier. During the first test run, each type of classifier was trained and evaluated using the single patient image set. Optimal training parameters of the classifiers were obtained using a grid-search approach. The results are presented in Figure 3, Figure 4 and Figure 5. The parameter is common in both SVM classifiers and influences the variance of the radial basis kernel. A large means that more data points will look similar, thus preventing overfitting. Using the aforementioned dataset, the results indicate a relative insensitivity of the classification accuracy on this parameter. For the given dataset, C values of the C-SVM larger than 1 seem optimal. The best results of the N-SVM classifier are obtained with N around 10% or lower combined with a high-variance radial basis function. Optimal RF training parameters were: a small node size of under 5, number of trees higher than 800, no out-of-bag samples, and no random attributes.
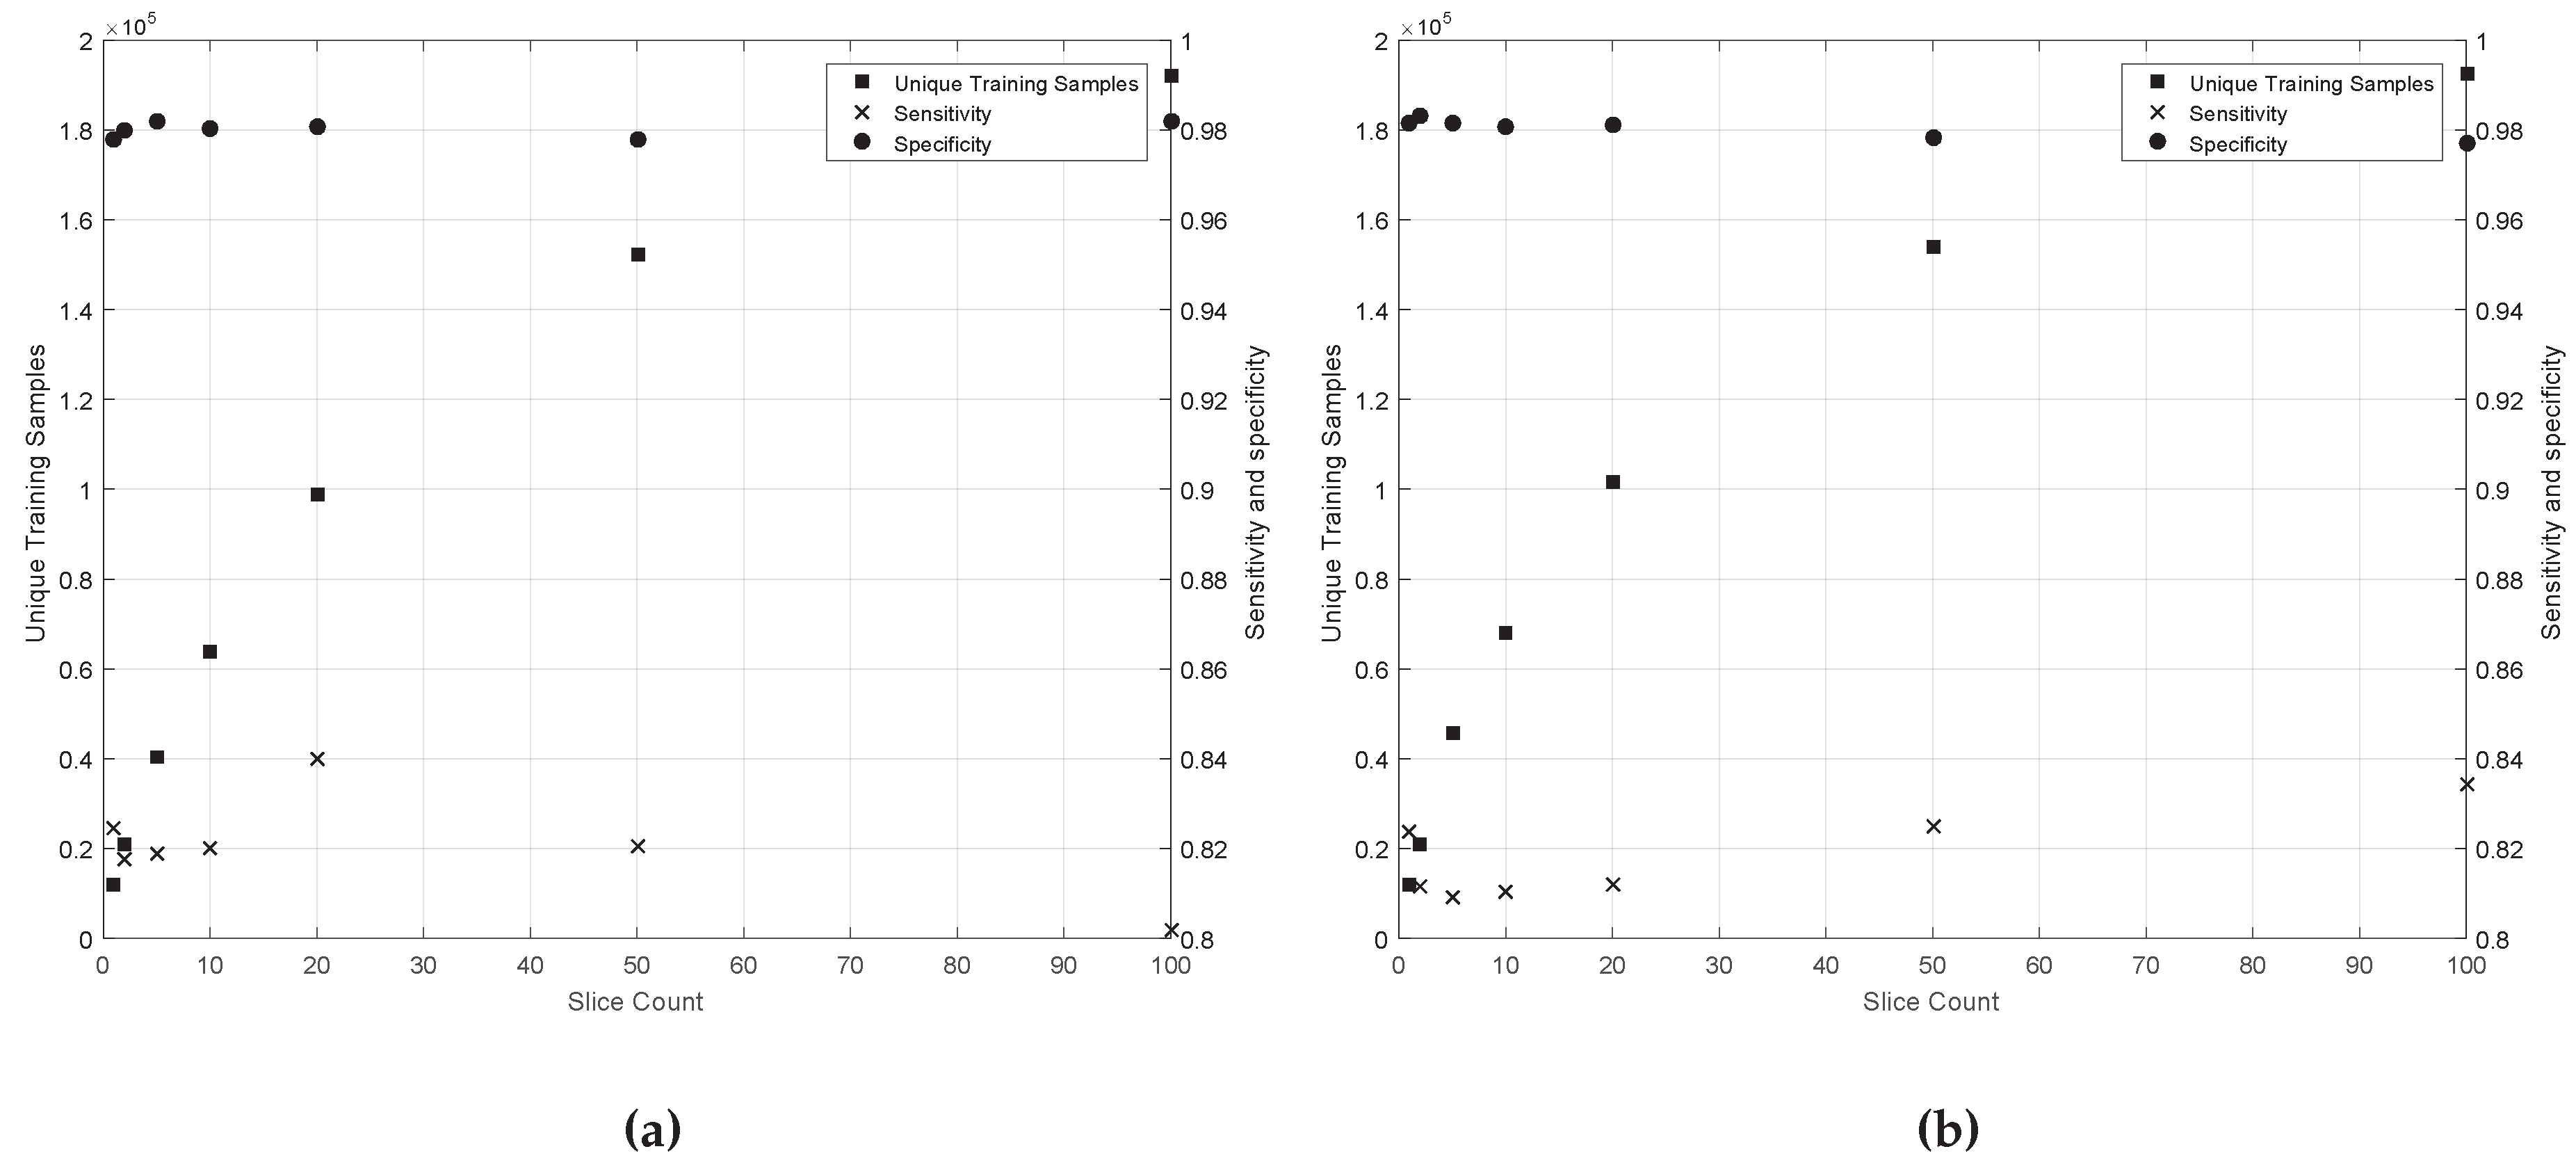
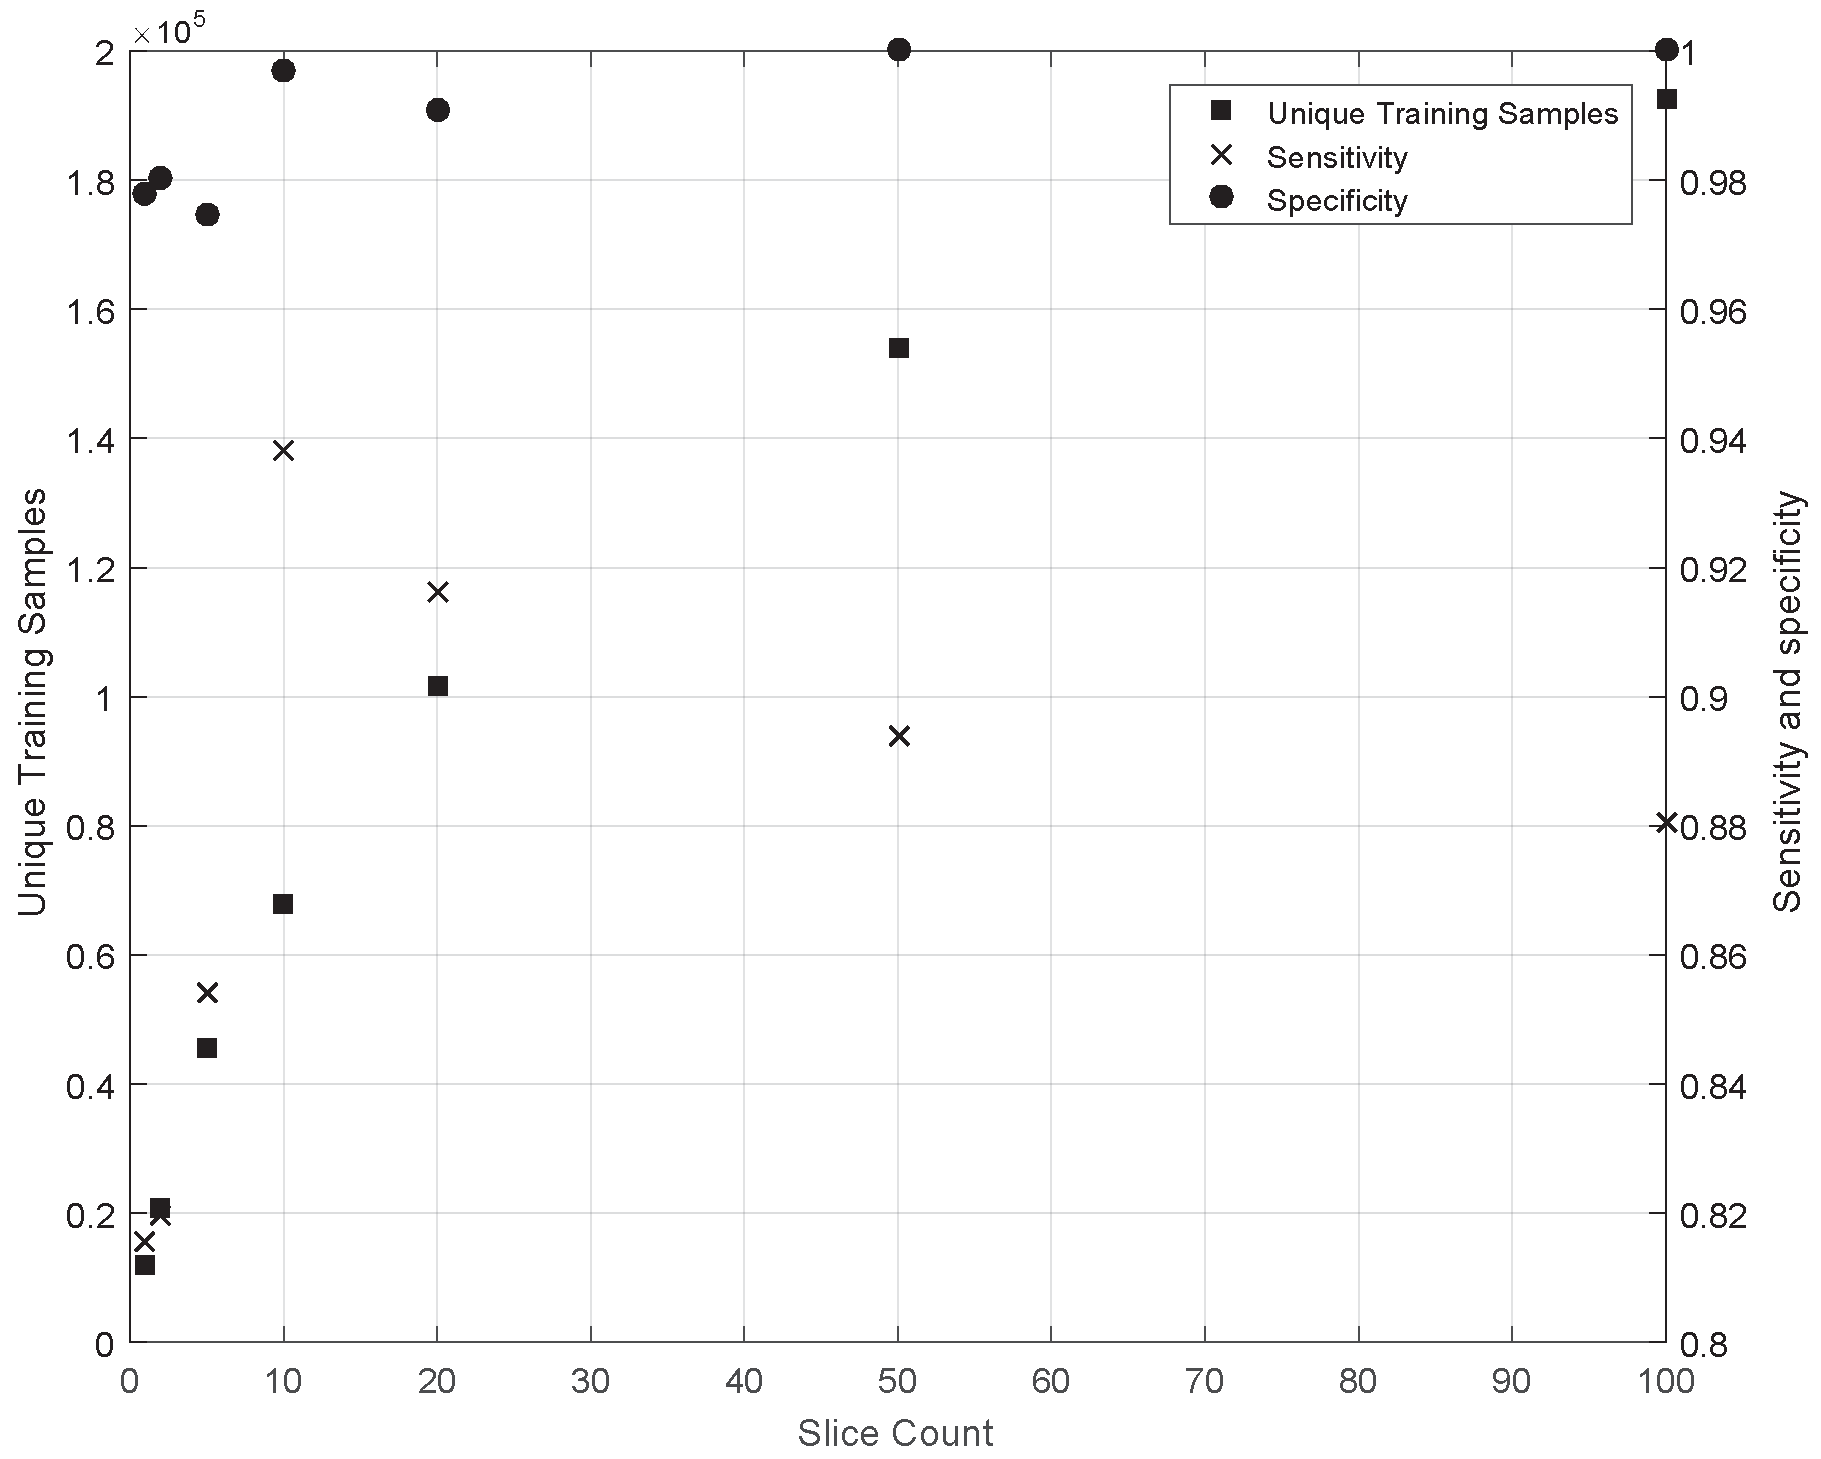
The second test run consisted of using a different number of slices around the center of the tumor to reveal the impact of the size of the training set on the specificity and sensitivity of all classifiers (Figure 6a and Figure 7). The results indicate that reducing the number of unique training samples has a negligible effect on the subsequent classification accuracy. RF shows slightly better classification accuracy improvement when using a larger training vector. Using a reduced training dataset influences training process length and might result in a simpler classifier, which is easier to interpret and has shorter classification computation times. The classification time is a limiting factor of using these methods in real-time applications.
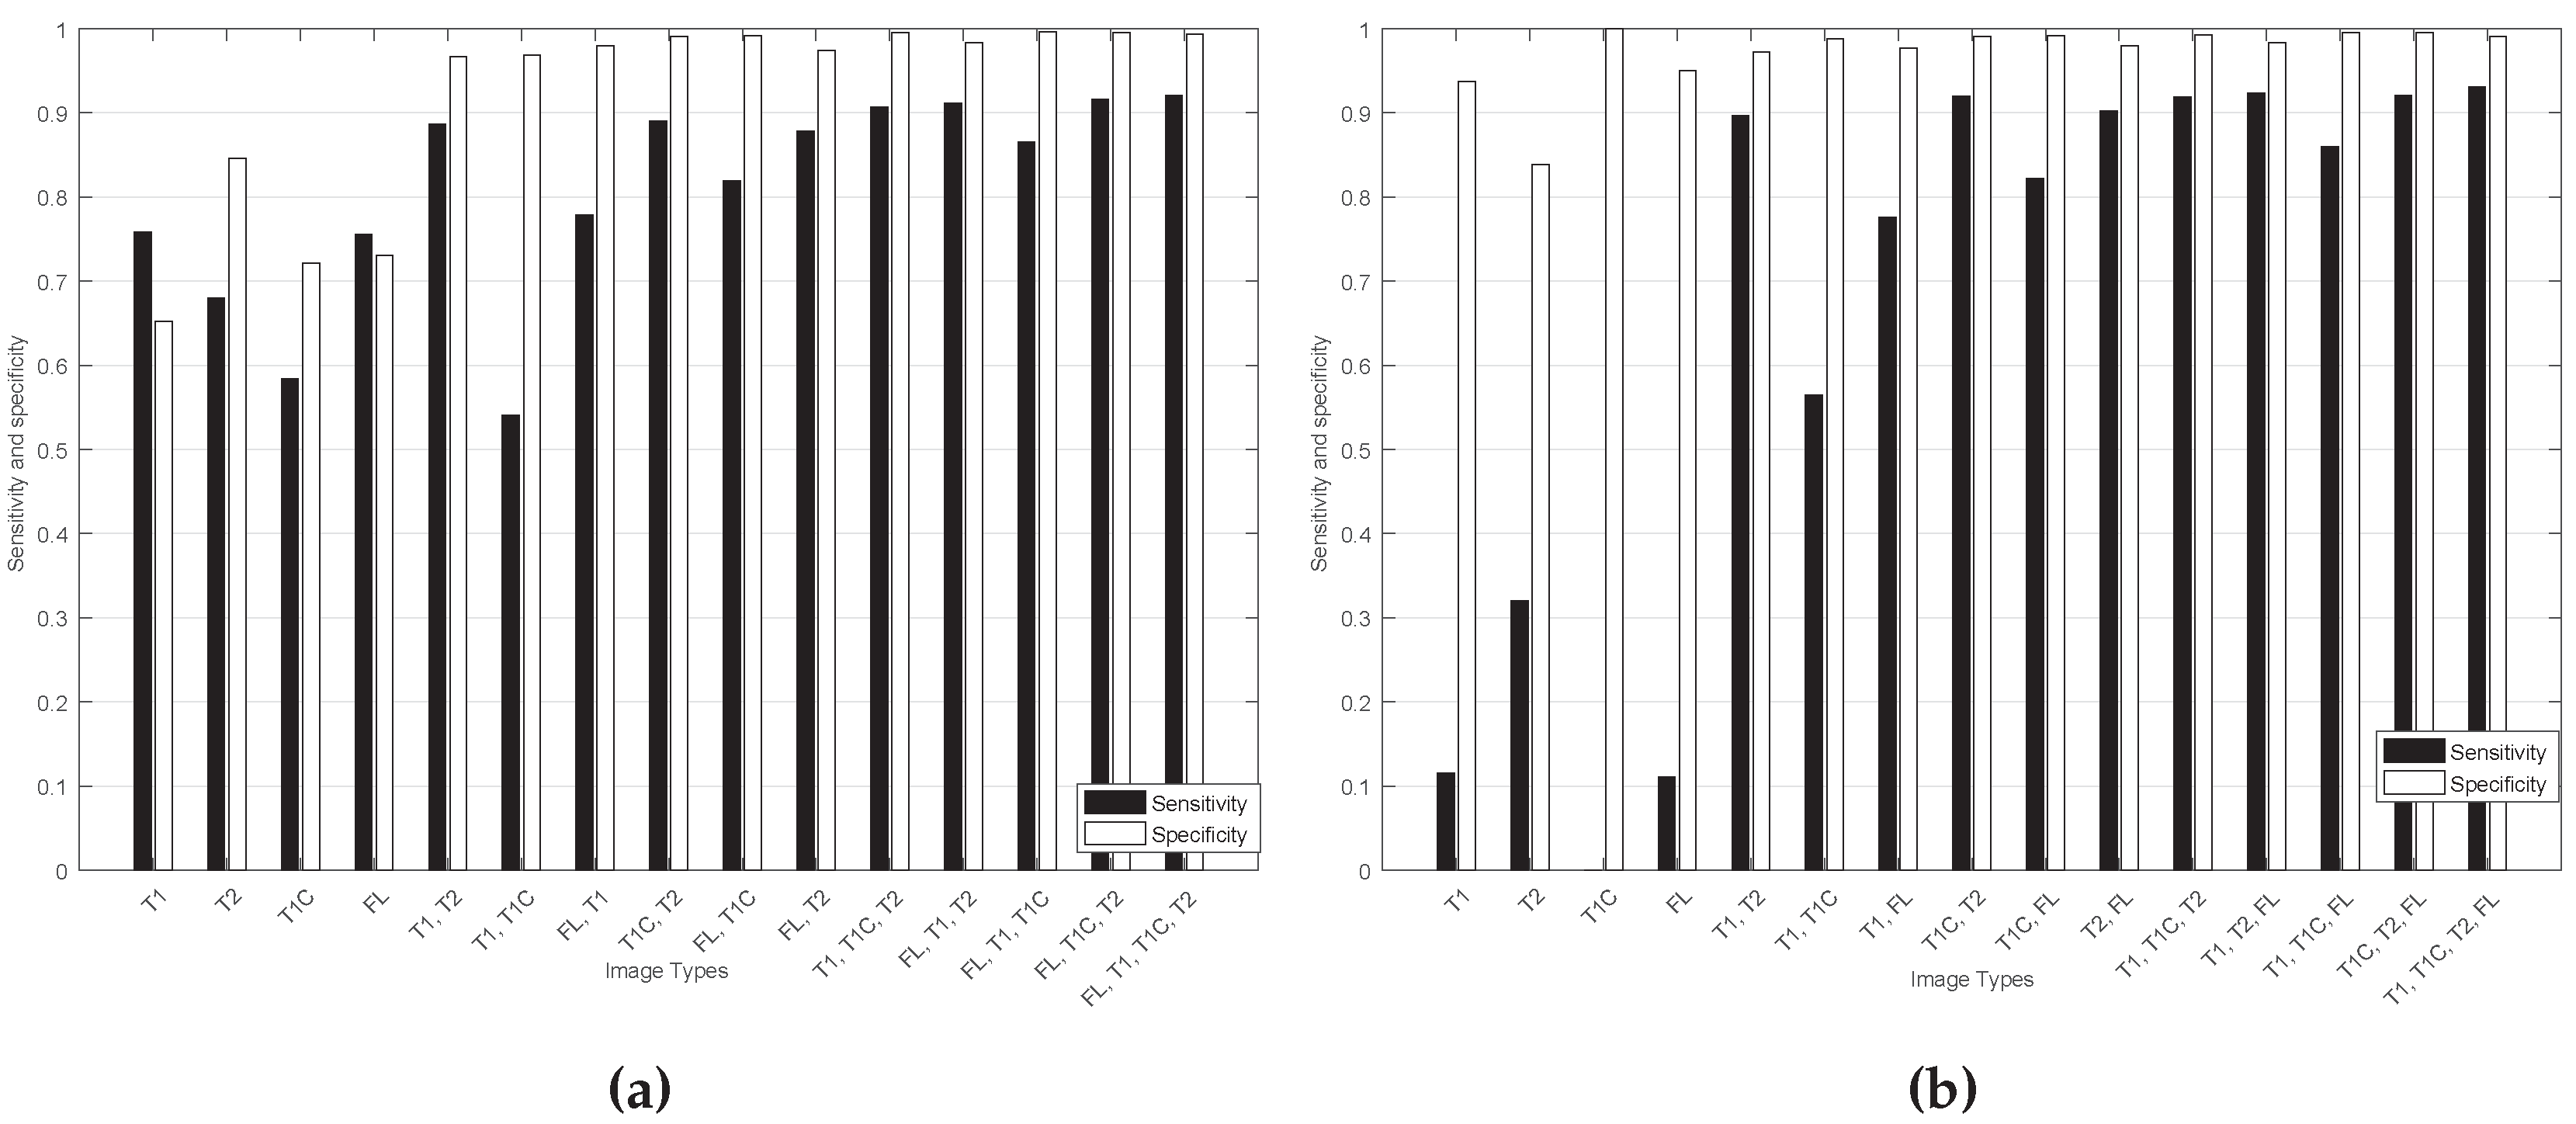
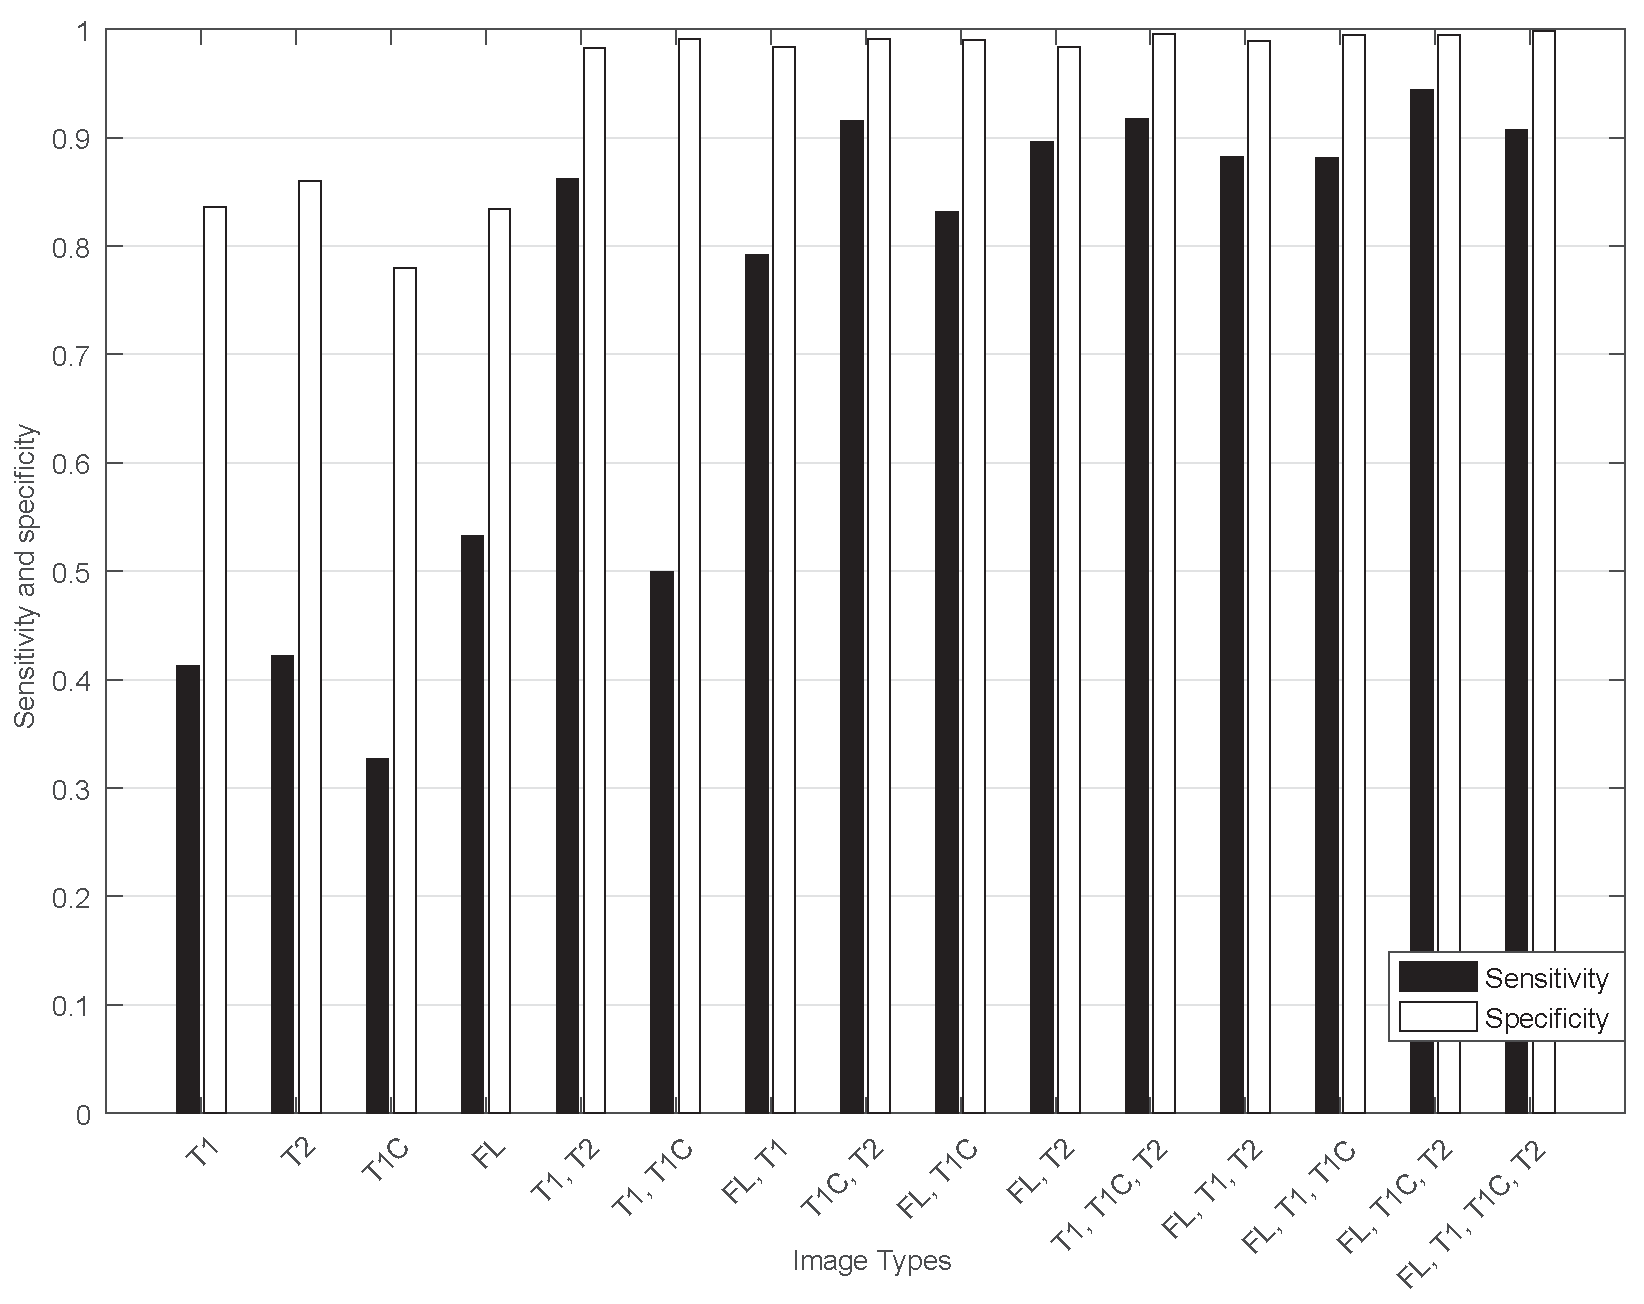
The effect of different image types on classifier accuracy was examined in the last test run (Figure 8a and Figure 9). Slices 88 of the LG_0001 images were used as a source of training samples. Sufficient sensitivity and specificity were obtained by only using T1- and T2-weighted images. Furthermore, all classifiers benefited from the addition of a postcontrast T1-weighted image. The RF classifier achieved best overall results with the use of FL, and postcontrast T1- and T2-weighted images.
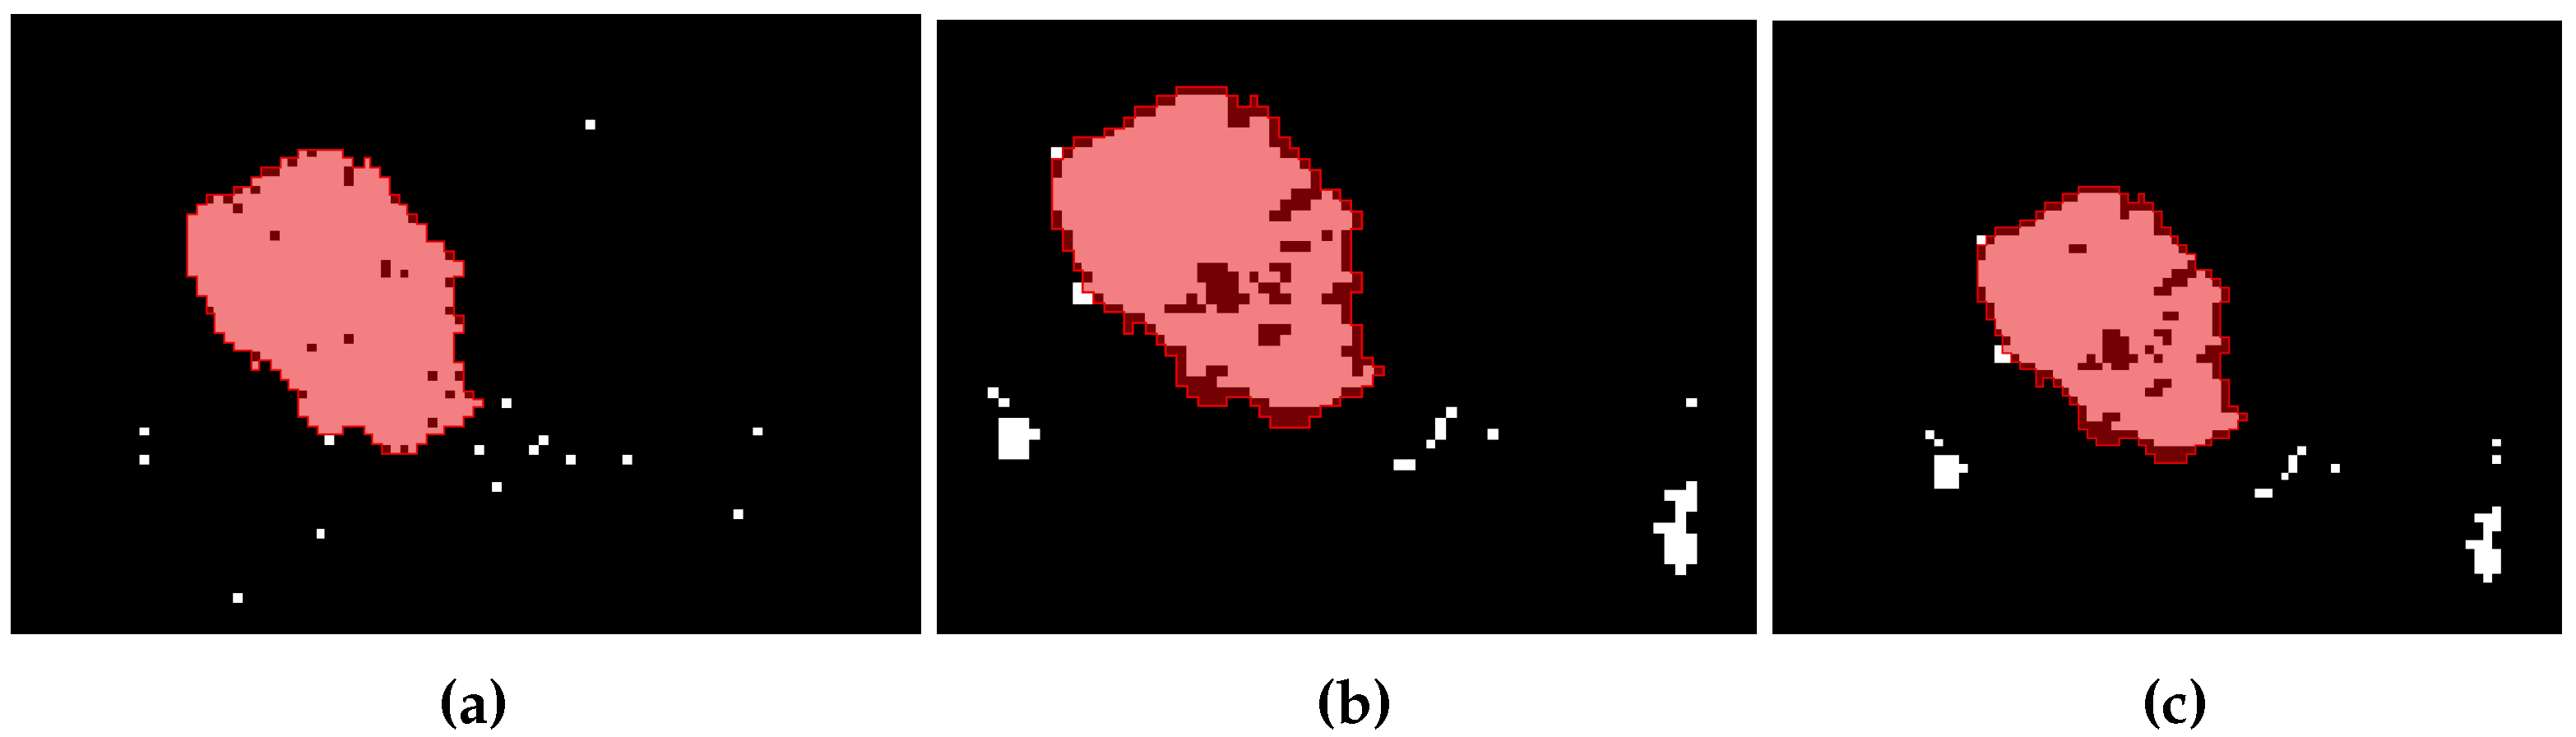
The following standardized procedure was designed in order to compare classifier performance. Training samples were extracted from the whole volume of the unmodified T1C and T2 images. Then, sensitivity and specificity were obtained using fivefold cross-validation. The best performing parameters and results are reported in Table 1. Segmentations are shown in Figure 10. Classification results can be further improved by using preprocessed data instead of raw data, and by means of postprocessing to remove the outlying voxels and inlying holes as demonstrated in Reference [16].
Lastly, the performance of the RF classifier trained on all tumor cores of the 20 real high-grade glioma volumes using the 3D Slicer extension were compared to similar studies performed on the BraTS dataset. The values were obtained as a mean of fivefold cross-validation. This comparison is shown in Table 2. The other DICE values are from Reference [17].
The means to combine the results of different classifiers to further expand the usability of the Supervised Segmentation Toolbox extension were added. Currently, logical AND and OR and a majority voting system are implemented. An addition of a Multiple Classifier System (MCS) is currently considered. A review of the advantages of MCS is provided by Wozniak et al. [18]. Termenon and Graña [19] used a two-stage MCS where the second classifier was trained on low-confidence data obtained by training and analysis of the first classifier. In the future, the authors expect implementing additional classifiers as well. Adding a Relevance Vector Machine (RVM), for example, might bring an improvement over SVM [20].
4. Conclusions
The Supervised Segmentation Toolbox extension was presented as an addition to the 3D Slicer extension library. This extension allows the user to train and use three types of classifiers, with more to be added in the future. The usability of the extension was demonstrated on a brain-tumor segmentation use case. The effects of the training parameters of all classifiers on the final sensitivity and specificity of the classification were considered to provide an insight into usable parameter selection for future studies. A low in combination with softer margin terms resulted in a better performing classifier commonly for both SVM classifiers. This might be largely due to a limited training sample, and a broader dataset should be analyzed in order to generalize the results. The RF classifier performed best using no added randomization, a relatively large tree count, and a small node size. The possibility of reducing training vector size in order to reduce model complexity and decrease classification time is verified. A 20-fold increase of the number of unique training samples resulted, at best, in a 2% increase of specificity. All combinations of input images are considered as a training input for all classifiers, and the significance of adding more types of images is discussed. A combination of T1C and T2 images performed sufficiently for all classifiers. The addition of the FL image brought a slight improvement in sensitivity. Lastly, best-performing parameter combinations were listed and the corresponding results were compared. The RF classifier had the largest sensitivity and worst specificity, and C-SVM performed oppositely. The significance of these two metrics largely depends on the type of task for which the classifiers are used. All sensitivity and specificity data were obtained directly using the 3D Slicer extension.
Supplementary Materials
The authors publicly release the source code of the Supervised Segmentation Toolbox. The source code can be found on GitHub [13]. The BraTS 2012 dataset is available on the challenge’s website.
Author Contributions
J.M. conceived and designed the experiments; D.C. performed the experiments, programmed the extension, analyzed the data, and wrote the paper.
Funding
This work was supported by the Ministry of Health of the Czech Republic, grant no. NV18-08-00459.
Conflicts of Interest
The authors declare no conflict of interest.
Abbreviations
The following abbreviations are used in this manuscript:
| BraTS | Brain-Tumor Segmentation |
| FL | Fluid-Attenuated Inversion Recovery |
| LGG | Low-Grade Glioma |
| MCS | Multiple Classifier System |
| OOB | Out Of Box |
| RVM | Relevance Vector Machine |
| RF | Random Forest |
| SVM | Support Vector Machine |
References
- Fedorov, A.; Beichel, R.; Kalpathy-Cramer, J.; Finet, J.; Fillion-Robin, J.C.; Pujol, S.; Bauer, C.; Jennings, D.; Fennessy, F.; Sonka, M.; et al. 3D Slicer as an image computing platform for the Quantitative Imaging Network. Magn. Reson. Imaging 2012, 30, 1323–1341. [Google Scholar] [CrossRef] [PubMed] [Green Version]
- Mehrtash, A.; Sedghi, A.; Ghafoorian, M.; Taghipour, M.; Tempany, C.M.; Wells, W.M.; Kapur, T.; Mousavi, P.; Abolmaesumi, P.; Fedorov, A. Classification of Clinical Significance of MRI Prostate Findings Using 3D Convolutional Neural Networks. Proc. SPIE Int. Soc. Optical Eng. 2017, 10134. [Google Scholar]
- Zhang, Y.; Dong, Z.; Wang, S.; Ji, G.; Yang, J. Preclinical diagnosis of magnetic resonance (MR) brain images via discrete wavelet packet transform with Tsallis entropy and generalized eigenvalue proximal support vector machine (GEPSVM). Entropy 2015, 17, 1795–1813. [Google Scholar] [CrossRef]
- Zhang, Y.; Wang, S.; Phillips, P.; Dong, Z.; Ji, G.; Yang, J. Detection of Alzheimer’s disease and mild cognitive impairment based on structural volumetric MR images using 3D-DWT and WTA-KSVM trained by PSOTVAC. Biomed. Signal Process. Control 2015, 21, 58–73. [Google Scholar] [CrossRef]
- Wang, S.; Li, Y.; Shao, Y.; Cattani, C.; Zhang, Y.; Du, S. Detection of dendritic spines using wavelet packet entropy and fuzzy support vector machine. CNS Neurol. Dis.-Drug Targets 2017, 16, 116–121. [Google Scholar] [CrossRef] [PubMed]
- Zhang, Y.; Yang, Z.; Lu, H.; Zhou, X.; Phillips, P.; Liu, Q.; Wang, S. Facial emotion recognition based on biorthogonal wavelet entropy, fuzzy support vector machine, and stratified cross validation. IEEE Access 2016, 4, 8375–8385. [Google Scholar] [CrossRef]
- Zheng, Q.; Wu, Y.; Fan, Y. Integrating semi-supervised and supervised learning methods for label fusion in multi-atlas based image segmentation. Front. Neuroinform. 2018, 12, 69. [Google Scholar] [CrossRef] [PubMed]
- Amiri, S.; Mahjoub, M.A.; Rekik, I. Tree-based Ensemble Classifier Learning for Automatic Brain Glioma Segmentation. Neurocomputing 2018, 313, 135–142. [Google Scholar] [CrossRef] [Green Version]
- Cortes, C.; Vapnik, V. Support-vector networks. Mach. Learn. 1995, 20, 273–297. [Google Scholar] [CrossRef] [Green Version]
- Chang, C.C.; Lin, C.J. LIBSVM: A library for support vector machines. ACM Trans. Intell. Syst. Technol. 2011, 2, 1–27. [Google Scholar] [CrossRef]
- Schölkopf, B.; Smola, A.J.; Williamson, R.C.; Bartlett, P.L. New support vector algorithms. Neural Comput. 2000, 12, 1207–1245. [Google Scholar] [CrossRef] [PubMed]
- Ho, T.K. Random decision forests. In Proceedings of the 3rd International Conference on Document Analysis and Recognition, Montreal, QC, Canada, 14–16 August 1995; pp. 278–282. [Google Scholar]
- Chalupa, D. Supervised Segmentation Toolbox for 3D Slicer. Source Code Available Under the GNU General Public License v3.0. Available online: https://github.com/chalupaDaniel/slicerSupervisedSegmentation (accessed on 14 October 2018).
- King, D.E. Dlib-ml: A machine learning toolkit. J. Mach. Learn. Res. 2009, 10, 1755–1758. [Google Scholar]
- Igel, C.; Heidrich-Meisner, V.; Glasmachers, T. Shark. J. Mach. Learn. Res. 2008, 9, 993–996. [Google Scholar]
- Kapás, Z.; Lefkovits, L.; Szilágyi, L. Automatic Detection and Segmentation of Brain Tumor Using Random Forest Approach. In Modeling Decisions for Artificial Intelligence; Springer: New York, NY, USA, 2016; pp. 301–312. [Google Scholar]
- Menze, B.H.; Jakab, A.; Bauer, S.; Kalpathy-Cramer, J.; Farahani, K.; Kirby, J.; Burren, Y.; Porz, N.; Slotboom, J.; Wiest, R.; et al. The Multimodal Brain Tumor Image Segmentation Benchmark (BRATS). IEEE Trans. Med. Imaging 2015, 34, 1993–2024. [Google Scholar] [CrossRef] [PubMed]
- Woźniak, M.; Graña, M.; Corchado, E. A survey of multiple classifier systems as hybrid systems. Inf. Fusion 2014, 16, 3–17. [Google Scholar] [CrossRef]
- Termenon, M.; Graña, M. A two stage sequential ensemble applied to the classification of Alzheimer’s disease based on MRI features. Neural Process. Lett. 2012, 35, 1–12. [Google Scholar] [CrossRef]
- Tipping, M.E. Sparse Bayesian learning and the relevance vector machine. J. Mach. Learn. Res. 2001, 1, 211–244. [Google Scholar]
- Geremia, E.; Menze, B.H.; Ayache, N. Spatial Decision Forests for Glioma Segmentation in Multi-Channel MR Images. MICCAI Chall. Multimodal Brain Tumor Segmentation 2012, 34. [Google Scholar]
- Bauer, S.; Nolte, L.P.; Reyes, M. Fully automatic segmentation of brain tumor images using support vector machine classification in combination with hierarchical conditional random field regularization. In Medical Image Computing and Computer-Assisted Intervention—MICCAI; Springer: Berlin/Heidelberg, Germany, 2011. [Google Scholar]
- Criminisi, A.; Zikic, D.; Glocker, B.; Shotton, J. Context-sensitive classification forests for segmentation of brain tumor tissues. Proc MICCAI-BraTS 2012, 1, 1–9. [Google Scholar]
- Festa, J.; Pereira, S.; Mariz, J.; Sousa, N.; Silva, C. Automatic brain tumor segmentation of multi-sequence MR images using random decision forests. Proc. NCI-MICCAI BRATS 2013, 1, 23–26. [Google Scholar]
Figure 1.
Slice 88 of the LG_0001 data from the 2012 Brain Tumor Segmentation (BraTS) Challenge. The dataset consists of a (a) T1-weighted image with labels as overlay; (b) postcontrast T1-weighted image; (c) T2-weighted image; and (d) Fluid Attenuated Inversion Recovery (FL) image.
Figure 1.
Slice 88 of the LG_0001 data from the 2012 Brain Tumor Segmentation (BraTS) Challenge. The dataset consists of a (a) T1-weighted image with labels as overlay; (b) postcontrast T1-weighted image; (c) T2-weighted image; and (d) Fluid Attenuated Inversion Recovery (FL) image.

Figure 2.
Supervised segmentation extension workflow.

Figure 3.
N-Support Vector Machine (SVM)-classifier (a) sensitivity and (b) specificity using different parameter pairs.
Figure 3.
N-Support Vector Machine (SVM)-classifier (a) sensitivity and (b) specificity using different parameter pairs.

Figure 4.
C-SVM-classifier (a) sensitivity and (b) specificity using different parameter pairs.

Figure 5.
Random Forest classifier sensitivity and specificity using different parameters. Left to right: Different node size, number of trees, OOB and number of random attributes.
Figure 5.
Random Forest classifier sensitivity and specificity using different parameters. Left to right: Different node size, number of trees, OOB and number of random attributes.

Figure 6.
(a) N-SVM and (b) C-SVM sensitivity and specificity using different training vector sizes.
Figure 6.
(a) N-SVM and (b) C-SVM sensitivity and specificity using different training vector sizes.

Figure 7.
RF-classifier sensitivity and specificity using different training vector sizes.

Figure 8.
Classifier sensitivity using different input images. N-SVM (a), C-SVM (b).

Figure 9.
RF-Classifier sensitivity using different input images.

Figure 10.
(a) RF, (b) C-SVM, and (c) N-SVM classification results of the slice 88 (white) and ground truth (red).
Figure 10.
(a) RF, (b) C-SVM, and (c) N-SVM classification results of the slice 88 (white) and ground truth (red).


Table 1.
Classifier comparison and best-performing parameters.
| Parameters | Sensitivity | Specificity | Acc. | Prec. | DICE | Jaccard | |
|---|---|---|---|---|---|---|---|
| C-SVM | γ = 1.0, C = 1.0 | 0.72 | 0.98 | 0.99 | 0.96 | 0.80 | 0.66 |
| N-SVM | γ = 10.0−3, N = 0.1 | 0.77 | 0.97 | 0.99 | 0.96 | 0.82 | 0.70 |
| RF | 0 % OOB, 0 random attributes, 1200 trees, node size 2 | 1.00 | 0.95 | 1.00 | 0.96 | 0.94 | 0.89 |
Table 2.
RF classifier comparison with similar studies. The classifier was trained using all 20 of the real high-grade glioma volumes, and the DICE value is a mean of fivefold cross-validation.
Table 2.
RF classifier comparison with similar studies. The classifier was trained using all 20 of the real high-grade glioma volumes, and the DICE value is a mean of fivefold cross-validation.
| Paper | Approach | DICE |
|---|---|---|
| This paper | RF | 0.43 |
| Geremia [21] | Spatial decision forests with intrinsic hierarchy | 0.32 |
| Kapás [16] | RF | 0.58 |
| Bauer [22] | Integrated hierarchical RF | 0.48 |
| Zikic [23] | Context-sensitive features with a decision tree ensemble | 0.47 |
| Festa [24] | RF using neighborhood and local context features | 0.50 |
© 2018 by the authors. Licensee MDPI, Basel, Switzerland. This article is an open access article distributed under the terms and conditions of the Creative Commons Attribution (CC BY) license (http://creativecommons.org/licenses/by/4.0/).
Share and Cite
MDPI and ACS Style
Chalupa, D.; Mikulka, J. A Novel Tool for Supervised Segmentation Using 3D Slicer. Symmetry 2018, 10, 627. https://doi.org/10.3390/sym10110627
AMA Style
Chalupa D, Mikulka J. A Novel Tool for Supervised Segmentation Using 3D Slicer. Symmetry. 2018; 10(11):627. https://doi.org/10.3390/sym10110627
Chicago/Turabian StyleChalupa, Daniel, and Jan Mikulka. 2018. "A Novel Tool for Supervised Segmentation Using 3D Slicer" Symmetry 10, no. 11: 627. https://doi.org/10.3390/sym10110627
Note that from the first issue of 2016, this journal uses article numbers instead of page numbers. See further details here.