Facial Asymmetry-Based Anthropometric Differences between Gender and Ethnicity
by

Muhammad Sajid
1,*, 
Tamoor Shafique
2,
Imran Riaz
1,
Muhammad Imran
1,
Mirza Jabbar Aziz Baig
3,
Shahbaz Baig
3 and
Sohaib Manzoor
4 1
Department of Electrical Engineering, Mirpur University of Science and Technology, Mirpur 10250 (AJK), Pakistan
2
Faculty of Computing, Engineering and Science, Staffordshire University, Stoke-on-Trent ST4 2DE, UK
3
Department of Electrical (Power) Engineering, Mirpur University of Science and Technology, Mirpur 10250 (AJK), Pakistan
4
School of Electronic Information and Communications, Huazhong University of Science and Technology, Wuhan 430074, China
*
Author to whom correspondence should be addressed.
Symmetry 2018, 10(7), 232; https://doi.org/10.3390/sym10070232
Submission received: 10 May 2018
/
Revised: 18 June 2018
/
Accepted: 18 June 2018
/
Published: 21 June 2018
Abstract
:Bilateral facial asymmetry is frequently exhibited by humans but its combined evaluation across demographic traits including gender and ethnicity is still an open research problem. In this study we measure and evaluate facial asymmetry across gender and different ethnic groups and investigate the differences in asymmetric facial dimensions among the subjects from two public face datasets, the MORPH and FERET. To this end, we detect 28 facial asymmetric dimensions from each face image using an anthropometric technique. An exploratory analysis is then performed via a multiple linear regression model to determine the impact of gender and ethnicity on facial asymmetry. Post-hoc Tukey test has been used to validate the results of the proposed method. The results show that out of 28 asymmetric dimensions, females differ in 25 dimensions from males. African, Asian, Hispanic and other ethnic groups have asymmetric dimensions that differ significantly from those of Europeans. These findings could be important to certain applications like the design of facial fits, as well as guidelines for facial cosmetic surgeons. Lastly, we train a neural network classifier that employs asymmetric dimensions for gender and race classification. The experimental results show that our trained classifier outperforms the support vector machine (SVM) and k-nearest neighbors (kNN) classifiers.
1. Introduction
Bilateral asymmetry is an inherent facial characteristic, which describes the left–right morphological differences [1]. It is well known that asymmetry is caused by functional, congenital or developmental factors [2]. Previous studies such as [3,4,5,6] suggest that facial asymmetry can be used to estimate the age group, gender and race. A relationship between symmetry and sexual dimorphism has been investigated in [3]. The study suggests that symmetry and gender-specific features are related in male and female faces. Similarly, in [4], the authors observed that facial masculinization covaries with bilateral asymmetry in males’ faces. A relationship between asymmetry and age has been discussed in [5,6]. The studies suggest that facial asymmetry becomes more pronounced with aging.
Previously, facial asymmetry has been measured and evaluated across aging variations in [2,6,7]. In [2], asymmetry has been measured on 3D face images to perform orthognathic surgery for treatment of facial asymmetry. The study also evaluates the contributions of facial soft tissues, dental and skeletal differences in the development of facial asymmetry. In [5], the relationship between facial asymmetry and age has been investigated on 3D face images. The study suggests that asymmetry is an inherent facial characteristic that increases with age. Densely sampled asymmetric facial features (DSAF) have been proposed in [6] to recognize face images across aging variations. In [7], horizontal and vertical asymmetric dimensions have been used to estimate the age group of a query face image. The knowledge learned from age group estimation is then used to recognize face images across aging variations. Facial asymmetry-based descriptors have been used in [8] for demographic estimation and face recognition tasks.
In most of the existing methods, face descriptors based on asymmetry have been used to recognize face images. In contrast, facial asymmetry based anthropometric dimensions have been used only in Reference [7] for age group estimation task. In contrary to the previous methods, in this study we aim to explore the impact of gender and ethnicity on facial asymmetry based anthropometric dimensions. More precisely, we will measure and evaluate facial asymmetry across gender and different ethnic groups. Moreover, we will use a linear regression model to explore the impact of gender and ethnicity on facial asymmetry based anthropometric dimensions.
Such a study will be significant for a number of practical applications such as the development of personal protective equipment like respiratory protective equipment (RPE) [9] and the development of computer models for planning plastic surgeries [10]. The effectiveness of RPE relies heavily upon respirator fit and is thus influenced directly by facial dimensions. Facial dimension changes are influenced by such factors as facial asymmetry, gender, and ethnicity [11,12]. Therefore, it is mandatory for RPE researchers, design engineers and manufacturers to address all design and use issues that can potentially impact the efficacy of RPE. For example, in case of tight-fitting face-pieces a good seal with the wearer’s face is mandatory to avoid any leakage. A fit test based on facial asymmetric dimensions can ensure that RPE would protect the wearer. Planning facial plastic surgery requires prior knowledge of asymmetric facial dimensions in accordance with the gender and ethnicity of patient because facial asymmetry is related with attractiveness [13]. Therefore, it is incumbent upon plastic surgeons to retain asymmetric facial dimensions during the procedure. A computer-assisted tool may be used to preview the possible surgery results incorporating the asymmetric dimensions to maintain the desired level of facial attractiveness. However, identification of demographic informative asymmetric facial dimensions has not been investigated to any significant degree. In this study, we aim to identify such demographic informative dimensions using a linear regression model. The motivation of this study is to answer the following questions.
- (i)
- Does facial asymmetry vary across gender and ethnicity?
- (ii)
- What is correlation between facial asymmetry of male and female faces?
- (iii)
- What is correlation between facial asymmetry of different ethnic groups?
- (iv)
- What is the impact of gender and ethnicity on asymmetric anthropometric dimensions?
The main contributions of this study are as follows.
- (i)
- To the best of our knowledge, this is the first study to evaluate facial asymmetry variations across gender and ethnicity.
- (ii)
- Using a linear regression model, we have identified such asymmetric dimensions which are significant to discriminate the subjects belonging to different populations.
- (iii)
- A neural network classifier has been used to classify face images based on gender and ethnicity.
2. Literature Review
There is a considerable literature on facial demographic analysis using anthropometric measurements. Milutinovic et al. [14] utilized facial proportions to evaluate face beauty. A correlation was established between given face images, symmetry and an ideal set of proportions to differentiate between anonymous and attractive females. The authors conclude that attractive faces bear uniformity between different facial sub-regions. Kim et al. [15], evaluated the facial appearance of young women against a preferred face appearance and compared the results with the general population. Zhuang et al. [16] evaluated the facial anthropometric variations across age groups, gender and race for face images. The authors observed significant variations in facial anthropometric variations between male and female faces of different ethnic groups across different age groups.
The above presented methods suggest that the impact of demographic variations on facial asymmetry has not been investigated to any significant level. Being a demographic informative feature, there is need to explore the differences in facial asymmetry among different populations of varying ethnicity and gender. In the following sections, we propose a linear regression-based approach to analyze the impact of gender and ethnicity on asymmetric facial dimensions.
3. Methods
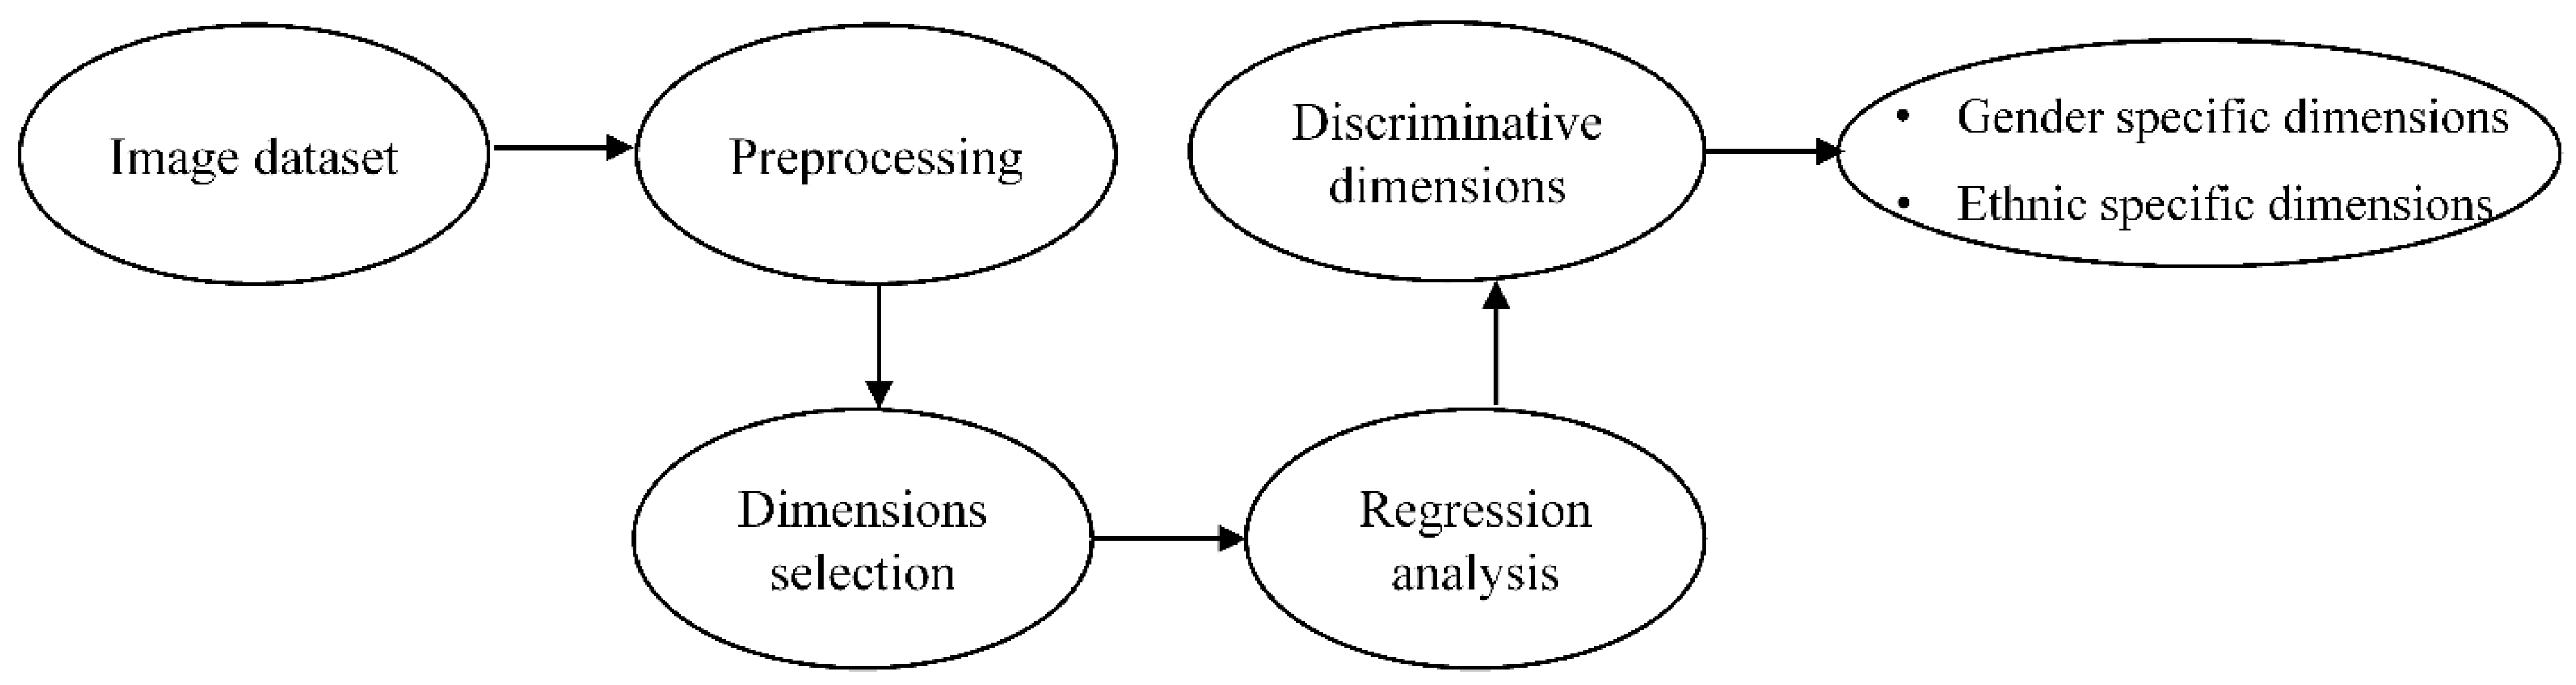
In this section, we present the proposed methodology and details of its different stages including image datasets, preprocessing, dimensions selection, regression analysis and development of regression model and its validation. Figure 1 displays the different stages of the proposed method to analyze the impact of demographic traits on asymmetric dimensions, which are explained in the following subsections.
3.1. Image Datasets
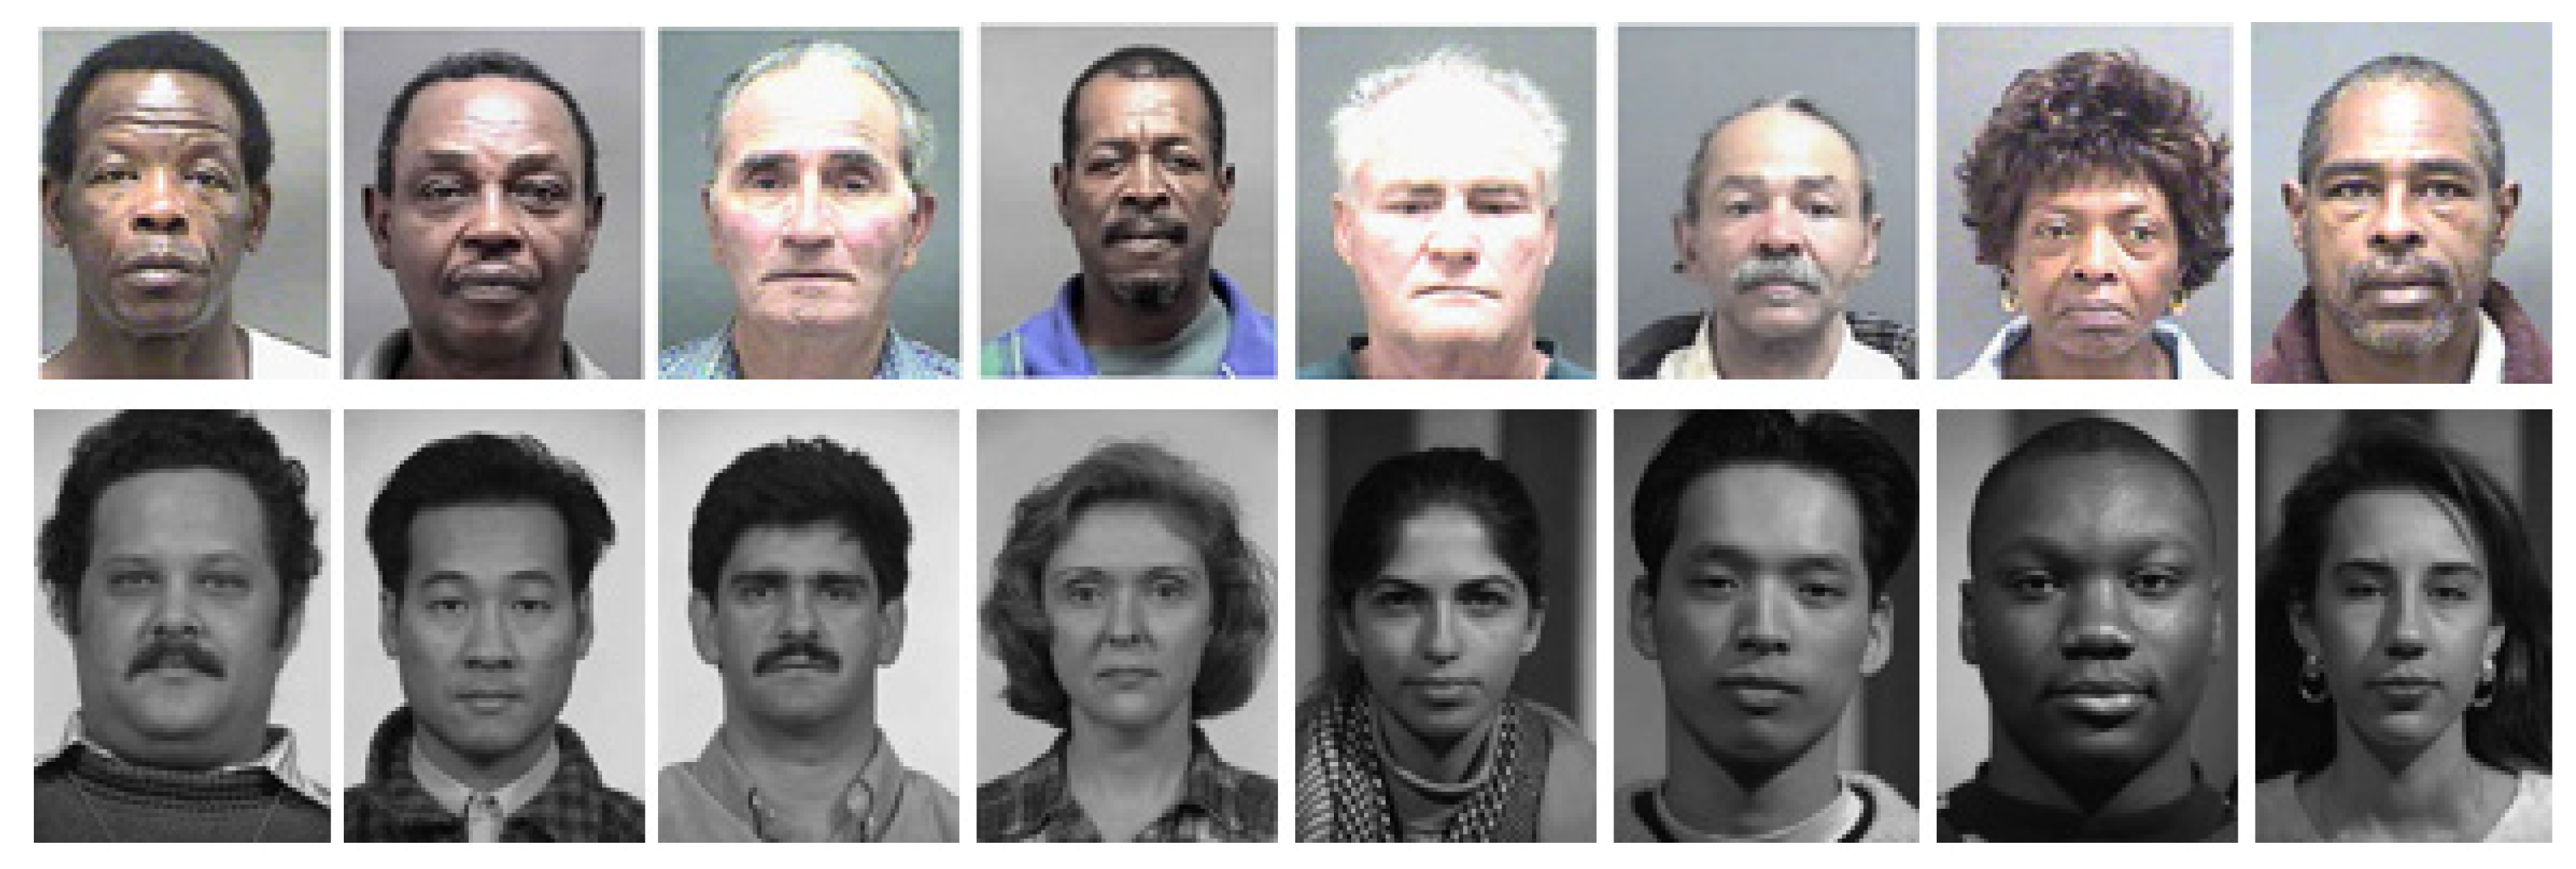
To determine the impact of demographic traits (gender and ethnicity) on asymmetric dimensions, we selected two standard face image datasets, called MORPH II (termed as MORPH in the rest of the study) [17] and FERET [18]. These datasets have been used extensively in demographic estimation and recognition tasks such as [7,8,19]. The MORPH dataset contains 55,000 unique face images of more than 13,000 subjects. The dataset contains face images of male and female subjects across different ethnicities including African, European, Asian, Hispanic and others. The FERET dataset contains 3580 face images of 1196 male and female subjects belonging to Asian, European, African, Hispanic, and other ethnicities. In this study, we selected 10,458 frontal face images from the MORPH database to form a subset of frontal face images such that there is one image per subject. Similarly, 1020 frontal face images were selected from the FERET dataset. The distribution of the face images by gender and ethnicity is shown in Table 1. Some example face images from the MORPH and FERET datasets are shown in Figure 2.
3.2. Preprocessing
Face images were first preprocessed to remove unwanted background appearances followed by an alignment procedure based on supervised decent method (SDM) [20] such that all face images have equal interpupillary distance. The main steps of the SDM method are shown in Algorithm 1. More precisely, the SDM relies on a regressor that is started from a raw initial shape guess based on mean landmarks initialized using face detector and progressively refines this estimate using descent directions and bias terms , resulting in a final shape estimate . Contrary to the original work [20], we use landmarks detected by Face++ API. The descent directions and the bias terms are learned by minimizing the following objective function in training.
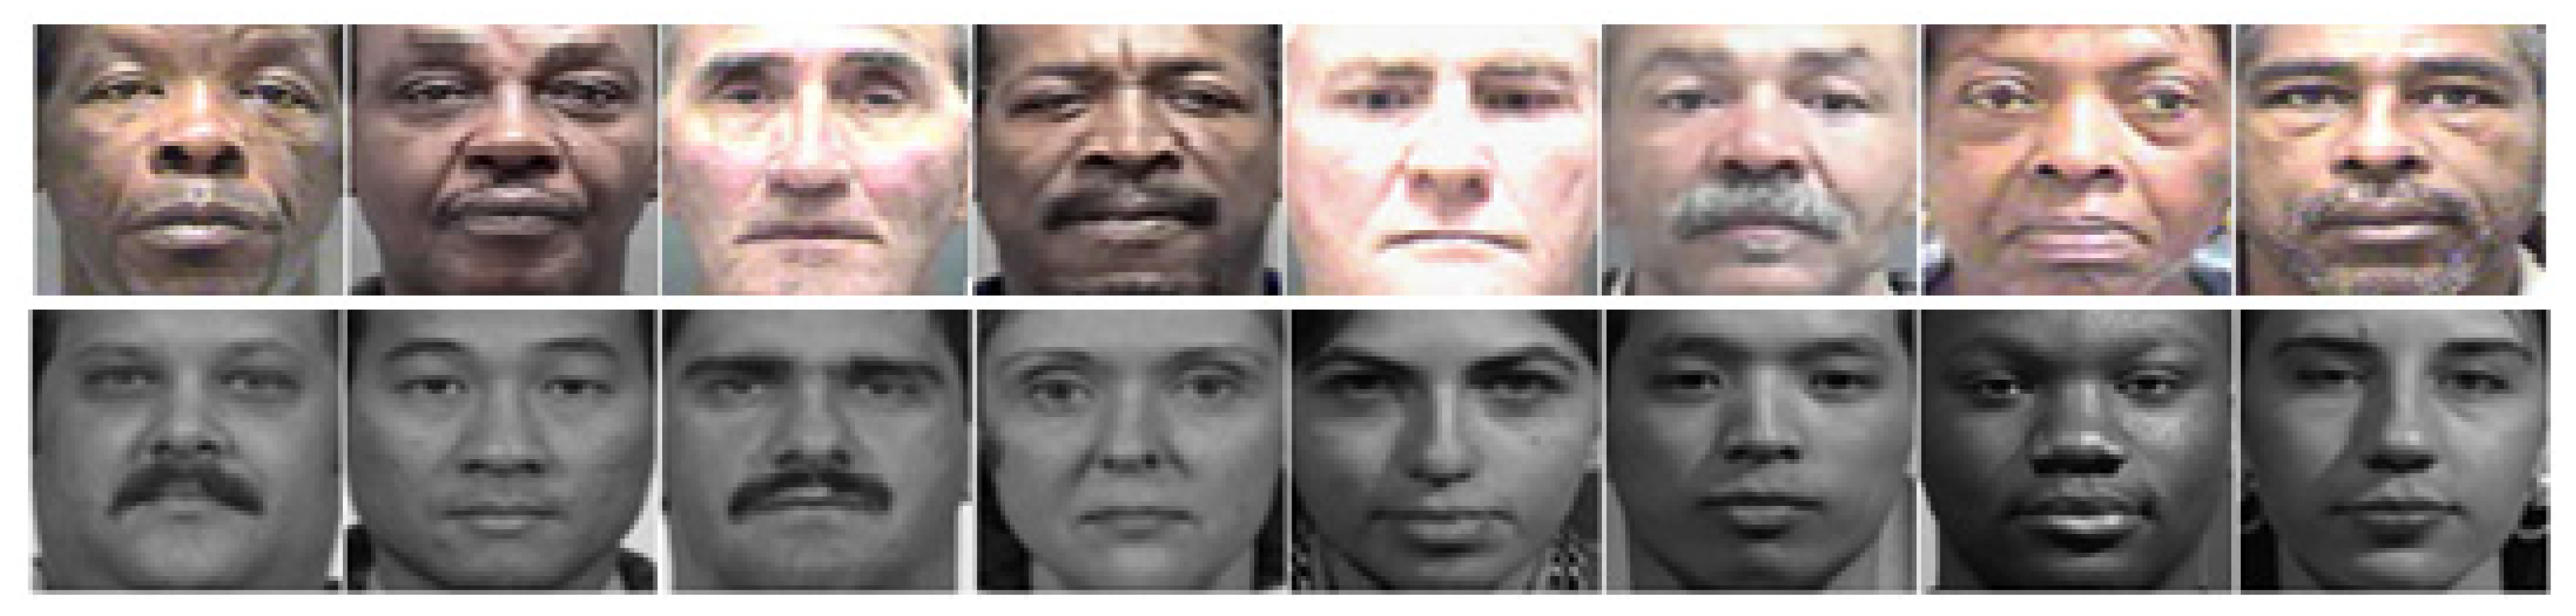
where, are facial landmarks detected using Face++ API [21]. Figure 3 shows example preprocessed face images from MORPH and FERET datasets.
| Algorithm 1 Face alignment using SDM method |
Input: Face image f, decent directions , bias terms , initial guess
|
| Output:Final estimate. |
3.3. Collection of Asymmetric Dimensions
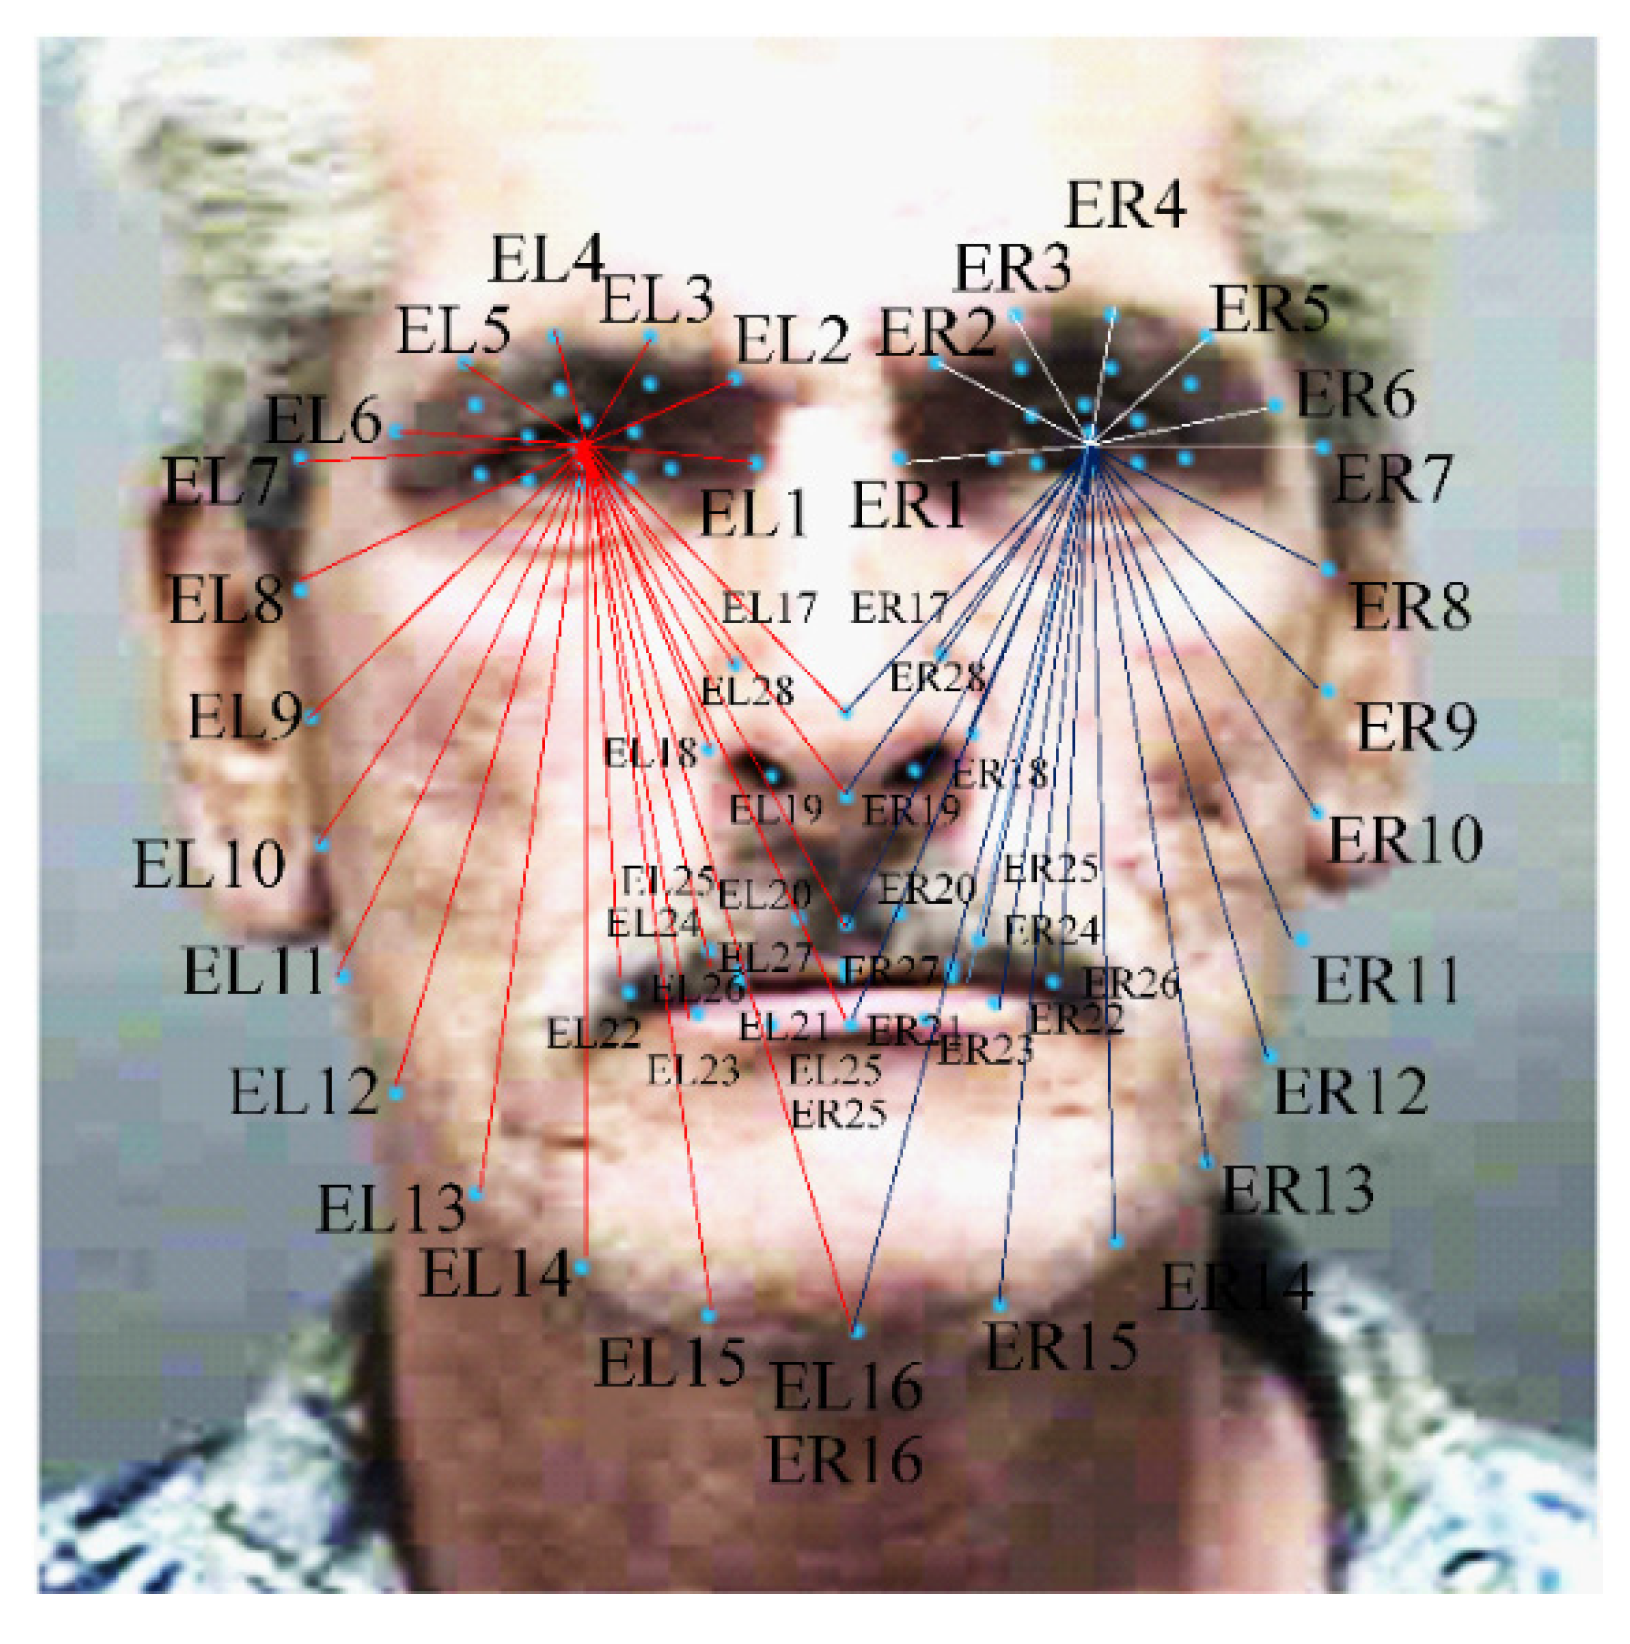
Once face images were aligned, the coordinates of selected landmarks were used to calculate 28 bilateral facial measurements expressed in millimeters reference to the fixed eye coordinates as shown in Figure 4.
The eyes were chosen as reference points because these are the most salient features of the face [22]. Euclidean distances was used to calculate the bilateral measurements. Finally, the right sided facial measurements ERi were subtracted from the corresponding left sided measurements ELi to calculate the asymmetric facial dimensions Di as illustrated in Equation (2).
This approach enables the calculation of anthropometric asymmetric dimensions. Algorithm 2 shows the main steps involved in calculating asymmetric facial dimensions.
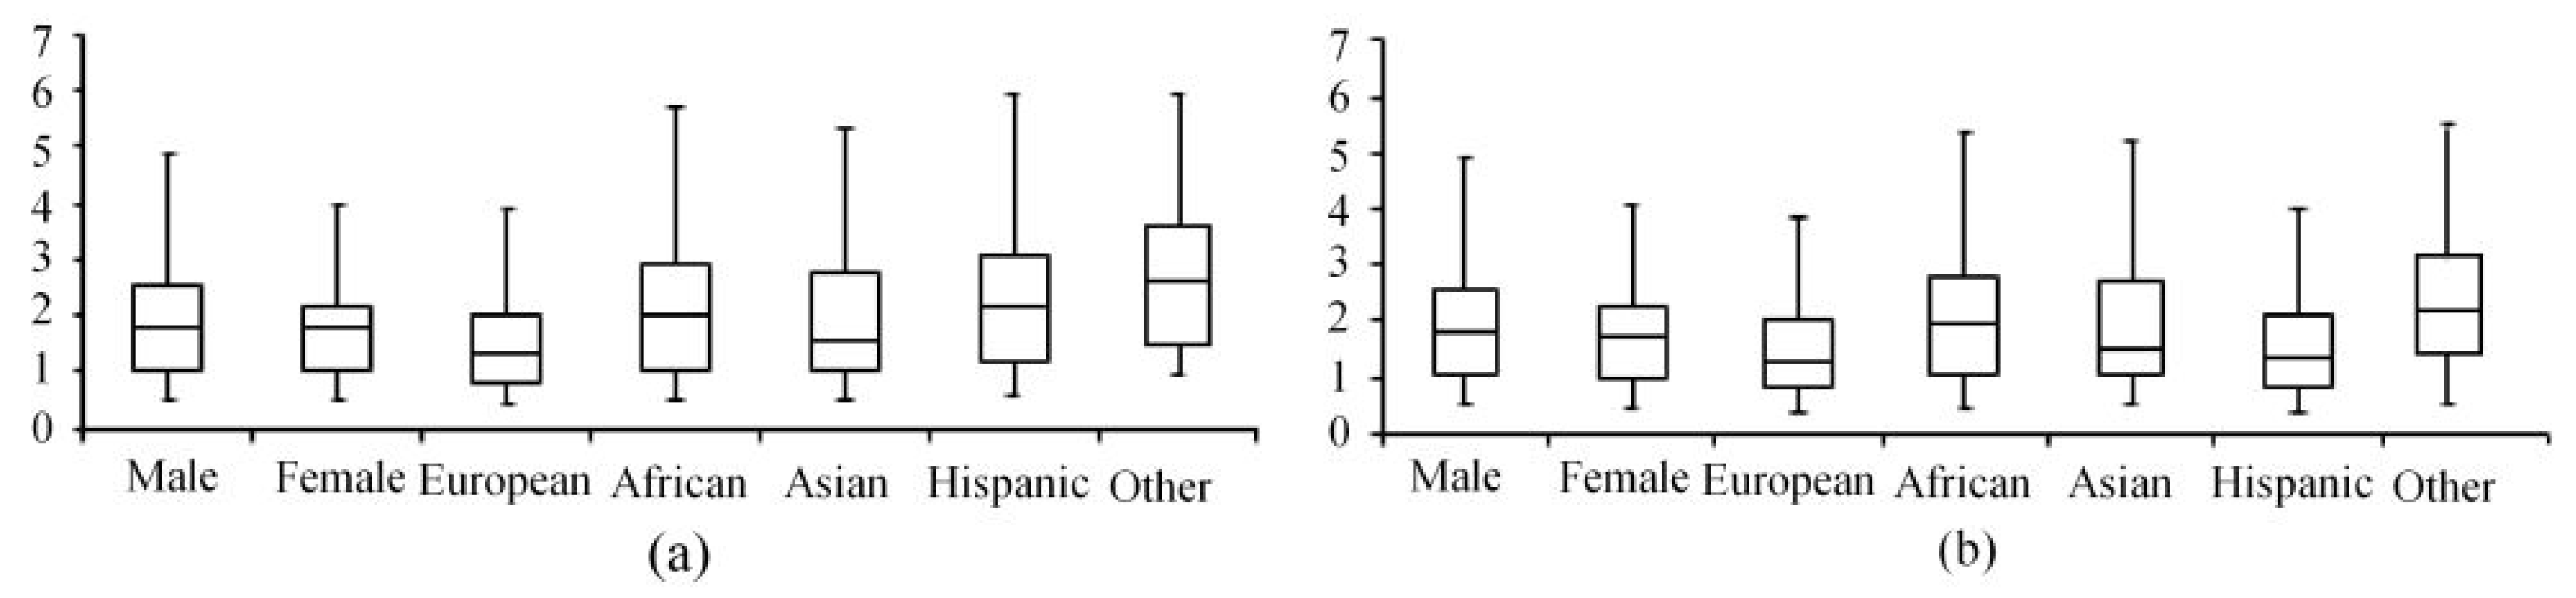
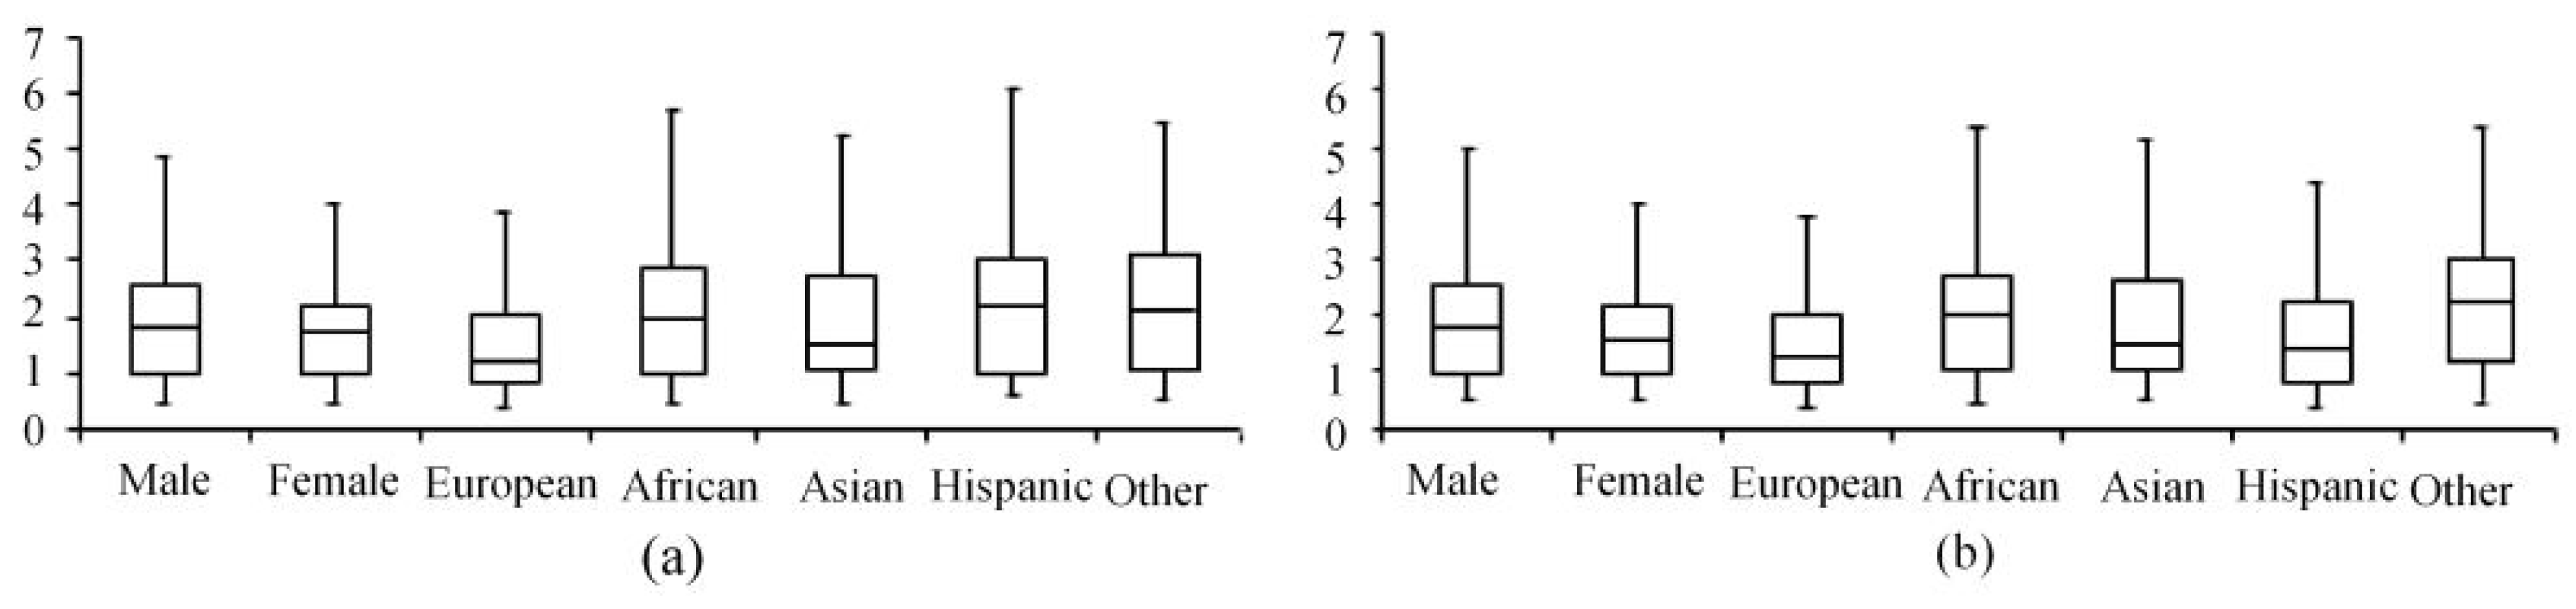
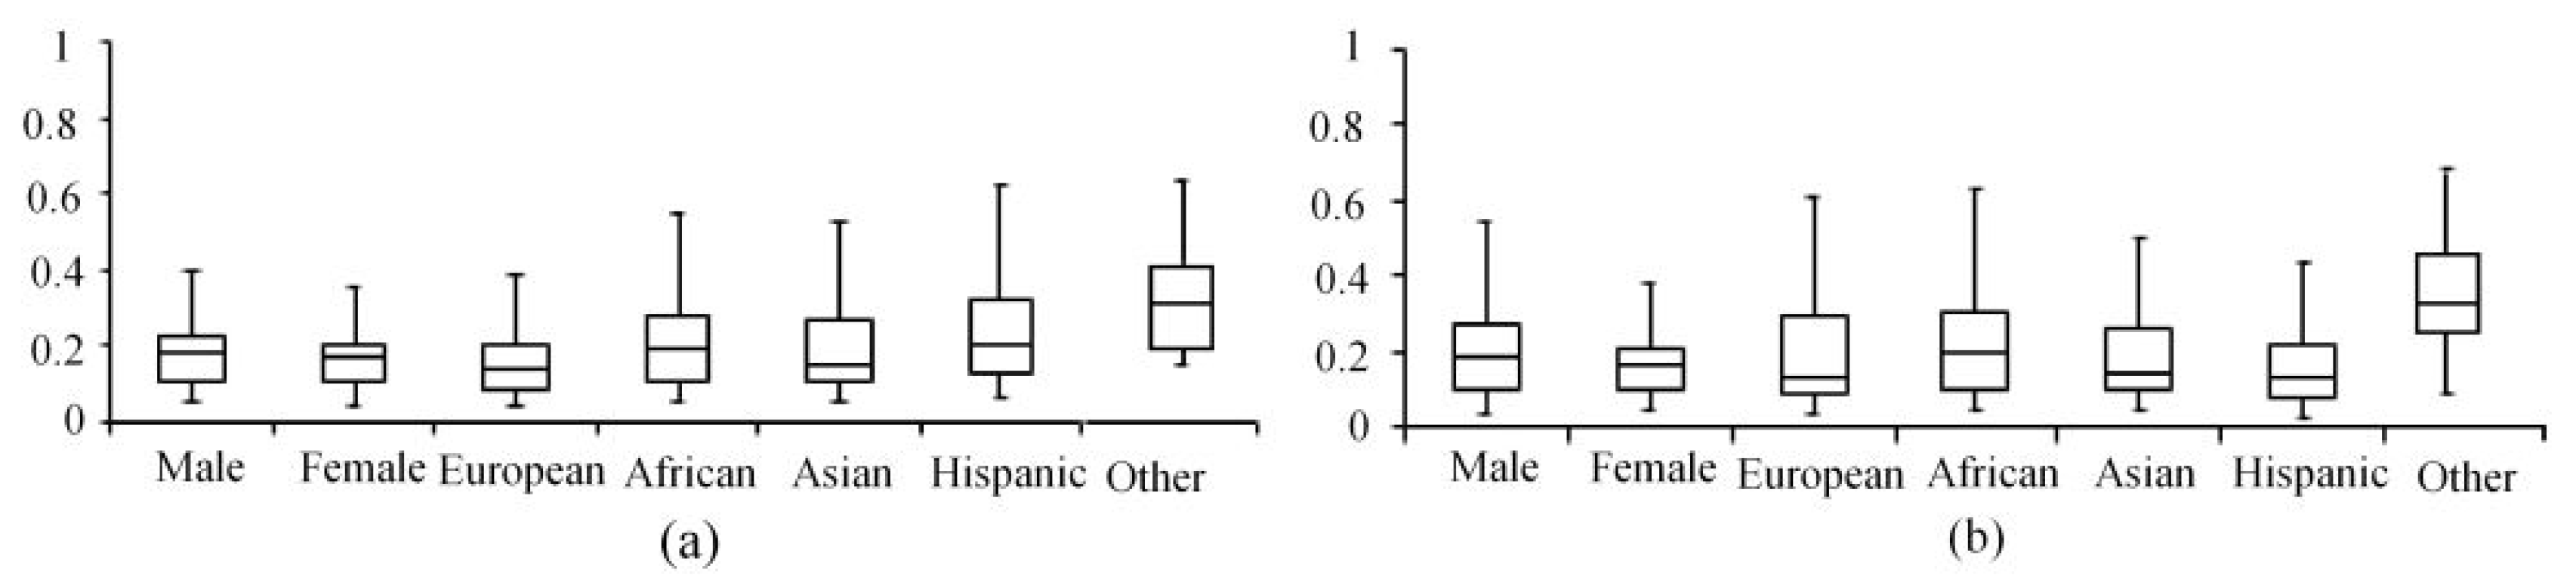
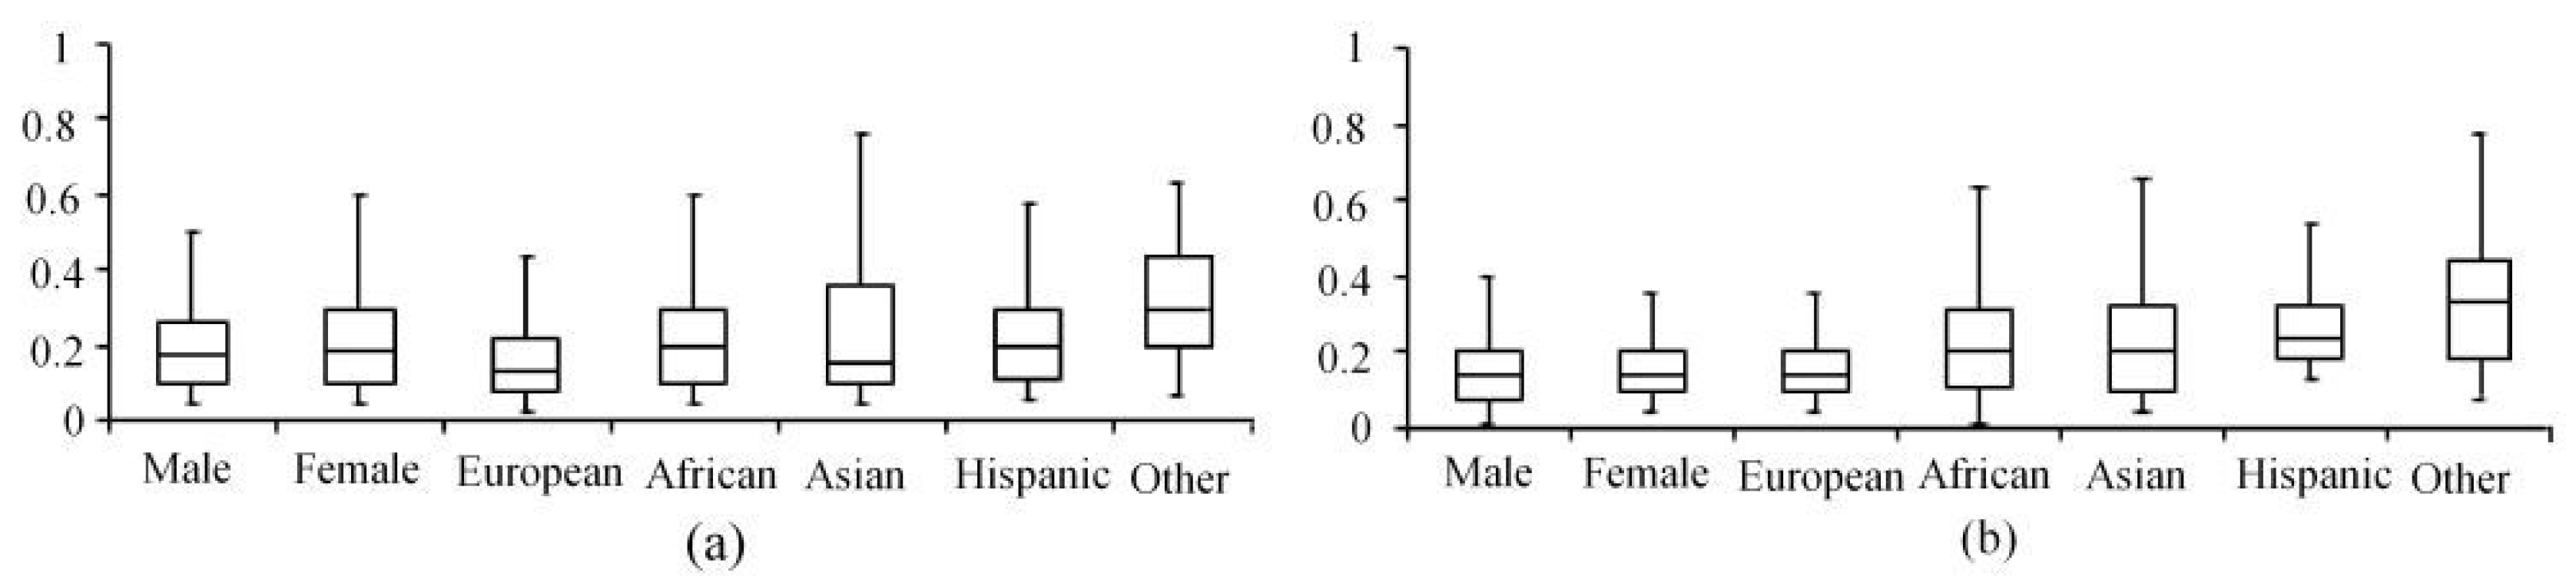
To verify the reliability of the chosen method in detecting asymmetric dimensions, we compute the same set of asymmetric dimensions using the active appearance model (AAM) [23] for landmarks detection followed by an image processing software application called ImageJ [24] for recording bilateral distances. For this purpose, first we computed the mean and standard deviation of each of the asymmetric dimensions obtained using the selected method given in Algorithm 2 before data normalization. Figure 5 and Figure 6 respectively present the mean values for the MORPH and FERET datasets in the form of box plots. The corresponding standard deviations are shown in Figure 7 and Figure 8 for the MORPH and FERET datasets, respectively. The values were expressed in millimeters, with males and females grouped, and considering the five ethnic groups including European, African, Asian, Hispanic and others. We compared the Intraclass Correlation Coefficients (ICC), and coefficient of variation (CV) for both methods to test the reliability in detecting asymmetric dimensions. The proposed approach resulted in ICC > 0.90 with p-value < 0.001 and ICC > 0.92 with p-value < 0.001 for MORPH and FERET datasets respectively.
| Algorithm 2 Detection of bilateral asymmetric dimensions |
Input: Aligned face image f, and coordinates of landmarks and
|
| Output: Bilateral asymmetric dimensions . |
For the proposed method, CV < 4.3% for MORPH and CV < 4.5% for FERET. In contrast, AAM algorithm with ImageJ resulted in ICC > 0.87 with p-value < 0.001 and ICC > 0.89 with p-value < 0.001 for MORPH and FERET datasets, respectively. Similarly, CV < 4.8% each for MORPH and FERET datasets is achieved for AAM with ImageJ method. The comparative results show that the proposed method is more reliable in detecting asymmetric dimensions compared to AAM with ImageJ toolbox.
3.3.1. Data Normalization
Data normalization aims to make values of different variables lie within the same ranges. In certain scenarios, the variable values may be too small or large and the variables with higher values may affect the development of a model, despite their insignificance. Such scenarios require data normalization before developing regression models. To this end, we use respective mean and variance to normalize the variable values as shown in Equation (3) [25].
where, is the normalized data variable, is the ith value of the jth variable, is mean of the jth variable and denotes the standard deviation. This type of normalization is called linear normalization with zero mean and unit variance.
3.3.2. Data Analysis
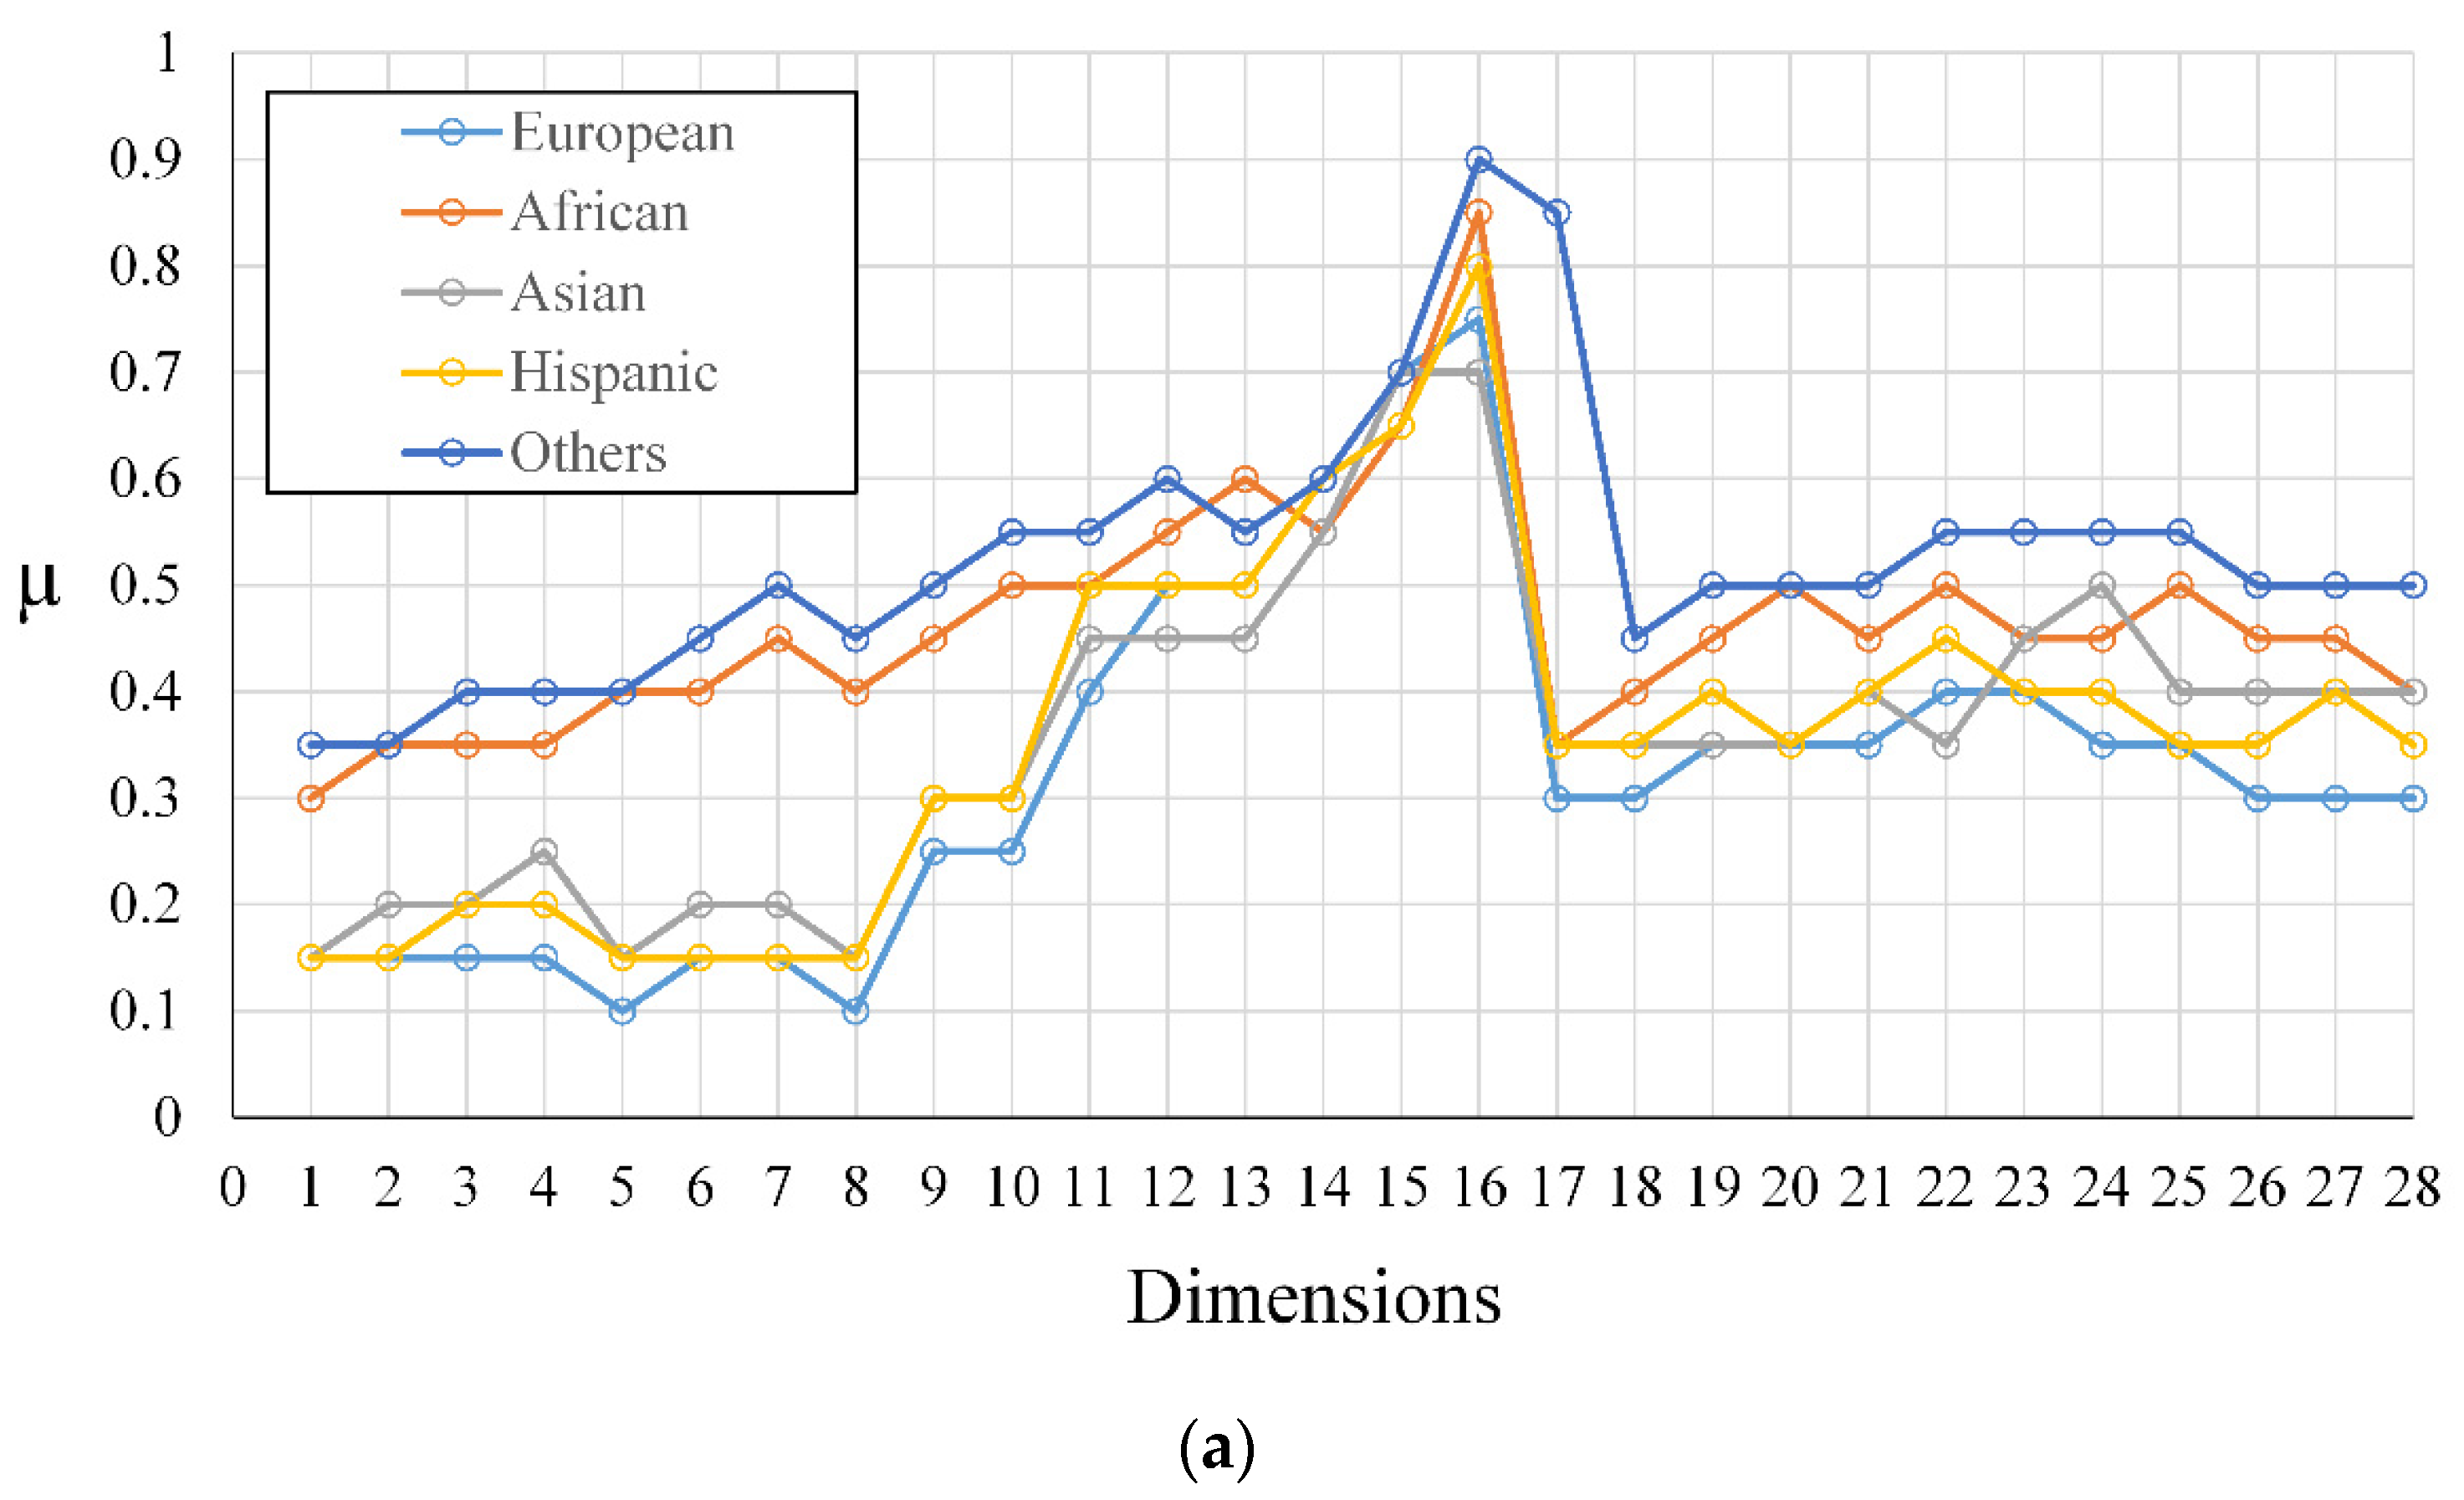
To correlate the facial asymmetry between different populations, the mean values of the normalized asymmetric dimensions were calculated and plotted in Figure 9a,b respectively for the MORPH and FERET datasets. Similarly, Figure 10a,b show the variation in mean values of asymmetric dimensions for five ethnic groups (European, African, Asian, Hispanic and Other).
- The facial asymmetry patterns for both male and female subjects are nearly identical in shape and shown increase for the lower parts of the face which is mainly due to the functional adaptation of masticatory activity in these parts as suggested in Reference [26].
- Facial asymmetry is slightly more pronounced in males compared to females. This is due to a difference in growth patterns and facial proportions between males and females [27]. Moreover, the masticatory frequencies are significantly higher in males resulting in pronounced facial asymmetry for lower part of the face [28].
- Like gender, facial asymmetry patterns are nearly identical for all ethnic groups. However, face images from African and “other” ethnic groups have more pronounced asymmetry compared to rest of the groups. This occurrence could be explained by the larger facial dimensions and development of increased masticatory activity of the subjects from these ethnic groups [11,29].
3.4. Regression Analysis
In this study, the 28 asymmetric dimensions were used as explanatory variables, while gender and ethnicity have been used as dependent variables. To analyze the co-relation between multiple explanatory variables and dependent variables, we propose to use a multiple regression model. The choice of the regression model is motivated by its ability to handle the unbalanced sample sizes present in the dataset. For example, the number of subjects with Asian origin are very small compared to African and European subjects. Secondly, due to absence of any interactions in the model, the individual demographic features are independent of each other. More precisely, we can assess the effect of a single variable, keeping all other variables constant. The linear model aims to find the best possible linear combination of independent variables that produces a predicted result as close as possible to the observed result across all the subjects. The regression model has been fit using the SPSS software. This software is chosen due to its powerful analytical features.
In the following analysis, European male subjects were assumed to form the baseline with asymmetric dimensions measured in millimeters and then individual effects were estimated for the rest of the demographic groups, i.e., females, and four ethnic groups (African, Asian, Hispanic, and others). We report the results of linear regression model in Table 2 and Table 3 for MORPH and FERET datasets, respectively. We report the average change from baseline to a group value along with standard error (SE) for each group value. The SE is a measure of the accuracy of predictions.
Consider the asymmetric dimension D1 with baseline average of 0.50 in Table 2. This shows that a European male subject would have asymmetric dimension D1 equal to 0.50 mm as predicted by linear regression model. In contrast, a female subject would have a smaller asymmetric dimension D1 by 1.25 mm. Similarly, a subject from African ethnicity would have a larger asymmetric dimension D1 by 1.75 mm.
4. Analysis of the Results
In this section, we analyze the regression results to check the impact of gender and ethnicity on facial asymmetry.
4.1. Gender
The asymmetric anthropometric measurements show that female subjects have smaller asymmetric dimensions compared to that of male subjects. The asymmetric dimensions D8, D9 and D10 are not significantly different from male faces. The most prominent difference between male and female subjects is observed for asymmetric dimensions D2, D3, and D4. One can observe that out of 28 dimensions, female subjects differ in 25 dimensions from male subjects. There is no significant difference between male and female subjects for symmetric dimensions D8, D9, and D10. This is because the cheek area contains more fat giving it a flatter look for both male and female subjects. The most significant difference is for asymmetric dimensions belonging to the eyebrows area (D2 through D4). This is because female subjects use facial makeup which cofound the left and right sided facial symmetry in female subjects [30]. Unless synthetic, the real make up contains bilateral differences among the deep face makeup areas such as eyes [31]. We also observe a major difference between male and female subjects for asymmetric dimensions including D17, D18, and D19. This difference can be attributed to narrow nose bridge for female subjects compared to male subjects. The highest asymmetric distance between male and female subjects belongs to asymmetric dimension D18 which is 5.00 mm, both for the MORPH and FEERET datasets suggesting the most asymmetric dimension of male subjects.
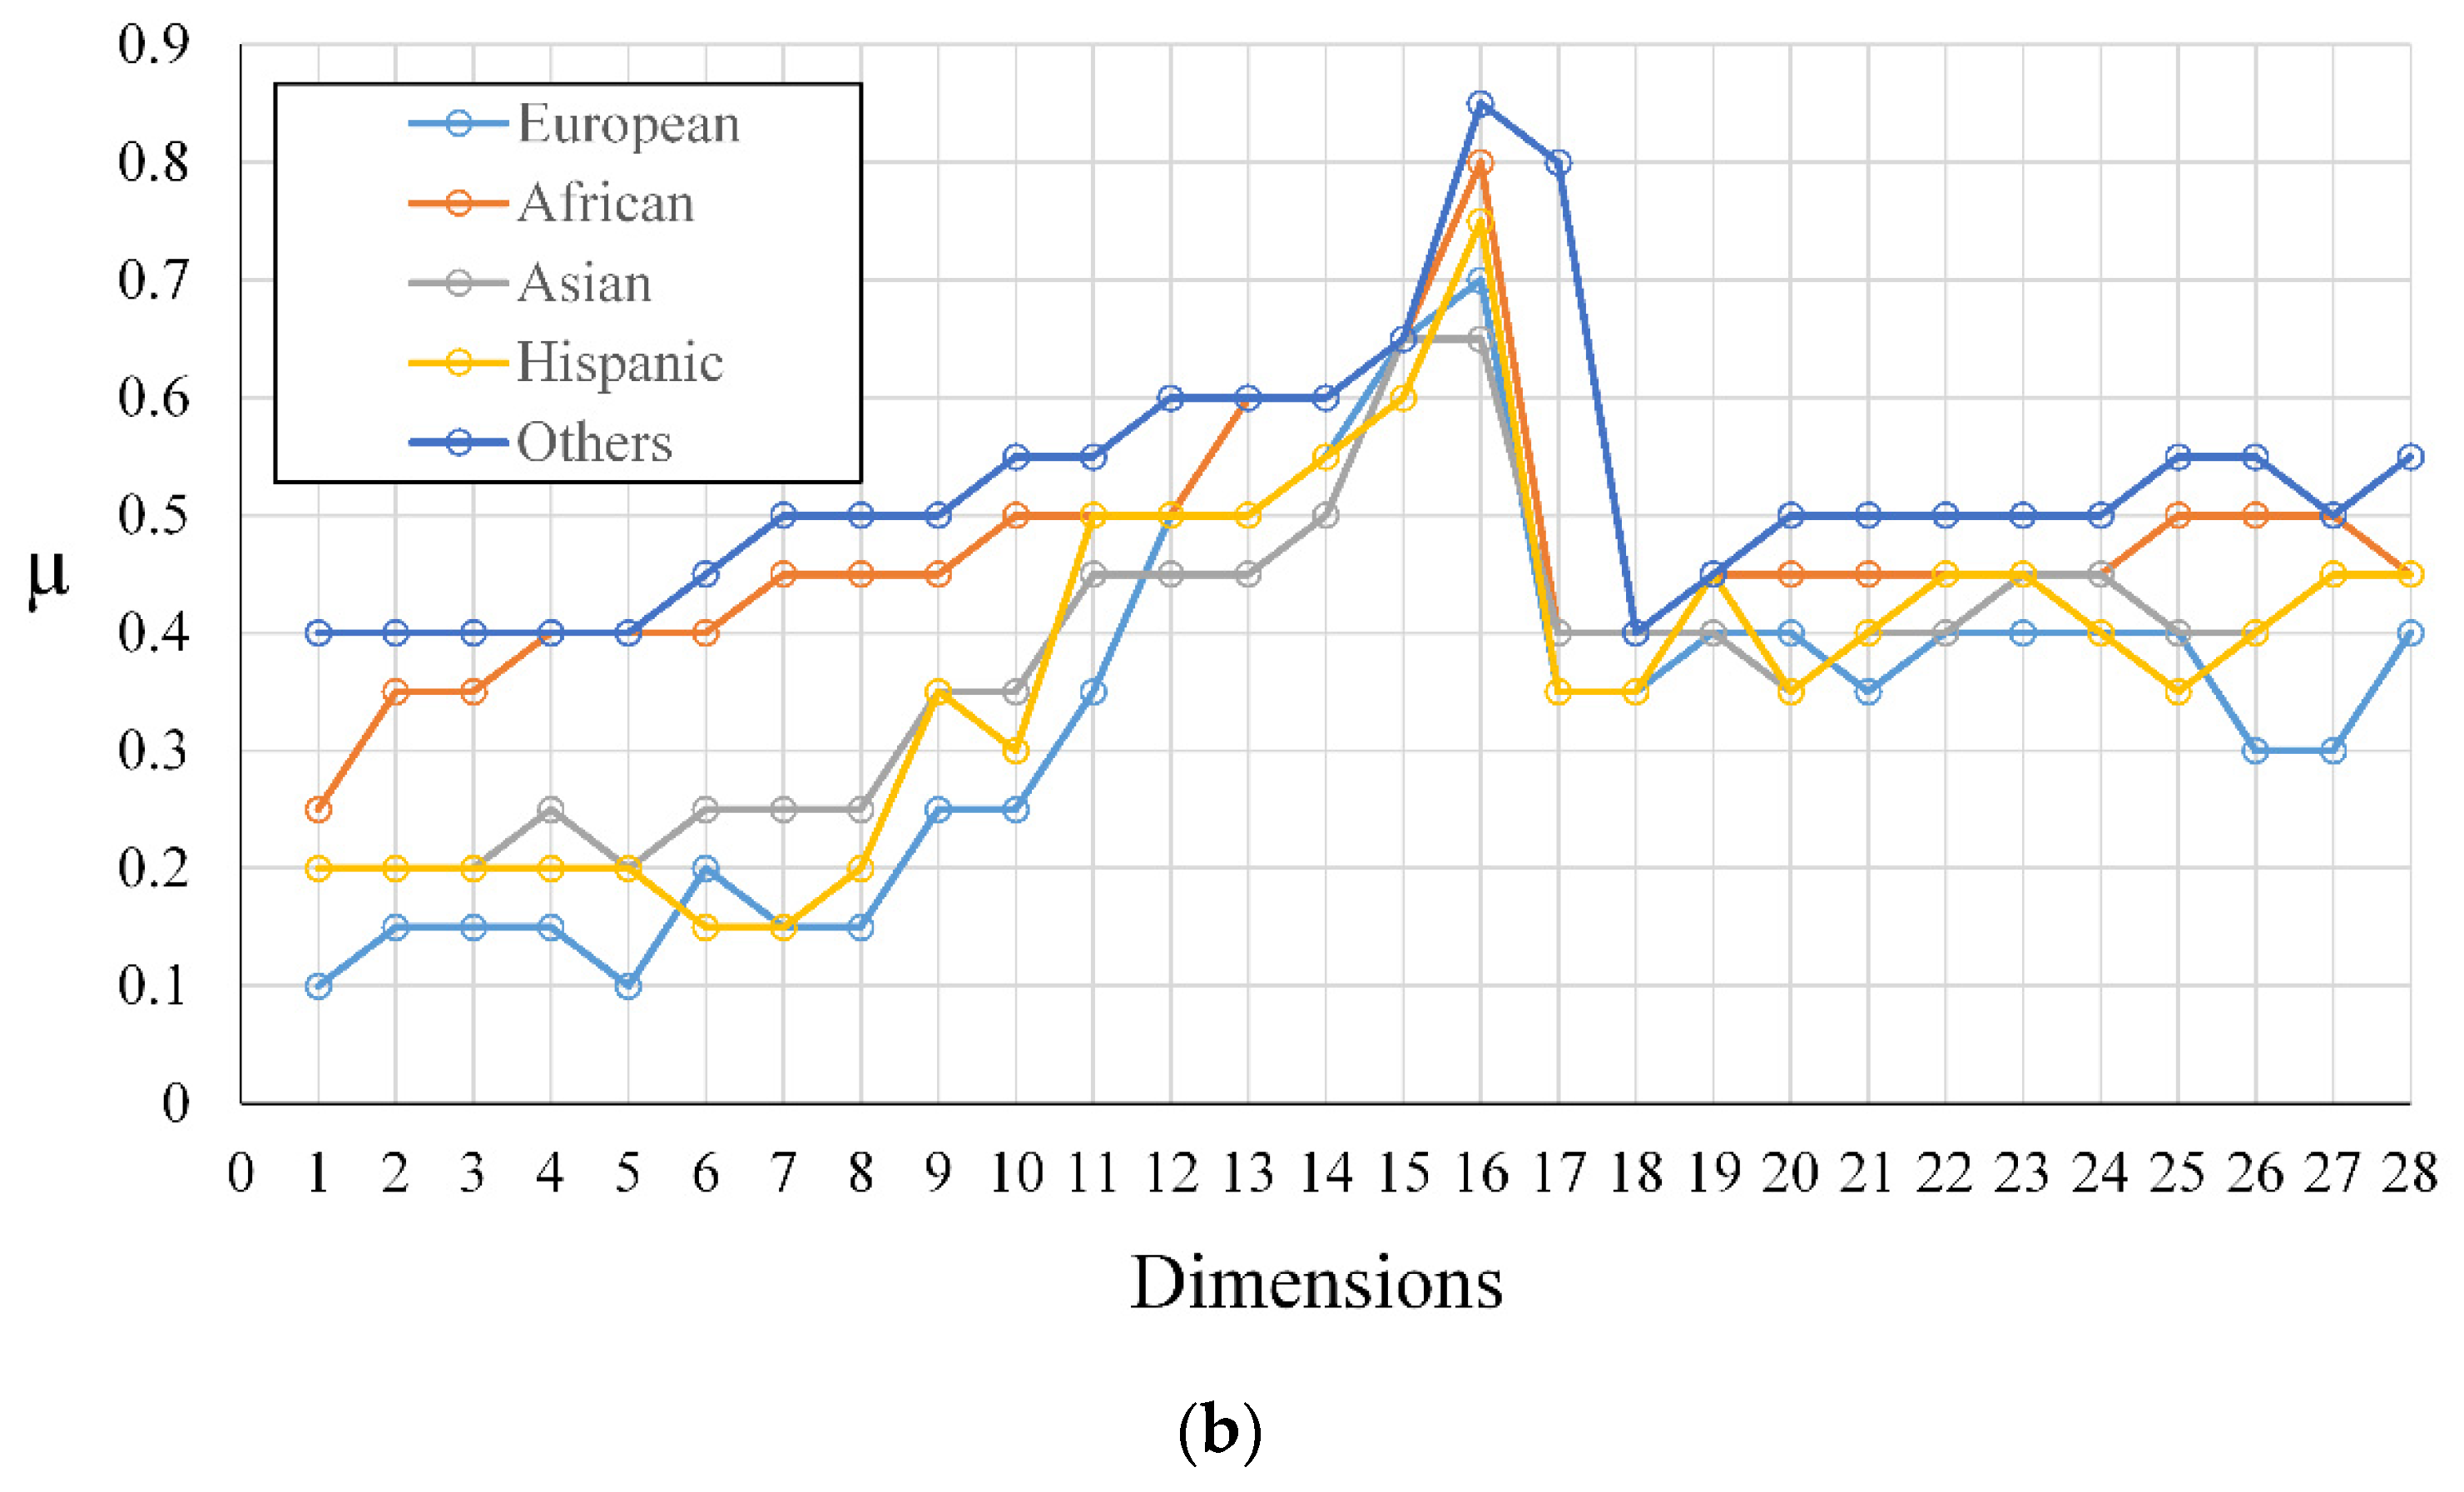
A collinearity check is one of the most important checks of the linear regression model, which aims to analyze the co-relation between the explanatory variables. Where one or more explanatory variables are collinear, they show a weak discriminative power. In this study we have used collinearity analysis to show the co-relation between base-line and demographic-adjusted asymmetric dimensions. Figure 11a,b show the collinearity analysis for base line asymmetric dimensions versus gender-adjusted asymmetric dimensions for MORPH and FERET datasets respectively. It depicts that dimensions D8, D9 and D10 are most insignificant asymmetric dimensions and thus carry no discriminative information between two demographic groups.
4.2. Ethnicity
4.2.1. African vs. European
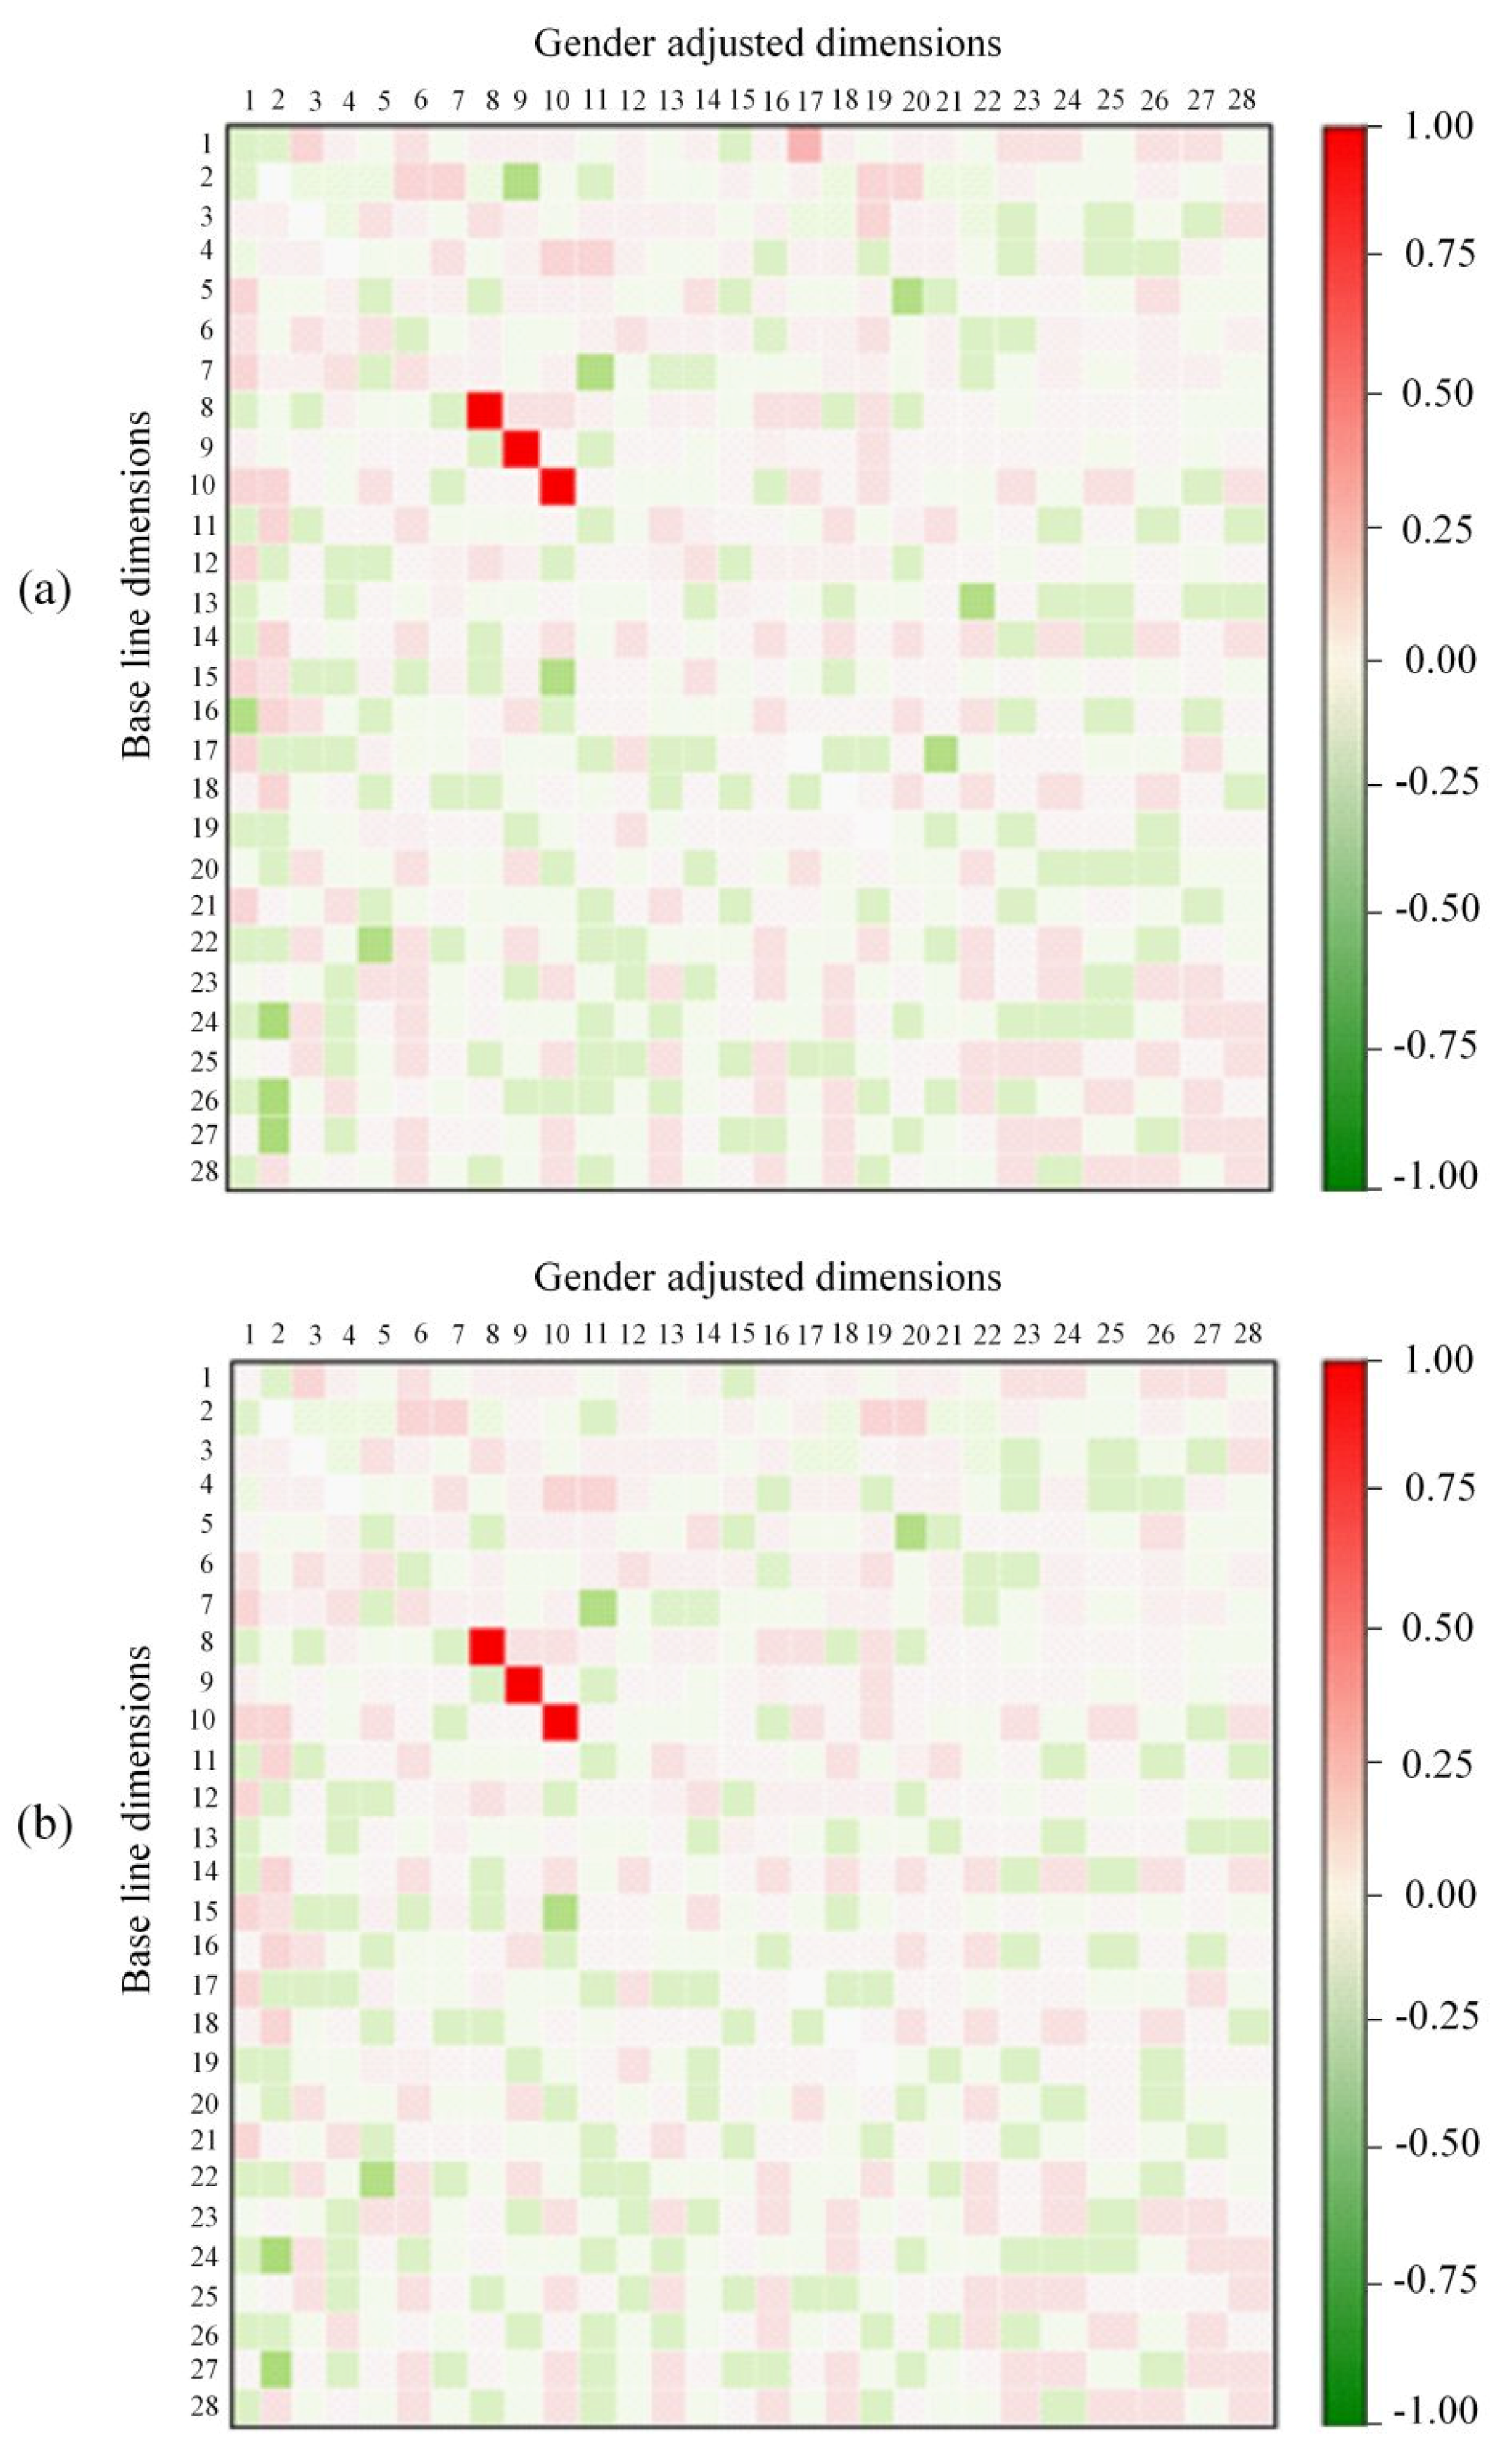
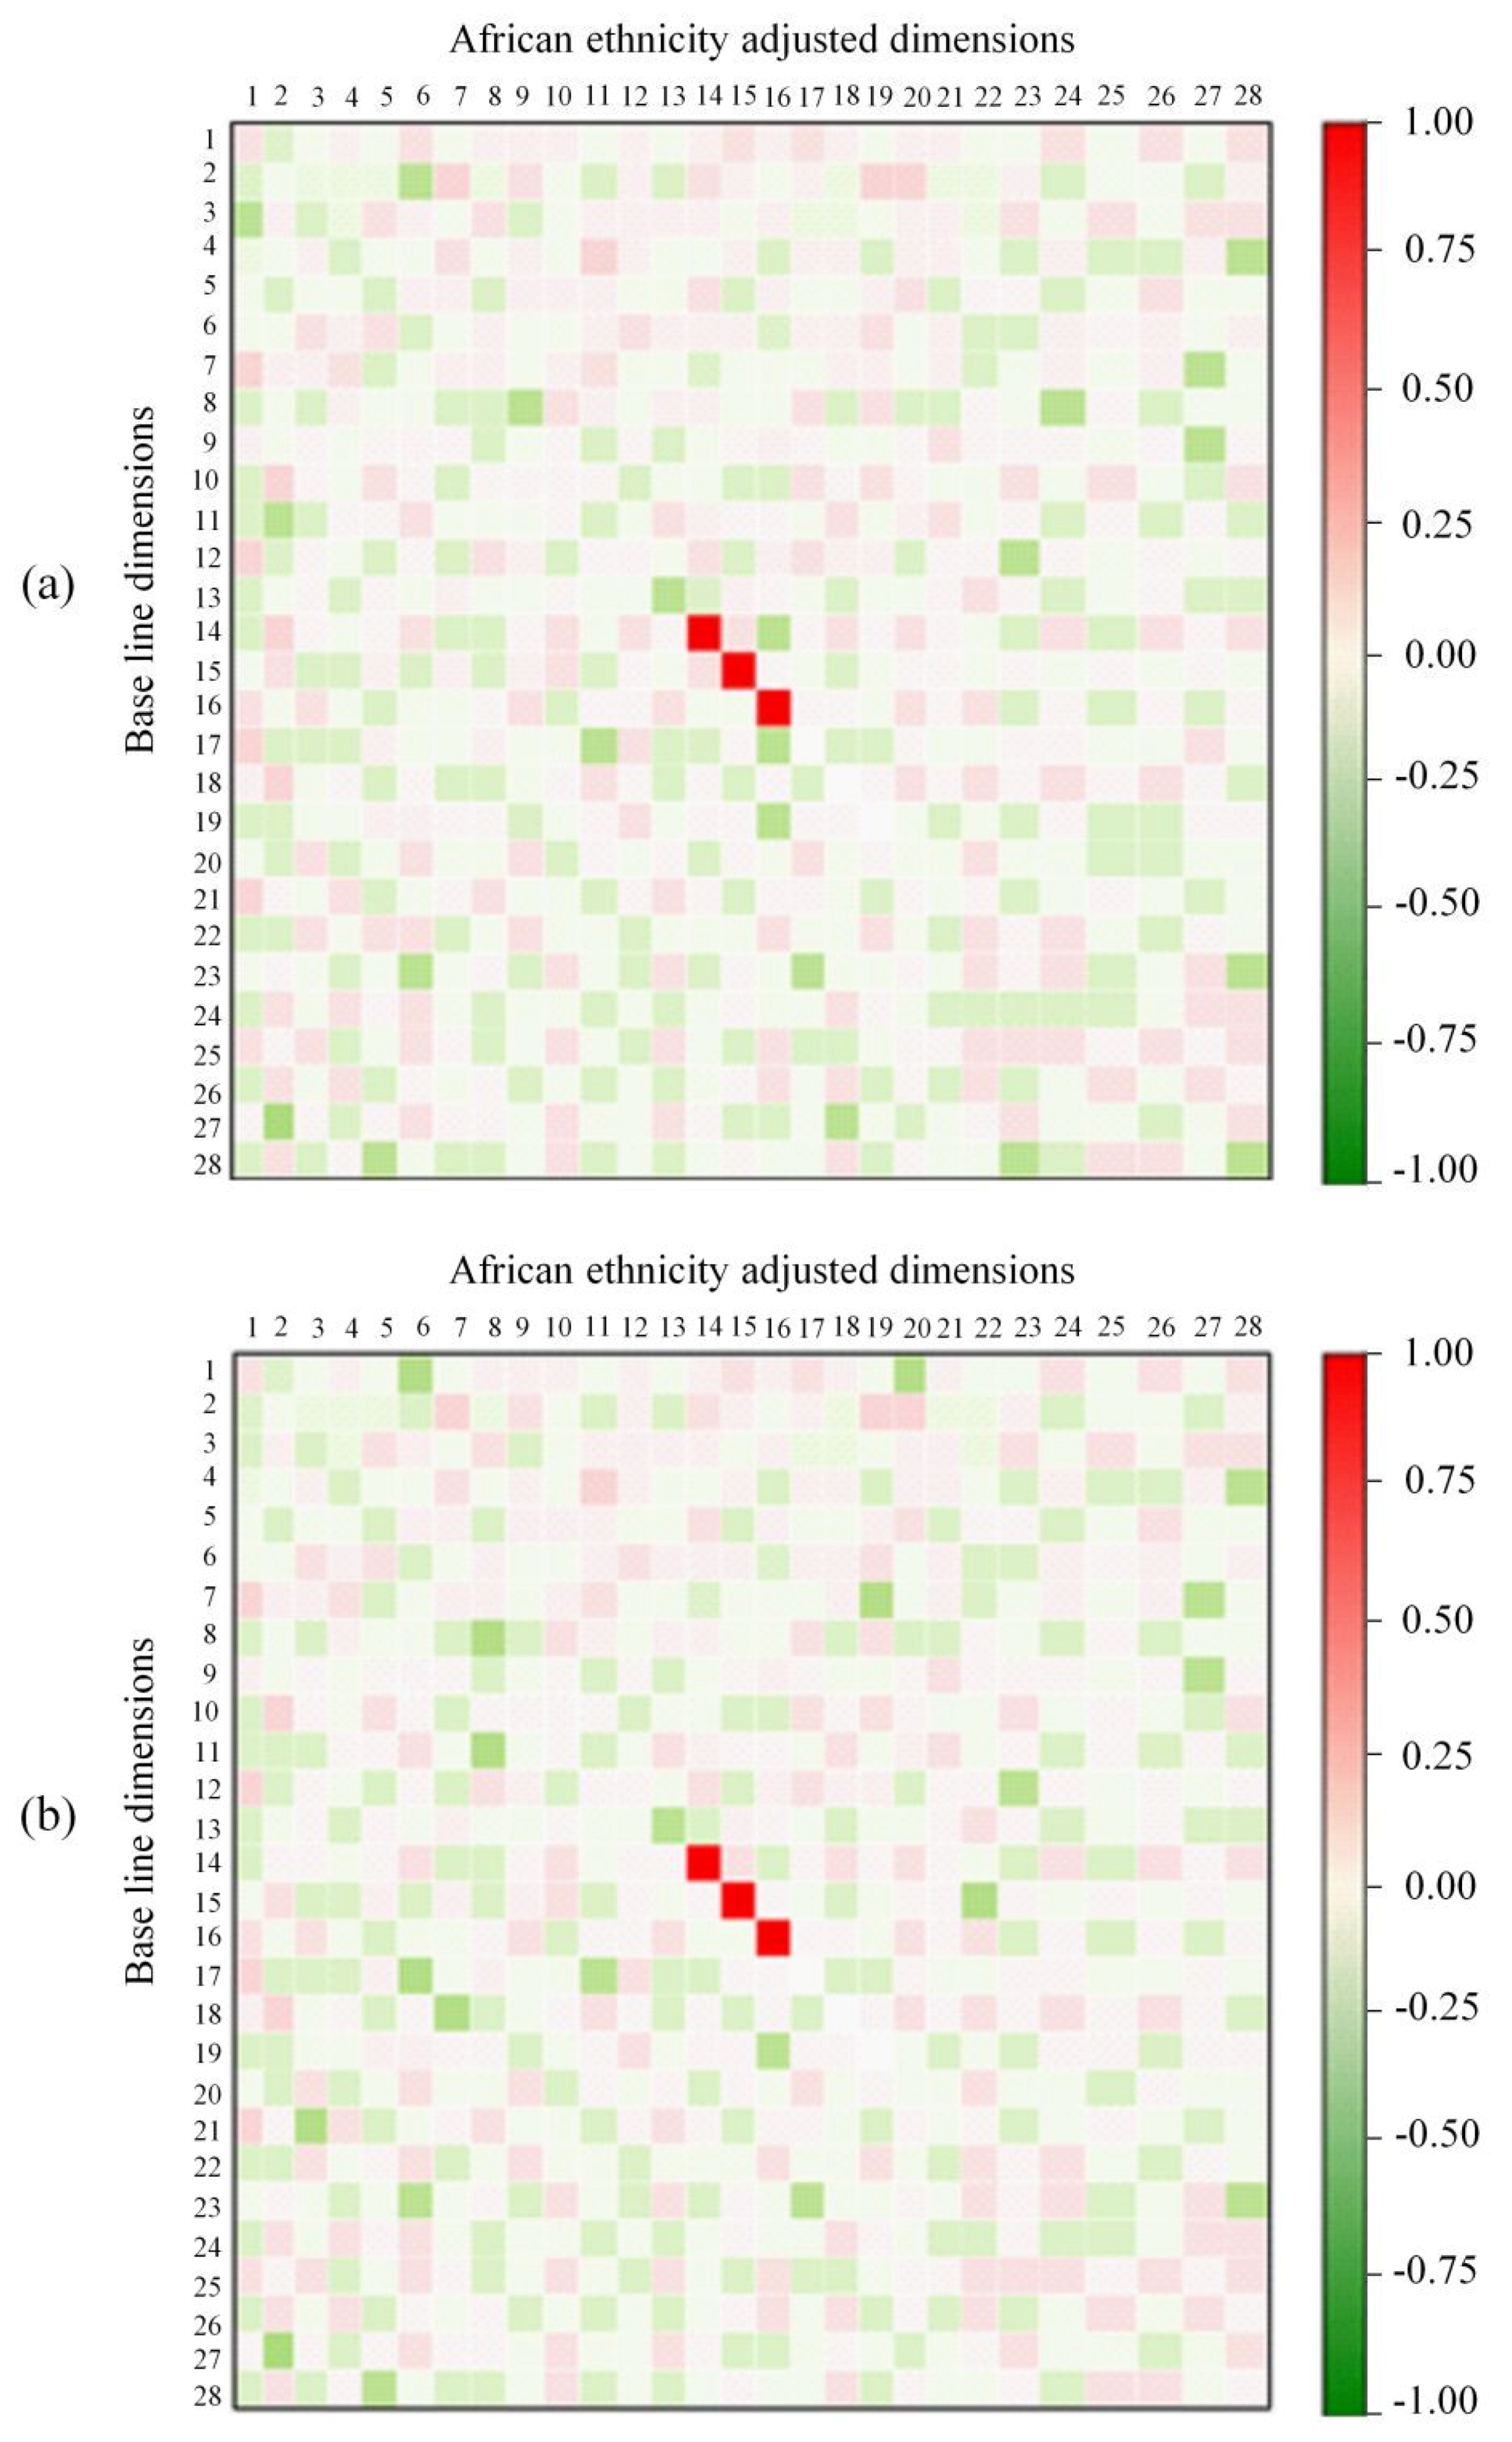
The African subjects have more asymmetric facial dimensions compared to European subjects. The comparative results suggest that out of 28 dimensions, Africans have 25 dimensions significantly different from Europeans, with the exception of D14, D15, and D16. This is because Africans have wide faces, with relatively wider nose, and thicker lips. This results in larger asymmetric facial measurements for the subjects belonging to African ethnicity. In contrast, Europeans have thinner lips owing to a genetic trait [32]. The collinearity analysis shown in Figure 12a,b suggest that the most significant differences occur for the asymmetric dimensions D17, D18, and D19 ranging from 3.5 mm to 4.25 mm both for MORPH and FERET datasets, owing to wider nose bridge of the Africans compared to the Europeans. The results suggest that most of the asymmetric dimensions are larger for Africans than European subjects.
4.2.2. Asian vs. European
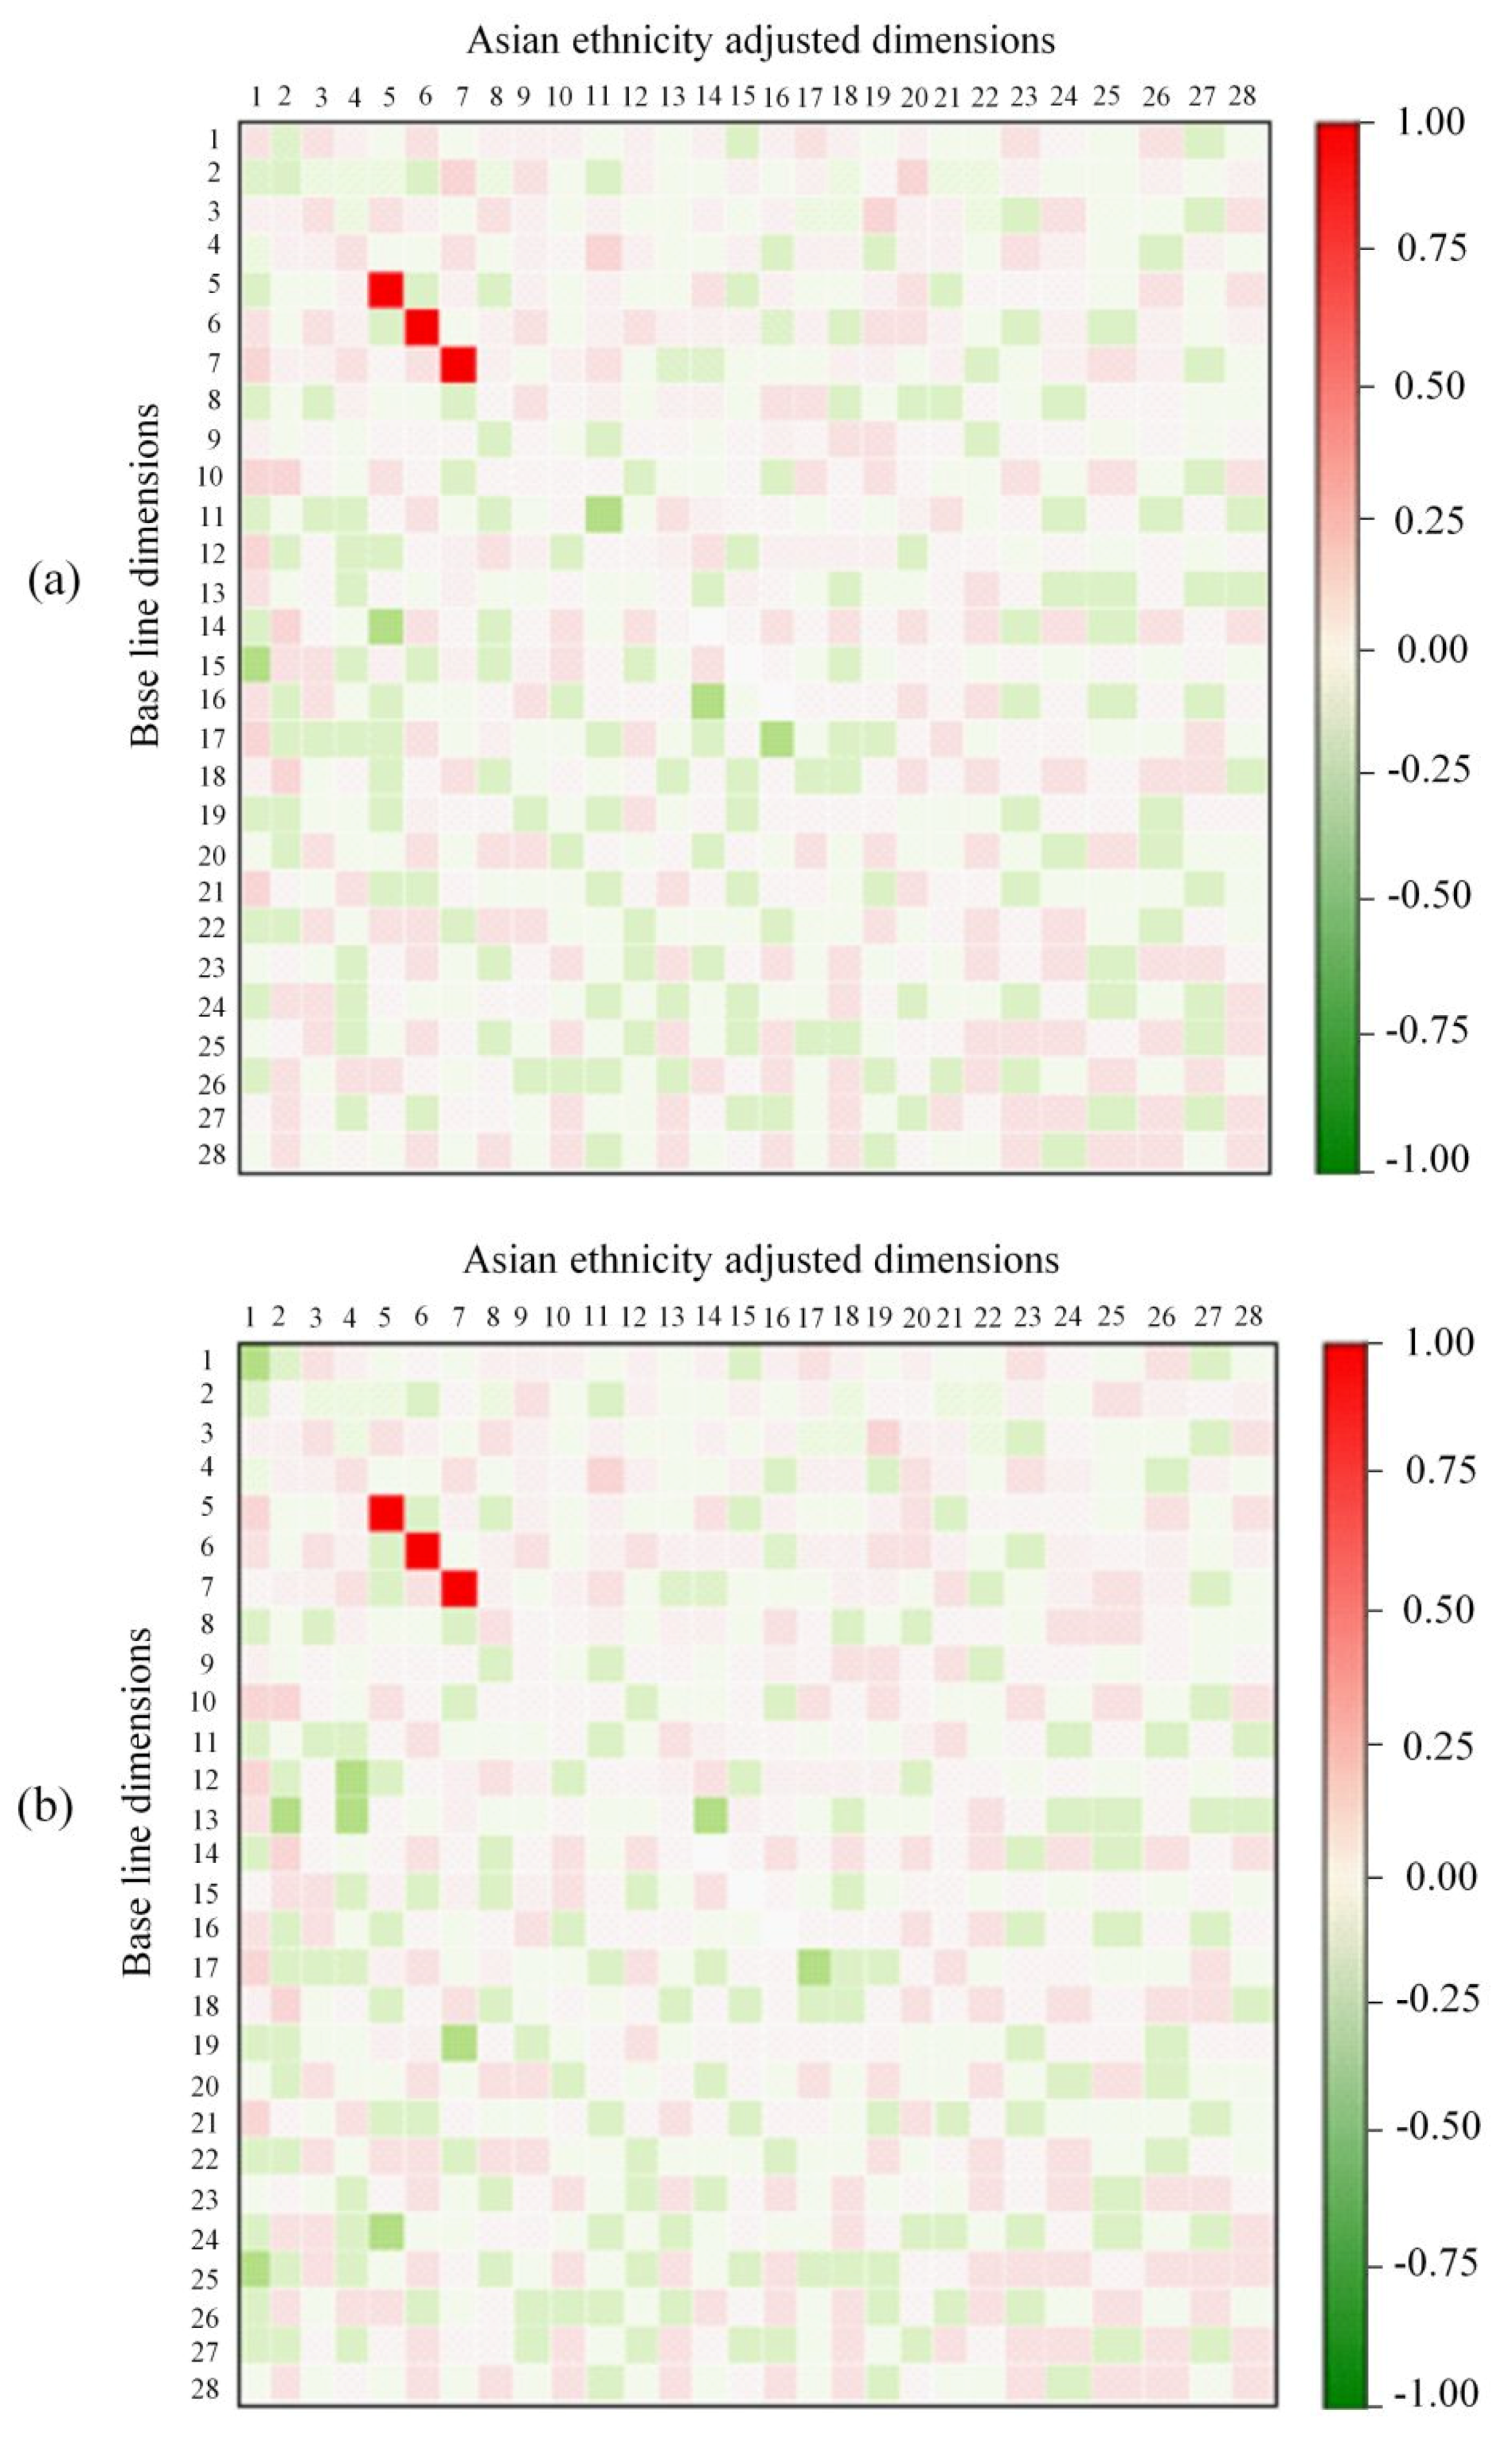
The results show that the Asian subjects have relatively smaller asymmetric dimensions compared to Europeans except D1 to D8 dimensions, ranging from a minimum of −2.25 to maximum of 2.25 mm. The dimensions D5, D6, and D7 are not significantly different from the baseline dimensions of the Europeans. This is because Asian subjects have smaller eyes compared to Europeans making the corresponding asymmetric dimensions small. There is significant difference between asymmetric dimensions D14, D15, and D16, suggesting prominent facial asymmetry across the length of the face. Collinearity analysis for the baseline versus Asian ethnicity adjusted asymmetric dimensions has been shown in Figure 13a,b for the MORPH and FERET datasets, respectively. It is evident that the dimensions D14, D15, and D16 are the most significant in discriminating the two ethnic groups.
4.2.3. Hispanic vs. European
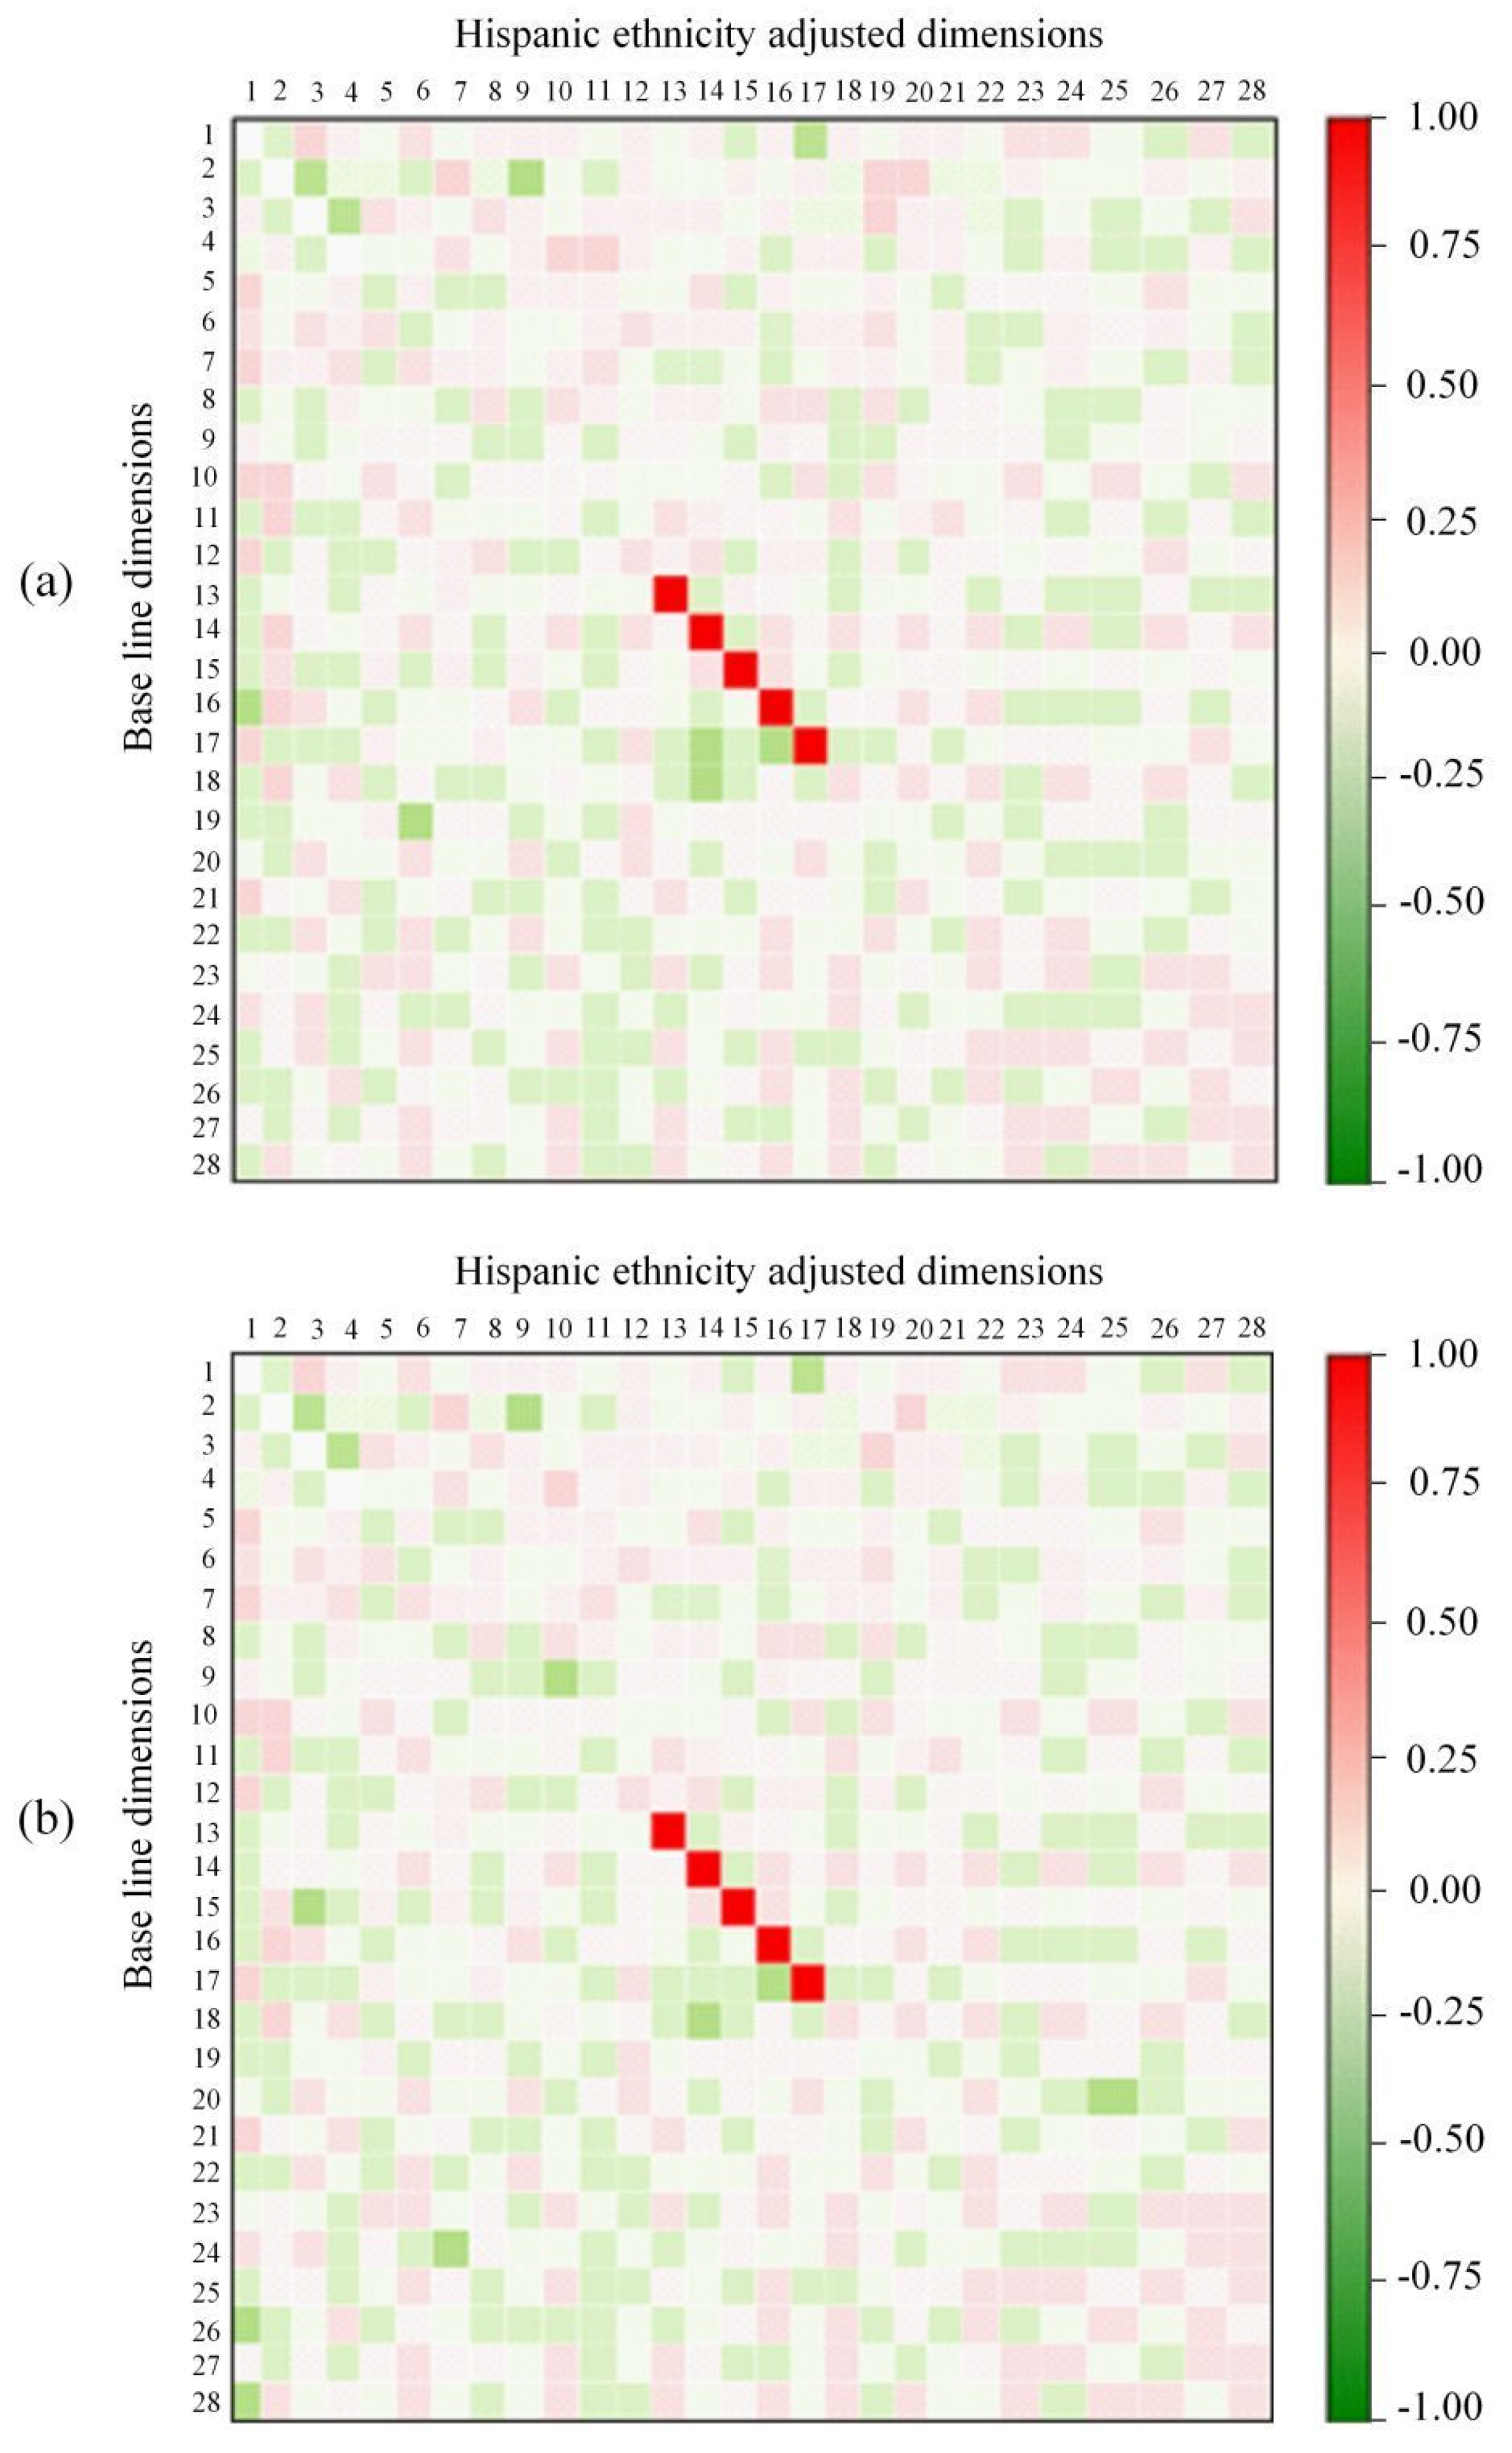
Hispanic subjects have smaller asymmetric dimensions including D1 through D10 compared to European subjects. The results suggest that there is no significant difference between asymmetric dimensions of Hispanic against European subjects, except D1, D2, D3, and D4. This is because, Hispanic subjects have relatively smaller eyes making small asymmetric dimensions. The collinearity analysis shown in Figure 14a,b for MORPH and FERET datasets suggests that there is no significant difference between asymmetric dimensions D13 through D17 between the subjects belonging to Hispanic and European ethnicities owing to similar face width of the subjects belonging to both ethnicities.
4.2.4. Other Ethnicities vs. European
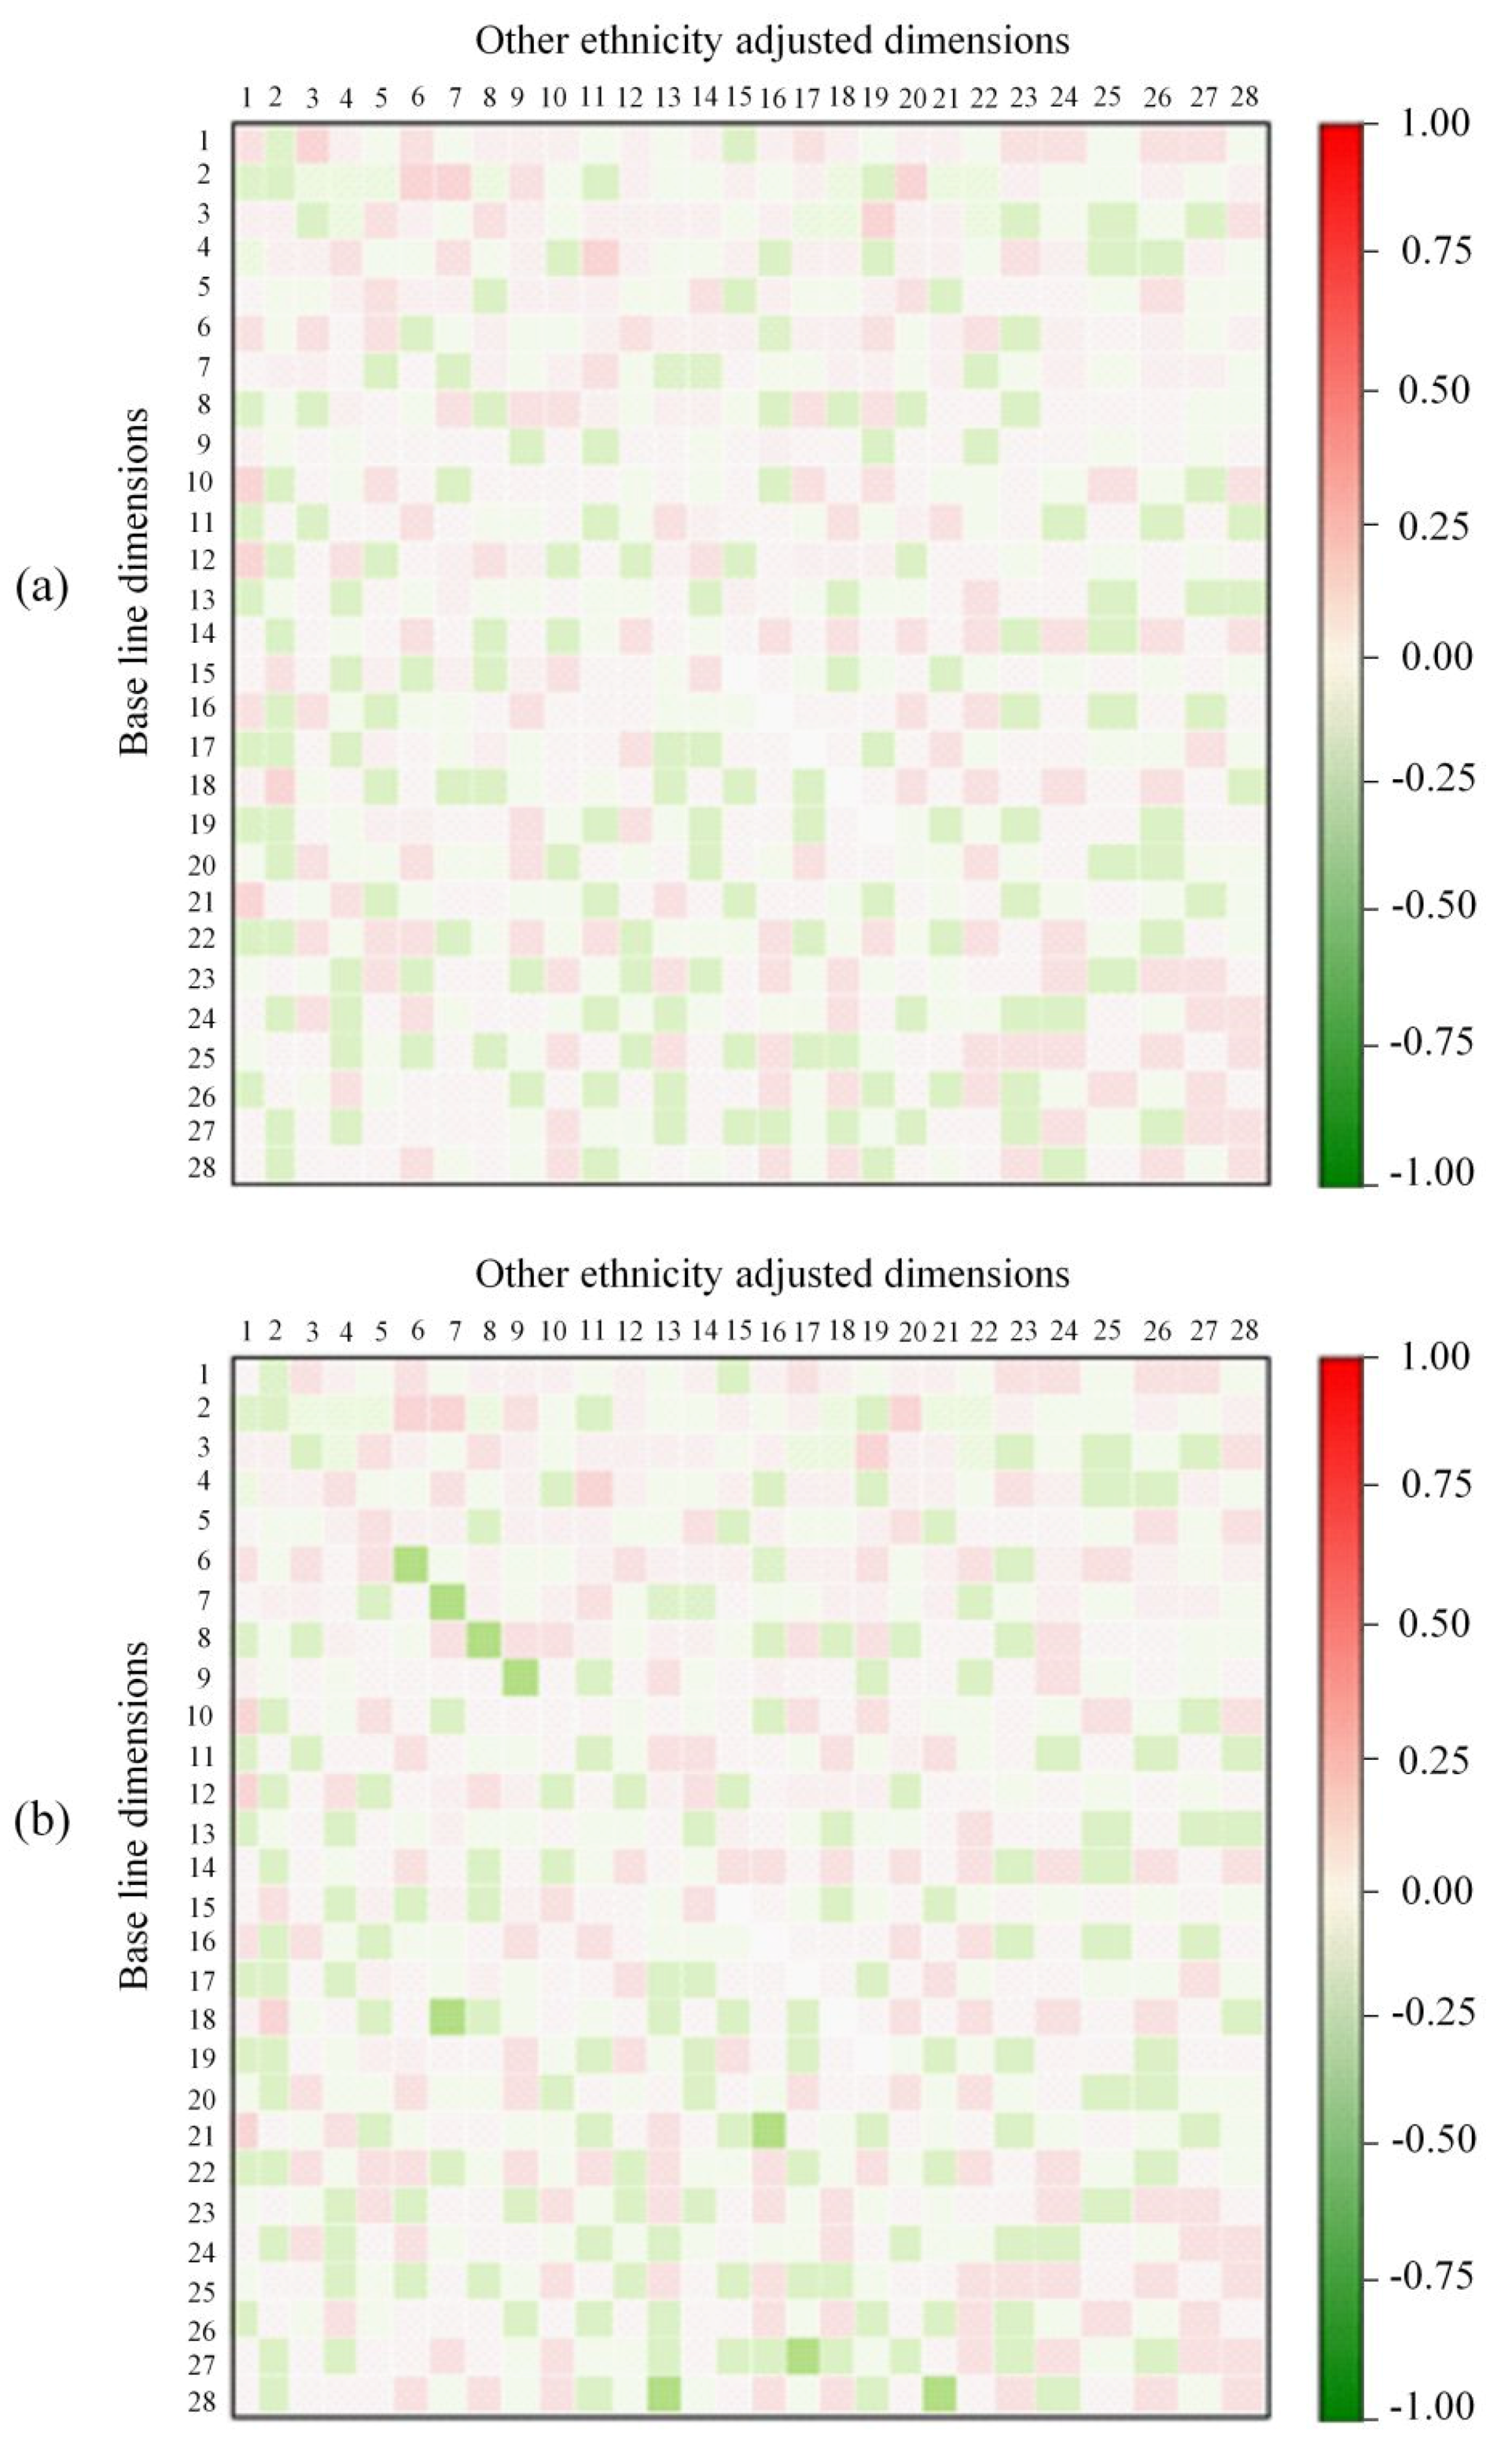
The subjects from other ethnic group differ from European subjects mainly in asymmetric dimensions D15, D16, D17, D18 and D19. These dimensions are higher for the subjects belonging to other ethnic groups compared to the European subjects. The collinearity analysis given in Figure 15a,b for MORPH and FERET datasets show that the most of the asymmetric dimensions are different for these two ethnic groups.
4.3. Validation of Linear Regression Model
To validate the performance of linear model in identifying the most discriminative asymmetric dimensions among different demographic groups, we used the post-hoc Tukey test. This test was used to search for the significant statistical differences between base line and different demographic groups. The post-hoc test results shown in Table 4 and Table 5 for the MORH and FERET datasets, respectively, indicate the significance level of average change from base line to each demographic group value. A direct comparison between the significance levels reported in Table 2 and Table 3 show consistency with post-hoc results reported in Table 4 and Table 5 for MORPH and FERET datasets, respectively. This validates the efficacy of the proposed linear model in identifying gender and ethnic-informative asymmetric dimensions.
4.4. Gender and Ethnicity Classification
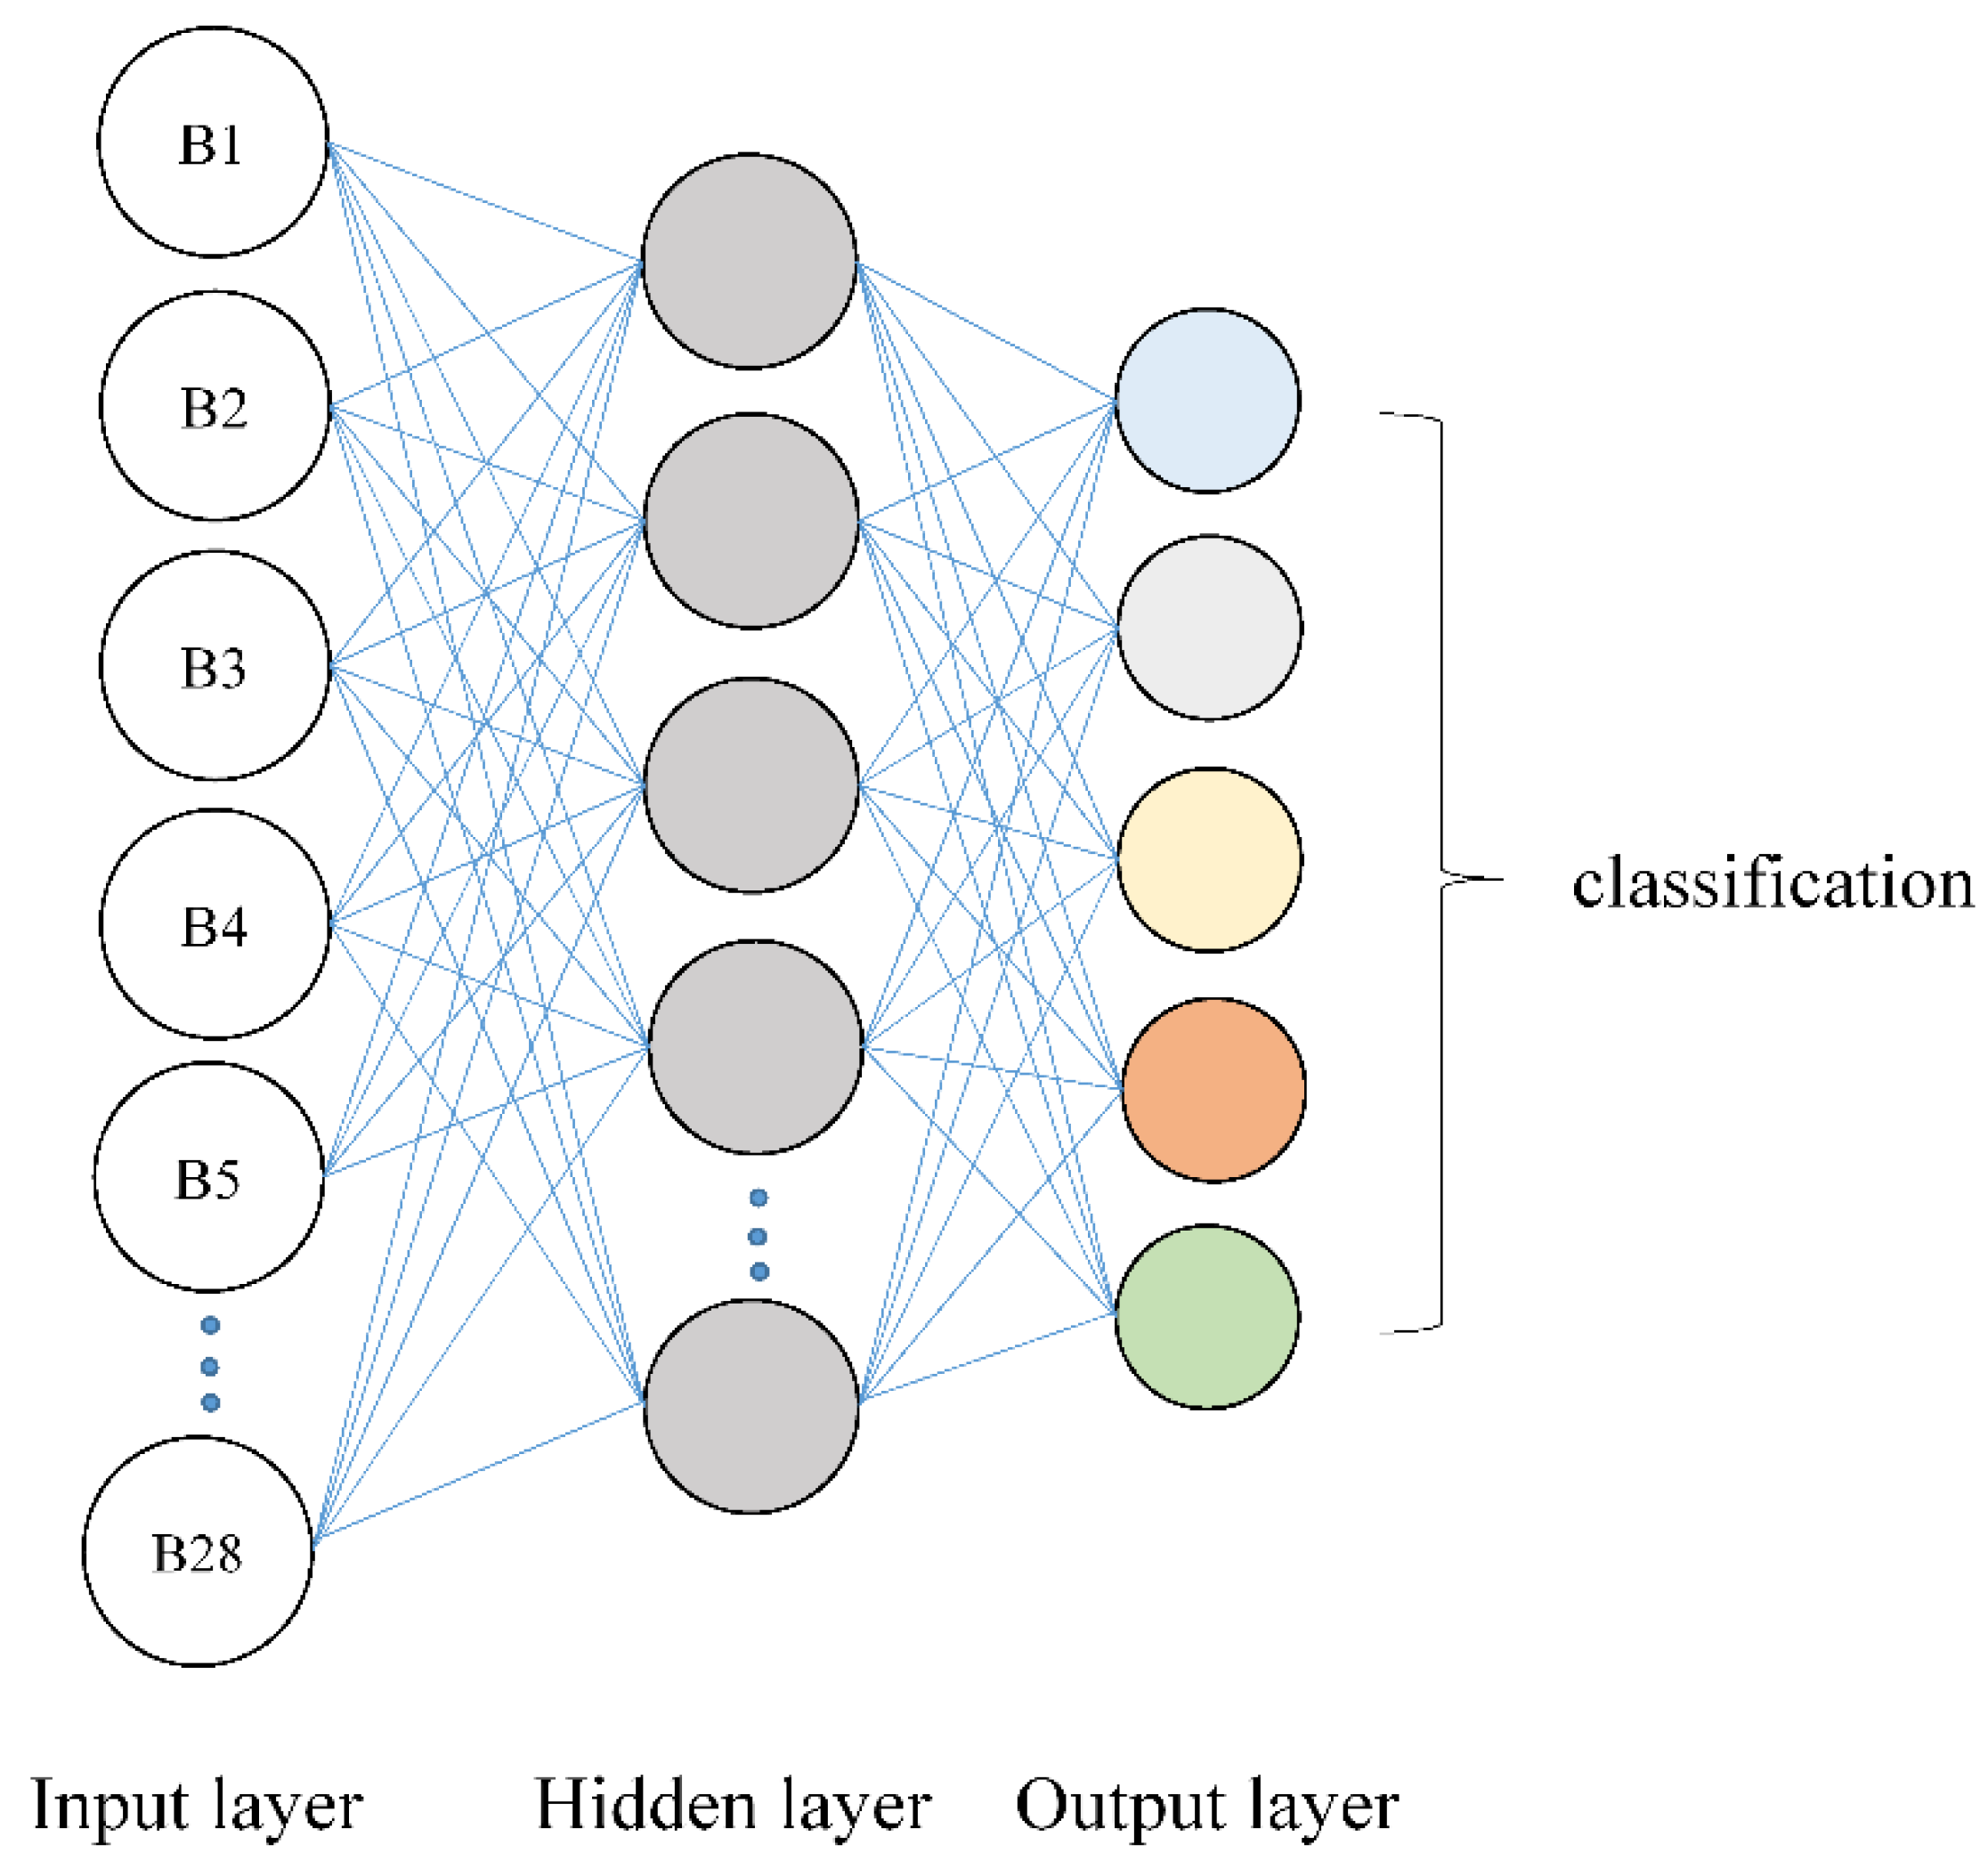
After dimension detection, we aim to perform gender and race classification based on asymmetric dimensions. For this purpose, we train a neural network classifier, which takes asymmetric dimensions as the input for the classification task. As we want to perform gender and race classification, we train two separate classifiers with different number of neurons in the output layer. The choice of this classifier is motivated by its superior performance for the underlying classification task. As shown in Figure 16, the neural network classifier we use takes the asymmetric dimensions as input and outputs the gender or race classification.
The neural network structure shown in Figure 16 has three layers: input, hidden and output, and is trained from scratch using stochastic gradient method [33]. The input layer accepts 28 asymmetric dimensions as the input. The hidden layer is followed by an output layer which is learned to classify face images into one of the two groups, male or female in case of gender classification task. In case of ethnicity classification, a face image is classified into one of the five ethnic groups, i.e., European, African, Asian, Hispanic or others. For ethnicity classification task, the output layer contains five neurons, while for gender classification task, there are two neurons in the output layer. The nodes of hidden layer are connected with the input and the output layers via two fully connected layers of weights. The training cycle of a neural network classifier consists of three steps. First, a training example is passed through the network to update the outputs of the nodes. The output of a node is computed in terms of its previous layer input and a sigmoid function [33]. Second, the classification errors are back-propagated to update the nodes using the gradient decent on L2 loss function. Finally, the current node weights are updated using the updated node outputs and gradient decent. This three step procedure is repeated for each training example in each training epoch. It is worthwhile to note that a five-fold cross validation methodology is adopted in training the neural network classifiers, such that training and test accuracies are well balanced.
Once trained, our classifiers can be used to predict the gender or ethnicity of a test face image by taking the argmax as classifier output. The classification accuracy of the network is calculated in terms of correctly classified face images out of the total number of test images.
Gender and Ethnicity Classification Experiments
To assess the performance of neural network classifiers, we use the following two experimental settings.
- (i)
- Split the gender and ethnicity subsets from MORPH into 70% training data and 30% test data and evaluate the classification performance.
- (ii)
- We use gender and ethnicity subsets from FERET as test data and train the classifiers on the corresponding MORPH subsets. This allows us to check the cross-dataset performance of classifiers.
Table 6 and Table 7 respectively display the classification accuracies for gender and ethnicity classification tasks on MORPH and FERET datasets.
From Table 6, we observe that neural network classifier results in classification accuracy of 83.97% and 83.00% for male and female subjects, respectively, on the MORPH subset. In case of the FERET dataset accuracies of 82.50% and 82.11% are achieved for male and female subjects, respectively. Similarly, the neural network classifier achieves classification accuracies of 80.50%, 82.00%, 81.23%, 80.75% and 83.51% for European, African, Asian, Hispanic and other ethnic groups, respectively, on the MORPH dataset. In case of the FERET subsets, classification accuracies of 80.01%, 80.65%, 80.30%, 79.64.00% and 83.00% are achieved for European, African, Asian, Hispanic and other ethnic groups, respectively. Finally, gender classification accuracies of 77.95% and 77.13% are achieved by the state-of-the-art Face++ API as shown in Table 6.
We also compare the gender and race classification accuracies of neural network classifier with those achieved with SVM [34] and kNN classifiers. As shown in Table 6, our classifier achieves overall gender classification accuracies of 83.48% and 82.30% on the MORPH and FERET datasets, respectively. In contrast, SVM [34] classifier achieves overall gender classification accuracies of 79.95% and 79.56% for male and female subjects, respectively. Similarly, kNN classifier gives overall gender classification accuracies of 78.12% and 77.70% for the MORPH and FERET datasets, respectively. As shown in Table 7, for ethnicity classification task, the neural network classifier achieves overall accuracies of 81.59% and 80.72% on the MORPH and FERET datasets, respectively. In contrast, SVM classifier [34] gives accuracies of 79.13% and 78.92% on the MORPH and FERET datasets, respectively. Similarly, kNN classifier achieves overall accuracy of 77.88% on the MORPH dataset and 76.71% on the FERET dataset. Face++ API [21] achieves overall ethnicity classification accuracy of 77.16% on the MORPH dataset and 76.18% on the FERET dataset.
From the above presented results, we make the following key observations.
- This study suggests that anthropometric asymmetric dimensions may provide an indication of gender and ethnicity. The evaluation results suggest that male faces are more asymmetric than female faces. Similarly, the face images of the subjects from African and other ethnic groups show more pronounced asymmetry followed by Asians, Hispanics and Europeans, respectively.
- We used a linear regression model to evaluate the impact of gender and ethnicity on facial asymmetry. It is observed that certain anthropometric asymmetric dimensions are significantly different among the subjects from varying gender and ethnicities.
- As the designs of facial masks that are not compatible with the asymmetric measurements could result in undesired events, the anthropometric analysis presented in this study could be significant for design of RPE and planning facial cosmetic surgery. We also train a neural network classifier from scratch to use asymmetric dimensions for gender and ethnicity classification. The classification results on the MORPH and FERET datasets show that the neural network classifier outperforms other classifiers including SVM [34] and kNN for the underlying tasks. The better performance of this classifier can be attributed to its ability to generate complex decision boundaries in the feature space. Second, the parameters of the first layer can be optimized for underlying classification task. The SVM classifier generates relatively lower classification accuracies. This is because SVM merely computes global matching scores using Euclidean distance between training and test samples. This global matching is very sensitive to variations in asymmetric dimensions of the subjects belonging to different population. Similarly, the poor performance of the kNN classifier can be attributed to its inherent limitation of generating classification errors on a small subset of discriminative features [35]. Facial anthropometric based gender and race classification accuracies outperform state-of-the-art Face++ API [21]. The better performance can be attributed to fact that different population has different bilateral facial asymmetry. Thus, gender and ethnicity-specific dimensions result into better classification performance.
- The generalization ability of the proposed method was evaluated using cross-database testing of the FERET on the MORPH dataset. As expected, cross-database testing accuracies are lower than intra-database testing. As shown in Table 6 and Table 7, the gender and ethnicity classification accuracies are still comparable to intra-database testing. This shows the generalization ability of the proposed method in classifying face images across gender and ethnicity.
- The results presented in Table 6 show that the classification accuracies for male subjects are slightly higher than the female subjects. This is because male faces are more asymmetric than female faces. This is in line facial asymmetry evaluation presented in Section 3. Similarly, from results presented in Table 7 show the highest classification accuracies for the subjects belonging to other ethnic groups, followed by African, Asian, Hispanic and Europeans. This is because faces of the subjects from other ethnicities are more asymmetrical than the rest of the groups. The ethnicity classification results are also in line with our asymmetry evaluation results presented in Section 3.
5. Conclusions
This paper has highlighted the impact of gender and ethnicity on asymmetric anthropometric dimensions. The statistical results suggest that there are significant differences in asymmetric facial dimension between male and female subjects. We noted similar trends among the subjects belonging to five distinct ethnicities, including European, Asian, African, Hispanic and others. The study suggests that (i) facial asymmetry varies with gender and race; (ii) the proposed linear regression model is a reliable method to detect gender and ethnicity-specific asymmetric dimensions; and (iii) both the gender and ethnicity affects the asymmetric facial dimensions significantly. Taken together, our findings compare well with post-hoc Tukey test outcomes, both for the MORPH and FERET datasets; (iv) the anthropometric asymmetric facial dimensions can be effectively used to classify face images belonging to different population. We observed that a neural network classifier trained from scratch for gender and race classification task can outperform the traditional classifiers, such as SVM and kNN. Finally, we observed that a neural network classifier trained from scratch for gender and race classification task can outperform the traditional classifiers, such as SVM and kNN.
We believe that these findings could be important to certain applications like the design and manufacture of RPE, as well as computer-aided techniques for planning plastic surgery. The future research directions may include the analysis of age-wise impact of gender and ethnicity on facial asymmetric dimensions.
Author Contributions
M.S. conceived the idea and performed the experiments. S.M. took part in writing the manuscript along with Figures and Tables. T.S. gave some useful insights to review and finalize the overall structure of the manuscript. I.R., M.I., M.J.A.B. and S.B. took part in revising the manuscript.
Funding
This research received no external funding.
Acknowledgments
The authors gratefully acknowledge the public availability of MORPH and FERET datasets used in this study.
Conflicts of Interest
The authors declare no conflict of interest.
References
- Ercan, S.T.; Ozdemir, I.; Etoz, A.; Sigirli, D.; Tubbs, R.S.; Lukas, M.; Guney, I. Facial asymmetry in young healthy subjects evaluated by statistical shape analysis. J. Anat. 2008, 213, 663–669. [Google Scholar] [CrossRef] [PubMed] [Green Version]
- Cheong, Y.W.; Lo, L.J. Facial asymmetry: Etiology, evaluation and management. Chang Gung Med. J. 2011, 34, 341–351. [Google Scholar] [PubMed]
- Little, A.C.; Jones, B.C.; Waitt, C.; Tiddem, B.P.; Feinberg, D.R.; Perrett, D.I.; Apicella, C.L.; Marlowe, F.W. Symmetry is related to sexual dimorphism in faces: Data across culture and species. PLoS ONE 2008, 3, e2106. [Google Scholar] [CrossRef] [PubMed] [Green Version]
- Steven, W.; Randy, T. Facial masculinity and fluctuatinga symmetry. Evol. Hum. Behav. 2003, 24, 231–241. [Google Scholar]
- Morrison, C.S.; Phillips, B.Z.; Chang, J.T.; Sullivan, S.R. The Relationship between Age and Facial Asymmetry. Available online: http://meeting.nesps.org/2011/ 80.cgi (accessed on 28 April 2017).
- Sajid, M.; Taj, I.A.; Bajwa, U.I.; Ratyal, N.I. The role of facial asymmetry in recognizing age-separated face images. Comput. Electr. Eng. 2016, 54, 255–270. [Google Scholar] [CrossRef]
- Sajid, M.; Taj, I.A.; Bajwa, U.I.; Ratyal, N.I. Facial asymmetry-based age group estimation: Role in recognizing age-separated face images. J. Forensic Sci. 2018. [Google Scholar] [CrossRef] [PubMed]
- Sajid, M.; Shafique, T.; Manzoor, S.; Iqbal, F.; Talal, H.; Qureshi, U.S.; Riaz, I. Demographic-assisted age-invariant face recognition and retrieval. Symmetry 2018, 10, 5. [Google Scholar] [CrossRef]
- Health and Safety Executive. 2013. Available online: https://www.hse.gov.uk/pubns/priced/hsg53.pdf (accessed on 2 June 2018).
- Laurentini, A.; de Simone, M.; Bottino, A. A Computer-Aided Technique for Planning Plastic Surgery Based on 3D Face Scans: Preliminary Results. In Proceedings of the International Conference on 3D Body Scanning Technologies, Lugano, Switzerland, 19–20 October 2010. [Google Scholar]
- Thiesen, G.; Gribel, B.F.; Freitas, M.P.M. Facial asymmetry: A current review. Dent. Press J. Orthod. 2015, 20, 110–125. [Google Scholar] [CrossRef] [PubMed]
- Roberge, R.; Zhuang, Z.; Stein, L. Association of body mass index with facial dimensions for defining respirator fit test panels. J. Int. Soc. Respir. Prot. 2006, 23, 44–52. [Google Scholar]
- Sforza, C.; Laino, A.; Grandi, G.; Pisoni, L.; Ferrario, V.F. Three-dimensional facial asymmetry in attractive and normal people from childhood to young adulthood. Symmetry 2010, 2, 1925–1944. [Google Scholar] [CrossRef]
- Milutinovic, J.; Zelic, K.; Nedeljkovic, N. Evaluation of facial beauty using anthropometric proportions. Sci. World J. 2014, 2014, 428250. [Google Scholar] [CrossRef] [PubMed]
- Kim, S.Y.; Bayome, M.; Park, J.H.; Kook, Y.A.; Kang, J.H.; Kim, K.H.; Moon, H.B. Evaluation of the facial dimensions of young adult women with a preferred facial appearance. Korean J. Orthod. 2015, 45, 253–260. [Google Scholar] [CrossRef] [PubMed]
- Zhuang, Z.; Landsittel, D.; Benson, S.; Robege, R.; Shaffer, R. Facial anthropometric differences among gender, ethnicity, and age groups. Ann. Occup. Hyg. 2010, 54, 391–402. [Google Scholar] [PubMed]
- Ricanek, K.; Tesafaye, T. MORPH: A longitudinal Image Database of Normal Adult Age-Progression. In Proceedings of the FGR (FGR06), Southampton, UK, 10–12 April 2006. [Google Scholar]
- FERET Database. Available online: https://www.itl.nist.gov/iad/humanid/feret (accessed on 15 September 2014).
- Han, H.; Otto, C.; Liu, X.; Jain, A.K. Demographic estimation from face images: Human vs. machine performance. IEEE Trans. Pattern Anal. Mach. Intell. 2014, 37, 1148–1161. [Google Scholar] [CrossRef] [PubMed]
- Xiong, X.; la Torre, F.D. Supervised Descent Method and Its Applications to Face Alignment. In Proceedings of the IEEE Conference on Computer Vision and Pattern Recognition, Portland, OR, USA, 23–28 June 2013. [Google Scholar]
- Megvii Inc., Face++ Toolkit. Available online: https://www.facepluplus.com (accessed on 3 January 2017).
- Rakover, S.; Teucher, B. Facial inversion effects: Parts and whole relationship. Percept. Psychophys. 1997, 59, 752–761. [Google Scholar] [CrossRef] [PubMed] [Green Version]
- Cootes, F.; Edwards, G.J.; Taylor, C.J. Active appearance models. IEEE Trans. Pattern Anal. Mach. Intell. 2001, 23, 681–685. [Google Scholar] [CrossRef] [Green Version]
- NIH Image/ImageJ. Available online: https://imagej.nih.gov/ij/ (accessed on 2 June 2018).
- Sergios, T.; Konstantinos, K. Pattern Recognition; Elsvier Inc.: Orlando, FL, USA, 2009. [Google Scholar]
- Vig, P.S.; Hewitt, A.B. Asymmetry of the human facial skeleton. Angle Orthod. 1975, 45, 125–129. [Google Scholar] [PubMed]
- Machado, C.E.P.; Flores, M.R.P.; Lima, L.N.C.; Tinoco, R.L.R.; Franco, A.; Bezerra, A.C.B.; Evison, M.P.; Guimaraes, M.A. A new approach for the analysis of facial growth and age estimation: Iris ratio. PLoS ONE 2017, 12, e0180330. [Google Scholar] [CrossRef] [PubMed]
- Khamnei, S.; Zamanlu, M.; Khamnei, S.; Zamanlu, M.; SalariLak, S.; Houshyar, Y.; Salekzamani, Y. Mastication patterns in humans: Gender differences. Neurophysiology 2016, 48, 375–379. [Google Scholar] [CrossRef]
- Beckerleg, S. Khat chewing as a new Ugandan leisure activity. J. East. Afr. Stud. 2009, 3, 42–54. [Google Scholar] [CrossRef]
- Dantcheva, A.; Chen, C.; Ross, A. Can Facial Cosmetics Affect the Matching Accuracy of Face Recognition Systems? In Proceedings of the 5th IEEE International Conference on Biometrics: Theory, Applications and Systems, Arlington, VA, USA, 23–27 September 2012. [Google Scholar]
- Alashkar, T.; Jiang, S.; Fu, Y. Rule-Based Facial Makeup Recommendation System. In Proceedings of the IEEE International Conference on Automatic Face & Gesture Recognition, Washington, DC, USA, 30 May–3 June 2017. [Google Scholar]
- Gao, Y.; Niddam, J.; Noel, W.; Hersant, B.; Meningaud, J.B. Comparison of aesthetic facial criteria between Caucasian and East Asian female populations: An esthetic surgeon’s perspective. Asian J. Surg. 2018, 41, 4–11. [Google Scholar] [CrossRef] [PubMed]
- Krizhevsky, A.; Sutskever, I.; Hinton, G.E. Imagenet classification with deep convolutional neural networks. Adv. Neural Inf. Process. Syst. 2012, 1, 1097–1105. [Google Scholar] [CrossRef]
- Chang, C.C.; Lin, C.J. LIBSVM: A library for support vector machines. ACM Trans. Intell. Syst. Technol. 2011, 2, 1–27. [Google Scholar] [CrossRef]
- Guo, G.; Jain, A.K.; W, M.; Zhang, H. Learning similarity measure for natural image retrieval with relevance feedback. IEEE Trans. Neural Net. 2002, 13, 811–820. [Google Scholar] [Green Version]
Figure 1.
Proposed methodology.

Figure 2.
Example face images from MORPH (top row) and FERET (bottom row).

Figure 3.
Example preprocessed face images from MORPH (top row) and FERET (bottom row).

Figure 4.
Graphic representation of the selected bilateral facial dimensions.

Figure 5.
Box plots showing the mean of asymmetric measurements using the selected method for the (a) MORPH, (b) FERET dataset.
Figure 5.
Box plots showing the mean of asymmetric measurements using the selected method for the (a) MORPH, (b) FERET dataset.

Figure 6.
Box plots showing the mean of asymmetric measurements using AAM with ImagJ for the (a) MORPH, (b) FERET dataset.
Figure 6.
Box plots showing the mean of asymmetric measurements using AAM with ImagJ for the (a) MORPH, (b) FERET dataset.

Figure 7.
Box plots showing the standard deviation of asymmetric measurements using the selected method for the (a) MORPH, (b) FERET dataset.
Figure 7.
Box plots showing the standard deviation of asymmetric measurements using the selected method for the (a) MORPH, (b) FERET dataset.

Figure 8.
Box plots showing the standard deviation of asymmetric measurements using AAM with ImagJ for the (a) MORPH, (b) FERET dataset.
Figure 8.
Box plots showing the standard deviation of asymmetric measurements using AAM with ImagJ for the (a) MORPH, (b) FERET dataset.

Figure 9.
Variation in mean values of asymmetric dimensions of male and female subjects from the (a) MORPH, (b) FERET dataset.
Figure 9.
Variation in mean values of asymmetric dimensions of male and female subjects from the (a) MORPH, (b) FERET dataset.

Figure 10.
Variation in mean values of asymmetric dimensions of subjects belonging to different ethnic groups from the (a) MORPH, (b) FERET dataset.
Figure 10.
Variation in mean values of asymmetric dimensions of subjects belonging to different ethnic groups from the (a) MORPH, (b) FERET dataset.


Figure 11.
Collinearity analysis for gender-adjusted asymmetric dimensions against base line dimensions for the (a) MORPH, and (b) FERET dataset.
Figure 11.
Collinearity analysis for gender-adjusted asymmetric dimensions against base line dimensions for the (a) MORPH, and (b) FERET dataset.

Figure 12.
Collinearity analysis for ethnicity adjusted asymmetric dimensions (African) against base-line dimensions for the (a) MORPH, and (b) FERET dataset.
Figure 12.
Collinearity analysis for ethnicity adjusted asymmetric dimensions (African) against base-line dimensions for the (a) MORPH, and (b) FERET dataset.

Figure 13.
Collinearity analysis for ethnicity adjusted asymmetric dimensions (Asian) against base-line dimensions for the (a) MORPH, and (b) FERET dataset.
Figure 13.
Collinearity analysis for ethnicity adjusted asymmetric dimensions (Asian) against base-line dimensions for the (a) MORPH, and (b) FERET dataset.

Figure 14.
Collinearity analysis for ethnicity adjusted asymmetric dimensions (Hispanic) against base-line dimensions for the (a) MORPH, and (b) FERET dataset.
Figure 14.
Collinearity analysis for ethnicity adjusted asymmetric dimensions (Hispanic) against base-line dimensions for the (a) MORPH, and (b) FERET dataset.

Figure 15.
Collinearity analysis for ethnicity adjusted asymmetric dimensions (Other ethnicities) against base-line dimensions for the (a) MORPH, and (b) FERET dataset.
Figure 15.
Collinearity analysis for ethnicity adjusted asymmetric dimensions (Other ethnicities) against base-line dimensions for the (a) MORPH, and (b) FERET dataset.

Figure 16.
Schematic of the neural network for classification task.


Table 1.
Distribution of subjects by gender and ethnicity from MORPH and FERET datasets.
| Ethnicity | European | African | Asian | Hispanic | Other | Total | |
|---|---|---|---|---|---|---|---|
| Male | MORPH | 1500 | 7000 | 30 | 300 | 8 | 8838 |
| FERET | 410 | 70 | 82 | 18 | 8 | 588 | |
| Female | MORPH | 490 | 1100 | 5 | 20 | 5 | 1620 |
| FERET | 310 | 51 | 61 | 5 | 5 | 432 | |
| Total | MORPH | 1990 | 8100 | 35 | 320 | 13 | 10,458 |
| FERET | 720 | 121 | 143 | 23 | 13 | 1020 | |
Table 2.
Regression coefficients for facial asymmetric measurements across gender and ethnic groups from the MORPH dataset.
Table 2.
Regression coefficients for facial asymmetric measurements across gender and ethnic groups from the MORPH dataset.
| Asymmetric Dimension | Base Line Average (SE) | Gender | Ethnic Groups | |||
|---|---|---|---|---|---|---|
| Female (SE) | African (SE) | Asian (SE) | Hispanic (SE) | Other (SE) | ||
| Average Change from Base Line | Average Change from Base Line to Each Ethnic Group Value | |||||
| D1 | 0.50 (0.9) | −1.25 (0.6) * | 1.75 (0.4) * | 2.25 (0.4) * | 3.75 (0.5) * | 2.00 (0.2) * |
| D2 | 0.25 (0.7) | 3.75 (0.5) * | 1.25 (0.6) * | −2.25 (0.6) * | 3.50 (0.4) * | 2.00 (0.4) * |
| D3 | 0.25 (0.8) | 3.50 (0.5) * | 2.00 (0.5) * | 2.00 (0.8) * | 4.00 (0.5) * | 2.00 (0.4) * |
| D4 | 0.25 (0.5) | 4.50 (0.6) * | 1.25 (0.3) * | 2.00 (0.8) * | 4.5 (0.7) * | 1.25 (0.2) * |
| D5 | 0.50 (1.0) | −2.00 (0.7) * | 2.00 (0.4) * | 0.25 (0.4) | 1.50 (0.6) * | 1.75 (0.5) ** |
| D6 | 0.50 (0.7) | −1.25 (0.5) * | 2.00 (0.2) * | 0.00 (0.1) | 2.00 (0.5) * | 1.25 (0.1) * |
| D7 | 0.75 (0.7) | 1.75 (0.3) * | 1.75 (0.5) * | 0.25 (0.1) | 2.00 (0.4) * | 3.75 (0.4) * |
| D8 | 0.75 (0.7) | 0.25 (0.5) | 1.25 (0.3) * | 2.25 (0.4) * | −1.00 (0.7) * | −0.75 (0.1) ** |
| D9 | 0.90 (0.6) | 0.00 (0.1) | 1.50 (0.4) * | 2.50 (0.7) ** | 2.50 (0.1) * | 1.00 (0.2) |
| D10 | 1.00 (0.7) | 0.00 (0.1) | 2.0 (0.5) ** | 2.00 (0.5) * | 2.00 (0.6) * | 3.50 (0.5) ** |
| D11 | 2.00 (0.8) | 1.25 (0.2) * | −1.25 (0.3) * | −2.50 (0.2) * | 1.25 (0.4) * | 3.25 (0.6) * |
| D12 | 2.50 (0.7) | −1.50 (0.4) ** | 1.00 (0.5) * | 2.00 (0.6) * | 2.00 (0.4) * | 2.00 (0.8) * |
| D13 | 4.00 (0.8) | 1.25 (0.5) * | 1.00 (0.2) * | 0.00 (0.4) * | 0.50 (0.1) | 2.00 (0.1) * |
| D14 | 4.25 (0.8) | 1.50 (0.4) * | 0.25 (0.5) | 4.25 (0.1) * | 0.00 (0.8) | 3.00 (0.1) * |
| D15 | 5.50 (0.7) | 1.25 (0.3) * | 0.00 (0.4) | 4.00 (0.4) * | 0.25 (0.4) | 4.25 (0.1) * |
| D16 | 4.50 (0.7) | −1.00 (0.2) | 0.00 (0.5) | 4.50 (0.2) * | 0.00 (0.3) | 3.75 (0.8) * |
| D17 | 2.25 (0.8) | −2.50 (0.4) * | 3.75 (0.1) * | 2.25 (0.8) * | 0.00 (0.4) | 4.75 (0.1) * |
| D18 | 2.50 (0.8) | −1.25 (0.4) * | 4.25 (0.4) * | 2.75 (0.7) * | −2.25 (0.2) * | 3.00 (0.9) * |
| D19 | 1.25 (0.6) | −1.25 (0.2) * | 3.75 (0.2) * | −2.00 (0.4) * | −2.25 (0.3) * | 3.25 (0.5) * |
| D20 | 1.00 (0.5) | 1.50 (0.3) * | 2.50 (0.4) * | 2.25 (0.7) * | −2.50 (0.5) * | −1.25 (0.2) * |
| D21 | 2.25 (0.4) | 1.50 (0.5) * | −2.50 (0.6) * | 2.00 (0.3) * | 2.00 (0.4) * | 1.55 (0.2) * |
| D22 | 2.00 (0.8) | −1.75 (0.4) * | 2.50 (1.0) * | −1.50 (0.2) | 1.75 (0.7) * | 1.25 (0.5) * |
| D23 | 2.50 (0.7) | 1.75 (0.1) * | 1.50 (2.0) * | −1.50 (0.6) | 2.00 (0.8) * | 2.00 (0.2) * |
| D24 | 1.00 (0.6) | 1.25 (0.2) * | −2.50 (0.1) * | 1.25 (0.4) * | 1.75 (0.5) * | 1.75 (0.3) * |
| D25 | 1.50 (0.5) | 1.50 (0.4) * | −2.00 (0.4) * | 2.20 (0.6) * | −1.50 (0.8) * | −1.25 (0.4) * |
| D26 | 2.00 (0.4) | −1.00 (0.4) * | 2.00 (0.5) * | −2.00 (0.7) * | −1.50 (0.6) * | 1.25 (0.7) * |
| D27 | 1.75 (0.4) | −1.00 (0.4) * | 2.00 (0.4) * | 1.50 (0.5) | 1.50 (0.7) * | 2.00 (0.8) |
| D28 | 1.25 (0.3) | 2.00 (0.6) * | −1.75 (0.4) * | 1.75 (0.7) * | −1.75 (0.4) * | −1.75 (0.8) |
Statistically significant differences (* p-value < 0.05; ** p-value < 0.02).
Table 3.
Regression coefficients for facial asymmetric measurements for gender and ethnic groups from the FERET dataset.
Table 3.
Regression coefficients for facial asymmetric measurements for gender and ethnic groups from the FERET dataset.
| Asymmetric Dimension | Base Line Average (SE) | Gender | Ethnic Groups | |||
|---|---|---|---|---|---|---|
| Female (SE) | African (SE) | Asian (SE) | Hispanic (SE) | Other (SE) | ||
| Average Change from Base Line | Average Change from Base Line to Each Ethnic Group Value | |||||
| D1 | 0.50 (0.7) | −1.25 (0.5) * | 1.50 (0.3) * | 2.00 (0.3) * | 4.50 (0.1) * | 2.00 (0.1) * |
| D2 | 0.50 (0.6) | −3.50 (0.6) * | 1.00 (0.5) * | −2.25 (0.6) * | 4.25 (0.3) * | 1.50 (0.5) * |
| D3 | 0.50 (0.6) | −4.00 (0.5) * | 2.25 (0.5) * | 2.00 (0.8) * | 3.50 (0.5) * | 2.25 (0.4) * |
| D4 | 1.00 (0.5) | −3.50 (0.6) * | 1.5 (0.5) * | 2.25 (0.8) * | 3.75 (0.7) * | 2.00 (0.2) * |
| D5 | 1.25 (1.0) | 1.00 (0.4) * | −1.50 (0.7) * | 0.00 (0.4) | 1.75 (056) * | 1.50 (0.5) ** |
| D6 | 1.00 (0.7) | −1.25 (0.5) * | −1.50 (0.2) * | 0.25 (0.2) | 2.00 (0.5) * | −2.00 (0.2) * |
| D7 | 1.75 (0.7) | −1.25 (0.4) * | 2.50 (0.5) * | 0.00 (0.2) | 2.25 (0.7) * | 3.50 (0.5) * |
| D8 | 1.25 (0.7) | 0.00 (0.4) | 1.50 (0.2) * | 2.25 (0.3) * | 1.50 (0.6) * | −1.50 (0.7) * |
| D9 | 1.00 (0.5) | 0.00 (0.3) | 1.50 (0.3) * | 2.00 (0.5) * | 1.75 (0.3) * | 2.00 (0.2) * |
| D10 | 1.25 (0.7) | 0.25 (0.2) | 2.0 (0.5) * | 2.25 (0.5) * | 1.50 (0.5) * | 3.25 (0.5) ** |
| D11 | 2.75 (0.8) | −1.25 (0.7) * | −1.25 (0.3) * | 1.50 (0.1) * | 1.50 (0.4) * | −3.25 (0.6) ** |
| D12 | 3.25 (0.7) | −1.75 (0.4) ** | 1.50 (0.5) * | −1.50 (0.5) * | 1.75 (0.5) * | −2.00 (0.6) * |
| D13 | 4.00 (0.8) | 2.00 (0.5) * | 1.50 (0.2) * | 2.50 (0.3) * | 0.50 (0.2) | 2.00 (0.1) * |
| D14 | 4.25 (0.8) | 2.00 (0.4) * | 0.50 (0.5) | 4.25 (0.2) * | 0.25 (0.1) | 2.75 (0.8) * |
| D15 | 6.00 (0.7) | 1.00 (0.3) * | 0.25 (0.2) | 3.75 (0.4) * | 0.25 (0.5) | 4.00 (0.6) * |
| D16 | 5.50 (0.5) | −2.00 (0.2) * | 0.00 (0.4) | 4.00 (0.2) * | 0.00 (0.3) | 3.50 (0.2) * |
| D17 | 2.75 (0.2) | −1.50 (0.5) * | 4.25 (0.1) * | 1.50 (0.7) * | 0.00 (0.4) | 4.00 (0.5) * |
| D18 | 2.00 (0.4) | −1.50 (0.5) * | 4.00 (0.4) * | −2.75 (0.6) * | 3.75 (0.5) * | 3.25 (0.8) * |
| D19 | 1.50 (0.6) | −1.50 (0.3) * | 3.50 (0.2) * | −1.25 (0.4) * | −2.50 (0.2) * | 4.00 (0.1) * |
| D20 | 1.25 (0.4) | 1.50 (0.3) ** | 2.25 (0.3) * | 2.50 (0.5) * | −2.50 (0.3) * | 1.25 (0.4) * |
| D21 | 2.00 (0.2) | −1.50 (0.5) * | −2.25 (0.5) * | 2.00 (0.4) * | 1.50 (0.4) * | 1.25 (0.2) * |
| D22 | 1.00 (0.4) | −1.75 (0.4) * | 2.00 (0.1) * | −1.25 (0.3) * | 2.00 (0.6) * | 1.50 (0.5) * |
| D23 | 2.25 (0.8) | 1.75 (0.2) * | 1.50 (0.3) * | −1.25 (0.6) | 2.00 (0.7) * | 2.25 (0.8) * |
| D24 | 1.25 (0..5) | 2.25 (0.2) * | −2.5 (0.2) * | 1.50 (0.3) * | 1.50 (0.4) * | −1.50 (0.7) * |
| D25 | 1.00 (0.5) | 1.25 (0.3) * | −2.00 (0.3) | 2.25 (0.6) * | 1.50 (0.7) * | −1.75 (0.4) * |
| D26 | 1.00 (0.4) | −1.50 (0.4) * | 1.75 (0.5) ** | −2.00 (0.8) * | 1.50 (0.6) * | 1.50 (0.5) * |
| D27 | 1.50 (0.2) | 1.50 (0.4) * | 1.50 (0.3) * | −1.25 (0.5) * | 1.50 (0.4) * | 1.25 (0.2) * |
| D28 | 2.00 (0.25) | 1.75 (0.6) * | 1.50 (0.2) * | 1.50 (0.7) * | 1.25(0.3) * | 1.50 (0.1) * |
Statistically significant differences (* p-value < 0.05; ** p-value < 0.02).
Table 4.
Post-hoc Tukey test outcomes for the MORPH dataset showing the statistically significant differences between baseline and adjusted dimensions for gender and ethnic groups.
Table 4.
Post-hoc Tukey test outcomes for the MORPH dataset showing the statistically significant differences between baseline and adjusted dimensions for gender and ethnic groups.
| Base Line Asymmetric Dimensions | Gender | Ethnic Groups | |||
|---|---|---|---|---|---|
| Female | African | Asian | Hispanic | Other | |
| Significance Level of Average Change from Base Line | Significance Level of Average Change from Base Line to Each Ethnic Group Value | ||||
| D1 | * | * | * | * | * |
| D2 | * | * | * | * | * |
| D3 | * | * | * | * | * |
| D4 | * | * | * | * | * |
| D5 | * | * | ǂ | * | * |
| D6 | * | * | ǂ | * | * |
| D7 | * | * | ǂ | * | * |
| D8 | * | * | * | * | * |
| D9 | ǂ | * | * | * | * |
| D10 | ǂ | * | * | * | * |
| D11 | ǂ | * | * | * | ** |
| D12 | ** | * | * | * | ** |
| D13 | * | * | * | ǂ | * |
| D14 | * | ǂ | * | ǂ | * |
| D15 | * | ǂ | * | ǂ | ǂ |
| D16 | * | ǂ | * | ǂ | ǂ |
| D17 | * | * | * | ǂ | ǂ |
| D18 | * | * | * | * | ǂ |
| D19 | * | * | * | * | ǂ |
| D20 | ** | * | * | * | * |
| D21 | * | * | * | * | * |
| D22 | * | * | * | * | * |
| D23 | * | * | * | * | * |
| D24 | * | * | * | * | * |
| D25 | * | * | * | * | * |
| D26 | * | ** | * | * | * |
| D27 | * | * | * | * | * |
| D28 | * | * | * | * | * |
Statistically significant differences (* p-value < 0.05, ** p-value < 0.02, ǂ p-value > 0.05).
Table 5.
Post-hoc Tukey test outcomes for the FERET dataset showing the statistically significant differences between baseline and adjusted dimensions for gender and ethnic groups.
Table 5.
Post-hoc Tukey test outcomes for the FERET dataset showing the statistically significant differences between baseline and adjusted dimensions for gender and ethnic groups.
| Base Line Asymmetric Dimensions | Gender | Ethnic Groups | |||
|---|---|---|---|---|---|
| Female | African | Asian | Hispanic | Other | |
| Significance Level of Average Change from Base Line | Significance Level of Average Change from Base Line to Each Ethnic Group Value | ||||
| D1 | * | * | * | * | * |
| D2 | * | * | * | * | * |
| D3 | * | * | * | * | * |
| D4 | * | * | * | * | * |
| D5 | * | * | ǂ | * | ** |
| D6 | * | * | ǂ | * | * |
| D7 | * | * | ǂ | * | * |
| D8 | * | * | * | * | * |
| D9 | ǂ | * | * | * | * |
| D10 | ǂ | * | * | * | * |
| D11 | ǂ | * | * | * | ** |
| D12 | ** | * | * | * | ** |
| D13 | * | * | * | ǂ | * |
| D14 | * | ǂ | * | ǂ | * |
| D15 | * | ǂ | * | ǂ | ǂ |
| D16 | * | ǂ | * | ǂ | ǂ |
| D17 | * | * | * | ǂ | ǂ |
| D18 | * | * | * | * | ǂ |
| D19 | * | * | * | * | ǂ |
| D20 | ** | * | * | * | * |
| D21 | * | * | * | * | * |
| D22 | * | * | * | * | * |
| D23 | * | * | * | * | * |
| D24 | * | * | * | * | * |
| D25 | * | * | * | * | * |
| D26 | * | ** | * | * | * |
| D27 | * | * | * | * | * |
| D28 | * | * | * | * | * |
Statistically significant differences (* p-value < 0.05, ** p-value < 0.02, ǂ p-value > 0.05).
Table 6.
Accuracy for gender classification task.
| Gender | Accuracy (%) | |||||||
|---|---|---|---|---|---|---|---|---|
| Neural Network | SVM [34] | kNN | Face++ [21] | |||||
| MORPH | FERET | MORPH | FERET | MORPH | FERET | MORPH | FERET | |
| Male | 83.97 | 82.50 | 80.00 | 79.26 | 78.84 | 78.00 | 78.00 | 77.26 |
| Female | 83.00 | 82.11 | 79.90 | 79.00 | 77.41 | 77.18 | 77.90 | 77.00 |
| Overall accuracy | 83.48 | 82.30 | 79.95 | 79.56 | 78.12 | 77.70 | 77.95 | 77.13 |
Table 7.
Accuracy for gender classification task.
| Ethnicity | Accuracy (%) | |||||||
|---|---|---|---|---|---|---|---|---|
| Neural Network | SVM [34] | kNN | Face++ [21] | |||||
| MORPH | FERET | MORPH | FERET | MORPH | FERET | MORPH | FERET | |
| European | 80.50 | 80.01 | 78.00 | 77.40 | 77.10 | 76.21 | 76.00 | 74.95 |
| African | 82.00 | 80.65 | 79.53 | 78.50 | 78.21 | 77.00 | 78.00 | 76.46 |
| Asian | 81.23 | 80.30 | 79.05 | 78.23 | 78.50 | 77.00 | 76.90 | 76.33 |
| Hispanic | 80.75 | 79.64 | 78.50 | 77.72 | 77.11 | 76.15 | 75.66 | 75.01 |
| Other | 83.51 | 83.00 | 80.60 | 77.78 | 78.50 | 77.20 | 79.25 | 78.18 |
| Overall accuracy | 81.59 | 80.72 | 79.13 | 78.92 | 77.88 | 76.71 | 77.16 | 76.18 |
© 2018 by the authors. Licensee MDPI, Basel, Switzerland. This article is an open access article distributed under the terms and conditions of the Creative Commons Attribution (CC BY) license (http://creativecommons.org/licenses/by/4.0/).
Share and Cite
MDPI and ACS Style
Sajid, M.; Shafique, T.; Riaz, I.; Imran, M.; Jabbar Aziz Baig, M.; Baig, S.; Manzoor, S. Facial Asymmetry-Based Anthropometric Differences between Gender and Ethnicity. Symmetry 2018, 10, 232. https://doi.org/10.3390/sym10070232
AMA Style
Sajid M, Shafique T, Riaz I, Imran M, Jabbar Aziz Baig M, Baig S, Manzoor S. Facial Asymmetry-Based Anthropometric Differences between Gender and Ethnicity. Symmetry. 2018; 10(7):232. https://doi.org/10.3390/sym10070232
Chicago/Turabian StyleSajid, Muhammad, Tamoor Shafique, Imran Riaz, Muhammad Imran, Mirza Jabbar Aziz Baig, Shahbaz Baig, and Sohaib Manzoor. 2018. "Facial Asymmetry-Based Anthropometric Differences between Gender and Ethnicity" Symmetry 10, no. 7: 232. https://doi.org/10.3390/sym10070232
Note that from the first issue of 2016, this journal uses article numbers instead of page numbers. See further details here.