Article

Ir-Ni Bimetallic OER Catalysts Prepared by Controlled Ni Electrodeposition on Irpoly and Ir(111)

1
The Electrochemical Energy, Catalysis and Materials Science Laboratory, Department of Chemistry, Technical University Berlin, Straße des 17. Juni 124, Berlin 10623, Germany
2
Fritz Haber Institute of the Max Planck Society, Department of Interface Science, Faradayweg 4-6, Berlin 14195, Germany
3
Max-Planck-Institut für Eisenforschung GmbH, Max-Planck-Strasse 1, Düsseldorf 40237, Germany
4
University of Wisconsin-Madison, 1415 Engineering Drive, Madison WI 53706, USA
5
Ertl Center for Electrochemistry and Catalysis, Gwangju Institute of Science and Technology, Gwangju 500-712, Korea
*
Author to whom correspondence should be addressed.
Surfaces 2018, 1(1), 165-186; https://doi.org/10.3390/surfaces1010013
Submission received: 26 November 2018 / Revised: 12 December 2018 / Accepted: 13 December 2018 / Published: 14 December 2018
(This article belongs to the Special Issue Electrochemical Surface Science: Basics and Applications)

Abstract

:
The alteration of electrocatalytic surfaces with adatoms lead to structural and electronic modifications promoting adsorption, desorption, and reactive processes. This study explores the potentiostatic electrodeposition process of Ni onto polycrystalline Ir (Irpoly) and assesses the electrocatalytic properties of the resulting bimetallic surfaces. The electrodeposition resulted in bimetallic Ni overlayer (OL) structures and in combination with controlled thermal post-deposition annealing in bimetallic near-surface alloys (NSA). The catalytic oxygen evolution reaction (OER) activity of these two different Ni-modified catalysts is assessed and compared to a pristine, unmodified Irpoly. An overlayer of Ni on Irpoly showed superior performance in both acidic and alkaline milieu. The reductive annealing of the OL produced a NSA of Ni, which demonstrated enhanced stability in an acidic environment. The remarkable activity and stability improvement of Ir by Ni modification makes both systems efficient electrocatalysts for water oxidation. The roughness factor of Irpoly is also reported. With the amount of deposited Ni determined by inductively coupled plasma mass spectrometry (ICP-MS) and a degree of coverage (monolayer) in the dependence of deposition potential is established. The density functional theory (DFT) assisted evaluation of H adsorption on Irpoly enables determination of the preferred Ni deposition sites on the three low-index surfaces (111), (110), and (100).

1. Introduction

Iridium is one of the most important electrode materials for basic surface science and industrial applications especially those in the field of electrochemistry due to its enhanced catalytic properties in water splitting electrolyzers [1,2]. The efficiency of electrolyzers and, thus, the catalytic properties are highly dependent on the interface between the electrode surface and the electrolyte. However, the main impediments to an effective application of water electrolysis as a sustainable method for hydrogen production are the high potential losses at the anode side and the high Ir material costs. In this context, studies on low index surfaces of single crystals offer a meaningful opportunity for a fundamental understanding and, based on it, the rational design of enhanced electrocatalytic materials. A wealth of information on structural and electronic effects can emerge from these studies particularly in the context of electrochemical deposition of metal adsorbates at a sub-monolayer coverage including underpotential deposition (UPD). Potential-controlled deposition results in the growth of a new two-dimensional phase, which is believed to have electronic properties that differ significantly from those of the respective bulk materials. In addition, the electronic structure of the substrate itself and, thus, the interfacial reactivity is altered by the metal adatoms [3,4]. The over-layer and near-surface alloy systems, therefore, offer a great variability in optimizing the binding energies to reaction intermediates and adsorption properties [5,6,7,8,9]. The deposition of metal adatoms on foreign metal substrates provides attractive systems with highly controllable surface coverages by using the electrode potential and deposition time. In particular, the resulting structure and surface properties of the new electrochemical materials are dependent on the variable surface coverage and, thereby, allow for a precise and reproducible control of the coverage-dependent properties. Due to its practical importance in surface chemistry and electrocatalysis, a number of ex situ and in situ techniques such as cyclic voltammetry (CV), scanning tunneling microscopy (STM), X-ray photoelectron spectroscopy (XPS), and low-energy electron diffraction (LEED) have been applied to augment the process of deposition at the molecular and atomic level [10].
In this study, the deposition of Ni on polycrystalline Ir and well-characterized Ir(111) electrodes in both sulfate-containing electrolytes and phosphate-buffered solutions will be presented employing experimental techniques. In situ cyclic current-potential curves are used to detect the redox potentials of the electroactive species or rather the potential range in which deposition takes place. Ex situ XPS data provides information on the chemical composition of the surface. In addition, a more quantitative trace metal analysis was performed with inductively coupled plasma-mass spectrometry (ICP-MS) to determine the adsorbed metal concentration based on high sensitivity and detection capability. Surface sensitive CO stripping measurements provide valuable insights into the morphological and structural composition of the deposit. Theoretically calculated hydrogen binding energies were taken into consideration. The Faraday charge efficiencies (FE) towards oxygen evolution of the modified electrodes were measured with differential electrochemical mass spectrometry (DEMS) and it was confirmed that the entire charge is transferred to facilitate the oxygen evolution reaction (OER).
In this case, a majority of the work has been carried out on polycrystalline Ir electrodes to study the multi-faceted Ni deposition process and to establish profound procedures and protocols for the precise control of surface coverage and structural composition. The intent is to present a broad overview and to provide detailed observations of the deposition process of Ni on Ir using not only electrochemical methods but also knowledge obtained from various surface sensitive techniques. The following studies and conclusions, therefore, present the first step in the electrodeposition of Ni layers on Ir electrodes and their electrochemical properties in the oxygen evolution reaction (OER). The results of this research expand the fundamental knowledge about the deposition process on polycrystalline Ir and show initial studies on Ir(111) single crystal electrodes under well-defined conditions of cleanliness thanks to a custom-made inductive and electrochemical crystal chamber [11].

2. Materials and Methods

2.1. Substrates

Ir(111) Single Crystal and Polycrystalline Ir (Irpoly)

Ir(111) single crystal electrodes with a diameter of 10 mm and a precision of orientation of ≤0.1° (MaTecK GmbH, Jülich, Germany) were applied as working electrodes for the study of surface modification. To mount the cylinder into the inductive and electrochemical setup in which the surface was refined thermally, two lateral holes with a diameter of 0.5 mm were machined into the shell surface through which loops made of Ir wire ( = 0.25 mm, 99.9%; Alfa Aesar, Germany) run. The detailed description of mounting can be found elsewhere [11]. A heating protocol consisting of several heating cycles per heating phase is applied until the determined electrochemical surface characterization is consistent with a perfectly clean and well-ordered (111) single-crystalline Ir surface [12].

2.2. Electrochemical Characterization

2.2.1. Ni Sweep Voltammetry

The electrodeposition of Ni on polycrystalline Ir was conducted in a standard rotating disk electrode (RDE) setup. Measurements on Ir(111) single crystals were performed in a custom-made setup [11].
Initially, the Ni electrodeposition was studied in 0.05 M H2SO4 (diluted from 95% H2SO4, Suprapure, Carl Roth, Germany) and in a phosphate buffer solution of pH 6.85 (0.1 M KH2PO4 and 0.1 M K2HPO4, 1:1 mixture by volume, Merck, Germany) using the cyclic voltammetry (CV) technique. The electrodes were transferred into the degassed solution containing 2 mM NiSO4. A voltammetric scan was then performed from the immersion potential of 1.0 VRHE for Irpoly and 0.8 VRHE for Ir(111) to the negative potential limit of 0.05 VRHE at a scan rate of 50 mV s−1. Under the same conditions, CVs of the electrodes were recorded in the absence of Ni2+ ions to locate the Ni adsorption-desorption region. These solutions contained 2 mM Na2SO4 to have the same anion concentration. To trace conductivity changes of the electrode, impedance spectroscopy was performed to determine the ohmic drop of the electrode. In both electrochemical measurements, the voltammetric scan ended at the positive potential limit to ensure the oxidation of all deposited Ni. All electrolytes were purged with either Ar (Ir(111) in the inductive setup) or N2 (Irpoly in the RDE) for at least 15 min to remove dissolved oxygen prior to use.

2.2.2. Controlled-Potential Technique

The potential range of Ni deposition on Irpoly in phosphate buffer was examined more thoroughly. A dependence of the deposited Ni amount on Irpoly as a function of deposition potential was established. The total metal content of the deposition process was determined at six potentials between 0.05 and 0.5 VRHE using ICP-MS. The given potential window was determined in the Ni sweep voltammetry experiments. The electrodes were immersed under a potential control at the deposition potential and the respective potential was held for a time of 10 min. Subsequently, the coverage of Ni was determined by ICP-MS after dissolving all Ni by immersing the electrode in 5 mL 0.1 M HNO3 for one hour. Beforehand, the electrodes were rinsed thoroughly with milli-q water.

2.2.3. Preparation of Ni Overlayers (OLs) and Ni (near-) Surface Alloys (NSAs)

To produce an overlayer of Ni (Ni/Ir OL), the electrode was immersed at the desired deposition potential (Edep) into a phosphate buffer solution of pH 6.85 (0.1 M KH2PO4, 0.1 M K2HPO4) containing 2 mM NiSO4 and held for 10 min. The Ni/Irpoly OL electrode catalyst for further electrochemical testing was produced at a deposition potential of 0.05 VRHE.
For the preparation of a Ni/Irpoly near surface alloy (NSA), the Ni/Irpoly OL electrode (Edep = 0.05 VRHE) was subsequently annealed for 1 min in 4% H2/Ar at 400 °C in a custom-made inductive setup [11]. The Ni-modified catalysts were then tested for OER activity in 0.1 M KOH and 0.05 M H2SO4.

2.2.4. Electrochemical OER Protocol at RDE

Two types of OER protocols were used to test the performance of unmodified and Ni-modified Irpoly electrodes at the RDE. First, the OER activities of Irpoly, Ni/Irpoly OL, and Ni/Irpoly NSA were tested in both 0.05 M H2SO4 and 01 M KOH. In a separate protocol, the stability of the Ni/Irpoly OL catalyst was subject to greater stress. The catalyst was first treated in 0.05 M H2SO4 before continuing the OER measurement in 0.1 M KOH. In between measurements, the electrode was rinsed thoroughly with milli-q water.
The electrolytes were prepared by dilution of 95% H2SO4 (Suprapure, Carl Roth, Germany) with ultrapure water. Purified Fe-free 0.1 M KOH was prepared according to the method reported by Trotochaud et al. [13].
For both procedures, the immersion of the electrodes at 1.00 VRHE was followed by 10 polarization curves into the potential region of OER at a scan rate of 5 mV s−1 from the immersion potential up until a current of 0.785 mA (current density of 1 mA cm−2) was reached. The measured currents are normalized to the geometric area of the electrodes to provide comparable current densities (jgeo). The geometric surface area of the electrodes is 0.785 cm2 corresponding to the diameter of 10 mm. After 10 consecutive cycles, electrochemical impedance spectroscopy (PEIS) was measured to obtain the ohmic resistance. The respective potentials are referred to as EiR.

2.2.5. CO Stripping Protocol

The CO stripping measurements were carried out in a rotating disk (RDE) electrode setup with a reversible hydrogen electrode (RHE) as a reference electrode and a Pt-mesh as a counter electrode. The measurements were recorded with a Bio-Logic SP-200 potentiostat (Bio-Logic, France). The CO stripping measurements were performed on an unmodified Irpoly and two Ni-modified Irpoly electrodes in purified Fe-free 0.1 M KOH (semiconductor grade, 99.99% trace metals basis, Merck, Germany). Ni/Irpoly OL and Ni/Irpoly NSA electrodes were prepared as described in Section 2.2.2.

2.3. Theoretical Characterization

Density Functional Theory (DFT) Calculated H-Ir Binding Energies

Theoretical H-Ir binding energies were calculated using the projector augmented wave (PAW) method [14,15] as implemented in the Vienna ab initio simulation package (VASP) [16,17]. Exchange-correlation energies were obtained by using the functional by Perdew, Burke, and Ernzerhof (PBE) [18]. A plane wave cutoff of 600 eV was used. Structure optimizations were performed until total energies were converged to 10−6 eV and forces acting on the relaxed ions were below 0.02 eV Å−1.
Surface models were obtained by cutting bulk iridium (lattice constant a = 3.877 Å) in (100), (110), and (111) orientation. The resulting slab models consist of five atomic layers separated by a 12 Å vacuum layer. The lowest two atomic layers are frozen to simulate the bulk. For Ir(100) and Ir(111), the Brillouin zone was sampled at 6 × 6 × 1 k points while 4 × 4 × 1 k points were used for the larger Ir(110) model.

2.4. Physicochemical Characterization

2.4.1. Inductively Coupled Plasma Mass Spectrometry (ICP-MS)

ICP-MS of the HNO3 aliquots taken to dissolve the electrodeposited nickel was measured with a NexION 300 X (PerkinElmer®, Shelton, CT, USA) equipped with a concentric PTFE Nebulizer-PFA-ST (PerkinElmer®, Shelton, CT, USA). and a spray chamber.

2.4.2. Atomic Force Microscopy (AFM)

The AFM images were done in a tapping mode using a Bruker MultiMode 8 microscope (Bruker, Berlin, Germany) on the samples after transport in Ar.

2.4.3. X-ray Photoelectron Spectroscopy (XPS)

The pristine and Ni-modified Ir(111) surfaces were analyzed by X-ray photoelectron spectroscopy in an ultra-high vacuum (UHV) setup equipped with Phoibos 150-MCD 9 hemispherical analyzer (SPECS GmbH, Berlin, Germany). A monochromatic Al Kα X-ray source ( h ν = 1486.5 eV) at 12 kV of anodic voltage and 300 W power was used to perform the characterization. For calibration of the binding energy, the C1s signal of graphitic-like carbon (285 eV) was used. For peak deconvolution, Gaussian-Lorentzian product functions and a Shirley background were applied in the Casa XPS software.

2.5. Mass Spectrometry

Differential Electrochemical Mass Spectrometry (DEMS)

Differential electrochemical mass spectrometry (DEMS) was acquired in a custom-made dual thin-layer electrochemical flow cell based on the concept reported elsewhere [19,20]. A Prisma quadrupole mass spectrometer (QMS 200, Pfeiffer-Vacuum, Germany) equipped with two turbomolecular pumps (HiPace 80, Pfeiffer, Germany) operating under 10−6 mbar were used to detect any volatile products. The instrument allows a continuous flow of the electrolyte of 10 µL s−1 through the hydrophobic membrane to the mass spectrum ion source. We used the hydrophobic PTFE membrane with a pore size of 30 nm and a thickness of 150 μm (Cobetter, Cat. No. PF-003HS) as the separation interface for the electrolyte and vacuum. A high mass transport rate is guaranteed due to the low volume of electrolyte flowing over the electrode surface as well a stable ionic current for the electrochemical process.
The electrochemistry was controlled using a BioLogic potentiostat, a leak-free Ag/AgCl as reference electrode (Warner Instruments, USA), and a Pt mesh as a counter electrode. Cyclic voltammograms in 0.1 M KOH and 0.05 M H2SO4 were recorded in a potential range of 0.6 and 1.6 VRHE (prior to iR-compensation) at a scan rate of 50 mV s−1. The flow cell setup was used for evaluating the faradaic charge efficiencies toward oxygen evolution for unmodified and Ni-modified polycrystalline Ir electrodes. The preparation of the Ni-modified electrodes is described above. In the first step, the ionic current baseline was recorded in a steady-state measurement to obtain a catalyst-specific calibration factor K*. A constant purge of N2 gas over the electrodes’ surface was done during integration of the electrode with the flow cell system. In addition, during DEMS experiments, the purge N2 was kept over the non-electrolyte contact areas of the electrode to ensure that the electrochemistry is running in an oxygen-free environment. DEMS measurements were monitorized with control product formation species with m/z values of 2, 16, 18, 28, 30, 36, 32, 34, 44 during the CV scan. The previously mentioned catalyst-specific calibration factor Kj* was applied for quantification of the faradaic efficiency (FE) of O2 (m/z 32). Chronopotentiometric steps were applied in the linear region of the ionic current baseline during the steady-state measurement protocol. In Equation (1), the relation between the mass spectrometric ion current (iMS,j) and the faradaic current (iF) to the volatile product j is given as:
K j * = i MS , j · z j i F .
In this case, zj is the number of transferred electrons per molecule of volatile product j. The division of the integrated mass spectrometric ion current (QMS,j) by the integrated capacitive current-corrected, faradaic current (QF) allows for the determination of the faradaic efficiency (FE) (charge selectivity) according to:
F E ( % ) = Q MS , j · z j Q F · K j * · 100 = Q F , j DEMS Q F · 100 .
In the analysis, only anodic faradaic currents are taken into account since solely the anodic processes of molecular oxygen evolution is of interest. The limits of integration were given by the detection signal of oxygen evolution (m/z 32) and the initial baseline level. For the different samples, the limits varied due to distinct onset potentials for oxygen evolution.

3. Results and Discussion

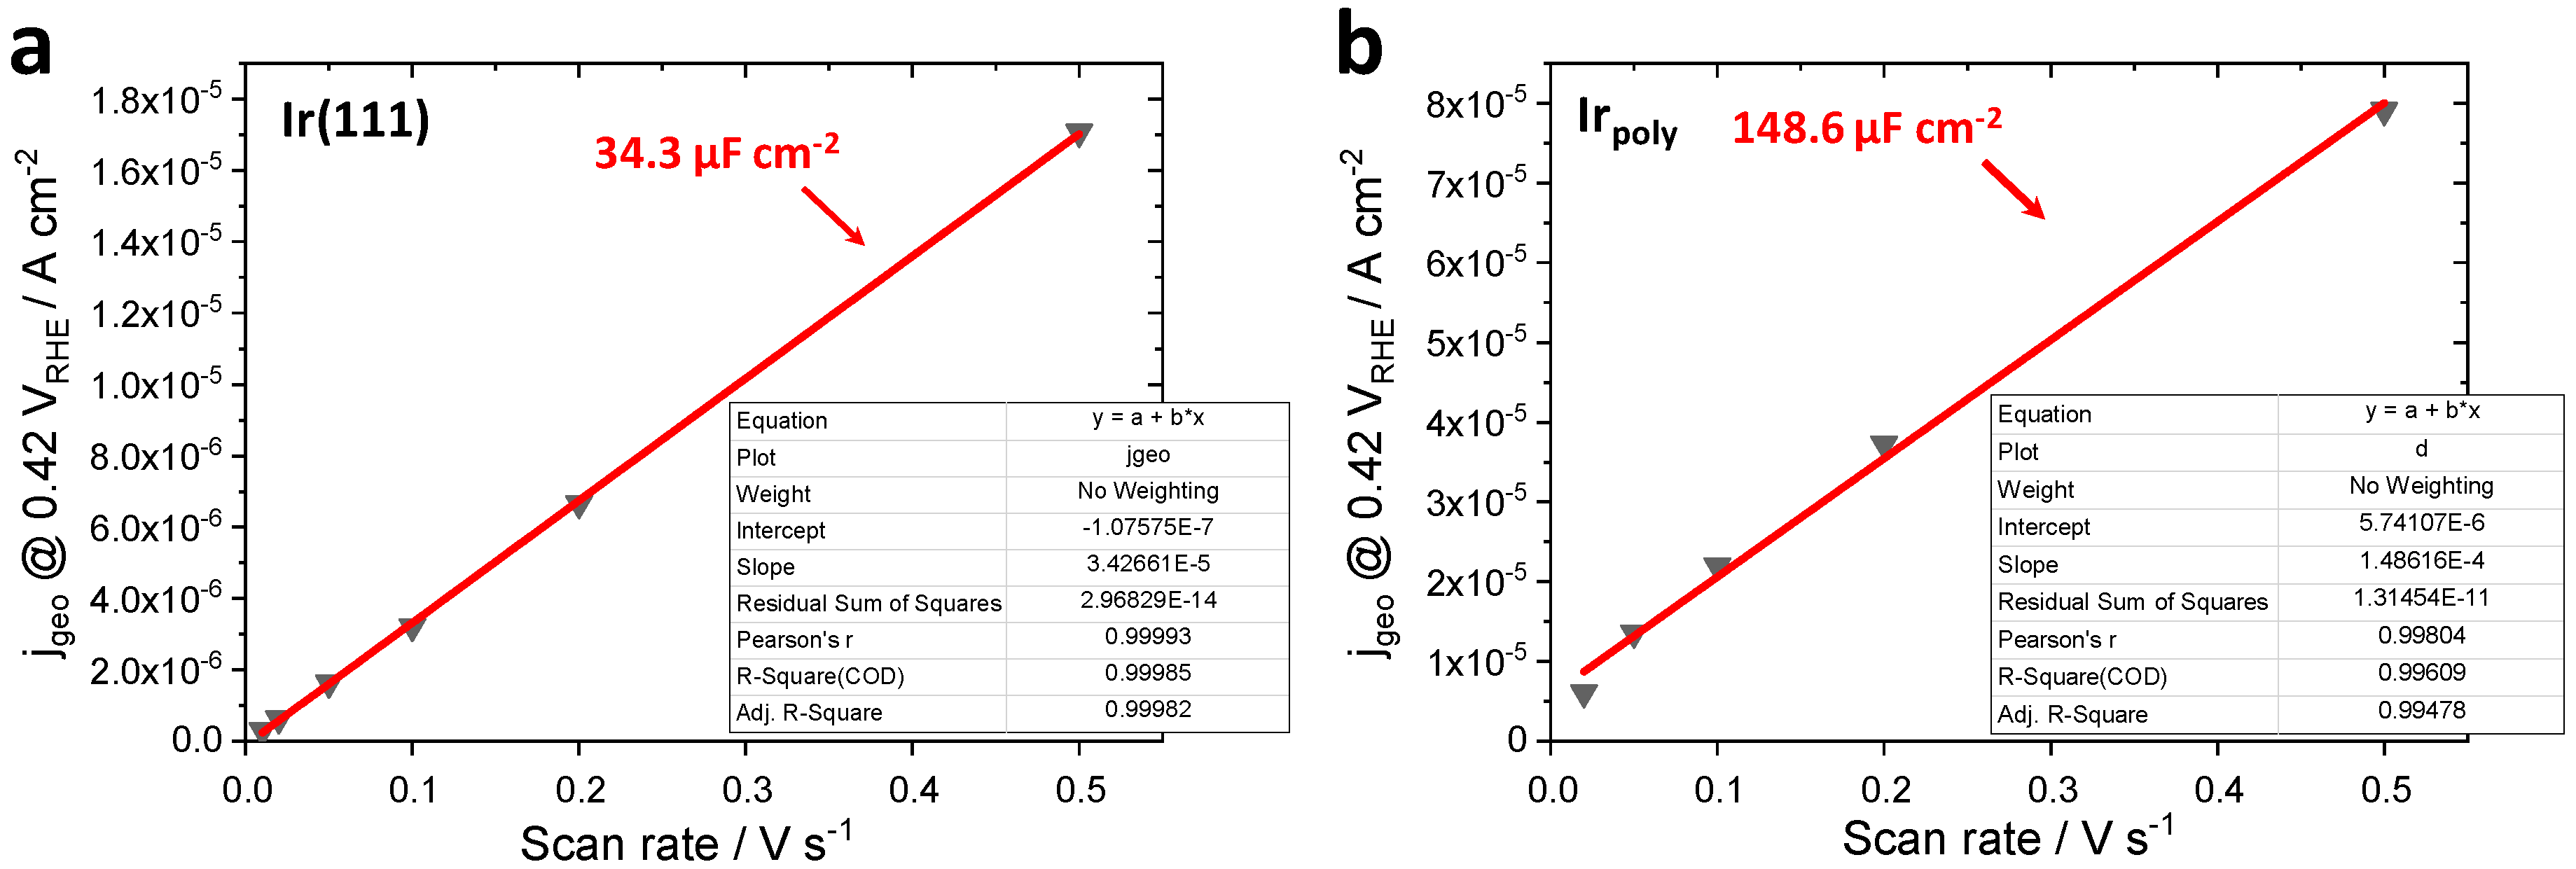
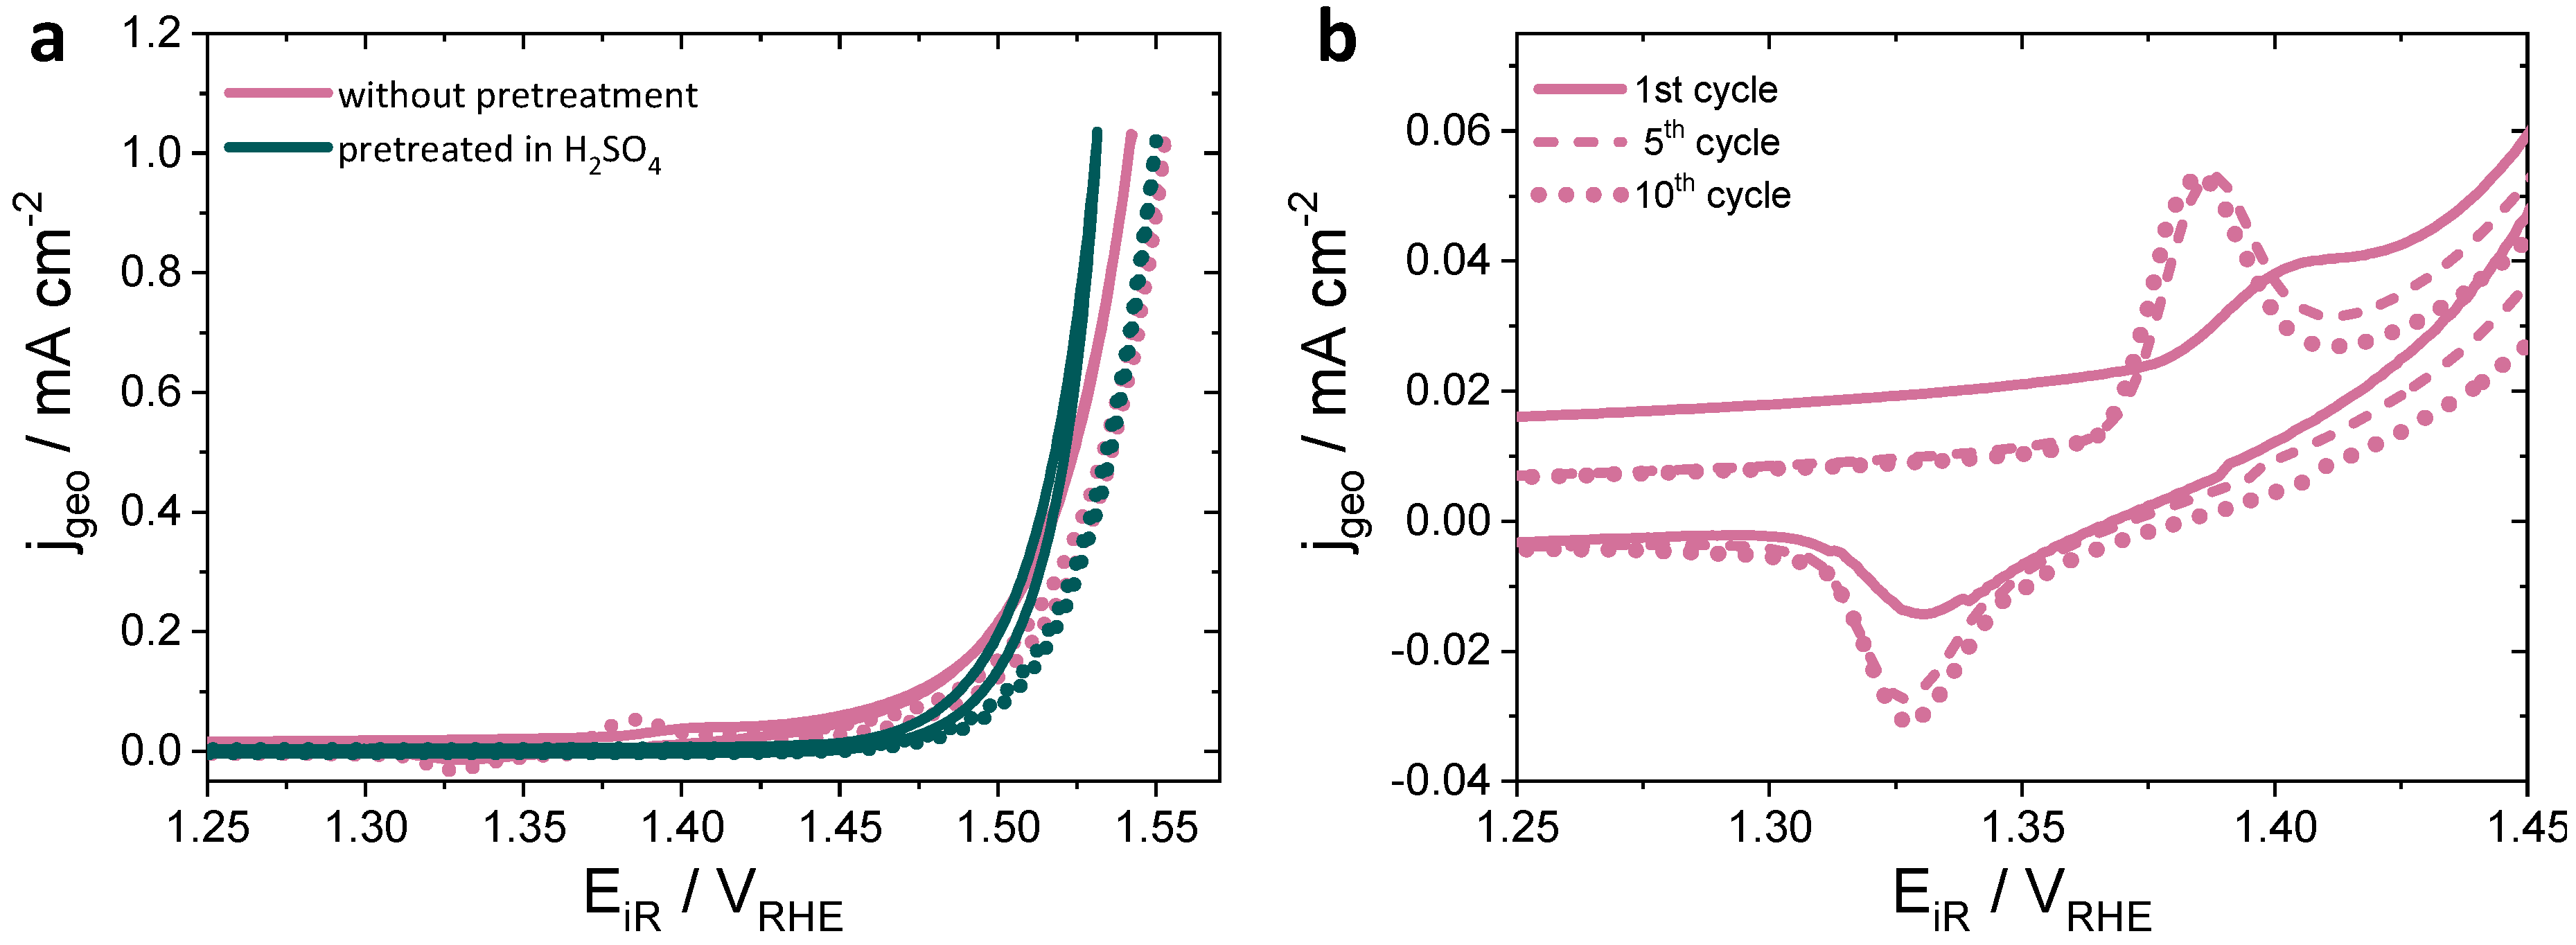
3.1. Roughness Factor (RF) of Irpoly

For the subsequent evaluation of the accurate amount of deposited Ni on Irpoly (which will be transferred into fractions of a single monolayer), the following calculations aim at determining the surface roughness of a polycrystalline Ir electrode. Equation (3) establishes a relationship between the double-layer charging capacitive current density jc and the double-layer capacitance Cdl (per geometric area) [21].
j c = ν · C dl .
For Irpoly, the potential window between 0.4 and 0.5 VRHE lacks any faradaic process (see Figure S1) and was, therefore, chosen to be the electrochemical double-layer capacitance. The roughness factor (RF) of Irpoly is then calculated from the double-layer capacitance according to the Equation (4) below.
R F = C dl C S .
CS in Equation (4) is the electrochemical double-layer capacitance of a smooth and planar electrode surface of the same material measured under the same conditions. These measurements have been conducted for a single crystal Ir(111) electrode. The double-layer capacitance measurements for Irpoly and Ir(111) are depicted in Figure 1. Given the slopes of both electrode surfaces, a roughness factor of 4.3 of the polycrystalline Ir electrode can be defined according to the following calculation.
R F = 148.6   μ F 34.3   μ F = 4.33 .
For calculating the mass of Ni needed to produce a monolayer on a polycrystalline Ir cylinder with a diameter of 10 mm, it is legitimate to assume that, on an Ir polycrystal, only a (111) face exists as the terraces of a polycrystal, which are presumed to consist of the three low-index surfaces (111), (110), and (100) nearly to the same extent.
In Table 1, the individual steps of our estimation are summarized. In the first step, the atoms per unit area are determined by dividing the number of Ir atoms per (111) face in the unit cell by the surface area of the (111) face. By using the Avogadro constant NA, the amount of substance per surface area is introduced. Given a geometric projected surface area of 0.785 cm2, the molar or atomic amount of Ni needed to form a complete monolayer is obtained. Analogously, the mass of Ni per monolayer can be obtained by introducing the molar mass of Ni (M = 58.68 g mol−1). With a given RF of 4.33, the estimated Ni amount to produce a monolayer on Irpoly is 0.52 µg.

3.2. Surface Chemical Characterization

Ni deposition was conducted and analyzed on polycrystalline Ir (Irpoly) and single-crystalline Ir(111) electrodes. The experiments with Irpoly have served to gain a better understanding of the deposition process and for determining the influence of adsorbed Ni on the surface and the resulting catalytic properties.

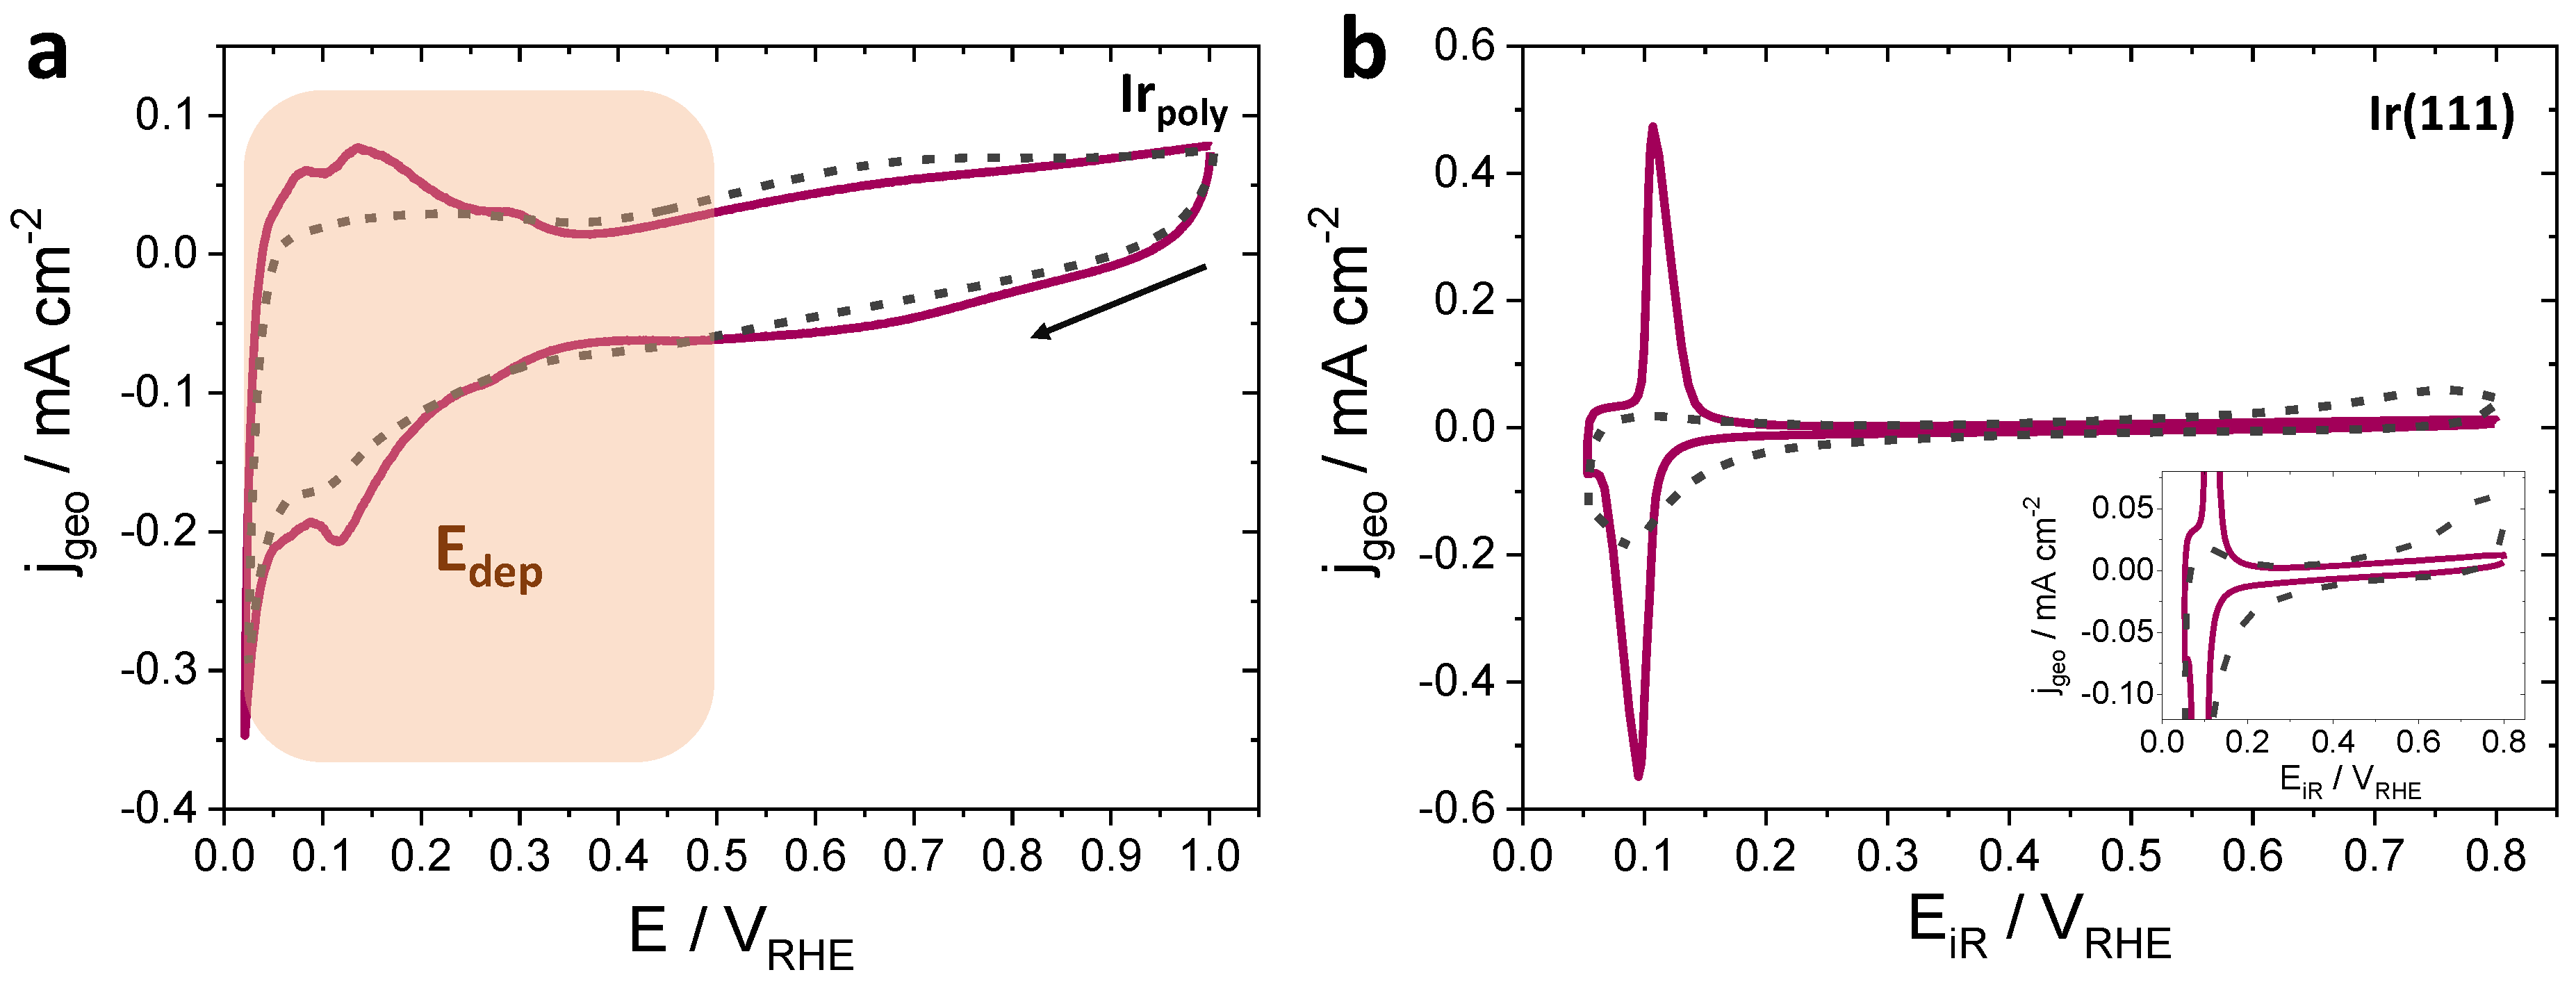
3.2.1. Ni Deposition on Irpoly and Ir(111) by Sweep Voltammetry

The Ni deposition process on a polycrystalline Ir electrode was first studied by using the cyclic voltammetry technique in order to determine the potential area in which Ni deposition occurs. Figure 2a depicts the cyclic voltammogram of a polished and electrochemically cleaned polycrystalline Ir cylinder in a phosphate buffer solution with and without 2 mM NiSO4. The solution without Ni2+ contains 2 mM Na2SO4 to guarantee the same concentration of anions in the electrolyte and to make the measurements comparable.
In the presence of Ni, the hydrogen adsorption-desorption region is reduced significantly, which suggests a blocking of Ir sites by Ni ad-atoms. By contrast, in the negative going sweep, there is only a slight distinction in the total electric charge between the cyclic voltammograms in the potential area of 0.5 to 0.0 VRHE, which implies that Ni electrodeposition on Ir is not recognizable as strongly defined deposition peaks. It cannot be determined with absolute certainty if oxygen desorption in the Ni-free solution (at ~+0.7 VRHE) is shifted toward lower potentials (at ~+0.65 VRHE) due to the so-called ligand effect [22], which is triggered by adsorbed Ni adatoms or if deposition of Ni occurs on distinct adsorption sites, which are merged into one broad redox wave. In the positive going sweep, desorption of Ni ad-atoms begins beyond the hydrogen underpotential deposition (HUPD) region and attains its maximum value at around +0.65 VRHE.
Figure 2b displays the cyclic voltammogram of a pristine Ir(111) single crystal electrode in phosphate buffer of pH 6.85 containing 2 mM NiSO4. A cyclic voltammogram of the same electrode in the absence of Ni is also shown for comparison. Both voltammograms were recorded in the potential window of 0.05–0.8 VRHE, which is a potential range adequate for a sufficient characterization of the Ir(111) surface [12]. The CV of Ir(111) in phosphate buffer without Ni is mostly featureless and only displays the HUPD redox peak at ~+0.1 VRHE. The significant difference between both voltammograms is located in the HUPD region. The characteristic HUPD peak of the (111) face is mostly masked in the presence of Ni. The voltammogram is presumably dominated by a broad deposition and stripping region of deposited Ni between 0.50–0.05 VRHE and 0.3–0.8 VRHE, respectively. The peak in the positive going sweep at ~+0.1 VRHE can either be ascribed to stripping off Ni or to a hydrogen desorption charge due to remaining hydrogen adsorption on Ir(111) sites or both. The latter case presupposes that not all Ir sites are being blocked by Ni adatoms during deposition. This might be a kinetically controlled problem if the deposition process by cyclic voltammetry requires some time to form a complete Ni layer. Free Ir sites may be explained by the deposition of Ni on existing Ni adatoms.
In the negative going sweep, the charge is found to be higher (≈375.9 µC cm−2) than the sum of the charges in the positive going sweep. From this observation, it seems that Ni deposition at a single crystalline Ir(111) is not entirely reversible, which means that Ni is not completely stripped off the surface in the anodic scan up to 0.8 VRHE.

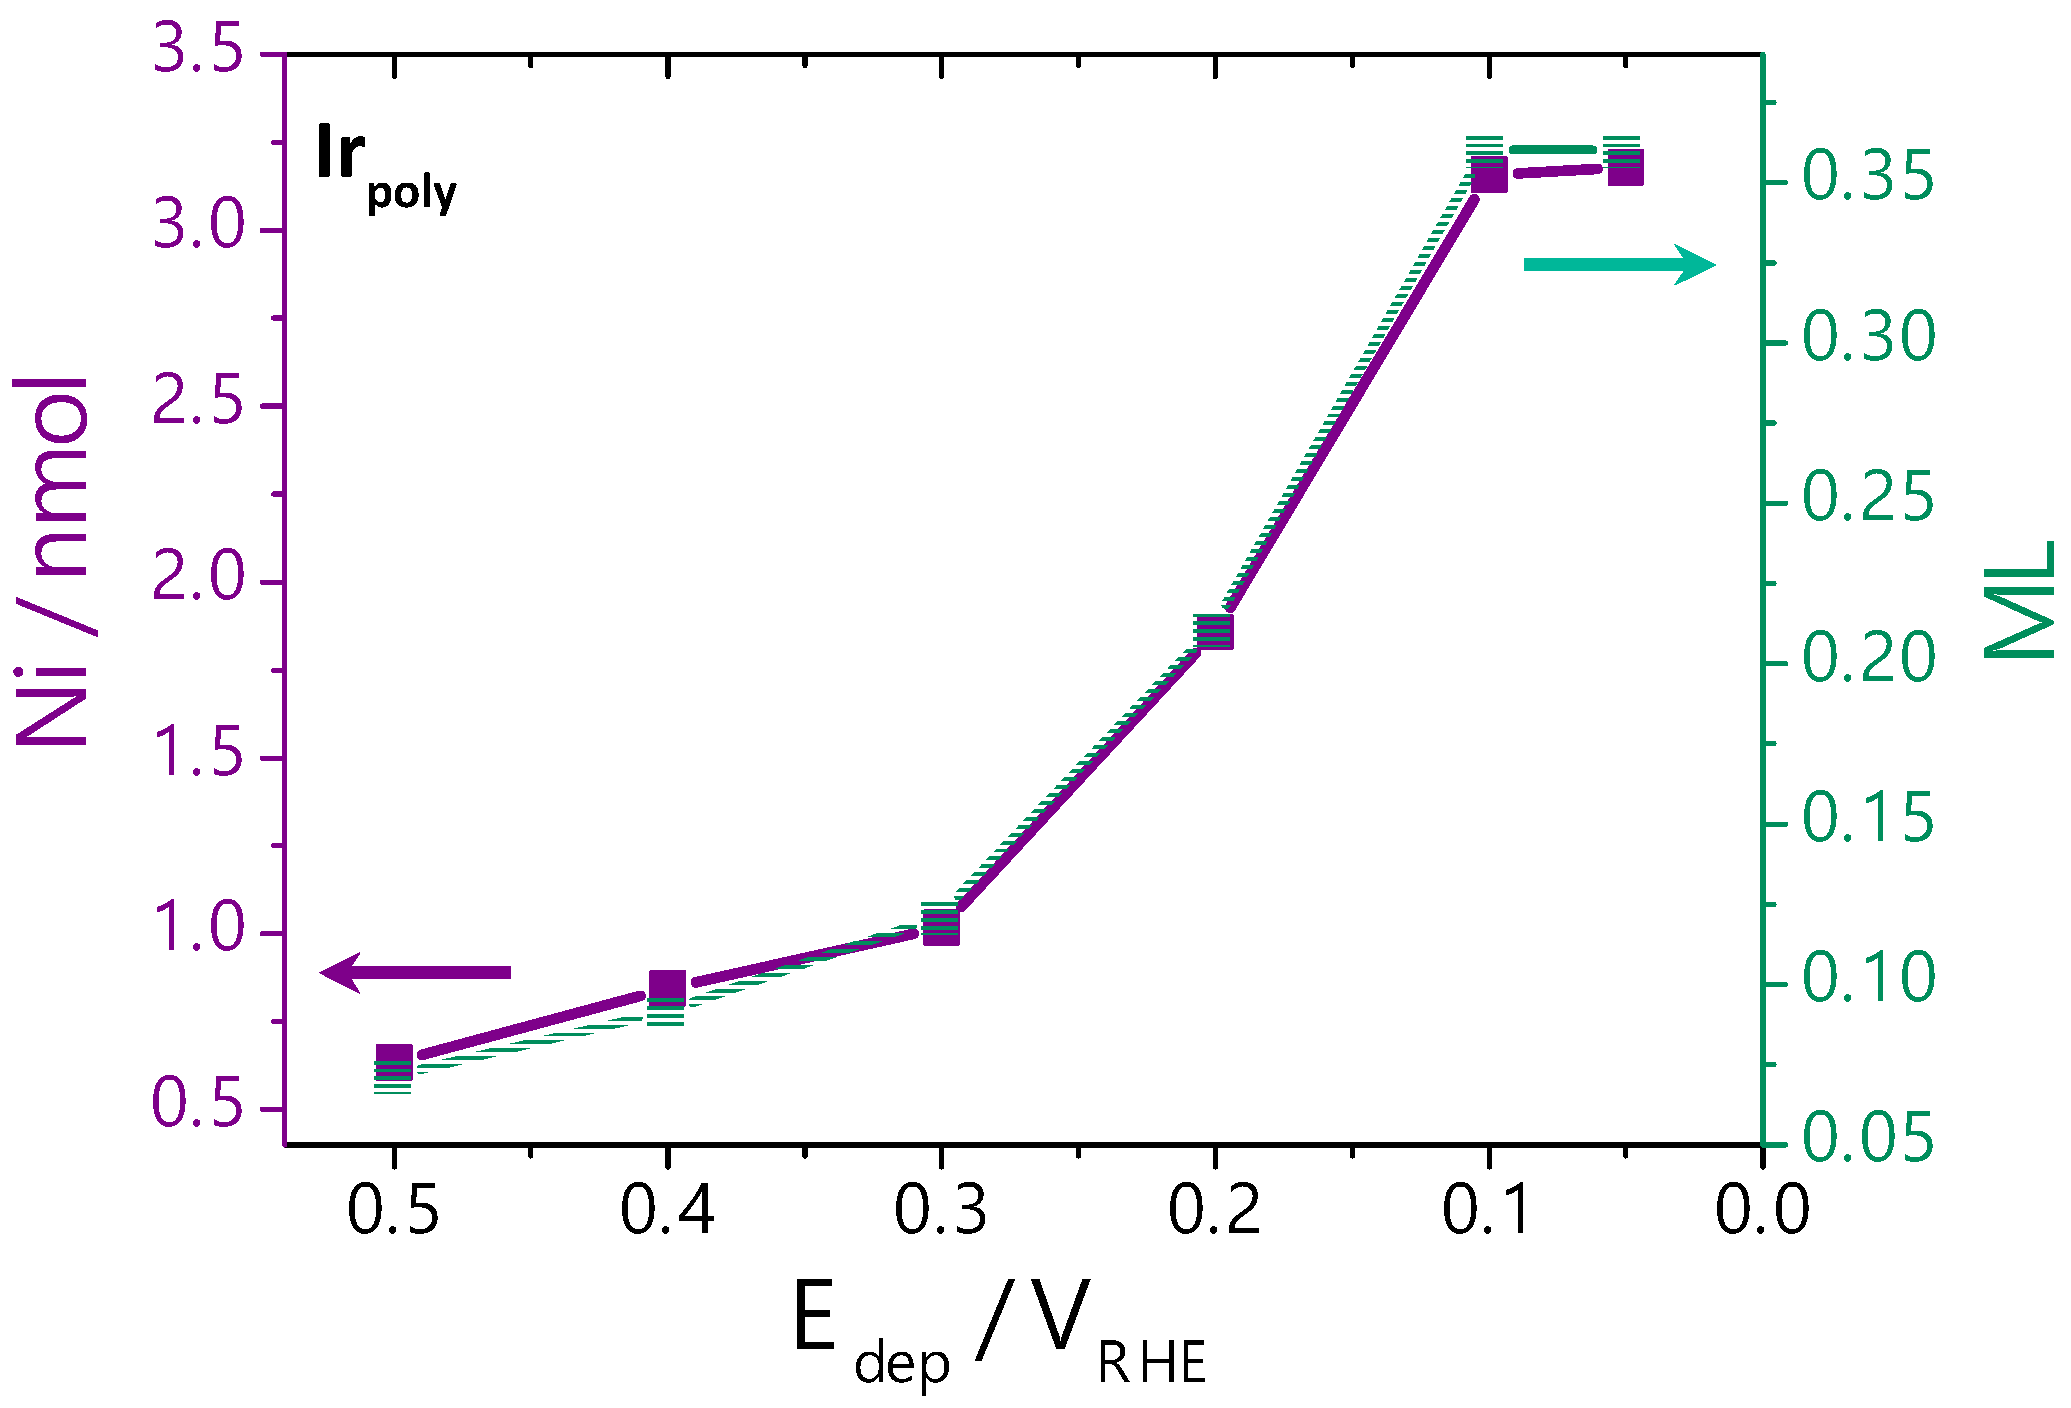
3.2.2. Ni Deposition on Irpoly by the Controlled-Potential Technique

The formation of a Ni layer is likely a process that requires some time since the cyclic voltammogram in Figure 2a does not display defined Ni redox peaks. Hence, the cycling technique may not be the most suitable approach. On this account, the potential range Edep in Figure 2a was used to establish a relationship between Ni coverage and the applied deposition potential (Edep). Therefore, the electrode was immersed at the desired potential under the potential control and the potential was held for 10 min. The deposited amount of Ni was determined chemically by ICP-MS. The process was conducted for six distinct deposition potentials. In Figure 3, the effect of the deposition potential Edep on the amount of adsorbed Ni is shown. The obtained values from ICP-MS and the resultant extent of Ni monolayer formation on polycrystalline Ir are presented in Table S1 As described earlier, the analyzed amount of Ni with ICP-MS was translated into a degree of coverage (ML) by assuming that (111) facets are prevalent on a polycrystalline Ir surface.
At first, a slight increase in Ni coverage and a decreasing deposition potential is observed. The linear rise becomes larger until the Ni amount approaches a limiting value at a potential of ≤+0.1 VRHE. Since the surface of a polycrystalline Ir electrode is not well-defined, the calculated values of Ni ML coverage provide approximate guidance for the relationship between absolute molar Ni amount and deposition potential. The assumption of a prevalent (111) facet on Irpoly is thereby the most severe assumption as a polycrystalline surface generally consists of a number of different types of facets. Some of these orientations may be less suitable or have less potential for Ni deposition. However, with an estimated average roughness factor of 4.33 for the polycrystalline Ir electrode, a maximum coverage of ~0.36 ML was obtained.

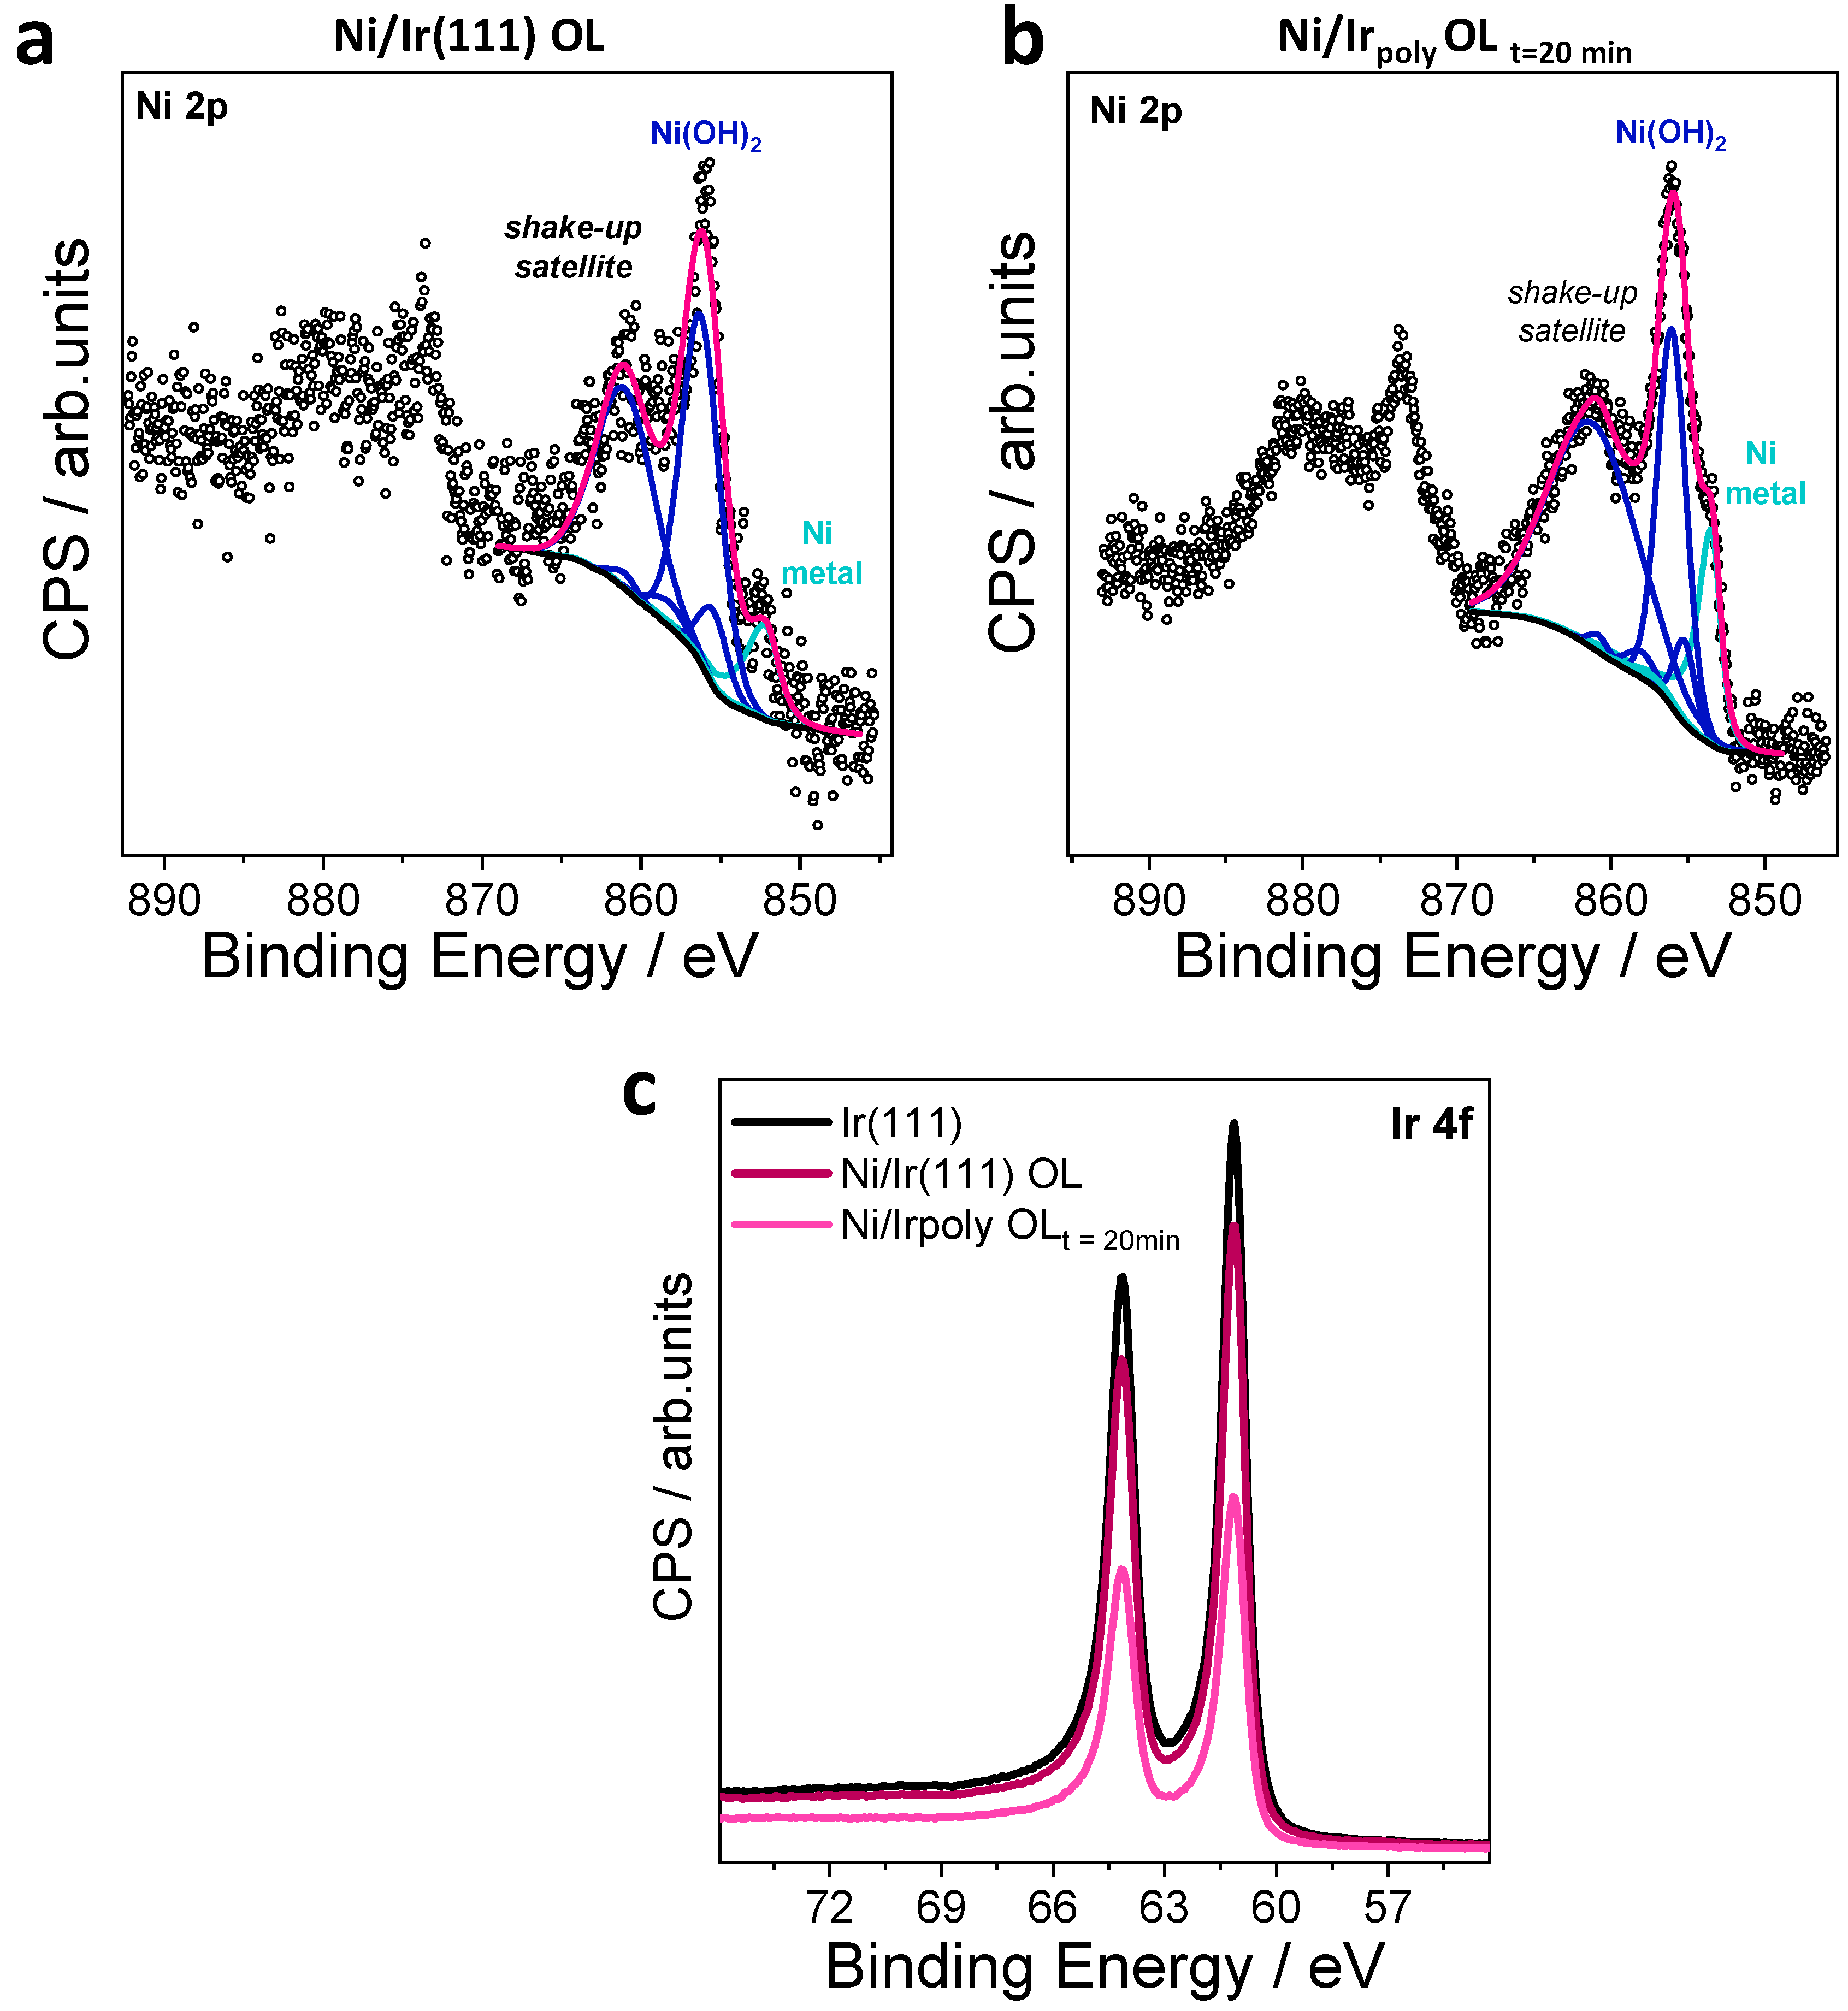
3.2.3. Surface Chemical State of Ni/Ir OL

The X-ray photoemission spectra of the Ni-modified single and polycrystalline Ir electrodes are presented in Figure 4.
The deposition was performed at a potential of 0.05 VRHE to form an over layer (OL). The Ni over layer on polycrystalline Ir (Ni/Irpoly OLt=20min) was formed by deposition for 20 min, which is twice as long as for the formation of an OL on Ir(111). For comparison, the XP core level spectra of the well-defined and unchanged Ir(111) single crystal are given in Figure S2. In this case, the survey spectrum over the entire energy range (Figure S2a, top view) is characterized by intense photoemission peaks distinctive for Ir and weak O1s and C1s lines. The high-resolution spectra in Figure S2b (4 panes) excludes the presence of Ni in the sample. During transfer of the single crystal into the UHV chamber and until vacuum conditions were reached, the sample was shortly exposed to a laboratory atmosphere. The detected carbon and oxygen signals can, therefore, be assigned to chemisorbed species during the loading process. After extended exposure time, a Ni-free near the surface region could be affirmed.
The binding energy and line shape of Ir(111) and Irpoly in the Ni-modified samples in Figure 4c are in accordance with the pure Ir spectrum. Thus, the deposition process does not affect the Ir state. This observation is, moreover, consistent with images of the topography of the Ni-modified Ir(111) surface analyzed by AFM. The AFM images and their respective height profiles are presented in Figure S3 with increasing magnifications from Figure S3a–c. The Ni/Ir(111) OL surface was found to exhibit well-resolved flat terraces vertically separated by ~1.53 Å tall steps, which is coherent with single or double atomic steps. The Ni 2p region of all prepared samples in Figure 4a,b indicate the prevalence of Ni2+ species with their main peaks at ~857 and 874 eV and their typical shake-up satellite peaks at ~863 and 880 eV. The intensity of the Ni lines increase for longer deposition times while the underlying Ir lines decrease in intensity (see Figure 4c), which implies higher Ni coverages. In Ni/Irpoly OLt=20min, the Ni content determined by XPS was three times greater than on the Ni-modified single crystalline Ir sample (Ni/Ir(111) OL). The bright spots in the AFM images correspond with very high probability to contamination by particles of dirt since these measurements have been performed in air.

3.3. Structure-Activity Correlations

3.3.1. Oxygen Evolution Reaction (OER) and Faraday Efficiencies (FE)

The electrochemical OER activity of Ni-modified Irpoly electrodes have been tested using the rotating disk electrode (RDE) technique in both acidic and alkaline environments. The respective OER polarization curves are depicted for the first cycle in Figure 5a,c and are compared to the pristine and unmodified Irpoly catalyst. The 10th OER cycle of the electrode materials is depicted (Figure S4a,b) to monitor the stability of the catalysts. The Ni/Irpoly NSA sample was formed by reductive annealing of Ni/Irpoly OL for 1 min and shows a very weak pronounced Ni(OH)2/NiOOH redox peak in 0.1 M KOH in the 10th cycle (see Figure S4b). The reductive treatment of the over layer for 2 min was sufficient to produce a near-surface alloy of Ni in the subsurface region [11]. Thus, a reduced time was chosen to design a surface in which Ni is both at the surface and in the subsurface of the catalyst.
As can be seen from Figure 5a,c, the geometric OER activity of the Irpoly reference catalyst was improved by the addition of Ni in the form of an over layer (OL) in both electrolyte systems. The superior catalytic performance of Ni/Irpoly OL in an acidic solution is not only displayed via the higher current density of the cyclic voltammogram (CV) curves but is also reflected by its lower Tafel slope at higher potentials of ~52 mV dec−1 (Figure 5b), which is significantly smaller than the slope of the unmodified (~70 mV dec−1) and NSA (~65 mV dec−1) electrocatalysts. Ni atoms in the subsurface layer (NSA) formed by the annealing of the OL do not seem to have an enhanced effect on the OER activity in acidic and alkaline media. In acidic solution, the OER performance of the NSA is almost identical to the unmodified Irpoly. These observations indicate that the performance of the modified material is strongly influenced by the relative position of the second component in the electrode material. In order to correlate the observed reactivity with the structure of the catalyst, the surface composition of a polycrystalline surface has to be considered in detail. Given the high roughness factor of the polycrystalline Ir surface (due to the grain boundaries), the Ni/Irpoly OL might have a similar surface structure to an Ir-Ni surface alloy in which Ni atoms are adjacent to Ir surface atoms. The result is an optimization of the binding energy towards critical reaction intermediates of the proposed oxygen evolution mechanism such as O, OH, and OOH.
In an alkaline environment, the mechanism of the OER has been proposed to occur via the following steps [23,24,25,26]: (M represents the catalytic active site).
M + OH M OH + e
M OH + OH M O + H 2 O + e
M O + OH M OOH + e
M OOH + OH M OO + H 2 O + e
M OO O 2 .
Annealing the OL system in a reductive atmosphere significantly reduces the amount of Ni adatoms at the surface. Since the characteristic Ni(OH)2/NiOOH redox peak can be recognized very weakly in the cyclic voltammogram of the 10th curve in 0.1 M KOH (see Figure 5c), Ni is still present at the surface albeit to a considerably smaller extent. The electronic effect of underlying Ni atoms on surface Ir atoms seems to have a slightly negative impact on the binding energy of reaction intermediates to Ir. However, the activity behavior of the three examined catalysts is somehow similar in KOH (see Figure 5c) whereby the pristine Irpoly is slightly more active than the NSA. The Tafel slopes of the electrocatalysts differ significantly in both examined electrolyte solutions. In acidic solution, the OL system exhibits the lowest slope followed by the NSA and the unmodified catalyst. Under alkaline conditions, the order of the Tafel slopes is as follows: NSA > Irpoly > OL. The analysis of the experimentally observed Tafel slopes is a powerful tool for determining the reaction steps that are rate-limiting at the reaction interface. It must be kept in mind that these parameters are greatly influenced by the concentration of the surface species formed during the reaction. In an acidic medium, the Tafel slopes of the catalysts differ far more than in alkaline milieu, which suggests a greater influence of Ni on the reaction mechanism. In 0.1 M KOH, the Tafel slopes lie in the range of ~60 mV dec−1. This predicts a slow chemical step to be rate-limiting [27]. The above presented reaction mechanism (6)–(10) proposes electron-transfer steps that determine the overall kinetics. However, the reaction step in Equation (7) can also be divided into an electron transfer process subsequent to a proton transfer step as:
M OH + OH M O + H 2 O
M O M O + e .
Thus, if the rate-determining step involves the purely chemical step in Equation (11), a Tafel slope of 60 mV dec−1 is predicted.
The electrode processes were also measured in a dual-thin layer flow cell setup in combination with differential electrochemical mass spectroscopy (DEMS). The respective Faraday efficiencies (FE) and faradaic current densities are given in Figure S5. In this case, the same order of activity performance was measured in the alkaline solution (OL > Irpoly > NSA). The superior OER performance of the Ni/Irpoly OL catalyst can be deduced to surface enrichment of Ir atoms promoting positive synergies between Ir and Ni atoms. The increase in activity with Ir-Ni binary systems has been observed in various studies in alkaline and acidic electrolytes [23,28,29,30]. The higher activity of Ni/Irpoly OL in acidic electrolyte may be assigned to an increase of surface OH groups initiated by leaching off Ni adatoms from the surface [23]. At these high potentials, partial oxidation of the catalyst surface cannot be precluded. The oxygen atoms, which were previously bound to Ni, will be protonated to become electroneutral. As OH is considered to act as a crucial intermediate in the oxygen evolution mechanism, a higher fraction of OH at the surface will have an advantageous effect on the reactivity.
As can be seen from Figure 5e, all Ni-modified catalyst systems display a higher OER reactivity in 0.1 M KOH compared to the acidic milieu, which might be partly attributed to the already higher activity of polycrystalline Ir in alkaline media when compared to the acidic substance. During repetitive cycling, the OER performance is declining for all catalysts in both systems (compare Figure S4a,b). In H2SO4, the OL system shows the highest drop in activity, which is most likely due to dissolution of Ni surface atoms. After 10 cycles into the potential regions of OER, the activities of the OL and NSA in an acidic solution approach each other, or in other words, the OL catalyst approaches the more stable NSA system. The relative position of Ni is critical for the stability of the catalyst material. The addition of Ni in the form of an over layer significantly enhances the electrocatalytic activity in comparison with an unmodified reference system. However, the stability of the Ni OL system is not given in acidic media. By contrast, Ni in the subsurface layer of Irpoly seems to positively affect the stability of the respective catalyst material since it shows the lowest drop in current density during the 10 cycles.
The OER activity of polycrystalline Ir has been enhanced in both an acidic and an alkaline solution with the addition of Ni at the topmost layer (OL) using the controlled-potential technique. Based on the significantly higher OER performance of the OL by contrast with the NSA and unmodified Ir electrode, the Ni/Irpoly OL system was investigated in a second OER protocol. In Figure 6, the OER polarization curves of two Ni OL catalyst systems in 0.1 M KOH are depicted. The electrochemical performance of each sample was tested by 10 consecutive cycles. However, both samples differ in their electrochemical pretreatment. The Ni-modified Irpoly electrode OLdi was tested in KOH directly after the process of Ni deposition. The electrochemical activity of the catalyst OLpr was initially recorded in 0.05 M H2SO4 before it was transferred into the alkaline setup.
For the OLdi catalyst, the characteristic Ni(OH)2/NiOOH redox transition [31,32] at ~+1.35 VRHE (see Figure 6b) is clearly visible and grows with an increasing cycle number. A slight cathodic shift of the precatalytic Ni2+/3+ redox wave is observed with an increasing cycle number, which indicates a destabilization of Ni2+ under OER catalytic potential. The redox charge obtained by integration of the area under the cathodic wave from the last scan amounts to 137.15 µC (with consideration of geometric surface area), which is equivalent to 1.42 nmol redox active Ni atoms. Taking into consideration that the Ni amount determined by ICP-MS for deposition at 0.05 VRHE was 3.178 nmol (see Table S1), this result would imply that not all Ni sites in the Ni/Irpoly OL system contribute equally to the OER current. The pre-treated OLpr catalyst shows no sign of a Ni(OH)2/NiOOH redox peak, which clearly confirms the instability of a Ni OL in acidic media. The characteristic redox peak of the OLdi, however, demonstrates the successful implementation of the electrochemical deposition of Ni on the polycrystalline Ir electrode and forms the basis of further atomic structure modifications. The prior OER treatment of the OL catalyst in sulfuric acid seems to activate the catalyst by ~31%. The enhanced electrochemical property of the pre-treated catalyst might be attributed to an increased presence of electrophilic oxygen species [33,34,35]. Pfeifer et al. identified the reactive OI− species by characteristic near-edge X-ray absorption fine structure (NEXAFS) features in Ir(III/IV) oxohydroxides. The dissolution of Ni adatoms along with the introduction of Ir vacancies in highly acidic solution and the accompanying formation of electronic defects in the cationic and anionic framework might lead to the formation of highly electrophilic oxygen atoms. Since these oxygen atoms are highly susceptible to a nucleophilic attack, they are suggested to facilitate the O-O bond formation, which is a key step during electrocatalytic OER. Another conclusion that can be drawn from the higher activity of the OLpr catalyst is roughening of the surface by repetitive cycling.
The selective leaching of a sacrificial component is a promising approach to design alloy systems with enhanced activity and stability towards the OER. In the work of Seitz et al., a highly active IrOx/SrIrO3 electrocatalyst was formed by leaching strontium in the near-surface during electrochemical testing from the surface of SrIrO3 thin-films [36]. In comparison to known IrOx catalyst materials, these IrOx surface layers induced by Sr deficiencies showed significantly higher OER activities, which supports the theory of increasing active sites by selective leaching of sacrificial components from surface alloys.
The observed order of activity of the Irpoly catalysts measured in KOH in the RDE setup could be confirmed with an electrochemical flow cell setup, which directly interfaced to a mass spectrometer (MS). In Figure S5a, the OL system displays the highest measured current density at 1.56 VRHE followed by Irpoly and the NSA system, which are quite close to one another. The subsequent OER measurements in acidic solution slightly differ in the sequence of activity. These were measured directly after the catalysts were treated in alkaline solution. The unmodified polycrystal experiences a drastic loss in current density. The NSA catalyst system, however, offers a greater stability and activity compared to Irpoly. The enhanced activity behavior of the NSA system was also observed in the 10th cycle directly measured in acidic solution (see Figure S4a). In Figure 5e, almost no activity loss is observed in acidic solution. Within the context of the measuring accuracy, the faraday efficiency (FE) of O2 evolution in Figure S5b reaches ~100% for Irpoly and for the OL catalyst in both electrolytes and in KOH, respectively. The FE over 100% for the OL catalyst in acidic solution is significant and may be deduced to Ni dissolution in the highly corrosive environment, which simultaneously produces additional oxygen. For both Ni-modified NSA catalysts, the FE amounts to ~104% within the precision of measurement. It should be noted that the faradaic efficiencies estimated using the calibration factor K* are assuming 100% efficiency in the steady state protocol and, therefore, the OER efficiencies reflect processes during non-equilibrium conditions.

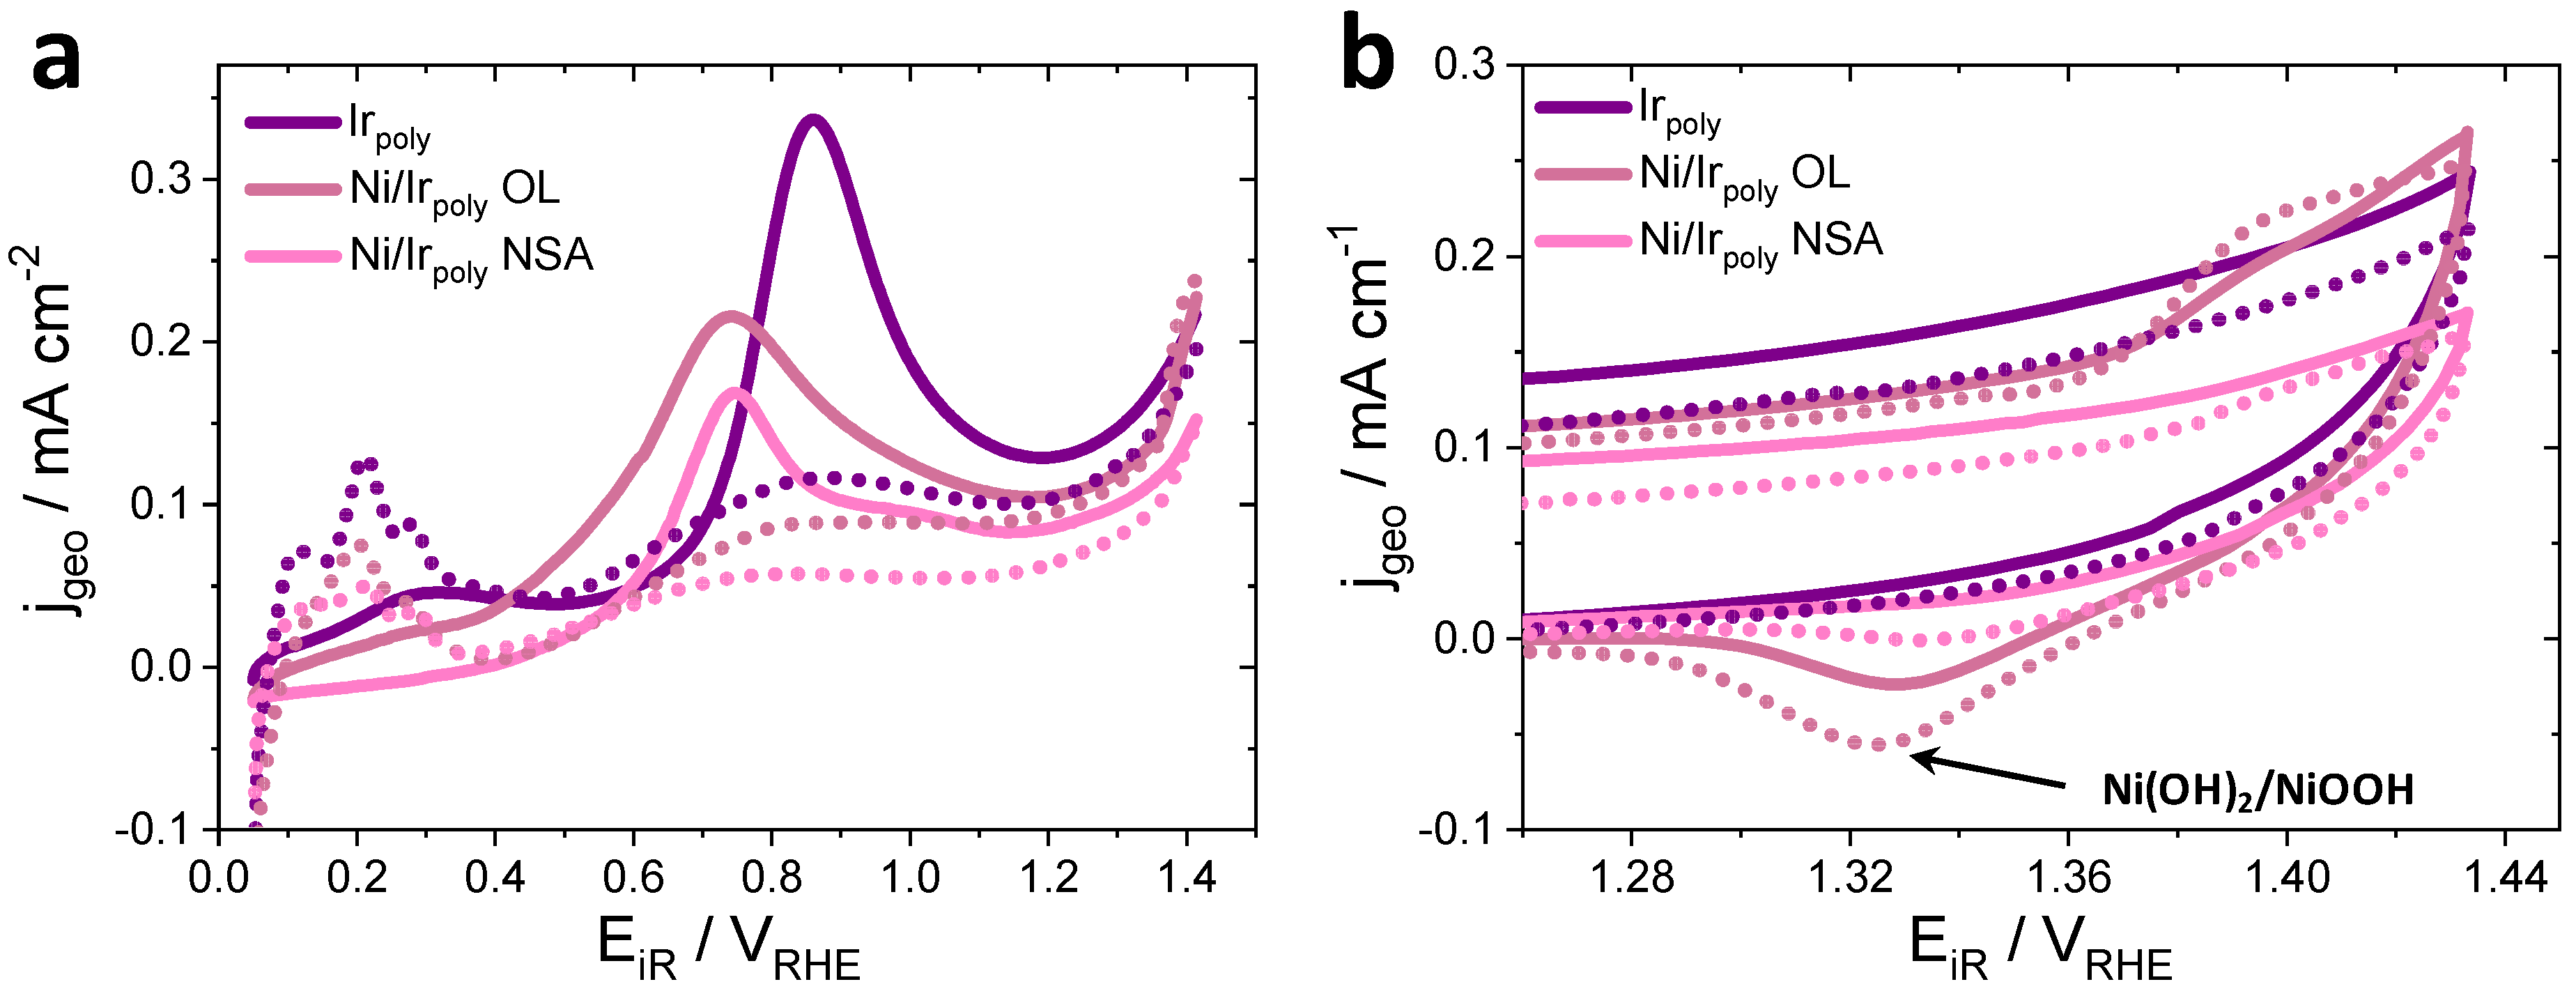
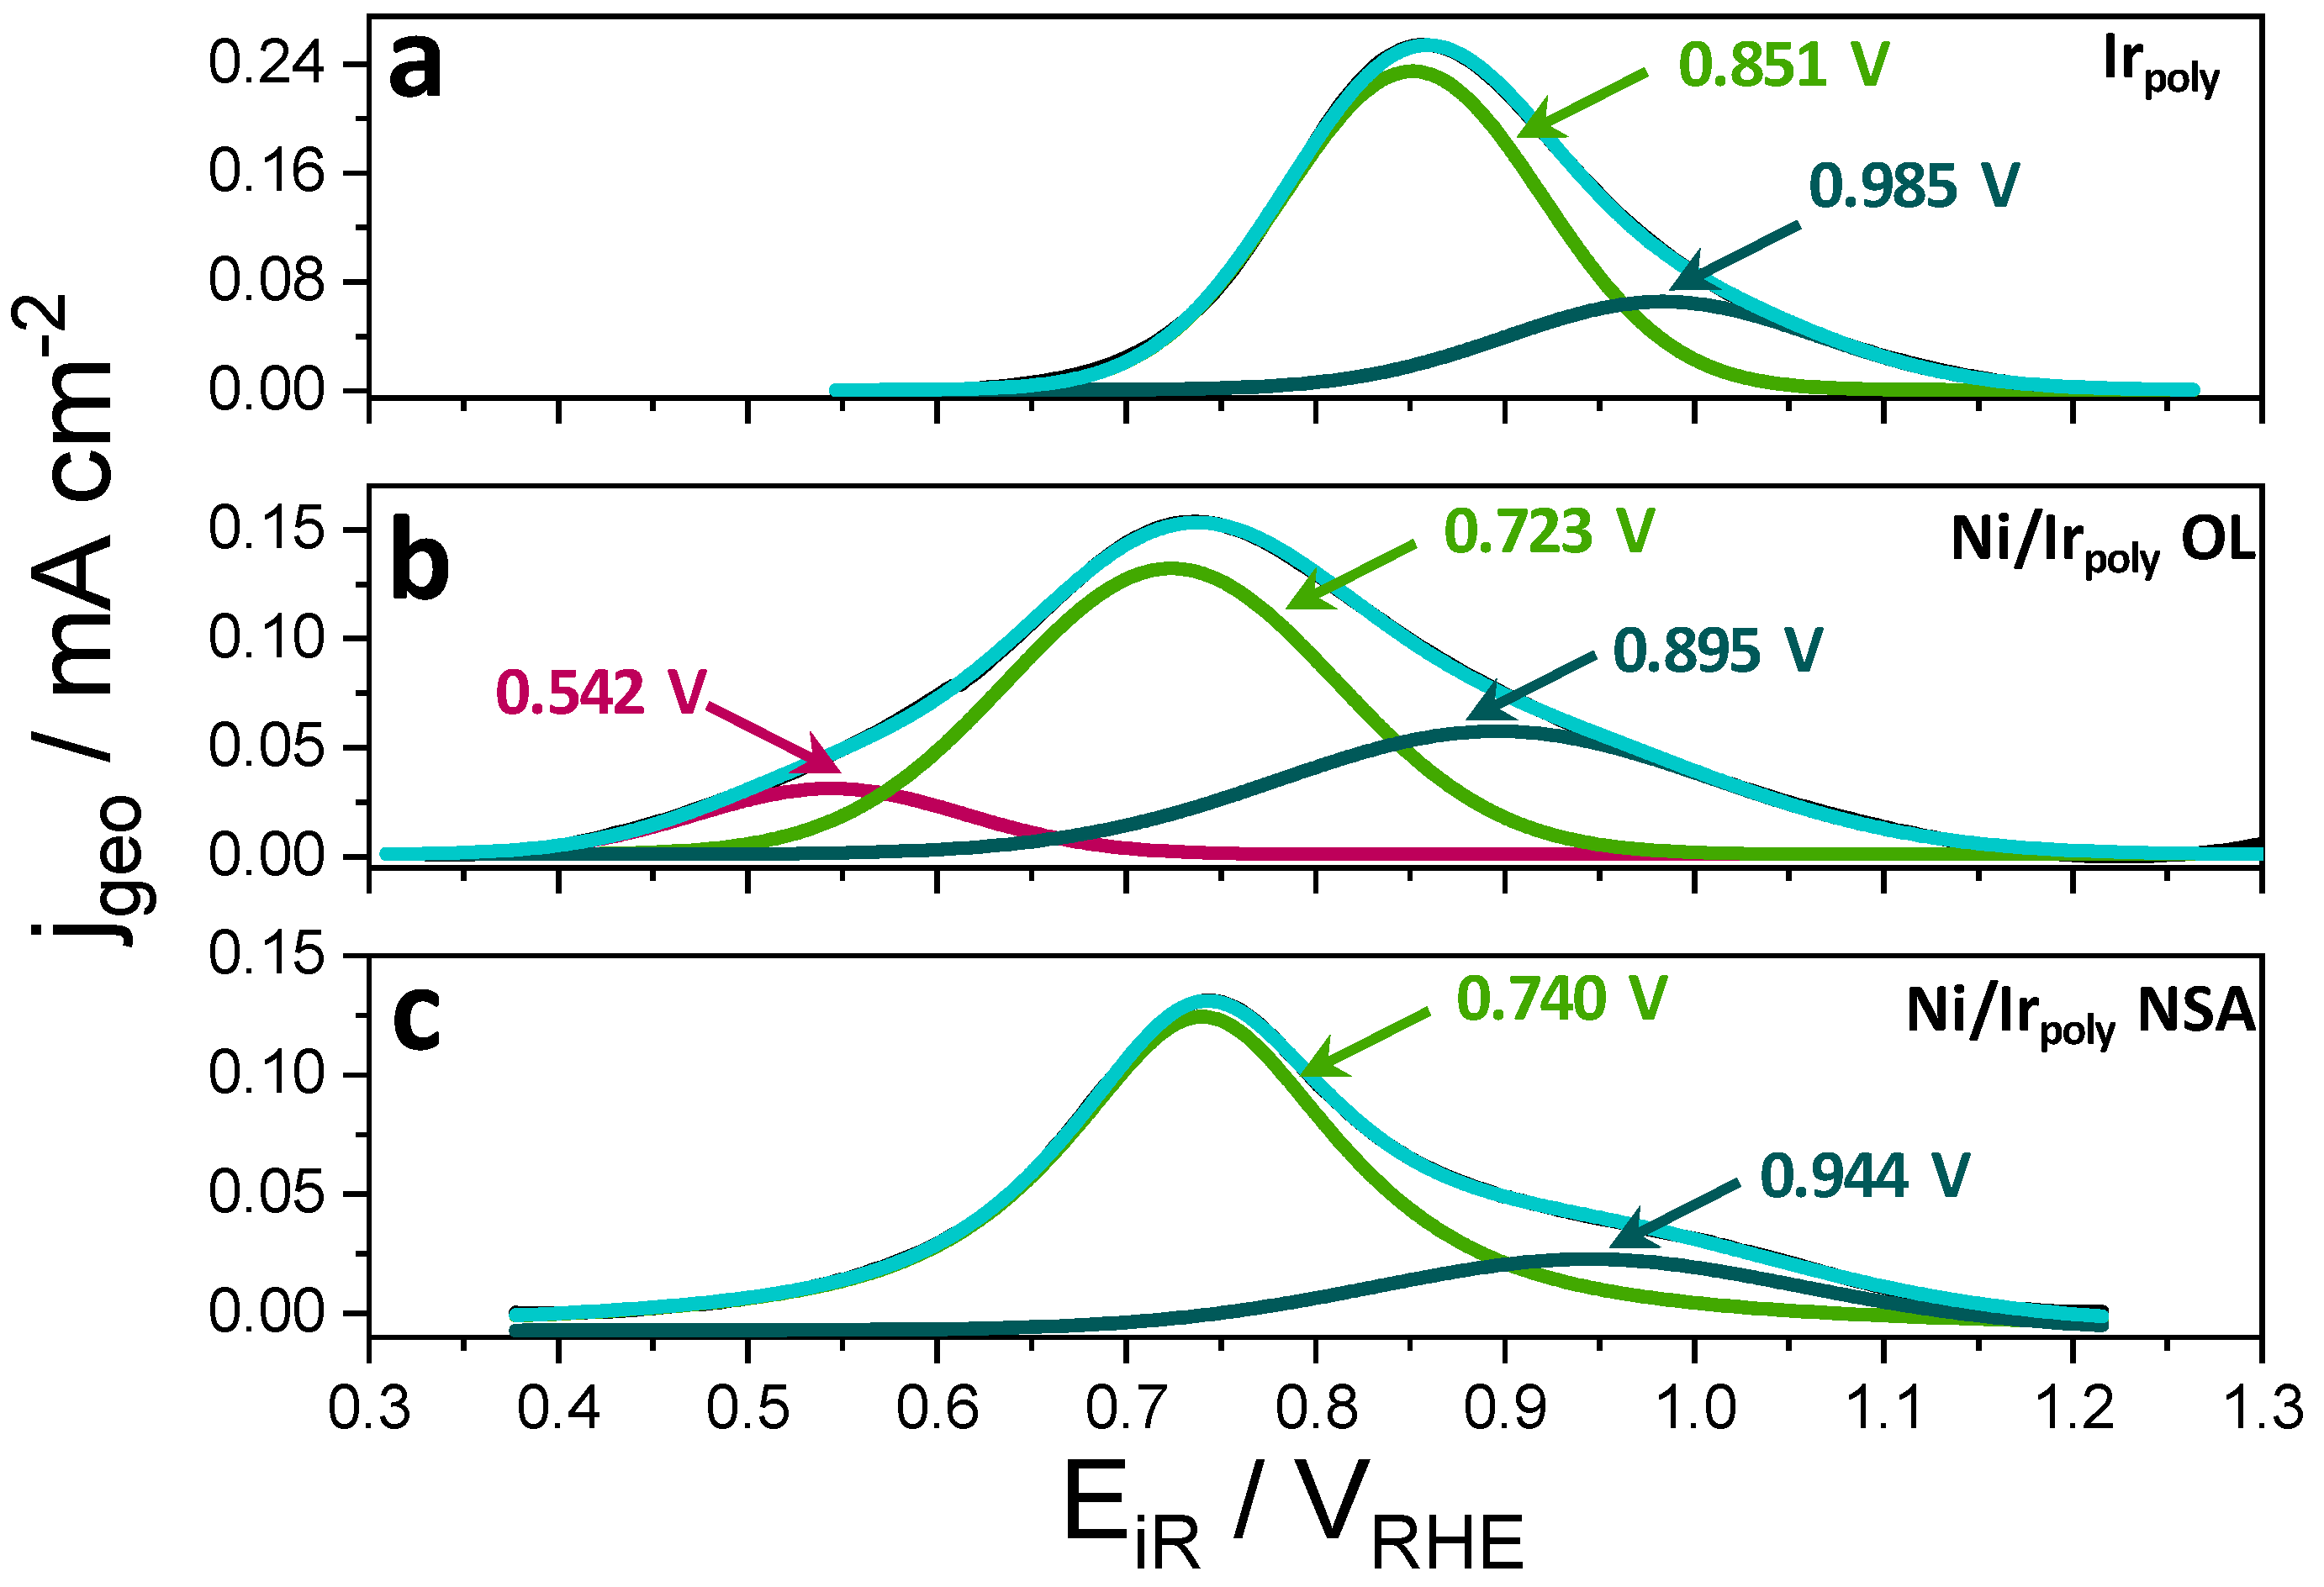
3.3.2. CO Stripping Voltammetry

The surface-sensitive electrochemical oxidation of adsorbed CO on pristine Irpoly and Ni-modified Irpoly electrodes has been studied in alkaline solution (0.1 M KOH) using stripping voltammetry. In this scenario, the Ni/Irpoly NSA catalyst was prepared by annealing the OL for only 1 min in the reductive atmosphere. Due to the reduced exposure to the reductive treatment, the characteristic Ni(OH)2/NiOOH feature is still visible in the cyclic voltammogram. The CO oxidation mechanism is examined in the alkaline electrolyte in order to integrate the Ni electrochemistry and to identify if CO adsorption is favored in the presence of Ni since the (sub)surface layers of Ni on Ir have not been stable in an acidic environment. Furthermore, the concept of OER in alkaline media may be of interest from the catalytic point-of-view since the pretreatment of the Ni/Irpoly OL catalyst in H2SO4 seems to have a beneficial effect in the subsequent activity measurement in KOH.
Figure 7 compares the anodic stripping voltammetry observed for a CO adlayer on the three distinct electrode surfaces in 0.1 M KOH solution at 50 mV s−1, which is followed by the second sweep cycle between the potentials of 0.05 and 1.40 VRHE. The presence of a CO surface adlayer can be confirmed since, for each electrocatalyst, a CO stripping peak was recorded. The voltammetric profiles further validate the complete electrooxidation of the adsorbed CO in the first anodic sweep since the second cycle produces a voltammogram displaying HUPD peaks characteristic for Ir.
It can be noticed that there is a clear distinction between the Ni-modified electrocatalysts and the unmodified, pristine polycrystalline Ir electrocatalyst with regard to the stripping peak shape and position in Figure 7a. The Ni/Irpoly OL and Ni/Irpoly NSA electrodes produced a stripping peak at much lower potentials than the pure Irpoly, which suggests that the oxidation of surface CO to CO2 is promoted by the presence of Ni. In accordance with the enhanced CO oxidation of the Ni-modified catalysts, the onset of OH adsorption on the OL and NSA starts at more negative potentials than on pristine Irpoly [37]. The oxidation of Ir sites is favored, or in other words, the adsorption of HO at free metallic sites is highly favored in the presence of Ni. An additional voltammetric feature of the CO-loaded Ir polycrystal is a broad peak at ~+0.3 VRHE (Figure 7a), which is only weakly defined for the OL and no longer present for the NSA. The possible origin of this peak will be discussed below.
To gain a quantitative understanding of the effect of Ni modification on the CO oxidation activity in alkaline electrolyte, the CO stripping profiles were deconvoluted into multiple peaks. In order to place hidden peaks, a linear background-correction was performed to the CO stripping peaks and, subsequently, the individual peaks were fitted. The respective CO stripping curves are presented in Figure 8 for Irpoly, Ni/Irpoly OL, and Ni/Irpoly NSA catalysts. At least two peaks can sufficiently fit all profiles.
The major component is centered at ~+0.85 VRHE for Irpoly and is shifted toward more cathodic potentials for Ni/Irpoly OL and Ni/Irpoly NSA. The effect of a more facile CO oxidation with respect to the unmodified Irpoly is quite likely due to a Ni richer surface, which has been observed in earlier studies [38,39,40]. The hypothesis is further reinforced by the fact that no Ni was removed by the CO stripping procedure since the characteristic Ni(OH)2/NiOOH redox couple was observed for both Ni-modified catalysts in Figure 8b after CO was stripped off the surface. The early onset of CO oxidation for the OL and NSA is initiated by highly hydrophilic Ni-rich areas forming Ni(oxo)hydroxides, which further react with adsorbed CO on neighboring Ir sites as early as ~+0.72 VRHE for Ni/Irpoly OL. The most likely reaction scheme to the CO oxidation process in alkaline solution can be assigned to a Langmuir-Hinshelwood mechanism involving the competitive adsorption of the reactants CO and OH [41].
CO ads + OH ads COOH ads
COOH ads CO 2 + H + + e .
The oxidative removal of adsorbed CO on Ir in the presence of Ni is presumed to proceed according to the following equations.
Ni ads + H 2 O Ni ads OH ads + H + + e
Ni ads OH ads + CO ads Ni ads + CO 2 + H + + e
In the CO stripping voltammetry of the pure Ir polycrystal in Figure 7a, an anodic redox wave is visible at ~+0.3 VRHE. The origin of this peak cannot be adequately verified. However, a rather small ‘pre-peak’ observed by Spendelow et al. [41] and García et al. [42] was attributed to oxidation of CO at step sites. In the study of the mechanism and kinetics of CO oxidation on stepped surfaces by in situ infrared spectroscopy, Lebedeva et al. found that the step trough is the most active site for CO oxidation [43]. After deposition of Ni, this peak is weakly identifiable, which suggests that Ni adatoms adsorb to some extent on Ir step sites. After annealing, however, the peak disappeared probably due to healing of a majority of defect sites on the polycrystalline Ir surface.
The CO stripping peaks in Figure 8 all consist of a small peak or shoulder at higher potentials (dark green fit) arising very likely from the adsorption of HO. Ir oxidation is prevented until the oxidative removal of adsorbed CO. On the Ni-modified catalysts, OH adsorption is more favored and, thereby, shifted to lower potentials as discussed earlier. The main peak positioned at ~+0.85 VRHE for Irpoly, ~+0.72 VRHE for Ni/Irpoly OL, and ~+0.74 VRHE for Ni/Irpoly NSA can be attributed to CO oxidation at terrace sites of Ir [44]. Based on the fitted data, the cathodic shift of the CO stripping peak is slightly more pronounced for Ni/Irpoly OL (~+0.72 VRHE) than for Ni/Irpoly NSA (~+0.74 VRHE). This finding can be interpreted under consideration of the CO oxidation charge of both Ni-modified catalysts. The CO stripping charge is frequently used to determine the electrochemical active surface area (ECSA), which is required to assess the stability and activity properties of electro-catalytic materials [38,45,46,47]. The baseline-corrected deconvoluted peaks (light green) were integrated for each individual catalyst. As expected, the net CO stripping charge of Irpoly was found to be the highest with 803 µC cm−2. The electrodeposition of Ni on the surface of Ir reduces the surface area available to CO, as Ir sites are blocked by Ni adatoms. A net charge of 569 µC cm−2 can be assigned to the OL catalyst. The CO charge for the NSA is slightly reduced to 529 µC cm−2. However, in addition to purely geometric blocking, electronic effects due to the Ni atoms need to be taken into consideration as well when discussing the CO coverages. Since the outer layer of the NSA in this study consists of both Ir and Ni atoms, the lower CO coverage on the NSA must be deduced to the modified electronic properties of the Ir surface atoms due to Ni atoms in the subsurface layer. A lowering of the chemisorption energy leads to a weaker adsorbate binding. A similar behavior has been reported by Bandarenka et al. in the study of the CO oxidation on alloys of Cu/Pt (111) [48]. It is, therefore, feasible that the electronic effect of Ni in the subsurface region on Ir either has a negative effect for the oxidation of CO or does not compensate for the reduced amount of surface Ni atoms. Consequently, the peak position of the main CO stripping peak is not only a function of the pure composition but depends strongly on the specific position of the non-noble metal. Apparent from Figure 8b, the CO stripping curve of the OL seems to consist of a second feature at ~+0.54 VRHE, which might be deduced to an OH adsorption on Ni adatoms prior to the facilitated electrochemical oxidation of CO. Even after intense fitting, this rather small peak was not found on the NSA most likely due to the comparatively small amount of Ni surface atoms. However, the absence of this peak on the NSA system strengthens the observed higher activity of the OL towards CO oxidation.
In the foregoing discussion, a distinction between distinct active Ir sites has not been addressed yet. The behavior of hydrogen on the polycrystalline Ir surface, however, may provide important information on the deposition process of Ni. In Figure 7a, there are three distinct redox features in the anodic branch of the HUPD region of the pristine Irpoly in the second scan after the complete oxidation of adsorbed CO. These redox peaks indicate distinct Ir sites at which oxidation of UPD hydrogen occurs. The well-defined HUPD peaks can be assigned to the three low-index crystallographic facets (111), (110), and (100) of Ir. A thorough theoretical study of the adsorption/deposition of hydrogen on various close-packed facets of noble and non-noble metals including the face-centered cubic (fcc) facets of Ir(111), Ir(110), and Ir(100) was performed. The energetically most favored adsorption sites for Ir(111) and Ir(100) were adopted by Ferrin et al. [49]. The binding energies (BE) for the three distinct low-index surfaces along with the coordination numbers (CN) of surface Ir atoms and calculated geometries for surface hydrogen (Site) are given in Table 2.
The binding energies were calculated relative to the hydrogen atom in the gas phase. The computational details reveal that the Ir(100) surface (−2.91 eV) binds hydrogen the strongest and is followed by Ir(111) (−2.73 eV) and Ir(110) (−2.74 eV). Based on these calculations, Ir(100) binds hydrogen ~0.20 eV more strongly than the Ir(111) and (110) surfaces. The difference in binding energy between those facets can be deduced to the hydrogen-metal bond distances and binding geometries. It has been reported that, for Ir(111), adsorption on the top site [50,51] is favored while, on Ir(100), the bridge site [52] is more favorable in terms of energy. Due to the distinct geometries of the adsorption configuration for surface hydrogen, the H-Ir bond distance on (100) is larger (1.81 Å) than on (111) (1.59 Å). The very similar hydrogen binding energies of the (111) and (110) sites hamper the assignment of the HUPD peaks. For this, an additional DFT study on Ni binding energies was performed revealing that Ni binds the strongest on the Ir(110) face (−4.55 eV), less strongly on the Ir(100) face (−4.47 eV), and the weakest on Ir(111) (−3.76 eV). Given the stronger binding of Ni to the (110) sites, we assume the first peak to originate from HUPD on (110) sites. The combined results from the DFT studies are presented in Figure 9.
As the HUPD peak attributed to the (110) sites is significantly reduced by forming an over layer of Ni, it appears that Ni adsorbs rather on (110) sites and that (100) sites are less favored. For the NSA catalyst system, the (110) peak is slightly visible whereas the (100) is more pronounced due to Ni in the subsurface layers. The HUPD charge is the lowest for the NSA catalyst (0.10 mC cm−2). For pristine Irpoly and Ni/Irpoly OL, the HUPD charge was determined to be 0.20 mC cm−2 and 0.13 mC cm−2, respectively. The given order was also observed for the CO charge and might provide important indications for the activity of the Ni-modified catalysts. The smaller HUPD charge of the NSA catalyst in comparison to the system in which Ni is present at the surface might be set into relation with its lower activity performance toward catalyzing the oxygen evolution.

4. Conclusions

The analysis of the three distinct catalyst systems with respect to their electrocatalytic performance towards oxygen evolution revealed that the Ni-modified polycrystalline Ir electrodes display distinct electrochemical properties. Incorporating Ni in the form of an over layer significantly reduces the overpotential to evolve oxygen in both the acidic and the alkaline solution. The promoting effect of Ni in IrNi bimetallic catalysts has been observed in various studies [23,29,35]. In acidic milieu, the higher activity might be assigned to the sacrificial leaching of Ni leading to a higher content of hydroxyl groups (OH). The Ni-depleted active catalyst structure is expected to be composed of oxygen atoms protonated from the electrolyte to form surface hydroxyl groups, which presumably act as crucial intermediates in the OER mechanism. The beneficial effect adding Ni to the OER activity, however, is no longer given to the same extent if Ni is present in the subsurface layer of the electrode. Thus, we can conclude that Ni in the NSA configuration is not able to perform as a sacrificial catalyst component as effectively as Ni in the OL configuration. Furthermore, the electronic effect of Ni on Ir might exercise a negative effect on the binding energy of Ir towards reaction intermediates in the OER. However, it cannot be neglected that the reductive treatment, which formed the NSA, led to partial healing of the Ir surface with a smaller density of defect and step sites. Since the environment of Ir was significantly altered, so was its activity. In alkaline media, the highly hydrophilic Ni adatoms are sufficient to achieve the desired effect of increasing the OER performance of the catalyst material. The performance of the OL system increases in KOH after it was pretreated in acid electrolyte beforehand. This observation confirms the hypothesis of Ni dissolution in acid. It appears as if the preceding OER treatment in 0.05 M H2SO4 has an advantageous impact on the electrocatalytic properties in KOH and can be deduced to the previously mentioned leaching of Ni in an acidic solution, which raises the concentration of surface OH atoms. The performance during OER of the catalysts including the shift of CO oxidation peaks is not only a function of the pure composition of the material but does strongly depend on the relative position of the metals to each other. However, it must be kept in mind that the interpretation of the peaks with regard to the CO stripping measurements especially of the shoulders is quite complex due to the presence of surface defects.

Supplementary Materials

The following are available online at https://www.mdpi.com/2571-9637/1/1/13/s1. Figure S1. Double-layer capacitance measurements displaying cyclic voltammograms of Irpoly measured in a potential window in which no faradic currents occur. Following scan rates were adjusted: 500 mV s−1, 200 mV s−1, 100 mV s−1, 50 mV s−1, 20 mV s−1 and 10 mV s−1; Figure S2. X-ray photoelectron spectroscopy measurements of (a) Ir(111) over the entire energy range. (b) High-resolution spectra of Ir(111) displaying the Ir4f, C1s, O1s and Ni 2p spectra. (c) XP spectra of Ni/Irpoly OLt=20min over the entire energy range; Figure S3. (a) Atomic force microscopy (AFM) images of Ni/Ir(111) OL with respective height profiles. (b) Magnification of a terrace assembly of (a) and (c) higher magnification. Scale bar is 400 nm. Arrows give the direction of the calculated height profile; Figure S4. 10th cycle of the electrocatalytic oxygen evolution reaction (OER) activities of Ni-modified Ir electrodes compared to pristine polycrystalline Ir at scan rates of 5 mV s−1 in (a) 0.05 M H2SO4 and (b) in 0.1 M KOH of Irpoly, Ni/Irpoly OL and Ni/Irpoly NSA. Current densities of the electrodes are normalized to the electrodes’ geometric surface area of 0.785 cm−2; Figure S5. Electrocatalytic OER activities of Ni-modified electrocatalysts and pristine Irpoly measured by differential electrochemical mass spectrometry (DEMS) in a dual-thin layer flow cell setup at a scan rate of 10 mV s−1. (a) Faradaic current densities measured at an OER overpotential of 300 mV (1.53 VRHE) normalized to the electrodes’ geometric surface area of 0.785 cm−2. The electrocatalytic OER activity in H2SO4 was measured directly after the treatment in KOH. (b) Faraday efficiency of oxygen evolution (FEO2) determined for the catalysts; Table S1. Calculated amount of adsorbed Ni on a polycrystalline Ir electrode in dependence of deposition potential Edep. The coverage of Ni (ML) was determined from ICP MS based on the assumption of a predominant (111) face on Irpoly.

Author Contributions

Conceptualization, E.Ö and P.S. Methodology, E.Ö. Validation, E.Ö. Formal analysis, E.Ö., J.A., A.M.M., I.S., and T.K. Investigation, E.Ö., J.A., and I.S. Resources, P.S., K.M., M.M., and B.R.C. Data analysis, E.Ö., J.A., I.S., and T.K. Writing—original draft preparation, E.Ö. Writing—review and editing, E.Ö., P.S., B.R.C., K.J.J.M., T.K., J.A., and A.M.M. Visualization, E.Ö. and P.S. Supervision, P.S. Project administration, E.Ö.

Funding

This research was funded by the Deutsche Forschungsgemeinschaft under the priority program SPP1613, grant number STR 596/3-1. The U.S. Department of Energy (DOE) through the Office of Basic Energy Sciences (BES) by grant DE-FG02-05ER15731 supported work at UW–Madison. Computational work was performed using supercomputing resources at the Center for Nanoscale Materials (CNM) at the Argonne National Laboratory under contract number DE-AC02-06CH11357 and at the National Energy Research Scientific Computing Center (NERSC) under contract number DE-AC02-05CH11231. Thomas Kropp is grateful for partial financial support by the Alexander von Humboldt Foundation.

Acknowledgments

We thank Benjamin Paul and Zarina Pawolek for helpful discussions and help with the set up.

Conflicts of Interest

The authors declare no conflict of interest.

References

  1. Cherevko, S.; Geiger, S.; Kasian, O.; Kulyk, N.; Grote, J.-P.; Savan, A.; Shrestha, B.R.; Merzlikin, S.; Breitbach, B.; Ludwig, A.; et al. Oxygen and hydrogen evolution reactions on Ru, RuO2, Ir, and IrO2 thin film electrodes in acidic and alkaline electrolytes: A comparative study on activity and stability. Catal. Today 2016, 262, 170–180. [Google Scholar] [CrossRef]
  2. Kasian, O.; Geiger, S.; Stock, P.; Polymeros, G.; Breitbach, B.; Savan, A.; Ludwig, A.; Cherevko, S.; Mayrhofer, K.J.J. On the Origin of the Improved Ruthenium Stability in RuO2–IrO2 Mixed Oxides. J. Electrochem. Soc. 2016, 163, F3099–F3104. [Google Scholar] [CrossRef]
  3. Schmeisser, D.; Jacobi, K. Photoelectron spectroscopy of nickel on zinc oxide in the monolayer and submonolayer range. Surf. Sci. 1979, 88, 138–152. [Google Scholar] [CrossRef]
  4. Gaebler, W.; Jacobi, K.; Ranke, W. The structure and electronic properties of thin palladium films on zinc oxide studied by AES and UPS. Surf. Sci. 1978, 75, 355–367. [Google Scholar] [CrossRef]
  5. Greeley, J.; Mavrikakis, M. Near-surface alloys for hydrogen fuel cell applications. Catal. Today 2006, 111, 52–58. [Google Scholar] [CrossRef]
  6. Greeley, J.; Mavrikakis, M. Alloy catalysts designed from first principles. Nat. Mater. 2004, 3, 810–815. [Google Scholar] [CrossRef] [PubMed]
  7. Greeley, J.; Mavrikakis, M. Surface and Subsurface Hydrogen:  Adsorption Properties on Transition Metals and Near-Surface Alloys. J. Phys. Chem. B 2005, 109, 3460–3471. [Google Scholar] [CrossRef] [PubMed]
  8. Herron, J.A.; Mavrikakis, M. On the composition of bimetallic near-surface alloys in the presence of oxygen and carbon monoxide. Catal. Commun. 2014, 52, 65–71. [Google Scholar] [CrossRef]
  9. Kandoi, S.; Ferrin, P.A.; Mavrikakis, M. Hydrogen on and in Selected Overlayer Near-Surface Alloys and the Effect of Subsurface Hydrogen on the Reactivity of Alloy Surfaces. Top. Catal. 2010, 53, 384–392. [Google Scholar] [CrossRef]
  10. Kim, C.; Möller, T.; Schmidt, J.; Thomas, A.; Strasser, P. Suppression of Competing Reaction Channels by Pb Adatom Decoration of Catalytically Active Cu Surfaces During CO2 Electroreduction. ACS Catal. under review.
  11. Özer, E.; Paul, B.; Spöri, C.; Strasser, P. Coupled Inductive Annealing-Electrochemical Setup for Controlled Preparation and Characterization of Alloy Crystal Surface Electrodes. Small Methods 2018, 1800232. [Google Scholar] [CrossRef]
  12. Özer, E.; Spöri, C.; Reier, T.; Strasser, P. Iridium(1 1 1), Iridium(1 1 0), and Ruthenium(0 0 0 1) Single Crystals as Model Catalysts for the Oxygen Evolution Reaction: Insights into the Electrochemical Oxide Formation and Electrocatalytic Activity. ChemCatChem 2016, 9, 597–603. [Google Scholar] [CrossRef]
  13. Trotochaud, L.; Young, S.L.; Ranney, J.K.; Boettcher, S.W. Nickel–Iron Oxyhydroxide Oxygen-Evolution Electrocatalysts: The Role of Intentional and Incidental Iron Incorporation. J. Am. Chem. Soc. 2014, 136, 6744–6753. [Google Scholar] [CrossRef] [PubMed]
  14. Blöchl, P.E. Projector augmented-wave method. Phys. Rev. B 1994, 50, 17953–17979. [Google Scholar] [CrossRef] [Green Version]
  15. Kresse, G.; Joubert, D. From ultrasoft pseudopotentials to the projector augmented-wave method. Phys. Rev. B 1999, 59, 1758–1775. [Google Scholar] [CrossRef]
  16. Kresse, G.; Furthmüller, J. Efficient iterative schemes for ab initio total-energy calculations using a plane-wave basis set. Phys. Rev. B 1996, 54, 11169–11186. [Google Scholar] [CrossRef]
  17. Kresse, G.; Furthmüller, J. Efficiency of ab-initio total energy calculations for metals and semiconductors using a plane-wave basis set. Comput. Mater. Sci. 1996, 6, 15–50. [Google Scholar] [CrossRef]
  18. Perdew, J.P.; Burke, K.; Ernzerhof, M. Generalized Gradient Approximation Made Simple. Phys. Rev. Lett. 1996, 77, 3865–3868. [Google Scholar] [CrossRef]
  19. Jusys, Z.; Massong, H.; Baltruschat, H. A New Approach for Simultaneous DEMS and EQCM: Electro-oxidation of Adsorbed CO on Pt and Pt-Ru. J. Electrochem. Soc. 1999, 146, 1093–1098. [Google Scholar] [CrossRef]
  20. Wonders, A.H.; Housmans, T.H.M.; Rosca, V.; Koper, M.T.M. On-line mass spectrometry system for measurements at single-crystal electrodes in hanging meniscus configuration. J. Appl. Electrochem. 2006, 36, 1215–1221. [Google Scholar] [CrossRef]
  21. McCrory, C.C.L.; Jung, S.; Peters, J.C.; Jaramillo, T.F. Benchmarking Heterogeneous Electrocatalysts for the Oxygen Evolution Reaction. J. Am. Chem. Soc. 2013, 135, 16977–16987. [Google Scholar] [CrossRef] [PubMed] [Green Version]
  22. Bligaard, T.; Nørskov, J.K. Ligand effects in heterogeneous catalysis and electrochemistry. Electrochim. Acta 2007, 52, 5512–5516. [Google Scholar] [CrossRef]
  23. Reier, T.; Pawolek, Z.; Cherevko, S.; Bruns, M.; Jones, T.; Teschner, D.; Selve, S.; Bergmann, A.; Nong, H.N.; Schlögl, R.; et al. Molecular Insight in Structure and Activity of Highly Efficient, Low-Ir Ir–Ni Oxide Catalysts for Electrochemical Water Splitting (OER). J. Am. Chem. Soc. 2015, 137, 13031–13040. [Google Scholar] [CrossRef]
  24. Rossmeisl, J.; Qu, Z.W.; Zhu, H.; Kroes, G.J.; Nørskov, J.K. Electrolysis of water on oxide surfaces. J. Electroanal. Chem. 2007, 607, 83–89. [Google Scholar] [CrossRef]
  25. Sanchez Casalongue Hernan, G.; Ng May, L.; Kaya, S.; Friebel, D.; Ogasawara, H.; Nilsson, A. In Situ Observation of Surface Species on Iridium Oxide Nanoparticles during the Oxygen Evolution Reaction. Angew. Chem. Int. Ed. 2014, 53, 7169–7172. [Google Scholar] [CrossRef] [PubMed] [Green Version]
  26. Favaro, M.; Valero-Vidal, C.; Eichhorn, J.; Toma, F.M.; Ross, P.N.; Yano, J.; Liu, Z.; Crumlin, E.J. Elucidating the alkaline oxygen evolution reaction mechanism on platinum. J. Mater. Chem. A 2017, 5, 11634–11643. [Google Scholar] [CrossRef] [Green Version]
  27. Doyle, R.L.; Lyons, M.E.G. The Oxygen Evolution Reaction: Mechanistic Concepts and Catalyst Design. In Photoelectrochemical Solar Fuel Production: From Basic Principles to Advanced Devices, 1st ed.; Giménez, S., Bisquert, J., Eds.; Springer International Publishing: Cham, Switzerland, 2016; pp. 41–104. ISBN 978–3-319-29641-8. [Google Scholar]
  28. Gong, L.; Ren, D.; Deng, Y.; Yeo, B.S. Efficient and Stable Evolution of Oxygen Using Pulse-Electrodeposited Ir/Ni Oxide Catalyst in Fe-Spiked KOH Electrolyte. ACS Appl. Mater. Interfaces 2016, 8, 15985–15990. [Google Scholar] [CrossRef]
  29. Nong, H.N.; Oh, H.S.; Reier, T.; Willinger, E.; Willinger, M.G.; Petkov, V.; Teschner, D.; Strasser, P. Oxide-Supported IrNiOx Core–Shell Particles as Efficient, Cost-Effective, and Stable Catalysts for Electrochemical Water Splitting. Angew. Chem. 2015, 127, 3018–3022. [Google Scholar] [CrossRef]
  30. Wang, C.; Sui, Y.; Xu, M.; Liu, C.; Xiao, G.; Zou, B. Synthesis of Ni–Ir Nanocages with Improved Electrocatalytic Performance for the Oxygen Evolution Reaction. ACS Sustain. Chem. Eng. 2017, 5, 9787–9792. [Google Scholar] [CrossRef]
  31. Bode, H.; Dehmelt, K.; Witte, J. Zur kenntnis der nickelhydroxidelektrode—I.Über das nickel (II)-hydroxidhydrat. Electrochim. Acta 1966, 11, 1079–1087. [Google Scholar] [CrossRef]
  32. Corrigan, D.A.; Knight, S.L. Electrochemical and Spectroscopic Evidence on the Participation of Quadrivalent Nickel in the Nickel Hydroxide Redox Reaction. J. Electrochem. Soc. 1989, 136, 613–619. [Google Scholar] [CrossRef]
  33. Pfeifer, V.; Jones, T.E.; Velasco Velez, J.J.; Arrigo, R.; Piccinin, S.; Havecker, M.; Knop-Gericke, A.; Schlögl, R. In situ observation of reactive oxygen species forming on oxygen-evolving iridium surfaces. Chem. Sci. 2017, 8, 2143–2149. [Google Scholar] [CrossRef] [PubMed] [Green Version]
  34. Pfeifer, V.; Jones, T.E.; Velasco Velez, J.J.; Massue, C.; Greiner, M.T.; Arrigo, R.; Teschner, D.; Girgsdies, F.; Scherzer, M.; Allan, J.; et al. The electronic structure of iridium oxide electrodes active in water splitting. Phys. Chem. Chem. Phys. 2016, 18, 2292–2296. [Google Scholar] [CrossRef] [PubMed] [Green Version]
  35. Nong, H.N.; Reier, T.; Oh, H.-S.; Gliech, M.; Paciok, P.; Vu, T.H.T.; Teschner, D.; Heggen, M.; Petkov, V.; Schlögl, R.; et al. A unique oxygen ligand environment facilitates water oxidation in hole-doped IrNiOx core–shell electrocatalysts. Nat. Catal. 2018. [Google Scholar] [CrossRef]
  36. Seitz, L.C.; Dickens, C.F.; Nishio, K.; Hikita, Y.; Montoya, J.; Doyle, A.; Kirk, C.; Vojvodic, A.; Hwang, H.Y.; Norskov, J.K.; et al. A highly active and stable IrOx/SrIrO3 catalyst for the oxygen evolution reaction. Science 2016, 353, 1011–1014. [Google Scholar] [CrossRef] [PubMed]
  37. Cui, C.; Ahmadi, M.; Behafarid, F.; Gan, L.; Neumann, M.; Heggen, M.; Cuenya, B.R.; Strasser, P. Shape-selected bimetallic nanoparticle electrocatalysts: Evolution of their atomic-scale structure, chemical composition, and electrochemical reactivity under various chemical environments. Faraday Discuss. 2013, 162, 91–112. [Google Scholar] [CrossRef] [PubMed]
  38. Rudi, S.; Cui, C.; Gan, L.; Strasser, P. Comparative study of the electrocatalytically active surface areas (ECSAs) of Pt alloy nanoparticles evaluated by Hupd and CO-stripping voltammetry. Electrocatalysis 2014, 5, 408–418. [Google Scholar] [CrossRef]
  39. Beermann, V.; Gocyla, M.; Kühl, S.; Padgett, E.; Schmies, H.; Goerlin, M.; Erini, N.; Shviro, M.; Heggen, M.; Dunin-Borkowski, R.E.; et al. Tuning the Electrocatalytic Oxygen Reduction Reaction Activity and Stability of Shape-Controlled Pt–Ni Nanoparticles by Thermal Annealing—Elucidating the Surface Atomic Structural and Compositional Changes. J. Am. Chem. Soc. 2017, 139, 16536–16547. [Google Scholar] [CrossRef]
  40. Chatenet, M.; Soldo-Olivier, Y.; Chaînet, E.; Faure, R. Understanding CO-stripping mechanism from NiUPD/Pt(110) in view of the measured nickel formal partial charge number upon underpotential deposition on platinum surfaces in sulphate media. Electrochim. Acta 2007, 53, 369–376. [Google Scholar] [CrossRef]
  41. Spendelow, J.S.; Goodpaster, J.D.; Kenis, P.J.A.; Wieckowski, A. Mechanism of CO Oxidation on Pt(111) in Alkaline Media. J. Phys. Chem. B 2006, 110, 9545–9555. [Google Scholar] [CrossRef]
  42. García, G.; Koper, M.T.M. Stripping voltammetry of carbon monoxide oxidation on stepped platinum single-crystal electrodes in alkaline solution. Phys. Chem. Chem. Phys. 2008, 10, 3802–3811. [Google Scholar] [CrossRef] [PubMed]
  43. Lebedeva, N.P.; Rodes, A.; Feliu, J.M.; Koper, M.T.M.; van Santen, R.A. Role of Crystalline Defects in Electrocatalysis:  CO Adsorption and Oxidation on Stepped Platinum Electrodes As Studied by in situ Infrared Spectroscopy. J. Phys. Chem. B 2002, 106, 9863–9872. [Google Scholar] [CrossRef]
  44. López-Cudero, A.; Cuesta, A.; Gutiérrez, C. Potential dependence of the saturation CO coverage of Pt electrodes: The origin of the pre-peak in CO-stripping voltammograms. Part 1: Pt(111). J. Electroanal. Chem. 2005, 579, 1–12. [Google Scholar] [CrossRef]
  45. Garrick, T.R.; Moylan, T.E.; Carpenter, M.K.; Kongkanand, A. Editors’ Choice—Electrochemically Active Surface Area Measurement of Aged Pt Alloy Catalysts in PEM Fuel Cells by CO Stripping. J. Electrochem. Soc. 2017, 164, F55–F59. [Google Scholar] [CrossRef]
  46. Hasché, F.; Oezaslan, M.; Strasser, P. Activity, stability and degradation of multi walled carbon nanotube (MWCNT) supported Pt fuel cell electrocatalysts. Phys. Chem. Chem. Phys. 2010, 12, 15251–15258. [Google Scholar] [CrossRef] [PubMed]
  47. Li, G.; Anderson, L.; Chen, Y.; Pan, M.; Abel Chuang, P.-Y. New insights into evaluating catalyst activity and stability for oxygen evolution reactions in alkaline media. Sustain. Energy Fuels 2018, 2, 237–251. [Google Scholar] [CrossRef]
  48. Bandarenka Aliaksandr, S.; Varela Ana, S.; Karamad, M.; Calle-Vallejo, F.; Bech, L.; Perez-Alonso Francisco, J.; Rossmeisl, J.; Stephens Ifan, E.L.; Chorkendorff, I. Design of an Active Site towards Optimal Electrocatalysis: Overlayers, Surface Alloys and Near-Surface Alloys of Cu/Pt(111). Angew. Chem. Int. Ed. 2012, 51, 11845–11848. [Google Scholar] [CrossRef]
  49. Ferrin, P.; Kandoi, S.; Nilekar, A.U.; Mavrikakis, M. Hydrogen adsorption, absorption and diffusion on and in transition metal surfaces: A DFT study. Surf. Sci. 2012, 606, 679–689. [Google Scholar] [CrossRef]
  50. Hagedorn, C.J.; Weiss, M.J.; Weinberg, W.H. Dissociative chemisorption of hydrogen on Ir(111): Evidence for terminal site adsorption. Phys. Rev. B 1999, 60, R14016–R14018. [Google Scholar] [CrossRef]
  51. Krekelberg, W.P.; Greeley, J.; Mavrikakis, M. Atomic and Molecular Adsorption on Ir(111). J. Phys. Chem. B 2004, 108, 987–994. [Google Scholar] [CrossRef]
  52. Lerch, D.; Klein, A.; Schmidt, A.; Müller, S.; Hammer, L.; Heinz, K.; Weinert, M. Unusual adsorption site of hydrogen on the unreconstructed Ir(100) surface. Phys. Rev. B 2006, 73, 075430. [Google Scholar] [CrossRef]
Figure 1. Double-layer capacitance measurements of (a) Ir(111) and (b) Irpoly displaying the anodic charging current densities measured at 0.42 VRHE.
Surfaces 01 00013 g001
Figure 2. Cyclic voltammograms of (a) a polycrystalline Ir electrode and (b) a pristine Ir(111) in a phosphate-buffered solution (pH = 6.85) containing either 2 mM Na2SO4 (solid lines) or 2 mM NiSO4 (dashed lines) at a scan rate of ν = 0.05 V s−1. The electrodes were immersed at a potential of 1.0 VRHE and 0.8 VRHE for Irpoly and Ir(111), respectively.
Surfaces 01 00013 g002
Figure 3. Relationship between amount of deposited Ni (in nmol, left axis) on polycrystalline Ir electrode and deposition potential Edep. The electrode was held for 10 min at each potential in a phosphate-buffered solution (pH = 6.85) containing 2 mM NiSO4. The amount of deposited Ni was analyzed by ICP-MS. The right axis (green) gives the determined value of the monolayer (ML) formation.
Surfaces 01 00013 g003
Figure 4. XP spectra of (a) Ni-modified Ir(111) single crystal (Ni/Ir(111) OL) and (b) a Ni-modified Ir polycrystal (Ni/Irpoly OLt=20min). (c) XP spectra from the Ir 4f core level of Ir(111), Ni/Ir(111) OL, and Ni/Irpoly OLt=20min. The deposition potential was 0.05 VRHE. The deposition time for the formation of the over layer on Irpoly was twice as long as for Ir(111).
Surfaces 01 00013 g004
Figure 5. Electrocatalytic OER activities of Ni-modified Ir electrodes compared to pristine polycrystalline Ir at scan rates of 5 mV s−1. (a) 1st OER cycle in 0.05 M H2SO4 and (b) corresponding Tafel plots (with ohmic-drop correction) of Irpoly, Ni/Irpoly OL, and Ni/Irpoly NSA. (c) 1st OER cycle in 0.1 M KOH and (d) corresponding Tafel plots of all catalysts. (e) Current densities of electrodes measured at 1.53 VRHE normalized to the electrode’s geometric surface area of 0.785 cm−2 for the 1st and 10th cycle. The 10th cycle is depicted in Figure S4 in the Supplementary Information.
Surfaces 01 00013 g005
Figure 6. (a) OER polarization curves of Ni/Irpoly OL in N2-saturated 0.1 M KOH without (lilac) and with (green) electrochemical OER pre-treatment in 0.05 M H2SO4. Scan rate ν = 5 mV s−1. 1st (solid lines) and 10th cycle (dotted lines) included. The over layer (OL) was formed by electrodeposition of Ni at 0.05 VRHE for 10 min. (b) Cathodic shift of the Ni(OH)2/NiOOH redox peak of the OL implies destabilization of Ni2+.
Surfaces 01 00013 g006
Figure 7. CO stripping (solid line) and the subsequent cyclic voltammogram (dotted line) for Irpoly, Ni/Irpoly OL, and Ni/Irpoly NSA measured in 0.1 M KOH. (a) Anodic curves over the entire potential range and (b) anodic and cathodic curves in a potential range of 1.25–1.44 VRHE.
Surfaces 01 00013 g007
Figure 8. CO stripping curves for (a) the unmodified polycrystalline Ir electrode and the Ni-modified (b) Irpoly OL and (c) Irpoly NSA catalysts obtained at 50 mV s−1 in N2-saturated 0.1 M KOH (purified Fe free) at a rotation of 1000 rpm. A linear-background correction was performed through baseline subtraction for the anodic CO stripping voltammetry in Figure 7a between 0.4 and 1.2 VRHE. The peaks were fit by Gaussian functions and the individual contributions are shown in colors. The cumulative curve is given in turquoise.
Surfaces 01 00013 g008
Figure 9. The second cycle of the CO stripping CV (from Figure 7) displaying the HUPD peaks of the three distinct catalyst systems. The allocation of the HUPD peaks are based on DFT calculations of the hydrogen binding energy on the three low-index surfaces (111), (110), and (100) of Ir.
Surfaces 01 00013 g009
Table 1. Calculations for determining the mass needed to produce a monolayer of Ni on a polycrystalline Ir cylinder with a diameter of 0.785 cm2. (Lattice parameter Ir: a = 3.8394 Å, according to PDF: 00-006-0598).
StepsCalculation
surface area calculation 3 / 4 · a 2
surface area/10−15 cm21.277
atoms per (111) face in unit cell2
atoms per unit area/1015 cm−21.566
amount of substance per surface area/nmol cm−22.6
amount of substance for monolayer/nmol ML−12.04
mass of Ni per monolayer/µg ML−10.12
mass of Ni per monolayer for Irpoly/µg ML−10.52
Table 2. DFT-calculated binding energies of hydrogen and H-Ir bond distances on the three low-index surfaces of Ir.
FaceCNSiteH BE/eVH-Ir Bond Distance/pm
(100)6bridging−2.912 × 181
(111)9atop−2.73159
(110)7bridging−2.742 × 181

