Article

Micro-Study of the Evolution of Rural Settlement Patterns and Their Spatial Association with Water and Land Resources: A Case Study of Shandan County, China

1
College of Geography and Environmental Science, Northwest Normal University, Lanzhou 730000, China
2
School of Management, Lanzhou University, Lanzhou 730000, China
*
Author to whom correspondence should be addressed.
Sustainability 2017, 9(12), 2277; https://doi.org/10.3390/su9122277
Submission received: 11 October 2017 / Revised: 5 December 2017 / Accepted: 6 December 2017 / Published: 8 December 2017
(This article belongs to the Special Issue Sustainable Smart Cities and Smart Villages Research)

Abstract

:
The balance between population and water and land resources is an important part of regional sustainable development. It is also significant for the ecological civilization in China and can help solve the Three Rural Issues (agriculture, countryside and farmers) in China. The Silk Road Economic Belt and Maritime Silk Road in twenty-first Century Strategy have brought new opportunities for the Hexi Corridor, which is facing challenges in the sustainable development of rural settlements. In this paper, we analyzed the temporal-spatial differentiation of rural settlement patterns in Shandan County of Hexi Corridor and studied the spatial association between rural settlements and water-land resources. Results show that the total area of rural settlement patches (CA), the number of rural settlement patches (NP), the mean patch area (MPS), the maximum patch areas (MAXP), the minimum patch areas (MINP) and the density of rural settlement patches (PD) changed more rapidly from 1998 to 2008 than from 2008 to 2015. In the second period, the indices mentioned before did not change significantly. The kernel density of rural settlements is basically consistent in three periods. Rural settlements mainly distribute along major roads and the hydrographic network and the kernel density of rural settlements decreases in the direction away from these roads and the hydrographic network. In addition, rural settlements in Shandan County are densely distributed in some regions and sparsely distributed in other regions. The dispersion degree of rural settlements increased from 1998 to 2008 and tended to be stable after 2008. These lead to the dispersion, hollowing and chaos of rural settlements in Shandan County. The spatial distribution of rural settlements in Shandan County is closely related to that of cultivated land and the hydrographic network. Our results might provide a theoretical basis for the reasonable utilization of water and land resources in Shandan County. Ultimately, a balance between population and water and land resources and regional sustainable development can be achieved.

1. Introduction

Settlement refers to a place where people concentrate and settle down for living and production purpose. It can also be called residential settlement. According to their characteristics and sizes, settlements can be classified into two categories: urban settlements and rural settlements. Currently, there are about 590 million permanent population living in more than 2 million villages in China, so rural settlements are the main form of settlement for Chinese population [1].
In the world, research on rural settlement geography began in the 19th century. J. G. Kohl, as the originator of rural settlement research, systematically discussed the relationship between settlement location and population concentration in his book The Relationship between Human Traffic and Terrain in 1841 [2]. Since then, many researchers have begun to explore the relationship between settlements and environment. For example, Dohme, Matlakowski, Hunziker et al. analyzed house forms in different regions and their adaptability to the geographical environment [2]. Ratzel, the main representative of environmental determinism, explored the dependence of settlement distribution on the natural environment [2]. Lugeon illustrated in detail the relationship between settlement location and environmental factors such as terrain and sunlight [2]. Brunhes comprehensively studied the relationship between rural settlements and the environment in his book Principles of Human Geography [3]. Blache, the representative of environmental possibilism, analyzed the relationship between residential buildings and the environment, building materials, house forms [4]. From 1920s to 1960s, there was more and more research on rural settlements. Demangeon in France, Kovalev in the Soviet Union and Doxiadis in Greece et al. qualitatively analyzed the formation, development, type and function of rural settlements [5,6,7]. After 1960s, metrology concept was introduced in rural settlement research which then entered a qualitative and quantitative stage. Rural Settlement in an Urban World (Bunce) [8], Rural Settlement and Land Use (Chisholm) [9] and Determination of Settlement Patterns in Rapidly Growing Rural Areas (Goodwin) [10] were such examples. Since 2000, research on rural settlements has been focused on their spatial layout and influencing factors [11], their spatial form and type [12,13,14], the evolution and reconstruction of rural settlement patterns [15,16,17], land use and landscape ecology [18,19] and the social perspective [20,21].
In China, the research on rural settlements appeared relatively later. Influenced by Western research on this topic, some researchers began to study rural settlements in 1930s. Lin published his paper Discussion on Settlement Classification on the Journal of Geography, Chen published his paper Settlement near Zunyi on the Journal of Acta Geographica Sinica and Yan published his paper Xikang Living Geography on the Journal of Acta Geographica Sinica [22,23,24]. These researchers preliminarily analyzed the relationship between settlements and geographical environment. From 1950s to 1960s, some researchers extensively studied settlement geography according to the actual situation of village and town planning in China. In 1950, Wu published his paper How to Do Urban Survey, in which he classified settlements and proposed to use urban degree to determine whether a settlement had reached the development level of urban areas [25]. In 1959, Zhang and Song published their paper Basic Experience of Planning of People’s Commune Economy in Rural Areas. They put forward three principles for the layout of residential settlements [26]. First, it should be closely related to the overall planning of commune and be conducive to further development and production. Second, it should adapt to river network. Third, it should consider the influences of various natural conditions, the original residential settlements, major traffic lines and their relationship to residential settlements. From 1970s to 1990s, Ye, Zheng, Chen et al. extensively studied rural settlements in China [2]. Rural settlement geography and urban geography were thus developed rapidly. Jin systematically studied the formation, classification and regional differences between Chinese rural settlements in his book Rural Settlement Geography published in 1988 and his book Chinese Rural Settlement Geography published in 1989 [27]. Recently, rural areas have entered a new developmental stage as the rapid progression of New Urbanization in China and the proposal and implementation of national policies such as Three Rural Issues, New Countryside, Coordination of Urban and Rural Development, Beautiful Countryside [28]. The spatial density and form of rural settlements in China have changed significantly. A series of research on rural settlements including their form and structure [29,30,31,32], their function [33,34], their evolution and driving mechanism and the hollowing and arrangement of rural settlements [35,36,37] has been conducted. The research areas mainly include the southwest Karst mountain area, the hilly area of the Loess Plateau, the Huang-Huai-Hai plain, the Bohai rim region and the Chang-Zhu-Tan area [30,35,38]. Integrated application of GIS, RS and landscape methods for rural settlement research is increasing and macro-scale research is changing to micro-scale research.
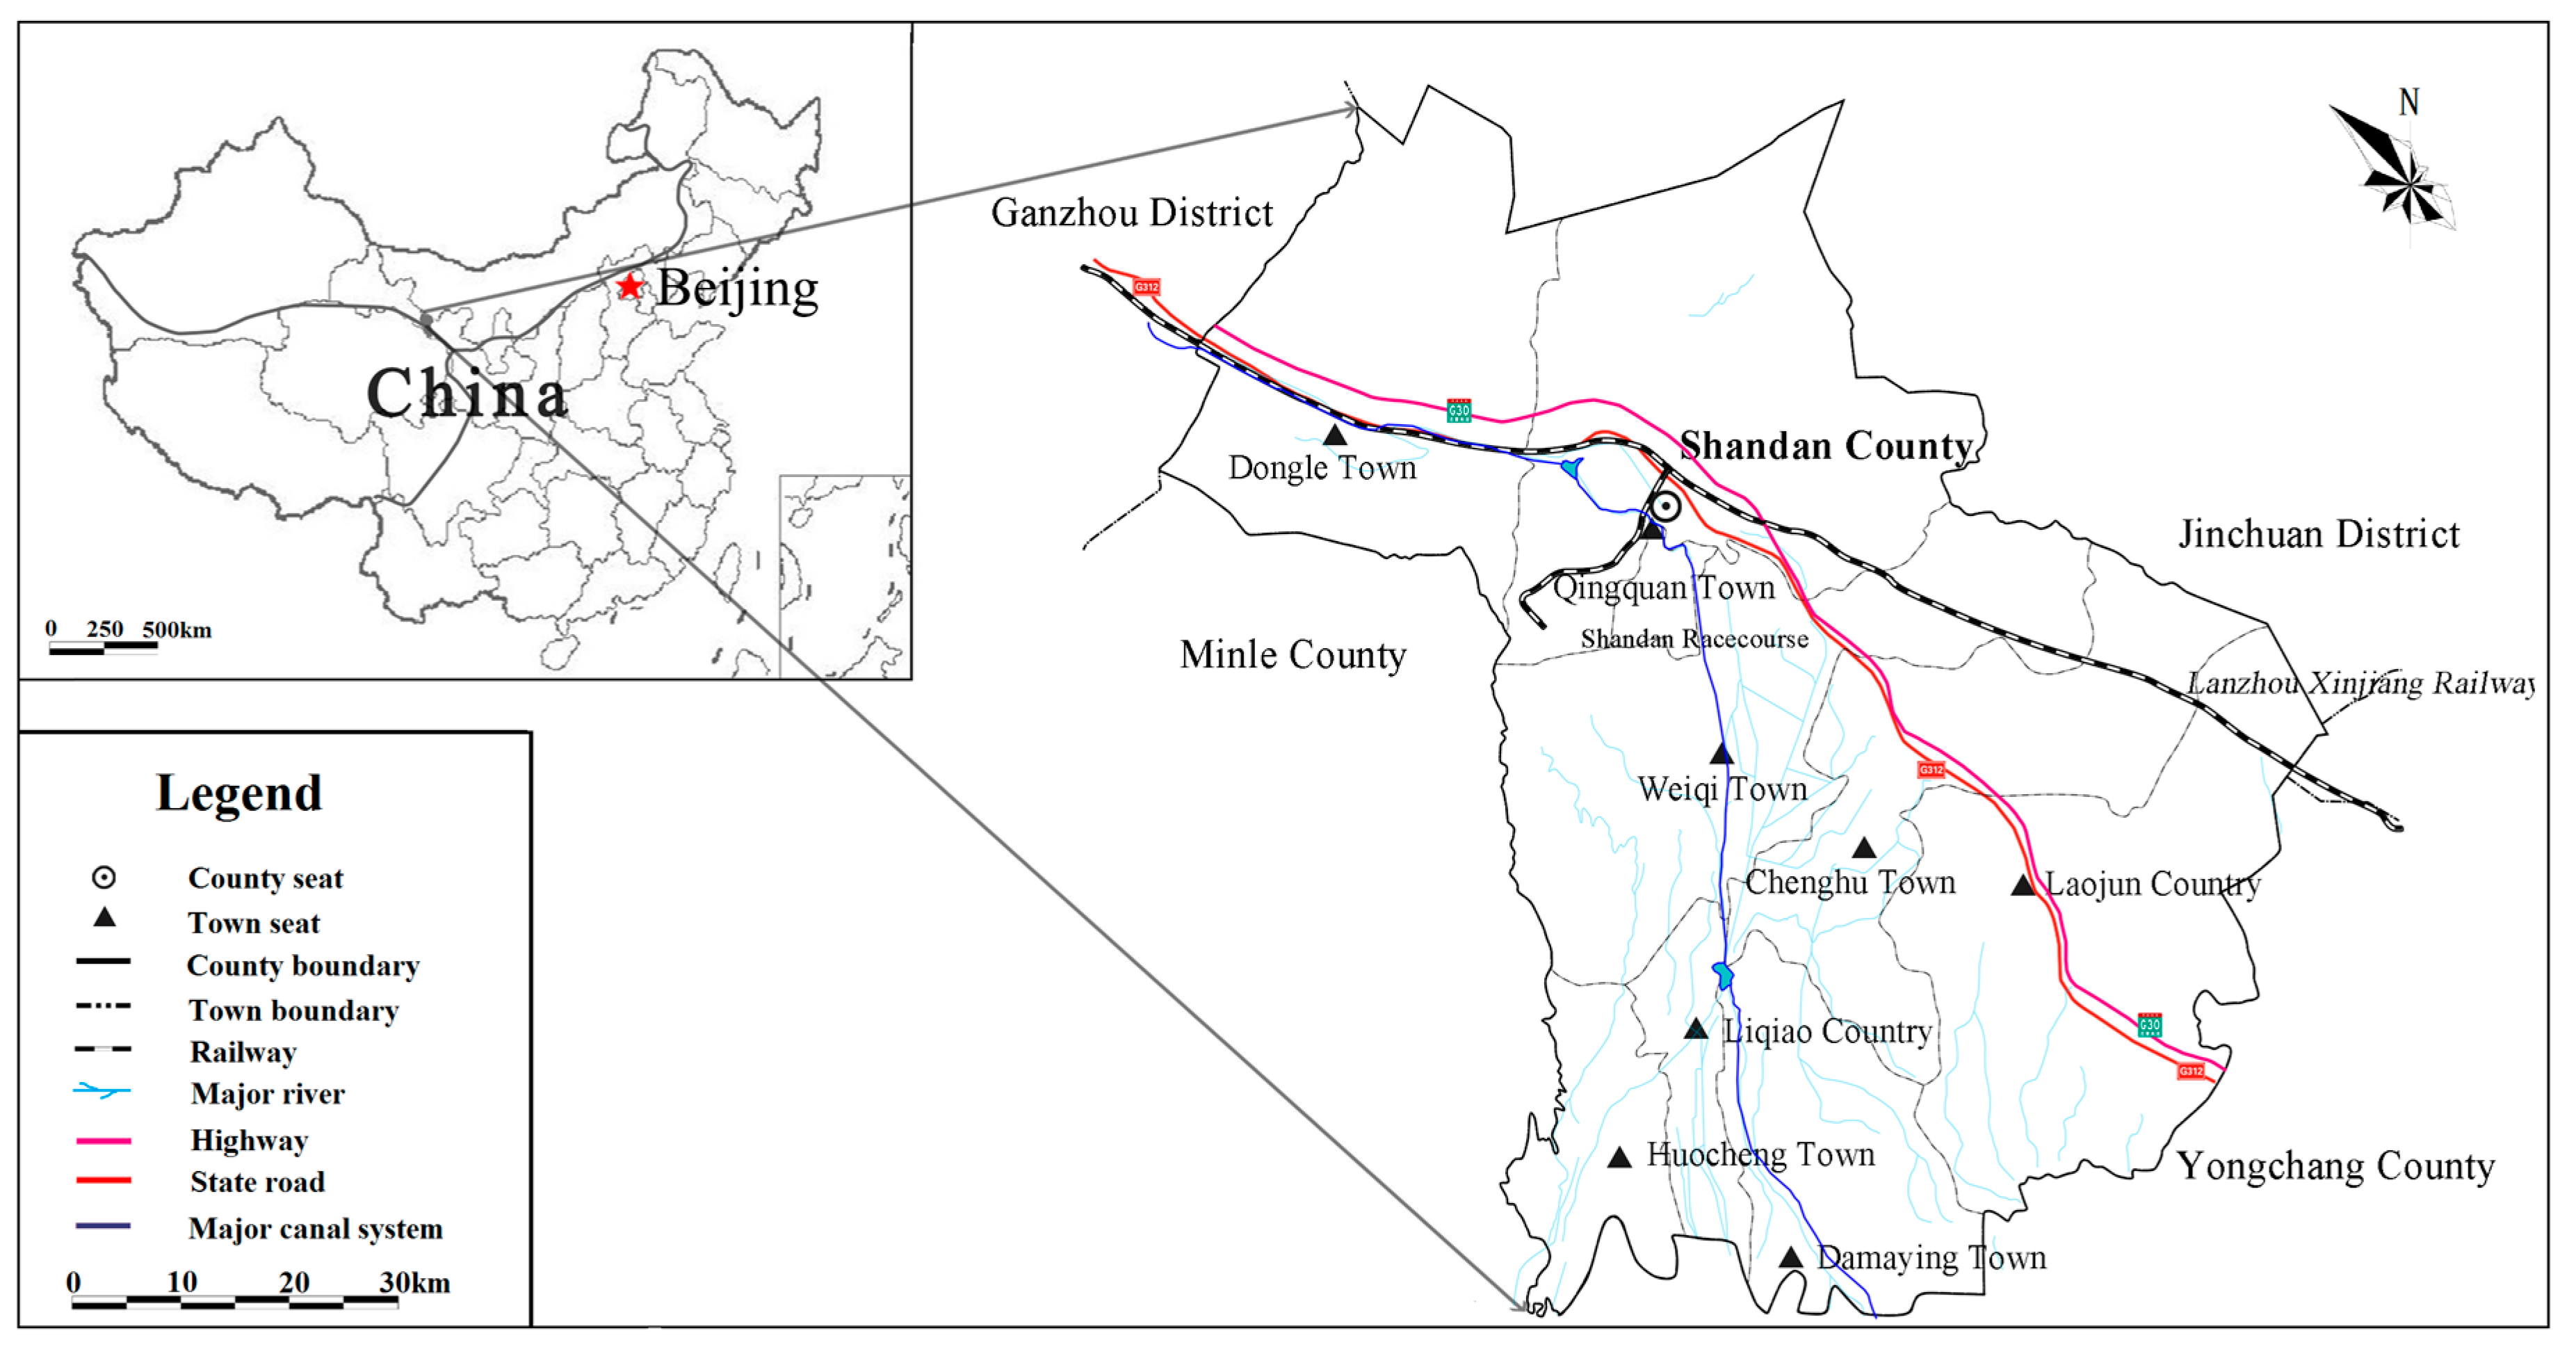
In China, oasis area accounts for 3–5% of the total area of arid region but it can provide resources supporting more than 90% of the population and create more than 95% of industrial and agricultural output value. Shandan County is a typical arid oasis region. Rural settlements are distributed in this area and human activities such as agricultural production and processing also occur in this area. Rural settlement is the main form of spatial agglomeration of rural population in Shandan County. Water and land resources are the most basic constituents of oasis and the existence and development of rural settlements are restricted by these two factors, which eventually determine the scale and carrying capacity of rural settlements [39]. Restricted by agricultural production technology, water and land resource endowment as well as rural population in Shandan County are closely related to the formation, scale, structure and change of rural settlements and the exploitation and utilization of water and land resources will be reflected in the settlements in oasis [40]. With the integrated development of urban and rural areas, the residents’ quality of life in Shandan County is greatly improved. The flow of people, resources and information between urban and rural areas is being strengthened. On the one hand, rural labor force is transferred to urban areas and some rural land is converted into urban land (with urbanization rate increasing from 14% in 1998 to 42.44% in 2015). Because of large-scale population transfer, rural areas tend to “Hollowed”. On the other hand, the change of rural residents’ living standard and lifestyle lead to new requirements of production and life in rural areas. This causes the number of rural settlements to grow, the cultivated area to expand and the density of the hydrographic network to increase. The structure and form of rural land use have changed greatly, so the relationships between population and water and land resources have changed adaptively, which will affect regional sustainable development.
Water and land resources are the most basic constituents of oasis. In fact, oasis can be simply defined as a place with water in desert. The abundance of water resources determines irrigated land area, which further affects the oasis’s carrying capacity for social economy. Settlement is a place of oasis population aggregation and it is also the concentrated expression of human economic activities. The spatial layout of oasis settlements is determined by the long-term interaction between settlements and the environment. The spatial association between oasis settlements and water and land resources is an important factor influencing the adaptability of the relations among population, land and water. Shandan County, located in the middle of Hexi Corridor, has special geographical location, where water and land resources are scarce, the economy is relatively weak and the ecological environment is fragile. Shandan Country is a typical arid oasis region and the relationships between population and land resources and between population and water resources are complex and sensitive, which will affect regional sustainable development by different allocation of resource [40]. Therefore, we explored the temporal-spatial differentiation of the rural settlement patterns in Shandan County from 1998 to 2015. Further, we studied the spatial association between rural settlements and water and land resources. Finally, we revealed the general pattern of the temporal-spatial change of rural settlements. The results might provide a theoretical basis for the reasonable utilization of water and land resources in Shandan County, help provide decision-making basis for the government and achieve regional sustainable development. Meanwhile, this study is important for deepening and expanding the theory of research on oasis settlements, guiding the construction of new socialist countryside, scientifically planning and building rural settlements and promoting the integrated development of urban and rural oases.

2. Overview of the Research Area

2.1. Natural Geography

Shandan County is located in the middle of the Hexi Corridor and is the eastern “gate” of Zhangye City in Gansu Province of China. Shandan County is often known as “the wasp-waist of corridor” and “the throat of Ganliang”. In fact, the ancient “Silk Road” passes this area. Shandan County is bounded by Yongchang County in the east, Minle County in the west, Ganzhou District in the northwest, the Huangcheng District of Sunan Yugur Autonomous County in the southeast, the Lenglong mountain range of the Qilian Mountains and Qinghai Province in the south and Longshou Mountain in the north. The other side of Longshou Mountain is Alashan Right Banner in the Inner Mongolia Autonomous Region. Shandan County is a typical oasis. It has a total area of 5402.43 km2, a north-south length of 136 km and an east-west width of 89 km. It is in 100°41′–100°42′E and 37°56′–39°03′N (Figure 1). This area has an alpine semi-arid climate, with uneven distribution of seasons, strong solar radiation, long sunshine hours, low temperature, large temperature difference between day and night, little but concentrated rainfall, high evaporation, low humidity and short frost-free period. The mean annual temperature is about 6.5 °C, the mean annual precipitation is 199.4 mm, sunshine hour is 2964.7 h, evaporation is 2351.2 mm and the frost-free period is 165 d. Its altitude ranges from 1549 to 4444 m above the sea level. The highest point is in the Lenglong mountain range of Qilian Mountains. The lowest point is in Xitun Shahe of Dongle County. There are the Maying river, Huocheng river, Sigou river and Shandan river in Shandan County. In addition, there are many ditches such as Liushui Kou, Ciyao Kou, Nanshan Kou.

2.2. Social Economy

Shandan County has jurisdiction over 2 townships (Liqiao and Laojun), 6 towns (Qingquan, Chenhu, Huocheng, Weiqi, Dongle and Damaying), 110 villages, 6 committees and 754 villager groups. It had 167.3 thousand permanent residents in 2015, among which urban population was 71,000. Thus, the urbanization rate was 42.44%. There are 14 minorities living in Shandan County including Hui, Dongxiang, Tibetan, Manchu, Zhuang, Miao, Tu, Tujia, Yugur, Bonan, Mongolian, Yi, Daur and Xibe. These minorities have a population of 747, accounting for 0.39% of the total population in the county. The GDP of Shandan County was 4.3 billion Yuan in 2015 and the ratio of three sectors (primary, secondary and tertiary) was 22.5: 26.5: 51in 2015. Clearly, the primary and secondary industries accounted for small proportions. Considering the total economic output, the per capita disposable income of farmers (10,526.6 Yuan) and the per capita disposable income of urban residents (19,445.1 Yuan), the industrial structure of Shandan County is relatively advanced.

3. Methods and Data Sources

3.1. Methods

3.1.1. The Indices of Rural Settlement Pattern

The indices of rural settlement pattern, such as CA, NP, MPS, MINP, MAXP and PD were used to analyze the evolution and differentiation of rural settlements in Shandan County and reflect their structural composition and spatial characteristics. Among the indices mentioned before, MPS = CA/NP and PD = NP/Scounty area.

3.1.2. Dispersion Degree

By using different size grids, the temporal-spatial change of rural settlements can be better revealed. The land use vector data (rural settlement patches) in 1998, 2008 and 2017 were converted into grid data (7055 grids) with a resolution of 1 km × 1 km. Dispersion degree of rural settlements refers to the amount of map patches that rural settlements occupy in each grid. The change in dispersion degree can reflect the temporal-spatial process of dispersion, mergence and disappearance of rural settlements [31].

3.1.3. Kernel Density

According to the nonparametric method for calculating surface density, the kernel density of rural settlements was determined. The higher the kernel density, the higher the distribution density of rural settlements. The formula was:
f ( x , y ) = 1 n h 2 i = 1 n k ( d i n )
where f(x,y) is the density estimate at (x,y), n is the number of observations, h is bandwidth (Mean Integrated Squared Error (MISE) is used in bandwidth estimation), k is Kernel function (Gaussian Kernel Function), di is the distance between position (x,y) and the ith observation point.
h M I S E = ( 4 σ ^ 5 3 n ) 1 5 1.06 σ ^ n 1 5
k = exp ( x x ) 2 / 2 h 2
where σ ^ is standard deviation and x’ is the center of Kernel function [41].
The GIS-based Kernel Density Estimation (KDE) method used in this paper is based on a moving window to calculate and output the point density of each grid cell. The specific methods are: (1) Define a search radius, move the circle and count the number of events that fall within the circle; (2) Determine the size of the output grid according to the density precision requirements; (3) Calculate the density contribution value of each event to each grid in the circle through the kernel function; (4) Assign density value to each grid and its value is the sum of the density contribution value of each event in the grid; (5) Output the density value of each grid. By setting different search radius, a better density distribution effect was achieved in this paper [42].

3.1.4. Spatial Hotspot Detection

Detection of a hotspot (or a coldspot) in spatial data and temporal-spatial data sets is very meaningful. Spatial hotspot detection (Getis-OrdGi*) was used to determine whether the number of rural settlement patches was significantly large or small (in statistics) in some regions. Then, the hotspots and coldspots were visualized for further study of the differentiation of rural settlement scale. The equation was:
G i * ( d ) = j = 1 n w i j ( d ) x j / j = 1 n x j
where wij(d) is spatial weight defined according to distance principle and xi and xj are variables in i and j zone, respectively. If Z(Gi*) is positive and statistically significant, the area will be a hotspot area, i.e., a large number of rural settlement patches accumulate in this area. If Z(Gi*) is negative and statistically significant, the area will be a cold spot area, i.e., rural settlement patches are sparsely dispersed in this area.

3.1.5. Spatial Association Model

In this paper, we proposed a model based on grids for exploring the spatial association between population and land resources and between population and water resources. ArcGis spatial overlay tool was used to obtain the distribution of spatial association.
K = S r u r a l   s e t t l e m e n t s / S c u l t i v a t e d   l a n d
L = S r u r a l   s e t t l e m e n t s / H h y d r o g r a p h i c   n e t w o r k
where Srural settlements is the area of settlements in each grid, Scultivated land is the area of cultivated land in each grid and Hhydrographic network is the length of the hydrographic network in each grid. A larger K value indicates that there is a lack of cultivated land in the grid and the conflict between population and land resources is serious. On the contrary, a smaller K value suggests that there is enough arable land in the grid and the conflict between population and land resources is not evident. Relevant research shows that under the strong control and guidance of the hydrographic network in the arid oasis area, the length and density of the hydrographic network are closely related to the water supply [40,43]. The water supply of the hydrographic network determines the size of irrigated land, which then also determines the carrying capacity of the population. Therefore, a larger L value indicates that the density of the hydrographic network is low and the water supply is inadequate in the grid but rural settlement size is larger and cannot be carried by water supply of the hydrographic network, the conflict between population and water resources is violent. Otherwise, a smaller L value means that the density of the hydrographic network in the grid is high and the water supply is adequate in the grid, rural settlement size is smaller and can be carried by water supply of the hydrographic network, the conflict between population and water resources is not evident.

3.2. Data Sources

The data came from four sources. (1) Basic maps. Topographic map (1:250,000) of Shandan County and vector administrative boundaries (1:250,000) were provided by Gansu Province Bureau of Surveying and Mapping. (2) Land-use vector data. Survey data of land use in Shandan County in 1998 and 2008 were provided by Gansu Province Land and Resources Department. Detailed survey data of land use in Shandan County in 2015 were provided by Shandan County Land Bureau. (3) Statistical data of social economy. Data such as population, GDP, tourism output of Shandan County in 1998–2015 were from statistical yearbook of Zhangye City (Zhangye Municipal Bureau of Statistics), National economic statistics of Shandan County, statistical yearbook of Shandan County (Shandan County Bureau of Statistics) and Shandan County land web (http://sz.shandan.gov.cn/). (4) Specify surveys information. Using participatory survey method and interview method, we interviewed 14 villages and 174 people, mainly collected data about the form, structure, pattern and evolution of rural settlements in Shandan County and local farmers’ perception about the factors influencing rural settlement evolution by two field studies in July 2015 and June 2016, respectively (Table 1).

4. Results and Discussion

4.1. Temporal Change of Layout of Rural Settlements in Shandan County

4.1.1. Temporal Change of the Indices of Rural Settlement Pattern

ArcGIS10.2 was used to extract the vector data of rural settlement distribution in 1998, 2008 and 2015 from the land-use vector data (Figure 2).The indices of rural settlement pattern such as CA, NP, MPS, MINP, MAXP and PD were chosen for comparative analysis (Table 2).
The indices of rural settlement pattern in Shandan County change more rapidly from 1998 to 2008 than from 2008 to 2015 (Table 2 and Figure 2). Rural settlement pattern tends to be stable in recent years. The CA increased by 38.99 hm2 from 1998 to 2008 with an average annual increase of 3.9 hm2 and increased by 315.2 hm2 from 2008 to 2015 with an average annual increase of 52.53 hm2. Thus, the CA changed more drastically in the second period. The CA accounts for only a small proportion of the county area. The proportion was 0.627% in 1998, 0.634% in 2008 and 0.692% in 2015, indicating a slowly rising trend. The NP changed significantly, especially in the first period, increasing by 2160 from 1998 to 2008. The ratio of the MAXP to the MINP was 10,697 in 1998, 1284.33 in 2008 and 11,986 in 2015. In 2008, the difference between the MAXP and the MINP reduced, while in 2015 this difference enlarged. The MPS in 1998 was large, about 4.46 hm2. In 2008 and 2015, however, the MPS was smaller, only accounting for 1/4 of that in 1998. The PD showed an overall increasing trend, especially from 1998 to 2008, increasing by 385.7%. The PD in 2008 was close to that in 2015.
The reasons for above changes areas follow. After 2000, the area of rural settlements in Shandan County expands rapidly. The distribution of rural settlements tends to be more dispersed, so the intensive degree of land use decreases. The increase in the NP leads to increase in the PD. In addition, the newly-formed rural settlement patches are often small and some large rural settlement patches might be broken into smaller ones. Thus, the MPS and the ratio of the MAXP to the MINP show a decreasing trend, indicate that the intensive degree of land use decreases. According to the specify surveys, the development of individual rural settlement is mainly in the form of expansion rather than the optimization of original structure, so the area of rural settlements expands, posing a huge threat to arable land resources.

4.1.2. Temporal Change of the Size of Rural Settlements

According to the areas (or sizes) of rural settlement patches in Shandan County, the rural settlements could be classified into four categories: solo settlements, small settlements, middle settlements and large settlements (Table 3). From 1998 to 2015, the numbers of solo and small settlements increased the most rapidly, by 751 and 1509, respectively. Notably, the increases in the numbers of solo and small settlements from 1998 to 2008 accounted for 91.5% and 93.1%, respectively. In addition, the total area of small settlements increased the most rapidly, by 441.05 hm2 from 1998 to 2015. The total area of solo settlements increased slightly, by 52.25 hm2 from 1998 to 2015. The number of middle settlements increased by 129 and their total area increased by 213.93 hm2 from 1998 to 2015. The number of large settlements decreased by 6 and their total area decreased by 353.04 hm2.
During the specify surveys, we found the following.
(1)
Shandan County entered a rapid developmental stage in 1998–2008, which was promoted by China’s rural development strategy and farmers’ own needs. During this period, the spatial structure of rural settlements changed greatly. After 2008, the rural development tended to be stable and the spatial structure of rural settlements did not change significantly.
(2)
Furthermore, the newly-formed settlements mainly include solo settlements and small settlements that are formed by several solo settlements close to each other. The area of such small settlement is smaller than 1 hm2. In addition, some large settlements could be divided into smaller ones. These lead to more solo and small settlements. In the past, the settlement area per household in Shandan County exceeded the standard value. Some farmers expanded the area of their settlements by building various buildings for production purpose. This promotes the formation of large settlements. Recently, because of the implementation of strategies such as New Countryside, Beautiful Countryside, New Rural Community, the area of household is restricted by government regulation and the buildings built temporarily for production or living purpose are demolished to optimize the layout of rural settlements and promote intensive land use.

4.1.3. Temporal Change of Dispersion Degree of Rural Settlements

Using 1 km × 1 km grids, we obtained the dispersion degree of rural settlements in 1998, 2008 and 2015 (Table 4 and Figure 3). In general, the dispersion degree of rural settlements increased from 1998 to 2008 and tended to be stable after 2008. The number of grids with rural settlements increased from 538 in 1998 to 727 in 2009 (by 35.13%) and increased by only 3.3% from 2008 to 2015. In 1998, the proportion of grids in which the dispersion degree of rural settlements is lower than 10 was 99.63% and decreased to 87.62% in 2008. Consequently, the proportion of grids in which the dispersion degree was higher than 10 increased by 12.02% from 1998 to 2008. In addition, the number of grids in which the dispersion degree is in the range of 0–5 decreased slightly (by 4.09%) from 1998 to 2008. However, the proportion of such grids decreased significantly, from 95.35% in 1998 to 67.68% in 2008. The number and proportion of grids in which the dispersion degree was higher than 6 increased. Especially, the number and proportion of grids in which the dispersion degree was in the range of 6–10 increased the most significantly, from 23 and 4.28% in 1998 to 145 and 19.94% in 2008. According to the field investigation results, the dispersion degree of rural settlements increased is caused by the formation of solo settlements (≤0.1 hm2) and small settlements as well as the division of large settlements into smaller ones. Thus, rural settlements tend to be more dispersed.
The reasons for the changes are as follows. Obstructed by the urban-rural dual security system (urban and rural have different social security systems, the urban security system has an impact on the entry of farmers), farmers found it hard to live and work in cities and towns. This has boosted the farmers’ demand for housing construction in rural areas, also resulted in a large-scale contiguous expansion and sporadic dispersion of rural settlements in space. Furthermore, driven by outside interests, the income of farmers increased is caused by a large number of invisible unemployed rural laborers turned to urban areas. The first wave of funds brought by farmers have encouraged the redevelopment of rural areas and expanded the number and area of cultivated land and settlement.

4.2. Spatial Differentiation of Rural Settlements in Shandan County

4.2.1. Spatial Differentiation of the Kernel Density

Feature to Point tool of Arc GIS10.2 was used to obtain the central points of rural settlement patches in 1998, 2008 and 2015. Using Kernel methods and 400-m search radius, the kernel density of rural settlements in 1998, 2008 and 2015 were obtained (Figure 4).
(1)
The kernel density of rural settlements in 1998, 2008 and 2015 are basically consistent. Rural settlements concentrate along Lanxin Railway, State Road 312 line, Lianhuo Highway and major canals. Then, the kernel density of rural settlements decreases in the direction away from these main roads and canals.
(2)
The position of settlement-intensive regions with kernel density larger than 2patches/km2 and the concentration degree change. In 1998, the settlement-intensive regions were relatively dispersed and distributed along major roads and canals. They were Wudun Village, Dazhai Village, Xiaozhai Village, Dongwan Village, Weiqi Village and Xiguan Village. In 2008 and 2015, the settlement-intensive regions were more concentrated and distributed around county seat (i.e., Qingquan Town).
(3)
The number and area of settlement-intensive regions changed from 1998 to 2015. In 1998, there were eight settlement-intensive regions and the area of each was relatively small. In 2008 and 2015, there were only three settlement-intensive regions and the area of each was relatively large. The areas of settlement-intensive regions in 2015 were especially large.
(4)
In 2008 and 2015, the number of regions with kernel density in the range of 0–2 patches/km2 increased obviously compared with that in 1998and their distribution tended to be more dispersed.

4.2.2. Spatial Differentiation of Hotspots and Coldspots

Hotspot detection tools were used to obtain the distribution of hotspots in Shandan County in 1998, 2008 and 2015 (Figure 5). Patch area was taken as the statistical attributes. A hotspot is a zone in which rural settlements are highly concentrated. A coldspot is a zone in which rural settlements are sparsely distributed. The results are as follows.
(1)
The spatial differentiation of hotspots and coldspots is evident. The north region of Shandan County is where hotspots concentrated and the south region of Shandan County is where coldspots concentrated.
(2)
From 1998 to 2008, the hotspot and coldspot zones expanded, especially hotspot zone. Hotspots distributed closely to county seat and oasis areas along Lanxin Railway, State Road 312 Line, Lianhuo Highway and major canals. The expansion of hotspot zones is because more settlement patches are formed and the construction of infrastructure such as highway makes the dispersed settlement patches more concentrated. The expansion of coldspot zones is due to the implementation of policies such as New Rural Construction, which leads to the decrease in the scale of rural settlement patches.
(3)
From 2008 to 2015, the distribution of hotspots did not change significantly, whereas that of coldspots changed greatly. The size of rural settlement patches and cultivated land area expanded, so rural settlement patches tended to be more concentrated. This leads to the smaller area of coldspot zone.
(4)
Combining the results of kernel density and hotspot detection, we can see that large-scale rural settlements densely distribute in some regions and small-scale rural settlements sparsely distribute in other regions of Shandan County.

4.2.3. Spatial Differentiation of Dispersion Degree

Rural settlements tended to be more dispersed from 1998 to 2015. In 1998, rural settlements in Shandan County were relatively concentrated and 95.35% of the grids with rural settlements had a dispersion degree below 5.0. In the north region of Liqiao township, the grids with rural settlements had a relatively higher dispersion degree and there were a large number of rural settlements that were densely distributed in this region. In 2008 and 2015, rural settlements tended to be more dispersed and grids in which the dispersion degree was above 6.0 increased by 27.68% and 29.3%, respectively. In some region, there were grids in which the dispersion degree was even above 21, accounting for 1.52% and 1.59% in 2008 and 2015, respectively. From 1998 to 2008, the number of grids in which the dispersion degree was in the range of 6–10 increased in regions around county seat. In Chenhu town, Liqiao township, Huocheng town and Damaying town which were at the south of county seat, there were more grids with dispersion degree in the ranges of 6–10 and 11–20. From 2008 to 2015, the number of grids with dispersion degree in the range of 11–20 increased around county seat but the dispersion degree of rural settlements in other towns did not change significantly.
During the specify surveys, it was found that there is a lack of scientific planning of the layout of rural settlement in Shandan County. The area of land for use expands outward but the efficiency of land use is relatively low. After 1998, population in Shandan County increased. The relationship between population and land resources in rural areas changed. The land within the effective farming radius cannot support the increasing population. In order to increase income, villagers began to cultivate new land, so cultivated land area expanded outward. Consequently, rural settlements expanded outward, leading to the dispersion, hollowing and chaos of rural settlements.

4.3. Spatial Association between Rural Settlements and Water and Land Resources in Shandan County

The rural settlements and their spatial distribution are affected by both natural and anthropogenic factors. Generally, rural settlements in hilly area are affected more by natural factors such as altitude, slope degree and slope direction, whereas rural settlements in plain oasis area are affected more by anthropogenic factors such as transportation, the hydrographic network, cultivated land. These factors will affect the location, structure and pattern of rural settlements. Shandan County is a typical plain oasis area, so its spatial layout should be affected more by cultivated land and the hydrographic network. Since there is almost no natural hydrographic network in Shandan County, the artificial hydrographic network was chosen for study.

4.3.1. Spatial Association between Rural Settlements and Land Resources

K values were calculated for the relationship between rural settlements and land resources in different situations. According to the agricultural land area per capita worldwide (1920 m2) and construction land area per capita worldwide (83 m2), the K value was calculated to be 0.04below which the conflict between rural settlements and land resources will not exist. According to the lower limits of agricultural land area per capita (533.3 m2) predetermined by Food and Agriculture Organization and construction land area per capita in rural areas (150 m2) predetermined by Chinese government for the New Urbanization strategy, the K value was calculated to be 0.28 above which there will be a conflict between rural settlements and land resources. If K < 0.04, the conflict between rural settlements and land resources does not exist, meaning there are less people and enough and resources. If 0.04 < K < 0.28, there would be a balance between rural settlements and land resources. If K > 0.28, the conflict between rural settlement and land resources exists and is violent, meaning there are a large population but limited land resources. Note that K = 88 indicates that there are settlements but no cultivated land in the grid, so the conflict between rural settlement and land resources exists and is violent. K = 99 indicates that there is cultivated land but no settlements in the grid, so the conflict between rural settlement and land resources does not exist.
Using coupling relationship model, K values were calculated and the number of grids with different K values were counted (Table 5). The distribution of grids with different K values was also presented (Figure 6).The results are as follows.
(1)
Note that the distribution of rural settlements in Shandan County is closely related to that of cultivated land. In 1998, the conflict between rural settlement and land resources was evident. In 2008 and 2015, the conflict between rural settlement and land resources became less evident.
(2)
In 1998, the conflict between rural settlement and land resources existed in Dongle town and regions along major roads and canals in the south of county seat. In other towns, the relationship between rural settlement and land resource varied. In 2008 and 2015, there was a balance between rural settlements and land resources in Dongle town and in regions around county seat. In Chenhu town and Weiqi town in the middle of Shandan County, the conflict between rural settlement and land resources almost did not exist. In Damaying town at the south of Shandan County and Huocheng town near the boundary of Shandan County, the conflict between rural settlement and land resources still did not exist. The conflict between rural settlement and land resources in 2008 and 2015 have weakened compared with 1998.
(3)
The conflict between rural settlement and land resources in Shandan County was the most violent in 1998 and the proportion of grids with K > 0.28 even reached 42.01%. In Dongle town, the conflict between rural settlement and land resources was especially severe. In other towns, the conflict between rural settlement and land resources did not exist in most regions. After 2008, the conflict between rural settlement and land resources became less violent and the total number and proportion of grids with K > 0.28 or K = 88 decreased. In 2015, the total proportion of grids with K > 0.28 or K = 88 decreased to 18.89% and these grids distributed in regions around county seat, in Damaying town at the south of Shandan County and in Huocheng town near the boundary of Shandan County.
(4)
In 1998, the distribution of rural settlements was consistent with that of cultivated land. After 2000, villagers began to cultivate new land, so there were more than 30% grids with K = 99. Note that rural settlements also tend to be more dispersed, which is related to the expansion of cultivated land area.

4.3.2. Spatial Association between Rural Settlements and the Hydrographic Network

Irrigation area in Shandan County is the main area that uses water. Currently, there are four irrigation areas in Shandan County: Huocheng, Laojun, Mayinghe and Sigou. Irrigation is mainly achieved by the hydrographic network, which is also the controlling factor for the spatial layout of cultivated land and rural settlements.
Different L values indicate different relationships between rural settlements and water resources. If L < 0.1, there is no conflict between rural settlements and water resources, meaning the hydrographic network can support the population. If 0.1 < L < 1, there is a balance between rural settlements and water resources. If L > 1, the conflict between rural settlements and water resources exists, meaning the hydrographic network cannot support the population. Note that L = 88 indicates that there are rural settlements but no hydrographic network in the grid, so the conflict between rural settlements and water resources exists. L = 99 indicates that there is the hydrographic network but no rural settlement in the grid, so the conflict between rural settlements and water resources does not exist. Using coupling relationship model, L values were calculated and the number of grids with different L values were counted (Table 6). The distribution of grids with different L values was also presented (Figure 7). The results are as follows.
(1)
Note that rural settlements distribute along the hydrographic network. The proportion of grids with L values in the range of 0–0.5 was 78.81% in 1998, 91.51% in 2008 and 89.75% in 2015, indicating there is almost no conflict or a balance between rural settlements and water resources. The spatial layout of the hydrographic network determines that of rural settlements and cultivated land.
(2)
Notably, there is spatial difference in L values. In regions around county seat, the conflict between rural settlements and water resources exists. In regions at the northwest of county seat, there is a balance between rural settlements and water resources. In regions at the south of county seat, the conflict between rural settlements and water resource does not exist.
(3)
According to specify surveys, rural settlements, cultivated land and the hydrographic network are mutually dependent on each other. After 2000, the expansion of cultivated land area leads to the expansion of the hydrographic network. The expansion rates of cultivated land and the hydrographic network are higher than that of rural settlements. Thus, there were 43.86% grids with the hydrographic network but without rural settlements in 2008. The amount of water supplied (in fact, it should be water distribution amount) by the artificial hydrographic network determines the irrigation area. The direction of the hydrographic network determines the direction in which irrigation area expands and further affects the size and spatial layout of rural settlements.

5. Conclusions

We analyzed the temporal-spatial differentiation of the rural settlement patterns in Shandan County using 1 km × 1 km sq. grids, GIS quantitative analysis, grid analysis, spatial hotspot detection and spatial association model. Further, we studied the spatial association between rural settlements and water and land resources. The conclusions are as follows.
(1)
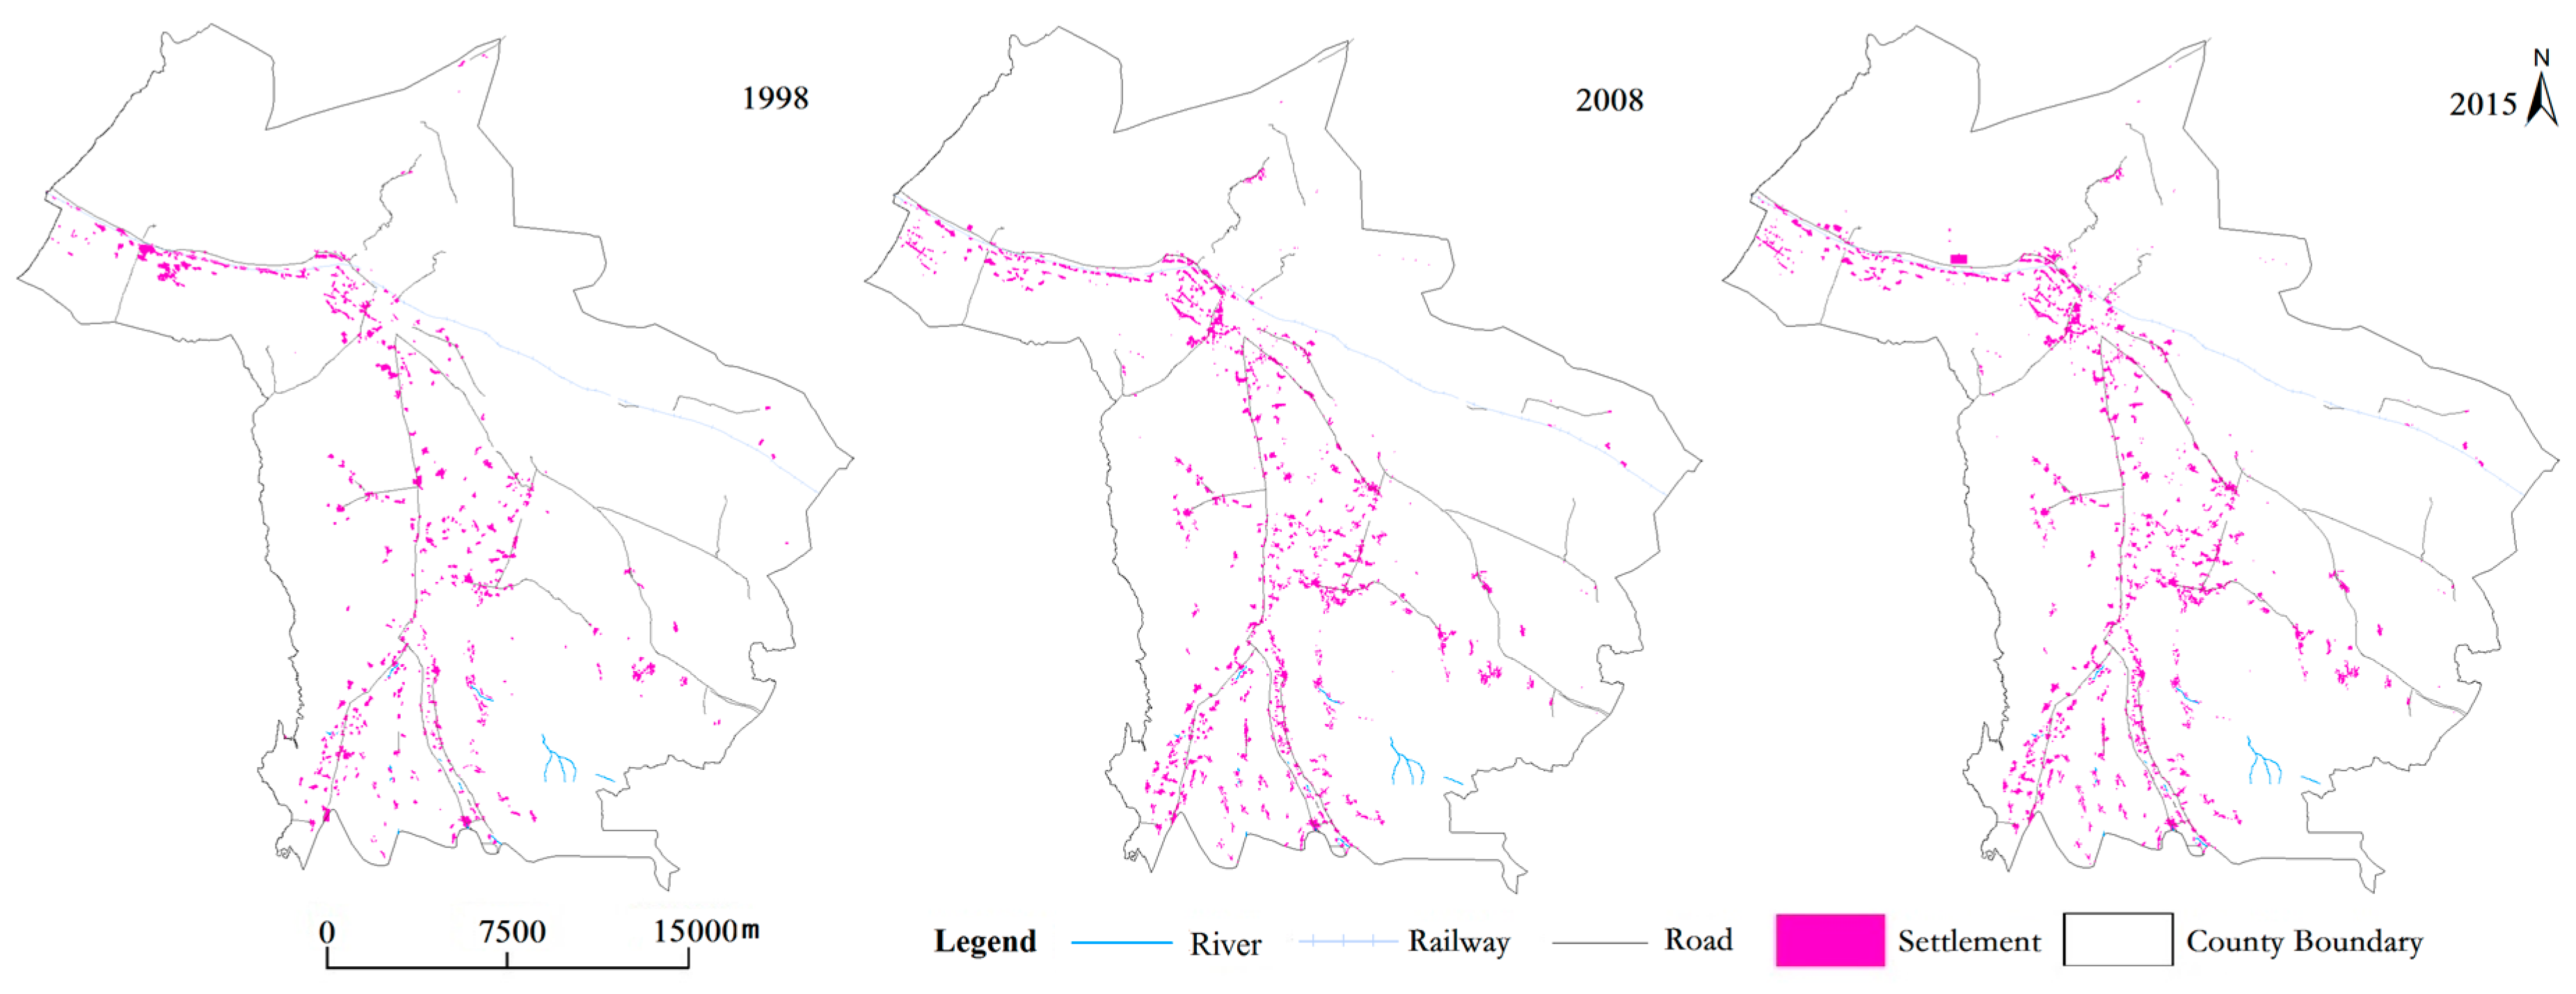
On the time scale, the total area of rural settlements in Shandan County expanded rapidly and the rural settlements tended to be more dispersed from 1998 to 2015. The increase in the number of rural settlement patches led to a higher density and a smaller average area of rural settlement patches. The CA, NP, MPS, MAXP, MINP and PD changed more rapidly from 1998 to 2008 than from 2008 to 2015. In the second period, the indices mentioned before did not change significantly. The formation of new small settlements and the division of large settlements contributed to the increase in the number of solo and small settlements.
(2)
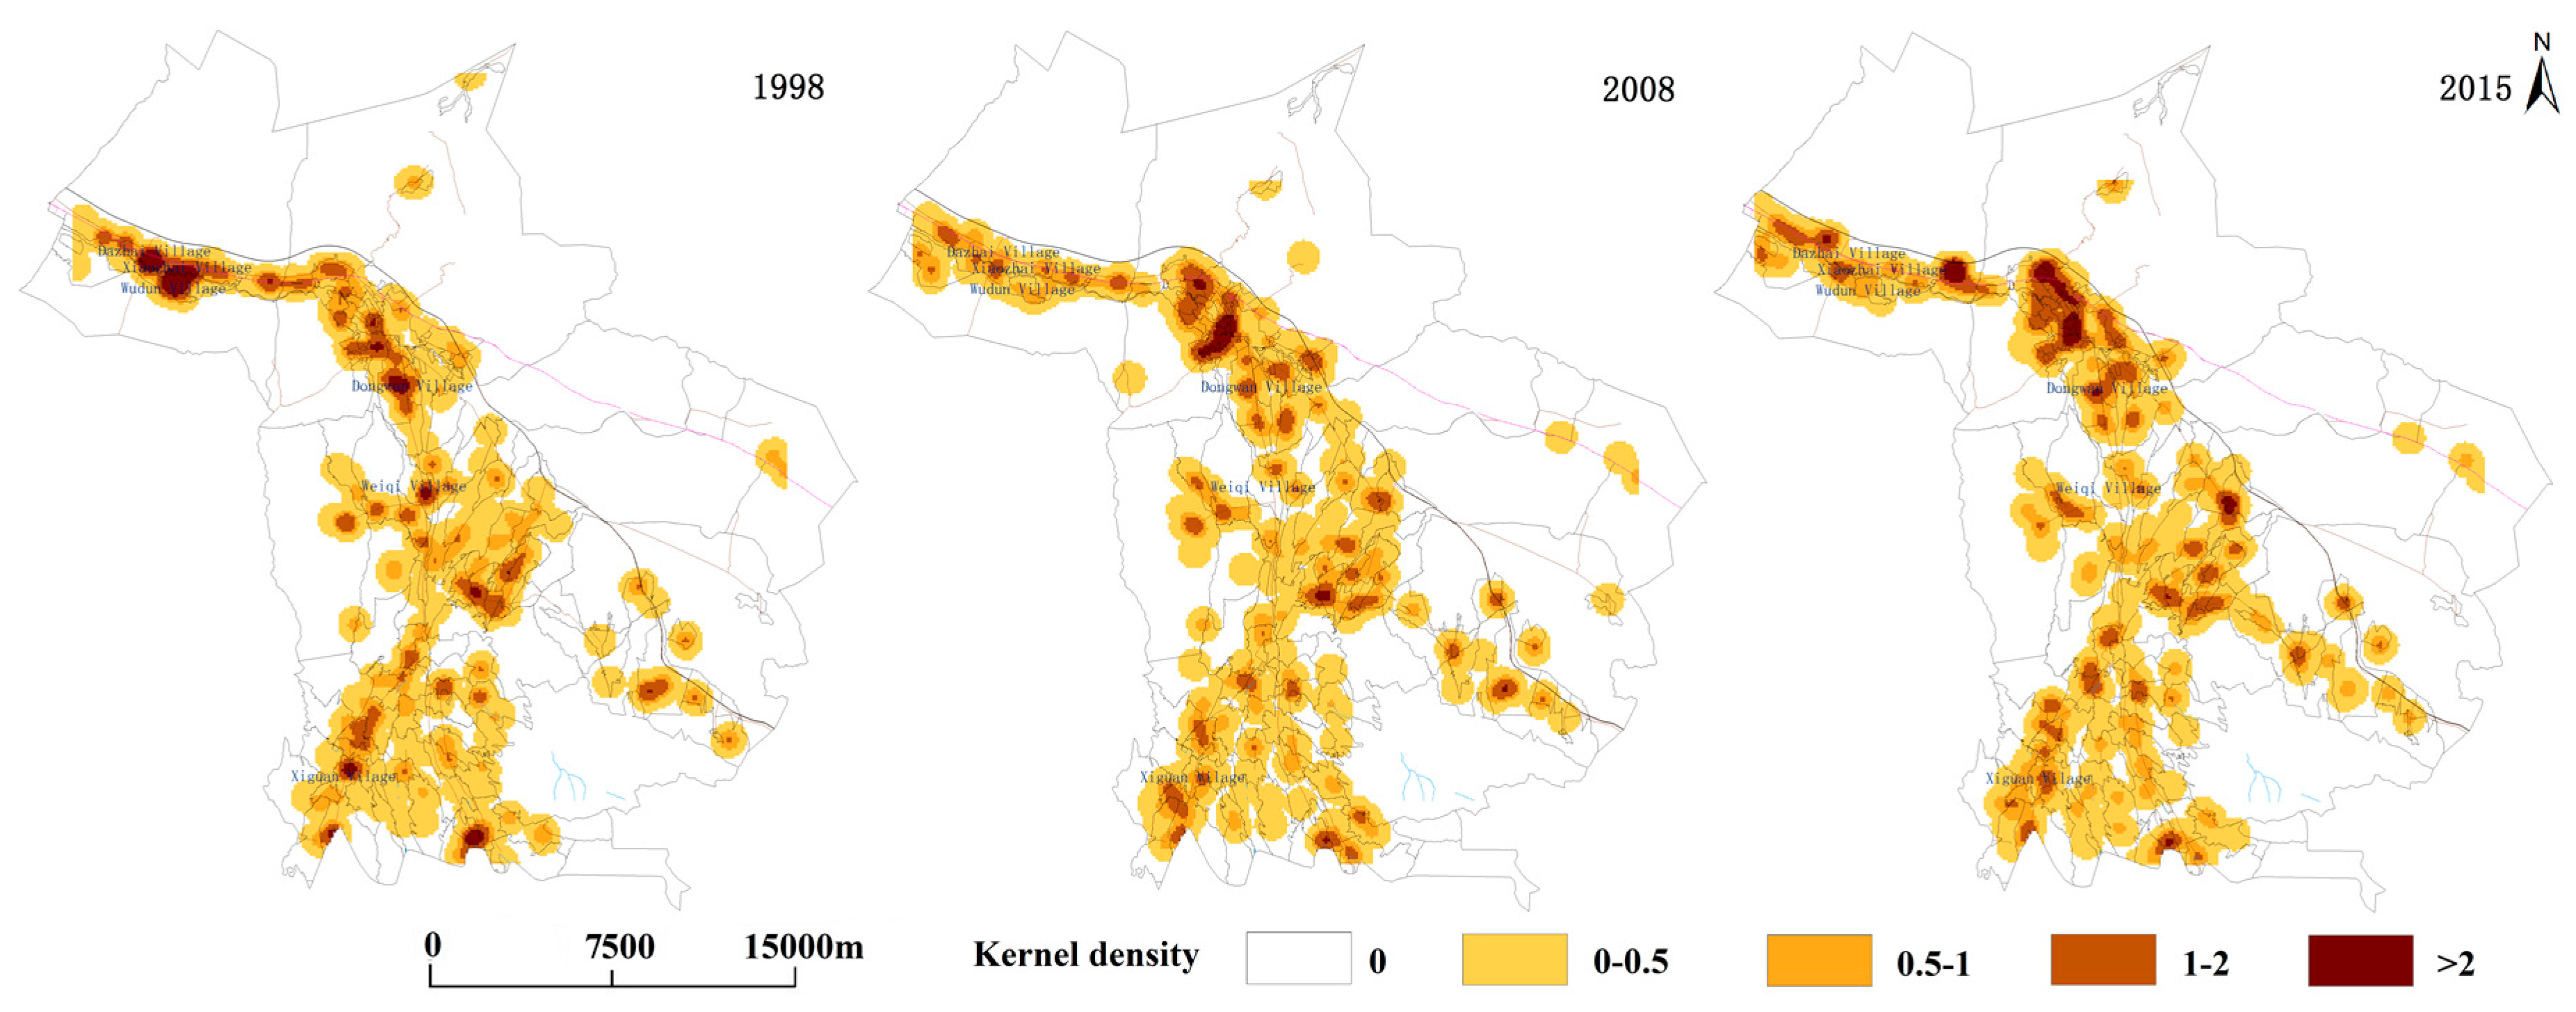
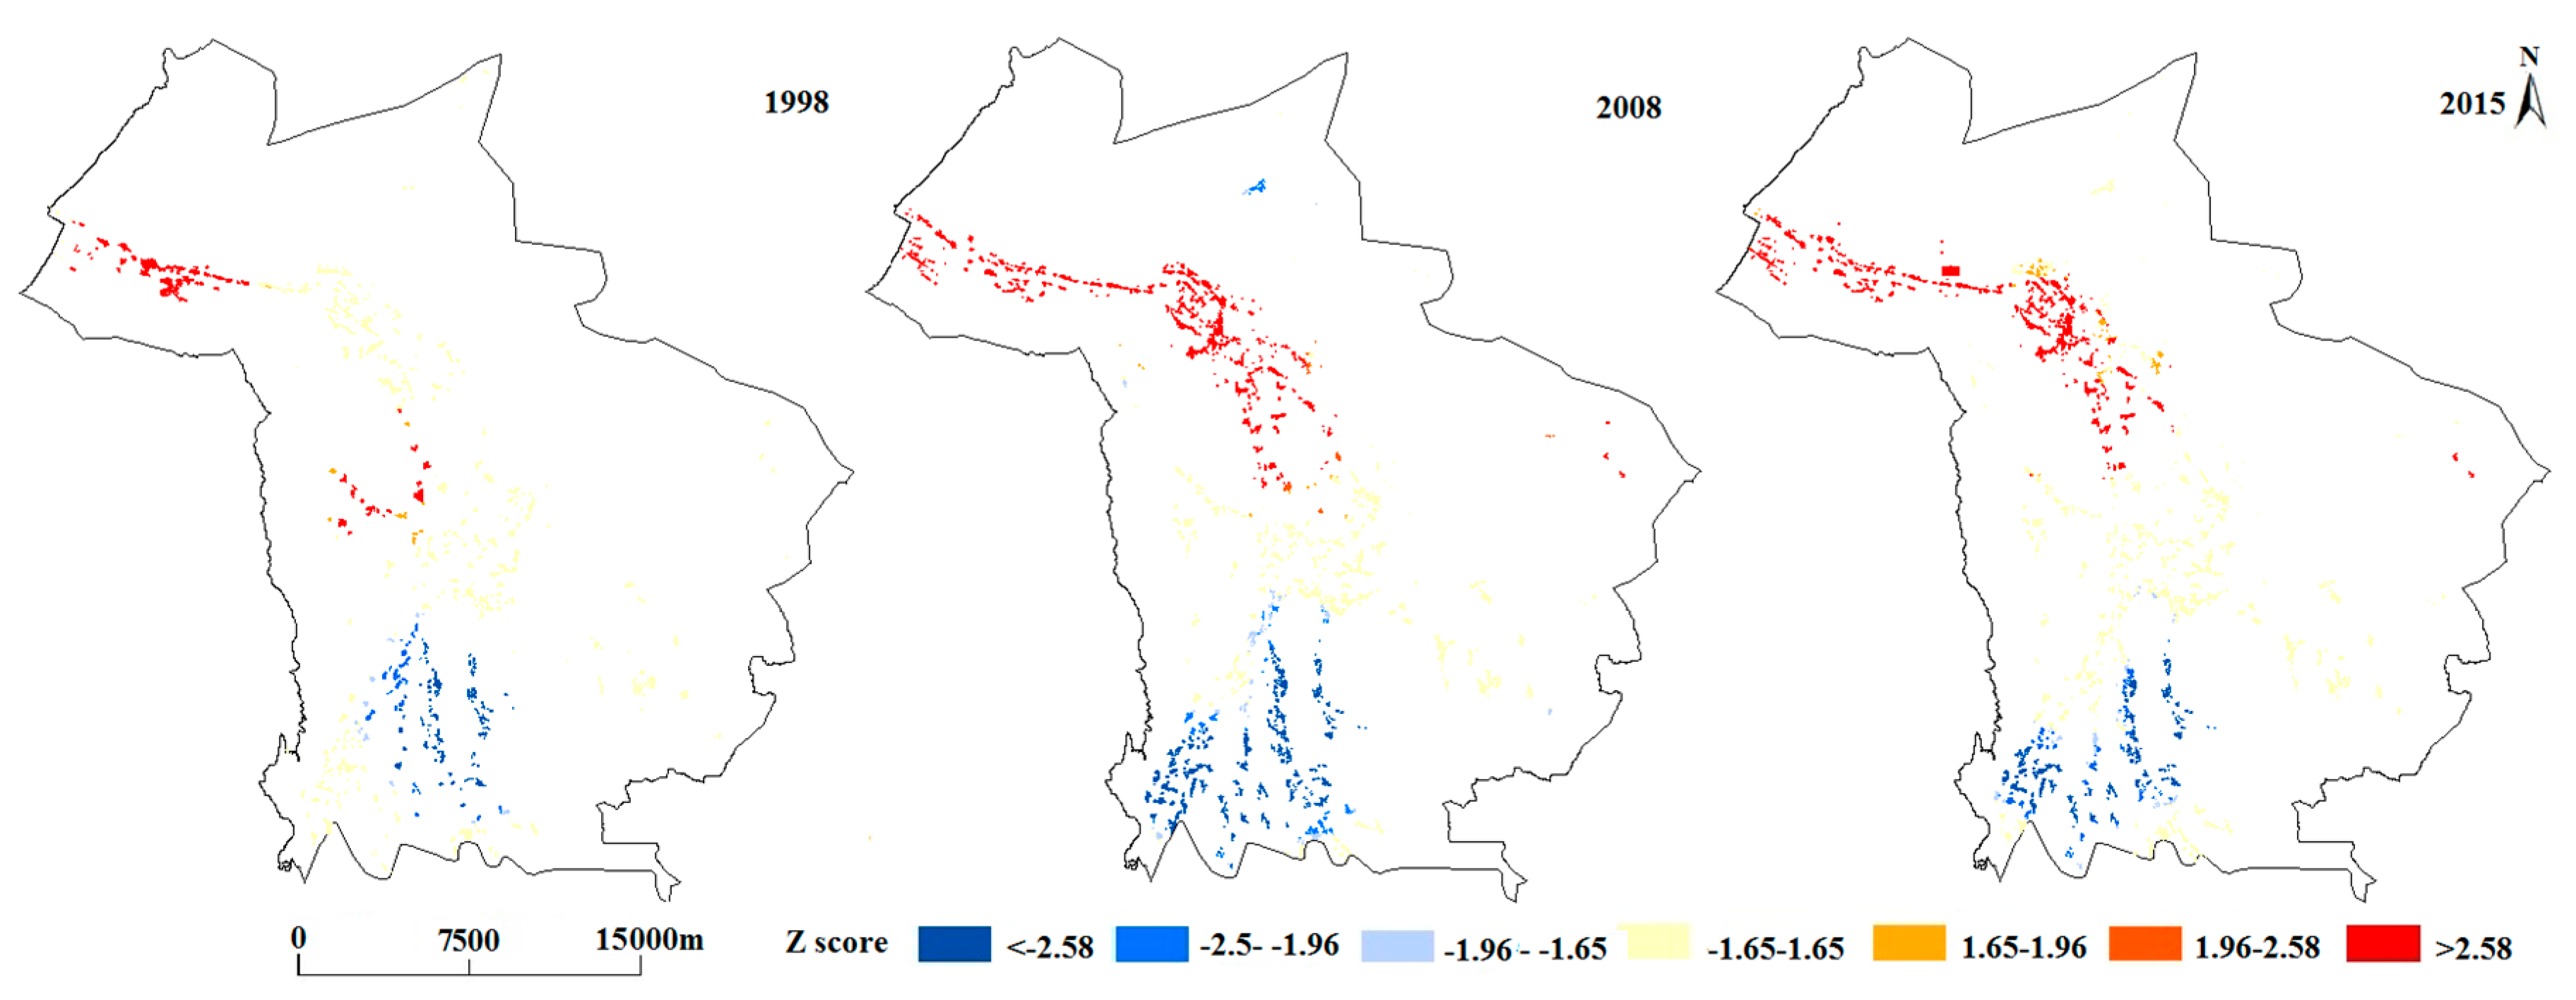
On the spatial scale, the kernel density of rural settlements in 1998, 2008 and 2015 are basically consistent. Rural settlements mainly distribute along major roads and the hydrographic network and then the kernel density of rural settlements decreases in the direction away from these roads and the hydrographic network. In 1998, the settlement-intensive regions were relatively dispersed. The number of such regions was large but the area of each was small. In 2008 and 2015, the settlement-intensive regions were more concentrated. Their number decreased but the area of each increased. In addition, there is spatial difference in the distribution of hotspots and coldspots. In other words, large-scale rural settlements densely distribute in some regions and small-scale rural settlements sparsely distribute in other regions of Shandan County. From 1998 to 2008, the hotspot zone and coldspot zone expanded. From 2008 to 2015, the hotspot zone did not change significantly, whereas the area of coldspot zone decreased significantly.
(3)
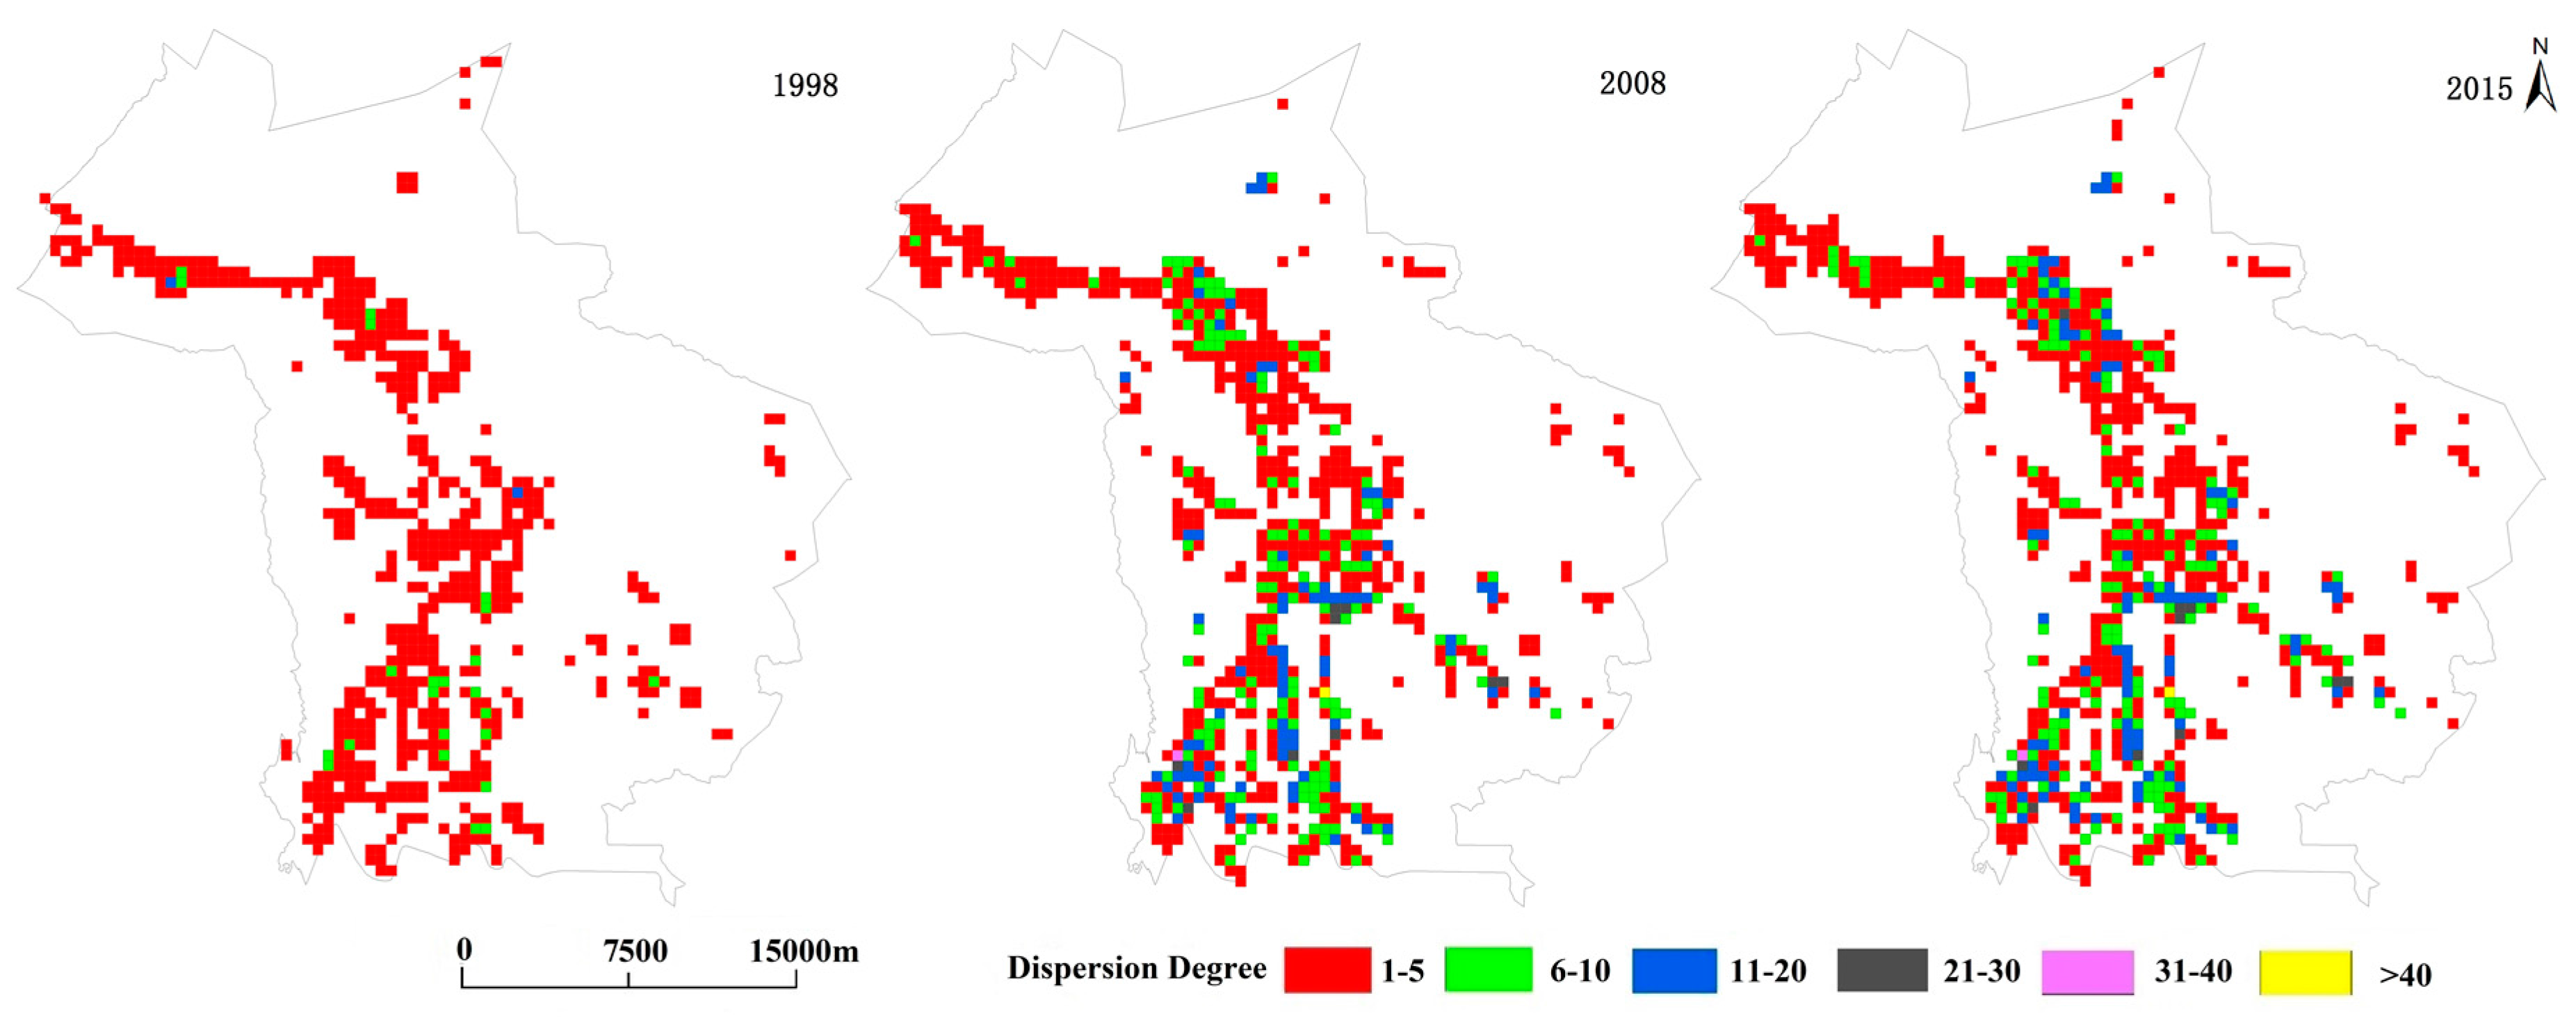
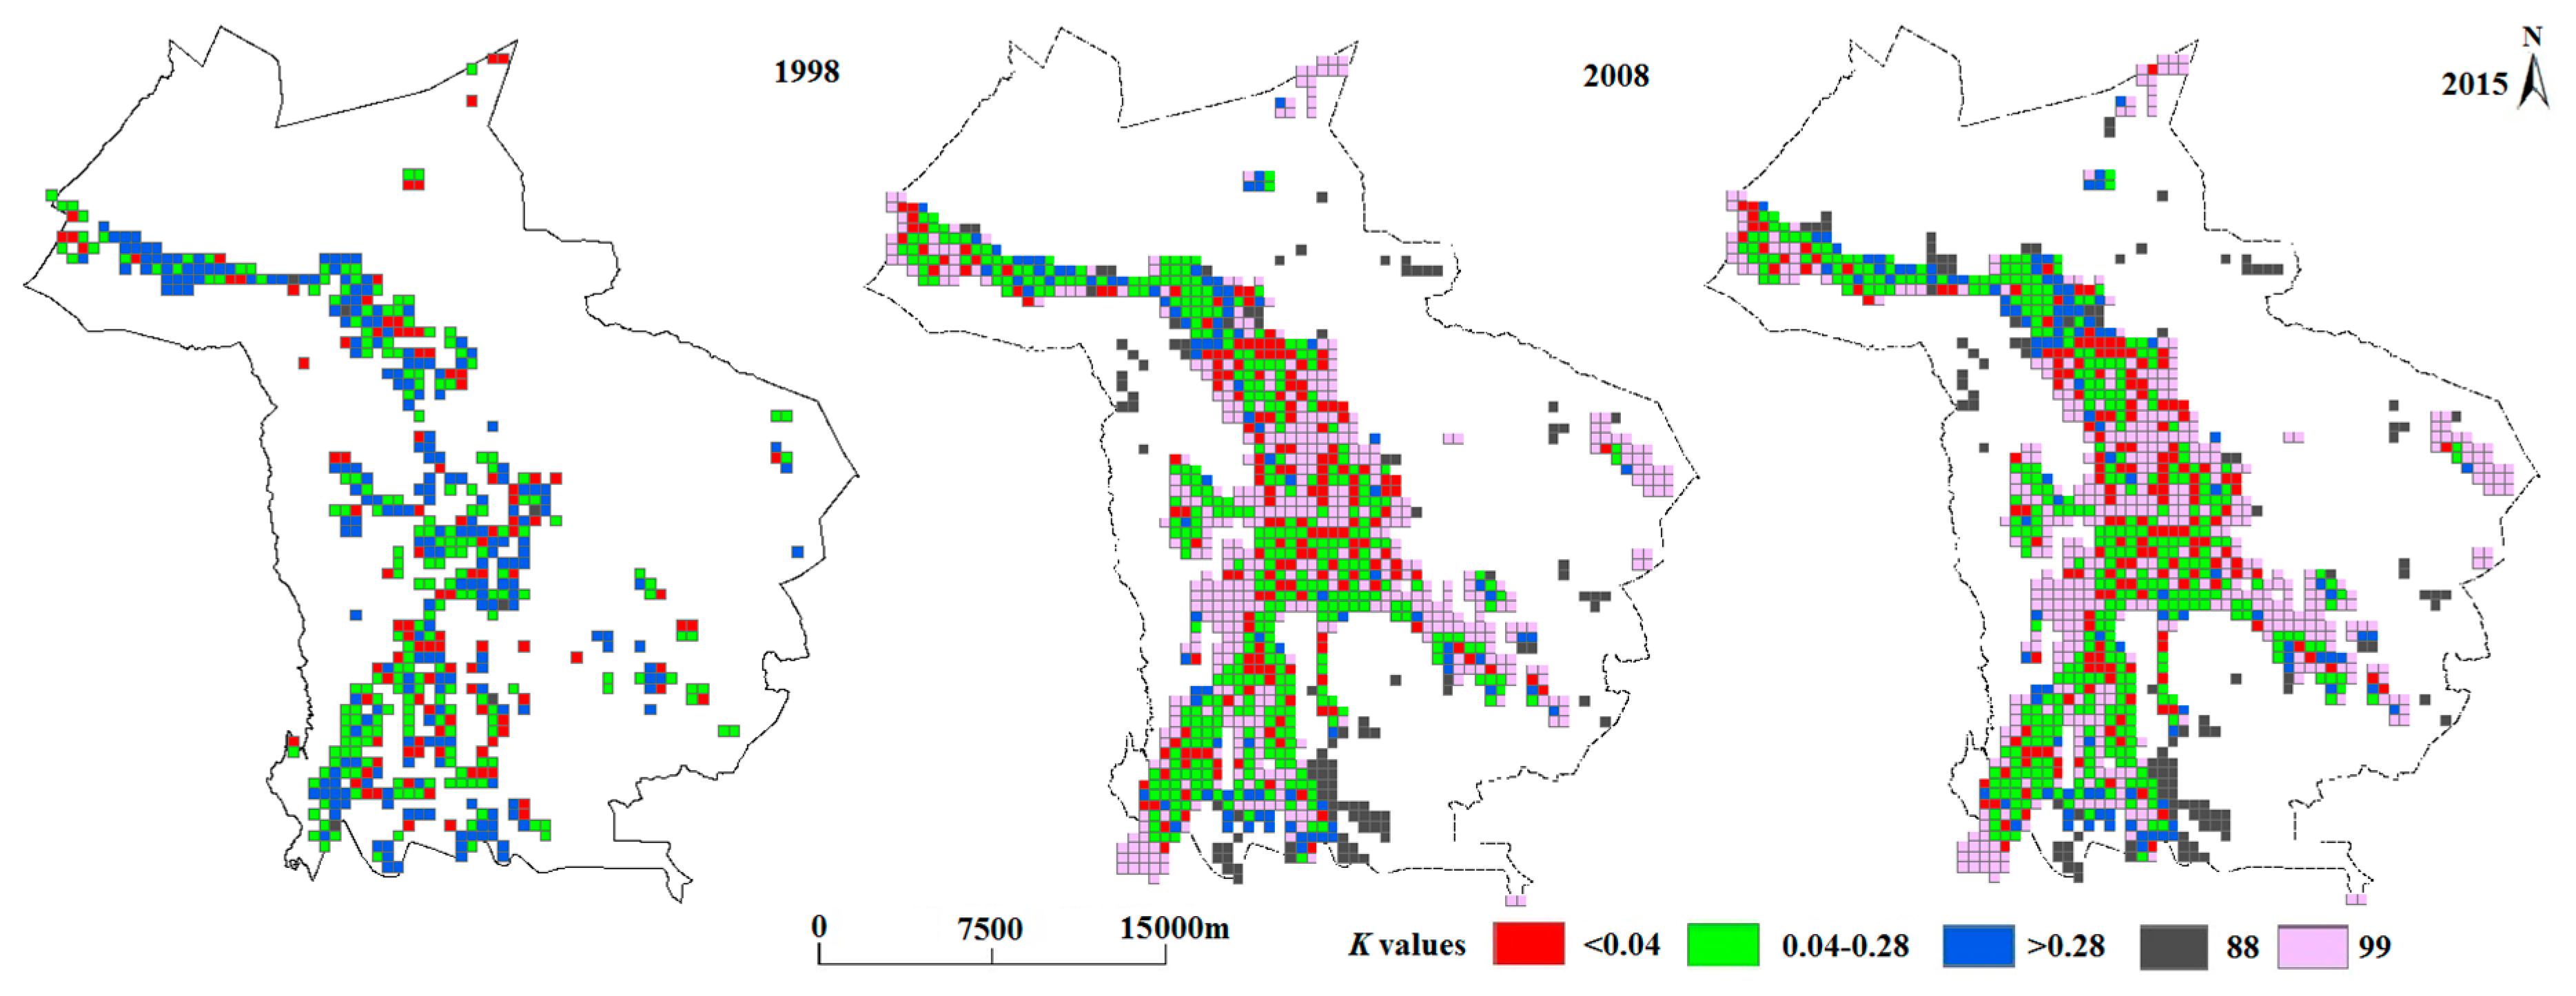
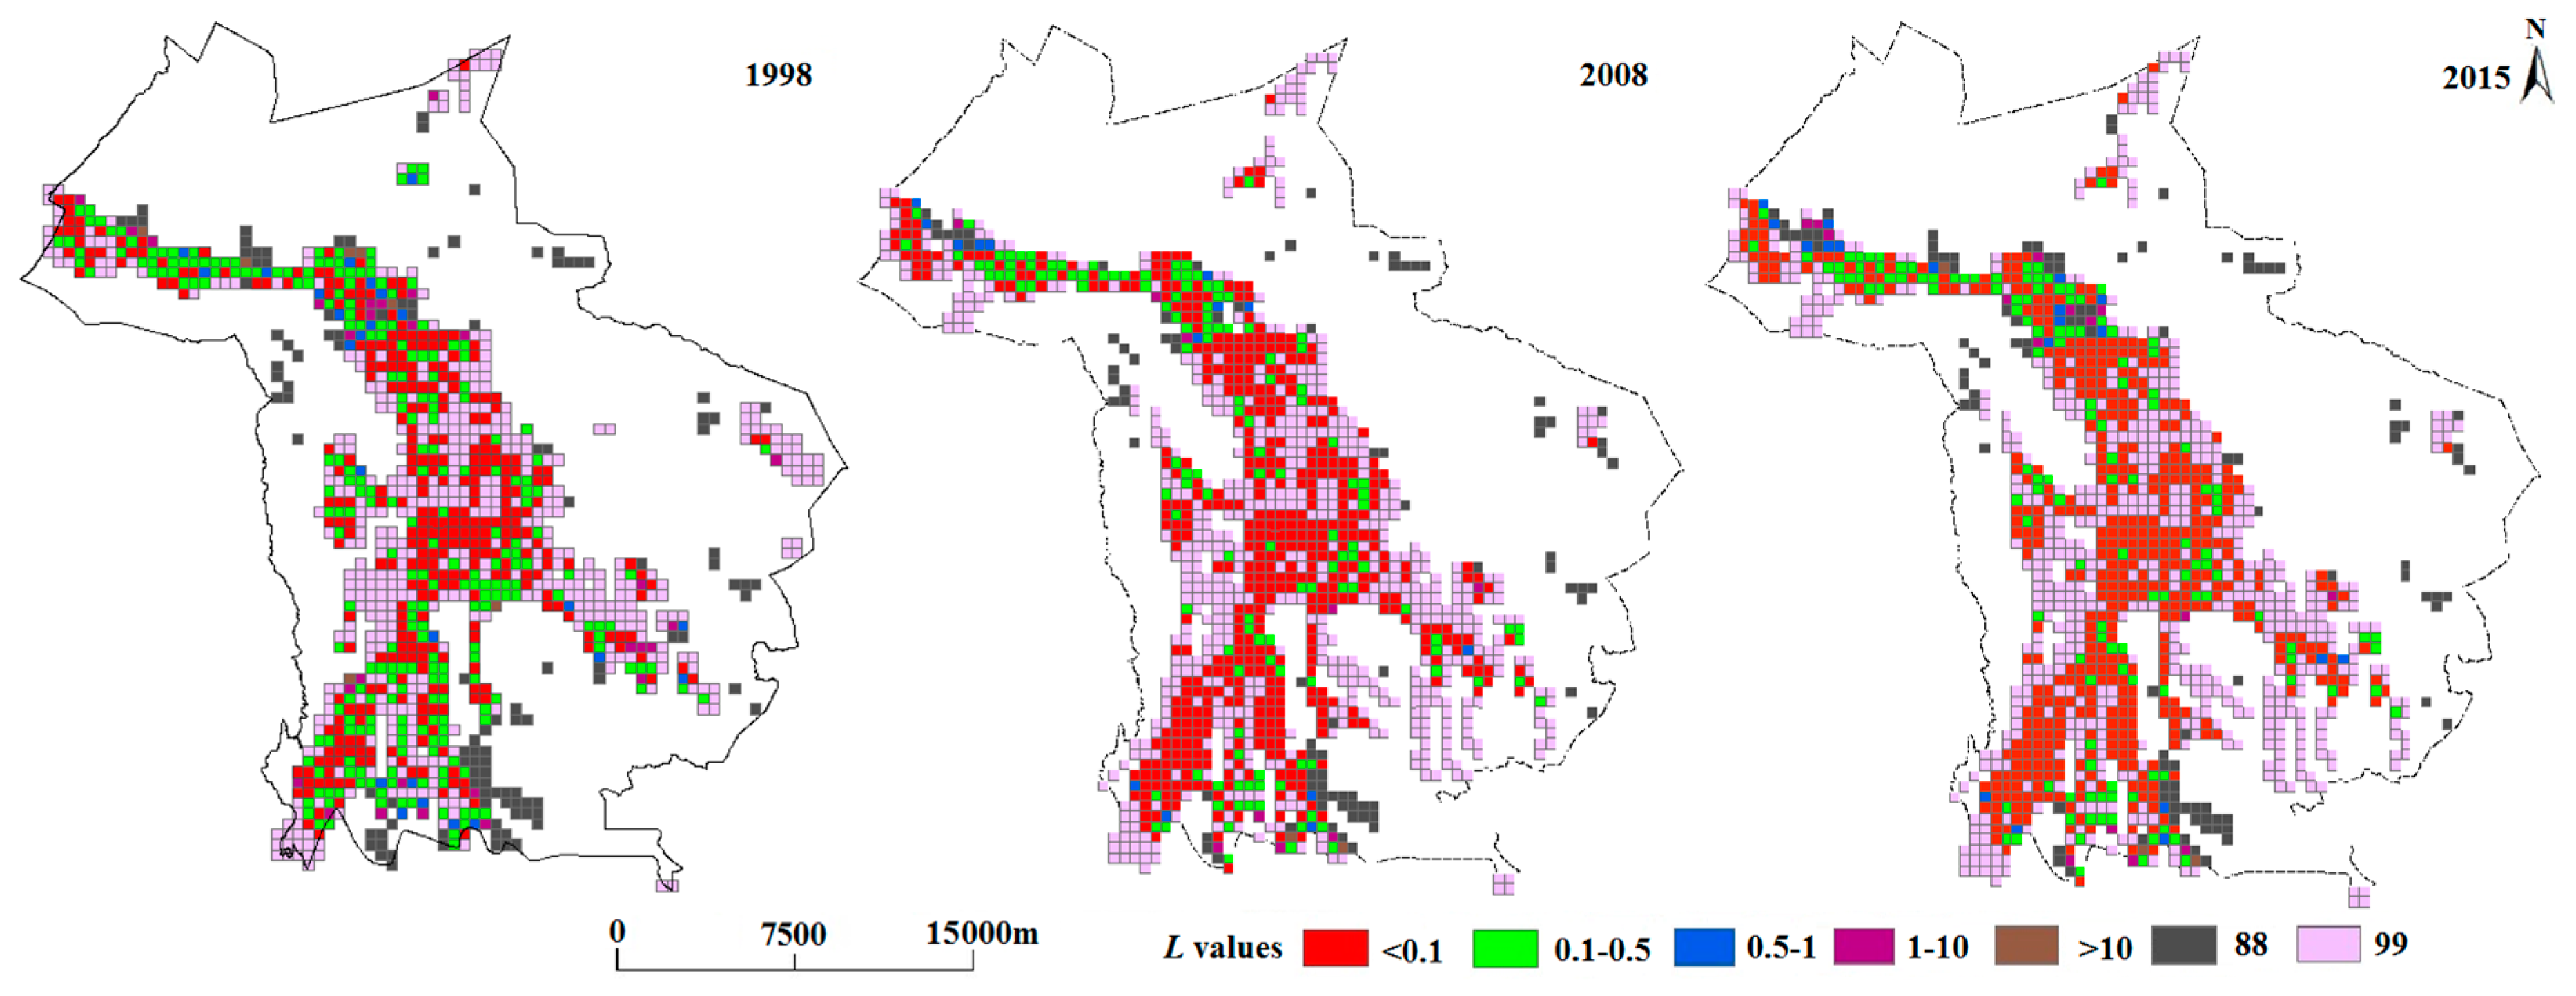
From 1998 to 2008, the dispersion degree of rural settlements increased. After 2008, the dispersion degree of rural settlements tended to be stable. In 1998, rural settlements in Shandan County were relatively concentrated and there were 95.35% grids in which the dispersion degree of rural settlements was below 5.0. In 2008 and 2015, rural settlements tended to be more dispersed and the proportion of grids in which the dispersion degree was above 6.0 increased to 27.68% and 29.3%, respectively. There were even grids in which the dispersion degree was above 21 and they accounted for 1.52% in 2008 and 1.59% in 2015. These lead to the dispersion, hollowing and disorder of rural settlements in Shandan County.
(4)
The spatial distribution of rural settlements in Shandan County is closely related to that of cultivated land and the hydrographic network from 1998 to 2015. It can be expressed in three kinds of spatial relationships: conflict, balance and no conflict. There is a conflict between rural settlement and land resources and the conflict in 2008 and 2015 has weakened compared with 1998. In contrast, there is almost no conflict or a balance between rural settlements and water resources from 1998 to 2015.After 2000, the expansion of cultivated land led to the expansion of the hydrographic network. The expansion rates of cultivated land and the hydrographic network were higher than that of rural settlements. Thus, there were 37.33% grids with cultivated land but without settlements and 43.86% grids with the hydrographic network but without settlements in 2008, this is the main reason for the conflict decreased between rural settlement and land and water resources.
This paper can provide a systematic framework for the theoretical and empirical research on the rural settlements in oasis at a micro scale. Different from the conventional comprehensive evaluation of the temporal-spatial distribution of rural settlements, we choose water and land resources, which are the most basic constituents of oasis, as the controlling factors for the development of rural settlements. We then explored the spatial association between rural settlements and water and land resources. Finally, we revealed the driving force of the spatial-temporal evolution of rural settlement patterns at a micro scale. This study can help guide the rural planning in oasis, promote intensive land utilization and lessen the conflict between rural settlements and water and land resources. Then, sustainable development and rural revitalization in China can be achieved. However, the study has not thoroughly and systematically discussed the essence of the spatial-temporal evolution of rural settlements in different periods and has not pointed out a direction for the spatial reconstruction of rural settlements in the future. Therefore, we will systematically analyze the evolution and driving mechanism of rural settlements under the background of rural economic and social transformation in future study. In addition, we will try to explore the spatial reconstruction of rural settlements in oasis so that a balance between land resources and population in oasis can be achieved.

Acknowledgments

This work was supported by the National Natural Science Foundation of China (Grant No. 41661105).

Author Contributions

Libang Ma and Xiaodong Guo designed the study and processed the data. Yaya Tian, Yongli Wang and Meimei Chen gave comments on the manuscript. All authors Contributed to the results, related discussions and manuscript writing.

Conflicts of Interest

The authors declare no conflict of interest.

References

  1. Zhou, G.H.; He, Y.H.; Tang, C.L.; Yu, T.; Xiao, G.Z.; Zhong, T. Dynamic mechanism and present situation of rural settlement evolution in China. J. Geogr. Sci. 2013, 23, 513–524. [Google Scholar] [CrossRef]
  2. Jin, Q.M. Rural Settlement Geography; Science Press: Beijing, China, 1988. (In Chinese) [Google Scholar]
  3. Jean, B. The Principle of People; Ren, M.E., Li, X.D., Eds.; Zhongshan Press: Nanjing, China, 1935. [Google Scholar]
  4. Blache, P.V. Principes de Geographie Huonaine; Zhen, C.C., Ed.; Commercial Press: Beijing, China, 1930. [Google Scholar]
  5. Demangeon, A. La Geographie de I’habitat Rurale, Report of the Commission on Types of Rural Settlement; Montgomery Shire Express, Limited: Newtown, UK, 1928. [Google Scholar]
  6. Demangeon, A. Types de Villages en France. Ann. Geogr. 1939, 48, 1–21. [Google Scholar]
  7. Doxiadis, C.A. Ekistics: An Introduction to the Science of Human Settlements; Oxford University Press: Oxford, UK, 1968. [Google Scholar]
  8. Bunce, M. Rural Settlement in an Urban World. Real Estate Econ. 1986, 14, 171–172. [Google Scholar] [CrossRef]
  9. Chisholm, M. Rural Settlement and Land Use; Transaction Publishers: Piscataway, NJ, USA, 1962. [Google Scholar]
  10. Goodwin, H.L.; Doeksen, G.A.; Oehrtman, R.L. Determination of settlement patterns in rapidly growing rural areas. Ann. Reg. Sci. 1984, 18, 67–80. [Google Scholar] [CrossRef] [PubMed]
  11. Banski, J.; Wesolowska, M. Transformations in housing construction in rural areas of Poland’s Lublin region-influence on the spatial settlement structure and landscape aesthetics. Landsc. Urban Plan. 2010, 94, 116–126. [Google Scholar] [CrossRef]
  12. Sevenant, M.; Antrop, M. Settlement models, land use and visibility in rural landscapes: Two case studies in Greece. Landsc. Urban Plan. 2007, 80, 362–374. [Google Scholar] [CrossRef]
  13. Infante-Amate, J.; Villa, I.; Jiménez, F.; Martínez Martín, M.; Martínez López, D.; Cunfer, G.; González de Molina, M. The rise and fall of the cortijo system: Scattered rural settlements and the colonization of land in Spain’s Mediterranean mountains since 1581 Original. J. Hist. Geogr. 2016, 54, 63–75. [Google Scholar] [CrossRef]
  14. Han, Y.W.; Song, Y.K.; Burnette, L.; Lammers, D. Spatiotemporal Analysis of the Formation of Informal Settlements in a Metropolitan Fringe: Seoul (1950–2015). Sustainability 2017, 97, 1190. [Google Scholar] [CrossRef]
  15. Conrad, C.; Rudloff, M.; Abdullaev, I.; Thiel, M.; Löw, F.; Lamers, J.P.A. Measuring rural settlement expansion in Uzbekistan using remote sensing to support spatial planning Original. Appl. Geogr. 2015, 62, 29–43. [Google Scholar] [CrossRef]
  16. Porta, J.; Parapar, J.; Doallo, R.; Barbosa, V.; Santé, I.; Crecente, R.; Díaz, C. A population-based iterated greedy algorithm for the delimitation and zoning of rural settlements. Comput. Environ. Urban Syst. 2013, 39, 12–26. [Google Scholar] [CrossRef]
  17. Mao, Y.; Liu, Y.F.; Wang, H.F.; Kong, X.S. A Spatial-Territorial Reorganization Model of Rural Settlements Based on Graph Theory and Genetic Optimization. Sustainability 2017, 9, 1370. [Google Scholar] [CrossRef]
  18. Haines, A.L. Managing rural residential development. Land Use Tracker 2002, 1, 6–10. [Google Scholar]
  19. Pino, A.; Hormazábal, N. Informal settlements: Reinterpreting rural imaginary in urban areas: The case of Valparaiso’s ravines. Habitat Int. 2016, 53, 534–545. [Google Scholar] [CrossRef]
  20. Popović, S.; Djurovic, N.; Murgul, V. Formation, development and issues of Montenegro rural settlements in the case of village Orja Luka in Bjelopavlici. Procedia Eng. 2015, 117, 832–840. [Google Scholar] [CrossRef]
  21. Paulo, R.M.; Nicolás, S.; Denise, P.B.; Maria, A.M.S. Larval habitats of Anopheles species in a rural settlement on the malaria frontier of southwest Amazon, Brazil Original. Acta Trop. 2016, 164, 243–258. [Google Scholar]
  22. Lin, C. Settlement classification discussion. Geography 1938, 6, 17–18. (In Chinese) [Google Scholar]
  23. Yan, Q.S. Living geographic in Xikang. Acta Geogr. Sin. 1939, 6, 43–58. (In Chinese) [Google Scholar]
  24. Chen, S.P.; Yang, L.P. Settlement near the Zunyi. Acta Geogr. Sin. 1943, 10, 69–81. (In Chinese) [Google Scholar]
  25. Wu, C.J. Relationship between Human and Economic Layout (Wu Chuanjun Collection); Academic Press: Beijing, China, 2008. (In Chinese) [Google Scholar]
  26. Zhang, T.Z.; Song, J.T.; Su, Y.X.; Wu, Y.R.; Su, S.R.; Hu, R.X. Preliminary experience in the economic planning of the rural people’s Commune. Acta Geogr. Sin. 1959, 25, 107–119. (In Chinese) [Google Scholar]
  27. Jin, Q.M. Rural Settlement Geography in China; Science and Technology Press of Jiangsu: Nanjing, China, 1989. (In Chinese) [Google Scholar]
  28. Sun, G.Y.; Wang, C.S.; Xiao, L.; Dong, G. Rural residential land use change and its influencing factors in the rapid-urbanization region: A case study of Longgang District, Shenzhen. Prog. Geogr. 2011, 30, 352–360. (In Chinese) [Google Scholar]
  29. Zhu, F.K.; Zhang, F.R.; Li, C.; Zhu, T. Functional transition of the rural settlement: Analysis of land-use differentiation in a transect of Beijing, China. Habitat Int. 2014, 41, 262–271. [Google Scholar] [CrossRef]
  30. Ma, L.B.; Fan, H.; Shi, P.J.; Guo, X.D. Spatial pattern of rural settlements in loess hilly area: A case study of Tianshui City, Gansu Province. Chin. J. Ecol. 2015, 11, 3158–3165. (In Chinese) [Google Scholar]
  31. Yang, R.; Liu, Y.S.; Long, H.L.; Qiao, L.Y. Spatio-temporal characteristics of rural settlements and land use in the Bohai Rim of China. J. Geogr. Sci. 2015, 25, 559–572. [Google Scholar] [CrossRef]
  32. Yang, R.; Xu, Q.; Long, H.L. Spatial distribution characteristics and optimized reconstruction analysis of China’s rural settlements during the process of rapid urbanization. J. Rural Stud. 2016, 47, 413–424. [Google Scholar] [CrossRef]
  33. Tian, Y.S.; Kong, X.S.; Liu, Y.L.; Wang, H.R. Restructuring rural settlements based on an analysis of inter-village social connections: A case in Hubei Province, Central China. Habitat Int. 2016, 57, 121–131. [Google Scholar] [CrossRef]
  34. Wang, C.; Huang, B.; Deng, C.; Wan, J.; Zhang, L.; Fei, Z.H.; Li, H.Y. Rural settlement restructuring based on analysis of the peasant household symbiotic system at village level: A Case Study of Fengsi Village in Chongqing, China. J. Rural Stud. 2016, 47, 485–495. [Google Scholar] [CrossRef]
  35. Long, H.L.; Zou, J.; Liu, Y.S. Differentiation of rural development driven by industrialization and urbanization in eastern coastal China. Habitat Int. 2009, 33, 454–462. [Google Scholar] [CrossRef]
  36. Tan, M.H.; Li, X.B. The changing settlements in rural areas under urban pressure in China: Patterns, driving forces and policy implications. Landsc. Urban Plan. 2013, 120, 170–177. [Google Scholar] [CrossRef]
  37. Liu, Y.S.; Yang, Y.Y.; Li, Y.R.; Li, J. Conversion from rural settlements and arable land under rapid urbanization in Beijing during 1985–2010. J. Rural Stud. 2017, 51, 141–150. [Google Scholar] [CrossRef]
  38. Li, T.T.; Long, H.L.; Liu, Y.Q.; Tu, S. Multi-scale analysis of rural housing land transition under China’s rapid urbanization: The case of Bohai Rim. Habitat Int. 2015, 48, 227–238. [Google Scholar] [CrossRef]
  39. Ding, W.H.; Meng, B. A study on interaction between oasis water resource and oasis urbanization: Taking example of Northwest Region. J. Inner Mong. Norm. Univ. 2005, 34, 502–505. [Google Scholar]
  40. Wang, L.C.; Gao, J. Spatial coupling relationship between settlement and land and water resources based on Irrigation Scale—A Case Study of Zhangye City. J. Nat. Resour. 2014, 29, 1888–1901. (In Chinese) [Google Scholar]
  41. Dehnad, K. Density Estimation for Statistics and Data Analysis. Technometrics 1992, 29, 296–297. [Google Scholar] [CrossRef]
  42. Cai, X.J.; Wu, Z.F.; Cheng, J. Analysis of road network pattern and landscape fragmentation based on kernel density estimation. Chin. J. Ecol. 2012, 31, 158–164. (In Chinese) [Google Scholar]
  43. Jiao, Y.M.; Xiao, D.N.; Ma, M.G. Spatial pattern in residential area and influencing factors in oasis landscape. Acta Ecol. Sin. 2003, 23, 2092–2100. (In Chinese) [Google Scholar]
Figure 1. Regional location map of Shandan County.
Sustainability 09 02277 g001
Figure 2. Distribution of rural settlements in Shandan County in 1998, 2008 and 2015.
Sustainability 09 02277 g002
Figure 3. Distribution of grids with rural settlements at different dispersion degree in Shandan County in 1998, 2008 and 2015.
Sustainability 09 02277 g003
Figure 4. Kernel density of rural settlements in Shandan County in 1998, 2008 and 2015.
Sustainability 09 02277 g004
Figure 5. Distribution of hotspots and coldspots in Shandan County in 1998, 2008and 2015. Each point represents the centroid of a rural settlement patch and its color represents the Z score. Red zone denotes hotspot zone. The deepness of color represents statistical significance. Blue zone denotes cold spot zone. Yellow zone denotes zone where settlements randomly distributed.
Sustainability 09 02277 g005
Figure 6. Distribution of grids with different K values in Shandan County in 1998, 2008 and 2015.
Sustainability 09 02277 g006
Figure 7. Distribution of grids with different L values in Shandan County in 1998, 2008 and 2015.
Sustainability 09 02277 g007
Table 1. Data sources.
Data TypesScaleYearData Sources
Basic mapsTopographic map1:250,0002010Gansu Province Bureau of Surveying and Mapping
Vector administrative boundaries1:250,0002010Gansu Province Bureau of Surveying and Mapping
Land-use vector dataSurvey data of land use1:10,0001998Gansu Province Land and Resources Department
Survey data of land use1:10,0002008Gansu Province Land and Resources Department
Detailed survey data of land use1:10,0002015Shandan County Land Bureau
Statistical data of social economy1998–2015Yearbook of Zhangye City, National economic statistics of Shandan County, statistical yearbook of Shandan County and Shandan County land web (http://sz.shandan.gov.cn/)
Specify surveys information2015, 2016Field research data
Table 2. The indices of rural settlement pattern in Shandan County in 1998, 2008 and 2015.
YearCA (hm2)The Proportion of Total Patch Area in County Area (%)NPMPS (hm2)MAXP (hm2)MINP (hm2)PD (Patch Number/km2)
19983385.840.6277604.46106.970.010.14
20083424.830.63429201.1738.530.030.54
20153740.020.69231431.19119.860.010.58
Δ2008–199838.990.0012160−3.2838.530.020.4
Δ2015–2008315.20.0582230.0281.33−0.020.04
Table 3. Classification of rural settlements in Shandan County.
ClassificationArea (hm2)199820082014
NumberThe Total Area (hm2)NumberThe Total Area (hm2)NumberThe Total Area (hm2)
Solo settlement≤0.1160.9370549.676753.18
Small settlement>0.1–1217112.591623516.151726553.64
Middle settlement>1–104481618.625221715.345771832.55
Large settlement≥10791653.7701143.74731300.66
Table 4. Grids with rural settlements at different dispersion degree in Shandan County in 1998, 2008 and 2015.
Year199820082015
Range of Dispersion DegreeGrid NumberProportion (%)Grid NumberProportion (%)Grid NumberProportion (%)
0–551395.3549267.6849666.05
6–10234.2814519.9415420.51
11–2020.377910.878911.85
21–3000.0091.24101.33
31–4000.0010.1410.13
41–4600.0010.1410.13
Total538100.00727100.00751100.00
Table 5. Grids with different K values in Shandan County in 1998, 2008 and 2015.
K Value Classification199820082015
NumberProportion (%)NumberProportion (%)NumberProportion (%)
0–0.0410820.0718115.6017915.11
0.04–0.2820437.9234629.8334929.45
>0.2822642.01958.191109.28
8800.001038.881139.61
9900.0043337.3343436.94
Total538100.001160100.001185100.00
Table 6. Grids with different L values in Shandan County in 1998, 2008 and 2015.
L Value Classification199820082015
NumberProportion (%)NumberProportion (%)NumberProportion (%)
0–0.131257.9948337.3047936.65
0.1–0.511220.8213410.3513310.18
0.5–1142.60141.08191.45
1–10203.7290.69100.77
>1010.1920.1530.23
887914.68856.561027.80
990056843.8656142.92
Total538100.001295100.001307100.00

