Analyzing Supply Chain Uncertainty to Deliver Sustainable Operational Performance: Symmetrical and Asymmetrical Modeling Approaches


1
Faculty of Economics and Business Administration, King Abdulaziz University, P.O. Box 80201, Jeddah 21589, Saudi Arabia
2
Toulouse Business School, University of Toulouse, 20, bd Lascrosses, BP 7010, 31068, Toulouse CEDEX 7, France
*
Author to whom correspondence should be addressed.
Sustainability 2017, 9(12), 2217; https://doi.org/10.3390/su9122217
Submission received: 31 October 2017
/
Revised: 21 November 2017
/
Accepted: 22 November 2017
/
Published: 30 November 2017
(This article belongs to the Section Economic and Business Aspects of Sustainability)
Abstract
:The purpose of this study is to analyze different types of supply chain uncertainties and suggest strategies to deal with unexpected contingencies to deliver superior operational performance (OP) using symmetrical and asymmetrical modeling approaches. The data were collected through a survey given to 146 supply chain managers within the fast moving consumer goods industry in Thailand. Symmetrical modeling is applied via partial least squares structural equation modeling (PLS-SEM) in order to assess the theoretical relationships among the latent variables, while asymmetrical modeling is applied via fuzzy set qualitative comparative analysis (fsQCA) to emphasize their combinatory causal relation. The empirical results support the theory by highlighting the mediating effect of supply chain strategy (SCS) in the relation between supply chain uncertainty (SCU) and firms’ OP and, hence, deliver business sustainability for the firms, demonstrating that the choice of SCS should not be an “either-or” decision. This research contributes by providing an illustration of a PLS-SEM and fsQCA based estimation for the rapidly emerging field of sustainable supply chain management. This study provides empirical support for resource dependence theory (RDT) in explaining the relation between SCU and SCS, which leads to sustainable OP. From a methodological standpoint, this study also illustrates predictive validation testing of models using holdout samples and testing for causal asymmetry.
1. Introduction
In recent years, the nature of competition has increasingly shifted toward one supply chain competing against another supply chain [1]. Bromiley and Rau and Breton-Miller and Miller have raised the question that why, under uncertainty, some firms outperform others [2,3]. Typically, supply chains serve the strategic goals through inter-reliant value-adding processes. Hult et al. have argued that the “strategic supply chain management” role is not merely moving products where they need to be, but is also a tool to enhance key outcomes [4,5]. By nature, supply chain entities are interdependent through sequential, parallel, and network structures, and collaboratively transform raw materials into finished products which can be highly vulnerable to uncertain risks and disruptions [6,7].
McKinsey Global Institute (MGI, USA) commissioned a study on globalization and found that geopolitical and domestic political instability will increasingly affect global businesses and their companies. Hence, business continuity and sustainable business performance are going to be a challenge. This is a rising phenomenon and common concern shared by 84% of executives who took part in this survey, which has been part of an on-going research for the last ten years. Findings indicated that most respondents expect that severe disruptions due to geostrategic risks (characterized by geopolitical, political, and macroeconomic instability) will affect their companies, with decidedly negative implications for profits and slowing growth. At the same time, a vast majority say their organizations are not ready to address these issues. While geostrategic risks are complex issues, these risks could be a potential source of competitive advantage for companies that develop better strategic capabilities to manage them. In a related study, Culp posits that natural disasters and extreme weather conditions are not the only threats to supply chains, but that systemic vulnerability, such as oil dependence and information fragmentation, also pose serious risks, as do political unrest and cyber-crime [8]. In addition, in a related study, Culp reported that 80% of companies worldwide see better protection of supply chains as a priority, because significant supply chain disruptions reduce the share price of affected companies by as much as 7% on average. For instance, events like the Japanese earthquake and tsunami, and the floods in Thailand have demonstrated how far the consequences of such risks can extend. The recent earthquake in Japan, for example, severely affected global electronics production and led to extended business disruptions for the automotive industry. The Thai flooding created significant shortages in the hard disk drive market that generated millions of dollars of losses for well-known electronics manufacturers. In addition to these headline events, however, the nature of supply chain risk is constantly changing. New risks and new vulnerabilities can often be better addressed if given close attention from management. Culp also found that the fragility of global supply chains is related to emerging risks and to supply and network design strategies [9]. Volatility and uncertainty are not going away anytime soon. Risk-based, cost-effective supply chain management can be an essential element of success. This capability cannot only help prevent losses, but can also prove, for many companies, to be a lasting source of competitive advantage.
Linton et al. posit sustainability are deeply rooted in the supply chain. Since the supply chain deals with the specific product from end-to-end with initial processing of raw materials until final delivery to the customer [10]. Sustainable operational performance (OP) is a vital element in achieving competitive advantage for the entire supply chain. When the resources are scarce and vitally important, companies are faced with uncertainty in managing the supply and demand to pursue specific supply chain strategy (SCS) to maintain sustainable OP [11]. Firms that are capable of managing these uncertainties with appropriate strategy will thrive with sustained performance and develop a source of competitive advantage [12]. Markley and Davis argued, in the near future, due to competitive pressure, as the sources of competitive advantage for firms become limited and they will search for new areas of excellence [13]. This study contributes towards sustainability by analyzing the potential source of competitive advantage firms can create from the creation of a sustainable supply chain. Moreover, uncertainty about the scarcity of the environmental and natural resource for companies’ will demand adopting or pursuing supply chain strategies that will continue to deliver sustainable OP.
Responding to uncertainty through managing supply chains is central to a firm’s strategic success. The unpredictability of consumer demands, shorter product life cycles, price and quality fluctuations in supply markets, continuous improvement initiatives by competitors, along with market dynamics, imply that supply chains are struggling for stability [14]. In response to this phenomenon, firms are searching for ways to overcome uncertainty [15]. By building on contingency theory, Hult et al., have found synergies between supply chain uncertainty (SCU) and SCS, and their positive impact on OP [6]. However, their links to OP are still unexplored. Resource dependence theory (RDT) asserts that firms facing substantial environmental uncertainty will attempt to stabilize themselves by imposing inter-organizational ties [16]. Contingency theory emphasizes the effectiveness of realizing an intended match between an uncertain environment within which an organization operates and its strategy [17,18]. Uncertainty within the supply chain arises from both upstream and downstream. In the case of downstream uncertainty, SCU stems from volatile demands, while upstream uncertainty arises from supply markets.
Hitt et al. [19] and later on followed by Qi et al. [18] explored this relationship have considered uncertainty as a moderator between inter-organizational relationships and performance [15]. Hence, this study attempts to extend this stream of research by focusing on the following gaps in the literature. First, RDT is adopted to examine the direct relationship between SCU (demand and supply) and SCS due to the fact that earlier studies by Wu et al. [20], Qi et al. [18], Yusuf et al. [21], Lee [22], and Fisher [23] concluded SCS is a broad and multidimensional phenomenon represented by multiple strategies [18,20,21,22,23]. Second, this research further extends on Fisher and Lee’s model who introduced the concept of “strategic supply chain” in response to uncertain environments, and who also examined the context of achieving superior performance through responding to uncertainty [23,24]. Taking these previous studies as our point of departure, we used RDT [24], as the theoretical lens to examine an appropriate strategy to achieve superior performance under uncertain supply chain conditions.
This study proceeds as follows. Next section proposes and develops some empirically testable hypotheses. Subsequent sections present the data and methodologies used in this research and explain the results. Finally, section five and six brings together the discussion, implications, limitations and future work.
2. Literature Review and Hypotheses
2.1. Theoretical Perspectives
RDT demonstrates how aligning SCU to SCS can affect OP. RDT proposes that firms become involved in exchanges with their environment to secure resources [24]. The underlying premises of RDT are: First, very few organizations are internally self-sufficient on strategic and critical resources, thereby leading to dependence on other firms [25]. Secondly, firms seek opportunities to mitigate uncertainty and manage dependence by purposefully structuring their exchange relationships, establishing formal and semi-formal links with other businesses [26]. Theoretically, establishing such inter-firm relationships is considered when addressing problems of uncertainty and dependence by increasing the level of coordination with the exchange partners [27].
Barney posited, RDT is in contrast to the well-established resource-based view (RBV), which is more internally focused [28]. RDT emphasizes exclusively complementary resources that can be obtained from external sources for an organization on a contingency basis to sustain or grow under uncertainty [29]. As supply chain partners work in close collaboration, they often become more dependent on each other. However, RDT suggests that in the case of uncertainty, firms should seek supply chain-wide integration and avoid dependencies. Thus, RDT has a high level of value in the supply chain context. In a supply chain context, the uncertainty arises from volatile demands and supply markets, and, to deal with such uncertainties, the match with a specific type of strategy will be contingent upon that condition.
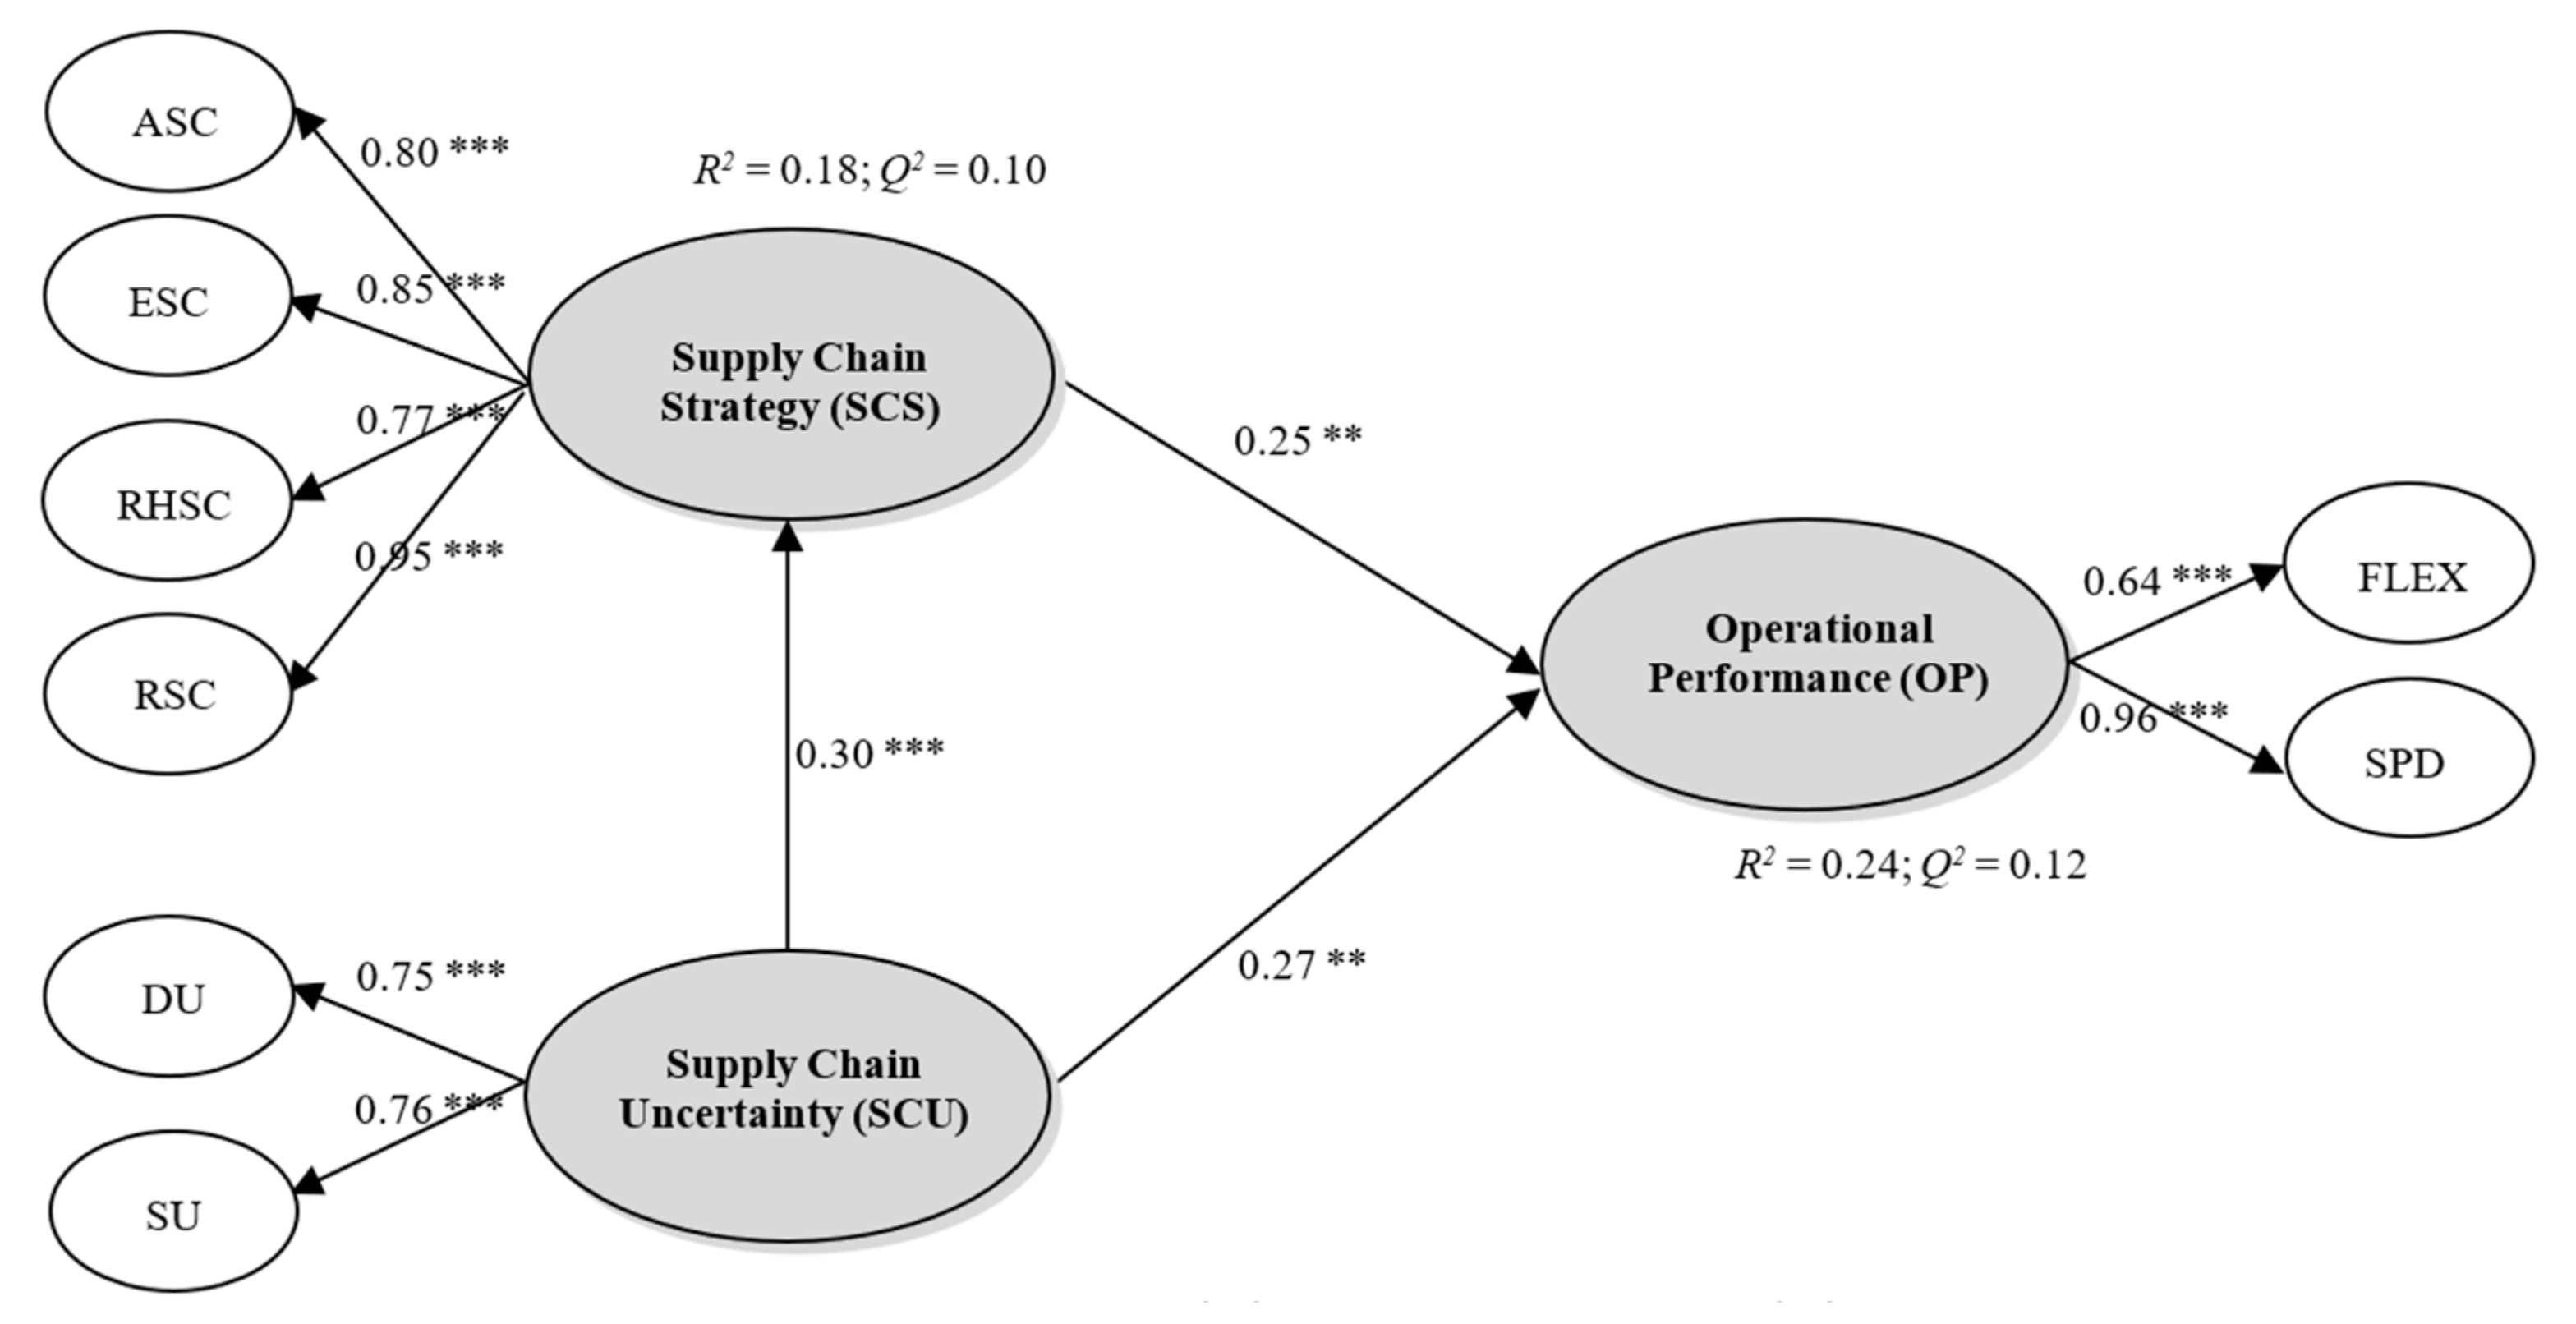
We build and test an integrated model to investigate the relationships among SCU, SCS, and OP and how SCS mediates the relationship between SCU and OP. Based on the extant literature, a conceptual model (Figure 1) is proposed to display the hypothesized relationships among SCU, SCS, and OP.
2.2. The Effects of SCU on SCS
SCU relates to decision-making in situations where the decision maker is at risk due to: lack information or its environment; lack of information processing capabilities; inability to accurately predict the outcome; or, lack of effective control mechanisms [30]. The uncertainty in the supply chain arises from the variation in demand and supply. Arbussa et al., argues that firms need to develop strategic agility to respond to such uncertainties [31]. Demand uncertainty (DU) is characterized by the unforeseen demand variability, in turn creating problems in planning and control that jeopardize delivery performance [23], while supply uncertainties are the supply side actions that are manifested through late deliveries, poor quality of incoming materials or parts. On the other hand, SCS refers to coordination and commitment of many firms to implementing company strategic objectives and utilizes inter-firm coordination as the capability that facilitates achievement of targets [32]. According to Lee, some uncertainty characteristics require supply chain strategies with initiatives and innovations that can provide a competitive edge to companies [22].
On the contrary, Fisher argued that functional products are characterized by predictable demand, long product life cycles, and lower profit margins [23]. Thus, firms handling such products require lower levels of capability to respond to frequent design changes and volume fluctuations. As these are low margin products, such firms put heavy emphasis on cost efficiency. Lee has expanded on Fisher’s work by incorporating levels of supply uncertainty [22,23]. Lee’s model emphasizes four strategic choices: efficient supply chain (ESC), responsive supply chain (RSC), risk-hedging supply chain (RHSC), and agile supply chain (ASC). ESC deals with creating the highest cost efficiencies in the supply chain [22]. RHSC aims at pooling and sharing resources in a supply chain so that the risks of supply disruption can also be shared [22]. Lee argued that a responsive supply chain strives to be responsive and flexible to the changing and diverse needs of the customers [22]. The ASC is responsive and flexible to customer needs [22].
An ESC strategy is developed on both low demand and supply uncertainty, whereas firms that adopt an RHSC strategy hedge against supplier uncertainty. These businesses address challenges that are related to process reliability, the supply base and long lead times from source to production, although they produce functional products [20,22]. Thus, a firm adopting an RHSC strategy is high in supply uncertainty, but low on-demand uncertainty due to the very nature of innovative products, which makes demand volatile, shortens the lifecycle, and provides greater profit margins [23]. Typically, firms deploying a responsive SCS attempt to be flexible to the changing and diverse demands of their customers, reflecting a moderate degree of price and service consciousness [33]. Such firms are focused on improving quality, delivery, modular design, and reliability performance. These improvements are beneficial to an SCS with innovative products, while they are reliable and have a stable supply base [22]. Finally, an ASC has an evolving process in which customer demands remain unstable, and suppliers are unreliable and limited. Such firms emphasize their resources and capabilities on quality, delivery dependability, and after-sales service [20,22,33]. Hence, firms with an ASC strategy view both supply and demand as having high uncertainty. Based on the above arguments, we propose the following hypothesis:
Hypothesis 1 (H1).
SCU positively influences the managerial decision to adopt specific SCS.
2.3. The Effects of the SCS on OP
Largely driven by globalization, in modern business practices competition has shifted from ‘firm versus firm’ to ‘supply chain versus supply chain’. Ketchen and Hult argued that the best value of supply chain management is reflected in how firms use their supply chains as “strategic weapons” to gain an advantage over competitors [34]. Because the supply chains span into a borderless and invisible process, cost and quality are now taken as constants, which leaves the emphasis on OP on speed and flexibility [35]. Thus, OP refers to the time required to deliver a customer’s order, and is measured regarding speed and flexibility [35]. Speed is the elapsed time from when a customer establishes a need to order until the product is delivered and is ready for customer use. Flexibility is the ability to accommodate special situations, like unusual or unexpected customer requests. Flynn et al. posit to respond effectively, it requires a supply chain to determine the nature of uncertainty it is facing and create an alignment with appropriate strategy [36]. Similarly, Stevens and Johnson concluded to evaluate the effectiveness of strategy the supply chain requires to measure its’ OP with relevant metrics [37]. The evaluation of the performance of adopted strategy is critical to help steer the supply chain decisions in the desired direction. Therefore, the improvement and assessment of OP are important because it will enhance efficiency across a supply chain. This discussion forms the basis of the following hypotheses:
Hypothesis 2 (H2).
SCS is positively related to a firm’s OP.
Hypothesis 3 (H3).
SCS mediates the relation between SCU and a firms’ OP.
3. Research Methodology
3.1. Data Collection Process
Survey data were collected from firms based in Thailand. The respondents were typically the supply chain decision makers of their firms. Phillips suggests that high-ranking informants tend to be more reliable sources of information than low-ranking ones [38]. Respondents were randomly selected from the list of registered companies in the Thailand Business Directory published by Teleinfo Media Public Co. Ltd., Bangkok, Thailand in 2015–2016. The sample firms included businesses of various sizes e.g., small, medium, and large. A combination of mail, e-mail, and telephone survey was used to collect data. In this study, respondents were requested to evaluate the extent, on a 5-point Likert scale, with which their firms practice the various aspects of measures. Although the use of single informants may result in method variance, as well as informant bias, the logistics or supply chain manager is most likely to be the most knowledgeable informant on the issue [39]. Consequently, of the 307 surveys sent out, 155 were returned. There were 146 usable responses included in the subsequent analysis. The overall response rate was 47.56%. The response rate is reasonably acceptable when compared to that of recent studies in operations management [40]. Summary details of the firms are presented in Appendix A. The survey was conducted over a period of two-and-a-half-month. Two techniques were used to improve the response rate, which was: (1) following up with reminder phone calls, and (2) promising to mail a final summary of the study’s results to responding firms for their reference.
3.2. Measurement Scales
The measurement of the constructs is based on existing validated scales. All the constructs in this study are operationalized in a reflective-reflective type 1 model based on theoretical considerations [41]. The scale of SCU draws on eight-item scales from Chen and Paulraj [42], which many prior studies have also used. Similarly, based on prior research, the scale of SCS draws on fourteen-item scales from [22,43]. Finally, based on earlier studies, the scale of OP draws on eight-item scales from Bayraktar et al. [44].
3.3. Symmetrical Modeling Approach
The research model (Figure 1) is analysed by employing a partial least square–structural equation modelling (PLS-SEM), as implemented in SmartPLS 3 [45]. SmartPLS 3 assesses the psychometric properties of the measurement model and estimates the parameters of the structural model simultaneously. PLS-SEM is a widely accepted variance-based, descriptive, and prediction oriented technique to SEM [46,47]. Using PLS-SEM is particularly more suitable when the research objective focuses on prediction and explaining the variance of key target constructs by different explanatory constructs [48,49,50]; the sample size is relatively small [48], and/or the available data is non-normal; and, if covariance-based SEM provides no, or at best questionable results [46,47,51].
3.4. Asymmetrical Modeling Approach
The hypothesized paths suggest a causal relation leading from SCU, through SCS, to OP (Figure 1). However, this relation may be more complex. That complexity is empirically scrutinized by a conventional correlational method (i.e., PLS-SEM) and an innovative configurational method based on set-theoretical approaches (i.e., fsQCA). Indeed, configurations play a crucial role in management research [52,53]. FsQCA is often applied in management research in conjunction with conventional statistical methods (regression for instance) [54,55,56]. However, it differs from them in the way that it prompts the researcher to go beyond mono-causality rationale and brings out the multiplicity of causal paths underlying management phenomena by using fsQCA software [57]. FsQCA approach uses Boolean algebra to generate a combination of causal conditions leading to an outcome. Central to fsQCA approach is the calibration procedure and the truth table analysis. The calibration is a transformation process consisting in converting conventional measures into fuzzy sets.
4. Data Analysis and Findings
4.1. Evaluation of the Measurement Model
Table 1 presents the descriptive statistics for the latent constructs. The results of the measurement model reveal that the model meets all of the minimum requirements. Firstly, all of the first- and second order-constructs with reflective items suggest a good indicator reliability with few indicator loadings below 0.70 (Table 2). However, since the criteria for reliability and convergent validity were met, we decided to retain all original items, as suggested by Hair et al. [46]. Secondly, Cronbach’s alpha and composite reliability values range from 0.70 to 0.91, thus meeting the commonly accepted threshold level [58]. Thirdly, all of the average variance extracted (AVE) values of the first- and second-order constructs are above 0.50 [59], supporting the construct measures’ convergent validity.
To examine the discriminant validity, this study uses two approaches: First, the results of cross loading show that all of the items load is higher on their respective constructs than on the other constructs, and that the differences between loadings and cross loading are much higher than the suggested threshold of 0.1 [60]. Second, Table 1 shows that the square root of AVE is greater than the corresponding construct correlation [59] on the diagonal.
Finally, the constructs in this study are operationalized in a reflective-reflective type 1 model based on theoretical considerations [41]. This study applies a two-stage approach to evaluate the hierarchical second-order latent constructs. In the first stage, the repeated indicator approach is used to obtain the latent variable scores for all the first-order constructs, which, in the second stage, serve as manifest variables in the measurement model of second-order constructs [41,51].
4.2. Evaluation of the Structural Model
The structural model is assessed employing the guidelines in [46]. First, this study examines the model for collinearity. The results show minimal collinearity with the variance inflation factor (VIF) for two sets of (predictor) constructs because they are much less than the common threshold of 5 [61]. Therefore, collinearity among the predictor’s constructs in the structural model is not a problem. Second, the model predictability is assessed using R2 values for the dependent latent variables. The R2 values of SCS (0.16) and OP (0.24) are in line with prior research [62,63], supporting the PLS-SEM model’s in-sample explanatory power [64].
Third, the sizes and significance of the path coefficients that represent the derived hypotheses were examined. To obtain the significance levels, the bootstrapping procedure (with some 5000 bootstrap samples and 146 bootstrap cases, using no sign changes) was run. As shown in Table 3, the results indicate that SCU has a significant effect on SCS (β = 0.30 ***; t = 3.91; CI0.90: (0.22, 0.27) and OP (β = 0.27 **; t = 3.02; CI0.90: (0.26, 0.31). In addition, SCS has a significant effect on OP (β = 0.25 **; t = 3.20; CI0.90: (0.22, 0.27). These results confirmed that all three hypotheses were accepted.
4.3. Mediation Analysis
This study follows Zhao et al.’s recommendations to examine mediation effects in the model [66]. Zhao et al. posit the key condition in showing mediation is that the indirect effect is significant [66]. The bootstrapping procedure facilitates the exploration of the SCS (mediator) simultaneously in the association between SCU (independent variable) and OP (dependent variable) [67]. Based on Zhao et al., this study applies the recommended 5000 bootstrap samples at the 90% confidence level [66]. The structural equation model is examined to determine whether SCS mediates the effect of SCU on OP. The results show the existence of a significant indirect effect of SCU on OP with the SCS mediator (β = 0.07 ****; t = 13.31; CI0.90: (0.06, 0.07), thus suggesting that SCS mediates the association between SCU and OP. However, the direct effect of SCU on OP shows partial mediation. The variance was (VAF) 22.15%; that is, there was a partial mediation or complementary mediation [66]. Further, the meditation testing, using the Baron and Kenny’s [68] procedure, produced highly similar results to those attained using the Zhao et al.’s method [66], thus suggesting SCS mediates the association between SCU and OP.
4.4. fsQCA Results
fsQCA analysis requires a calibration of the conventional variables measured using Likert scales. First, this study measures each latent variable by calculating the average of the values of their items [69]. This process results in six conditions and two variables reflecting the outcome. Second, the eight variables are then calibrated into fuzzy sets using the direct calibration method [57]. Accordingly, the decision was made for the threshold of full membership in the sets (fuzzy score = 0.95). The threshold for full non-membership (fuzzy score = 0.05) and the cross-over point, which indicates a point of maximum ambiguity where respondents are not in or out of the sets (fuzzy-score = 0.50) [70] (pp. 104–105). In line with extant studies, such as Fiss [53], this study employs the 75th percentile of each variable as an anchor for the full membership. For the full non-membership, the 25th percentile and the 50th percentile for the crossover point were used. This study does not use absolute anchors for two reasons [71]. Firstly, it is the first exploration of a research incorporating SCU and an SCS in a single empirical frame. Secondly, concept measurements are based on subjective scales. However, due to the asymmetric nature of the distribution of responses associated with variable supply uncertainty, the percentile for the calibration process was not used; instead, the six-value fuzzy set was used [72]. Because the outcome is originally measured by the flexibility and the speed of the supply chain, a so-called macro-variable was created by combining them. Ragin qualifies the macro-variable as a ‘higher-order construct’, which benefits from using the maximum of the values of the measures of which it is composed [73].
Table 4 exhibits the results of the fsQCA analysis of high OP. The notation in Table 4 is based on the extant literature [53,74].
Table 4 shows the existence of five causal paths leading to high OP. They represent various combinations of SCS and SCU. Each part of the overall solution has a consistency greater than 0.80, which can be considered acceptable. These five solutions demonstrate the existence of a first-order equifinality (e.g., Fiss) in the analysis of the OP of the supply chain [53]. In Solution 1 (1a and 1b), the SCS consists of a conjunction of lack of ASC, efficiency, responsiveness, and a lack of risk hedging, while the SCU is only based on a demand uncertainty. In Solution 1a, efficiency and a lack of risk hedging constitute the core conditions regarding the SCS. These conditions have a strong causal relation with high OP (the outcome). Conversely, responsiveness and lack of agility are peripheral or contributing conditions, which imply that they have a low causal relation with the high OP. Regarding SCU; demand uncertainty maintains a strong causal relationship with the high OP of the supply chain, regardless of the presence or absence of supply uncertainty. Solutions 1a and 1b provide evidence of a second-order equifinality (e.g., Fiss) [53]. Indeed, comparing Solutions 1a and 1b indicates that a high demand uncertainty and a high uncertainty in supply can be treated as substitutes. These results also demonstrate that companies can achieve a high OP even though they do not hedge against risks and do not encounter agility in their supply chain. Solution 2 indicates that certain companies may engage an SCS to a lesser extent, although they face an uncertainty context marked by high demand uncertainty and low supply uncertainty. In contrast, Solution 3 emphasizes that companies may deploy other massive supply chain strategies in the absence of high uncertainty in their supply chain. Solutions 4 and 5 suggest that companies encountering a high level of uncertainty may implement differentiated supply chain strategies.
To additionally examine the causal asymmetry assumption underlying fsQCA, a new outcome variable was created that represents the absence of the high OP of the supply chain. The new outcome is computed as the negation of the high OP of the supply chain examined in Table 4, and investigated with the same six conditions reflecting the SCS and uncertainty. The analysis was not conclusive in emphasizing the manner in which the asymmetrical nature of the causal relations led to either a high or low OP. Indeed, we obtain a solution only when lowering the cut-off of the truth table algorithm from “0.8” down to “0.75”.
4.5. Testing for Predictive Validity
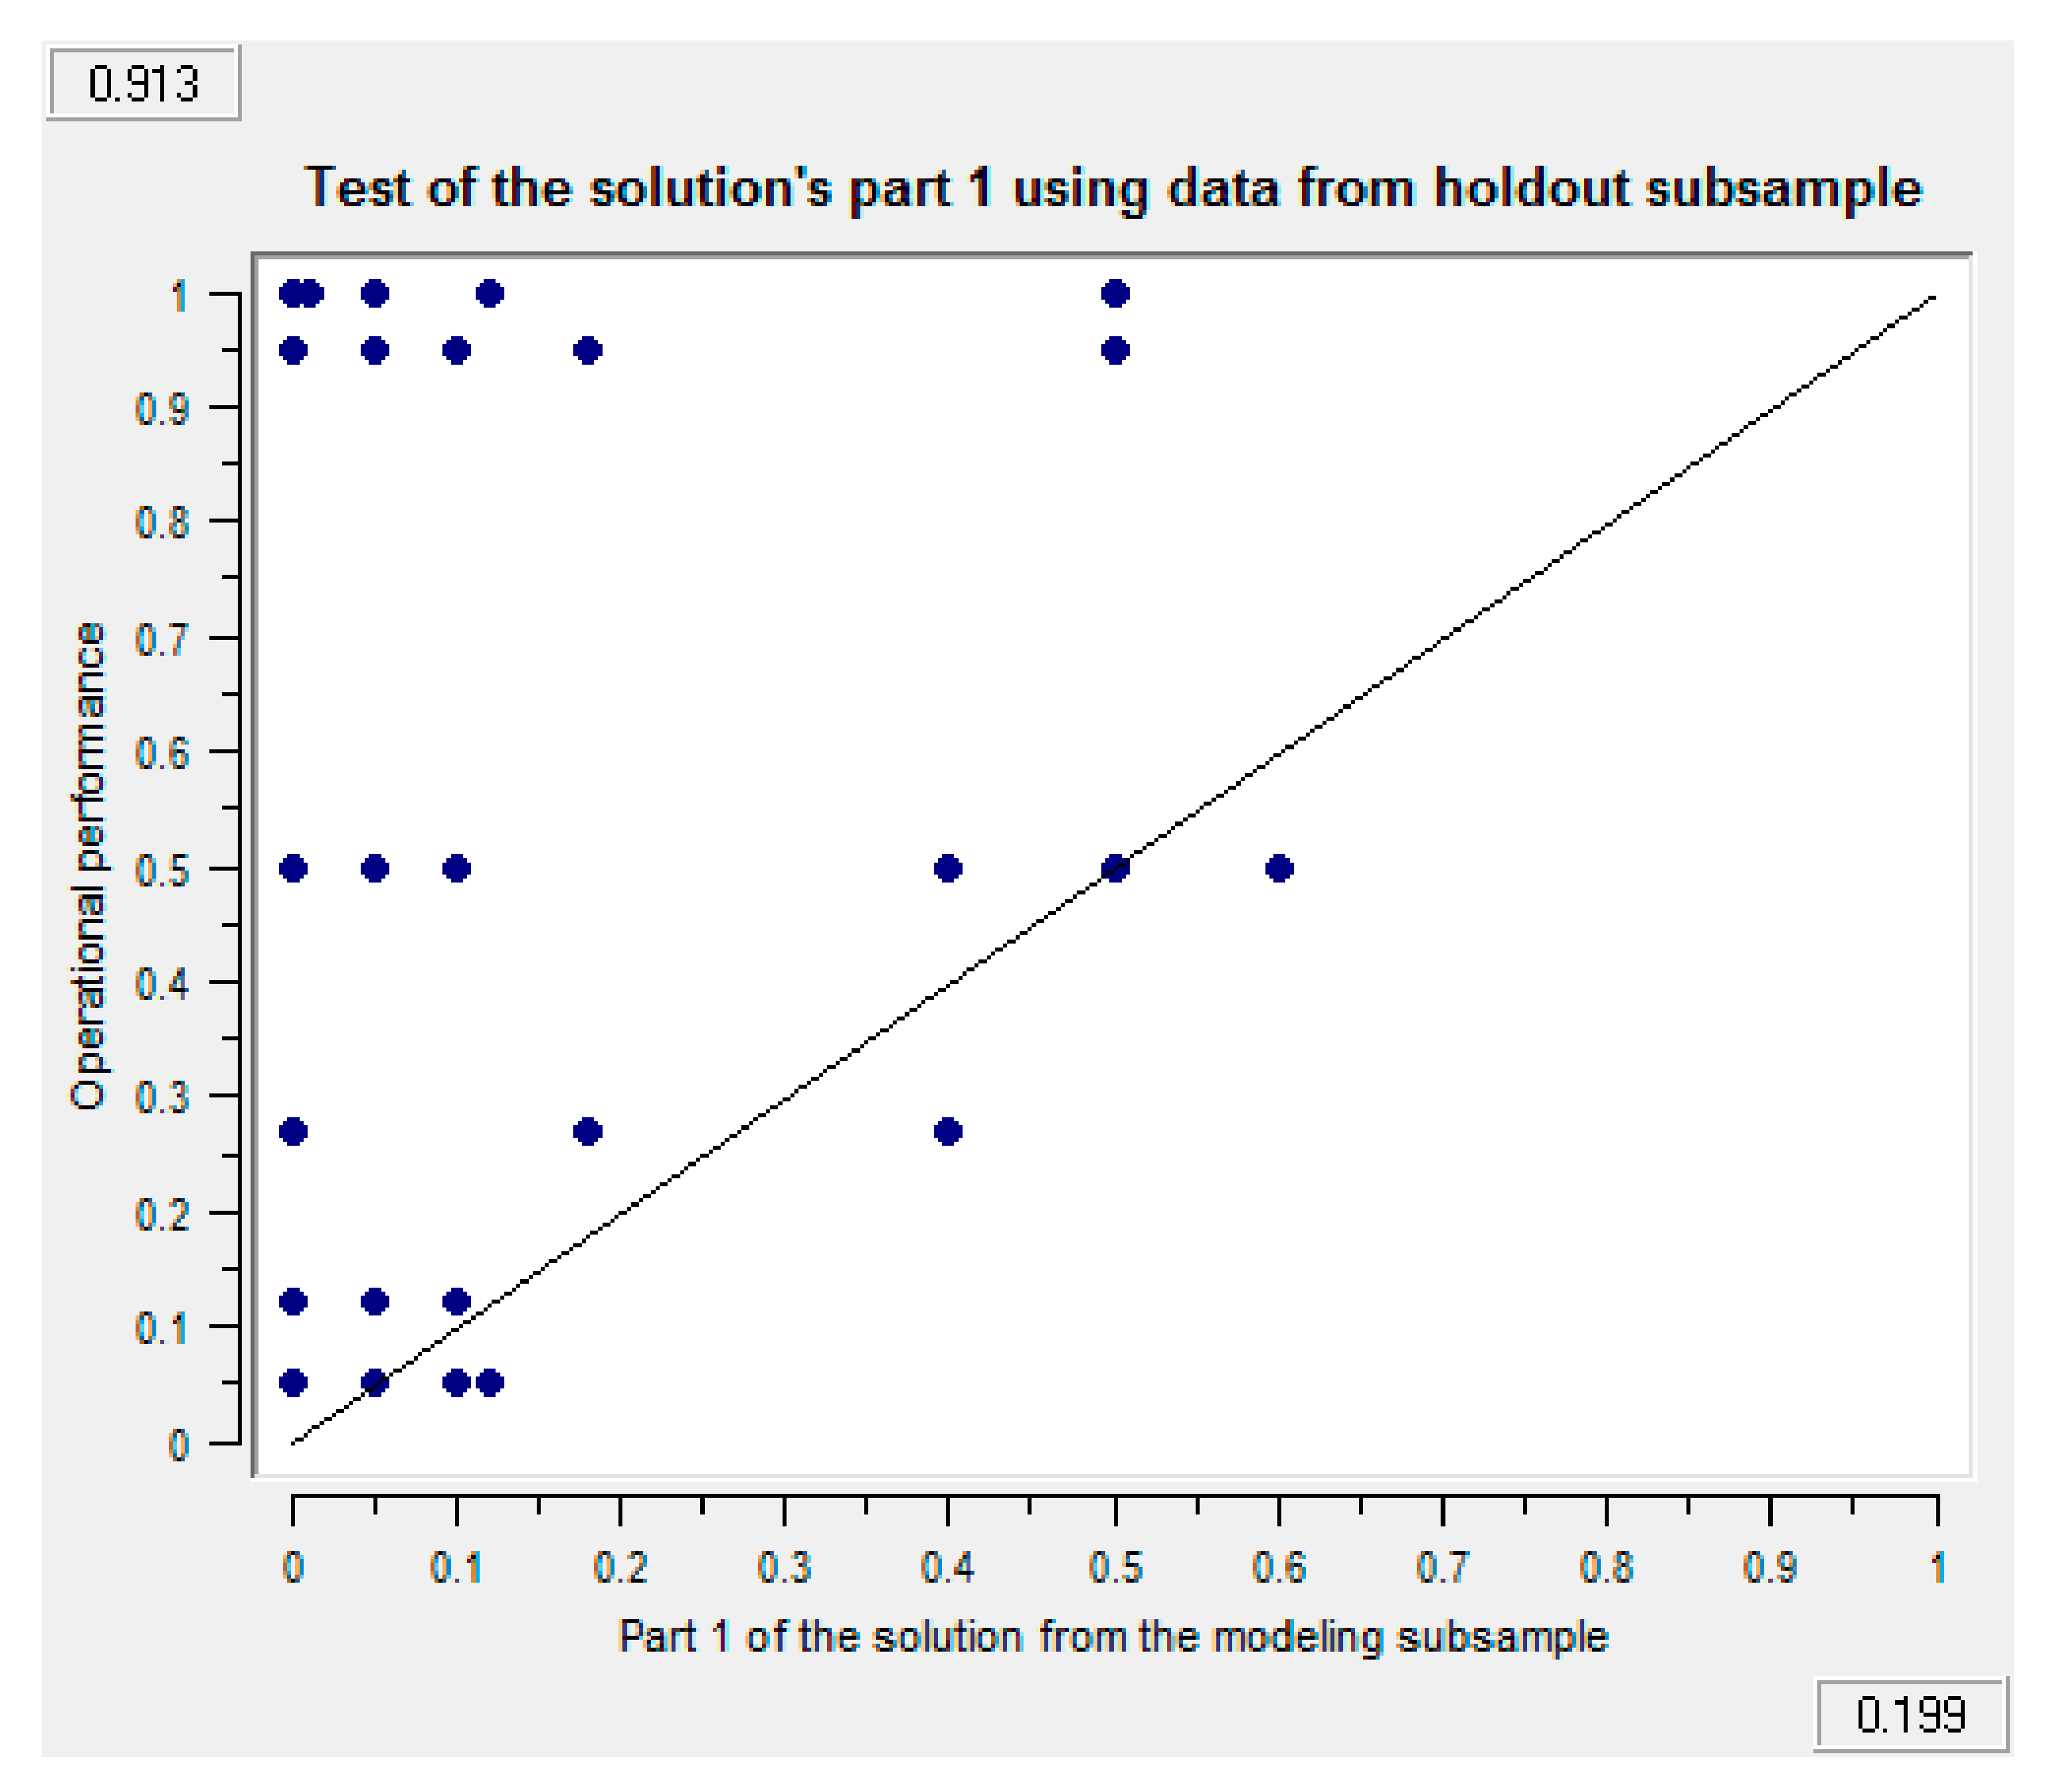
Previous PLS-SEM and fsQCA analyses demonstrate how well the model investigated fits the data. They are not indicative of how independent variables (conditions) predict dependent variables (result). Thus, a predictive analysis is performed in this study [75,76,77]. This study follows the procedure in Cepeda-Carrión et al. to report the predictive validity of the PLS-SEM model as follows [77,78]: first, two-thirds of the sample is randomly chosen, which is composed of 96 samples as the training set; the remaining 50 samples represent the holdout sample. The training set is used to estimate the parameters in the model. Using the holdout sample, each indicator is standardized, and the construct scores are formed as linear combinations of the respective indicators using the weights obtained from the training sample. The construct scores are standardized. For the OP of the endogenous construct in the holdout sample, the predictive scores are created by using the path coefficients obtained from the training sample. The correlation between the predictive scores and construct scores is 0.63 (p < 0.01), which suggests that the PLS-SEM model has acceptable predictive validity. Furthermore, the predictive validity of fsQCA analysis is made following recent empirical studies [20,56,75,76,79]. Table 5 highlights that the patterns of the complex combination of conditions are causally consistent indicators of a high level of supply chain OP. Furthermore, Figure 2 shows that the first part of the solution of the modeling subsample is causally relevant in predicting the high OP of the supply chain with a consistency higher than “0.80” (0.91). Predictive tests for the remaining four parts of the solution of the modeling subsample show the high consistency of the outcome under investigation. All of the results will be provided at the request of any interested readers.
5. Discussion and Conclusions
This study provides empirical support for RDT in explaining the relationship between SCU and SCS, which leads to firms’ OP. By focusing on uncertainty and strategy this study contributes towards context specific sustainable supply chain management research, as prescribed by Busse and Mollenkopf [80]. Also, fsQCA provides a more fine-grained analysis of SCU and strategy alignment. Findings from both PLS-SEM and fsQCA constitute a significant contribution to and an extension of the literature in supply chain management. For researchers, this study also demonstrates that the application of PLS-SEM, along with fsQCA, allow one to test an interlinked set of hypotheses simultaneously in a prediction oriented modeling because the model in this study contained a series of dependence relationships.
This study also illustrates predictive validation testing of models using holdout samples and testing for causal asymmetry. From a research implication standpoint, this research contributes by illustrating a PLS-based estimation for a rapidly emerging field of study of supply chain management. In an uncertain environment, supply chain partners tend to work in close collaboration; they often become more dependent on each other. However, instead of just collaborating, firms should seek supply chain-wide integration and avoid dependencies.
Based on the results, we found support for hypotheses H1 and H2. This implies that SCU internally leads to the selection of a specific strategy that will contribute to firms’ OP. In addition, the empirical findings lend support for hypothesis H3, which illustrates that SCS has a mediating role in a firm’s OP. This finding is due to businesses that engage in managing SCS look for ways to enhance each other’s competitiveness.
Overall, this study contributes to the literature on the most debated link between SCU and OP which is mediated by the SCS. The combined causal relationship investigated through fsQCA nuances those contributions. Unlike Paulraj and Chen, who found that demand uncertainty has no impact on SCS [25], this study shed insights into the link between SCU and SCS. Indeed, this study shows that in the relationship leading to OP, SCU dimensions offer alternative decision-making approaches (see Solutions 1a and 1b).
According to the adopted theoretical premise of RDT, under uncertain (both supply and demand) circumstances, due to resource scarcity, firms attempt to collaborate with their supply chain partners to respond to the volatile environment. This finding is also supported by Berti and Mulligan that, in an uncertain market environment firms typically experience declining profit and the reduced cost price [81]. As a result, sustainability of firms may be at stake that leads to increased barriers to market access with the inevitable effect of market abandonment.
From a methodological perspective, this study illustrates the usefulness of applying complementarities of PLS-SEM and fsQCA in empirically unpacking the OP differentials as they are examined in SCU and SCS research. The PLS-SEM methodology is suitable in explaining the causal paths through which SCU and SCS ultimately affect performance, whereas fsQCA provides a deeper understanding of the complex, non-linear, and synergistic effects of supply chain risk management in conditioning the effect of SCU and SCS on performance. The PLS-SEM results demonstrate the general tendency, whereas fsQCA uncovers the multiple realities that exist in terms of achieving the desired state [55,82]. Ultimately, this study confirms that the use of PLS-SEM supplemented with fsQCA approach suggests that the scholarly community may apply such combinative approach to make this multi-mixed approach a formidable statistical tool.
The findings of the research have several meaningful implications for managers in the global marketplace. Before formulating a strategy, managers should analyse the nature and source of inherent uncertainty within their supply chain, and align this source with an appropriate strategy. This will contribute to better OP. Solutions 2 and 5 indicate that whether or not uncertainty is apparent, managers do not need/have an SCS to achieve OP (Solution 2), whereas in an uncertain supply environment, one needs to have a strategy for high performance (Solution 5).
The practitioners may utilize this knowledge as a guideline to ensure that a “strategic fit” between firm and supply chain partners is created and to support the improvement of decision-making to ensure that there is an appropriate strategic approach for the customer and supplier to best influence a firm’s OP. We are also aware that core to fsQCA is to consider each indicator of the latent constructs with equal importance in the causal paths. Using importance-performance map analysis (IPMA) [37,77], we might gain a deeper understanding of the importance which each indicator composing SCS and SCU intervenes in the causal paths to sustainable OP. IPMA enables managers to prioritize their organizational and managerial actions. It also helps managers to identify important areas for the improvement of marketing or management activities. In this study, both PLS-SEM and fsQCA results show that SCS and SCU have the highest importance on sustainable OP. Therefore, practitioners may note that a one-point increase in the performance of SCU and SCS are expected to increase the performance of OP by the value of the total effect (0.46) and (0.17) respectively.
6. Research Limitations and Future Research
The current study is based on the data collected from one single economy within one single industry. Hence, the findings may not be generalizable to other economies and industries. This study has been conducted based on an inductive approach with cross-sectional data. However, future research may consider using longitudinal data to see the changes over time. In addition, supply chain uncertainty should encourage collaborative efforts within the partners that would contribute to better operational performance [83], future research should incorporate the supply chain collaborative dimensions in the model. Touboulic and Walker suggested sustainable supply chain management is emerging as an applied field of knowledge and due to its’ applied orientation, an action research approach would be more meaningful [84]. By nature, the problems in the supply chain are often inter-disciplinary and concerned with the impact on society and business, at large. Also, this raises a future research question, ‘to what extent can market/supply chain forces drive sustainability?’ Finally, taking into consideration Schlittgen et al., PLS-IRRS, instead of PLS-SEM, should be jointly used with fsQCA [36]. This could be useful to address issue related unobserved heterogeneity that our data may contain. For future research and taking into consideration Schlittgen et al., the iteratively reweighted regressions segmentation method for PLS (PLS-IRRS), instead of PLS-SEM, should be jointly used with fsQCA [36]. This could be useful to address issue related unobserved heterogeneity that our data may contain.
Author Contributions
Mohammad Asif Salam designed the research, collected the data and drafted the manuscript. Murad Ali mainly worked on PLS-SEM, results, and analysis along with suggestions for the overall structure. Konan Anderson Seny Kan mainly worked on fsQCA, results, and analysis part. All the authors wrote, read and approved the final manuscript.
Conflicts of Interest
The authors declare no conflict of interest.
Appendix A

Table A1.
Demographic profile of the respondents.
| Information about Respondents | No. | % | Information about Sampling Firms | No. | % |
|---|---|---|---|---|---|
| (a) Education | (a) Industry type | ||||
| College degree | 53 | 36.3 | Supplier | 19 | 13.0 |
| Some college | 7 | 4.8 | Manufacturer | 90 | 61.6 |
| Advanced/Professional degree | 86 | 58.9 | Distributor | 20 | 13.7 |
| (b) Experience | Retailer | 3 | 2.1 | ||
| 1–5 Years | 24 | 16.4 | Transportation | 6 | 4.1 |
| 6–10 Years | 40 | 27.4 | Other | 8 | 5.5 |
| 11–15 Years | 28 | 19.2 | (b) Total annual sales revenue | ||
| 16–20 Years | 28 | 19.2 | $0 to $250 M | 37 | 25.3 |
| 20+ Years | 26 | 17.8 | $250 to $500 M | 43 | 29.5 |
| (c) Current role | 500 M to $1 B | 38 | 26.0 | ||
| Finance | 12 | 8.2 | $1 B to $3 B | 18 | 12.3 |
| IT/Technology | 17 | 11.6 | $3 B+ | 9 | 6.2 |
| Marketing | 50 | 34.2 | (c) Number of employees | ||
| Operations/Logistics | 49 | 33.6 | 100 or less | 15 | 10.3 |
| Other | 18 | 12.3 | 101–1000 | 78 | 53.4 |
| (d) Seniority level | 1001–10,000 | 44 | 30.1 | ||
| Level executive | 14 | 9.6 | 10,001 | 9 | 6.2 |
| Senior management | 50 | 34.2 | (d) Firm’s age | ||
| Middle management | 55 | 37.7 | 10 or less | 16 | 11.0 |
| Lower management | 26 | 17.8 | 11–50 | 118 | 80.8 |
| Admin/Other | 1 | 0.7 | 50 or more | 12 | 8.2 |
| (e) Industry sector | (e) Ownership structure of organization | ||||
| Petrochemical | 20 | 13.7 | Private | 85 | 58.2 |
| Retail | 18 | 12.3 | Public | 36.0 | 24.7 |
| Energy and Utilities | 18 | 12.3 | Joint (Public/Private) | 25 | 17.1 |
| Food & Agriculture | 17 | 11.6 | |||
| Building & Construction | 15 | 10.3 | |||
| Industrial Investment | 16 | 11.0 | |||
| Consumer electronics | 16 | 11.0 | |||
| Automotive industry | 15 | 10.3 | |||
| Others | 11 | 7.5 | |||
References
- Markman, G.D.; Waldron, T.L.; Panagopoulos, A. Organizational hostility: Why and how nonmarket players compete with firms. Acad. Manag. Perspect. 2016, 30, 74–92. [Google Scholar] [CrossRef]
- Bromiley, P.; Rau, D. Operations management and the resource-based view: Another view. J. Oper. Manag. 2016, 41, 95–106. [Google Scholar] [CrossRef]
- Breton-Miller, L.; Miller, D. The paradox of resource vulnerability: Considerations for organizational curatorship. Strateg. Manag. J. 2015, 36, 397–415. [Google Scholar] [CrossRef]
- Hult, G.T.M.; Ketchen, D.J.; Nichols, E.L. An examination of cultural competitiveness and order fulfillment cycle time within supply chains. Acad. Manag. J. 2002, 45, 577–586. [Google Scholar] [CrossRef]
- Hult, G.T.M.; Ketchen, D.J.; Slater, S.F. Information processing, knowledge development, and strategic supply chain performance. Acad. Manag. J. 2004, 47, 241–253. [Google Scholar] [CrossRef]
- Hult, G.T.M.; Ketchen, D.J.; Arrfelt, M. Strategic supply chain management: Improving performance through a culture of competitiveness and knowledge development. Strateg. Manag. J. 2007, 28, 1035–1052. [Google Scholar] [CrossRef]
- Roh, J.; Hong, P.; Min, H. Implementation of a responsive supply chain strategy in global complexity: The case of manufacturing firms. Int. J. Prod. Econ. 2014, 147, 198–210. [Google Scholar] [CrossRef]
- Culp, S. Supply Chain Disruption—A Major Threat to Business. Forbes. 2013. Available online: http://www.forbes.com/sites/steveculp/2013/02/15/supply-chaindisruption-a-major-threat-to-business (accessed on 12 November 2015).
- Culp, S. Supply Chain Risk a Hidden Liability for Many Companies. Forbes. 8 October 2012. Available online: http://www.forbes.com/sites/steveculp/2012/10/08/supply-chain-risk-a-hidden-liability-for-many-companies (accessed on 5 December 2015).
- Linton, J.D.; Klassen, R.; Jayaraman, V. Sustainable supply chains: An introduction. J. Oper. Manag. 2007, 25, 1075–1082. [Google Scholar] [CrossRef]
- Kalaitzi, D.; Matopoulos, A.; Bourlakis, M.; Tate, W.L. Supply chain strategies in an era of natural resource scarcity. Int. J. Oper. Prod. Manag. 2017. [Google Scholar] [CrossRef]
- Mishra, D.; Sharma, R.R.K.; Kumar, S.; Dubey, R. Bridging and buffering: Strategies for mitigating supply risk and improving supply chain performance. Int. J. Prod. Econ. 2016, 180, 183–197. [Google Scholar] [CrossRef]
- Markley, M.J.; Davis, L. Exploring future competitive advantage through sustainable supply chains. Int. J. Phys. Distrib. Logist. Manag. 2007, 37, 763–774. [Google Scholar] [CrossRef]
- Colicchia, C.; Strozzi, F. Supply chain risk management: A new methodology for a systematic literature review. Supply Chain Manag. 2012, 17, 403–418. [Google Scholar] [CrossRef]
- Brandon-Jones, E.; Squire, B.; Autry, C.W.; Petersen, K.J. A contingent resource-based perspective of supply chain resilience and robustness. J. Supply Chain Manag. 2014, 50, 55–73. [Google Scholar] [CrossRef] [Green Version]
- Balkin, D.B.; Gomez-Mejia, L.R. Toward a contingency theory of compensation strategy. Strateg. Manag. J. 1987, 8, 169–182. [Google Scholar] [CrossRef]
- Chandler, A.D., Jr. Strategy and Structure; MIT Press: Cambridge, MA, USA, 1962. [Google Scholar]
- Qi, Y.; Zhao, X.; Sheu, C. The impact of competitive strategy and supply chain strategy on business performance: The role of environmental uncertainty. Decis. Sci. 2011, 42, 371–389. [Google Scholar] [CrossRef]
- Hitt, M.A.; Ireland, R.D.; Palia, K.A. Industrial firms’ grand strategy and functional importance: Moderating effects of technology and uncertainty. Acad. Manag. J. 1982, 25, 265–298. [Google Scholar] [CrossRef]
- Wu, T.; Wu, Y.C.; Chen, Y.J.; Goh, M. Aligning supply chain strategy with corporate environmental strategy: A contingency approach. Int. J. Prod. Econ. 2014, 147, 220–229. [Google Scholar] [CrossRef]
- Yusuf, Y.Y.; Gunasekaran, A.; Adeleye, E.O.; Sivayoganathan, K. Agile supply chain capabilities: Determinants of competitive objectives. Eur. J. Oper. Res. 2004, 159, 379–392. [Google Scholar] [CrossRef]
- Lee, H.L. Aligning supply chain strategies with product uncertainties. Calif. Manag. Rev. 2002, 44, 105–119. [Google Scholar] [CrossRef]
- Fisher, M.L. What is the right supply chain for your product? Harv. Bus. Rev. 1997, 75, 105. [Google Scholar]
- Pfeffer, J.; Salancik, G.R. The External Control of Organizations: A Resource Dependence Perspective; Harper and Row: New York, NY, USA, 1978. [Google Scholar]
- Paulraj, A.; Chen, I.J. Environmental uncertainty and strategic supply management: A Resource dependence perspective and performance implications. J. Supply Chain Manag. 2007, 43, 29–42. [Google Scholar] [CrossRef]
- Ulrich, D.; Barney, J.B. Perspectives in organizations: Resource dependence, efficiency, and population. Acad. Manag. Rev. 1984, 9, 471–481. [Google Scholar]
- Cyert, R.; March, J. A Behavioral Theory of the Firm; Prentice-Hall: Englewood Cliffs, NJ, USA, 1963. [Google Scholar]
- Barney, J. Firm resources and sustained competitive advantage. J. Manag. 1991, 17, 99–120. [Google Scholar] [CrossRef]
- Barringer, B.R.; Harrison, J.S. Walking a Tightrope: Creating Value through Interorganizational Relationships. J. Manag. 2000, 26, 367–403. [Google Scholar] [CrossRef]
- Van der Vorst, G.A.J.; Beulens, J.M. Identifying sources of uncertainty to generate supply chain redesign strategies. Int. J. Phys. Distrib. Logist. Manag. 2002, 32, 409–430. [Google Scholar] [CrossRef]
- Arbussa, A.; Bikfalvi, A.; Marquès, P. Strategic Agility-Driven Business Model Renewal: The Case of an SME. Manag. Decis. 2017, 55, 271–293. [Google Scholar] [CrossRef]
- Christopher, M.; Ryals, L. Supply chain strategy: Its impact on shareholder value. Int. J. Logist. Manag. 1999, 10, 1–10. [Google Scholar] [CrossRef]
- Mason-Jones, R.; Naylor, B.; Towill, D.R. Lean, Agile or Leagile? Matching your supply chain to the marketplace. Int. J. Prod. Res. 2000, 38, 4061–4070. [Google Scholar] [CrossRef]
- Ketchen, D.J.; Hult, G.T.M. Bridging organization theory and supply chain management: The case of best value supply chains. J. Oper. Manag. 2007, 25, 573–580. [Google Scholar] [CrossRef]
- Bowersox, D.J.; Closs, D.J.; Cooper, M.B. Supply Chain Logistics Management; McGraw Hill: Irwin, NY, USA, 2002. [Google Scholar]
- Schlittgen, R.; Ringle, C.M.; Sarstedt, M.; Becker, J.-M. Segmentation of PLS Path Models by Iterative Reweighted Regressions. J. Bus. Res. 2016, 69, 4583–4592. [Google Scholar] [CrossRef]
- Ringle, C.M.; Sarstedt, M. Gain more insight from your PLS-SEM results: The importance-performance map analysis. Ind. Manag. Data Syst. 2016, 116, 1865–1886. [Google Scholar] [CrossRef]
- Phillips, L. Assessing measurement error in key informant reports: A methodological note on organizational analysis in marketing. J. Mark. Res. 1981, 18, 395–415. [Google Scholar] [CrossRef]
- Huber, G.P.; Power, D.J. Retrospective reports of strategic-level managers: Guidelines for increasing their accuracy. Strateg. Manag. J. 1985, 6, 171–180. [Google Scholar] [CrossRef]
- Tan, K. A structure equation model of new product design and development. Decis. Sci. 2001, 32, 195–226. [Google Scholar] [CrossRef]
- Becker, J.M.; Klein, K.; Wetzels, M. Hierarchical latent variable models in PLS-SEM: Guidelines for using reflective-formative type models. Long Range Plan. 2012, 45, 359–394. [Google Scholar] [CrossRef]
- Chen, I.J.; Paulraj, A. Towards a Theory of Supply Chain Management: The Constructs and Measurements. J. Oper. Manag. 2004, 22, 119–150. [Google Scholar] [CrossRef]
- Power, D.; Boonyathan, P. The Relationship between strategic response to supply chain uncertainty, supply chain relationships and firm’s performance—A conceptual framework. In Proceedings of the Production and Operation Management Society Conference, Shanghai, China, 19–23 June 2006. [Google Scholar]
- Bayraktar, E.; Demirbag, M.; Koh, S.L.; Tatoglu, E.; Zaim, H. A causal analysis of the impact of information systems and supply chain management practices on operational performance: Evidence from manufacturing SMEs in Turkey. Int. J. Prod. Econ. 2009, 122, 133–149. [Google Scholar] [CrossRef]
- Ringle, C.M.; Wende, S.; Becker, J.M. SmartPLS 3; SmartPLS GmbH: Boenningstedt, Germany, 2015. Available online: http://www.smartpls.com (accessed on 2 September 2017).
- Hair, J.F.; Hult, G.T.M.; Ringle, C.; Sarstedt, M. A Primer on Partial Least Squares Structural Equation Modeling (PLS-SEM), 2nd ed.; Sage Publications: Thousand Oaks, CA, USA, 2017. [Google Scholar]
- Sarstedt, M.; Ringle, C.M.; Hair, J.F. Partial least squares structural equation modeling. In Handbook of Market Research; Homburg, C., Klarmann, M., Vomberg, A., Eds.; Springer: Cham, Switzerland, 2017; pp. 1–40. [Google Scholar]
- Hair, J.F.; Sarstedt, M.; Ringle, C.M.; Mena, J.A. An assessment of the use of partial least squares structural equation modeling in marketing research. J. Acad. Mark. Sci. 2012, 40, 414–433. [Google Scholar] [CrossRef]
- Chin, W.W. How to write up and report pls analyses. In Handbook of Partial Least Squares: Concepts, Methods and Applications; Esposito Vinzi, V., Chin, W.W., Henseler, J., Wang, H., Eds.; Springer: Berlin/Heidelberg, Germany, 2010; pp. 655–690. [Google Scholar]
- Richter, N.F.; Cepeda, G.; Roldán, J.L.; Ringle, C.M. European management research using partial least squares structural equation modeling (PLS-SEM). Eur. Manag. J. 2016, 33, 1–3. [Google Scholar] [CrossRef]
- Hair, J.F.; Sarstedt, M.; Ringle, C.M.; Gudergan, S.P. Advanced Issues in Partial Least Squares Structural Equation Modeling; SAGE Publications, Incorporated: Thousand Oaks, CA, USA, 2017. [Google Scholar]
- Fang, E.; Palmatier, R.W.; Grewal, R. Effects of customer and innovation asset configuration strategies on firm performance. J. Mark. Res. 2011, 48, 587–602. [Google Scholar] [CrossRef]
- Fiss, P.C. Building better causal theories: A fuzzy set approach to typologies in organization research. Acad. Manag. J. 2011, 54, 393–420. [Google Scholar] [CrossRef]
- Seny Kan, K.A.; Adegbite, E.; El Omari, S.; Abdellatif, M. On the use of qualitative comparative analysis in management. J. Bus. Res. 2015, 69, 1458–1463. [Google Scholar] [CrossRef] [Green Version]
- Mikalef, P.; Pateli, A. Information technology-enabled dynamic capabilities and their indirect effect on competitive performance: Findings from PLS-SEM and fsQCA. J. Bus. Res. 2017, 70, 1–16. [Google Scholar] [CrossRef]
- Ali, M.; Seny Kan, K.A.; Sarstedt, M. Direct and configurational paths of absorptive capacity and organizational innovation to successful organizational performance. J. Bus. Res. 2016, 69, 5317–5323. [Google Scholar] [CrossRef]
- Ragin, C.C. Redesigning Social Inquiry: Fuzzy Sets and Beyond; University of Chicago Press: Chicago, IL, USA, 2008. [Google Scholar]
- Nunnally, J. Psychometric Theory; McGraw-Hill: New York, NY, USA, 1978. [Google Scholar]
- Fornell, C.; Larcker, D.F. Evaluating structural equation models with unobservable variables and measurement error. J. Mark. Res. 1981, 18, 39–50. [Google Scholar] [CrossRef]
- Bellis, E.; Sprott, D.E.; Herrmann, A.; Bierhoff, H.W.; Rohmann, E. The influence of trait and state narcissism on the uniqueness of mass-customized products. J. Retail. 2016, 92, 162–172. [Google Scholar] [CrossRef]
- Sarstedt, M.; Ringle, C.M.; Smith, D.; Reams, R.; Hair, J.F. Partial least squares structural equation modeling (PLS-SEM): A Useful tool for family business researchers. J. Fam. Bus. Strategy 2014, 5, 105–115. [Google Scholar] [CrossRef]
- Lenny Koh, S.C.; Demirbag, M.; Bayraktar, E.; Tatoglu, E.; Zaim, S. The impact of supply chain management practices on performance of SMEs. Ind. Manag. Data Syst. 2007, 107, 103–124. [Google Scholar] [CrossRef]
- Wu, P.L.; Yeh, S.S.; Woodside, A.G. Applying complexity theory to deepen service dominant Logic: Configural analysis of customer experience-and-outcome assessments of professional services for personal transformation. J. Bus. Res. 2014, 67, 1647–1670. [Google Scholar] [CrossRef]
- Sarstedt, M.; Ringle, C.M.; Henseler, J.; Hair, J.F. On the emancipation of PLS-SEM. A commentary on Rigdon (2012). Long Range Plan. 2014, 47, 154–160. [Google Scholar] [CrossRef]
- Chin, W. Issues and Opinion on Structural Equation Modeling. MIS Q. 1998, 22, 7–16. [Google Scholar]
- Zhao, X.; Lynch, J.G.; Chen, Q. Reconsidering Baron and Kenny: Myths and truths about mediation analysis. J. Consum. Res. 2010, 37, 197–206. [Google Scholar] [CrossRef]
- Preacher, K.J.; Hayes, A.F. Asymptotic and resampling strategies for assessing and comparing indirect effects in simple and multiple mediator models. Behav. Res. Methods 2008, 40, 879–891. [Google Scholar] [CrossRef] [PubMed]
- Baron, R.M.; Kenny, D.A. The moderator-mediator variable distinction in social psychological research: Conceptual, strategic, and statistical considerations. J. Personal. Soc. Psychol. 1986, 51, 1173–1182. [Google Scholar] [CrossRef]
- Woodside, A.G.; Hsu, S.Y.; Marshall, R. The general theory of cultures’ consequences on international tourism behavior. J. Bus. Res. 2011, 64, 785–799. [Google Scholar] [CrossRef]
- Ragin, C.C. Calibrating fuzzy sets. In Redesigning Social Inquiry: Fuzzy Sets and Beyond; Ragin, C.C., Ed.; University of Chicago Press: Chicago, IL, USA, 2008; pp. 85–105. [Google Scholar]
- Tóth, Z.; Thiesbrummel, C.; Henneberg, S.C.; Naudé, P. Understanding configurations of the relational attractiveness of the customer firm using fuzzy set QCA. J. Bus. Res. 2015, 68, 723–734. [Google Scholar] [CrossRef]
- Ragin, C.C. Qualitative comparative analysis using fuzzy sets (fsQCA). In Configurational Comparative Methods, Qualitative Comparative Analysis (QCA) and Related Techniques; Benoît, R., Ragin, C.C., Eds.; Sage: Los Angeles, CA, USA, 2009; pp. 87–121. [Google Scholar]
- Ragin, C.C. Fuzzy-Set Social Science; University of Chicago Press: Chicago, IL, USA, 2000. [Google Scholar]
- Ragin, C.C.; Fiss, P.C. Net effects analysis versus configurational analysis: An empirical demonstration. In Redesigning Social Inquiry: Fuzzy Sets and Beyond; Ragin, C.C., Ed.; University of Chicago Press: Chicago, IL, USA, 2008; pp. 190–212. [Google Scholar]
- Gigerenzer, G.; Brighton, H. Homo heuristicus: Why biased minds make better inferences. Top. Cognit. Sci. 2009, 1, 107–143. [Google Scholar] [CrossRef] [PubMed]
- Woodside, A.G. Embrace perform model: Complexity theory, contrarian case analysis, and multiple realities. J. Bus. Res. 2014, 67, 2495–2503. [Google Scholar] [CrossRef]
- Ali, Z.; Sun, H.; Ali, M. The Impact of Managerial and Adaptive Capabilities to Stimulate Organizational Innovation in SMEs: A Complementary PLS–SEM Approach. Sustainability 2017, 9, 2157. [Google Scholar] [CrossRef]
- Cepeda-Carrión, G.C.; Henseler, J.; Ringle, C.M.; Roldán, J.L. Prediction-oriented modeling in business research using PLS path modeling: An introduction to a JBR special section. J. Bus. Res. 2016, 69, 4545–4551. [Google Scholar] [CrossRef]
- Raïes, K.; Mühlbacher, H.; Gavard-Perret, M.L. Consumption community commitment: Newbies’ and longstanding members’ brand engagement and loyalty. J. Bus. Res. 2015, 68, 2634–2644. [Google Scholar] [CrossRef]
- Busse, C.; Mollenkopf, D.A. Under the umbrella of sustainable supply chain management: Emergent solutions to real-world problems. Int. J. Phys. Distrib. Logist. Manag. 2017, 47, 342–343. [Google Scholar] [CrossRef]
- Berti, G.; Mulligan, C. Competitiveness of Small Farms and Innovative Food Supply Chains: The Role of Food Hubs in Creating Sustainable Regional and Local Food Systems. Sustainability 2016, 8, 616. [Google Scholar] [CrossRef]
- Mikalef, P.; Pateli, A.; Batenburg, R.S.; Wetering, R.V.D. Purchasing alignment under multiple contingencies: A configuration theory approach. Ind. Manag. Data Syst. 2015, 115, 625–645. [Google Scholar] [CrossRef]
- Salam, M. A. The Mediating Role of Supply Chain Collaboration on the Relationship between Technology, Trust and Operational Performance: An Empirical Investigation. Benchmarking Int. J. 2017, 24, 298–317. [Google Scholar] [CrossRef]
- Touboulic, A.; Walker, H. A relational, transformative and engaged approach to sustainable supply chain management: The potential of action research. Hum. Relat. 2016, 69, 301–343. [Google Scholar] [CrossRef]
Figure 1.
Results of the structural model; note: * |t| ≥ 1.96 at p = 0.05 level; ** |t| ≥ 2.58 at p = 0.01 level; *** |t| ≥ 3.29 at p = 0.001 level.
Figure 1.
Results of the structural model; note: * |t| ≥ 1.96 at p = 0.05 level; ** |t| ≥ 2.58 at p = 0.01 level; *** |t| ≥ 3.29 at p = 0.001 level.

Figure 2.
Test of Part 1 of the solution from the modeling subsample using data from the holdout subsample.
Figure 2.
Test of Part 1 of the solution from the modeling subsample using data from the holdout subsample.

Table 1.
Descriptive statistics, correlations for the study constructs.
| M | S.D | ASC | ESC | RHSC | RSC | SCU | DU | SU | SCS | FLEX | SPD | OP | |
|---|---|---|---|---|---|---|---|---|---|---|---|---|---|
| ASC | 3.26 | 0.75 | 0.85 | ||||||||||
| ESC | 3.91 | 0.70 | 0.32 ** | 0.79 | |||||||||
| RHSC | 3.25 | 0.79 | 0.27 ** | 0.31 ** | 0.84 | ||||||||
| RSC | 3.76 | 0.62 | 0.60 ** | 0.11 ** | 0.52 ** | 0.71 | |||||||
| SCS | 3.14 | 0.51 | 0.50 ** | 0.50 ** | 0.27 ** | 0.47 ** | 0.60 | ||||||
| DU | 2.81 | 0.74 | 0.12 | 0.19 * | 0.13 | 0.18 * | 0.18 * | 0.81 | |||||
| SU | 3.47 | 0.65 | 0.10 | 0.32 ** | 0.16 * | 0.23 ** | 0.23 ** | 0.077 | 0.84 | ||||
| SCU | 3.54 | 0.59 | 0.15 | 0.36 ** | 0.20 * | 0.28 ** | 0.28 ** | 0.600 ** | 0.50 ** | 0.66 | |||
| FLEX | 3.61 | 0.59 | 0.23 ** | 0.29 ** | 0.23 ** | 0.31 ** | 0.31 ** | 0.327 ** | 0.19 * | 0.34 ** | 0.77 | ||
| SPD | 3.89 | 0.53 | 0.17 * | 0.17 * | 0.21 ** | 0.14 | 0.21 ** | 0.112 | 0.19 * | 0.18 * | 0.46 ** | 0.78 | |
| OP | 3.75 | 0.48 | 0.24 ** | 0.28 ** | 0.26 ** | 0.27 ** | 0.31 ** | 0.26 ** | 0.22 ** | 0.31 ** | 0.57 ** | 0.64 ** | 0.66 |
M = Mean, S.D = Standard deviation. ASC = Agile supply chain. ESC = Efficient supply chain. RHSC = Risk-Hedging supply chain. RSC = Responsive supply chain. SCS = Supply chain strategy. DU = Demand uncertainty. SU = Agile supply chain. SCU = Supply chain uncertainty. FLEX = Flexibility. SPD = Speed. OP = Operational performance. Diagonal and italicized bold elements are the square roots of the AVE (average variance extracted). Off-diagonal elements are the correlation between constructs’ variables. * |t| ≥ 1.65 at p = 0.10 level. ** |t| ≥ 1.96 at p = 0.05 level.
Table 2.
Measurement Model.
| Construct | Code | Items | FOL | SOL |
|---|---|---|---|---|
| Measurement model at first-order factors (First-stage) | ||||
| ASC (reflective) [22,43] | ||||
| C.R = 0.89; α = 0.83; AVE = 0.67; VIF = 2.99 | SSA1 | Our supply chain always faces the volatile customer demand. | 0.81 | 0.74 |
| SSA2 | Our supply chain needs to maintain a higher capacity buffer in response to the volatile market. | 0.85 | 0.75 | |
| SSA3 | Our supply chain provides the customer with personalized products. | 0.81 | 0.69 | |
| SSA4 | Our supply chain structure often changes to cope with a volatile market. | 0.80 | 0.76 | |
| ESC (reflective) [22,43] | ||||
| C.R = 0.84; α = 0.71; AVE = 0.64; VIF = 1.12 | SSE1 | Our supply chain supplies predictable products | 0.83 | 0.57 |
| SSE2 | Our supply chain reduces any waste as much as possible | 0.83 | 0.64 | |
| SSE3 | Our supply chain reduces costs through mass production. | 0.72 | 0.47 | |
| RHSC (reflective) [22,43] | ||||
| C.R = 0.88; α = 0.80; AVE = 0.71; VIF = 1.78 | SSH1 | Our supply chain partners are ready to share resources whenever necessary | 0.89 | 0.75 |
| SSH2 | Our supply chain reduces costs through sharing capacities/resources | 0.86 | 0.69 | |
| SSH3 | Our supply chain partners are always ready to support and cooperate | 0.78 | 0.76 | |
| RSC (reflective) [22,43] | ||||
| C.R = 0.80; α = 0.70; AVE = 0.50; VIF = 1.81 | SSR1 | Our supply offers wider product range | 0.76 | 0.57 |
| SSR2 | Our supply chain offers new products more frequently | 0.77 | 0.64 | |
| SSR3 | Our supply chain offer more innovative products | 0.64 | 0.47 | |
| SSR4 | Our supply chain provides fast deliveries | 0.66 | 0.74 | |
| DU [42] | ||||
| C.R = 0.88; α = 0.81; AVE = 0.65; VIF = 1.56 | SUD1 | Our master production schedule has a high degree of variation in demand over time. | 0.86 | 0.54 |
| SUD2 | Our demand fluctuates drastically from week to week. | 0.86 | 0.49 | |
| SUD3 | Our requirements for raw materials supply vary drastically from week to week. | 0.84 | 0.51 | |
| SUD4 | Customer requirements/services for products change dramatically. | 0.63 | 0.42 | |
| SU [42] | ||||
| C.R = 0.91; α = 0.87; AVE = 0.71; VIF = 2.84 | SUS1 | Our suppliers always provide us a correct lead time estimation | 0.82 | 0.62 |
| SUS2 | Our suppliers consistently meet our delivery requirements | 0.87 | 0.73 | |
| SUS3 | Our suppliers provide us the input with consistent quality | 0.88 | 0.77 | |
| SUS4 | Our suppliers consistently meet specified volume requirements | 0.81 | 0.65 | |
| FLEX (reflective) [44] | ||||
| C.R = 0.86; α = 0.78; AVE = 0.60; VIF = 3.14 | FPF1 | Ability to customize products/services | 0.79 | 0.60 |
| FPF2 | Ability to respond to changes in delivery requirement | 0.74 | 0.50 | |
| FPF3 | Ability to adjust production volumes | 0.81 | 0.73 | |
| FPF4 | Ability to produce a range of products/services | 0.75 | 0.72 | |
| SPD (reflective) [44] | ||||
| C.R = 0.86; α = 0.79; AVE = 0.61; VIF = 1.28 | FPS1 | On time delivery | 0.80 | 0.71 |
| FPS2 | Delivery Dependability | 0.81 | 0.68 | |
| FPS3 | Delivery Speed | 0.70 | 0.60 | |
| FPS4 | Time to Market | 0.82 | 0.73 | |
| Measurement model at second-order factors (Second-stage) * | ||||
| SCS | Supply Chain Strategy | |||
| C.R = 0.82; α = 0.74; AVE = 0.92 | ASC | Agile supply chain | 0.80 | |
| ESC | Efficient supply chain | 0.85 | ||
| RHSC | Risk Hedging supply chain | 0.77 | ||
| RSC | Responsive supply chain | 0.95 | ||
| SCU | Supply Chain Uncertainty | |||
| C.R = 0.92; α = 0.90; AVE = 0.87 | DU | Demand uncertainty | 0.75 | |
| SU | Supply uncertainty | 0.76 | ||
| OP | Operational performance | |||
| C.R = 0.86; α = 0.82; AVE = 0.89 | FLEX | Flexibility | 0.64 | |
| SPD | Speed | 0.96 | ||
Note: All loadings and weights are significant at 0.001 level (2-tailed). * Second order construct, two-stage approach. FOL = First-order loadings. SOL = Second-order loadings. C.R = Composite reliability. α = Cronbachs Alpha. AVE = Average variance extracted. VIF = Variance inflation factor.
Table 3.
Mediation Analysis Results.
| Mediation Model | Standardized Coefficient | t-Value | 95% CI | VAF (%) | f2 † | q2 † | Conclusion |
|---|---|---|---|---|---|---|---|
| Direct effect | |||||||
| SCU on OP | 0.27 ** | 3.02 | (0.37, 0.43) | 0.17 | |||
| SCU on SCS | 0.30 *** | 3.91 | (0.38, 0.44) | 0.21 | 0.04 | H1 supported | |
| SCS on OP | 0.25 ** | 3.20 | (0.15, 0.19) | 0.17 | 0.04 | H2 supported | |
| Indirect effect | |||||||
| SCU on OP (mediated by SCS) | 0.07 *** | 13.31 | (0.06, 0.08) | 22.15 | H3 supported | ||
Note: CI = Confidence interval; VAF (%) = Variance represented percentage. † = Effect size. The values of f2 and q2; 0.02, 0.15, 0.35 for weak, moderate, strong effects. * |t| ≥ 1.96 at p = 0.05 level; ** |t| ≥ 2.58 at p = 0.01 level; *** |t| ≥ 3.29 at p = 0.001 level.
Table 4.
Solutions table indicating the configurations needed to achieve high OP.
| Configuration | Solution | |||||
|---|---|---|---|---|---|---|
| 1a | 1b | 2 | 3 | 4 | 5 | |
| SCS | ||||||
| ASC |  | | |  | | |
| ESC | | | | | | |
| RSC |  | | | | | |
| RHSC |  | | | | | |
| SCU | ||||||
| DU | | | | | | |
| SU | | | | | | |
| Consistency | 0.99 | 0.93 | 0.88 | 0.80 | 0.87 | 0.86 |
| Raw coverage | 0.17 | 0.21 | 0.16 | 0.10 | 0.13 | 0.21 |
| Unique coverage | 0.00 | 0.03 | 0.08 | 0.02 | 0.06 | 0.11 |
| Overall solution consistency | 0.84 | |||||
| Overall solution coverage | 0.56 | |||||
Note: “ ![Sustainability 09 02217 i002]() ” indicates the presence of a condition, and “
” indicates the presence of a condition, and “ ![Sustainability 09 02217 i001]() ” indicate the absence. Framed signs (“
” indicate the absence. Framed signs (“ ![Sustainability 09 02217 i004]() ” and “
” and “ ![Sustainability 09 02217 i003]() ”) indicate core conditions; signs without frame indicate (“
”) indicate core conditions; signs without frame indicate (“ ![Sustainability 09 02217 i002]() ” and “
” and “ ![Sustainability 09 02217 i001]() ”) peripheral conditions. Blank spaces indicate “don’t care.”
”) peripheral conditions. Blank spaces indicate “don’t care.”
” indicates the presence of a condition, and “ ” indicate the absence. Framed signs (“ ” and “ ”) indicate core conditions; signs without frame indicate (“ ” and “ ”) peripheral conditions. Blank spaces indicate “don’t care.”
Table 5.
Complex configurations of SCU and strategy dimensions, which indicate a high level of OP for the modeling subsample.
Table 5.
Complex configurations of SCU and strategy dimensions, which indicate a high level of OP for the modeling subsample.
| Solution from the Modeling Subsample | Raw Coverage | Unique Coverage | Consistency |
|---|---|---|---|
| 1. ~su*du*~esc*~asc*~rsc*~rhsc | 0.12 | 0.05 | 0.84 |
| 2. su*~du*esc*~asc*rsc*~rhsc | 0.14 | 0.08 | 0.95 |
| 3. ~su*du*esc*~asc*rsc*~rhsc | 0.07 | 0.01 | 0.98 |
| 4. su*du*~esc*asc*~rsc*rhsc | 0.15 | 0.08 | 0.89 |
| 5. su*du*esc*asc*rsc*rhsc | 0.19 | 0.12 | 0.87 |
| Overall solution consistency: | 0.87 | ||
| Overall solution coverage: | 0.47 | ||
Note: SU: Supply uncertainty, DU: Demand uncertainty, ASC: Agile supply chain, ESC: Efficient supply chain, RSC: Responsive supply chain, RHSC: Risk-hedging supply chain, and “~”: the negation of the condition.
© 2017 by the authors. Licensee MDPI, Basel, Switzerland. This article is an open access article distributed under the terms and conditions of the Creative Commons Attribution (CC BY) license (http://creativecommons.org/licenses/by/4.0/).
Share and Cite
MDPI and ACS Style
Salam, M.A.; Ali, M.; Seny Kan, K.A. Analyzing Supply Chain Uncertainty to Deliver Sustainable Operational Performance: Symmetrical and Asymmetrical Modeling Approaches. Sustainability 2017, 9, 2217. https://doi.org/10.3390/su9122217
AMA Style
Salam MA, Ali M, Seny Kan KA. Analyzing Supply Chain Uncertainty to Deliver Sustainable Operational Performance: Symmetrical and Asymmetrical Modeling Approaches. Sustainability. 2017; 9(12):2217. https://doi.org/10.3390/su9122217
Chicago/Turabian StyleSalam, Mohammad Asif, Murad Ali, and Konan Anderson Seny Kan. 2017. "Analyzing Supply Chain Uncertainty to Deliver Sustainable Operational Performance: Symmetrical and Asymmetrical Modeling Approaches" Sustainability 9, no. 12: 2217. https://doi.org/10.3390/su9122217
Note that from the first issue of 2016, this journal uses article numbers instead of page numbers. See further details here.