Article

Uncovering the Green, Blue, and Grey Water Footprint and Virtual Water of Biofuel Production in Brazil: A Nexus Perspective

by
Raul Munoz Castillo
1,2,
Kuishuang Feng
1,
Klaus Hubacek
1,3,*,
Laixiang Sun
1,4,
Joaquim Guilhoto
5,6 and
Fernando Miralles-Wilhelm
7
1
Department of Geographical Sciences, University of Maryland, College Park, MD 20742, USA
2
Water & Sanitation Division, Inter-American Development Bank, Washington, DC 20057, USA
3
Department of Environmental Studies, Masaryk University, Brno 602 00, Czech Republic
4
International Institute for Applied Systems Analysis (IIASA), Laxenburg A-2361, Austria
5
Organization for Economic Co-operation and Development (OECD), 75775 Paris, France
6
Department of Economics, University of São Paulo, São Paulo 05508-020, Brazil
7
Department of Atmospheric and Oceanic Sciences, College Park, University of Maryland, College Park, MD 20742, USA
*
Author to whom correspondence should be addressed.
Sustainability 2017, 9(11), 2049; https://doi.org/10.3390/su9112049
Submission received: 27 September 2017 / Revised: 29 October 2017 / Accepted: 30 October 2017 / Published: 8 November 2017
(This article belongs to the Special Issue Natural Resources Economics)

Abstract

:
Brazil plays a major role in the global biofuel economy as the world’s second largest producer and consumer and the largest exporter of ethanol. Its demand is expected to significantly increase in coming years, largely driven by national and international carbon mitigation targets. However, biofuel crops require significant amounts of water and land resources that could otherwise be used for the production of food, urban water supply, or energy generation. Given Brazil’s uneven spatial distribution of water resources among regions, a potential expansion of ethanol production will need to take into account regional or local water availability, as an increased water demand for irrigation would put further pressure on already water-scarce regions and compete with other users. By applying an environmentally extended multiregional input-output (MRIO) approach, we uncover the scarce water footprint and the interregional virtual water flows associated with sugarcane-derived biofuel production driven by domestic final consumption and international exports in 27 states in Brazil. Our results show that bio-ethanol is responsible for about one third of the total sugarcane water footprint besides sugar and other processed food production. We found that richer states such as São Paulo benefit by accruing a higher share of economic value added from exporting ethanol as part of global value chains while increasing water stress in poorer states through interregional trade. We also found that, in comparison with other crops, sugarcane has a comparative advantage when rainfed while showing a comparative disadvantage as an irrigated crop; a tradeoff to be considered when planning irrigation infrastructure and bioethanol production expansion.

1. Introduction

The interdependency between land, energy, and water systems has gained increasing interest as demand for these vital resources is growing around the world, leading to resource scarcity and adverse environmental impacts [1]. At the same time, there is increasing competition for these resources from other economic sectors, domestically and from abroad. The stress on these resources is further enhanced through their vulnerability to climate change. Several world regions are already experiencing security challenges in food, energy, and water systems (FEWS), adversely affecting sustainable development [1].
In this context, the bioenergy sector is at the core of the energy-water nexus. Biofuels, mostly based on crops, may contribute to the enhancement of energy security in countries lacking direct access to fossil fuel deposits, the reduction of greenhouse gas (GHG) emissions, and a more profitable use of crops than in the food market [2]. However, the production of biofuel crops requires water and land resources [3,4] that could otherwise be used for the production of food (FAO, OECD) and other important ecosystem goods and services. Therefore, the competing needs for land and water resources by food and biofuel production are at the forefront of the energy-food debate [5]. For example, the global biofuel water footprint is estimated to increase more than tenfold in the period 2005–2030, reaching up to 5.5% of the totally available blue water for humans, placing extra pressure on fresh water resources in China, Brazil, and the US, who contribute about half of the global biofuel water footprint [3]. In the longer term, the impacts may be even higher, especially given climate change [6].
The water footprint (WF) [7,8] serves as a framework for assessing the link between human consumption and the appropriation of freshwater. The WF of a product (or service) represents the total amount of water used during all production steps required to produce the product (or service), and is expressed in water volume per unit of product (e.g., m3/ton). The blue WF is defined as the volume of surface and groundwater consumed (evaporated) during production. The green WF refers to the amount of rainwater consumed. The grey WF is the volume of freshwater that is required to assimilate the load of pollutants based on existing ambient water quality standards [8]. Blue water is generally scarcer and has higher opportunity costs than green water. In addition, blue water can substitute for green water and therefore, a comprehensive assessment of WF requires a consideration of both green and blue water footprints [8].
Brazil is the world’s second largest producer and consumer and the largest exporter of ethanol, which is largely derived from sugarcane [9]. The production of sugarcane-derived ethanol in Brazil was boosted by the oil crisis in the 1970s thanks to the “Proalcool” Program launched by the Brazilian government with the aim of promoting the use of ethanol in the transportation sector. The existing literature assumes that Brazil will be a major supplier of bioenergy to international markets under future climate mitigation scenarios given its assumed abundance of water resources. For instance, an assessment of the global blue and green water footprint of road transport in 2030 concluded that only Brazil has sufficient available water resources to meet targets for 2030 since the other three large producers (the US, India, and China) would suffer from water shortages, and would not even be able to sustain their own biofuel production in a self-sufficiency scenario [3].
While Brazil is indeed a well-endowed country in terms of water availability with a national average of 33,000 m3/cap/yr [10], it is at the same time subject to high temporal and spatial variability. The lowest value of water per capita is found in the Atlantic Northeast hydrographic region, with less than 1200 m3/cap/year, and values lower than 500 m3/cap/year in some of the main watersheds. These watersheds also suffer from water quality problems which further restrict the uses of water [10]. In light of these regional differences of water availability, investments in irrigation and regional infrastructure development would allow for a greater expansion of sugarcane production, but need to take into account regional or local water availability, as an increased water demand for irrigation would put pressure on other users, which could intensify conflicts in water-scarce regions such as Eastern and Northeastern Brazil [9,10]. On the other hand, limiting irrigation for bioenergy will substantially increase land requirements.
Sugarcane and ethanol productions negatively affect water quality and aquatic systems in Brazil. One of the main causes of such impacts is sedimentation downhill across the landscape from sugarcane fields that is deposited into wetlands, streams, rivers, and reservoirs. The severity of the problem of sedimentation is aggravated even further by the transport of contaminants such as pesticides and heavy metals used for sugarcane cultivation to aquatic systems [11]. As over-fertilization for sugarcane is a usual problem in Brazil, consequent losses of nutrients to aquatic systems (mainly Nitrogen, but also Phosphorus and Potassium) are one of the main causes of impacts on water quality associated with its production, leading to eutrophication in water bodies and aquatic systems. The industrial processing of ethanol is another important source of pollution through the generation of wastewater and vinasse (liquid byproduct of ethanol), produced from the distillation process, both rich in organic matter and therefore increasing the BOD (biochemical oxygen demand) of the water bodies [11]. The pollution of watercourses and bodies not only impacts the ecological equilibrium of the receiving ecosystems, but also affects other water uses downstream, limiting the access to freshwater to other users and increasing treatment costs.
Given the potential increase of external demand driven by on-going international commitments for climate change mitigation, it becomes critical for Brazil to consider regional differences in water availability. This is needed to avoid transferring the negative environmental impacts of meeting international bioenergy mandates to the producing regions, potentially aggravating already complex water resource problems [12].
Yet previous analyses considering the overall water availability at the national level have largely ignored potential impacts on water resources at state or local levels driven by future increased biofuel production. This is especially relevant in more water stressed regions and states with increasing competition for water use among economic sectors along their national and global supply chains. This is echoed by [13], who assessed the direct and indirect impacts on water consumption of the power sector in major emitting economies, including Brazil, under the Nationally Determined Contributions (NDCs) and longer-term mitigation scenarios and concluded that in light of geographically uneven water scarcity, climate policy decisions concerning the biofuels sector should consider not only on-site water demands, but also the virtual water input from upstream sectors, as well as the virtual water embedded in goods that move in national and international trade.
Another important shortcoming of the literature on the water footprint of biofuels in Brazil is their main focus on blue (irrigation) water driven by sugarcane production. However, it is key to include the green water footprint in the analysis because of the competition for rainwater between crops [3]. Introducing the green water footprint allows one to account for the water footprint associated with irrigated and rainfed sugarcane production, which ultimately is an indicator of the tradeoffs between water and land impacts of sugarcane production. Also, the expansion of biofuel crops may lead to water pollution, thus limiting the availability of water to other crops or sectors due to water quality impacts of the utilization of fertilizers and pesticides.
This study analyzes the spatial distribution, at the state level, of virtual water flows and the water footprint associated with sugarcane-derived ethanol production and consumption in Brazil. By applying an environmentally extended multiregional input-output (MRIO) approach, we estimate the water footprint, including blue, green, and grey water; the scarce water footprint; and the interregional virtual water flows across Brazil at the state level driven by ethanol production and international exports. We also use a comparative advantage ratio to assess the competitiveness of sugarcane compared to other crops in terms of the value added per unit of water consumption.

2. Materials and Methods

Using MRIO analysis, we calculated production and consumption-based WF and scarce water footprints (SWF) of bioethanol and associated virtual water flows associated with interregional and international trade. The SWF is the original WF weighed by the water scarcity in the catchment (aggregated to the state level) where the WF is located; this provides a water-scarcity weighted WF that reflects the potential local environmental impacts of water consumption [14]. Through this analysis, we explored the comparative advantage of using water to produce sugarcane (the major crop for biofuel production in Brazil) versus other agricultural crops and other economic sectors across Brazil.

2.1. Data Sources

We used an MRIO table for Brazil for the year 2011 at the state level (27 states). The MRIO tables were built based on 27 state I-O tables and estimated inter-regional trade flows [15,16,17]. The database offers a highly detailed description of the economy with 149 sectors, including 18 agricultural sectors; three primary energy sectors; seven power generation sectors; and two biofuel production sectors, including one for sugarcane-based ethanol, providing more detail than previous studies.
To estimate the green, blue, and grey water footprint for the agricultural sectors, we combined state-level water consumption factors in m3/ton from the Water Footprint Network [18], linked to crop data from the National Census of Agriculture [19] including 35 permanent and 31 temporary crops that we aggregate to match the MRIO sectors.
In this way, we were able to capture both rainfed and irrigated agriculture, compared to previous studies in Brazil, which have focused on water consumption associated with irrigation and therefore are limited to the blue water footprint. For the remaining sectors, we focused our analysis on the blue water and grey water footprint, assuming that the green water footprint applies specifically to agricultural sectors.
For the livestock sectors, we calculated the direct water consumption coefficient by using the methodology of the ONS (National Operator of the Electrical System) [20], for different species and combined with the production of municipal livestock statistics from the Brazilian Institute for Geography and Statistics (IBGE) [19]. To convert from water withdrawal to water consumption (blue water), we adopted the return flow ratio proposed by the ONS for all species (0.2). To calculate the grey water footprint, we applied the blue water/grey water ratios for different livestock species in Brazil from Mekonnen and Hoekstra [21].
For the water supply and sanitation sector, we obtained the water withdrawals at the state level by combining the per capita water consumption rate (l/person/day) from the National Environmental Sanitation Secretariat (SNSA) [22], combined with the equivalent population per state according to the 2010 Census [23], from which we discounted the distribution losses per state according to SNSA [22]. To convert into water consumption (blue water), we applied 0.8 as the return flow rate according to the Brazilian Association of Technical Standards (ABNT) [24]. To estimate the grey water footprint for the domestic water supply, we applied the relation factor blue/grey water footprint for Brazil from Mekonnen and Hoekstra [25].
Regarding primary energy, we used the water consumption factors by source from Gleick [26], which were combined with the production values from the Oil National Agency (year 2011) [27] in the case of oil and gas sectors and from the National Department for Mineral Production [28] for coal (year 2010). For the bioenergy production sectors, we used the water consumption coefficients from the Foundation Bank of Brazil (FBB); MMA: Foundation to support the Federal University of Vicosa [29] for the sugarcane-based ethanol and from the US Sandia National Laboratories for biodiesel [30] in the case of the non-ethanol biofuels sector. In relation to the power generation sectors, the amount of blue water was calculated by multiplying the power generation by source and state from the Brazilian Energy Research Institute [31] by the consumption coefficients for each technology from NREL [32]. For the specific case of hydropower, we used the consumption (evaporated) water coefficient for Brazil [33]. The grey water footprint was considered negligible for these sectors compared to agricultural and urban wastewater pollution. See Table 1 for an overview of data sources and steps.
Since this research intends to address the competition for water resources among biofuel production, agriculture and livestock (food production), energy and electricity, and urban water supply, it is important to clarify that we did not include the water footprint assessment for other sectors (such as mining and industry), which provides a limitation of this study and an underestimate of the potential water impacts.
To estimate water scarcity, we used Raskin’s definition of water scarcity [34] as the ratio of total water withdrawal (TWW) to total water availability (TWA). The water scarcity index (WSI) is thus given by WSI = TWW/TWA. This concept is referred to in the literature as the withdrawal-to-availability (WTA) index and the water resources vulnerability index (WRVI). We used the water balance database provided by the National Water Authority (ANA) [35] to calculate the WTA at the state level. In this database, the WTA is detailed at the micro-watershed level, with a total of 558,699 watersheds. To make this data compatible with the spatial detail of the MRIO table, the state WTA was obtained by aggregating the value of the micro-watersheds within each state boundary by using GIS. The state’s fresh water consumption was then multiplied by the state WTA index to obtain the scarce water consumption at the state level. According to ANA, the proposed categorization for the WTA thresholds follows that adopted by the European Environment Agency and the United Nations, as follows: (i) excellent conditions for a WTA < 5%; (ii) comfortable conditions when 5% < WTA < 10%; (iii) worrisome conditions when 10% < WTA < 20%; (iv) critical conditions for 20% < WTA < 40%; and (v) very critical conditions when WTA > 40%.

2.2. Multiregional Input-Output Model

MRIO analysis is a widely used modeling approach, which enables analysts to explore the entire supply chain and the associated (‘embodied’) emissions or natural resource use. At its core, it is an accounting procedure relying on regional economic input-output (IO) tables and inter-regional trade matrices, depicting the flows of money to and from each sector within and between the interlinked economies, and thus revealing each sector’s entire supply chain. The MRIO modeling approach has been frequently used in water footprint and virtual water studies by utilizing the IO ability to quantify direct and indirect (upstream supply chain) water consumption for sectorial production at regional, national or global scales [36,37,38,39,40,41].
In this study, we apply the MRIO approach to assess virtual water flows across 149 sectors and 27 Brazilian states. The MRIO database for Brazil contains the intermediate consumption matrix Z, the final consumption matrix Y, the value added vector v, and the international export vector e. To estimate the virtual water in intra- and inter-regional supply chain to satisfy final consumption including international exports in each state, we extended the MRIO framework with a water coefficient matrix K, which covers green, blue, and grey water coefficient vectors, in addition to water scarcity-weighted water coefficients to account for scarce water. To distinguish the consumptive water and water scarcity-weighted consumptive water, we refer to them as fresh water and scarce water, respectively.
To calculate virtual water flows ( VW ), we extended the MRIO system based on Leontief’s demand-drive model, Equation (1), with the water coefficient matrix, as follows:
x = ( I A ) 1 ( y + e )
where x is a vector of the gross output of the 3969 industry sectors; I is an identify matrix; A = Z / x ^ , is a technical coefficient matrix describing inputs into the production of industry sectors to produce one unit output of these sectors and the hat symbol denotes the diagonalization of gross output vector x; ( I A ) 1 is the Leontief inverse matrix which captures the total input requirement to produce one unit of final consumption product; and y is the summation of rows for final consumption matrix Y.
By incorporating the water coefficient k, we may derive a water multiplier matrix, which can be used to calculate total virtual water flows in Brazil:
V W dom = k ^ ( I A ) 1 Y
where VWdom is a matrix containing virtual water flows from the industry sectors in different states to satisfy their own final consumption (e.g., household consumption, governmental expenditure, capital investment) and other states’ final consumption (e.g., exports of final products to other states); k ^ is a matrix with water coefficients on its diagonal; and k ^ may be used as the water coefficient matrix for green, blue, or grey water and scarce green, blue, or grey water.
To calculate virtual water in international exports from Brazil to foreign countries, we replaced the final consumption matrix Y with the international export vector e:
V W exp r = k ^ ( I A ) 1 e r
where V W exp r is a vector of virtual water from different sectors in different states that is consumed for the production of international exports in state r.
The total WF at the state level in Brazil can then be calculated by the summation of domestic virtual water flows ( V W dom ) from all industry sectors associated with the final consumption of water in each state using Equation (4).
WF = i V W dom
where i indicates each industrial sector in a given state.
Since we do not have the physical data for the share of sugar cane for biofuel, sugar production, and others, we separated the water consumption of sugar cane production into these three categories using the shares of each one from the MRIO database. In the MRIO table, there are separate sectors for sugar production and biofuel production.

2.3. Total Water Footprint

To provide a comprehensive and complete overview of freshwater appropriation by biofuels, there is a need to consider consumptive water uses, as well as water pollution. The pollution of freshwater resources not only poses a threat to environmental sustainability and public health, but also increases the competition for freshwater [42].
We used the green, blue, and grey water footprint of crops estimated by [18]. Their database details the green, blue, and grey water footprint of 126 crops in a 5 by 5 arc minute grid expressed in m3 ton−1. To estimate the green, blue, and grey water footprint for each of the crops detailed in the MRIO table, we multiplied the aggregated value of the water footprint (blue, green, and grey) at the state level by the respective sectorial production in tons for the given state. We then incorporated the estimated water footprint for each sector and state into our model through the row vector for water consumption to obtain consumptive blue, green, and grey water footprints. It is important to highlight that these water footprint factors reflect the water consumptive uses of water and not water withdrawals.

2.4. Comparative Advantage Ratio

We used a comparative advantage ratio aggregated to the state level to assess the competitiveness of sugarcane compared to other crops in terms of the value added per unit of water consumption.
This ratio is given by the following relation:
C A j = ( V A s c / V A s x ) / ( W F s c / W F s x )
where C A j is the comparative advantage ratio for a given state j, V A s c is the added value for sugarcane, V A s x is the added value for the sector or crop compared with sugarcane production, W F s c is the water footprint driven by sugarcane production, and W F s x is the water footprint due to the production of the crop. We obtained the added value for each crop from the MRIO table.
The purpose of using this ratio is to assess the water footprint of sugarcane driven by ethanol production from a broader nexus perspective. We evaluated the competing uses of water with other crops or agricultural sectors, focusing on total water consumption and the added value of sugarcane. Since the core of the ethanol water footprint is associated with the agricultural stage of the supply chain, we assumed that any potential growth in bioethanol demand, either domestic or international, will drive the demand for sugarcane production and thus will increase the demand for water.
For the purposes of this investigation, we compared the production of sugarcane with other main crops cultivated in Brazil, namely rice, corn, and soybean. In addition, we also compared sugarcane to the total agricultural production (the sum of all agricultural sectors of the MRIO table). A CA value above 1.0 implies that the production of sugarcane in this specific state is more competitive in terms of the value added per unit of water consumption than the production of other crops. We applied this ratio separately for the consumptive uses of water; green and blue water footprint.

3. Results

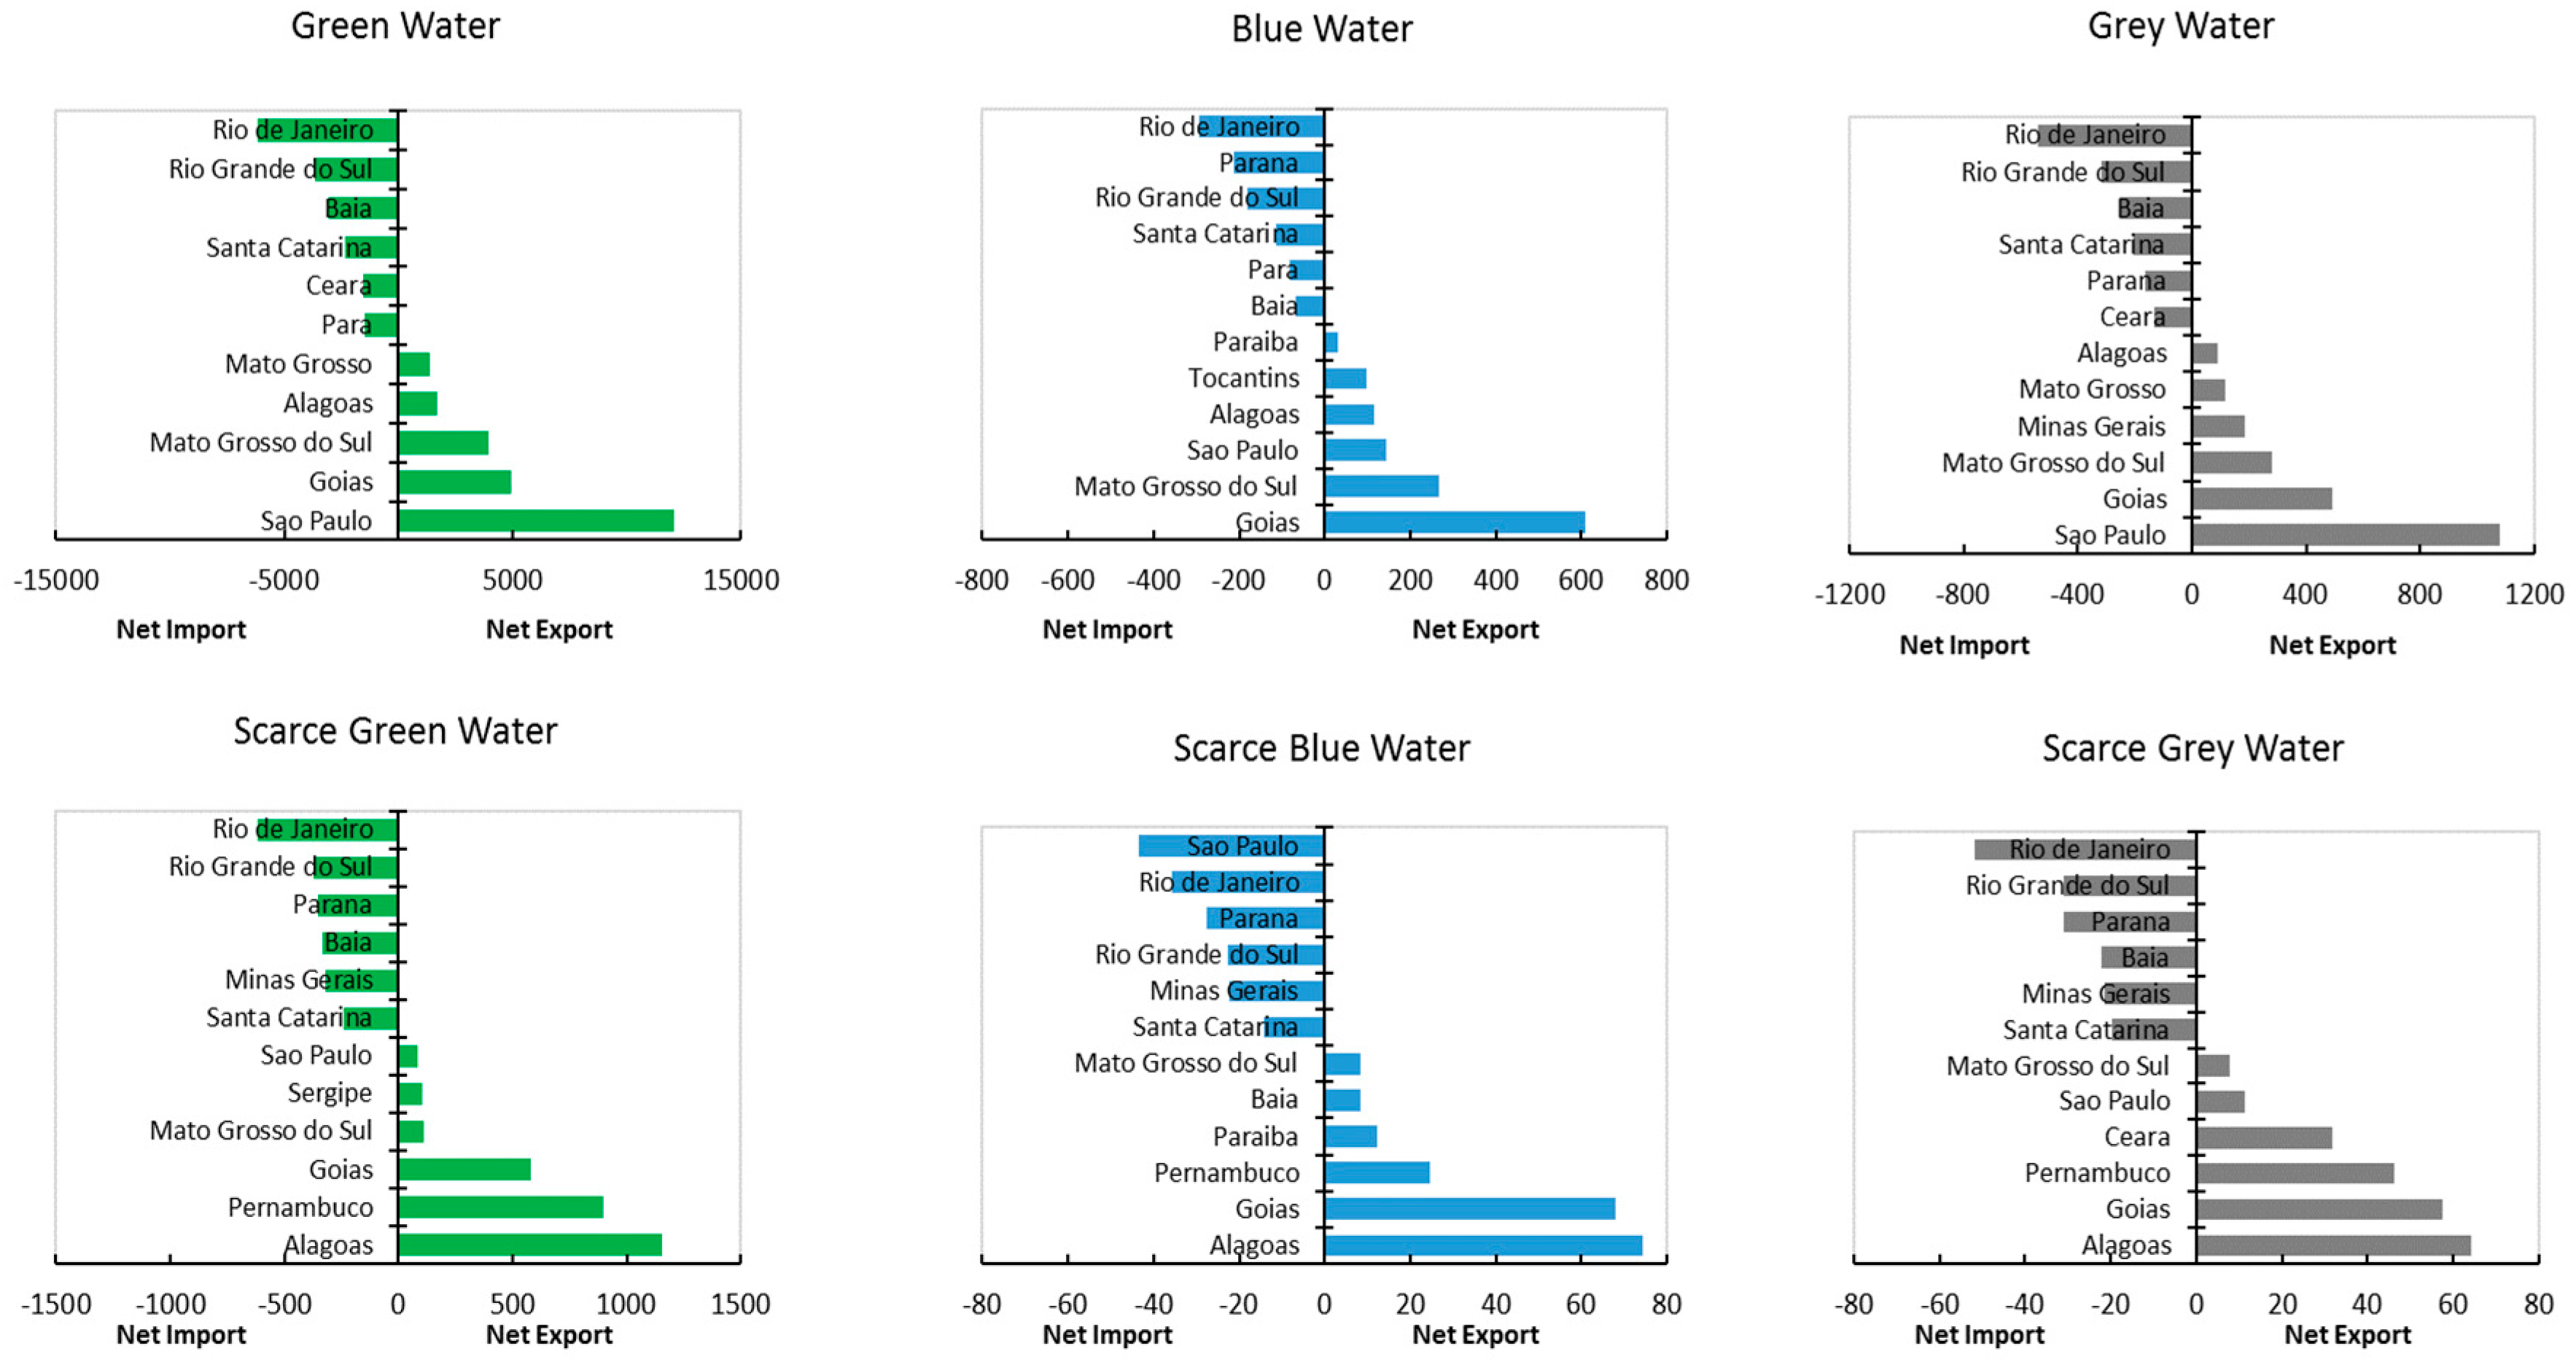
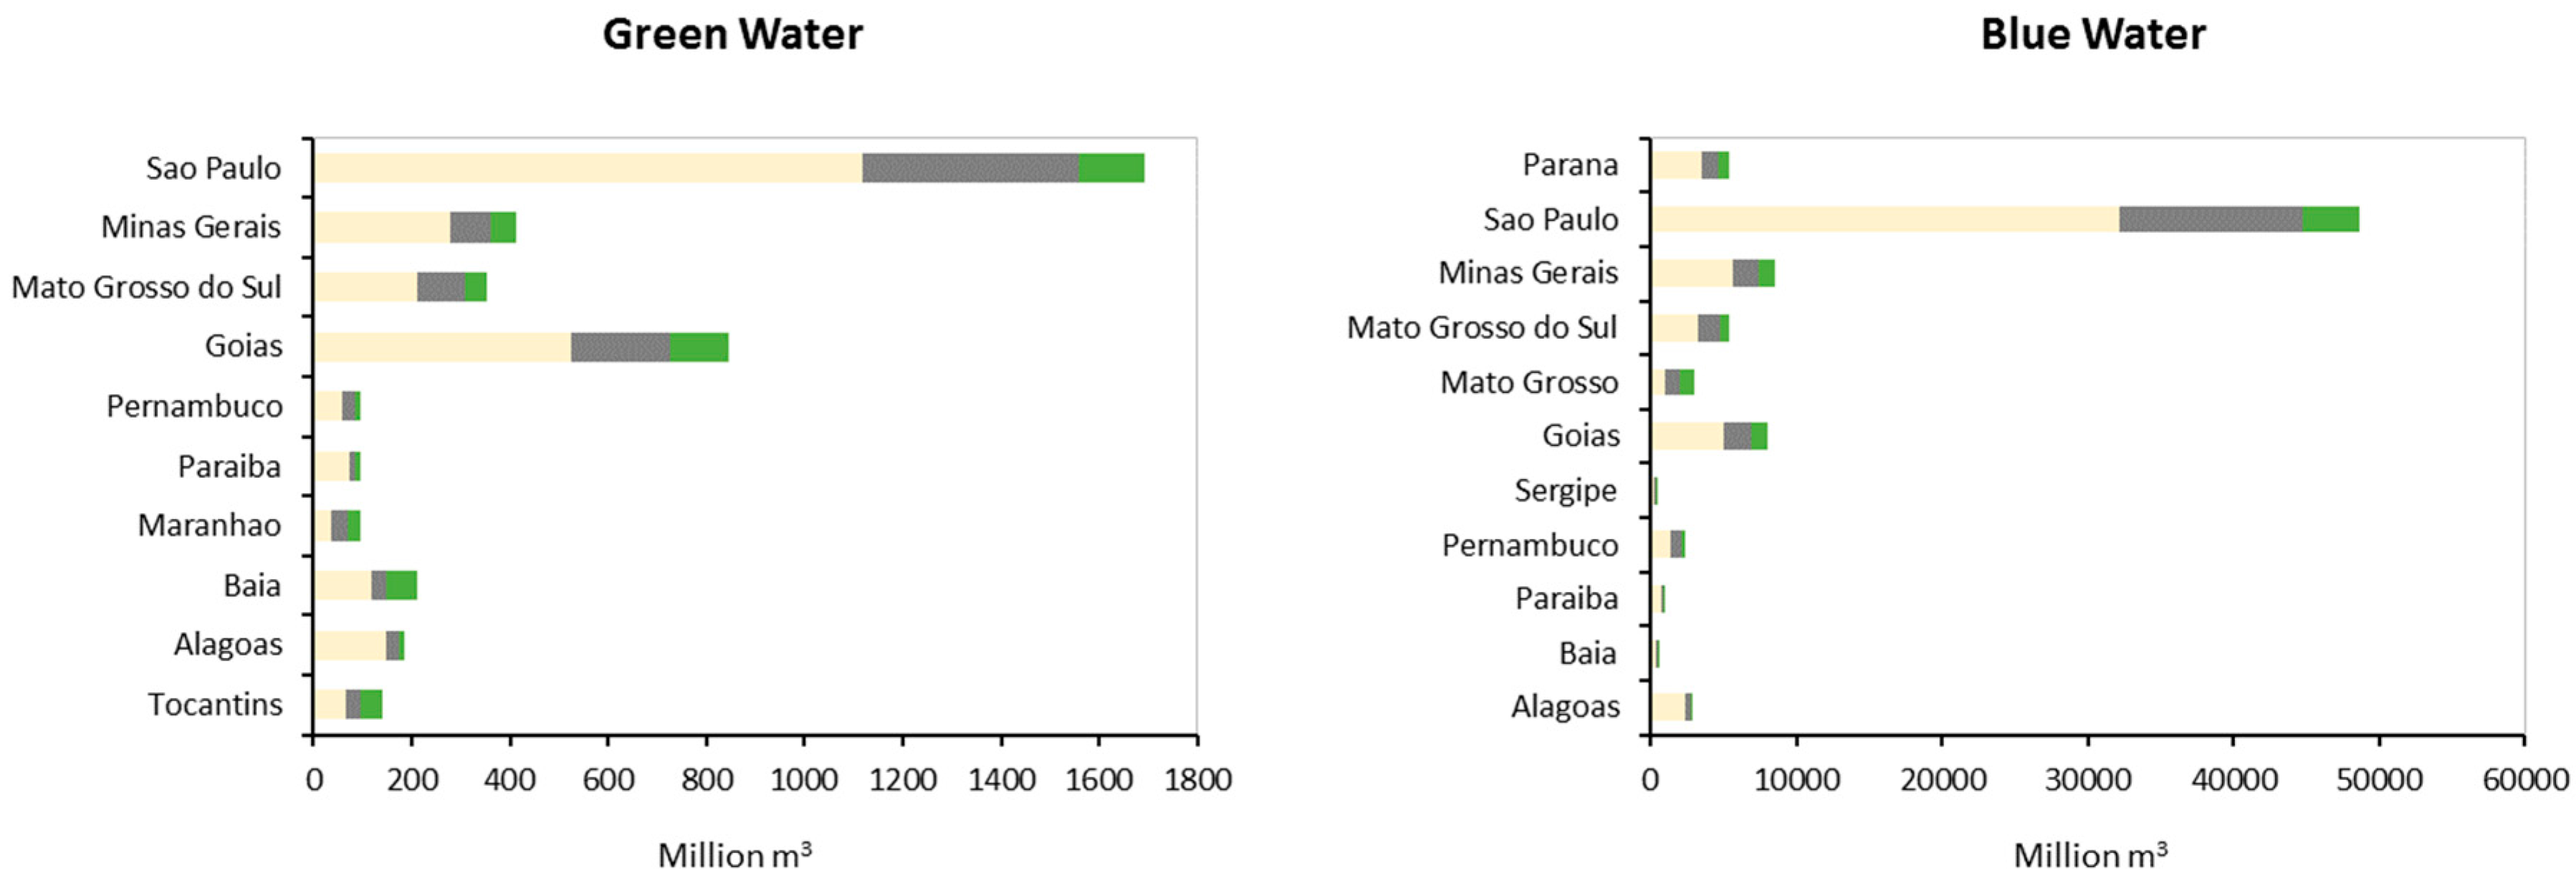
3.1. Inter-State Virtual Water Flows

In 2010, the total water consumption of sugarcane production in Brazil was estimated as 101 billion m3, of which 54 billion m3 was virtually traded across Brazil. Over 2.5 billion m3 of virtual blue water associated with sugarcane production was traded across Brazil. In addition, the virtual green and grey water flows were 48 billion m3 and 4.1 billion m3, respectively. It is worth noting that the grey water footprint triggered by sugarcane production is 64% higher than its blue water footprint, a significant amount that has to be taken into account when comprehensively assessing total water appropriation due to water pollution by sugarcane and ethanol production.
Figure 1 shows the virtual water traded by the top exporters and importers of virtual water associated with sugarcane production. São Paulo, the richest state in Brazil and the largest producer of ethanol, responsible for 51% of the production, shows a higher production-based water footprint than its consumption-based water footprint, which leads the state to be a net exporter of green, blue, and grey water. Just by itself, this state has a consumption-based green water footprint of 36.6 billion m3 (41% of the national), 1.5 billion m3 (36%) of blue water footprint, and 3.1 billion m3 (41%) of grey water footprint. On the other hand, the state has a production-based green water footprint of 48 billion m3 (55%), 1.7 billion m3 (39%) of blue water footprint, and 4.2 billion m3 (55%) of grey water footprint.
However, in terms of blue water, the top exporters are Goiás and Matto Grosso do Sul with 0.607 billion m3 (46%) and 267 billion m3 (20%), respectively, followed by São Paulo and Alagoas, in the arid Northeast, with 114 million m3. This can be explained by the fact that most of the production in São Paulo state is rainfed, while more than half of the irrigated sugarcane production occurs in the dry Northeast [9], Goiás, and Matto Grosso do Sul.
The major importers of virtual green water associated with sugarcane production are Rio de Janeiro with 6.2 billion m3 (25%), followed by Rio Grande do Sul with 3.7 billion m3 (15%), Bahia with 3.1 billion m3 (12%), Santa Catarina with 2.4 billion m3 (9%), Ceará with 1.5 billion m3 (6.2%), and Pará with 1.4 billion m3 (5.8%) of green water. Rio de Janeiro is also the largest importer of blue water and grey water with 300 m3 and 350 million m3, respectively, followed by other Southern states such as Parana, Rio Grande do Sul, and Santa Catarina. For these states, their total consumptive water footprint is much larger than their local water consumption, due to the large import of ethanol, sugar, and other products from sugarcane for domestic consumption.
Thanks to the level of disaggregation of the MRIO table, we were able to uncover the water consumption by sugarcane for ethanol production vs. the total water footprint of sugarcane production. The blue water footprint of sugar cane production driven by ethanol was 1 billion m3, (23% of the total blue water footprint driven by sugarcane and 6.5% of total agricultural blue water footprint in Brazil), which is 4.7 and 4.6 times higher than the blue water footprint of power generation and primary energy sectors, respectively. The green water footprint was 21.7 billion m3 and the grey water footprint 1.8 billion m3.
Figure 2 shows the distribution of the regional water footprint among sugar, bioethanol, and “others” for the top ten states with the highest blue and green water footprint. On average, the largest share of the total footprint from sugarcane is due to sugar production accounting for 64%, whereas ethanol production is responsible for 24%, equivalent to 24.5 billion m3 total water footprint.
Our results also show that 13.5 billion m3 of virtual total water, including green, blue, and grey water, were traded across the 27 Brazilian states, representing 54% of the total water footprint driven by ethanol production. Figure 3 presents the top water and scarce water importers and exporters in Brazil due to ethanol production. With regard to the virtual blue water footprint, the states with higher rates of irrigated sugarcane production lead the ranking. Goiás is the top exporter of blue water with 45% of the total, followed by Mato Grosso do Sul (23%) and São Paulo (16%). The top importers are Rio de Janeiro with 22% of the total, and the Southern states of Parana (16%), Rio Grande do Sul (13%), and Santa Catarina (8%). São Paulo is the largest exporter of green water with 52%, together with Goiás (18%), Mato Grosso (17%), and Mato Grosso do Sul (8%). The major importers of green water are Rio de Janeiro with 24% of the national, followed by Rio Grande do Sul (14%) and Bahia (12%).
In terms of virtual grey water associated with bioethanol production, as could be expected, São Paulo was the largest exporter (52%), while from the import side, Rio de Janeiro was the largest importer (24%).
In general, some of the major virtual water importers like Rio Grande do Sul, Bahia, and Ceará, which face severe to critical water scarcity conditions, are benefitting from importing virtual water from main producer states, alleviating the potential pressure on their own water resources if the equivalent production of ethanol would have to be produced domestically.
The distribution of virtual water flows changes significantly when we focus on the scarce water footprint and virtual scarce water. A total of 6.7 billion m3 of virtual scarce water associated with sugar cane production was traded across Brazil. This amount represents 12% of the total scarce water footprint of sugarcane, equivalent to 10.5 billion m3, and around 63% of the total freshwater footprint of sugarcane production. Regarding bioethanol, as shown in Figure 3, in 2010, a total of 1.5 billion m3 of total virtual scarce water was traded across Brazilian states driven by ethanol production, accounting for 63% of the total scarce water footprint of 2.3 billion m3. This value represents 11% of total virtual water traded at the national level due to ethanol production, and importantly, most of the flows originated in states with critical or highly critical water scarcity. Therefore, accounting for the production-based versus consumption-based water footprint at these states might become relevant when assessing the impacts of bioethanol production and considering competing uses of water resources with other users or other crops at the local scale. For instance, in Alagoas, a critically water stressed state, the export of virtual scarce blue water from ethanol production to other states was equivalent to 71.9% of the total blue freshwater exported to other states.
The top exporter of virtual scarce green water from bioethanol production is Pernambuco with 40%, followed by Alagoas (20%) and Goiás (19%). The main importers of green scarce water are Rio de Janeiro (20%), Parana (12%), and Rio Grande do Sul (12%). Our results indicate that water-rich states impose water pressure on water scarce states through importing virtual scarce green water for ethanol production, from states with limited water availability.
Similarly, for virtual blue water exchanges, three water scarce states are ranked as the top exporters associated with ethanol: Goiás with 39%, followed by Pernambuco (23%) and Alagoas (22%); whereas the top six net virtual water importing states are Rio de Janeiro at the top with 18% of the total followed by São Paulo (15%), Parana (14%), and Minas Gerais (12%). The distribution for virtual scarce grey water follows a similar pattern.
Figure 4 traces the start to endpoint of virtual water and virtual scarce water via inter-regional trade across Brazil. When looking at the scarce blue water flows from ethanol, Goiás, Pernambuco, and Alagoas are the main exporters, mostly to other water-rich states. São Paulo, as the second top net importer after Rio de Janeiro, is driving the largest flows from other water-scarce states in the Semiarid Northeast. Goiás is virtually exporting the largest flow of 52 million m3 to São Paulo and to others states in the center and the southeast regions such as Minas Gerais, Parana, Rio Grande do Sul, or Santa Catarina.
Regarding scarce green water flows driven by ethanol, the same three states are the net exporters driven by the demand from São Paulo, but also from other water abundant states such us Minas Gerais, Parana, Rio de Janeiro, Santa Catarina, or Mato Grosso do Sul. São Paulo is the top exporter with the greatest flow of 990 million m3 to Rio de Janeiro, equivalent to 18% of its total virtual water exports to other states.
The flow distribution for virtual grey scarce water driven by ethanol is similar to the one for scarce blue water, but São Paulo is the net exporter, with its highest export flow to Rio de Janeiro and driving the same time virtual water flows from other states, including the top three water scarce exporters. Alagoas, in the Semiarid Northeast, as in the case of the virtual blue water, remains a net exporter of grey water.

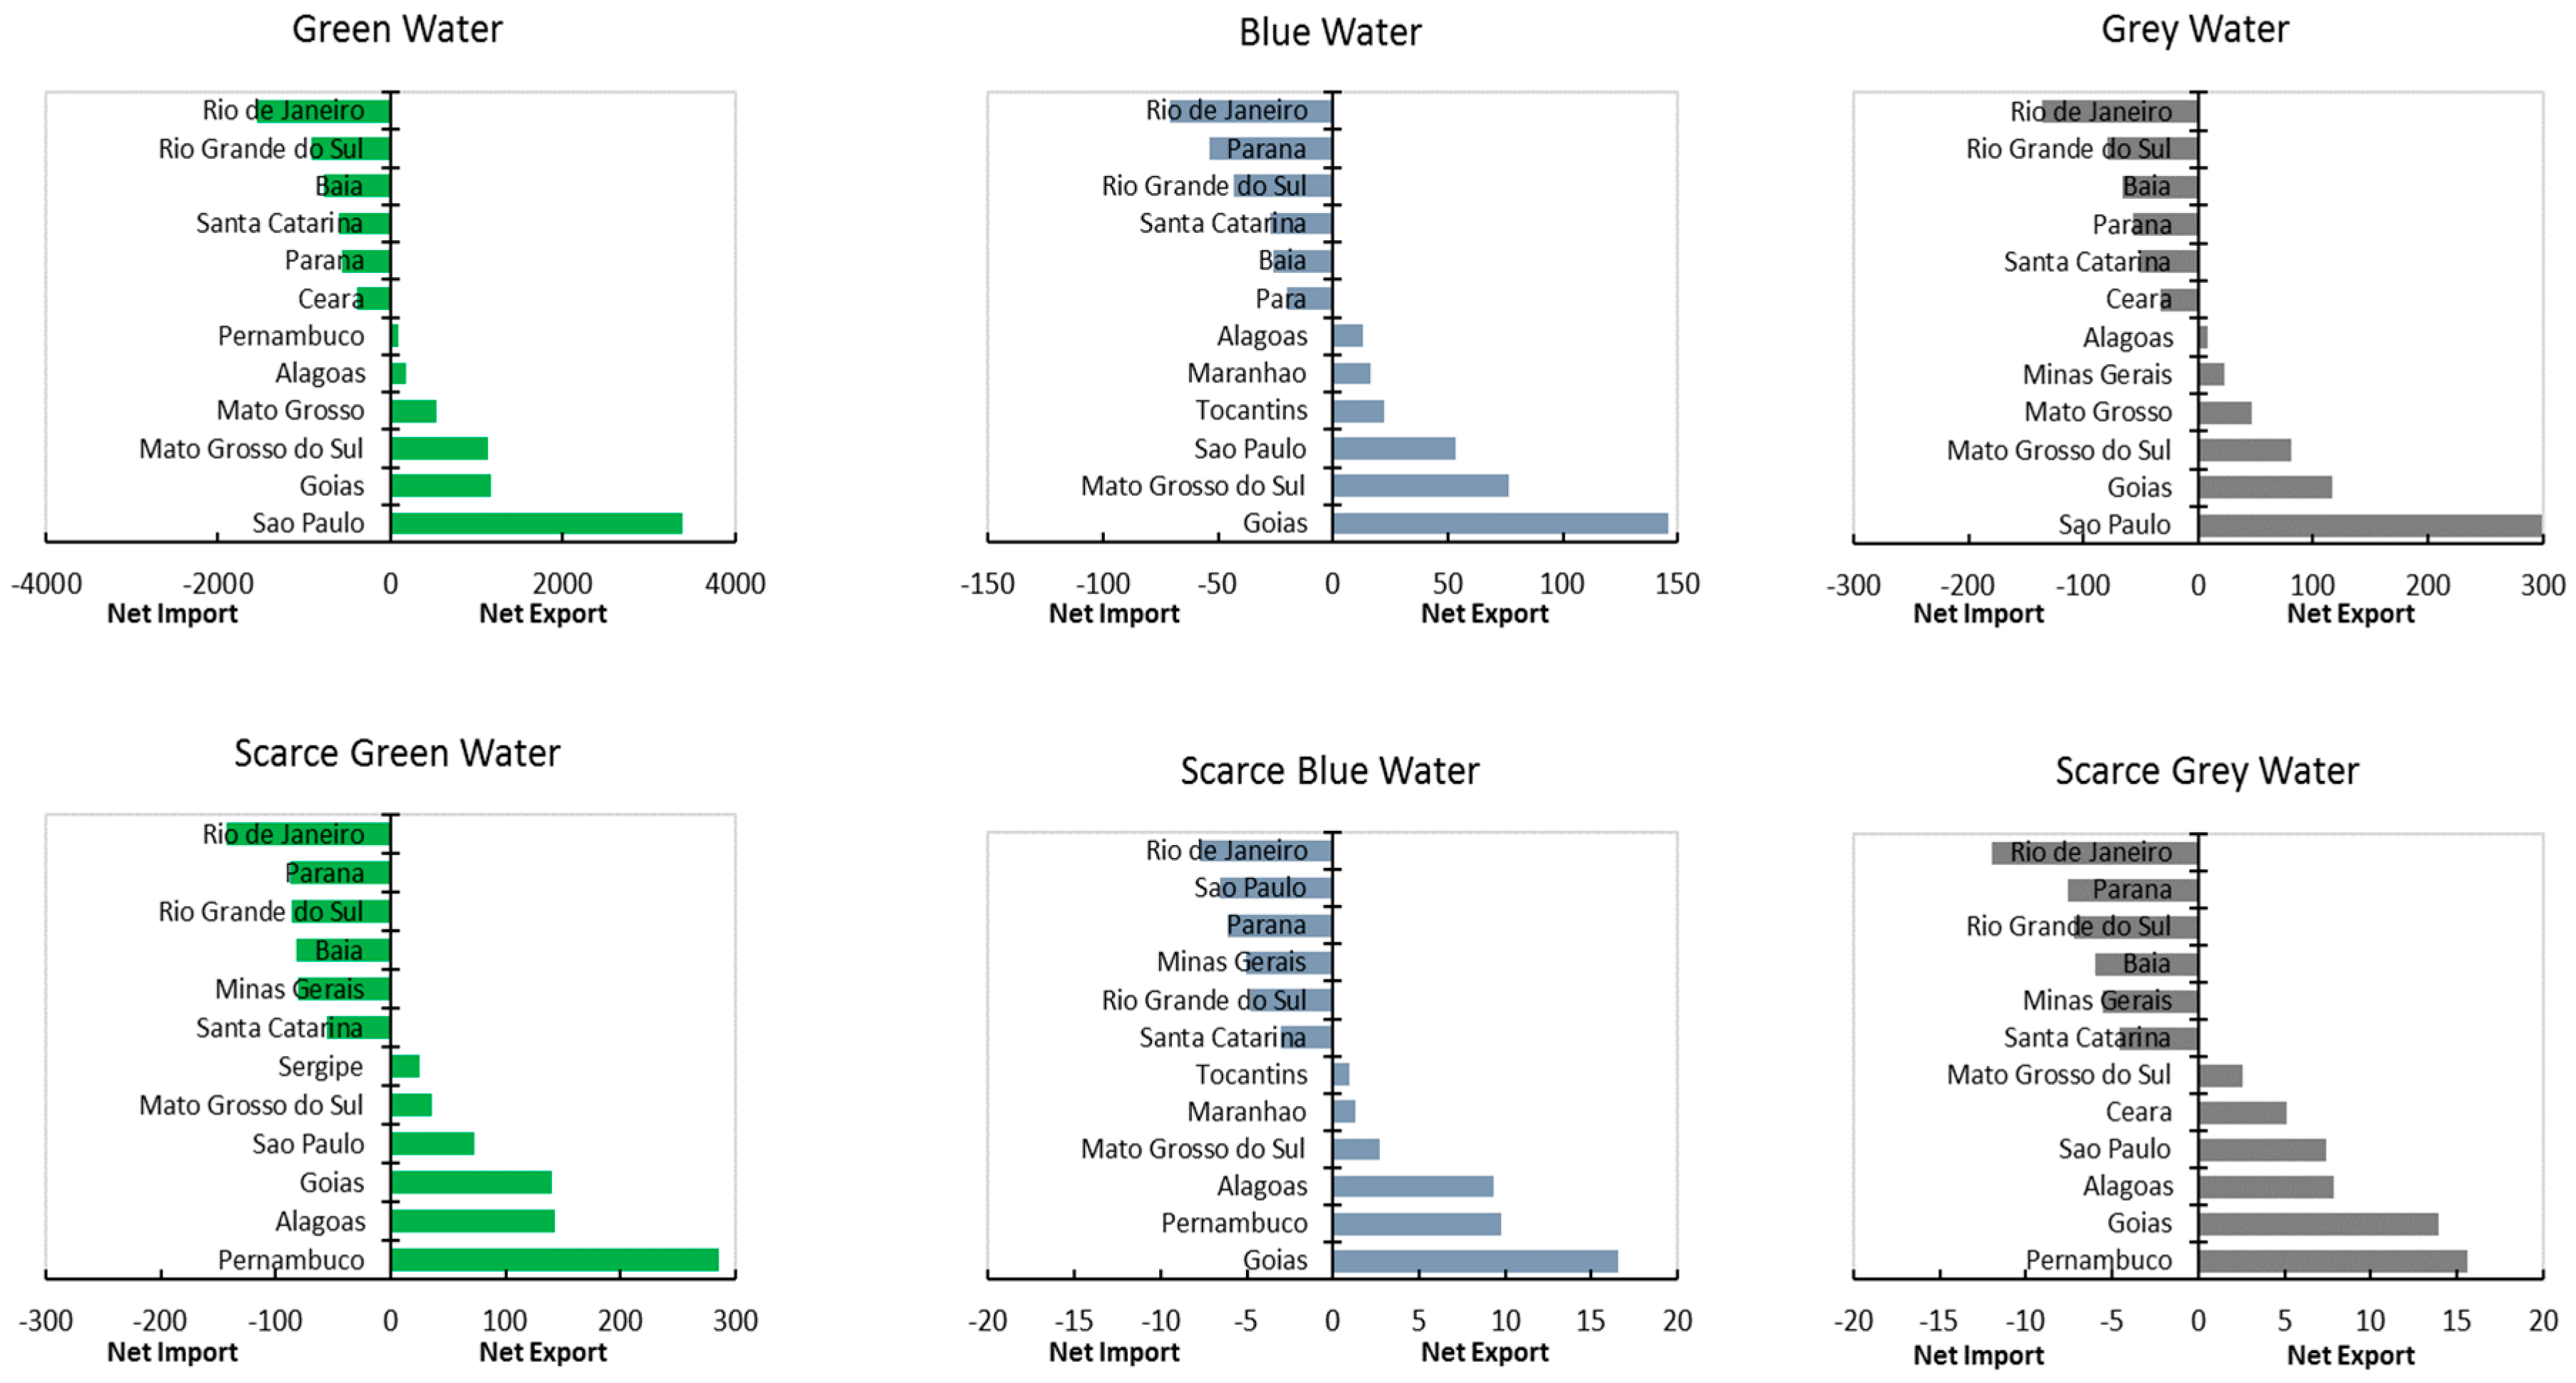
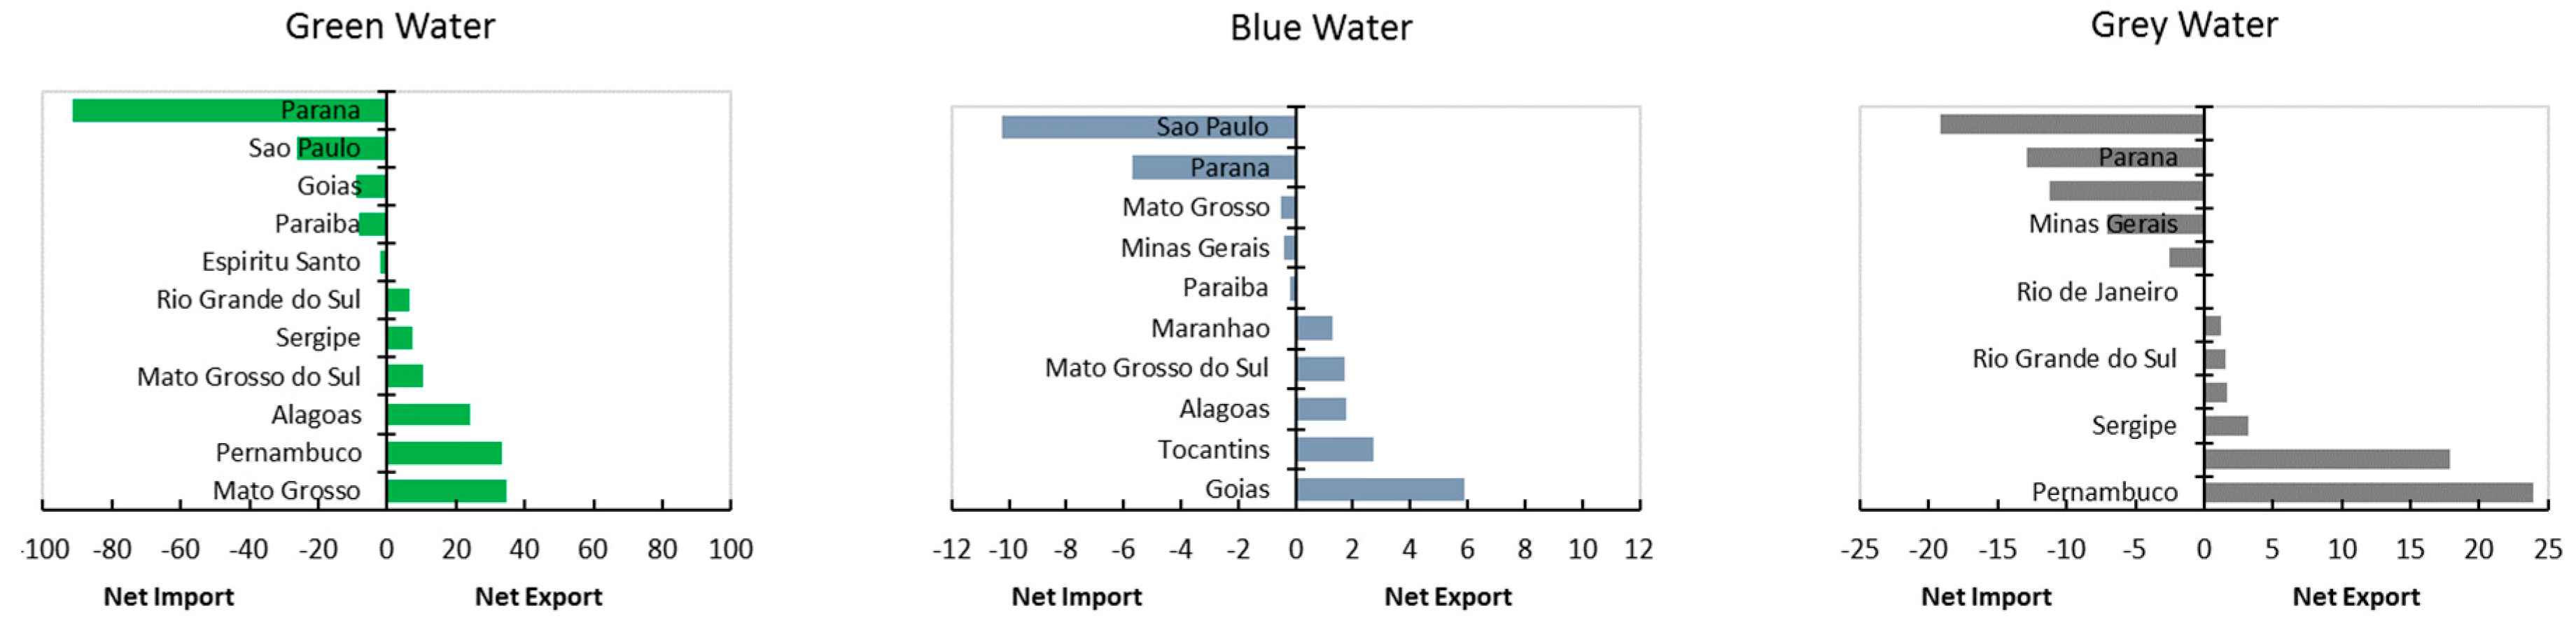
3.2. Virtual Water and Scarce Virtual Water Flows Driven by Internatioanal Trade

Given the importance of Brazil in the global markets for biofuels and the expected increasing demand in the upcoming years, especially in the context of ongoing international climate change mitigation like the INDCs, it is also important to assess the proportion of the water footprint driven by international exports of ethanol. Figure 5 shows net importers or exporters of virtual water triggered by Brazilian exports of ethanol. Figure 6 displays the distribution for the water footprint of international exports and the domestic consumption by the top six production-based water consumer states for both total freshwater and scarce water. The total blue water associated ethanol consumption triggered by international export is 290 million m3 (29% of the total blue water footprint of ethanol). The total green water footprint driven by ethanol exports is 3.5 billion m3 (16% of the total green water footprint of ethanol), from which only 17% were traded among states. The total grey water totals 306 million m3 (16% of the ethanol’s total grey water footprint).
Overall, São Paulo, Brazil’s biggest economy and the top exporter in Brazil, has the largest water footprint driven by international exports associated with ethanol production. São Paulo is responsible for 39% of the total blue water footprint, 70% of the total green water footprint, and 54% of the total grey water footprint associated with ethanol for the production of the international export of goods and service. Ethanol consumption associated with international exports accounts for 19% of green, 34% of blue, and 46% of the grey water footprint for São Paulo’s ethanol total footprint.
Ethanol exports also drive the water footprint in other important producer states. However, as shown in Figure 5, most of the water footprint by exports in these states is induced by São Paulo, which is the top net importer of virtual water driven by international exports and thus triggers a significant water footprint in other states through importing ethanol to re-export or as an input to produce other export goods. In contrast, in terms of the value added triggered by its international exports, São Paulo received 85% of the total value added, while other virtual water exporter states such as Pernambuco, Bahia, and Alagoas received just 0.1%, 0.06%, and 0.7%, respectively. Rio de Janeiro, another important virtual water importer, retains over 8.8% of the total value added by international exports of ethanol.
This is particularly relevant to consider for highly water stressed states such as Goiás, Pernambuco, Bahia, and Alagoas, which, as shown in Figure 6, are among the top six states with the highest shares of green, blue, or grey scarce water footprint associated with international exports but receive a low share of value added in return. In other words, richer states such as São Paulo benefit with a higher economic value added from exporting ethanol or products that use ethanol as part of their production chain while impacting water availability in poorer states through importing virtual scarce water from them.

3.3. Water Scarcity and Comparative Advantage of Sugarcane Production

Finally, in order to have a more comprehensive and nexus (energy-food) perspective, we evaluated the competing uses of water with other crops and sectors through a comparative advantage assessment that relates the water footprint with the value added by different competing crops and sugarcane production. In Table 2, we summarize the results for the comparative advantage assessment between the production of sugarcane and other crops for the top ten states with the largest production-based water consumption. The results in Table 2 show the values for the CA coefficient referred to in Equation (5).
When looking at the results for the green water footprint, six out of the ten selected states show a comparative advantage for sugarcane production compared to other crops (CA higher than 1.0). The states with the lowest values of CA are for two extremely dry and water stressed states, Pernambuco and Paraíba.
In contrast, when focusing on the results relative to blue water consumption, all the selected states, with the exception of Pernambuco, show a relative competitive disadvantage for sugarcane production compared to other crops (CA lower than 1.0). Only when compared to rice, we find four states—São Paulo, Mato Grosso do Sul, Alagoas, and Pernambuco—where producing sugarcane has a higher relative comparative advantage; explained by the higher blue water intensity of rice cultivation.
The inter-state comparison provides some interesting results. With regard to the green water footprint, Mato Grosso do Sul has the highest CA value (2.27) compared to all crops, while it has one of the lowest CA rates (0.32) for blue water. Mato Grosso do Sul is among the top ten agricultural states in Brazil but has lower rates of irrigated agriculture than other main producers such as Goiás, Minas Gerais, or Mato Grosso, so the CA values indicate that sugarcane production has a higher competitive advantage in this state and could be favored over other crops when not depending on a new irrigated area and thus water for irrigation should be limited to crops with a higher comparative advantage. Goiás and Alagoas, two of the main sugarcane producers that also cope with worrisome and very critical water stress conditions, present similar values.
The opposite situation can be found in Pernambuco, where CA values for green water are among the lowest (0.56), but it is the only state with a CA value (1.15), indicating that even though the state is critically water stressed, sugarcane could still be prioritized over other crops when assigning limited water resources for irrigation.
When focusing on intra-state results, it is interesting to see how São Paulo, where sugarcane production is predominantly rain fed, has a comparative advantage over rice (1.06), corn (2.27), or soy (2.03) when considering the results for the green water footprint, and only over rice production (1.32) when assessing the CA related to the blue water footprint. On the other hand, Alagoas is the only state with a competitive advantage for sugarcane production over soy cultivation relative to blue water consumption, in contrast to the results against total agricultural production, explained by higher rates of irrigated agriculture with sugarcane as the dominant irrigated crop.
In light of these results, when focusing on the competitive advantage related to the green water footprint, the production of sugarcane has a competitive advantage over the cultivation of rice, corn, or soy in some of the Brazilian states, whereas its production has a clear competitive disadvantage when considering the results for the blue water footprint. Taking into consideration that the green water footprint is usually associated with rainfed crops while the blue water footprint is commonly related to irrigated agricultural production, this implies that the production of sugarcane as a rainfed crop is more competitive than other food or feed crops in some of the states, while irrigated sugarcane is less competitive than other crops such as rice, corn, or soybean. For irrigated agriculture, more competitive crops than sugarcane should be prioritized when planning the expansion of new agricultural systems.
Overall, the results seem to show a clear tradeoff between water footprint and land use expressed by the opposite general trends of green water and blue water results. While favoring rainfed agriculture for sugarcane and potentially having a positive impact in terms of a lower water consumption through irrigation, this may also imply the need for greater land areas dedicated to sugarcane, appropriating land that could be used for pastures or other crops.
Finally, we compared the CA values of sugarcane production with other economic sectors than crops to have a broader vision from a nexus perspective. For that purpose, we assessed the results for the blue water footprint, as water for irrigation is the agricultural consumptive use competing with other non-agricultural uses of water, through the use of infrastructure that withdraws water from the environment. As could be expected and shown in Table 3 the sugarcane production has a clear competitive disadvantage when compared to most non-agricultural sectors as primary energy, power generation, or livestock. Only, with a few exceptions (Goiás, Matto Grosso do Sul, Tocantins, and Paraíba), when compared to the the water and sanitation sector does it have a competitive advantage. It can be explained by the nature of the residential water supply as a public service, which is often subsidized and in most cases is not associated with any economic activity.

4. Discussion and Conclusions

Given the uneven spatial distribution of water availability and scarcity in Brazil, decision-making related to biofuel sector planning and climate change policy should take into consideration not only on-site water demand by bioenergy production, but also the virtual water traded across the country and its spatial distribution. This is especially relevant under ongoing international climate change mitigation negotiations and agreements that may very well increase the demand of biofuel production in Brazil as a major player in the global biofuel markets.
By using an environmentally extended MRIO model through the incorporation of water consumption and water scarcity, we uncover the green, blue, and grey water footprints of sugarcane-based ethanol production in Brazil and its interregional virtual water flows spatially distributed at the state level. This work contributes to the existing literature on virtual water research on biofuels in Brazil by providing a comprehensive account of the total appropriation of water by biofuel production, including the associated water pollution discharges to the environment. In addition, this research allows disaggregation at the sectoral level from sugarcane to ethanol production, and to track flows of virtual water and scarce water from production to consumption within the supply chains across Brazilian states. Our results show that the major share of the water footprint of sugarcane production is driven by sugar and other processed food production, while ethanol is responsible for less than one third of the total sugarcane water footprint.
According to our estimates for 2010, 54 billion m3 of total virtual water driven by sugarcane production was traded across Brazil, accounting for 54.3% of the total water footprint. From this total, the green water footprint accounted for 48 billion m3, the blue water footprint for 2.5 billion m3, and the grey water footprint for 4.1 billion. It is worth noting that the grey water footprint was 64% higher than the blue water footprint, which supports our initial argument about the importance of including the grey water footprint in water footprint assessments in order to avoid an underestimation of actual water appropriation by a given sector or economic activity.
From the water footprint of sugarcane, we uncovered the total water footprint of sugarcane-based bioethanol. We found that São Paulo is the largest exporter of green and grey water, with the biggest flows to its neighbor state, Rio de Janeiro, which is the largest importer of virtual water. At the same time, São Paulo is a net importer of water from other water stressed states such as Goiás and Alagoas. Regarding the blue water virtual flows, we found that Goiás, a water stressed state, is the largest exporter with its biggest flow to São Paulo, which is benefiting by the use of scarce blue water from Goiás for its economic activities.
We also found that inter-regional flows of virtual water associated with bioethanol production are significantly different when considering water scarcity. Our results show that the three water stressed states Goiás, Pernambuco, and Alagoas led the rank of scarce green, blue, and grey water, which is mainly driven by consumption and production activities in São Paulo and other water abundant states in the southern-center region. Rio Grande do Sul, the only water scarce state in the southern region, with a richer economy, is a net importer of scarce water from Goiás and from other poorer and critically water stressed states in the semiarid northeast such as Alagoas and Pernambuco.
Interestingly, when focusing on the water footprint driven by international exports, we found that most of the virtual water is driven by São Paulo, which, as the main producer and exporter of ethanol, is triggering significant water consumption in other states through importing ethanol to re-export or as an input to produce other goods for export. However, the main share (85%) of the economic added value associated with these exports remained in São Paulo, while Pernambuco and Alagoas received in return only 0.1% and the 0.7% of the added value triggered by the international exports of ethanol, respectively.
Finally, we used our model to assess the competitive advantage of sugarcane production compared to other crops relative to the value added per unit of green and blue water footprint. By doing so, we evaluated the production of sugarcane from a broader land-energy-water nexus perspective to better understand the competition for water use among sugarcane and other crops. We show that producing sugarcane has a competitive advantage over the cultivation of soy, corn, or rice in some of the states related to the use of green water, while related to the blue water footprint, the production of sugarcane is less competitive in most cases in terms of the added value per cubic meter of blue water consumed. This could be a critical part of water management in Brazil given the potentially significant expansion of biofuel production at the national level. This is especially pertinent in the context of the southeast, particularly in the state of São Paulo where 90 percent of the sugarcane production occurs, which is mostly rainfed, where land and water are being used fully and therefore there is very limited expansion possibility in that region. This may imply that any potential expansion of sugarcane in other regions such as the northeast, where half of the production is already irrigated due to the lack of available cropland and limited water availability, will occur by expanding irrigation systems increasing the competition for water between sugarcane and other suitable crops, as well as residential consumption, as shown by our results for the comparative advantage with non-agricultural sectors. This important potential implication merits further investigation.
As a final concluding remark of this study, to better inform biofuel-related policies and planning in Brazil, further research is needed to further understand the tradeoffs between water and land use impacts of bioenergy production in Brazil; to explore how future policy scenarios for biofuel production and global demand scenarios under international climate mitigation agreements could aggravate these impacts; and to develop deeper and finer resolution analyses of those impacts and tradeoffs in water scarcer regions with greater potential for bioenergy expansion to enhance efforts in sustainable water infrastructure and irrigation planning.

Acknowledgments

F.M.W. was supported by a National Science Foundation (NSF) award EAR1541642 (Development and application of analytical tools in support of food-energy-water nexus planning). K.F. acknowledges the support from National Natural Science Foundation of China—NSFC 71628301. K.H. was partly supported by the Czech Science Foundation under the project VEENEX (GA ČR No. 16-17978S)

Author Contributions

R.M.C., K.F., K.H. and L.S. conceived and designed the experiments; R.M.C. and K.F. performed the experiments; R.M.C., K.F., K.H. and L.S. analyzed the data; J.G., K.F. and F.M.W. contributed to materials; R.M.C., K.F. and K.H. wrote the paper.

Conflicts of Interest

The authors declare no conflict of interest.

Disclaimer

The contents of this publication express the views of J.G. and does not necessarily represent the views of OECD or of its member countries. The contents of this publication express the views of R.M.C. and does not necessarily represent the views of IADB or of its member countries.

References

  1. Miralles-Wilhelm, F. Development and application of integrative modeling tools in support of food-energy-water nexus planning—A research agenda. J. Environ. Stud. Sci. 2016, 6, 3–10. [Google Scholar] [CrossRef]
  2. Sorda, G.; Banse, M.; Kemfert, C. An overview of biofuel policies across the world. Energy Policy 2010, 38, 6977–6988. [Google Scholar] [CrossRef]
  3. Gerbens-Leenes, P.W.; van Lienden, A.R.; Hoekstra, A.Y.; van der Meer, T.H. Biofuel scenarios in a water perspective: The global blue and green water footprint of road transport in 2030. Glob. Environ. Chang. 2012, 22, 764–775. [Google Scholar] [CrossRef]
  4. Gerbens-Leenes, W.; Hoekstra, A.Y.; van der Meer, T.H. The water footprint of bioenergy. Proc. Natl. Acad. Sci. USA 2009, 106, 10219–10223. [Google Scholar] [CrossRef] [PubMed]
  5. Rulli, M.C.; Bellomi, D.; Cazzoli, A.; Carolis, G.D.; D’Odorico, P. The water-land-food nexus of first-generation biofuels. Sci. Rep. 2016. [Google Scholar] [CrossRef] [PubMed] [Green Version]
  6. Bonsch, M.; Humpenöder, F.; Popp, A.; Bodirsky, B.; Dietrich, J.P.; Rolinski, S.; Biewald, A.; Lotze-Campen, H.; Weindl, I.; Gerten, D. Trade-offs between land and water requirements for large-scale bioenergy production. GCB Bioenergy 2016, 8, 11–24. [Google Scholar] [CrossRef]
  7. Chapagain, A.K.; Hoekstra, A.Y. Water Footprints of Nations. Volume 1: Main Report; UNESCO-IHE Institute for Water Education: Delft, The Netherlands, 2004. [Google Scholar]
  8. Hoekstra, A.Y.; Chapagain, A.K.; Aldaya, M.M.; Mekonnen, M.M. The Water Footprint Assessment Manual Setting the Global Standard; Earthscan: London, UK; Washington, DC, USA, 2011. [Google Scholar]
  9. Carneiro, A.C.G.; Nunez, H.; Moraes, M.M.G.A.; Onal, H. An Economic Analysis of Land Use Changes and Biofuel Feedstock Production in Brazil: The Role of Irrigation Water. Available online: http://www.webmeets.com/files/papers/wcere/2014/993/WCERE%202014%20Onal%20et%20al.pdf (accessed on 31 October 2017).
  10. ANA. Balanço Hídrico Quantitativo do Brasil, Cojuntura dos Recursos Hidricos no Brasil: Informe 2011; National Water Agency: Brasilia, Brazil, 2011.
  11. Martinelli, L.A.; Filoso, S. Expansion of sugarcane ethanol production in Brazil: environmental and social challenges. Ecol. Appl. 2008, 18, 885–898. [Google Scholar] [CrossRef] [PubMed]
  12. Watkins, D.W.; de Moraes, M.M.G.A.; Asbjornsen, H.; Mayer, A.S.; Licata, J.; Lopez, J.G.; Pypker, T.G.; Molina, V.G.; Marques, G.F.; Carneiro, A.C.G. Bioenergy development policy and practice must recognize potential hydrologic impacts: Lessons from the Americas. Environ. Manag. 2015, 56, 1295–1314. [Google Scholar] [CrossRef] [PubMed]
  13. Wan, L.; Wang, C.; Cai, W. Impacts on water consumption of power sector in major emitting economies under INDC and longer term mitigation scenarios: An input-output based hybrid approach. Appl. Energy 2016, 184, 26–39. [Google Scholar] [CrossRef]
  14. Pfister, S.; Koehler, A.; Hellweg, S. Assessing the environmental impacts of freshwater consumption in LCA. Environ. Sci. Technol. 2009, 43, 4098–4104. [Google Scholar] [CrossRef] [PubMed]
  15. Visentin, J.C. O uso da Água e a Interdependência das Economias Regionais: O Caso das Bacias Hidrográficas Brasileiras; Universidade de São Paulo: São Paulo, Brazil, 2017. [Google Scholar]
  16. Ussami, K.A.; Guihoto, J.J.M. Economic and Water Dependence among Regions: The Case of Alto Tiet, Sao Paulo State, Brazil. Available online: https://www.dropbox.com/s/gydw3rw1y8irve0/MRIOWaterSP_v3.pdf?dl=0 (accessed on 19 September 2017).
  17. Guilhoto, J.J.M.; Gonçalves Junior, C.A.; Coelho Visentim, J.C.; Imori, D.; Ussami, K.A. Construção da Matriz Inter-regional de Insumo-produto para o Brasil: Uma aplicação do TUPI; NEREUS: Brussels, Belgium, 2017. [Google Scholar]
  18. Mekonnen, M.M.; Hoekstra, A.Y. The green, blue and grey water footprint of crops and derived crop products. Hydrol. Earth Syst. Sci. 2011, 15, 1577–1600. [Google Scholar] [CrossRef] [Green Version]
  19. IBGE. Censo Agropecuário 2006. Brasil, Grandes Regiões e Unidades de Federação; Brazilian Institute of Geography and Statistics: Rio de Janeiro, Brazil, 2009.
  20. FAHMA CONSORTIUM/DREER. Estimativa das Vazões Para Atividades de uso Consuntivo da água nas principais Bacias do Sistema Interligado Nacional—SIN; National Electrical System Operator: Brasilia-DF, Brazil, 2003. [Google Scholar]
  21. Mekonnen, M.M.; Hoekstra, A.Y. A Global Assessment of the water footprint of farm animal products. Ecosystems 2012, 15, 401–415. [Google Scholar] [CrossRef]
  22. Secretariat National Environmental Sanitation. Sistema Nacional de Informações sobre Saneamento: Diagnóstico dos Serviços de Água e Esgotos—2009; MCIDADES: Brasilia, Brazil, 2011. [Google Scholar]
  23. Brazilian Institute of Geography and Statistics (IBGE). Censo 2010; Brazilian Institute of Geography and Statistics (IBGE): Brasilia, Brazil, 2015.
  24. Horochoski, L.; Wiecheteck, G.K.; Vaz, M.S.M.G. Avaliação do coeficiente de retorno de esgoto na bacia hidrográfica do arroio gertrudes—Ponta Grossa (PR). Rev. Eng. Technol. 2011, 3, 59–68. [Google Scholar]
  25. Mekonnen, M.M.; Hoekstra, A.Y. National water footprint accounts: The green, blue and grey water footprint of production and consumption. In Value of Water Research Report Series; UNESCO-IHE: Delft, The Netherlands, 2011. [Google Scholar]
  26. Gleick, P.H. Water and Energy. Annu. Rev. Energy Environ. 1994, 19, 267–299. [Google Scholar] [CrossRef]
  27. ANP. Produção Nacional de Petróleo e LGN (Metros Cúbicos) Produção Nacional de Petróleo e LGN (Barris) Produção Nacional de Petróleo e LGN (Barris Equivalentes de Petróleo); Agência Nacional do Petróleo, Gás Natural e Biocombustíveis: Rio de Janeiro, Brazil, 2016.
  28. Departamento Nacional de Produção Mineral. Anuário Mineral Brasileiro 2010; DNPM: Brasilia-DF, Brazil, 2011.
  29. FUNARBE. Relatório Final dos Coeficientes Técnicos de Recursos Hídricos das Atividades Industrial e Agricultura Irrigada; MMA: Brasilia, Brazil, 2011.
  30. Tidwell, V.; Chatein Sun, A.; Malczynski, L. Biofuel Impacts on Water; SANDIA: Livermore, CA, USA, 2011.
  31. EPE. Balanço Energético Nacional Brazilian Energy Balance; Ministério de Governo Federal Ministério de Minase Energia: Brasilia, Brazil, 2011.
  32. Macknick, J.; Newmark, R.; Heath, G.; Hallet, K. A Review of Operational Water Consumption and Withdrawal Factors for Electricity Generating Technologies; U.S. Department of Energy: Golden, CO, USA, 2011.
  33. Pfister, S.; Saner, D.; Koehler, A. The environmental relevance of freshwater consumption in global power production. Int. J. Life Cycle Assess. 2011, 16, 580–591. [Google Scholar] [CrossRef]
  34. Damkjaer, S.; Taylor, R. The measurement of water scarcity: Defining a meaningful indicator. Ambio 2017, 46, 513–531. [Google Scholar] [CrossRef] [PubMed]
  35. ANA. Balanço Hídrico Quantitativo do Brasil, Cojuntura dos Recursos Hidricos no Brasil: Informe 2016; National Water Agency: Brasilia, Brazil, 2016.
  36. Cazcarro, I.; Duarte, R.; Sanchez-Choliz, J. Water Footprints for Spanish Regions Based on a Multi-Regional Input-Output (MRIO) Model. In The Sustainability Practitioner’s Guide to Multi-Regioal Input-Output Analysis; Murray, J., Lenzen, M., Eds.; Common Ground: Champaign, IL, USA, 2013; pp. 119–132. [Google Scholar]
  37. Dietzenbacher, E.; Velazquez, E. Analysing Andalusian virtual water trade in an input-output framework. Reg. Stud. 2007, 41, 185–196. [Google Scholar] [CrossRef]
  38. Feng, K.; Chapagain, A.; Suh, S.; Pfister, S.; Hubacek, K. Comparison of Bottom-up and Top-down approaches to calculating the water footprints of nations. Econ. Syst. Res. 2011, 23, 371–385. [Google Scholar] [CrossRef]
  39. Feng, K.; Hubacek, K.; Pfister, S.; Yu, Y.; Sun, L. Virtual Scarce Water in China. Environ. Sci. Technol. 2014, 48, 7704–7713. [Google Scholar] [CrossRef] [PubMed]
  40. Lenzen, M.; Moran, D.; Bhaduri, A.; Kanemoto, K.; Bekchanov, M.; Geschke, A.; Foran, B. International trade of scarce water. Ecol. Econ. 2013, 94, 78–85. [Google Scholar] [CrossRef]
  41. Serrano, A.; Guan, D.; Duarte, R.; Paavola, J. Virtual Water Flows in the EU27: A Consumption-based Approach. J. Ind. Ecol. 2016, 20, 547–558. [Google Scholar] [CrossRef] [Green Version]
  42. United Nations Environment Programme Global Environment Monitoring System (GEMS)/Water Programme. Water Quality Outlook; United Nations: Ottawa, ON, Canada, 2016. [Google Scholar]
Figure 1. Top net virtual water exporters and importers of sugarcane production driven by the final demand of Brazilian provinces (units in million m3). Negative values in the x-axis show net imports of virtual water and positive values represent net exports of virtual water.
Sustainability 09 02049 g001
Figure 2. Water footprint (WF) distribution of sugar production, ethanol, and “others” (other sectors) for the top-ten states with the largest blue and green water footprint (units in million m3).
Sustainability 09 02049 g002
Figure 3. Net virtual exporters and importers of freshwater and scarce water from sugar cane production for ethanol (units in million m3) driven by the final consumption of Brazilian provinces. Negative values on the x-axis show net imports of virtual water and positive values represent net exports of virtual water.
Sustainability 09 02049 g003
Figure 4. Virtual blue, green, and grey water and scarce water of sugar cane production for ethanol traded across Brazilian states (units in million m3).
Sustainability 09 02049 g004
Figure 5. Top net exporting and importing states of virtual water driven by Brazil’s international exports of ethanol (units in million m3).
Sustainability 09 02049 g005
Figure 6. Water footprint of ethanol driven by domestic consumption and international exports. Light color shows the share driven by domestic demand and, and the dark color shows the share driven by international exports (units in million m3).
Sustainability 09 02049 g006
Table 1. Explanation of data collection and compilation for sectoral level water consumption.
SectorGreen WaterBlue WaterGrey WaterData Sources
Agriculture-cropsWF Factor (m3/ton) × Production (ton)WF Factor (m3/ton) × Production (ton)WF Factor (m3/ton) × Production (ton)IBGE
Water Footprint Network
Agriculture-livestockN/ANumber of heads × average weight per animal (Kg/unit) × (1/1000) (ton/Kg) × WF factor
(m3/ton) × return flow rate (%)
[Per livestock category]
Blue WF-Grey WF ratio (%) × blue water (m3)IBGE
ONS
Water Footprint Network
Water and sanitationN/AWithdrawal rate (L/person/day) × population (person) × distribution losses ratio (%) × returns flow rate (%)/1000 (L/m3)Blue WF-Grey WF ratio (%) × blue water (m3)IBGE
SNSA
ABNT
Water Footprint Network
Primary EnergyN/AWF Factor (m3/ton) ×
Production (ton)
NegligibleANP
FBB, Funarve
DNPM
US Sandia Laboratories
Gleick, P.H. (1994)
ElectricityN/APower Generation (MWh) × WF ratio (m3/MWh)NegligibleANEEL
NREL
Table 2. Comparative Advantage results (CA values) for green and blue water of sugarcane production versus: total agriculture, rice, corn, and soy.
Green Water
StateTotal AgricultureRiceCornSoy
São Paulo0.931.062.272.03
Minas Gerais0.890.552.131.47
Goiás1.080.733.981.03
Mato Grosso do Sul2.271.3254.011.65
Parana1.471.754.531.26
Mato Grosso1.111.1354.740.94
Alagoas1.083.091.58151.32
Pernambuco0.560.160.4442.28
Paraíba0.470.100.0726.41
Bahia1.400.584.281.99
Blue Water
StateTotal AgricultureRiceCornSoy
São Paulo0.711.320.010.03
Goiás0.240.040.000.00
Minas Gerais0.420.260.030.01
Matto Grosso do Sul0.322.730.000.02
Rio de Janeiro0.290.310.010.01
Bahia0.170.090.020.00
Alagoas0.932.020.011.09
Tocantins0.110.230.010.00
Pernambuco1.153.770.040.01
Paraíba0.450.120.130.03
Table 3. Comparative Advantage results (CA values) for blue water of sugarcane production versus water & sanitation, livestock, power generation (excluding bioethanol based generation and hydropower), and primary energy sectors (excluding bioethanol production).
Blue Water
StateWater & SanitationPower GenerationPrimary EnergyLivestock
São Paulo1.760.250.010.38
Goiás0.320.01N/A0.09
Minas Gerais1.680.16N/A0.37
Matto Grosso do Sul0.890.05N/A0.36
Rio de Janeiro3.230.460.0090.48
Bahia6.910.040.0030.07
Alagoas58.220.050.050.7
Tocantins0.05N/AN/A0.06
Pernambuco3.110.21N/A0.25
Paraíba0.780.0001N/A0.08

