1. Introduction
The impacts of climate change are complex and diverse, which can include rises in sea levels, flooding, drought, increased temperature, etc. [
1]. The fact that these adverse effects and the possibility that the rising cause of global warming pollutants are anthropogenic, is now widely accepted [
2,
3,
4]. A substantial reduction in the amount of CO
2 emissions resulting from human activities is needed to curb global warming, and this has led to numerous measures to ensure that cleaner and more efficient energy sources are utilised in all facets of human lives.
The UK is leading the way in this regard, evidenced by the law put in place to reduce by 60% CO
2 emissions by 2050 following the Royal Commission on Environmental Pollution (RCEP) report in 2000 [
5]; this target has since increased to 80% [
6]. The UK government has justifiably put considerable focus towards reducing the CO
2 emissions from buildings (residential and commercial) because studies/analyses have shown that they account for at least 43% [
7,
8]. To achieve the CO
2 emissions reduction, it is important to significantly reduce emissions from existing buildings which makes up the bulk of buildings during this period, especially commercial ones such as hotels which accounts for one of the top sectors [
9]. Possible explanations for the high emissions in hotels can be attributed to the fact that hotels generally prioritise the comfort of guests and the guest mind-set is centred on experiencing luxury without the added pressure of behaving in the energy efficient manner that they might encounter elsewhere [
10]. Moreover, hotels operate on a 24/7, 365 days a year basis.
The need to estimate annual energy consumption in existing buildings and the built environment at large is becoming ever more important, as greater attention is now being placed on effectively controlling utility costs, total energy consumption and CO
2 emissions [
11]. Estimated energy use can be utilised for various purposes such as justification for proposed refurbishment works, developing budgets for utility costs, demonstrating compliance to certain regulation targets etc. The European Union (EU) ‘Energy Performance of Building Directive’ (EPBD), which is aimed at helping its member states towards attaining higher energy efficient buildings, places emphasis on the necessity to develop certain methodologies for energy performance estimation and issuance of energy performance certificates [
12]. The directive specifically makes it compulsory for all member states to develop national calculation methodologies that are in conformity with the structure of the directive findings [
13].
In the UK, two main systems are used for domestic and non-domestic buildings to demonstrate compliance with the EPBD directive. The Standard Assessment Procedure (SAP) for energy ratings of dwellings is used for domestic buildings, whereas the Simplified Building Energy Model (SBEM) which accommodates a broader variety of building types is used for non-domestic buildings [
14]. “Part L: Conservation of Fuel and Power” of the Building Regulations governs the energy efficiency of new buildings (of all types) in England and Wales, with extensions, such as L2A for new non-domestic buildings and L2B for work in existing non-domestic buildings [
14].
Although there has been significant progress made in the area of tools (software packages) designed to estimate the energy performance of buildings, they still have some limitations in their capability to accurately predict the energy performance of actual buildings with real occupancy behaviour and activities [
15]. Even accurate energy predictions for simple buildings with relatively simple occupancy behaviour is difficult enough, as exhibited in the current state of the art. Despite these shortcomings, legislation that requires the estimation of building energy performance is still being introduced by many countries, along with recommended tools to help confirm compliance. The recommended tools are generally underpinned on the European Committee for Standardisaton (CEN) umbrella document [
16]. There is an inherent problem that these tools will be required by most clients to provide accurate actual energy consumption in new and existing buildings which is not necessarily what the tools are designed for, as most energy models are mainly used at the design stage to evaluate various design choices and to ensure compliance with building regulations [
17]. Also, the difference between the estimated building performance and the actual site consumption from utility bills is known as the ‘performance gap’ [
17].
The aim of this paper is to estimate the operational energy consumption of an existing hotel building in the UK with the use of dynamic simulation software (EDSL TAS) and compare the estimated energy consumption with available site consumption data.
The following objectives helped to achieve the articulated aim:
Collection of all necessary data (such as Computer Aided Design (CAD) plans, building fabric makeup, plants/system information and operating energy consumption) and site surveys to verify the collected data.
Creation of a hotel model on the dynamic simulation software using the data obtained.
Estimation of annual energy consumption of the hotel using the Building Regulation Part L model.
Estimation of annual energy consumption of the hotel using bespoke energy model. This is done through the systems modelling component of the dynamic simulation software.
Improve the system modelling result by estimating and accounting for (unregulated energy use) catering energy use.
Comparison of the model results against actual building operational energy consumption.
The paper will present an approach of improving estimates of operational energy which can reduce the expected performance gap between Building Regulation Part L model and actual building energy use. Furthermore, it contributes to existing state of the art in this area, as most studies on non-domestic buildings use offices as a case study.
Building Energy Performance Modelling for Compliance and Actual Energy Consumption Estimation
The building regulation provides the minimum standard for new and existing buildings in the UK. These government-set regulations differ marginally for Scotland and Northern Ireland as they are separately overseen. In Wales and England, Part L “Conservation of Fuel and Power” oversees the efficiency of new buildings with extensions such as L2A for new non-domestic buildings and L2B for work in existing non-domestic buildings [
14]. New buildings in the UK must be assessed at design stage with the standardised calculation method known as the National Calculation Methodology (NCM), which is the calculation approach required by the EPBD for demonstration of compliance with energy performance standards [
11,
17,
18].
To show compliance to building regulations, NCM takes into consideration the architectural design, regulated energy use (such as lighting, heating, cooling and domestic hot water requirement) of the modelled building and offers a comparison between the carbon emissions of the model and a comparable notional building. Both calculations are done using standard sets of data for different activities and call on the same service construction databases. The standard NCM templates define the operational inputs (such as operational hours, occupancy density, set temperature points for space conditioning, domestic hot water demand, ventilation rate etc.) that are used for both the modelled and notional buildings. The NCM enables compliance calculations to be done by endorsed dynamic simulation software (such as Environmental Design Solution LTD EDSL TAS) for large complex buildings or SBEM for less complicated non-domestic buildings. Dynamic thermal simulation software is preferred for complex buildings because it gives hourly output which is needed to give more accurate evaluations, compared to SBEM which provides monthly calculation output. As highlighted earlier, the calculation procedure for both alternative dynamic simulation software and SBEM is defined in NCM which is issued by the UK government’s Department for Communities and Local Government (DCLG). Therefore, they use specific weather data and a standardised set of activities and construction databases, but some unregulated energy uses (such as plug loads, catering, lifts, servers etc.) are not accounted for in the calculation. This makes the building regulation part L energy results not representative of real site energy consumption [
19]. Even though the NCM guidance clearly advises that part L results are not equivalent to the building’s actual consumption, it is frequently used as a starting point for computing an actual consumption model and possibly budget planning for utilities use.
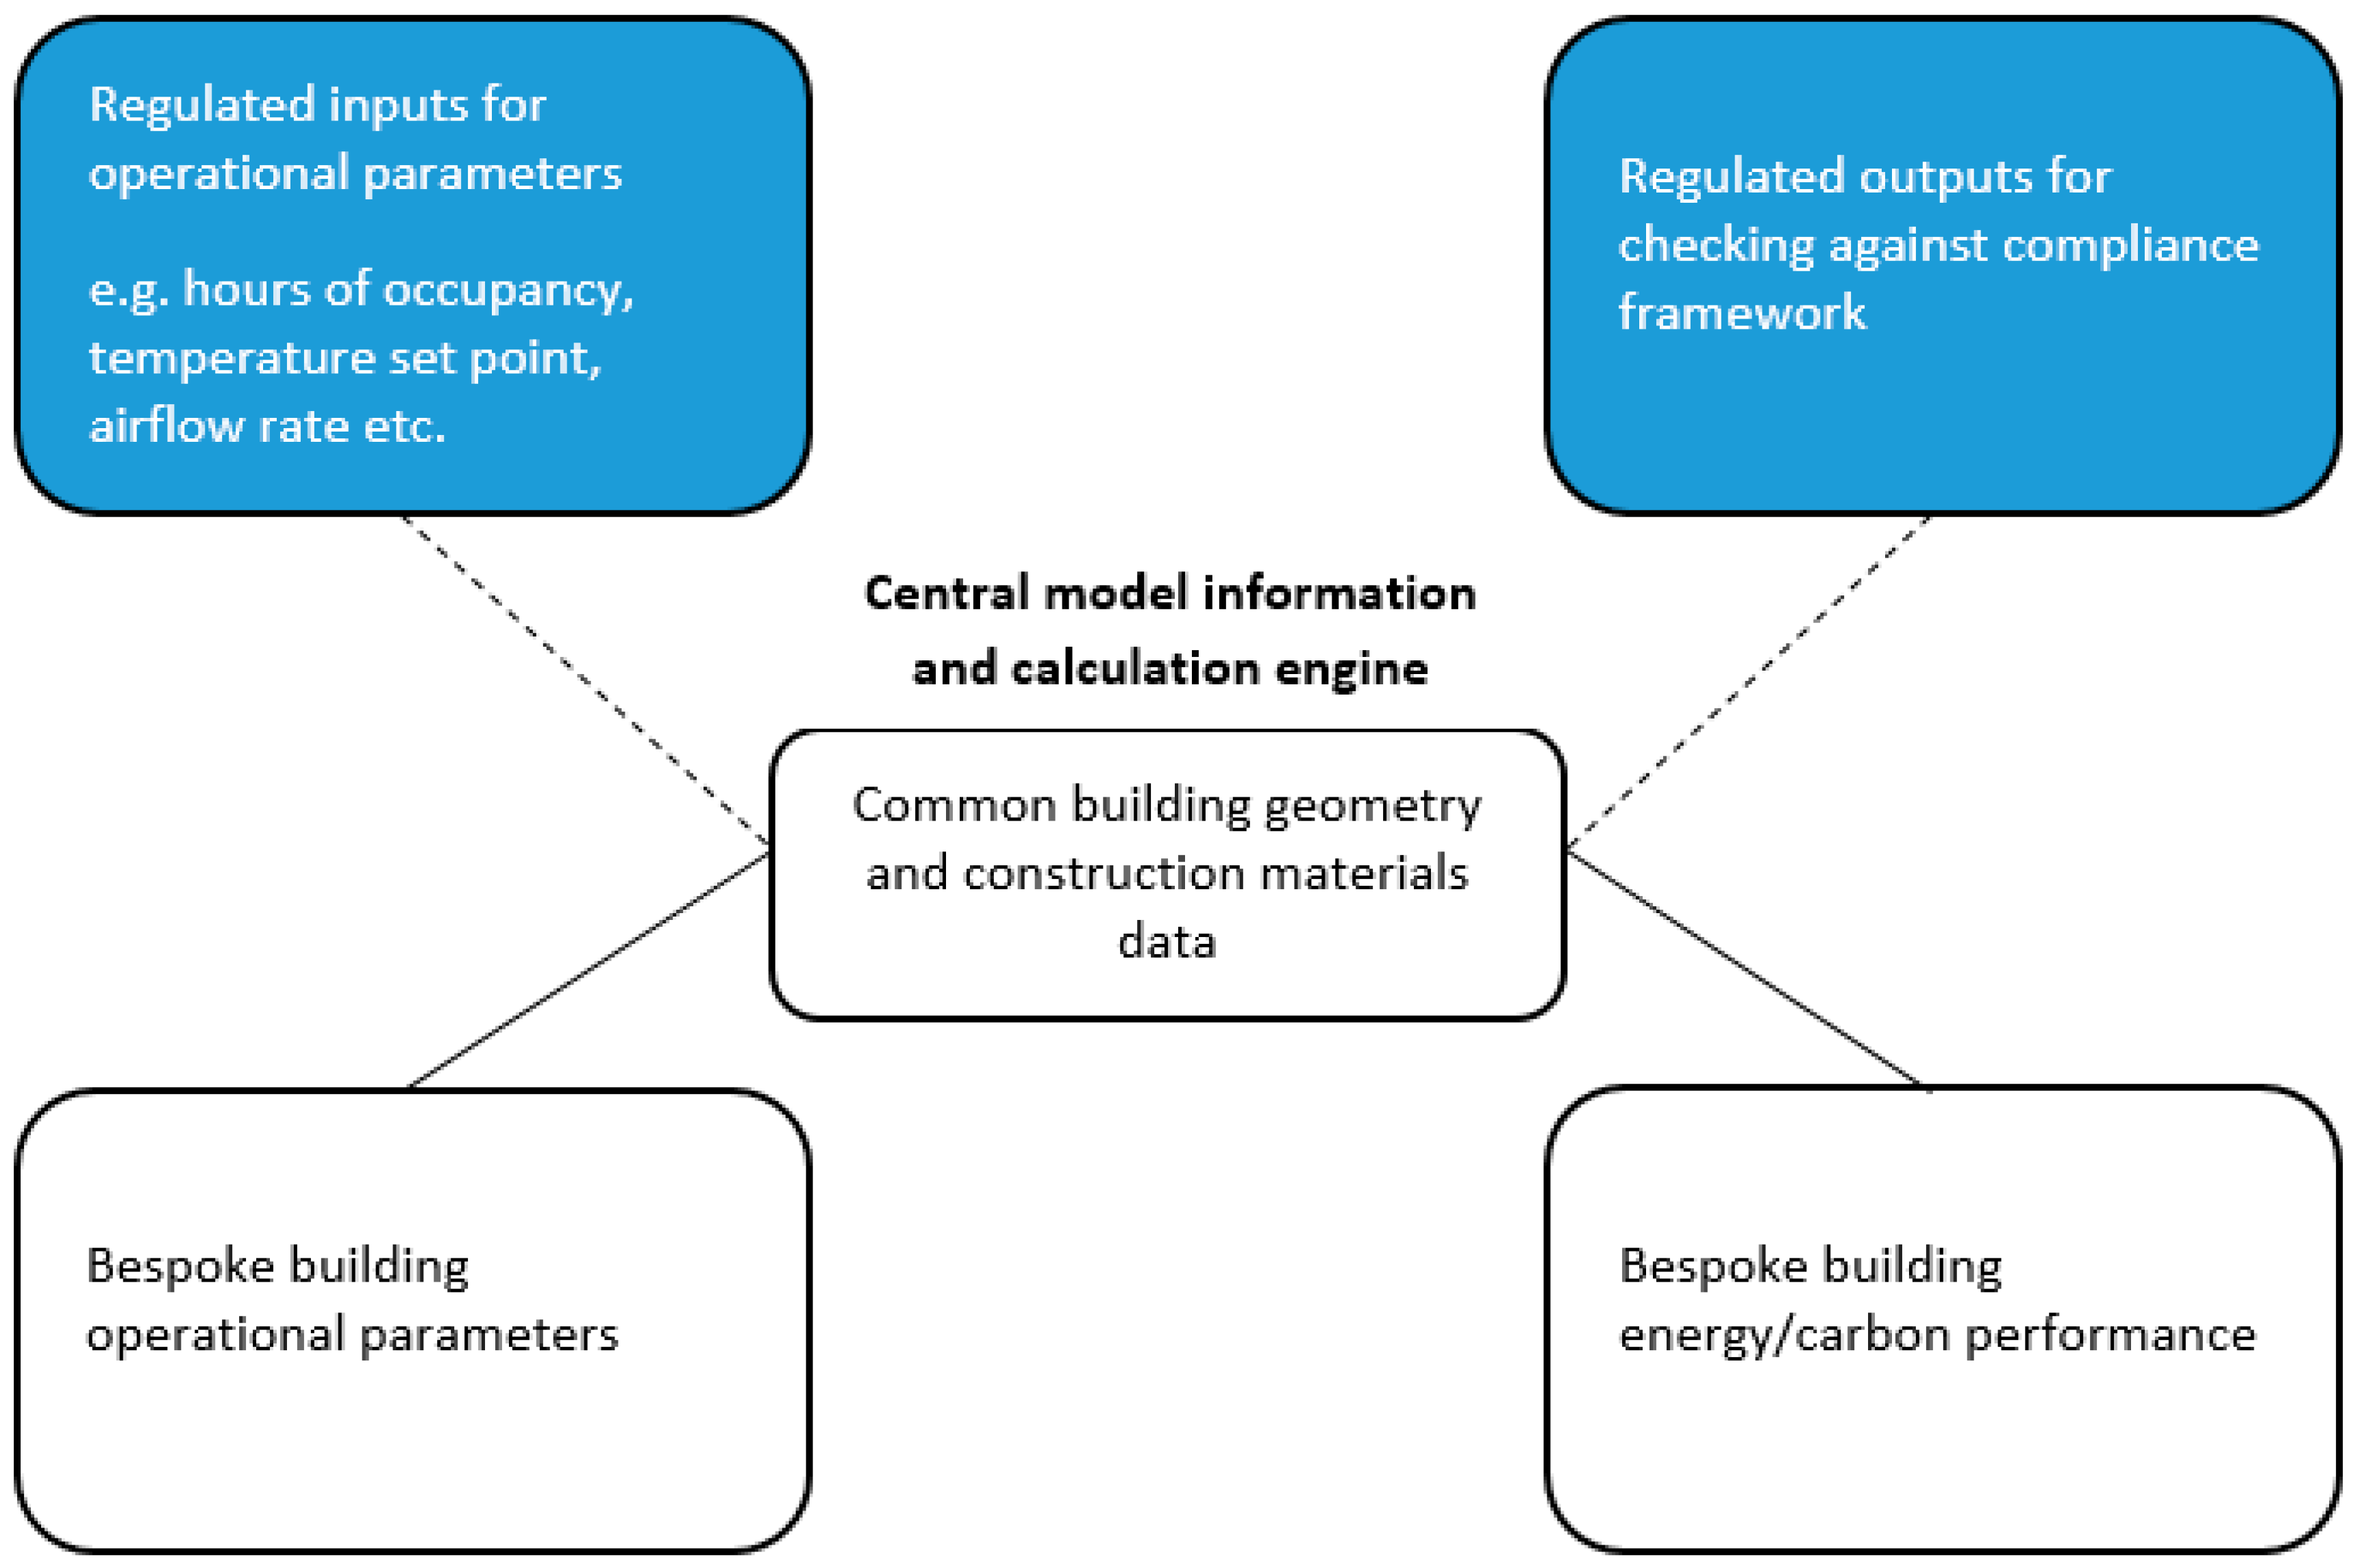
On the other hand, bespoke energy models using Dynamic Simulation Models (DSM) can estimate energy consumption that is more representative of actual energy consumption. This is because bespoke analysis enables greater flexibility as usage pattern and internal conditions can be defined along with systems that are more representative of actual buildings [
19]. It should therefore be noted that within building energy modelling, there are two main evaluation categories that should not be confused; namely, modelling for compliance and bespoke modelling.
Figure 1 shows the major distinction between the DSM compliance energy model and bespoke model.
However, despite the closer representation to actual site energy consumption that bespoke models offer, there is still the existence of performance gaps as the models have limitations. Limitations associated with the fact that models are always a simplified view of the real world, notwithstanding their complexities, occupants behaviour cannot be perfectly assumed, weather data used are usually average climatic data which will not necessarily be representative of a specific real year, etc.
The accuracy of the energy simulation is generally as good as the quality of input data available used for the thermal model [
20,
21]. Therefore, simulation accuracy depends on various dynamic input parameters such as occupancy characteristics and weather data, both of which are difficult to replicate in modelling to match that of the real building, especially at the design stage. The choice of weather data used for the simulation has a considerable impact on the result. According to Holmes and Hecker [
22], building service engineers can only use the weather data of a year to run building simulations, while the world metrological organisation defines climate as a 30-year period to reduce the effect of natural inter-annual differences in the weather data. This poses a question of which year’s weather data should be used. Generally, the weather data employed in building simulation models contain hourly records of the core weather variables (like temperature, solar radiation, relative humidity and wind speed) at a location in close proximity to the modelled building [
23]. Usually, two distinct types of weather files are used to perform building simulations in the UK; these are the Test Reference Year (TRY) and Design Summer Years (DSY) [
24]. The weather file of a year that is representative of the weather over a certain number of years is referred to as the TRY, which differs as different countries employ different methods in choosing their TRY [
25]. The weather file comprises of average months chosen from the baseline of historical data [
26]. The updated Chartered Institution of Building Services Engineers (CIBSE) TRY files are developed using a baseline period of 1984 to 2013 as opposed to the previous TRY using a baseline of 1984 to 2006, thus accounting for the effect of climate change [
27]. In Virk and Eames [
26], in the UK, the International Organization for Standardization (ISO) methodology is employed to select suitable TRY months and it selects representative months using air temperature, relative humidity, cloud cover (as a substitute for global irradiation) and wind speed (as a secondary parameter). The primary variables are used to obtain the three months with the lowest ranking. From these months, the month with the most average wind speed is subsequently selected as the representative month for that location [
26]. Since TRY is developed to be representative of weather over certain years, it would not contain extreme scenarios, therefore it is better suited for measuring energy performance and not appropriate for estimating building performance under worst case scenarios like overheating [
22,
25].
2. Literature Review
Study of available state of the art shows that there is a significant amount of literature on the discrepancy between energy model at design and measured energy consumption of operational non-domestic buildings, especially offices. Some of these works are presented in this section along with some studies on the energy performance of hotel buildings.
Menezes et al. [
15] investigated the observed performance gap between predicted and actual energy performance of non-domestic (office) buildings through Post Occupancy Evaluation (POE) information. The study shows the existence and causes of performance gaps between the design energy modelling and actual building energy use in operation, with the major underlining causes being: the unrealistic input assumptions on occupancy behaviour and facilities management in building energy models. The study also showed that POE can help to significantly reduce this performance gap by employing the data obtained to develop a more representative model of the actual building which incorporates better parameters with regards to occupancy behaviour and unregulated energy use, especially small power and catering equipment in high density office buildings. The result of the case study building demonstrates that the accuracy of the model can be increased to within 3% of actual electricity consumption values.
Gucyeter and Gunaydin [
12] worked on improving the retrofit strategy of an existing university case study office building. To achieve this, it was important to develop a simulation model which can give an acceptable energy consumption estimate, especially as standard models do not necessarily give adequate correlation with real operational energy consumption. The study employed a calibrated simulation based on energy performance audit and monitoring of the case study building which is evaluated on performance levels and potential for improvement with simple Energy Conservation Measures (ECM). The TAS model was calibrated using one year of monitored data, such as indoor temperature, humidity, energy consumption, site climatic data etc. which after 13 runs of repeating the calibration process a calibrated base-case model with an average root mean square error of 12.45% for heating and cooling energy consumption compared against monitored data. The calibrated base-case model was finally used to evaluate three retrofit strategies along with several proposed ECM.
Knight, Strvoravdis and Lasvaux [
16] compared site measured energy consumption data to predicted values from detailed surveys and modelling for a case study mixed use UK educational building. The study provided an understanding as to how close the predictions from available software are to actual energy consumption. Though the paper highlighted inherent challenges associated to the use of software modelling for evaluating building energy performance, the result of predicted energy from survey data, as well as that obtained using UK SBEM asset type compliance model, compared favourably to the site monitored actual energy consumption profile for the case study building. However, the paper pointed out that further case studies need to be analysed to have any assurance in its findings.
The work of Collins [
11] highlighted the increasing importance of accurately estimating annual energy consumption within the construction sector, and also identified that the challenges of using available software are related to their methodologies that are sometimes complex, time consuming and difficult to interrogate and does not necessarily produce predictions that are accurate enough. The study thereby presented the use of heating degree days (HDD) computed from simulation weather data as a means of monitoring actual performance against predicted heating energy consumption.
Furthermore, CIBSE [
17] TM54 presented with the aid of a case study high density office building, the apparent mismatch between predicted energy performance of a building at design stage against operational energy. The report provides methods which can be employed by building professionals to bridge the performance gap by estimating the various energy uses (such as lifts, catering facilities, servers, small power office equipment etc.) which are not accounted for in energy compliance models. The results show very significant correlations between energy consumption estimates using this approach, compared to actual operational energy consumption.
Figure 2 shows a comparison of the case study result for Part L model and the TM54 estimates against actual measurements from the report.
Xing et al. [
28] evaluated the efficacy of Energy retrofit measures (ERMs) in reducing the energy demand of hotel buildings using an existing hotel building in china. The study was undertaken with building simulation software and the energy-saving potential of an articulated retrofit scheme was evaluated. The main factors influencing the accuracy of the estimation of the energy consumption of hotel buildings were investigated via calibration of the baseline model. Their result revealed that internal load schedules along with occupancy rate and the chillers’ coefficient of performance (COP) have significant effects on the accuracy of the model for hotel buildings. Furthermore, post-implementation monitoring indicated strong correlations between the prediction of the calibrated model and the actual outcomes of the building energy efficiency retrofit, thus validating the accuracy of calibrated energy models.
The works of Deng and Burnett [
29], Priyadarsini et al. [
30] and Wang [
31] examined the performance of hotel buildings in different cities located in a cooling dominant climate. Deng and Burnett [
29] used data based on utility billing, augmented by actual site measurement and operational information to study the energy performance of 16 different hotel buildings in Hong Kong. Their result estimated the Energy Use Intensity (EUI) per unit floor area for all the hotels and examined the correlation between obtained EUI and several factors such as year of construction, occupancy, hotel class and weather. The analysis showed no clear correlation between EUI and the examined factors. Similarly, Priyadarsini et al. [
30] used energy consumption data and other relevant information collected from 29 top-class hotels via national survey in Singapore. The study evaluated the EUI of the hotels and investigated the correlation between electricity consumption and occupancy of several rooms of the individual hotels. The result showed weak correlation which highlights the importance for improved energy management in hotels during low occupancy periods. Additionally, their EUI Pearson correlations with other possible explanatory indicators show that density of workers and years after the previous significant energy retrofit were also observed to be immensely connected to the energy use intensity of the hotels. Wang [
31] conducted a comparable study in Taiwan using data from a bigger sample of 200 hotels comprising of 45 international tourist hotels, 19 standard tourist hotels, 116 hotel enterprises, and 20 bed and breakfast accommodations. Pearson correlations between EUI and possible explanatory indicators showed that certain building conditions, operations, and other factors are significant. Moreover, these presented works all highlighted the increasing difficulty of adequately evaluating the energy consumption of hotel buildings due to several reasons. These reasons include the fact that most hotels house several varied facilities such as kitchens, restaurants, function spaces, retail outlets, swimming pools, etc., along with their significantly varying levels of occupancy even though they normally operate for 24 h all through the year.
From the review precedent literature presented, it is apparent that a reasonable amount of studies on improving energy performance prediction has been done, especially at design stage. However, most studies are on non-domestic office buildings. Additionally, it can be observed that there is a research gap relating to the computation of unregulated energy consumption estimates. Therefore, this study contributes to the gap by presenting an approach that can be used to estimate considerable unregulated energy use such as catering in an existing hotel building. This contribution thus provides an indication of possible unregulated energy consumption that can be evaluated to help in performance gap reduction in hotel buildings; especially as precedent studies have demonstrated that accurate estimation of energy consumption in hotel buildings are progressively onerous due the mixed-use nature of hotels accommodating varied activities.
3. Methodology
The focus of this study is to estimate the energy consumption of a case study UK hotel building, based in the south east with the aid of an approved dynamic simulation software. Estimation of the total energy consumption for the model is obtained by two approaches. The first approach evaluates the energy consumption via a UK building regulation part L model and the second approach is by evaluating energy performance through the systems modelling component of the dynamic simulation software. The second approach is then modified to include the estimates for unaccounted building energy use such as catering services. The simulation results are validated by comparing against site measured energy consumption. The case study building was surveyed to enable verification of available data such as building fabric data (e.g., walls and windows), occupancy information to ensure simulation assumptions are realistic, building usage to ensure zone grouping is as shown on architectural plan and Heat Ventilation and Air Conditioning (HVAC) system characteristics.
EDSL TAS software version 9.3.3 (Engineering Development Solutions limited, Milton Keynes, UK ) is employed as the dynamic simulation software to model and calculate the energy performance for this study. TAS, designed by Engineering Development Solutions limited, is a set of application products with the capability to simulate thermal performance of buildings and their systems which can be translated to energy consumption estimates [
32]. The software is also approved by and fully accredited for the UK building regulation 2013 and demonstrates compliance to various BS EN ISO standards [
33]. It has a 3D graphic-based geometry input interface that includes a CAD link; however, the core module is the TAS Building Designer (TBD), which performs a dynamic building simulation with integrated natural and forced air flow [
32]. Furthermore, it provides a comprehensive solution as a powerful simulation and 3D modelling tool, and also realistically accounts for occupied summer hours underpinned on the CIBSE TM52 adaptive overheating criteria [
34]. TAS systems, used in the second approach, is the component of the software suite which provides plant modelling capabilities to simulate systems such as HVAC systems/control.
Table 1 shows the input parameters used for each model.
3.1. Building Description
The building used in this case study is Hilton Reading located in Reading, Berkshire. The building, constructed in 2009, is a four storey hotel with underground basement parking. The building is a predominantly single glazed facade, sealed building and fully air conditioned with total floor area of 12,362 m2. The windows are typically double glazed (4 mm clear pane; 50 mm air gap and 4 mm clear pane) with a total window area of 1080 m2 and window to building envelope area of 30%. The ground floor of the building accommodates the reception area, conference/meeting rooms, restaurant/bar/kitchen and fitness/pool area. While the first, second and third floors accommodate mainly the ensuite bedrooms, the roof houses the plant rooms. The rooftop central Air Handling Units (AHU) provide heating/cooling as well as fresh air to all building floors whilst Fan Coil Units (FCU) provide cooling/heating to individual bedrooms/meeting rooms. The hotel is very busy with a room occupancy rate of over 90% annually. The Domestic Hot Water (DHW) demand to all rooms, kitchens and toilets is met by six gas fired boilers. Reading, Berkshire is about 40 miles from central London, which is the closest weather station. Therefore, the weather data used for simulation of heating and non-heating season is the current CIBSE London TRY. Additionally, the building’s construction year (2009) informed the selection of building fabrics that comply with the 2006 UK building regulation in the simulation process.
The processes that were used to develop both the UK Building Regulation model and system/plant modelling on the dynamic simulation software (TAS) is presented in
Section 3.2 and
Section 3.3. The main difference between the two models is in the TAS simulation process. For the building regulation model, the populated TAS building file (TBD) uses uneditable standard NCM databases for internal conditions and simulation, whereas the TBD file used for system/plant modelling uses editable internal conditions that reflect operational building parameters (such as occupancy hours and temperature set-point).
3.2. Building 3D Modelling Process
The 3D modeler component of the software enables information on the building geometry, such as floors, wall types, windows and doors dimensions etc. to be inputted. Also, the categorisation of the floor areas into different zones based on their usage is done, and all these data are used to generate the 3D model as close to reality as possible. The CAD drawings are used to obtain data for the 3D modelling;
Figure 3 shows the typical architectural floor plan.
The drawings also provide the categorisation of the building floors into various zones such as bedrooms, reception, offices, kitchen etc. which are used in various stages of the simulation process. The zoning process is done meticulously based on the usage of the space as it has a direct bearing on the space internal condition.
3.3. TAS Simulation Process
The TAS TBD component of the software is the core part of the software suite; it performs the thermal simulation of the building. Some modelling parameters and assumptions are made in this study to execute the building performance simulation, which are enumerated below.
Appropriateness of CIBSE TRY weather data (which is based on historic average data patterns over a certain number of years) to be applicable to prevailing weather conditions of the case study building location.
Acceptability of the National Calculation Methodology’s standard hotel internal conditions activity and occupancy as existing conditions of the case study hotel building.
Table 2 and
Table 3 show modelling simulation parameters and assumptions.
3.4. UK Building Regulation Model
The UK building regulation component of EDSL TAS, which is based on the 2013 building regulations, was also used for this study. It subjects the simulation result to the NCM standards to estimate the energy performance of the building mainly for compliance purposes. This is done by systematically going through the program by selecting appropriate parameters to develop the building’s plant circuit arrangement which translate to generation of various building reports, for example, Energy Performance Certificate (EPC) documents.
3.5. Plant/Systems Modelling
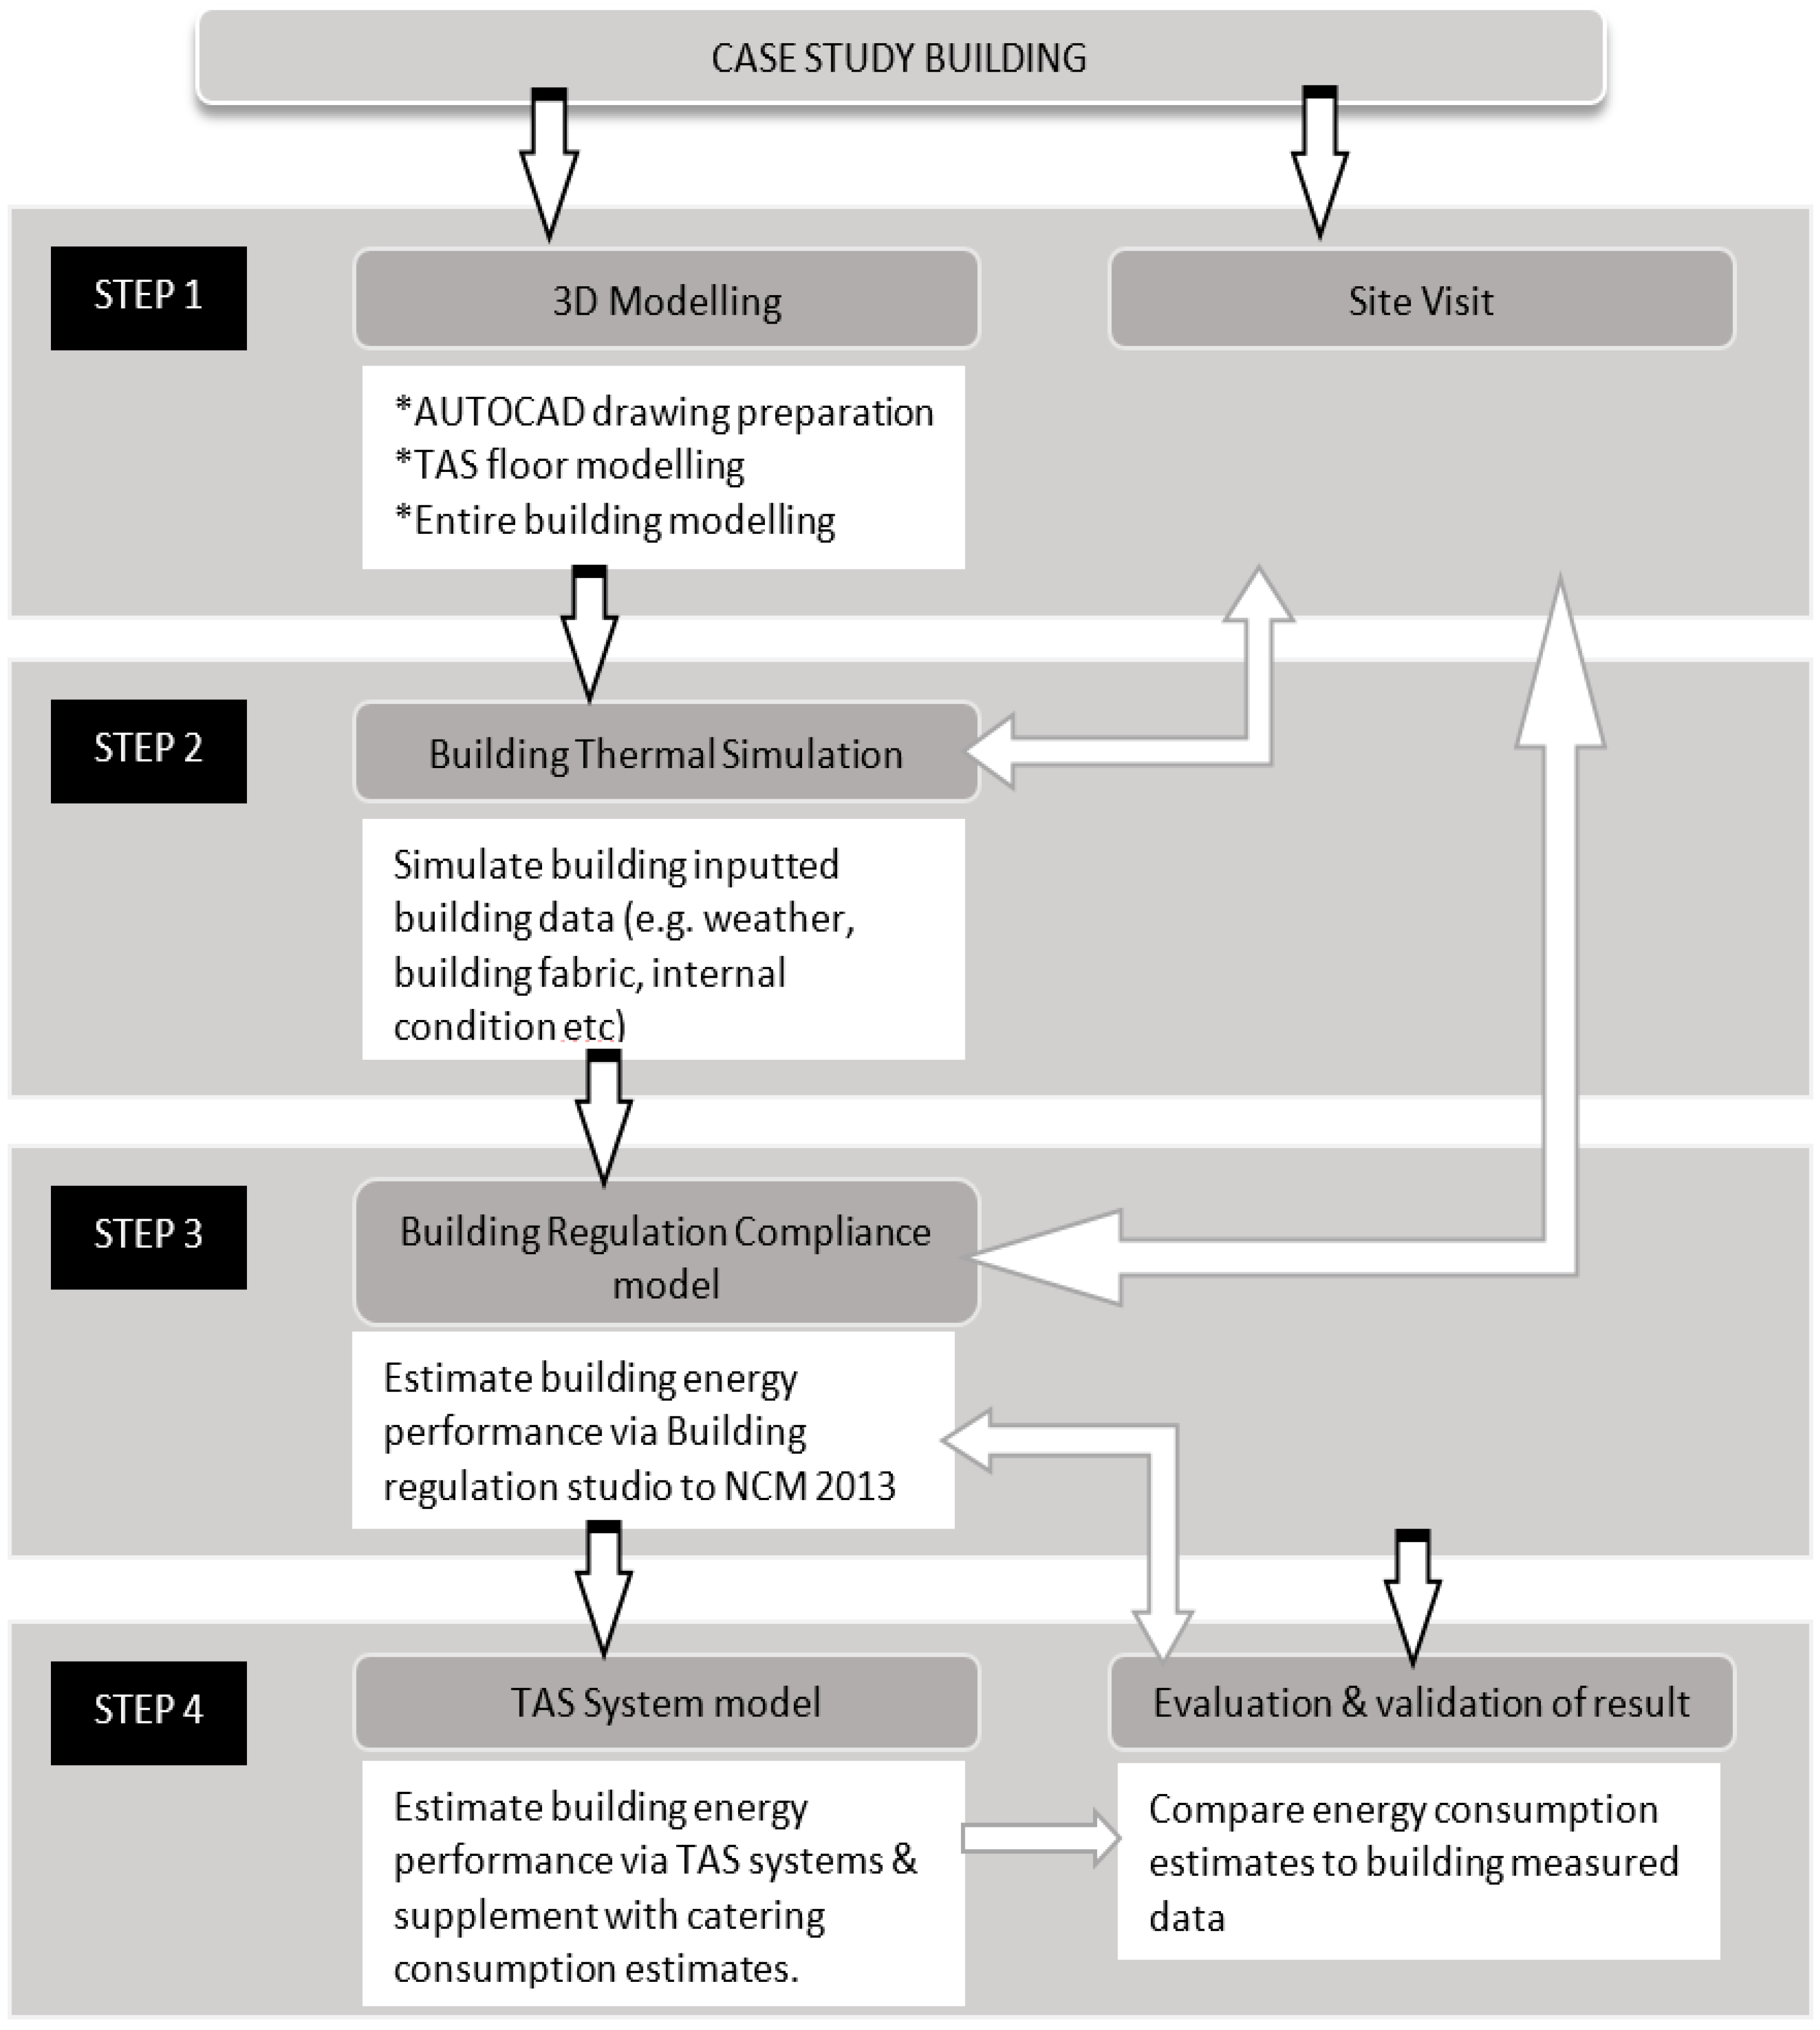
The TAS systems module of the TAS software suite enables the simulated TAS building file (TSD) to be directly coupled with it to give energy performance estimates that are not entirely subjected to the NCM standards, thereby improving energy consumption estimates. However, the estimate still does not account for unregulated energy use, such as catering, which can be significant in a hotel building and is therefore estimated in this work to augment the TAS systems result.
Figure 4 shows a summary of the case study process.
4. Results and Discussion
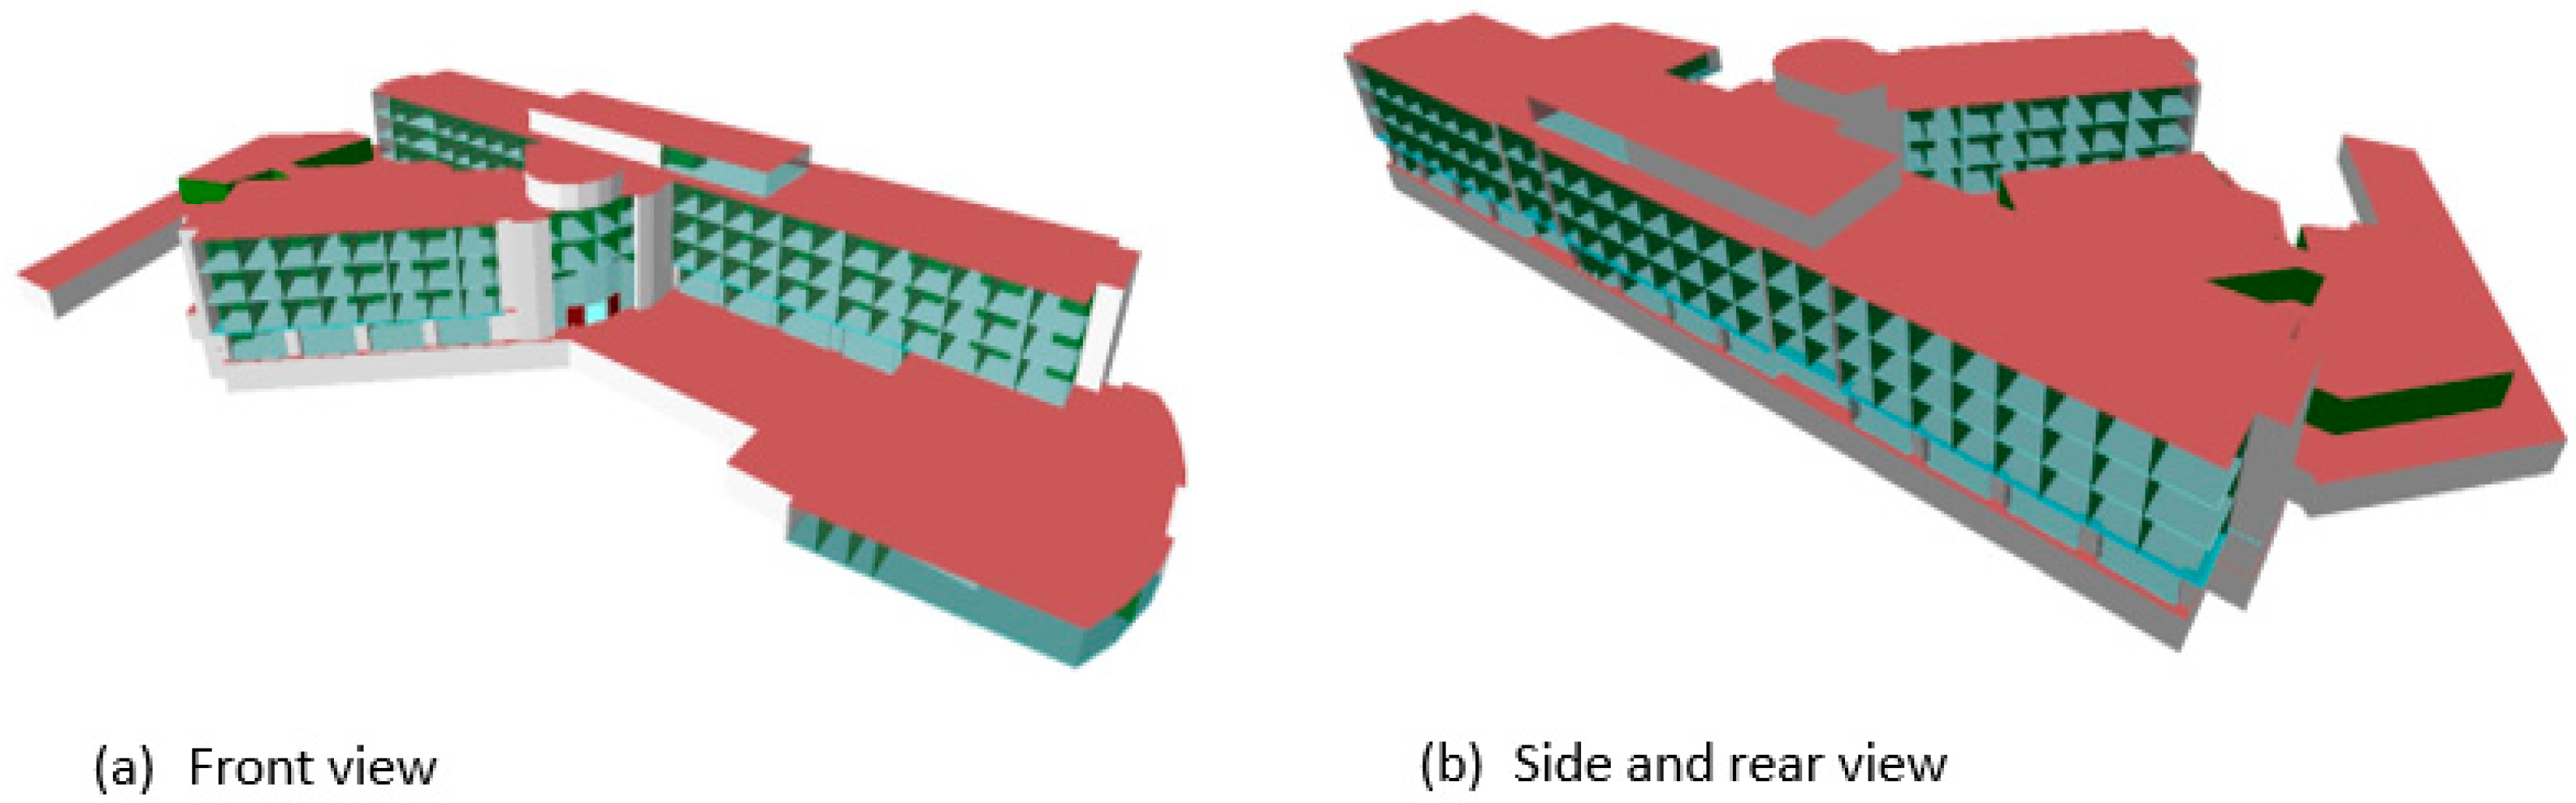
The results and discussion of the case study hotel building is presented in this section.
Figure 5 illustrates the result of the 3D modelling process.
The populated TAS TBD file is directly attached to the building regulation studio component of the software to obtain Part L energy performance results, simulated based on the UK 2013 Building Regulation for England and Wales. Typical results which include reports of annual energy consumption and monthly energy consumption simulation of the case study hotel building is presented in
Figure 6 and
Figure 7. The energy consumption estimate comprises of heating, cooling, auxiliary, lighting, DHW and equipment energy use.
Figure 6a demonstrates the breakdown of the annual energy results based on building regulations for various components. Auxiliary energy is the energy used by controls, pumps, and fans for the HVAC systems. Additionally, there is a standard allowance for small power heat gains in order to calculate the heating and cooling demands which is the equipment energy use.
It can be clearly seen from the analysis of
Figure 6b,c that the total energy consumption estimate result via the building regulation simulation is significantly lower compared to the actual building consumption data with a percentage error of −44%, indicating an underestimation. This is primarily because the building studio model is designed to simulate for compliance purposes and this must strictly follow NCM guides, including use of NCM databases (ineditable building fabric input and internal conditions), definition of notional and reference building, etc. Moreover, the estimated energy does not account for some energy uses such as catering services, servers, small power office equipment and lifts. However, from
Figure 6c, it can be observed that the energy consumption trend of the TAS building studio results across the year does not differ significantly compared to the actual building measurement, with both profiles showing peak consumption in the heating season and lower consumption during cooling season. It is also worth noting that the simulation results presented in
Figure 6 and
Figure 7 is computed using typical climatic data of the building, whereas the actual building energy measurements can be subject to micro-climatic variations.
The results of energy consumption estimates obtained from modelling of the plant/systems on the TAS systems component of the software is presented in
Figure 7.
From
Figure 7a–c, it is apparent that energy consumption estimates obtained by simulating the actual systems give an improved result compared to estimates from building compliance modelling. This is because actual system modelling uses a thermal simulation (TSD) file that is not evaluated through the building regulation; thus, the TSD results are more representative of the actual building condition. Moreover, this simulation is not strictly subjected to NCM guides and databases of standardised internal conditions. However, the comparison of the system simulation result against the actual building consumption data from
Figure 7 shows that TAS system energy consumption results underestimate total annual energy with a percentage estimate of −28%. This discrepancy is a result of some unaccounted energy uses, including catering, lifts and small power equipment which are usually not accounted for in building energy models.
The result of energy consumption estimates derived by accounting for expected fossil fuel and electricity consumption associated with catering energy use is presented to improve the model estimate. Catering activities are different and difficult to estimate between different hotels, especially in already existing buildings. Sub-metering is the best way to adequately monitor catering energy consumption and this is easier to achieve where the kitchen is housed in a separate building/section or by careful planning during the building design stage [
35]. Since simple reliable calculation estimates for catering energy use are difficult to come by, it is recommeded in CIBSE TM 54 that benchmarks be used to estimate commercial kitchens energy use. A typical benchmark that can be utilised for this purpose is adopted from CIBSE TM 50: Energy efficiency in commercial kitchens [
35], which comprises of catering energy benchmarks for various building categories per meal served.
For this case study hotel building, the operational energy benchmark (2.54 kWh for fuel and 1.46 kWh for electricity) for a good practice business/holiday hotel building type was used along with the actual hotel data of number of meals served.
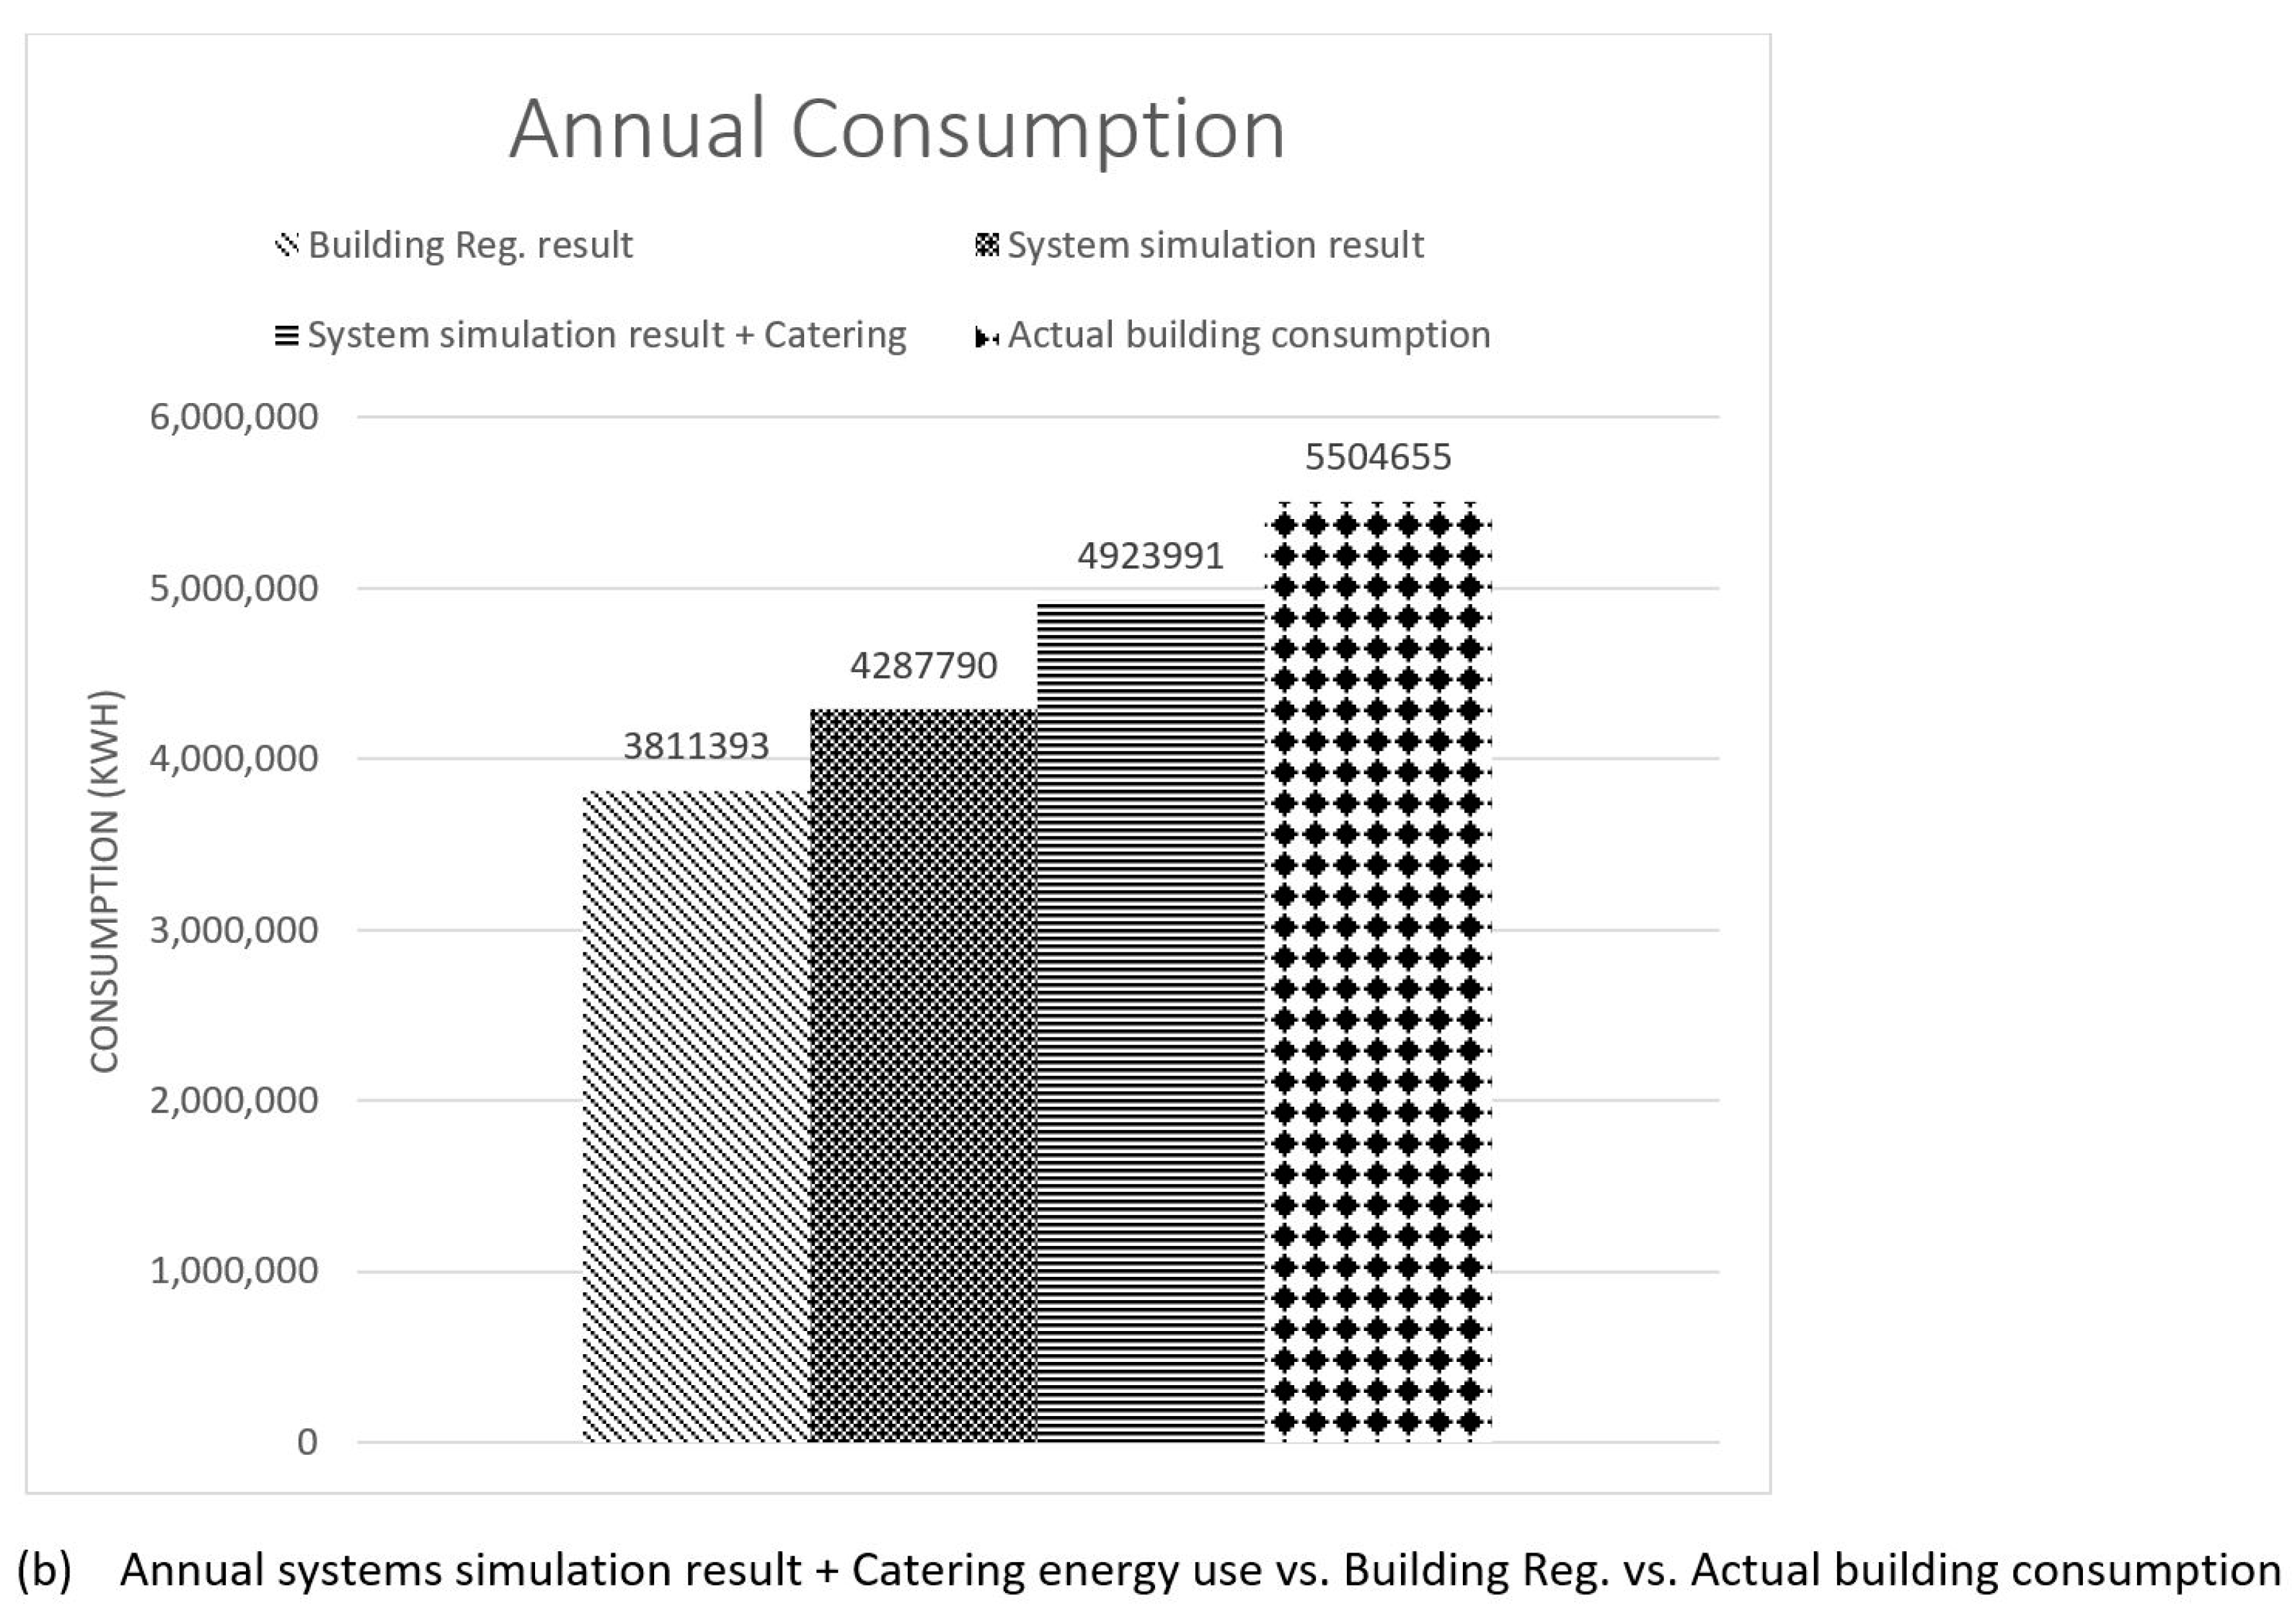
Figure 8 presents the results for systems simulation plus catering energy consumption estimates.
From
Figure 8a,b above, it can be seen that energy consumption results from the system simulation augumented with catering energy use gives an even better result compared to that obtained from the building compliance model and system simulation model. This is mainly because it accounts for unregulated energy use, such as catering, which is significant for hotel buildings.
Figure 8a shows that the energy consumption profile of the model matches closely with that of the actual building energy consumption profile, especially during the cooling season, but this does not appear to be so during heating season. This indicates that the majority of the error in the model estimate is related to heating energy use, with the actual building heating energy use being higher than the model’s result. This type of error cannot be totally eliminated, as models cannot be an exact representation of reality where the micro climatic condition is dynamic rather than the average single year TRY weather data used in energy simulation models, and other factors like occupancy/occupant behaviour are difficult to represent accurately. However, from
Figure 8b, it can be observed that the comparison of total annual consumption of the TAS systems + catering energy use model gives a significantly improved energy consumption estimate, even though it underestimates annual energy consumption by 12%.
Though the three models underestimate total energy consumption compared to the actual building data,
Figure 9a,b shows the major improvement in energy consumption estimates of the (Systems energy model and System simulation + catering energy use) from the Building Regulation compliance model when compared against the actual building data, with the (system simulation model) and (systems simulation + catering model) giving 11% and 23% improvement, respectively, from the building compliance model.
5. Conclusions
The work on the estimation and validation of energy consumption in a UK existing hotel building via a dynamic simulation model highlighted the known existence of performance gaps between estimated energy consumption and actual building energy consumption in commercial buildings. Also, since a considerable amount of studies were focused on improving the performance estimation in mostly office buildings, this paper presents a method of improving the estimation of actual energy consumption in an existing non-domestic structure using a hotel building as a case study.
The results of the case study hotel building shows that the use of energy models that are not strictly subjected to building regulations or NCM methodologies/databases and also accounts for some unregulated energy use such as catering which is significant in a hotel, can considerably improve actual building consumption estimates. For this case study building, an energy consumption estimate which is within 12% of the actual building consumption data was obtained. Moreover, the result also demonstrated that such a model can produce energy consumption estimates that are up to 23% more accurate than building regulation compliance models. The result of this study provides an indication of possible unregulated energy use that can be estimated to aid in the reduction of performance gaps for hotel buildings that have restaurants or high catering demands. However, the study is limited in its use of benchmark energy estimates to account for catering energy use and in the use of a single case study to validate performance gap reduction. Therefore, further studies should be done in other hotels in the region to validate the proposed model.
Recommendation
The encouraging results also demonstrate that even more accurate predictions can be obtained if more unregulated building energy uses such as lifts, small power loads and servers can be accounted for and factored into the model. Additionally, the results also demonstrate that designers that do not have access to actual building energy data for validation can produce improved energy performance estimates with greater confidence by using the suggested approach in this study, especially if more of the unregulated energy use consumption estimates are accounted for in the energy model. Possible limitations to using this approach by designers can be associated with the accuracy of input data and assumptions, for example, occupancy density, hours of occupancy and temperature set point, since design assumptions might differ from actual building usage.


 ,
, 


