Assessing Uncertainties of Well-To-Tank Greenhouse Gas Emissions from Hydrogen Supply Chains
by
 ,
,
Akito Ozawa
1 ,
,
Mai Inoue
2,
Naomi Kitagawa
1,
Ryoji Muramatsu
1,
Yurie Anzai
1,
Yutaka Genchi
1 and
Yuki Kudoh
1,* 1
Research Institute of Science for Safety and Sustainability, National Institute of Advanced Industrial Science and Technology (AIST), 16-1 Onogawa, Tsukuba, Ibaraki 305-8569, Japan
2
Leave a Nest Co., Ltd., Tokyo Head Office Institute of Innovation & Knowledge (I2K), 4F/5F Iidabashi-Miyuki Bldg 1-4 Shimomiyabi-cho, Shinjuku-ku, Tokyo 162-0822, Japan
*
Author to whom correspondence should be addressed.
Sustainability 2017, 9(7), 1101; https://doi.org/10.3390/su9071101
Submission received: 31 May 2017
/
Revised: 16 June 2017
/
Accepted: 21 June 2017
/
Published: 23 June 2017
(This article belongs to the Special Issue Hydrogen Economy: Technology and Social Issue)
Abstract
:Hydrogen is a promising energy carrier in the clean energy systems currently being developed. However, its effectiveness in mitigating greenhouse gas (GHG) emissions requires conducting a lifecycle analysis of the process by which hydrogen is produced and supplied. This study focuses on the hydrogen for the transport sector, in particular renewable hydrogen that is produced from wind- or solar PV-powered electrolysis. A life cycle inventory analysis is conducted to evaluate the Well-to-Tank (WtT) GHG emissions from various renewable hydrogen supply chains. The stages of the supply chains include hydrogen being produced overseas, converted into a transportable hydrogen carrier (liquid hydrogen or methylcyclohexane), imported to Japan by sea, distributed to hydrogen filling stations, restored from the hydrogen carrier to hydrogen and filled into fuel cell vehicles. For comparison, an analysis is also carried out with hydrogen produced by steam reforming of natural gas. Foreground data related to the hydrogen supply chains are collected by literature surveys and the Japanese life cycle inventory database is used as the background data. The analysis results indicate that some of renewable hydrogen supply chains using liquid hydrogen exhibited significantly lower WtT GHG emissions than those of a supply chain of hydrogen produced by reforming of natural gas. A significant piece of the work is to consider the impacts of variations in the energy and material inputs by performing a probabilistic uncertainty analysis. This suggests that the production of renewable hydrogen, its liquefaction, the dehydrogenation of methylcyclohexane and the compression of hydrogen at the filling station are the GHG-intensive stages in the target supply chains.
1. Introduction
Hydrogen has been attracting attention as a clean energy source in part because of its flexibility as an energy carrier; it can be produced from a variety of industrial processes and consumed by a variety of end-users. For example, hydrogen can be produced from hydrocarbon feedstocks via chemical processes (e.g., steam reforming of natural gas (NG) and coal gasification), and by using electricity to power the electroylysis of water [1,2]. “Renewable hydrogen” is produced using renewable energy or electricity sources and can usually be expected to decrease the greenhouse gas (GHG) emissions associated with its use [3,4]. At the other end of the supply chain, hydrogen can be consumed by diverse end-use applications as it can be transformed into kinetic, electric and thermal energy [3,4]. In the transportation sector, for example, hydrogen fuel cell vehicles (FCVs) have received attention globally as one of the next-generation clean vehicles that major motor companies are developing and releasing in the passenger car market [5,6,7]. Other types of FCVs, such as forklifts [8,9,10] and buses [11,12,13], have also been commercialized. Regarding residential energy applications, micro fuel cell combined heat and power (FC-CHP) systems could decrease household energy use owing to their high gross energy efficiencies (the sum of power generation efficiency and heat production efficiency) [14]. Megawatt-class hydrogen energy systems have also been installed around the world in data centers, hotels and many other commercial facilities to combine distributed renewable energy resources—such as solar photovoltaics (PV) and wind turbines—and measures to ensure a stable energy supply—such as battery storage, and water electrolyzers, storage tanks and fuel cells for hydrogen production, storage and use, respectively [15,16,17,18]. In terms of power generation, a commercially operated 12 MW hydrogen turbine began operating in Italy in 2009 [19,20].
Given this flexibility, hydrogen is regarded as useful for increasing energy diversity and mitigating GHG emissions in Japan. To support future increases in its supply and demand, various technologies related to the production, transport and storage of hydrogen are being developed in Japan [21]. Liquid hydrogen (LH2) and methylcyclohexane (MCH) are promising hydrogen carriers that are suitable for long-term storage and long-distance transport owing to their relative ease of handling [22]. LH2 and MCH have therefore been considered for a private-sector-led national demonstration project focusing on an international hydrogen supply chain that transports hydrogen produced from renewable or excess energy to Japan [23,24,25].
In parallel with research and development (R&D) surrounding hydrogen technologies, designing the future hydrogen economy requires understanding the potential socio-economic and environmental properties of the hydrogen supply chain. A common approach to help decision makers with the design and development of products and processes is to evaluate their environmental influences throughout their life cycle [26]. Many studies have been published that report life cycle approaches to the hydrogen production process. For example, life cycle inventory (LCI) analyses have been published that calculate the life cycle GHG emissions for hydrogen produced from steam reforming of NG [27,28,29,30,31,32], coal gasification [29,31,32], and renewably powered electrolysis of water [30,31,32,33]. Specifically, Kato [34] took an economic approach and estimated the final cost in Japan of hydrogen produced in South Australia, Norway and the Middle East. Meanwhile, other studies have conducted life cycle sustainability assessments to simultaneously evaluate the economic, social and environmental impacts [35,36,37].
A number of LCI studies have also been published that compare the environmental benefits of using hydrogen instead of conventional energy sources. Examples of such comparative studies in the automotive sector using Well-to-Wheel (WtW) and Well-to-Tank (WtT) frameworks to estimate GHG emissions have been carried out for Japan, the US and Europe [38,39,40,41,42]. Regarding the use of hydrogen in local energy systems, Usui and Hondo [43] compared the life cycle CO2 emissions from electricity storage systems for distributed wind power, including hydrogen storage using LH2 and MCH that was then used in FC-CHP. Mori et al. [44] compared the life cycle environmental emissions from a renewable hydrogen-powered uninterruptible power system (UPS) and a UPS powered by an internal combustion engine. However, it should be noted that most of these LCI studies were conducted based on specific assumptions and the mere use or the combinations of the results in previous studies does not make sense due to the differences of methodologies, system boundaries and databases used in each analysis. These Japanese studies were also conducted under the energy supply and demand structure during the first decade of the 21st century. After the Great East Japan earthquake occurred in 2011, our energy supply structure has drastically changed so that the LCI results should be different if conducted under the current energy supply. As far as the authors recognize, the WtW study conducted by Mizuho Information & Research Institute [45] was the only study that assessed the life cycle GHG profiles of various hydrogen supply chain under the current energy supply but most of the data used for the assessment are not provided in their report. In the same manner as the EU’s CertifHy project [46], LCI analysis should be conducted to understand the environmental profile of the potential international hydrogen supply chain and extract the technical issues related to hydrogen carrier to make the supply chain low-carbon.
Using LCI analysis as a decision-making tool requires considering the range of possible consequences of a given technological pathway [47]. Once the pathway is identified, remaining uncertainty in the LCI is usually attributed to the use of inaccurate or unrepresentative data [48,49]. One method of mitigating these uncertainties is to conduct sensitivity analyses. The ISO 14044 guidelines suggest that sensitivity analyses should include a wide range of factors to determine the influence of variation in assumptions, methods and data [50]. An alternative option, uncertainty analysis, employs probabilistic simulations based on the Monte Carlo method to evaluate the combined influence of multiple uncertain factors on the results. Here, probability distributions are assumed for the system’s input parameters. Repeated calculations with different input values then yield a probability frequency distribution of total GHG emissions from the whole system [49]. The application of uncertainty analysis using Monte Carlo simulation and LCI has been demonstrated for WtW emissions [41].
As awareness of unintended and unwanted side-effects has increased, it has become common practice during the early stages of new technology development to carry out ex ante assessments of potential consequences that the widespread implementation of the new technologies may create [51,52]. Most components in the hydrogen supply chain are immature and still developing, which creates uncertainties regarding their real-world performance and could affect the supply chain’s total GHG emissions. These uncertainties have not be fully considered in previous Japanese WtW studies [38,39,40] and addressing this knowledge gap is a key focus of this study.
Foreground inventory data related to the hydrogen supply chains are collected by literature surveys, and the Japanese life cycle inventory database is used as the background data of the analysis. A probabilistic uncertainty analysis of the LCI results is then conducted and the results used to highlight GHG hotspots in the supply chain to promote a discussion of the technical opportunities available for reducing GHG emissions across the different supply chains.
2. Methods and Assumptions
2.1. Overview
Figure 1 shows the processes that are within the study’s system boundary. The renewable hydrogen supply chain comprises domestic and overseas stages. The overseas stages are: the generation of renewable power; the production of renewable hydrogen by water electrolysis; the production and storage of the hydrogen carrier (LH2 or MCH); and the ocean transport of the hydrogen carrier to Japan. The domestic stages comprise: the storage of the hydrogen carrier and its distribution to hydrogen filling stations by tank truck; the release of hydrogen from the energy carrier (restoration) followed by its compression; and finally the filling of FCVs with hydrogen. A reference supply chain of hydrogen produced domestically from the steam reforming of natural gas (NG) was also analyzed. This supply chain comprises: the overseas extraction and liquefaction of NG; the ocean transport of liquefied natural gas (LNG) to Japan; the production of hydrogen by steam reforming of NG which is obtained by LNG regasification; the compression and distribution of hydrogen as compressed gaseous hydrogen (CGH2) to hydrogen filling stations by tank truck; and finally the compression and filling of FCVs stages.
According to Kato [34], Australia and Norway both have the potential to supply large amounts of low-cost hydrogen using wind power. In Australia, solar PV is also a potential power source for hydrogen production and the feasibilities of exporting solar PV-generated hydrogen from Australia to Japan have been investigated [53,54]. For these reasons, Australia and Norway were chosen as the renewable hydrogen producing countries in this study. The one-way transport distance to Japan was set as 10,000 km from Australia and 20,000 km from Norway.
Table 1 shows the case settings configured for hydrogen from Australia. It was typically assumed that the electricity used in overseas processes other than hydrogen production was supplied using the country’s standard electricity grid (referred to as “base case” hereafter). Electricity from the Australian grid has a high GHG emissions intensity owing to the grid’s strong dependency on coal-fired power generation. Thus, the use of low-carbon electricity, as investigated in the “low-carbon case” where all electricity inputs were from the same low-carbon source, was investigated for its potential to significantly decrease GHG emissions from Australian renewable hydrogen supply chain.
Inventory data were collected from previous WtW and LCI studies on hydrogen supply chains. Where more than two process options were found (owing to differences in equipment specifications), the mean and standard deviation were also calculated. The Japanese Inventory Database for Environmental Analysis (IDEA) ver. 2.0 [55] was used as the background data.
2.2. GHG Emissions Calculation Using IDEA
GHG emissions were defined as the sum of the 100-year CO2-equivalent global warming potentials of emitted CO2, CH4, N2O, HFCs, PHCs and SF6 [56].
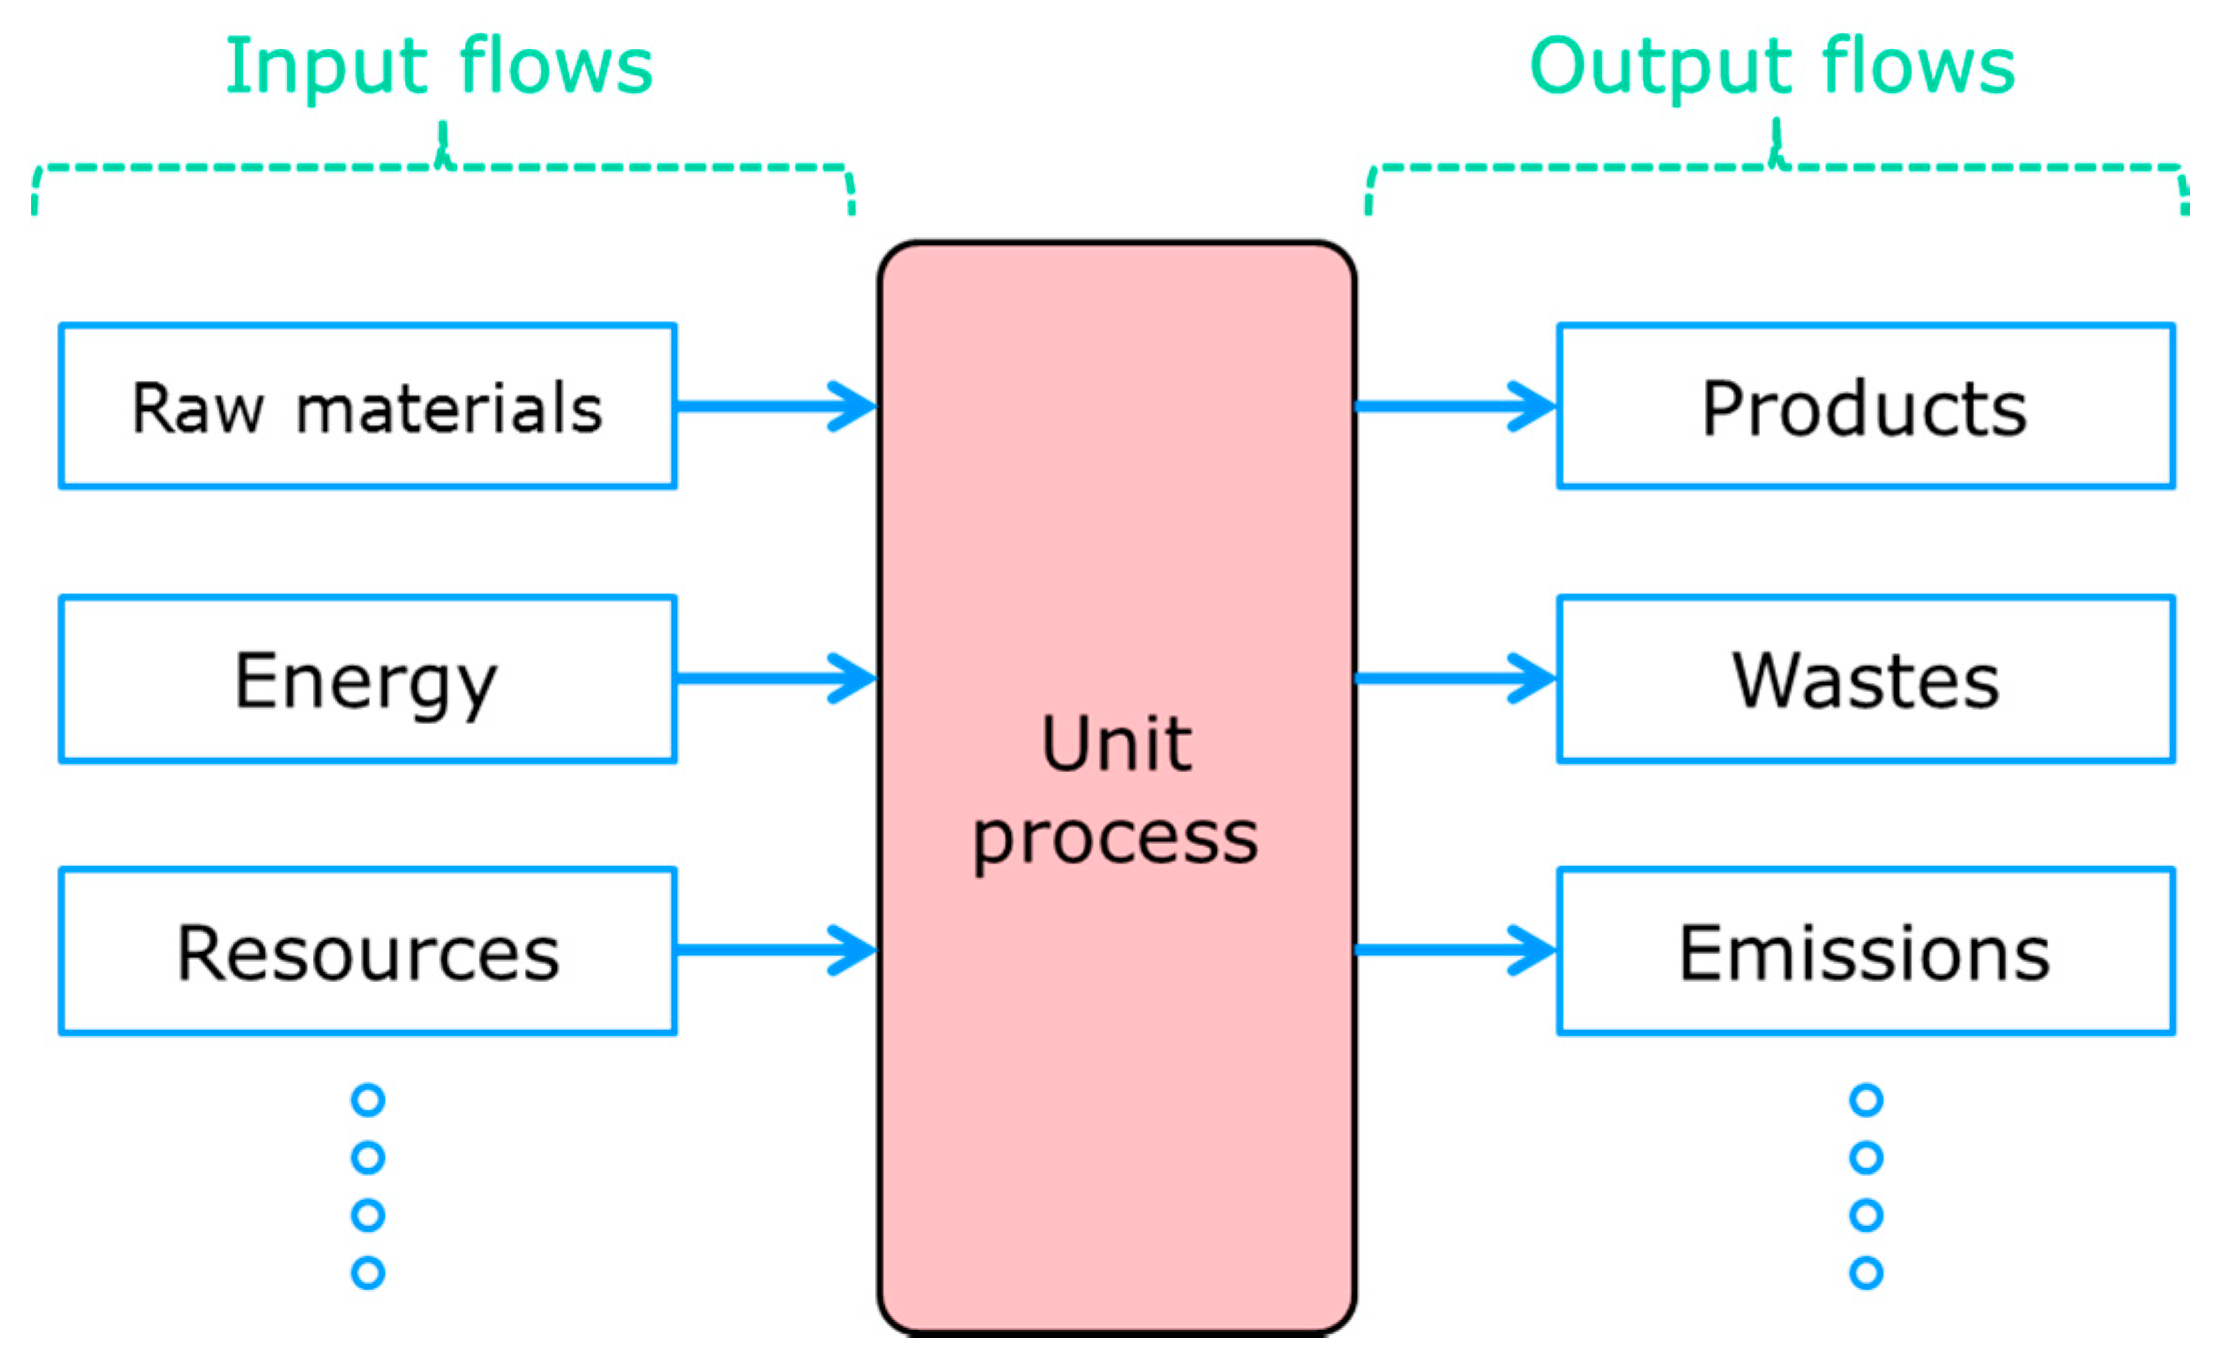
The IDEA inventory database was developed by National Institute of Advanced Industrial Science and Technology [55]. Figure 2 illustrates IDEA’s structure, which uses a unit process to relate input flows (raw materials, energies, and resources) to output flows (products, wastes, emissions to air, water and soil) [57].
The GHG emissions of a product were calculated using IDEA as follows. First, a matrix (the IDEA input coefficient table) was configured by tabulating the input flows. Each element of the table () represented the amount of product required to produce one unit of product . Letting and be the amount of production and final demand of product , respectively, the supply–demand balance for product could be expressed using Equation (1):
where .
Then, the amount of produced () was obtained using a matrix operation. Here, the inverse matrix was approximated by the sum of the power series, as shown in Equation (2):
where denotes the identity matrix.
By defining as the GHG emissions from the unit process for product , the embodied GHG emissions were then obtained from Equation (3):
where .
IDEA ver. 2.0, released in May 2016, includes inventory data of more than 3800 unit processes. Because it covers all of the items in the Japan Standard Commodity Classification, the GHG emissions of any product produced in Japan in the year 2014 are included in IDEA. However, IDEA’s embodied GHG emissions data are limited to Japanese economic activities and thus require assumptions to approximate the emissions attributed to Australian or Norwegian economic activity. For estimating overseas activity using IDEA, a new matrix was created and used in Equation (2) instead of was configured from the IDEA input coefficient table by employing the following steps:
- All of the elements of were set equal to those in . This assumed that the economic activity in Australia and Norway was the same as that in Japan. (For example, if the same product is produced in Japan and Australia, it requires the same inputs in both countries).
- The elements for oversea transport of resources were set to zero to ensure that the approximated emissions of a product did not include those generated by overseas transport of the constituent inputs.
- The elements referring to grid electricity in Japan were changed to reflect grid electricity in Australia or Norway.
2.3. Renewable Power Generation in Hydrogen-Producing Country
Renewable power plants (wind and solar PV in Australia, and wind in Norway) were assumed to provide dedicated power to parts of the hydrogen supply chains. This meant that the power plants’ life cycle GHG emissions (for example, those associated with materials production, construction, transport and operation) were then used whenever renewable electricity was consumed.
The input data used by Imamura et al. [58,59] were used to calculate life cycle GHG emissions using IDEA. The assumptions made by Imamura et al. [58,59] were to evaluate the Japanese renewable power plants. In order to reflect the wind conditions and insolation in hydrogen producing countries, the Australian and Norwegian load factors for wind and solar PV [34,60] were used in our calculation. Table 2 shows the specifications of wind and solar PV power plants assumed in this study while Table 3 shows the calculated life cycle GHG emissions of wind and solar PV power generation. The reason for the large difference in Australian and Norwegian wind power emissions could be attributed to the GHG emissions intensity divergence in grid electricity of the two countries.
2.4. Renewable Hydrogen Production by Water Electrolysis
Water electrolysis is a popular method of producing hydrogen which has been known for around 200 years [61]. Hydrogen was assumed to be produced using renewable power via electrolysis using either polymer electrolyte membranes or alkaline water. The mean electricity input was calculated as 5.19 kWh/Nm3-H2 [62,63,64,65,66,67,68,69,70,71,72,73,74]. The pure water requirement was set to the theoretical value of 0.804 kg/Nm3-H2.
2.5. Hydrogen Energy Carriers
2.5.1. Liquid Hydrogen (LH2)
Hydrogen liquefaction has long been the preferred method of increasing hydrogen density for transport as the liquid has approximately one eight-hundredth of the volume of gaseous hydrogen [22]. This preference is despite hydrogen having the second lowest boiling point (−253 °C) after helium and the large amount of electricity that the process requires. Figure 3 shows the renewable hydrogen supply chain using LH2 that was modeled in this study. Assumptions for each of the supply chain components are described below.
● LH2 production
LH2 was produced by cooling gaseous hydrogen. The mean electricity input for LH2 production was calculated as 0.906 kWh/Nm3-H2 [65,66,75,76,77,78].
● LH2 storage at loading port
LH2 was stored in stationary insulation tanks at a loading port. It was assumed that the boil-off of hydrogen gas during this stage was subsequently re-liquefied. The electricity input for LH2 storage at the loading port was set to 0.055 kWh/Nm3-H2 [39].
● LH2 ocean transport by tanker
A LH2 tanker (160,000 m3 tank capacity, 16 knots sailing speed) [66] was assumed for transport of LH2 to Japan. However, because LH2 tankers are still being developed, exact data were not available. Thus, the emissions data were estimated using data for LNG tankers in IDEA under the assumption that the GHG emissions of a LH2 tanker per transport volume of LH2 expressed in ton-kilometer unit were equal to those for a LNG tanker per ton-kilometer of LNG. The emissions from laden and ballast voyages were both included in the estimation. The mean boil-off rate of LH2 during the voyage was calculated as 0.3%/day [65,66].
● LH2 storage at unloading port
LH2 was assumed to be transferred from the tanker to stationary tanks at an unloading port. It was assumed that the gas resulting from hydrogen boil-off was subsequently re-liquefied. The electricity input for LH2 storage at the unloading port was set to 0.055 kWh/Nm3-H2 [39].
● Domestic distribution of LH2 by tank truck
LH2 tank trucks (23 kL tank capacity, 3.5 km/L-diesel oil fuel economy) [45,79] were assumed to be responsible for the domestic distribution from the LH2 storage terminal to the hydrogen filling stations. The one-way distance was set to 50 km [66], and both the emissions by the laden and empty journeys were included to the inventory.
● LH2 storage at hydrogen filling stations
LH2 was assumed to be transferred from tank trucks to stationary tanks at hydrogen filling stations. The electricity input required for LH2 storage at a filling station was set to 0.055 kWh/Nm3-H2 [39].
2.5.2. Methylcyclohexane (MCH)
MCH (CH3C6H11) is another promising hydrogen carrier. It is produced by the hydrogenation of toluene (TOL; CH3C6H5) and releases hydrogen via catalytic dehydrogenation:
MCH was first proposed as a hydrogen storage system for use as a vehicle fuel in 1980 [80] under what is now known as the methylcyclohexane-toluene-hydrogen (MTH) system [81,82]. After hydrogenation of TOL at the hydrogen supply site, MCH is transported by tanker and dehydrogenated at the demand site to yield H2 and the original TOL, which is then returned to the supply site and reused [83]. The dehydrogenation of MCH to TOL is important to the process owing to its large endothermic heat of reaction (205 kJ/mol-MCH = 68.3 kJ/mol-H2) [84]. A number of catalysts, including those that are platinum [85,86,87,88], palladium [88,89,90] and nickel [91,92] based, have been investigated for their ability to facilitate an efficient dehydrogenation of MCH. Figure 4 shows the renewable hydrogen supply chain using MCH that was assumed in this study.
● MCH production
MCH was produced by the chemical reaction between TOL and hydrogen. The reaction yield of hydrogen addition to TOL and the hydrogen consumption rate were set to 99.8% and 97.9%, respectively [65]. The mean electricity input for MCH production was calculated as 40.68 kWh/t-MCH [65,66,93].
● MCH storage at loading port
MCH was assumed to be stored in cone roof tanks at an overseas loading port. The mean electricity input for MCH storage at the loading port was calculated as 0.915 kWh/t-MCH [65,66].
● MCH ocean transport by tanker
A chemical tanker was assumed to be used for the ocean transport of MCH to Japan. The associated GHG emissions were calculated using IDEA’s emissions data for a chemical tanker.
● MCH storage at unloading port
MCH was assumed to be transferred from the chemical tanker to cone roof tanks at a domestic unloading port. The electricity input for MCH storage at the unloading port was assumed to be the same as that required for storage at the loading port.
● Domestic distribution of MCH/TOL by tank trucks
Tank trucks (20 kL tank capacity, 2.34 km/L-diesel oil fuel economy) [45,79] were assumed to be used for the domestic distribution of MCH to and TOL from the hydrogen filling stations. The one-way distance was set as 50 km [66], and both the emissions associated with the MCH- and TOL-laden trucks were included in the inventory.
● Dehydrogenation of MCH at hydrogen filling stations
At the hydrogen filling stations, MCH was assumed to be converted to hydrogen and TOL by the dehydrogenization reaction. The conversion rate, selectivity and hydrogen yield of the reaction were set to 95.0%, 99.9% and 90.0%, respectively [65]. It was assumed that heat required by the dehydrogenization was supplied by combustion of city gas. The mean electricity input for MCH dehydrogenization was calculated as 0.310 kWh/Nm3-H2 [65,66,93].
● TOL storage at loading port
TOL was assumed to be stored in cone roof tanks at a domestic loading port. The mean electricity input for TOL storage at the loading port was calculated as 0.915 kWh/t-TOL [65,66].
● TOL ocean transport by tanker
A chemical tanker was assumed for transport of TOL from Japan. The associated GHG emissions were calculated using IDEA’s emissions data for a chemical tanker.
● TOL storage at unloading port
TOL was assumed to be transferred from the chemical tanker to cone roof tanks at a domestic unloading port. The electricity input for TOL storage at the unloading port was assumed to be the same as the input at the loading port.
● TOL replacement
Owing to unwanted side chemical reactions (including demethylation, isomerization, cycloreversion and dimerization) that also occur during the hydrogenation and dehydrogenation stages, a portion of the TOL must be replaced with virgin TOL to maintain the MTH cycle efficiency [94]. It was assumed that 3% of the initial TOL-loading was replaced every year.
2.6. Supply Chain for Hydrogen Produced by Natural Gas (NG) Reforming
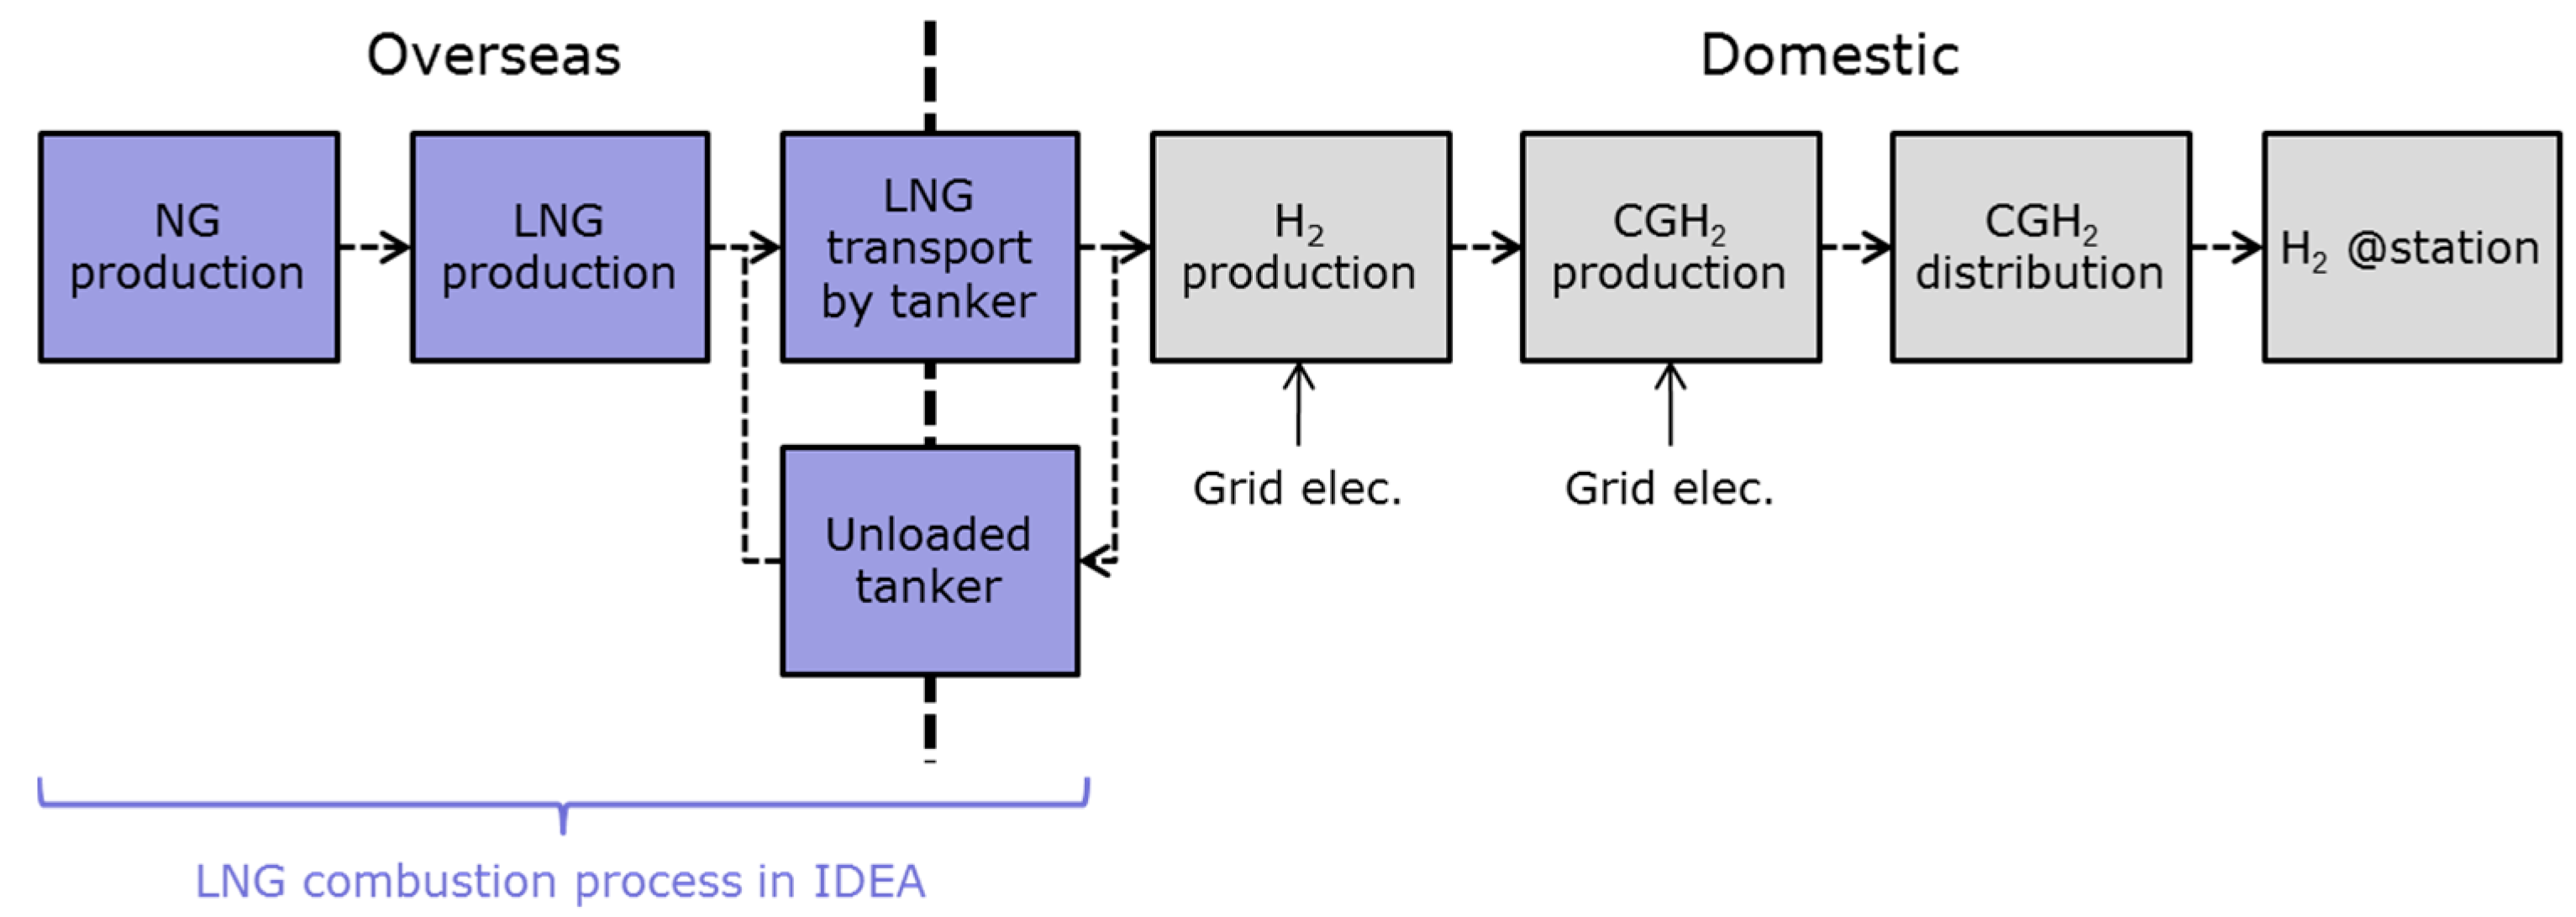
Figure 5 shows the supply chain for hydrogen produced by NG reforming assumed in this study. IDEA’s GHG emissions associated with the combustion of LNG were used to calculate the emissions associated with the production of NG, its compression to produce LNG and LNG transport by tanker to Japan. Other stages in the supply chain are described below.
● Hydrogen production via steam reforming of NG
Gaseous hydrogen was assumed to be produced in Japan by reforming NG derived from imported LNG. The mean NG and electricity inputs were calculated as 15.04 MJ(LHV)/Nm3-H2 and 0.211 kWh/Nm3-H2, respectively [38,39,95,96,97]. The process water requirement was set to 1.964 × 10⁻³ m3/Nm3-H2 [68,97].
● Hydrogen compression at production plant
The produced hydrogen was assumed to be compressed to 20 MPa and loaded into gas tank trucks for distribution. The electricity input for the compression stage at the production plant was set to 0.272 kWh/Nm3-H2 [39].
● Domestic distribution of CGH2 by tank trucks
Gas tank trucks were assumed to carry out the domestic distribution of CGH2. The mean tank capacity and fuel economy of the trucks were calculated as 2330 Nm3-H2 and 2.75 km/L-diesel oil, respectively [40,98]. The one-way distance was set to 50 km [66], and both the emissions associated with laden and empty trucks were included to the inventory.
2.7. Hydrogen Compression and Filling of FCVs at Hydrogen Filling Stations
At the hydrogen filling stations, hydrogen was assumed to be compressed to a pressure of 70 MPa before the FCVs were filled. The electricity consumption for the compression and filling activities were set to 0.282 kWh/Nm3-H2 and 0.093 kWh/Nm3-H2, respectively [39].
2.8. Uncertainty Analysis
A range of parameters (listed in Table A1) were considered as part of the uncertainty analysis carried out on the WtT GHG emissions resulting from the various hydrogen supply chains. To determine the probability distribution for each parameter, the WtW analysis methodology adopted by General Motors et al. [95] was applied. Most parameters were assumed to follow a normal distribution curve according to the mean and standard deviation values presented in Table A1. Based on the literature values for inventory data quality, the standard deviation of GHG emissions attributed to renewable power generation was assumed to be 10% of the mean value [99,100].
As for MCH production, hydrogen production by NG steam reforming and hydrogen compression at the NG steam reforming plant, electricity input might show negative if a normal distribution was assumed for the parameters. Hence, in these processes triangle distribution functions using the mean, minimum and maximum data in the inventory were assumed instead of a normal distribution.
3. Results and Discussion
3.1. WtT GHG Emissions for Hydrogen Carriers
3.1.1. Liquid Hydrogen (LH2)
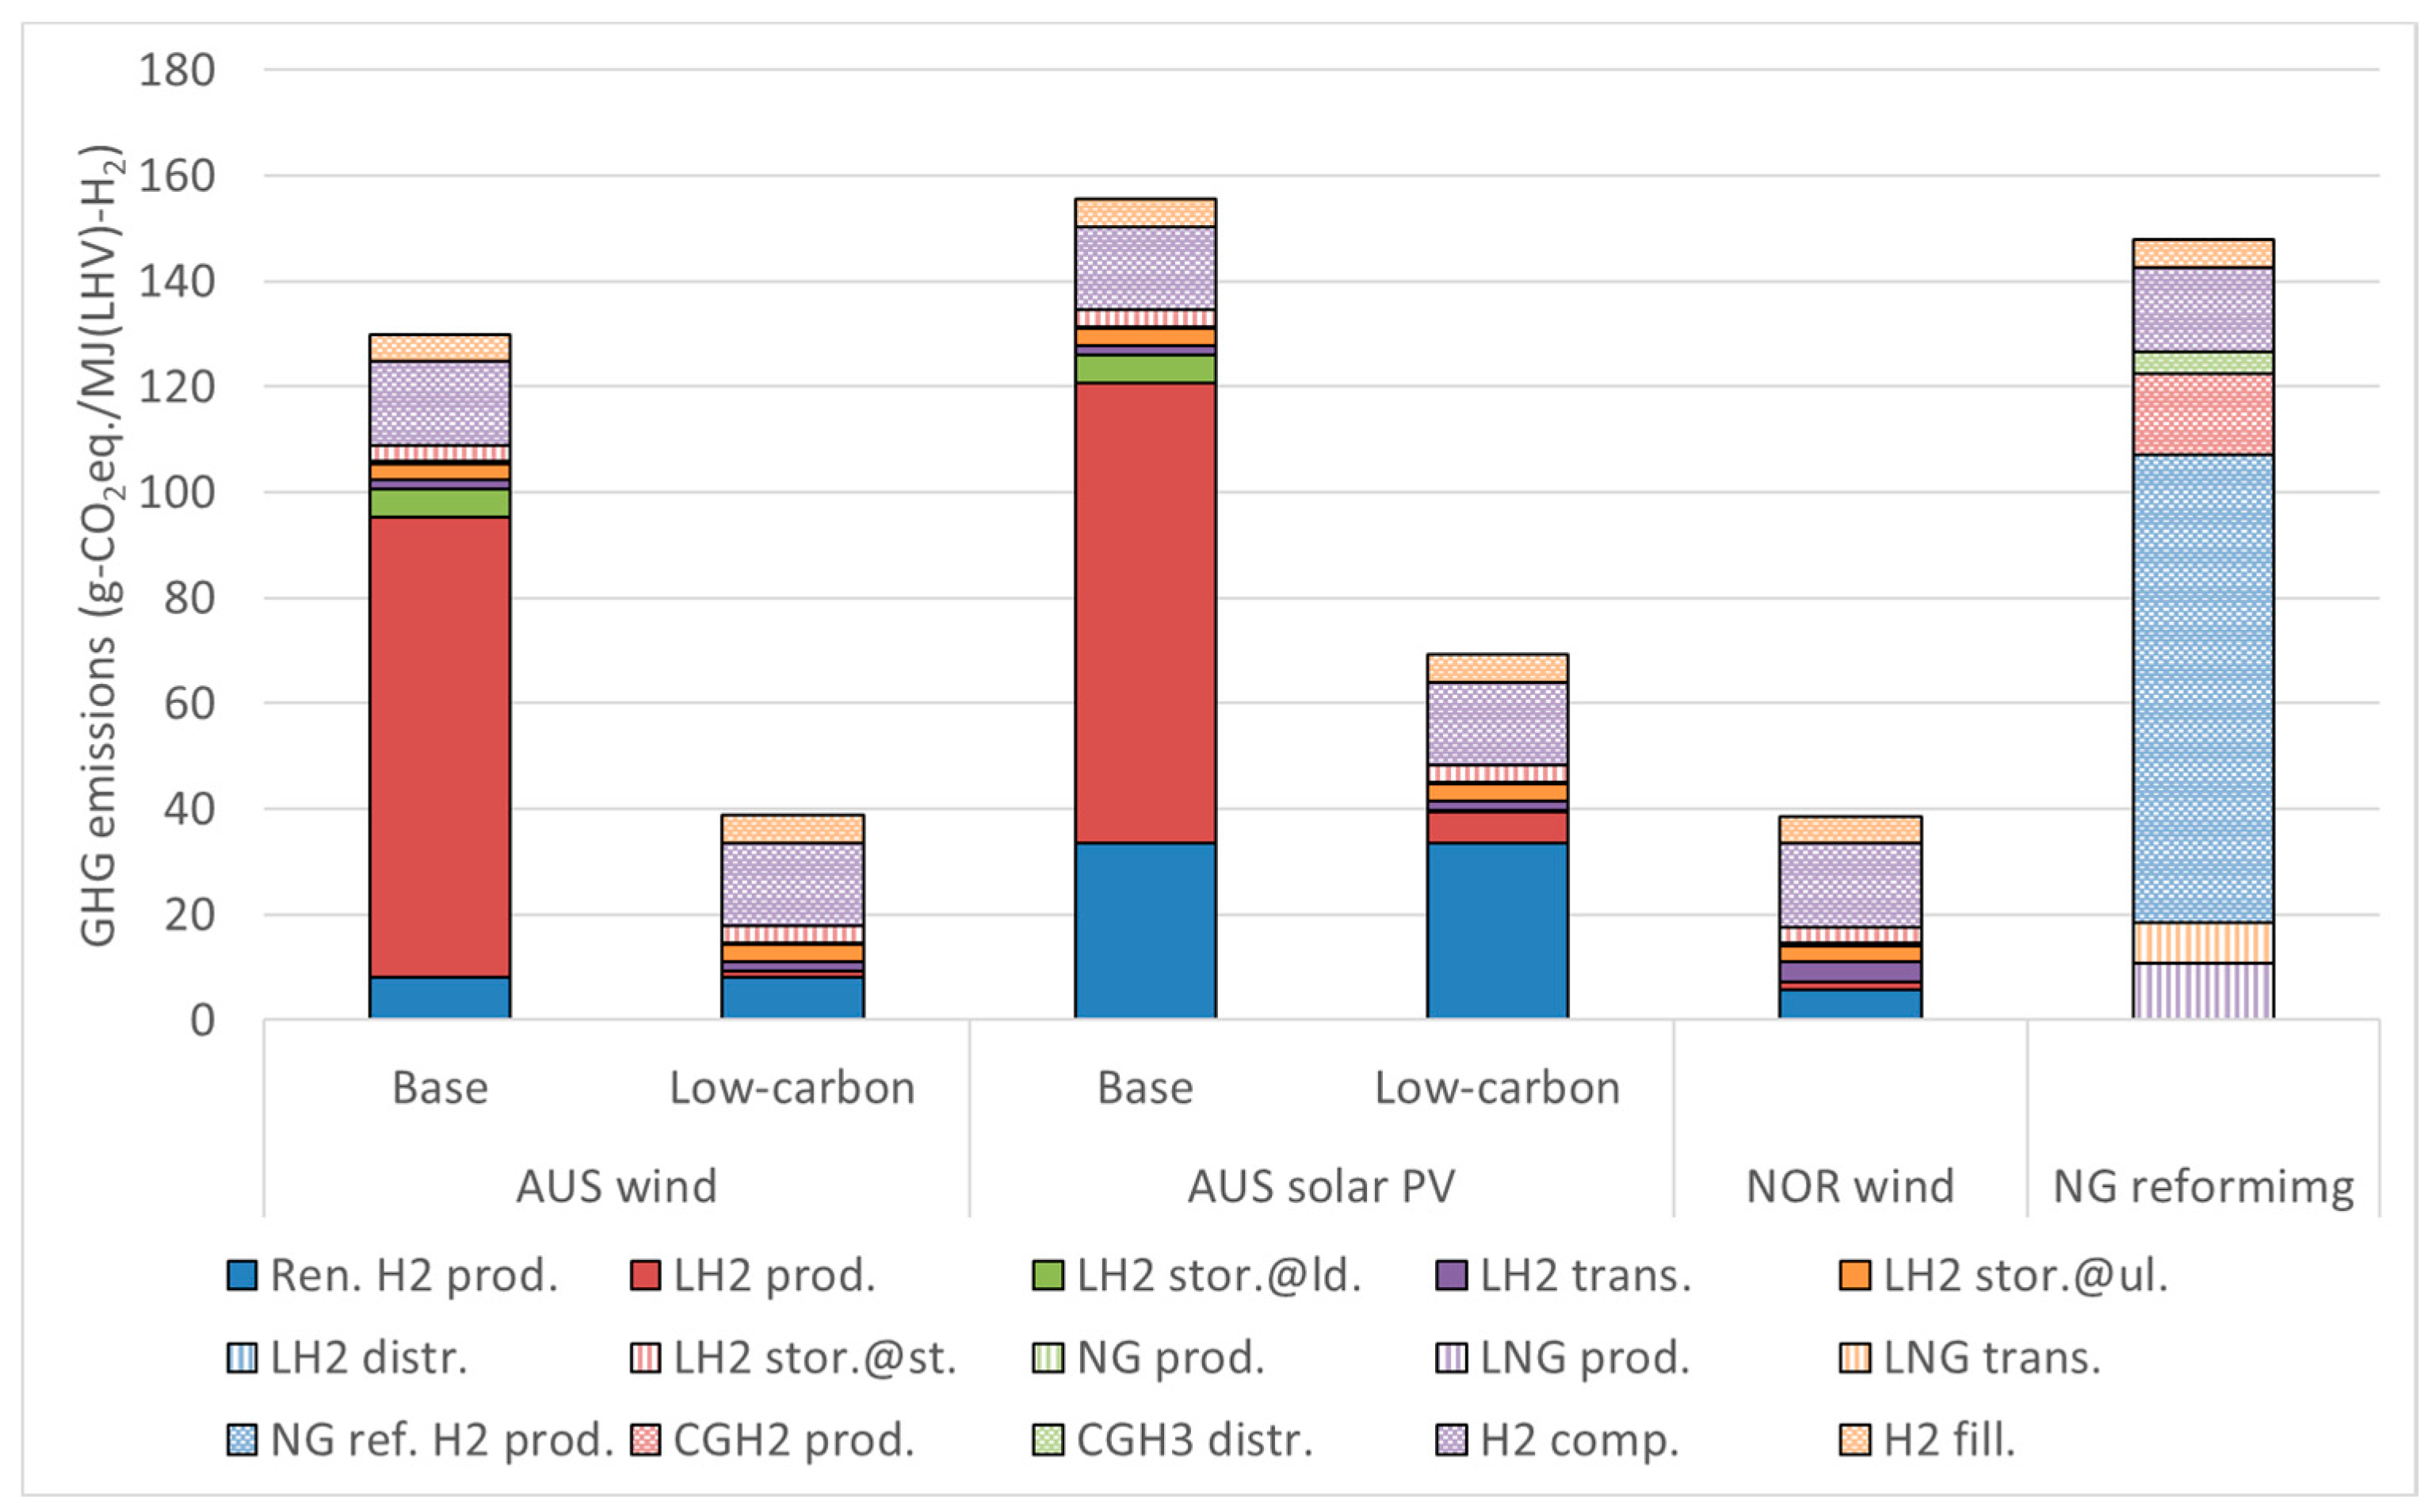
Figure 6 shows the mean WtT GHG emissions from the renewable hydrogen supply chains using LH2. The emissions from the NG reforming hydrogen supply chain are also shown for reference. Except for the Australian solar PV base case, all supply chains that combined LH2 with renewable power-produced hydrogen showed lower GHG emissions than those from reforming of NG.
In the Australian base cases, cooling hydrogen to produce LH2 was responsible for the largest portion of GHG emissions, accounting for 67% and 56% of the total for the wind and solar PV supply chains, respectively. This is explained by considering the large electricity consumption of the hydrogen liquefaction process owing to hydrogen’s very low boiling point (−253 °C). Possible options for decreasing electricity consumption include improving process efficiency by implementing new liquefiers [103,104] or combining the liquefaction with a LNG re-gasification process [105]. Alongside decreasing the electricity requirement, the associated GHG emissions could be decreased by employing a low-carbon power source: using wind and solar PV power in Australia rather than grid electricity decreased the total GHG emissions by 70% and 55%, respectively.
Other GHG hotspots of the LH2 supply chain were the original hydrogen production step and hydrogen compression at domestic filling stations. Continued R&D for technologies related to the components in water electrolysis—such as electrodes, electrolytes and membranes—is important in further decreasing the carbon-intensity of renewable hydrogen production [106,107]. Meanwhile, employing domestic renewable energy sources to power the hydrogen compression process at the filling stations could decrease GHG emissions from this stage.
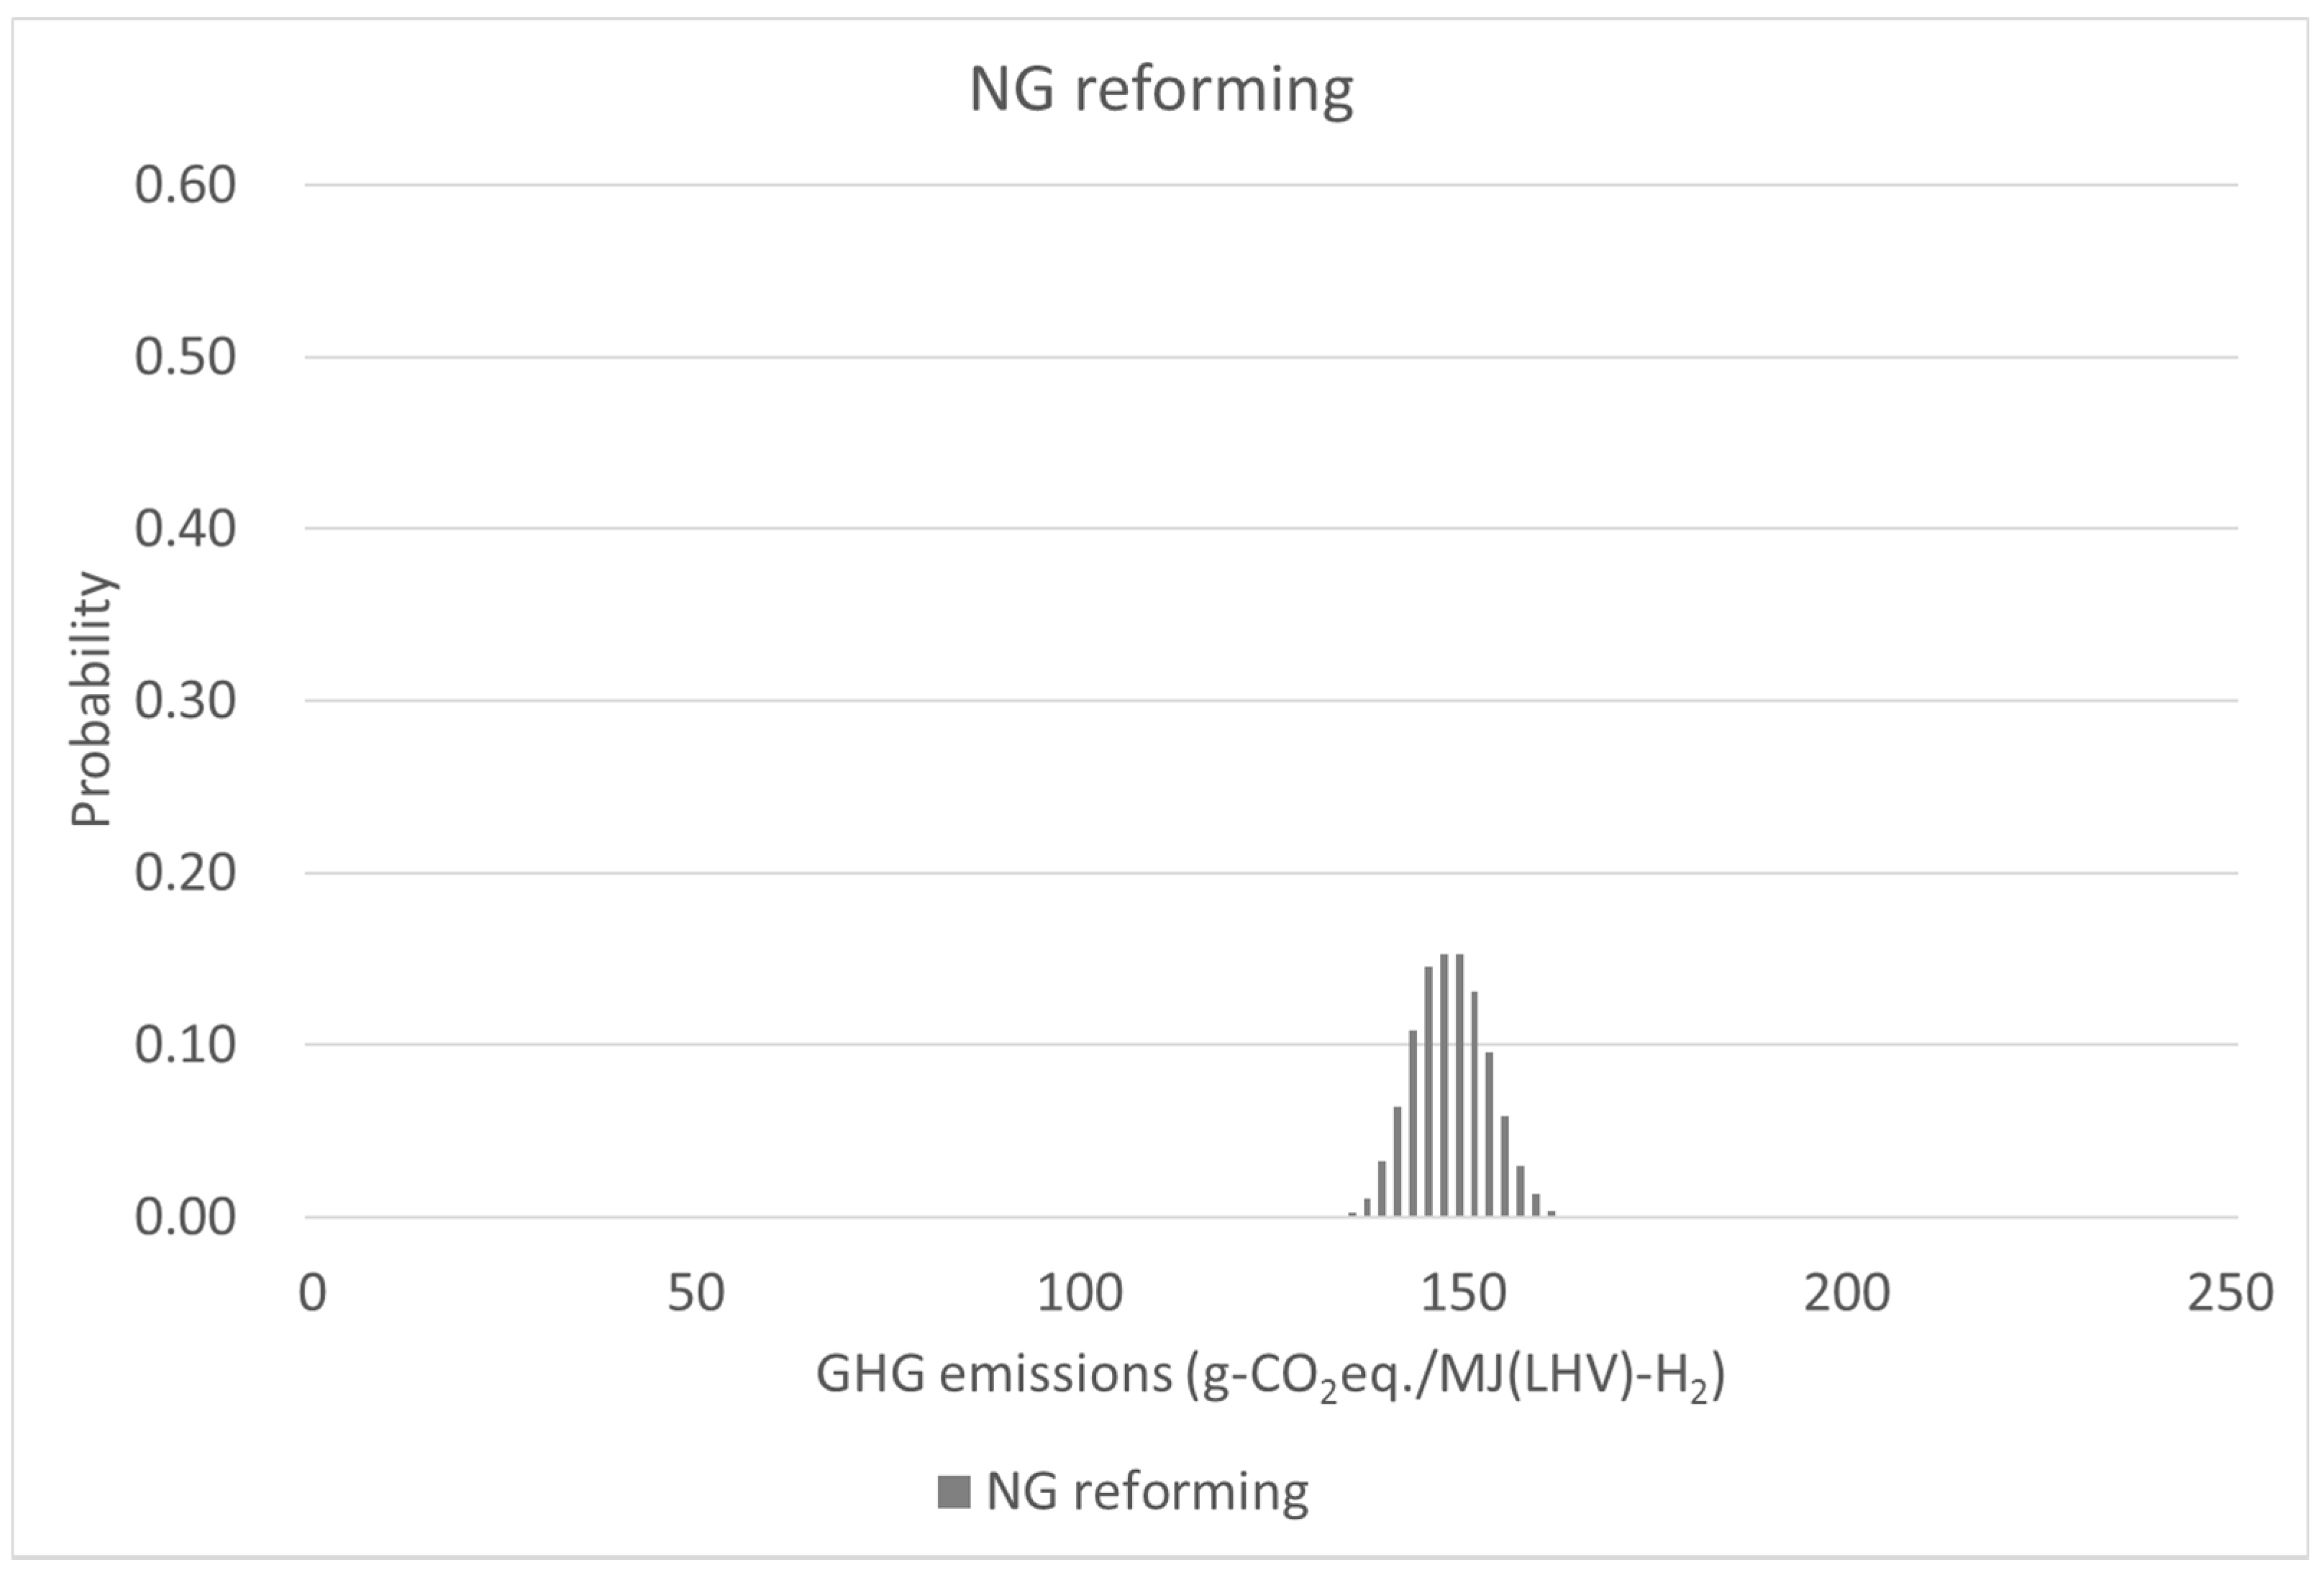
Regarding the NG reforming hydrogen supply chain, hydrogen production via steam reforming of NG was the most GHG-intensive process which account for 60% of the total GHG emissions.
3.1.2. Methylcyclohexane (MCH)
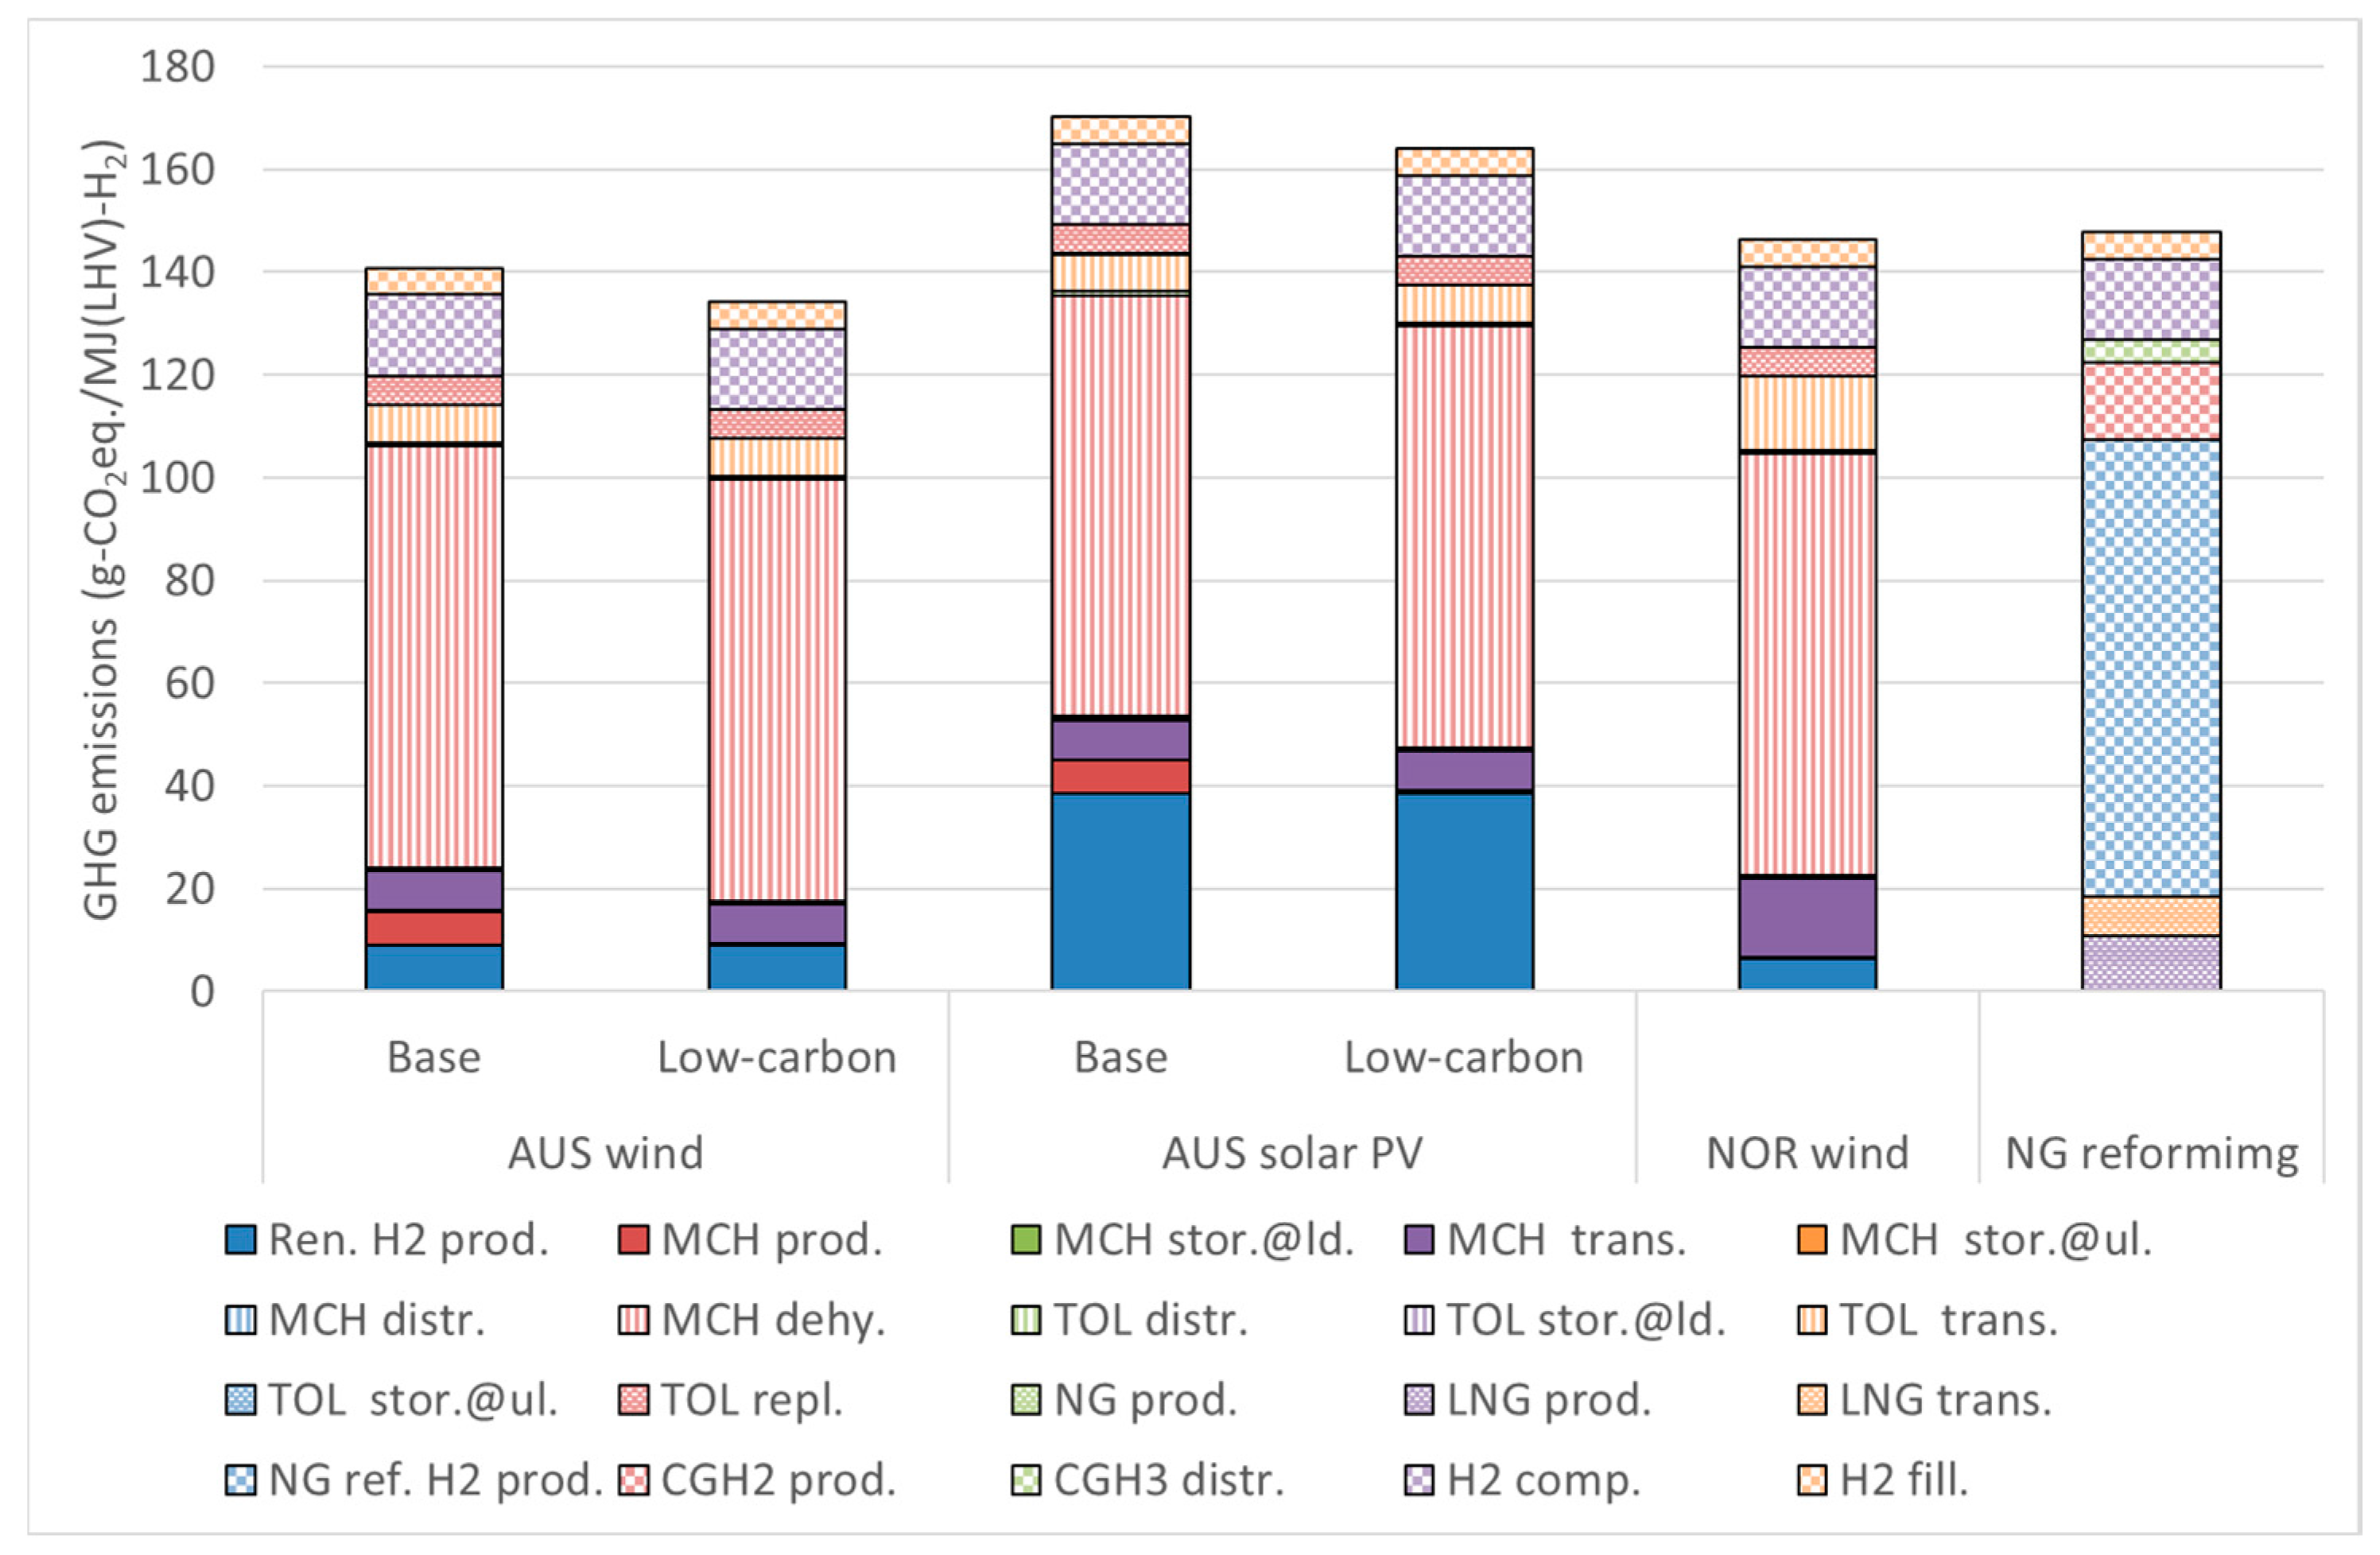
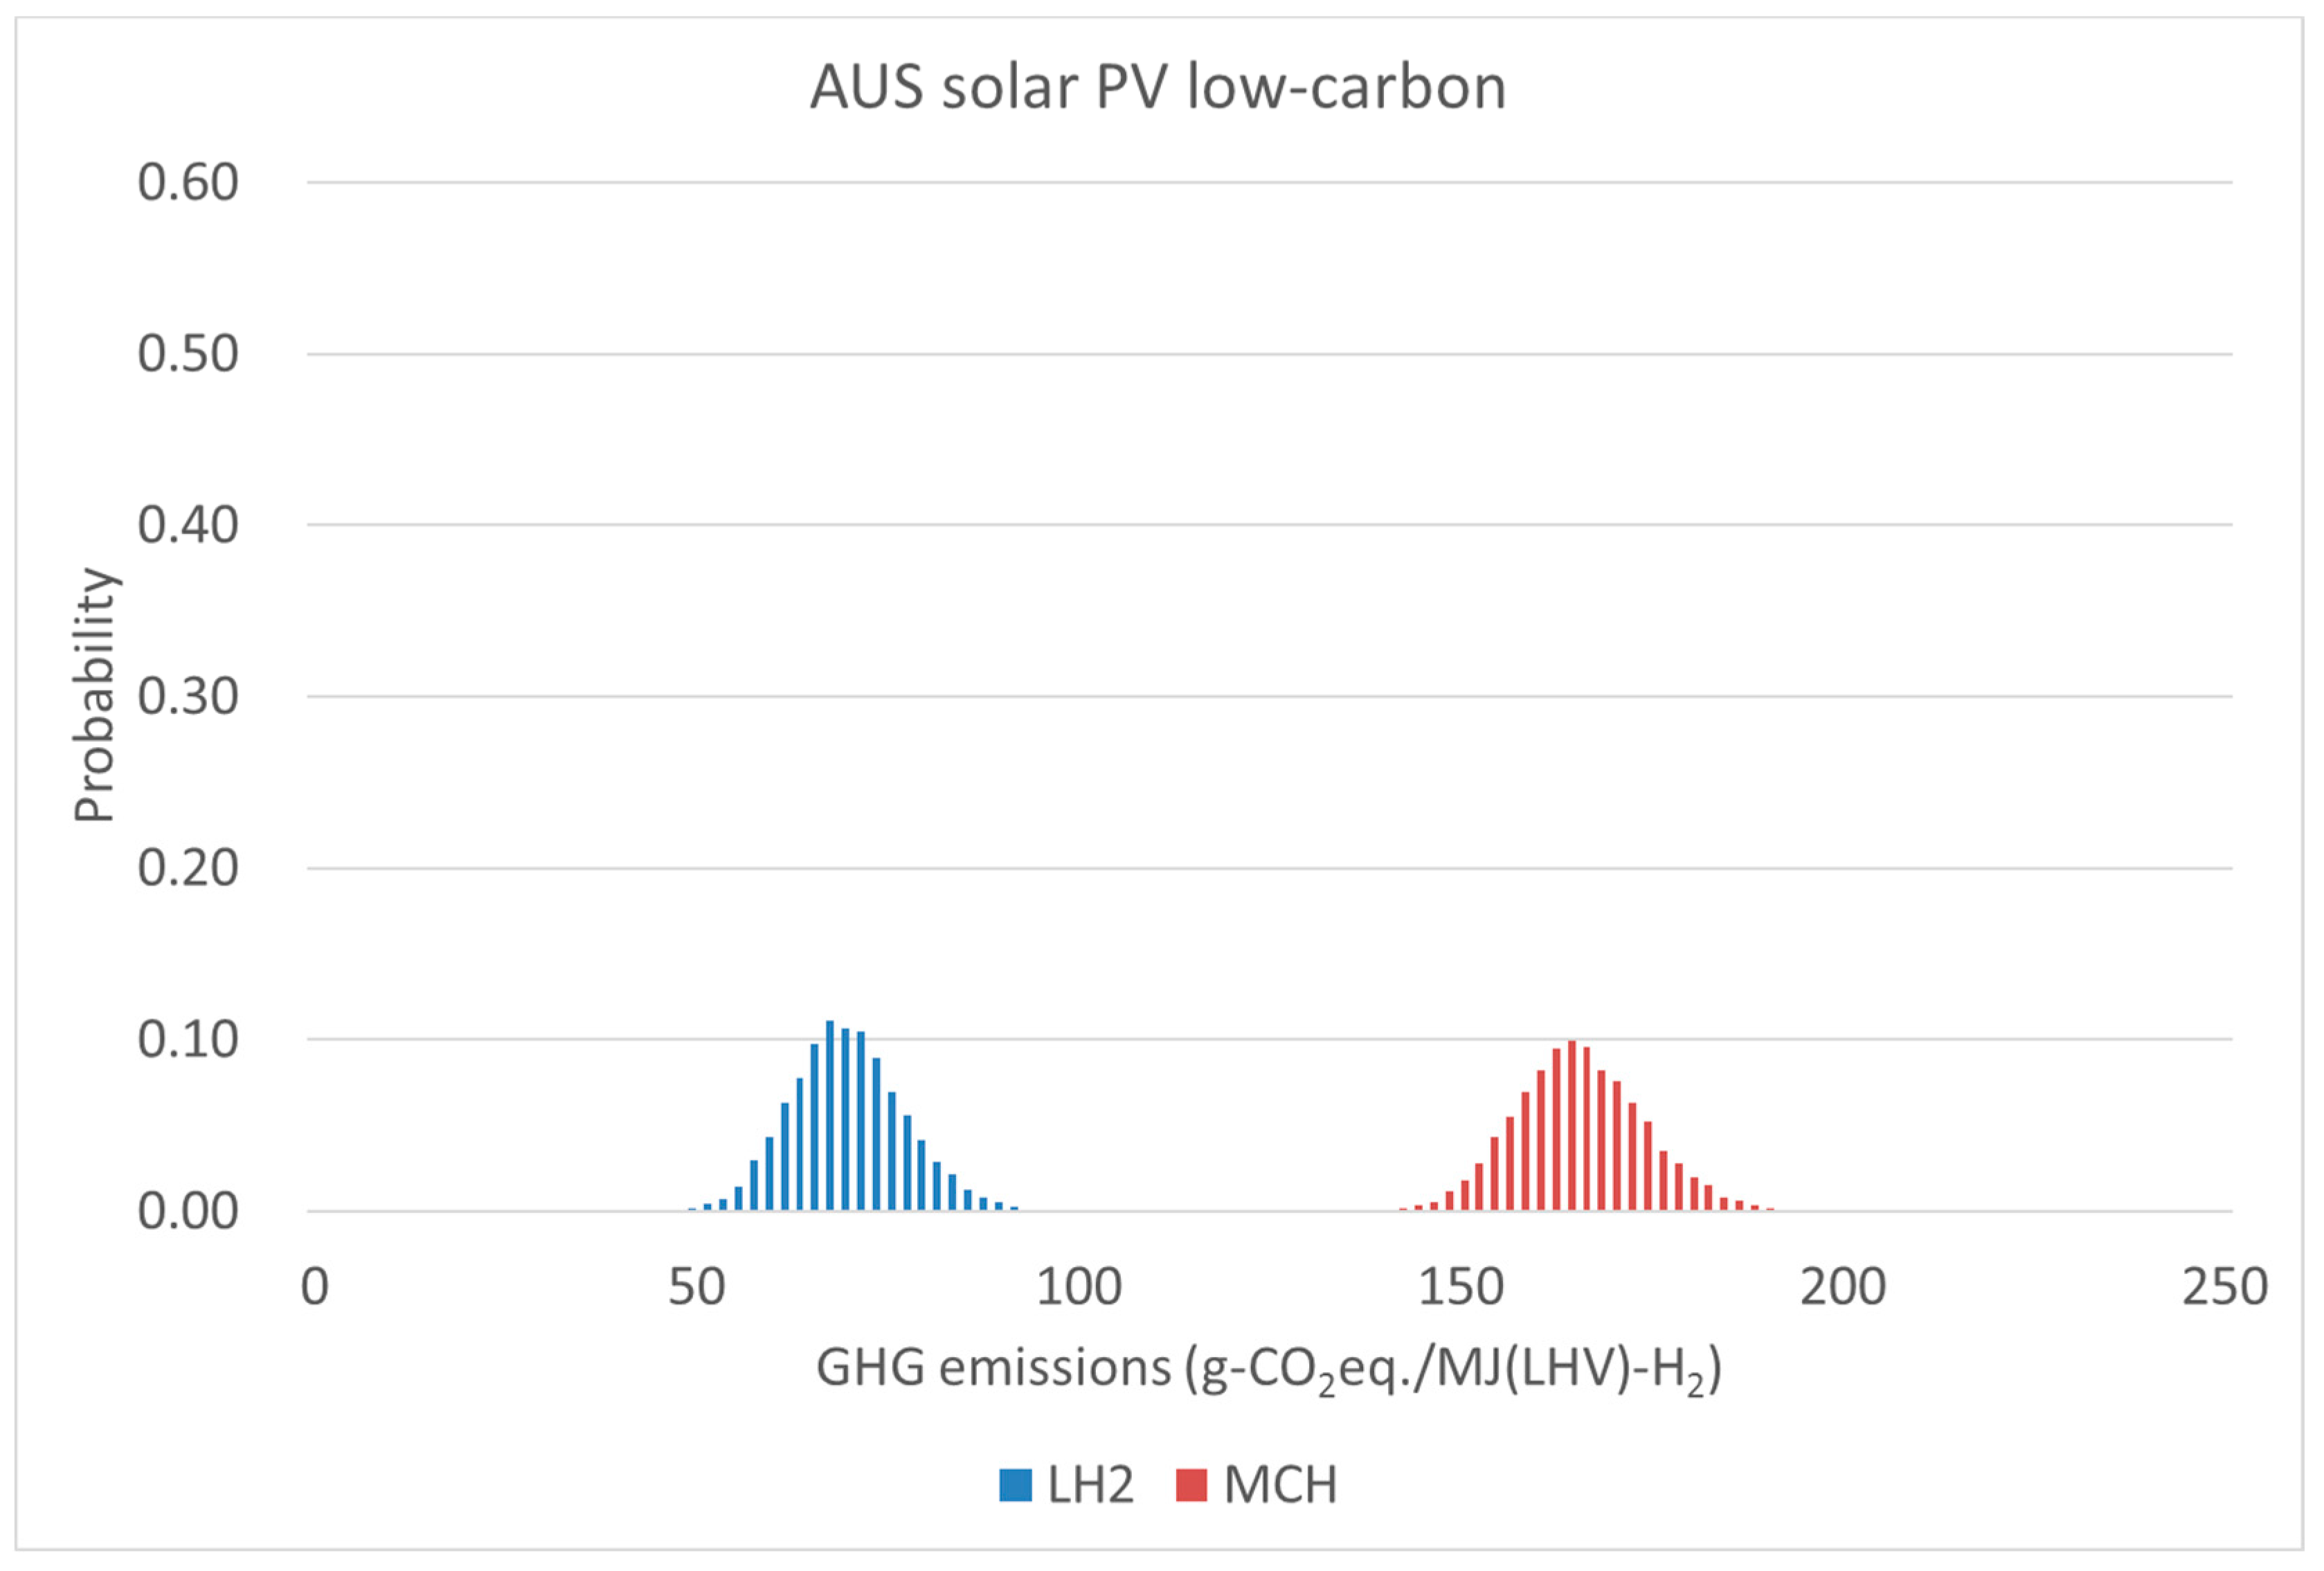
Figure 7 shows the mean WtT GHG emissions from the renewable hydrogen supply chains that used MCH as the hydrogen carrier. The associated emissions for hydrogen produced by NG reforming are again also shown for reference. All of the WtT GHG emissions presented lie in the range 130–170 g-CO2eq./MJ(LHV)-H2 which indicates that the GHG emissions were relatively insensitive to both where the hydrogen was produced and the renewable power technology employed. Unlike the large decreases observed for hydrogen supplied using LH2, the WtT GHG emissions for the low-carbon cases for Australian wind and solar PV power were only 5% and 4%, respectively, lower than the emissions in the base case.
For all cases, the dehydrogenation of MCH at the hydrogen filling stations was responsible for the largest portion—approximately half—of the total GHG emissions. Because the dehydrogenation of MCH is considerably endothermic—and therefore energy-intensive—the energy source and process efficiency for this step have a large influence on the supply chain’s overall life cycle emissions. Given that it was assumed that the heat required for the dehydrogenation was obtained by the combustion of city gas, this stage’s GHG emissions could be decreased by using waste heat from nearby plants. For example, if all of this heat could be supplied from waste sources, the total emissions for the Australian base cases for wind and solar PV power could be 58 and 48%, respectively, lower than when burning city gas. Notably, Cresswell and Metcalfe demonstrated a MCH dehydrogenation system in which the reaction heat was supplied by waste heat from a solid oxide fuel cell [108]. R&D that focuses on improving the dehydrogenation catalysts is also important for advancing the process efficiency [109,110]. In this manner, catalysts that facilitate the dehydration using low-quality waste heat have been reported by Chaouki and Klvana [111] and Hodoshima et al. [112].
As with the LH2 process, the GHG emissions attributed to the initial production of renewable hydrogen and the compression of hydrogen at filling stations were also found to have a moderate impact on the total. Finally, the two-way long-distance ocean transport (of MTH and TOL) was particularly notable in the Norwegian case where the combined emissions attributed to ocean transport of MTH and TOL accounted for 20% of the total WtT GHG emissions.
3.2. WtT GHG Emissions Based on Uncertainty Analysis
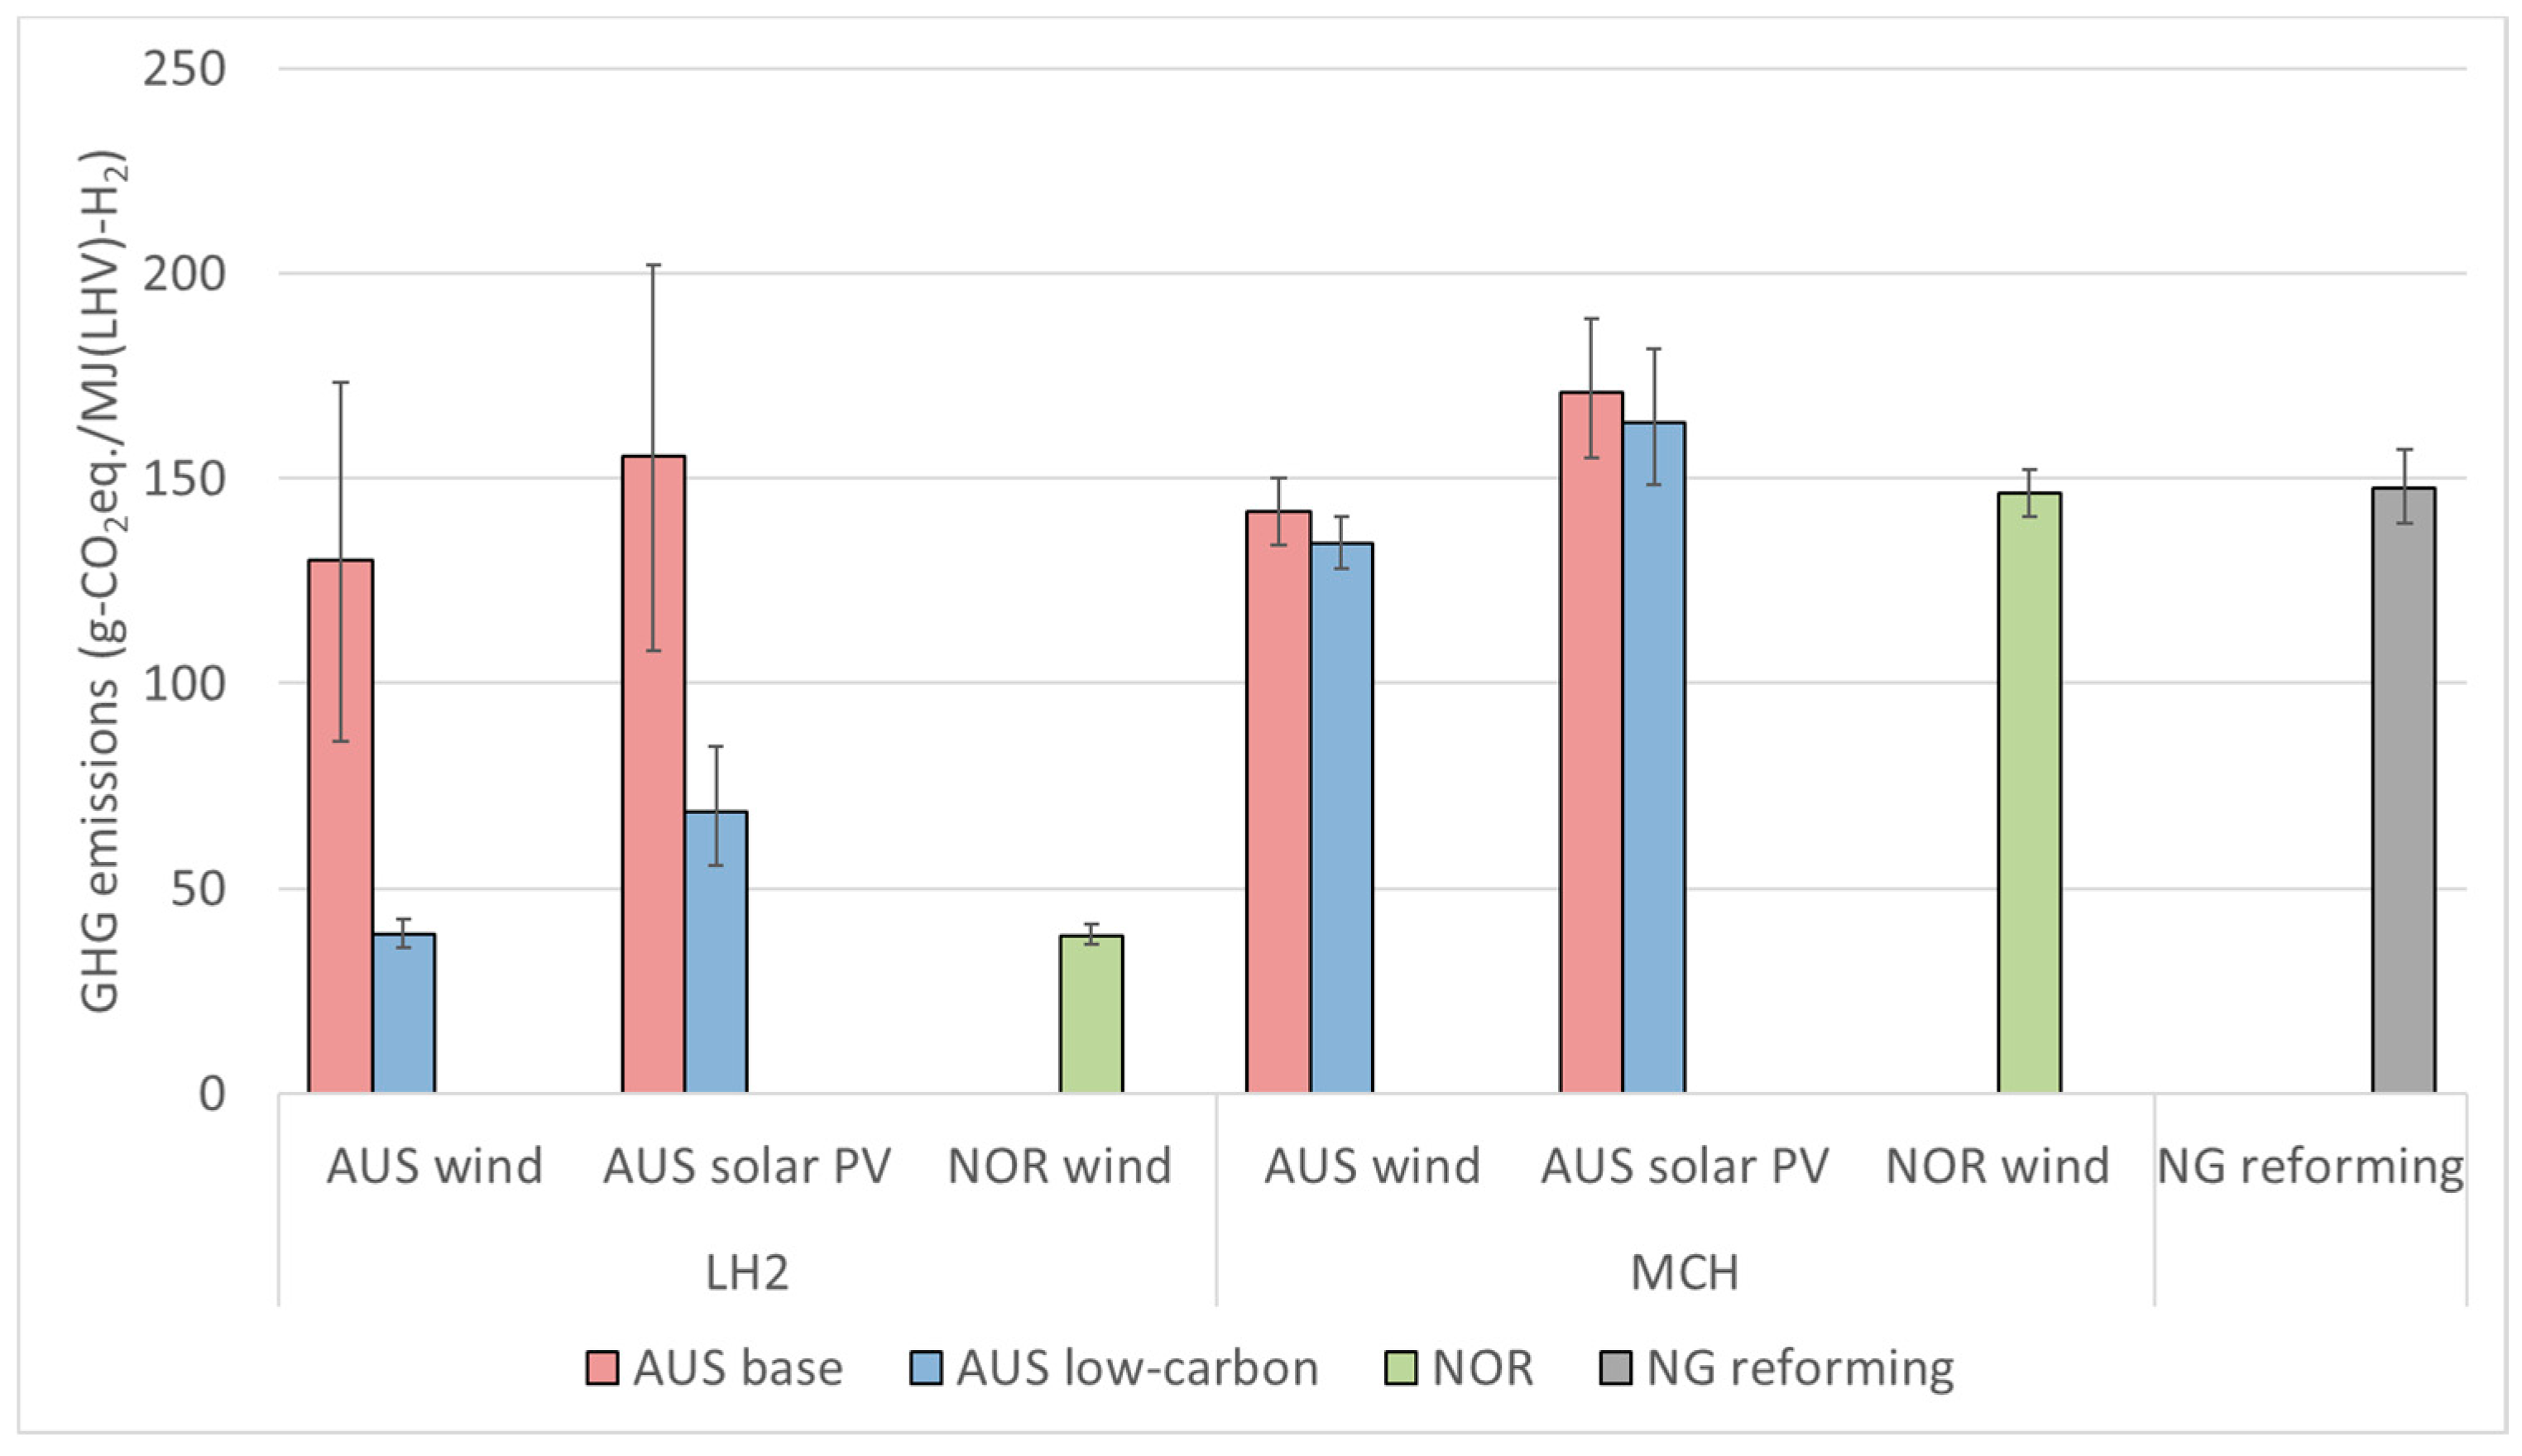
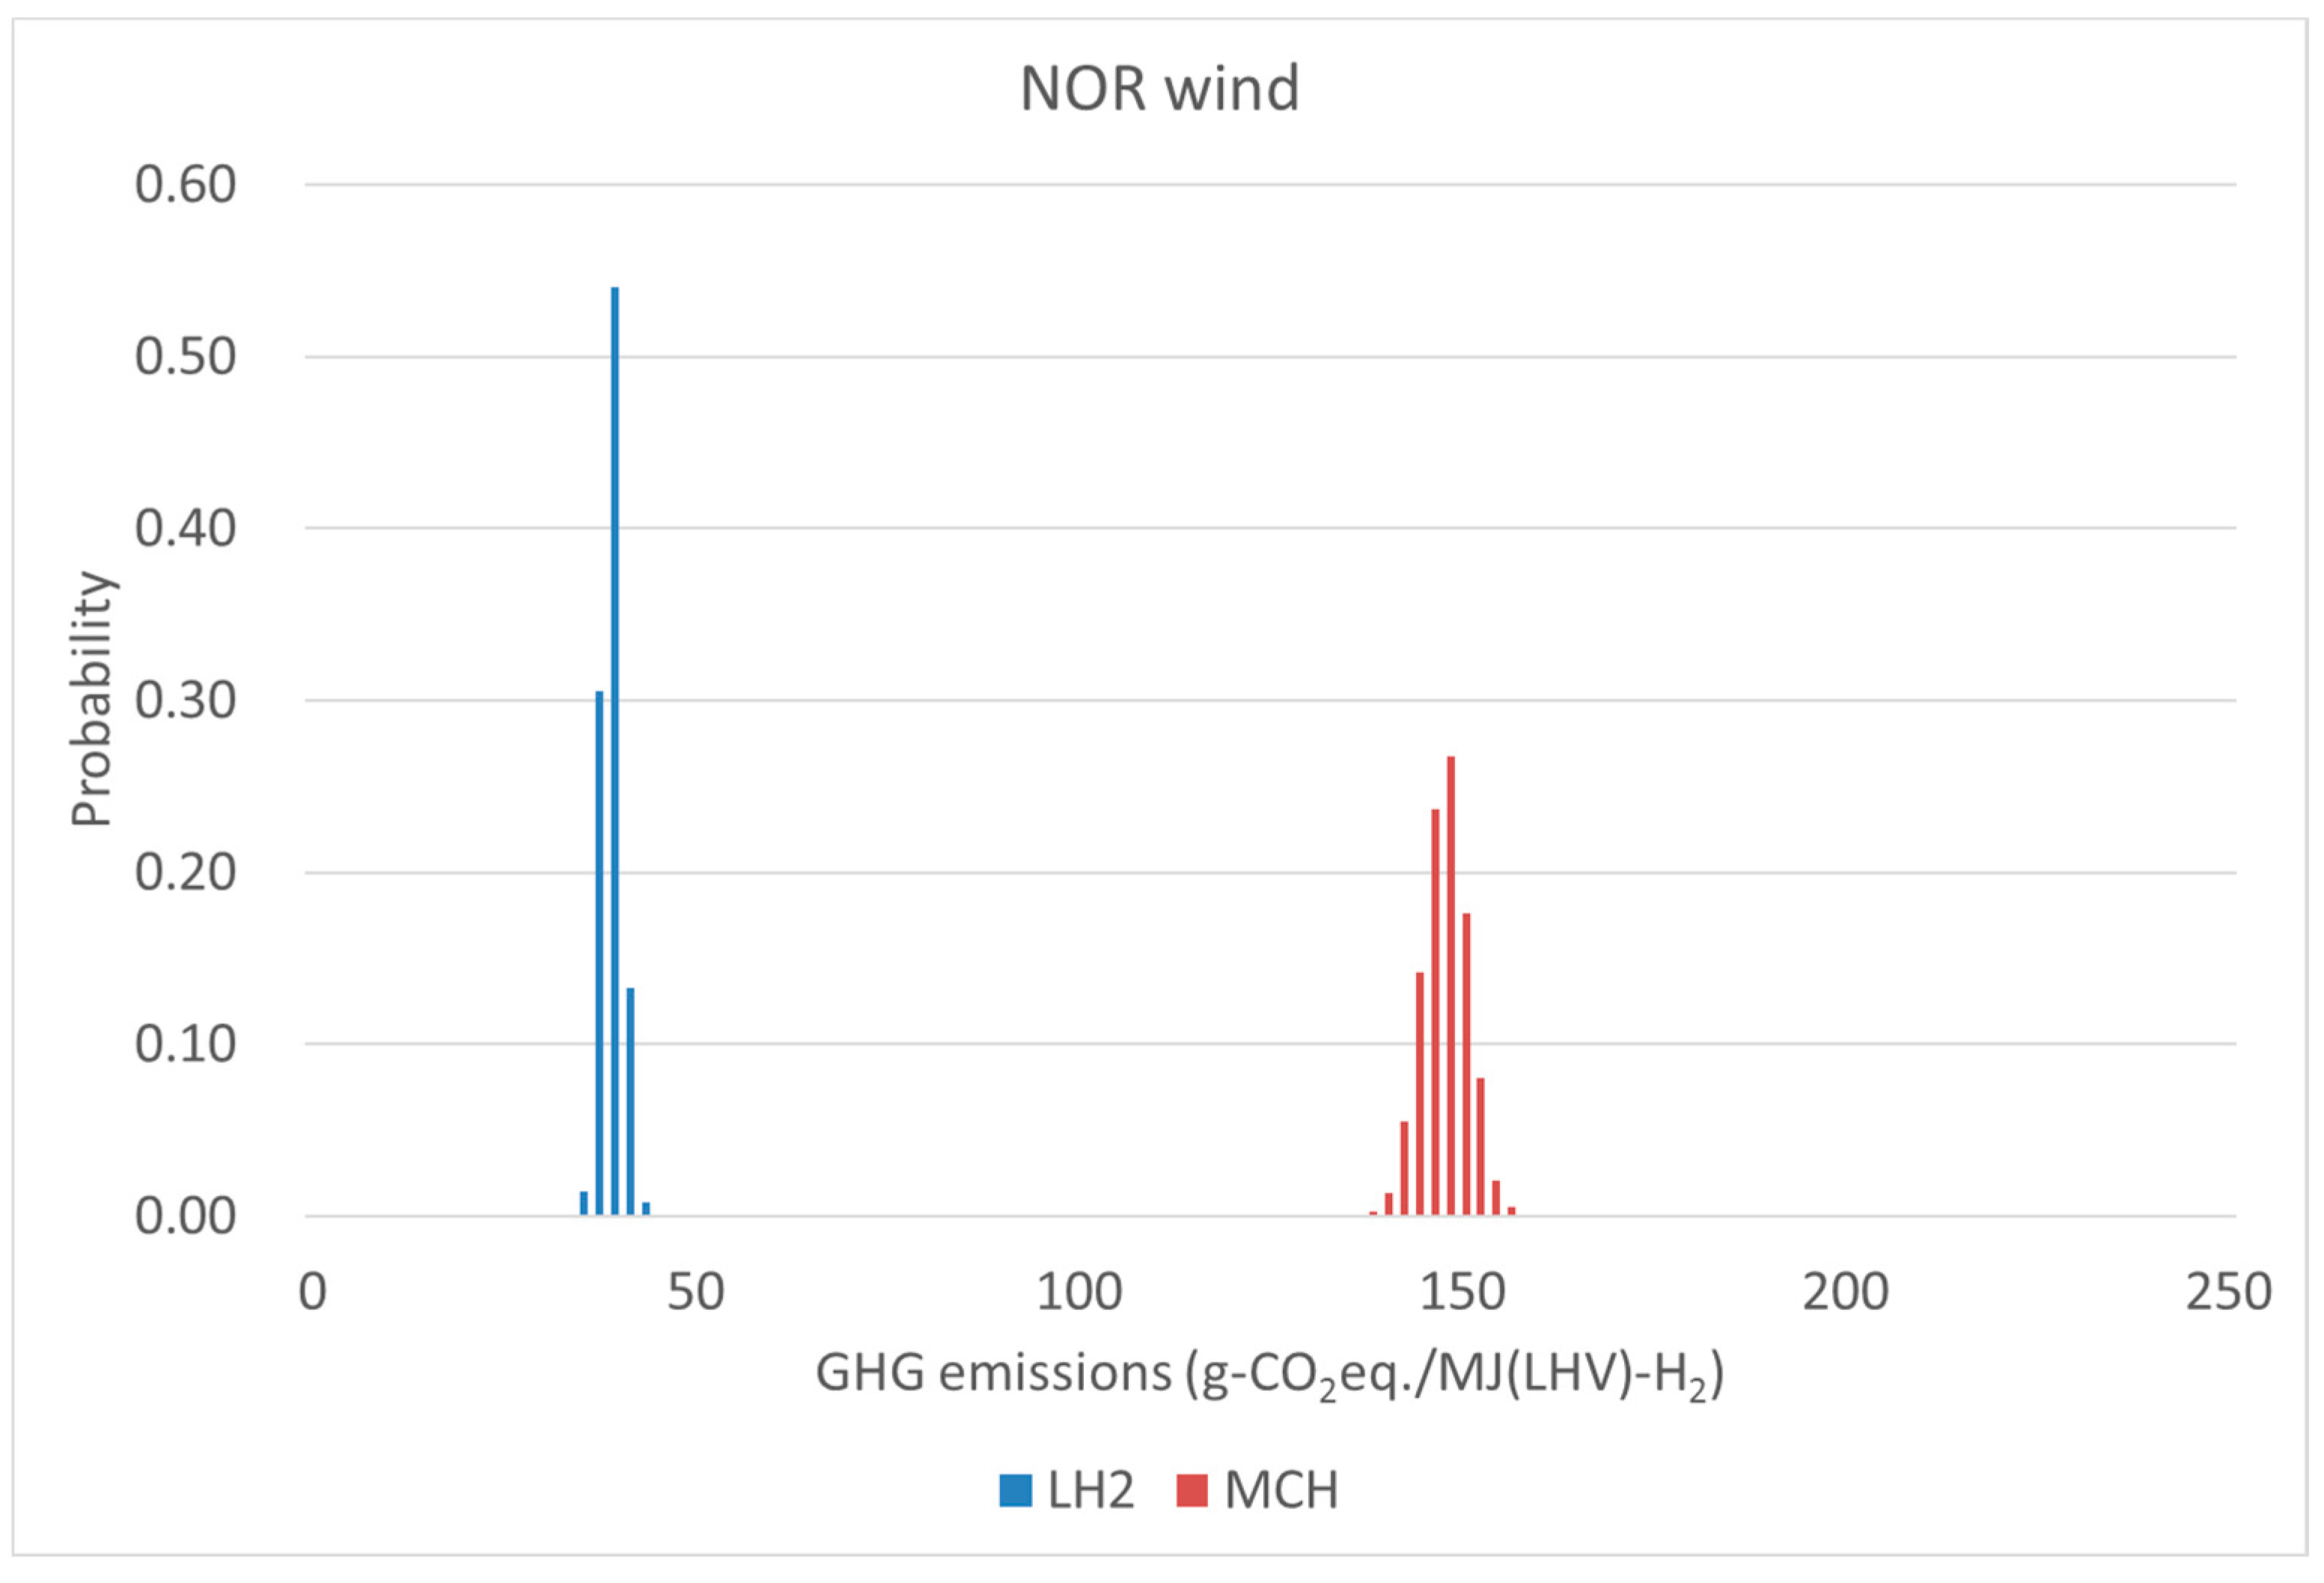
Figure 8 shows the uncertainty analysis results for the WtT GHG emissions from renewable and NG reforming hydrogen supply chains. From the comparison of all results and their variability analyses, it is clear that the GHG emissions from renewable hydrogen using LH2 as the hydrogen carrier are significantly lower than those from hydrogen produced by NG reforming for the Australia low-carbon cases and the Norway case. Conversely, no significant decrease was observed for the MCH cases. Nonetheless, with future technical developments, such as those described in the previous section, the GHG emissions from the MCH process are expected to decrease.
4. Conclusions
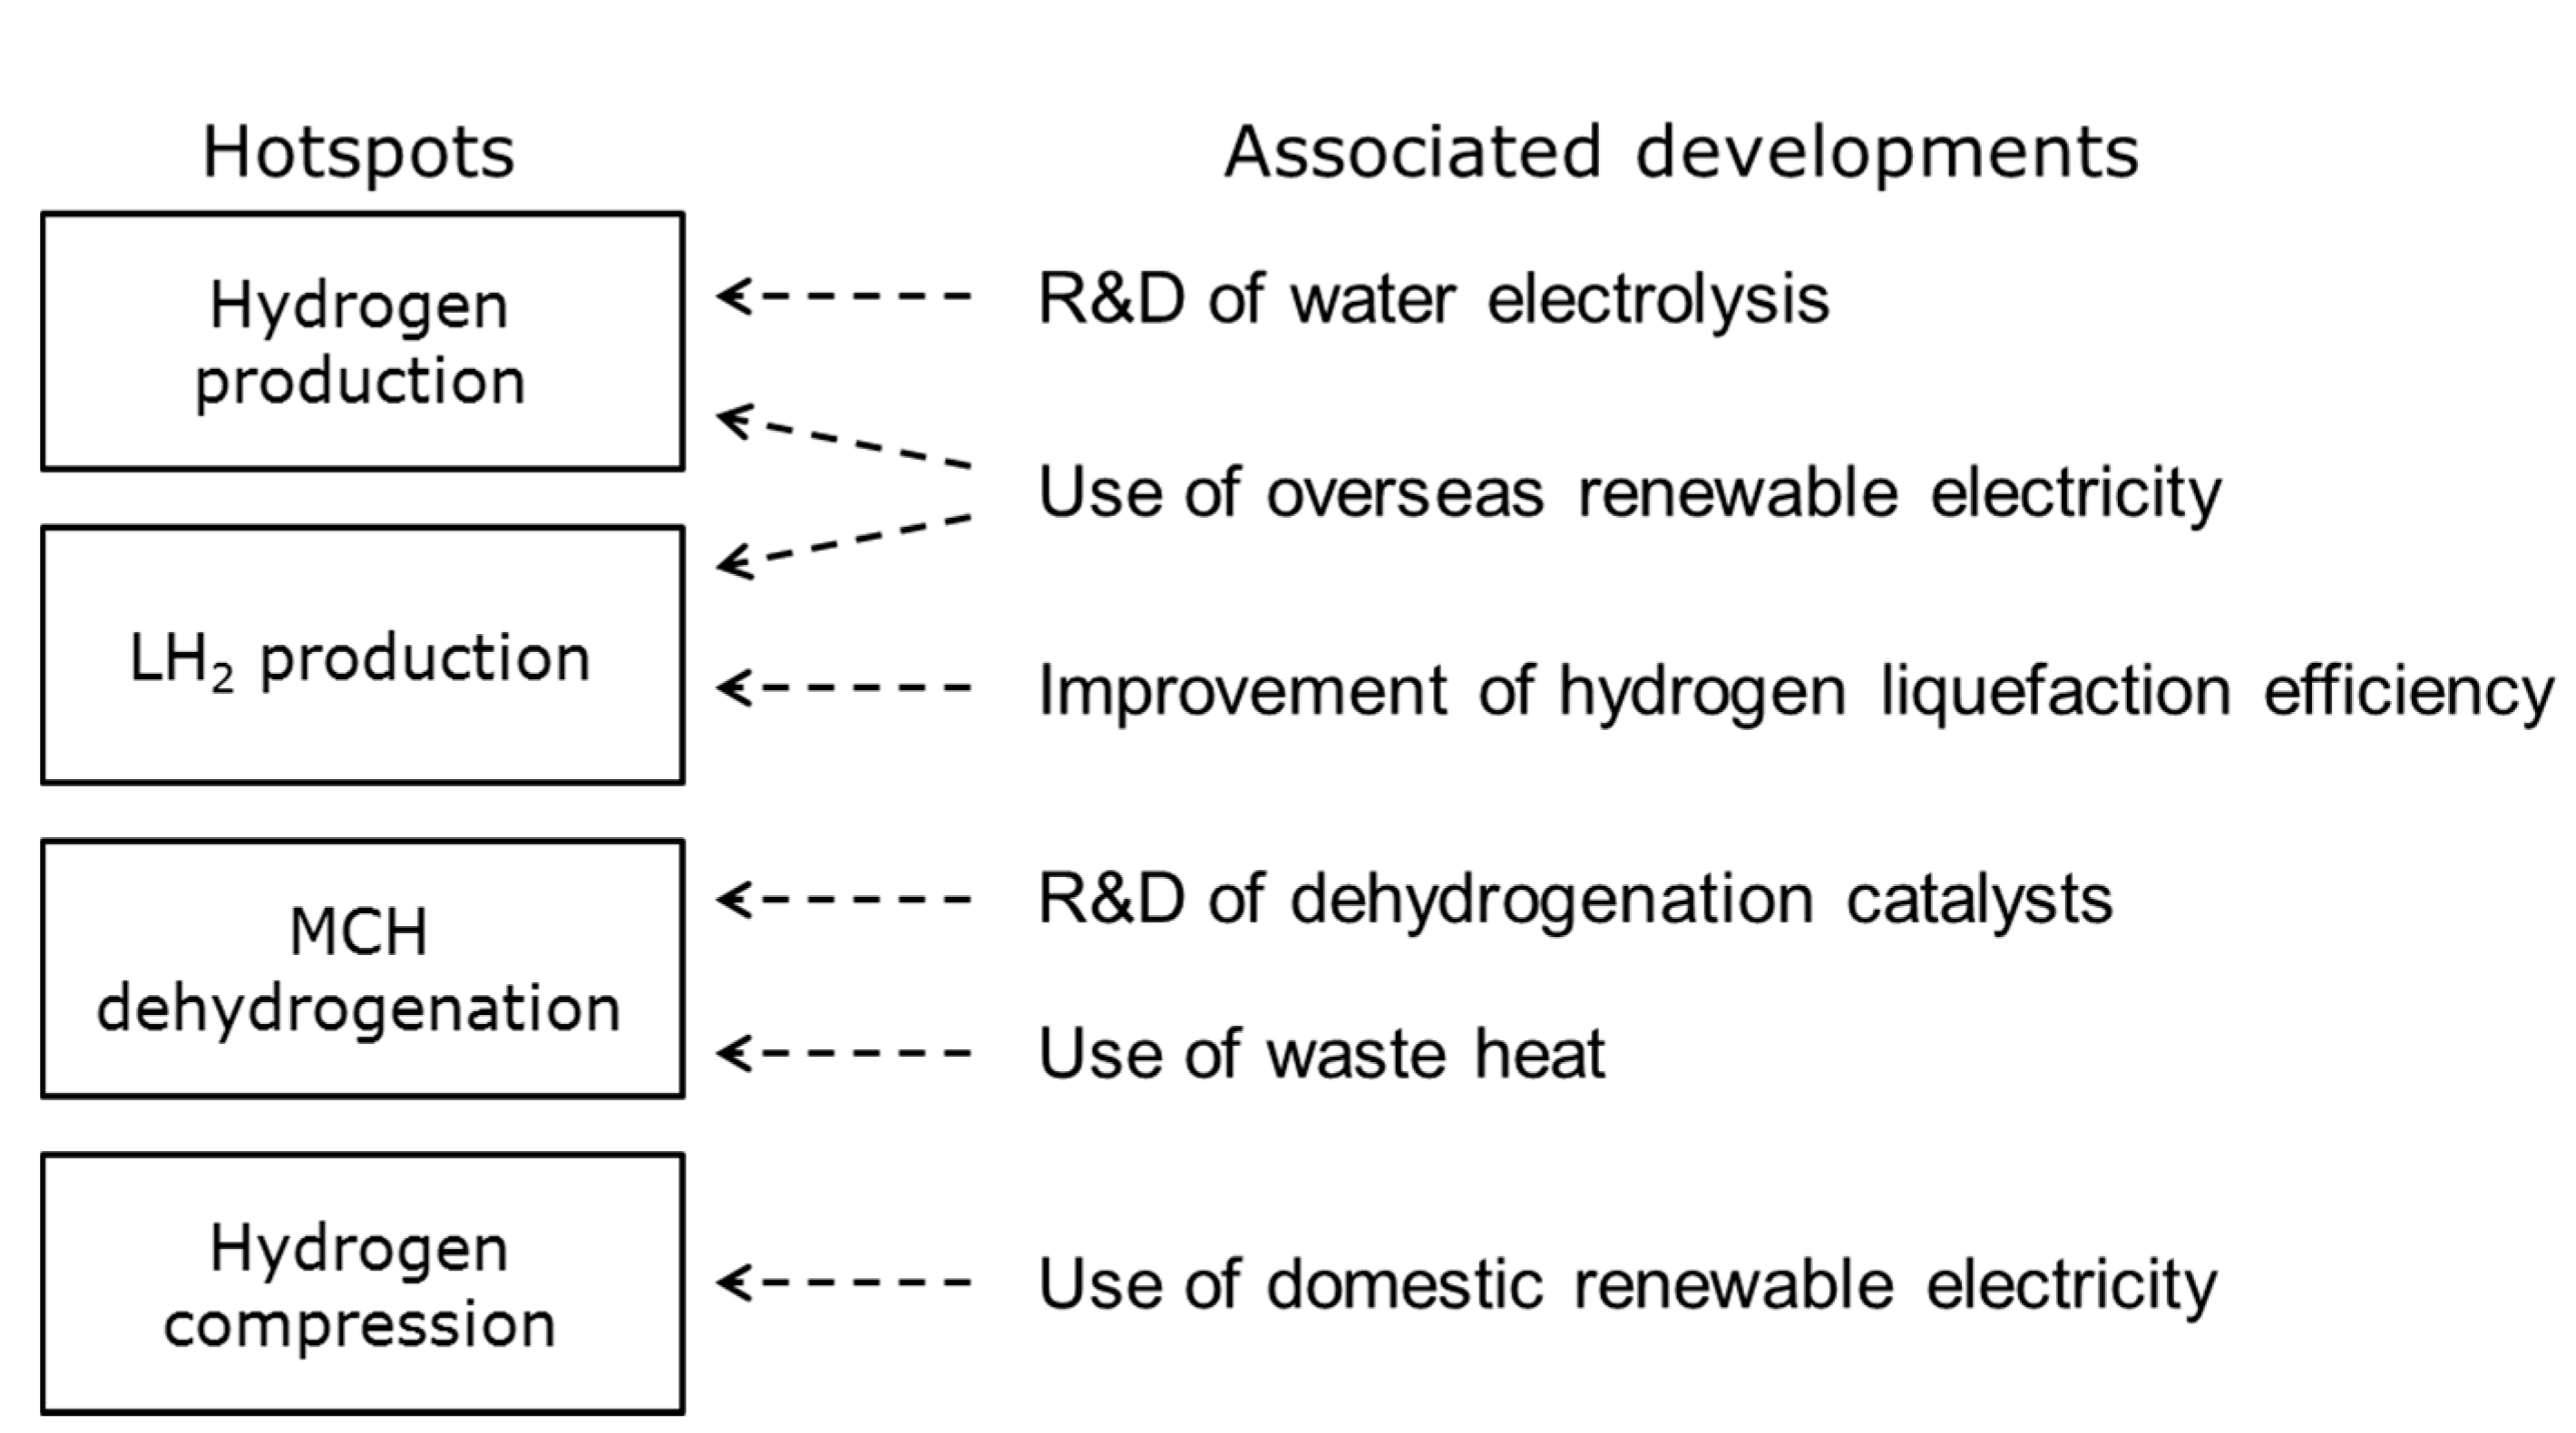
To better understand the potential role of hydrogen energy in decreasing GHG emissions in Japan, a WtT LCI analysis was carried out for renewable hydrogen supply chains originating in Australia and Norway. Wind- or solar PV-powered electrolysis generated hydrogen that was transported to Japan using a hydrogen carrier (LH2 or MCH), before being distributed to domestic hydrogen filling stations where the hydrogen was restored and pressurized for FCV applications. Data were drawn from literature surveys and IDEA, the Japanese life cycle inventory database. A Monte Carlo-based uncertainty analysis was performed to investigate the impact of variations in the supply chain’s energy and material inputs. The LCI analyses showed that the initial hydrogen production, its liquefaction to produce LH2, the dehydrogenation of MCH and the compression of hydrogen at the filling stations were particularly GHG-intensive activities in the respective supply chains. A number of technological options to decrease GHG emissions in these areas were discussed, as summarized in Figure 9. With a 95% confidence interval, renewable hydrogen produced in Australia (low-carbon cases) or Norway and transported to Japan as LH2 exhibited significantly lower WtT GHG emissions than those calculated for hydrogen produced by NG reforming. Although the technology options modeled herein suggested the MCH pathway exhibited similar GHG emissions to those from the NG reforming production supply chain, the uncertainty analysis results suggested that feasible technical developments could result in significantly lower emissions from the MCH pathway.
This study mainly focused on the GHG emissions of hydrogen produced from renewable energy resources. However, other potentially low-carbon supply chains exist, such as hydrogen produced from gasification of lignite combined with carbon capture and storage (CCS), which shall be evaluated in future work.
Similarly, we note that extending the LCI analysis to include economic, social and other environmental impacts as part of multiple criteria analyses will also be increasingly important for the deliberation of hydrogen’s potential role as an energy medium.
Acknowledgments
This study was supported by “Advancement of Hydrogen Technologies and Utilization Project” funded by the New Energy and Industrial Technology Development Organization (NEDO).
Author Contributions
Akito Ozawa performed the LCI and uncertainty analyses and, together with Mai Inoue, interpreted the results and wrote the manuscript under the supervision of Yuki Kudoh and Yutaka Genchi. Naomi Kitagawa, Ryoji Muramatsu and Yurie Anzai helped collect inventory data. All authors approved the final version of the manuscript.
Conflicts of Interest
The authors declare no conflicts of interest.
Abbreviations
| AUS | Australia |
| CGH2 | compressed gaseous hydrogen |
| FC-CHP | fuel cell combined heat and power unit |
| FCVs | fuel cell vehicles |
| GHG | greenhouse gas |
| IDEA | Inventory Database for Environmental Analysis |
| ISO | International Organization for Standardization |
| LCI | life cycle inventory |
| LHV | lower heating value |
| LH2 | liquid hydrogen |
| LNG | liquefied natural gas |
| MCH | methylcyclohexane |
| MTH | methylcyclohexane-toluene-hydrogen |
| NG | natural gas |
| NOR | Norway |
| PV | photovoltaics |
| R&D | research and development |
| TOL | toluene |
| UPS | uninterruptible power system |
| WtT | Well-to-Tank |
| WtW | Well-to-Wheel |
Appendix A

Table A1.
The probability distribution function, mean, standard deviation (SD), minimum (min.) and maximum (max.) values for various uncertainty parameters.
Table A1.
The probability distribution function, mean, standard deviation (SD), minimum (min.) and maximum (max.) values for various uncertainty parameters.
| Parameter (Unit) | Function | Mean | SD | Min. | Max. | Reference |
|---|---|---|---|---|---|---|
| GHG emissions for wind power generation in Australia (g-CO2eq./kWh) | Normal | 15.3 | 1.53 | [34,58,59,60,99,100] | ||
| GHG emissions for solar PV power generation in Australia (g-CO2eq./kWh) | Normal | 66.4 | 6.64 | [34,58,59,60,99,100] | ||
| GHG emissions for wind power generation in Norway (g-CO2eq./kWh) | Normal | 10.8 | 1.08 | [34,58,59,60,99,100] | ||
| Electricity input for hydrogen production via water electrolysis (kWh/Nm3-H2) | Normal | 5.19 | 0.94 | [62,63,64,65,66,67,68,69,70,71,72,73,74] | ||
| Electricity input for liquefaction of gaseous hydrogen to produce LH2 (kWh/Nm3-H2) | Normal | 0.906 | 0.233 | [65,66,75,76,77,78] | ||
| LH2 Boil-off rate during ocean transport (%/day) | Normal | 0.3 | 0.1 | [65,66] | ||
| Electricity input for MCH production (kWh/t-MCH) | Triangular | 40.68 | 37.62 | 7.54 | 93.30 | [65,66,93] |
| Electricity input for MCH storage at loading/unloading port (kWh/t-MCH) | Normal | 0.915 | 0.085 | [65,66] | ||
| Electricity input for MCH dehydrogenization (kWh/Nm3-H2) | Normal | 0.310 | 0.047 | [65,66,93] | ||
| Electricity input for TOL storage at loading/unloading port (kWh/t-TOL) | Normal | 0.915 | 0.085 | [65,66] | ||
| NG input for hydrogen production via NG steam reforming (MJ(LHV)/Nm3-H2) | Normal | 15.04 | 0.24 | [95,97] | ||
| Electricity input for hydrogen production via NG steam reforming (kWh/Nm3-H2) | Triangular | 0.211 | 0.110 | 0.100 | 0.323 | [95,97] |
| Electricity input for hydrogen compression at NG steam reforming hydrogen production plant (kWh/Nm3-H2) | Triangular | 0.272 | 0.135 | 0.119 | 0.440 | [39] |
| Tank capacity of CGH2 tank trucks (Nm3-H2) | Normal | 2,330 | 130 | [40,98] | ||
| Fuel economy of CGH2 tank trucks (km/L-diesel oil) | Normal | 2.75 | 0.25 | [40,98] |
Table A2.
Electricity input for hydrogen production via water electrolysis; individual values of inventory data from each literature are shown side by side.
Table A2.
Electricity input for hydrogen production via water electrolysis; individual values of inventory data from each literature are shown side by side.
| Reference | Electricity (kWh/Nm3-H2) | ||||||
|---|---|---|---|---|---|---|---|
| Asaoka et al. [62] | 4.5 | 5.1 | 4.85 | ||||
| Hydrogenics [63,64] | 5.4 | 4.9 | 6.7 | ||||
| IAE (2010) [65] | 6.5 | 4.3 | 5.3 | ||||
| IAE (2016) [66] | 4.8 | ||||||
| Japan Petroleum Energy Center [67] | 4.8 | 5.3 | 6.5 | 4.5 | |||
| Kawasaki Heavy Industries [68] | 4.8 | ||||||
| Kobelco Eco-Solutions [69] | 6.5 | ||||||
| Mitsusima and Matsuzawa [70] | 4.3 | 4.6 | 3.9 | 4.2 | 4.6 | 4.8 | 4.3 |
| 4.3 | 4.5 | 4.7 | 4.4 | 5.8 | 6.0 | 4.5 | |
| 4.5 | 3.9 | 3.7 | 5.6 | 5.2 | |||
| NEDO [71] | 4.3 | 5.3 | 6.5 | ||||
| NREL [72] | 6.3 | 6.1 | |||||
| Proton On-Site [73,74] | 7.3 | 7.0 | 6.8 | 6.2 | |||
| Mean | 5.19 | ||||||
| Standard deviation | 0.94 | ||||||
Table A3.
Electricity input for liquefaction of gaseous hydrogen to produce LH2; individual values of inventory data from each literature are shown side by side.
Table A3.
Electricity input for liquefaction of gaseous hydrogen to produce LH2; individual values of inventory data from each literature are shown side by side.
| Reference | Electricity (kWh/Nm3-H2) | |||
|---|---|---|---|---|
| IAE (2010) [65] | 1.059 | 0.958 | 0.900 | |
| IAE (2016) [66] | 0.550 | 0.690 | ||
| IAE et al. [75] | 0.970 | |||
| JRC [76] | 0.900 | |||
| JHFC [77] | 1.259 | |||
| Kawasaki Heavy Industries [78] | 1.079 | 1.259 | 0.692 | 0.555 |
| Mean | 0.906 | |||
| Standard deviation | 0.233 | |||
Table A4.
LH2 boil off rate of liquid hydrogen while ocean transport.
| Reference | Boil off Rate (%/day) | ||||
|---|---|---|---|---|---|
| IAE (2010) [65] | 0.4 | ||||
| IAE (2016) [66] | 0.2 | ||||
| Mean | 0.3 | ||||
| Standard deviation | 0.1 | ||||
Table A5.
Electricity input for MCH production.
| Reference | Electricity (kWh/t-MCH) | ||||
|---|---|---|---|---|---|
| IAE (2010) [65] | 7.54 | ||||
| IAE (2016) [66] | 93.3 | ||||
| Hondo et al. [93] | 21.2 | ||||
| Mean | 40.68 | ||||
| Standard deviation | 37.62 | ||||
Table A6.
Electricity input for MCH storage at loading/unloading port.
| Reference | Electricity (kWh/t-MCH) | ||||
|---|---|---|---|---|---|
| IAE (2010) [65] | 0.83 | ||||
| IAE (2016) [66] | 1.00 | ||||
| Mean | 0.915 | ||||
| Standard deviation | 0.085 | ||||
Table A7.
Electricity input for MCH dehydrogenization.
| Reference | Electricity (kWh/Nm3-H2) | ||||
|---|---|---|---|---|---|
| IAE (2010) [65] | 0.335 | ||||
| IAE (2016) [66] | 0.352 | ||||
| Hondo et al. [93] | 0.244 | ||||
| Mean | 0.310 | ||||
| Standard deviation | 0.047 | ||||
Table A8.
Electricity input for TOL storage at loading/unloading port.
| Reference | Electricity (kWh/t-MCH) | ||||
|---|---|---|---|---|---|
| IAE (2010) [65] | 0.83 | ||||
| IAE (2016) [66] | 1.00 | ||||
| Mean | 0.915 | ||||
| Standard deviation | 0.085 | ||||
Table A9.
NG input for hydrogen production via NG steam reforming.
| Reference | Natural Gas (MJ(LHV)/Nm3-H2) | ||||
|---|---|---|---|---|---|
| General Moters et al. [95] | 15.27 | ||||
| Ramsden et al. [97] | 14.80 | ||||
| Mean | 15.04 | ||||
| Standard deviation | 0.24 | ||||
Table A10.
Electricity input for hydrogen production via NG steam reforming.
| Reference | Electricity (kWh/Nm3-H2) | ||||
|---|---|---|---|---|---|
| General Moters et al. [95] | 0.323 | ||||
| Ramsden et al. [97] | 0.100 | ||||
| Mean | 0.211 | ||||
| Standard deviation | 0.110 | ||||
Table A11.
Electricity input for hydrogen compression at NG steam reforming hydrogen production plant; individual values of inventory data from each literature are shown side by side.
Table A11.
Electricity input for hydrogen compression at NG steam reforming hydrogen production plant; individual values of inventory data from each literature are shown side by side.
| Reference | Electricity (kWh/Nm3-H2) | ||||
|---|---|---|---|---|---|
| JHFC (2011) [39] | 0.119 | 0.440 | |||
| Mean | 0.272 | ||||
| Standard deviation | 0.135 | ||||
Appendix B
Figure A1.
Probability histograms of WtT GHG emissions from hydrogen supply chains for hydrogen produced using wind power in Australia (base case).
Figure A1.
Probability histograms of WtT GHG emissions from hydrogen supply chains for hydrogen produced using wind power in Australia (base case).

Figure A2.
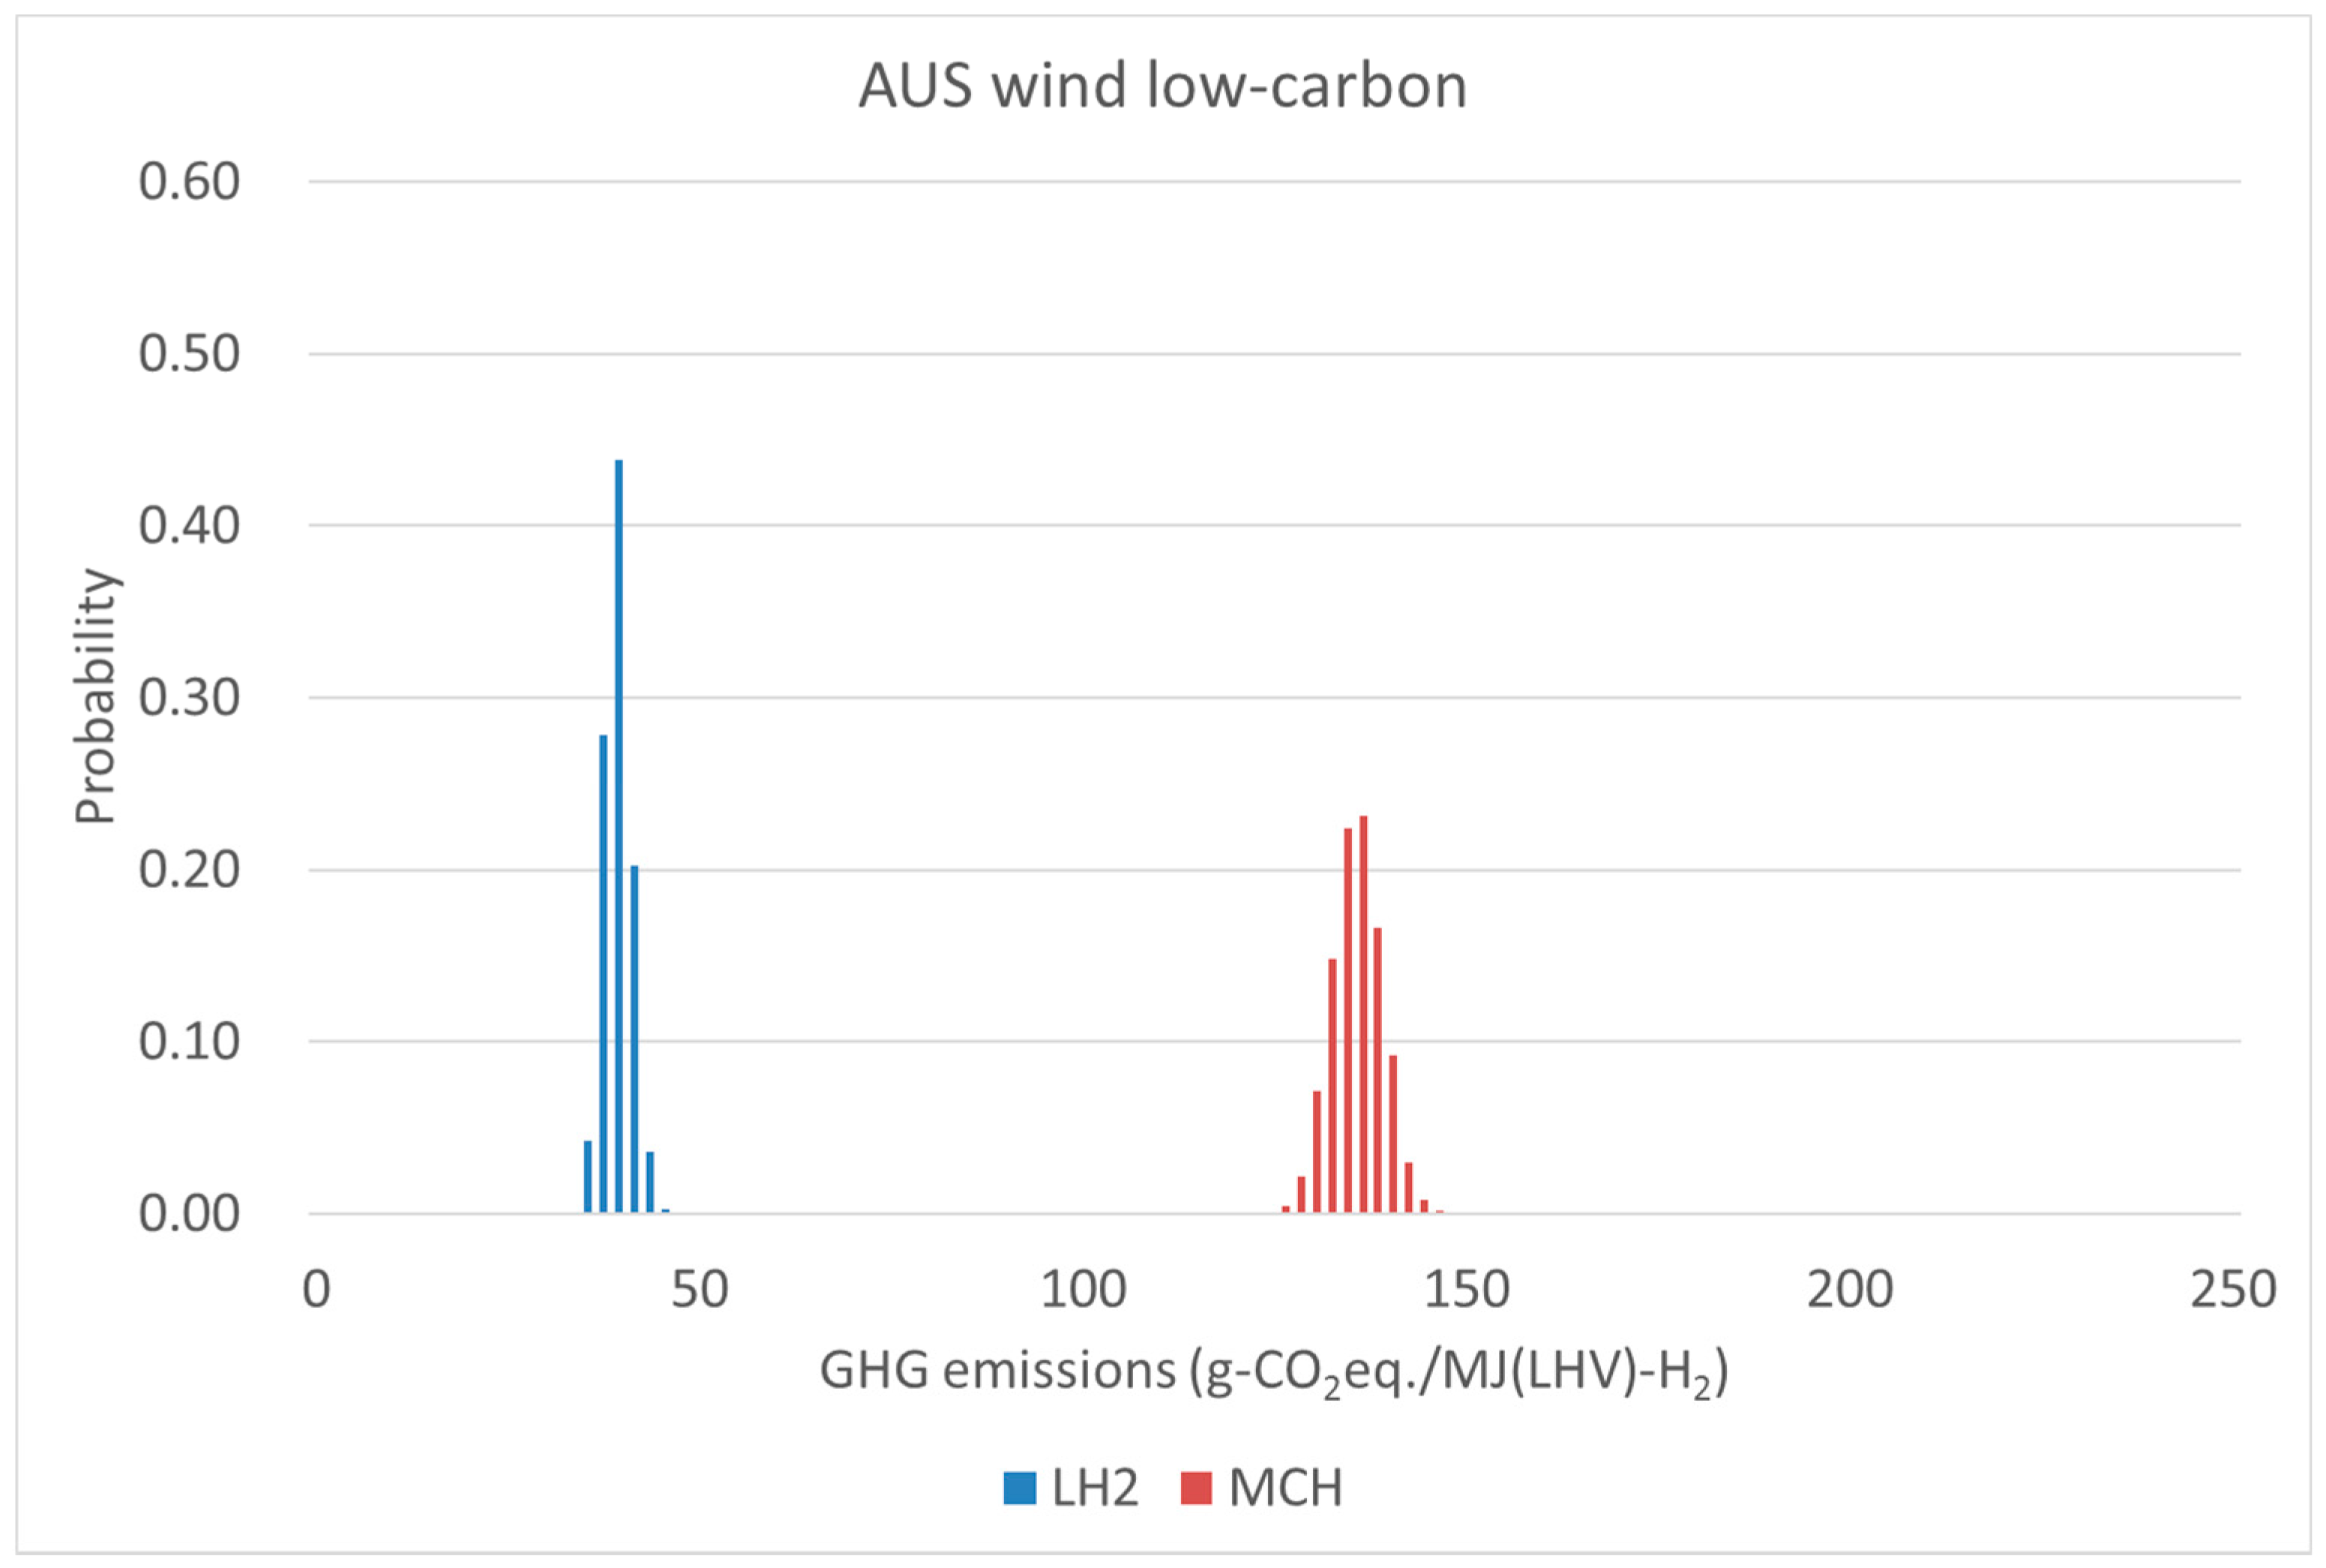
Probability histograms of WtT GHG emissions from hydrogen supply chains for hydrogen produced using wind power in Australia (low-carbon case).
Figure A2.
Probability histograms of WtT GHG emissions from hydrogen supply chains for hydrogen produced using wind power in Australia (low-carbon case).

Figure A3.
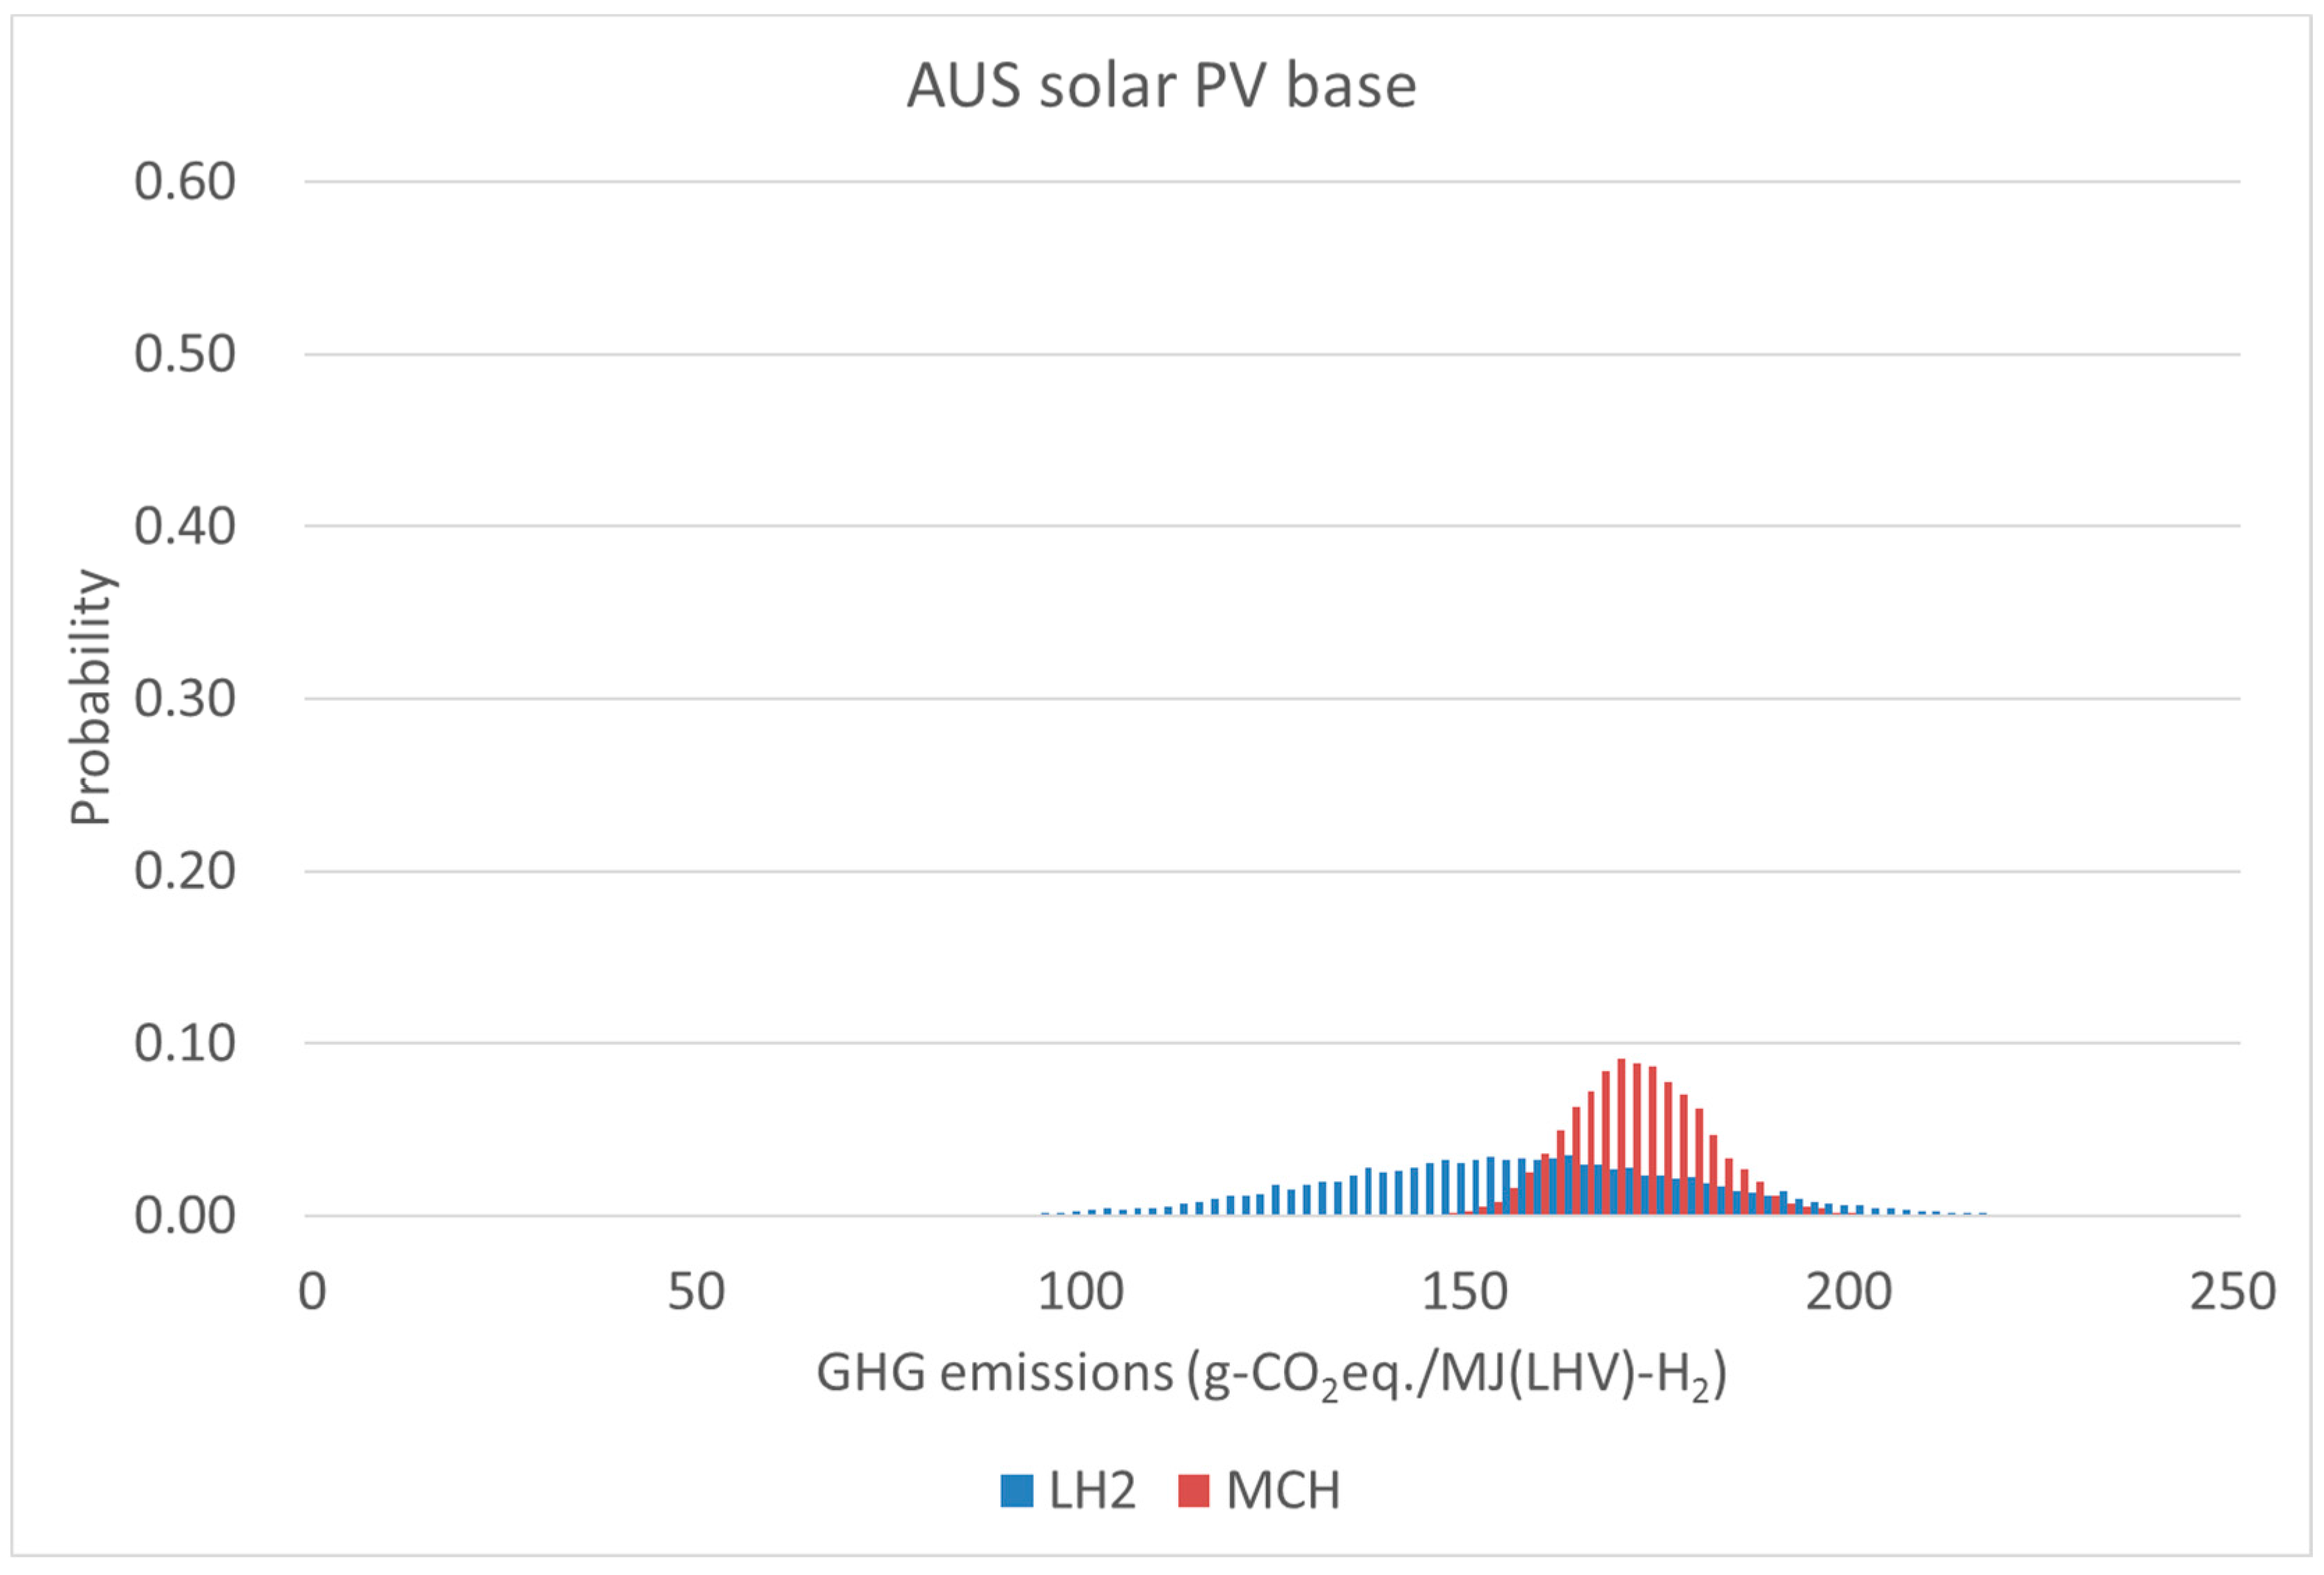
Probability histograms of WtT GHG emissions from hydrogen supply chains for hydrogen produced using solar PV power in Australia (base case).
Figure A3.
Probability histograms of WtT GHG emissions from hydrogen supply chains for hydrogen produced using solar PV power in Australia (base case).

Figure A4.
Probability histograms of WtT GHG emissions from hydrogen supply chains for hydrogen produced using solar PV power in Australia (low-carbon case).
Figure A4.
Probability histograms of WtT GHG emissions from hydrogen supply chains for hydrogen produced using solar PV power in Australia (low-carbon case).

Figure A5.
Probability histograms of WtT GHG emissions from hydrogen supply chains for hydrogen produced using wind power in Norway.
Figure A5.
Probability histograms of WtT GHG emissions from hydrogen supply chains for hydrogen produced using wind power in Norway.

Figure A6.
Probability histogram of WtT GHG emissions for supply chain for hydrogen produced using NG reforming.
Figure A6.
Probability histogram of WtT GHG emissions for supply chain for hydrogen produced using NG reforming.

References
- Navarro, R.M.; Peña, M.A.; Fierro, J.L.G. Hydrogen Production Reactions from Carbon Feedstocks: Fossil Fuels and Biomass. Chem. Rev. 2007, 107, 3952–3991. [Google Scholar] [CrossRef] [PubMed]
- Holladay, J.D.; Hu, J.; King, D.L.; Wang, Y. An overview of hydrogen production technologies. Catal. Today 2009, 139, 244–260. [Google Scholar] [CrossRef]
- Barbir, F.; Basile, A.; Veziroglu, T.N. Compendium of Hydrogen Energy: Hydrogen Enenrgy Conversion; Woodhead Publishing: Cambridge, UK, 2015. [Google Scholar]
- National Research Council and National Academy of Engineering. The Hydrogen Economy; National Academies Press: Washington, DC, USA, 2004. [Google Scholar]
- Toyota Motor Corporation It’s Official! Toyota Mirai Goes the Distance. Available online: http://pressroom.toyota.com/releases/2015+aspen+ideas+mirai+mileage.htm (accessed on 11 December 2016).
- Honda Motor Corporation Honda Begins Sales of All-new Clarity Fuel Cell-Clarity Fuel Cell Realizes the World’s Top-Class Cruising Range among Zero Emission Vehicles of Approximately 750 km2. Available online: http://world.honda.com/news/2016/4160310eng.html (accessed on 11 December 2016).
- Daimler, A.G. Under the microscope: Mercedes-Benz GLC F-CELL: The Fuel Cell Gets a Plug-Daimler Global Media Site. Available online: http://media.daimler.com/marsMediaSite/en/instance/ko.xhtml?oid=11111320 (accessed on 11 December 2016).
- Mayyas, A.; Wei, M.; Chan, S.H.; Lipman, T. Fuel Cell Forklift Deployment in the USA. In Fuel Cells: Data, Facts and Figures; Wiley-VCH Verlag GmbH & Co. KGaA: Weinheim, Germany, 2016; pp. 334–342. [Google Scholar]
- Landinger, H. International Perspectives for Fuel Cells for Materials Handling Vehicles (MHVs). In Proceedings of the 10th International Colloquium Fuels—Conventional and Future Energy for Automobiles, Stuttgart, Germany, 22 January 2015. [Google Scholar]
- Material Handling & Logistics Toyota Testing Hydrogen to Power Forklifts|Reduce emissions by 80%. Available online: http://mhlnews.com/transportation-distribution/toyota-testing-hydrogen-fuel-cells-power-forklifts (accessed on 18 December 2016).
- Eudy, L.; Post, M.; Jeffers, M. Fuel Cell Buses in U.S. Transit Fleets: Current Status 2016; National Renewable Energy Laboratory: Golden, CO, USA, 2016. Available online: https://energy.gov/sites/prod/files/2016/12/f34/fcto_2016_fuel_cell_bus_report.pdf (accessed on 22 June 2017).
- Madden, B.; Zaetta, R.; Skiker, S. Guidelines for Delivering Fuel Cell BUS Projects (D.4.8c); Clean Hydrogen in European Cities: Cambridge, UK, 2016; Available online: http://chic-project.eu/newsevents/news/chic-guidelines-for-cities-how-to-start-a-fuel-cell-bus-project (accessed on 22 June 2017).
- Toyota Motor Corporation Toyota to Start Sales of Fuel Cell Buses under the Toyota Brand from Early 2017. Available online: http://newsroom.toyota.co.jp/en/detail/13965745/ (accessed on 18 December 2016).
- Elmer, T.; Worall, M.; Wu, S.; Riffat, S.B. Fuel cell technology for domestic built environment applications: State of-the-art review. Renew. Sustain. Energy Rev. 2015, 42, 913–931. [Google Scholar] [CrossRef]
- Curtin, S.; Gangi, J. The Business Case for Fuel Cells 2015: Powering Corporate Sustainability; Fuel Cell and Hydrogen Energy Association: Washington, DC, USA, 2015. [Google Scholar]
- ITM Power RWE Power-to-Gas Energy Storage System Launched. Available online: http://www.itm-power.com/news-item/rwe-power-to-gas-energy-storage-system-launched (accessed on 18 December 2016).
- Toshiba Corporation Toshiba H2One Hydrogen Based Autonomous Energy Supply System Now Providing Power to a Kyushu Resort Hotel. Available online: https://www.toshiba.co.jp/about/press/2016_03/pr1402.htm (accessed on 11 December 2016).
- Harbor Bureau. Toshiba Corporation Toshiba H2OneTM Hydrogen Based Autonomous Energy Supply System Now Providing Power to the City of Yokohama’s Port & Harbor Bureau. Available online: http://www.toshiba.co.jp/about/press/2016_04/pr2101.htm (accessed on 18 December 2016).
- Balestri, M.; Benelli, G.; Donatini, F.; Arlati, F.; Conti, G. Enel’s Fusina hydrogen-fed power generation plant. In Proceedings of the International Conference on Clean Electrical Power, Capri, Italy, 21–23 May 2007; pp. 456–463. [Google Scholar]
- Patel, S. Enel’s Fusina Hydrogen-Fueled Plant Goes Online. Available online: http://www.powermag.com/enels-fusina-hydrogen-fueled-plant-goes-online/ (accessed on 5 April 2017).
- Sasaki, K.; Li, H.-W.; Hayashi, A.; Yamabe, J.; Ogura, T.; Lyth, S.M. Hydrogen Energy Engineering: A Japanese Perspective; Springer Japan: Tokyo, Japan, 2016. [Google Scholar]
- Gupta, R.; Basile, A.; Angelo, B.; Veziroglu, T.N. Compendium of Hydrogen Energy: Hydrogen Storage, Distribution and Infrastructure; Woodhead Publishing: Cambridge, UK, 2015. [Google Scholar]
- Mitsugi, C.; Harumi, A.; Kenzo, F. WE-NET: Japanese hydrogen program. Int. J. Hydrogen Energy 1998, 23, 159–165. [Google Scholar] [CrossRef]
- Kawasaki Heavy Industries Kawasaki Hydrogen Road. Available online: http://global.kawasaki.com/en/stories/hydrogen/?_ga=1.256845131.198432951.1491376371 (accessed on 18 April 2017).
- Chiyoda Corporation Hydrogen Supply Chain. Available online: https://www.chiyoda-corp.com/technology/en/spera-hydrogen/spera02.html (accessed on 18 April 2017).
- UNEP/SETAC Life Cycle Initiative. Life Cycle Approaches: The Road from Analysis to Practice; UNEP/SETAC Life Cycle Initiative: Paris, France, 2005. [Google Scholar]
- Spath, P.L.; Mann, M.K. Life Cycle Assessment of Hydrogen Production via Natural Gas Steam Reforming; National Renewable Energy Labaratory: Golden, CO, USA, 2001. [Google Scholar]
- Marquevich, M.; Sonnemann, G.W.; Castells, F.; Montané, D. Life cycle inventory analysis of hydrogen production by the steam-reforming process: Comparison between vegetable oils and fossil fuels as feedstock. Green Chem. 2002, 4, 414–423. [Google Scholar] [CrossRef]
- National Energy Technology Laboratory. Life-Cycle Analysis of Greenhouse Gas Emissions for Hydrogen Fuel Production in the United States from LNG and Coal; National Energy Technology Laboratory: Pittsburgh, PA, USA, 2005. Available online: https://www.netl.doe.gov/File%20Library/Research/Energy%20Analysis/Life%20Cycle%20Analysis/h2_from_coal_lng_final.pdf (accessed on 22 June 2017).
- Ozbilen, A.; Rosen, M.A. A comparative life cycle analysis of hydrogen production via thermochemical water splitting using a Cu–Cl cycle. Int. J. Hydrogen Energy 2011, 36, 11321–11327. [Google Scholar] [CrossRef]
- Wulf, C.; Kaltschmitt, M. Life cycle assessment of hydrogen supply chain with special attention on hydrogen refuelling stations. Int. J. Hydrogen Energy 2012, 37, 16711–16721. [Google Scholar] [CrossRef]
- Cetinkaya, E.; Dincer, I.; Naterer, G.F. Life cycle assessment of various hydrogen production methods. Int. J. Hydrogen Energy 2012, 37, 2071–2080. [Google Scholar] [CrossRef]
- Franzitta, V.; Curto, D.; Milone, D.; Trapanese, M. Energy Saving in Public Transport Using Renewable Energy. Sustainability 2017, 9, 106. [Google Scholar] [CrossRef]
- Kato, T. Possibility of Hydrogen Production from Renewable Energy. J. Jpn. Inst. Energy 2015, 94, 7–18. (In Japanese) [Google Scholar]
- Gnanapragasam, N.V.; Reddy, B.V.; Rosen, M.A. A Methodology for Assessing the Sustainability of Hydrogen Production from Solid Fuels. Sustainability 2010, 2, 1472–1491. [Google Scholar] [CrossRef]
- Manzardo, A.; Ren, J.; Mazzi, A.; Scipioni, A. A grey-based group decision-making methodology for the selection of hydrogen technologies in life cycle sustainability perspective. Int. J. Hydrogen Energy 2012, 37, 17663–17670. [Google Scholar] [CrossRef]
- Stefanova, M.; Tripepi, C.; Zamagni, A.; Masoni, P. Goal and Scope in Life Cycle Sustainability Analysis: The Case of Hydrogen Production from Biomass. Sustainability 2014, 6, 5463–5475. [Google Scholar] [CrossRef]
- Japan Hydrogen & Fuel Cell Demonstration (JHFC) Project. Analysis of Total Efficiency; Japan Hydrogen & Fuel Cell Demonstration (JHFC): Tokyo, Japan, 2006. (In Japanese) [Google Scholar]
- Japan Hydrogen & Fuel Cell Demonstration (JHFC) Project. Analysis of Total Efficiency and GHG Emission; Japan Hydrogen & Fuel Cell Demonstration (JHFC): Tokyo, Japan, 2011. (In Japanese) [Google Scholar]
- Toyota Motor Corporation; Mizuho Information & Research Institute. Well-to-Wheel Analysis of Greenhouse Gas Emissions of Automotive Fuels in the Japanese Context; Toyota Motor Corporation; Mizuho Information & Research Institute: Tokyo, Japan, 2004. [Google Scholar]
- Argonne National Laboratory. The Greenhouse Gases, Regulated Emissions, and Energy Use in Transportation Model. Available online: https://greet.es.anl.gov/ (accessed on 5 April 2017).
- European Commission Joint Research Centre Institute for Energy and Transport. WELL-To-WHEELS Report Version 4.a; European Commission Joint Research Centre Institute for Energy and Transport: Ispra, Italy, 2014. [Google Scholar]
- Usui, T.; Hondo, H. Life Cycle CO2 Emission Analysis of Hydrogen Storage and Battery for Wind Power Generation. J. Jpn. Inst. Energy 2010, 89, 551–561. (In Japanese) [Google Scholar] [CrossRef]
- Mori, M.; Jensterle, M.; Mržljak, T.; Drobnič, B. Life-cycle assessment of a hydrogen-based uninterruptible power supply system using renewable energy. Int. J. Life Cycle Assess. 2014, 19, 1810–1822. [Google Scholar] [CrossRef]
- Mizuho Information & Research Institute. Evaluation Report on GHG Emission from Hydrogen from Life Cycle Perspectives; Mizuho Information & Research Institute: Tokyo, Japan, 2016; Available online: https://www.mizuho-ir.co.jp/publication/report/2016/pdf/wttghg1612.pdf (accessed on 22 June 2017). (In Japanese)
- CertifHy. Available online: http://www.certifhy.eu/ (accessed on 16 June 2017).
- Williams, E.D.; Weber, C.L.; Hawkins, T.R. Hybrid Framework for Managing Uncertainty in Life Cycle Inventories. J. Ind. Ecol. 2009, 13, 928–944. [Google Scholar] [CrossRef]
- Huijbregts, M.A.J.; Norris, G.; Bretz, R.; Ciroth, A.; Maurice, B.; von Bahr, B.; Weidema, B.; de Beaufort, A.S.H. Framework for modelling data uncertainty in life cycle inventories. Int. J. Life Cycle Assess. 2001, 6, 127–132. [Google Scholar] [CrossRef]
- Björklund, A.E. Survey of approaches to improve reliability in LCA. Int. J. Life Cycle Assess. 2002, 7, 64–72. [Google Scholar] [CrossRef]
- ISO 14044. Environmental Management—Life Cycle Assessment—Requirements and Guidelines; International Organization for Standardization: Geneva, Switzerland, 2006; Available online: https://www.iso.org/obp/ui/#iso:std:iso:14044:ed-1:v1:en (accessed on 22 June 2017).
- Vergragt, P.; Groenewegen, P. New technological developments and technology assessment: A plea for an integrated approach. Proj. Apprais. 1989, 4, 29–35. [Google Scholar] [CrossRef]
- Rip, A.; Misa, T.J.; Schot, J. Constructive Technology Assessment: A New Paradigm for Managing Technology in Society. In Managing Technology in Society: The Approach of Constructive Technology Assessment; Pinter Publishers: New York, NY, USA, 1995; pp. 1–12. [Google Scholar]
- Australian Government Department of Industry Tourism and Resources. National Hydrogen Study; Australian Government Department of Industry Tourism and Resources: Canberra, Austrial, 2003.
- Forcey, T. Proposal for an Economic Study into: Producing Hydrogen and Ammonia for Domestic Use and Export, from Renewable Energy in the Spencer Gulf Region of South Australia; Melbourne Energy Institute: Melbourne, Austria, 2015; Available online: http://energy.unimelb.edu.au/__data/assets/pdf_file/0003/2044245/Economic-Report-into-producing-Hydrogen-and-Ammonia-for-domestic-use-and-export.pdf (accessed on 22 June 2017).
- National Institute of Advanced Industrial Science and Technology (AIST). IDEA (Inventory Database for Environmental Analysis). Available online: http://www.idea-lca.jp/index.html (accessed on 22 June 2017).
- Intergovernmental Panel on Climate Change (IPCC). 2.10.2 Direct Global Warming Potentials-AR4 WGI Chapter 2: Changes in Atmospheric Constituents and in Radiative Forcing. Available online: https://www.ipcc.ch/publications_and_data/ar4/wg1/en/ch2s2-10-2.html (accessed on 22 December 2016).
- National Institute of Advanced Industrial Science and Technology (AIST). IDEA Ver.2 Manual Part. 1; National Institute of Advanced Industrial Science and Technology (AIST): Tokyo, Japan, 2016.
- Imamura, E.; Tsuchiya, Y. Evaluation of Life Cycle CO2 Emission of Large-scale Grid-connected Photovoltaic Systems; Central Research Institute of the Electric Power Industry: Tokyo, Japan, 2013; Available online: http://criepi.denken.or.jp/jp/kenkikaku/report/detail/Y12031.html (accessed on 22 June 2017). (In Japanese)
- Imamura, E.; Bando, S.; Tsuchiya, Y.; Ikeno, M. Evaluation of Life Cycle CO2 Emission of Offshore and Onshore Wind Farms; Central Research Institute of the Electric Power Industry: Tokyo, Japan, 2015; Available online: http://criepi.denken.or.jp/jp/kenkikaku/report/detail/Y14018.html (accessed on 22 June 2017). (In Japanese)
- Palmer, G. Energy in Australia; SpringerBriefs in Energy; Springer International Publishing: Cham, Switzerland, 2014. [Google Scholar]
- Trasatti, S. Water Electrolysis: Who First? J. Electroanal. Chem. 1999, 476, 90–91. [Google Scholar] [CrossRef]
- Asaoka, Y.; Uotani, M.; Iwahori, T.; Terada, N. Hydrogen Station Model. In the Introduction Phase of Hydrogen Energy and its Cost Assessment-Role of Hydrogen Production by Electrolysis-; Central Research Institute of the Electric Power Industry: Tokyo, Japan, 2004; Available online: http://criepi.denken.or.jp/jp/kenkikaku/report/detail/T03070.html (accessed on 22 June 2017). (In Japanese)
- Hydrogenics Corporation. OnSite Hydrogen Generation HyLYZERR PEM Electrolysis Technology; Hydrogenics Corporation: Oevel, Belgium.
- Hydrogenics Corporation. HySTAT® Hydrogen Generatiors; P Hydrogenics Corporation: Oevel, Belgium, 2001. [Google Scholar]
- Institute of Applied Energy (IAE). Study of Intercontinental Renewable Energy Transportation Technology from Foregin Countries; Institute of Applied Energy (IAE): Tokyo, Japan, 2010. [Google Scholar]
- Institute of Applied Energy (IAE). Economical Evaluation and Characteristic Analyses for Energy Carrier Systems (FY2014-FY2015) Final Report; Institute of Applied Energy (IAE): Tokyo, Japan, 2016. (In Japanese) [Google Scholar]
- Japan Petroleum Energy Center (JPEC). Research on Possibilities of Massive Hydrogen Transport Using Organic Hydride; Japan Petroleum Energy Center (JPEC): Tokyo, Japan, 2010. (In Japanese) [Google Scholar]
- Kawasaki Heavy Industries. Supplemental Investigation of Project Development of Hydrogen Supply & Utilization Infrastructure Chain Using Australian Brown Coal (FY2013) Final Report; Kawasaki Heavy Industries: Tokyo, Japan, 2013. (In Japanese) [Google Scholar]
- Kobelco Eco-Solutions Corporation Ltd. High-Purity Hydrogen Oxygen Generator; Kobelco Eco-Solutions Corporation Ltd.: Tokyo, Japan. (In Japanese)
- Mitsusima, S.; Matsuzawa, K. Present technologies and subjects of water electrolysis. Hydrogen Energy Syst. 2011, 36, 11–16. (In Japanese) [Google Scholar]
- New Energy and Industrial Technology Development Organization (NEDO). Guidebook of Hydrogen Utilization; New Energy and Industrial Technology Development Organization (NEDO): Tokyo, Japan, 2008. (In Japanese) [Google Scholar]
- Johanna, I. Technology Brief: Analysis of Current-Day Commercial Electrolyzers; National Renewable Energy Labaratory: Golden, CO, USA, 2004. [Google Scholar]
- Proton On-Site H2/H4/H6. Available online: http://www.protononsite.com/products/h2-h4-h6 (accessed on 19 January 2017).
- Proton On-Site C10/C20/C30. Available online: http://www.protononsite.com/products/c10-c20-c30 (accessed on 19 January 2017).
- Institute of Applied Energy (IAE); Iwatani Corporation; Kawasaki Heavy Industries; Kansai Electric Power Company; Shimizu Corporation; Mitsubishi Heavy Industries; Chiyoda Corporation. Feasibility Study in Response to Hydrogen Carriers; New Energy and Industrial Technology Development Organization (NEDO): Tokyo, Japan, 2009; Available online: http://www.nedo.go.jp/library/seika/shosai_201012/20100000001831.html (accessed on 22 June 2017). (In Japanese)
- European Commission Joint Research Centre Institute for Energy and Transport. WELL-to-WHEELS Report Version 3; European Commission Joint Research Centre Institute for Energy and Transport: Ispra, Italy, 2008. [Google Scholar]
- Japan Hydrogen & Fuel Cell Demonstration (JHFC) Project. Report on the 4th JHFC Seminar; Japan Hydrogen & Fuel Cell Demonstration (JHFC): Tokyo, Japan, 2005. (In Japanese) [Google Scholar]
- Kawasaki Heavy Industries. Feasibility Study to Realize a Future Energy System (Hydrogen Supply Chain) Using Carbon-Free Fuel Derived from Low Rank Coal (FY2012–2013); Kawasaki Heavy Industries: Tokyo, Japan, 2012. (In Japanese) [Google Scholar]
- Iwatani Corporation Storage, Transport and Handling Technologies of Hydrogen. Available online: http://www.iwatani.co.jp/jpn/h2/tech/technique.html (accessed on 16 April 2017). (In Japanese).
- Taube, M.; Taube, P. A liquid organic carrier of hydrogen as a fuel for automobiles. In Hydrogen Energy Progress, Proceedings of the Third World Hydrogen Energy Conference, Tokyo, Japan, 23–26 June 1980; Veziroglu, T.-N., Fueki, K., Ohta, T., Eds.; Pergamon Press: Oxford, UK; New York, NY, USA, 1981; pp. 1077–1085. Available online: http://www.iaea.org/inis/collection/NCLCollectionStore/_Public/13/652/13652276.pdf (accessed on 22 June 2017).
- Taube, M.; Rippin, D.W.T.; Cresswell, D.L.; Knecht, W. A system of hydrogen-powered vehicles with liquid organic hydrides. Int. J. Hydrogen Energy 1983, 8, 213–225. [Google Scholar] [CrossRef]
- Taube, M.; Rippin, D.; Knecht, W.; Hakimifard, D.; Milisavljevic, B.; Gruenenfelder, N. A prototype truck powered by hydrogen from organic liquid hydrides. Int. J. Hydrogen Energy 1985, 10, 595–599. [Google Scholar] [CrossRef]
- Grünenfelder, N.F.; Schucan, T.H. Seasonal storage of hydrogen in liquid organic hydrides: Description of the second prototype vehicle. Int. J. Hydrogen Energy 1989, 14, 579–586. [Google Scholar] [CrossRef]
- Kato, Y.; Koyama, M.; Fukushima, Y.; Nakagaki, T. Energy Technology Roadmaps of Japan: Future Energy Systems Based on Feasible Technologies beyond 2030; Springer Japan: Tokyo, Japan, 2016. [Google Scholar]
- Shukla, A.A.; Gosavi, P.V.; Pande, J.V.; Kumar, V.P.; Chary, K.V.R.; Biniwale, R.B. Efficient hydrogen supply through catalytic dehydrogenation of methylcyclohexane over Pt/metal oxide catalysts. Int. J. Hydrogen Energy 2010, 35, 4020–4026. [Google Scholar] [CrossRef]
- Zhang, C.; Liang, X.; Liu, S. Hydrogen Production by Catalytic Dehydrogenation of Methylcyclohexane over Pt. Catalysts Supported on Pyrolytic Waste Tire Char. Int. J. Hydrogen Energy 2011, 36, 8902–8907. [Google Scholar] [CrossRef]
- Shukla, A.; Pande, J.V.; Biniwale, R.B. Dehydrogenation of methylcyclohexane over Pt/V2O5 and Pt/Y2O3 for hydrogen delivery applications. Int. J. Hydrogen Energy 2012, 37, 3350–3357. [Google Scholar] [CrossRef]
- Ali, J.K.; Baiker, A. Dehydrogenation of methylcyclohexane to toluene in a pilot-scale membrane reactor. Appl. Catal. A Gen. 1997, 155, 41–57. [Google Scholar] [CrossRef]
- Ali, J.K.; Newson, E.J.; Rippin, D.W.T. Exceeding equilibrium conversion with a catalytic membrane reactor for the dehydrogenation of methylcyclohexane. Chem. Eng. Sci. 1994, 49, 2129–2134. [Google Scholar] [CrossRef]
- Hatim, M.D.I.; Fazara, M.A.U.; Syarhabil, A.M.; Riduwan, F. Catalytic Dehydrogenation of Methylcyclohexane (MCH) to Toluene in a Palladium/Alumina Hollow Fibre Membrane Reactor. Procedia Eng. 2013, 53, 71–80. [Google Scholar] [CrossRef]
- Coughlan, B.; Keane, M.A. The catalytic dehydrogenation of cyclohexane and methylcyclohexane over nickel loaded Y zeolites. Catal. Lett. 1990, 5, 89–100. [Google Scholar] [CrossRef]
- Yolcular, S.; Olgun, Ö. Ni/Al2O3 catalysts and their activity in dehydrogenation of methylcyclohexane for hydrogen production. Catal. Today 2008, 138, 198–202. [Google Scholar] [CrossRef]
- Hondo, H.; Morizumi, Y.; Usui, T. Life Cycle Environmental Analysis of Hydrogen Storage Technology Using Organic Hydride: Energy Requirement and CO2 Emission. J. Jpn. Inst. Energy 2008, 87, 753–762. (In Japanese) [Google Scholar] [CrossRef]
- Japan Petroleum Energy Center (JPEC). Development of Component Technologies for Off-Site Hydrogen Supply Using Organic Hydrides; Japan Petroleum Energy Center (JPEC): Tokyo, Japan, 2008. [Google Scholar]
- General Motors; L-B-Systemtechnik GmbH; BP; ExxonMobil; TotalFinaElf. Well-to-Wheel Analysis of Energy Use and Greenhouse Gas Emissions of Advanced Fuel/Vehicle Systems—A European Study; L-B-Systemtechnik GmbH: Ottobrunn, Germany, 2002; Available online: https://www.netinform.de/GW/files/pdf/Euro-WTW_Annex.pdf (accessed on 22 June 2017).
- Azuma, T. Natural gas supporting hydrogen energy society. Pet. Nat. Gas Rev. 2005, 39, 37–46. (In Japanese) [Google Scholar]
- Ramsden, T.; Ruth, M.; Diakov, V.; Laffen, M.; Timbario, T.A. Hydrogen Pathways Updated Cost, Well-To-Wheels Energy Use, and Emissions for the Current Technology Status of Ten Hydrogen Production, Delivery, and Distribution Scenarios; National Renewable Energy Labaratory: Golden, CO, USA, 2013. [Google Scholar]
- Japan Petroleum Energy Center (JPEC). Report on Life Cycle Inventory Data of Transportation Fuel; Japan Petroleum Energy Center (JPEC): Tokyo, Japan, 2002. (In Japanese) [Google Scholar]
- Weidema, B.P.; Wesnæs, M.S. Data quality management for life cycle inventories—An example of using data quality indicators. J. Clean. Prod. 1996, 4, 167–174. [Google Scholar] [CrossRef]
- Meier, M.A. Eco-Efficiency Evaluation of Waste Gas Purification Systems in the Chemical Industry. Ph.D. Disseration, Swiss Federal Institute of Technology in Zurich (ETH Zurich), Zürich, Switzerland, 1997. [Google Scholar]
- Oracle. Oracle Crystal Ball. Available online: http://www.oracle.com/us/products/applications/crystalball/overview/index.html (accessed on 11 May 2017).
- Morgan, M.G.; Henrion, M.; Small, M. Uncertainty: A Guide to Dealing with Uncertainty in Quantitative Risk and Policy Analysis; Cambridge University Press: Cambridge, UK, 1992. [Google Scholar]
- Quack, H. Conceptual design of a high efficiency large capacity hydrogen liquefier. AIP Conf. Proc. 2002, 613, 255–263. [Google Scholar]
- Valenti, G.; Macchi, E. Proposal of an innovative, high-efficiency, large-scale hydrogen liquefier. Int. J. Hydrogen Energy 2008, 33, 3116–3121. [Google Scholar] [CrossRef]
- Kuendig, A.; Loehlein, K.; Kramer, G.J.; Huijsmans, J. Large scale hydrogen liquefaction in combination with LNG re-gasification. In Proceedings of the 16th World Hydrogen Energy Conference, Lyon, France, 13–16 June 2006; pp. 1–8. [Google Scholar]
- Carmo, M.; Fritz, D.L.; Mergel, J.; Stolten, D. A comprehensive review on PEM water electrolysis. Int. J. Hydrogen Energy 2013, 38, 4901–4934. [Google Scholar] [CrossRef]
- Zeng, K.; Zhang, D. Recent progress in alkaline water electrolysis for hydrogen production and applications. Prog. Energy Combust. Sci. 2010, 36, 307–326. [Google Scholar] [CrossRef]
- Cresswell, D.L.; Metcalfe, I.S. Energy integration strategies for solid oxide fuel cell systems. Solid State Ion. 2006, 177, 1905–1910. [Google Scholar] [CrossRef]
- Alhumaidan, F.; Cresswell, D.; Garforth, A. Hydrogen Storage in Liquid Organic Hydride: Producing Hydrogen Catalytically from Methylcyclohexane. Energy Fuels 2011, 25, 4217–4234. [Google Scholar] [CrossRef]
- Akamatsu, K.; Nakao, S. Development of Membrane Reactors for Dehydrogenating Organic Chemical Hydrides to Supply High-purity Hydrogen. J. Jpn. Pet. Inst. 2011, 54, 287–297. [Google Scholar] [CrossRef]
- Chaouki, J.; Klvana, D. Influence of the deactivation of an industrial Pt-Sn/Al2O3 catalyst on the performance of the dehydrogenation reactor. Chem. Eng. Sci. 1994, 49, 4639–4646. [Google Scholar] [CrossRef]
- Hodoshima, S.; Shono, A.; Saito, Y. Chemical Recuperation of Low-Quality Waste Heats by Catalytic Dehydrogenation of Organic Chemical Hydrides and Its Exergy Analysis. Energy Fuels 2008, 22, 2559–2569. [Google Scholar] [CrossRef]
Figure 1.
Process flow charts showing stages within the life cycle inventory (LCI) system boundary.

Figure 2.
Data structure of Inventory Database for Environmental Analysis (IDEA) [57].
Figure 2.
Data structure of Inventory Database for Environmental Analysis (IDEA) [57].

Figure 3.
Renewable hydrogen supply chain using LH2. Only renewable electricity was used for hydrogen production (expressed in green font). For electricity inputs for production and storage of liquid hydrogen (red font), the base cases assumed the input was equal to grid electricity. However, for the Australian low-carbon cases, the same renewable electricity input was assumed as that used for hydrogen production.

Figure 4.
Renewable hydrogen supply chain using MCH. Only renewable electricity was used for hydrogen production (expressed in green font). For electricity inputs for production and storage of MCH and TOL (red font), the base cases assumed the input was equal to grid electricity. However, for the Australian low-carbon cases, the same renewable electricity input was assumed as that used for hydrogen production.

Figure 5.
Supply chain for hydrogen production by NG reforming.

Figure 6.
Mean WtT GHG emissions for renewable hydrogen supply chains using LH2 as the hydrogen carrier.
Figure 6.
Mean WtT GHG emissions for renewable hydrogen supply chains using LH2 as the hydrogen carrier.

Figure 7.
Mean WtT GHG emissions from the renewable hydrogen supply chains that use MCH as the hydrogen carrier.
Figure 7.
Mean WtT GHG emissions from the renewable hydrogen supply chains that use MCH as the hydrogen carrier.

Figure 8.
Uncertainty analysis results for WtT GHG emissions from renewable and NG reforming hydrogen supply chains. Bar graphs show the mean values; error bars represent the 95% confidence interval. Probability histograms of the WtT GHG emissions obtained by Monte Carlo simulation are shown in Appendix B.

Figure 9.
GHG hotspots in the hydrogen supply chains, and associated developments that could decrease GHG emissions.
Figure 9.
GHG hotspots in the hydrogen supply chains, and associated developments that could decrease GHG emissions.

Table 1.
The base and low-carbon cases.
| Case | Description |
|---|---|
| Base Case | Electricity for hydrogen production via water electrolysis was supplied with renewable electricity, while the electricity used in the other Australian processes was supplied by Australian grid electricity. |
| Low-Carbon Case | Electricity used in all the Australian processes was supplied with the same renewable electricity as water electrolysis. |
Table 2.
Specifications of wind and solar PV power plants used in the model.
| Parameter | Wind | Solar PV |
|---|---|---|
| Capacity (MW) | 40 | 10 |
| Load factor (%) | 35 | 18 |
| Auxiliary power ratio (%) | 10 | 3 |
| Amount of electricity generated (MWh/year) | 122,640 | 14,532 |
| Life time (year) | 30 | 30 |
Table 3.
Calculated life cycle GHG emissions for wind and solar PV power generation (g-CO2eq./kWh).
| Hydrogen-Producing Country | Wind | Solar PV |
|---|---|---|
| Australia | 15.3 | 66.4 |
| Norway | 10.8 | n/a |
© 2017 by the authors. Licensee MDPI, Basel, Switzerland. This article is an open access article distributed under the terms and conditions of the Creative Commons Attribution (CC BY) license (http://creativecommons.org/licenses/by/4.0/).
Share and Cite
MDPI and ACS Style
Ozawa, A.; Inoue, M.; Kitagawa, N.; Muramatsu, R.; Anzai, Y.; Genchi, Y.; Kudoh, Y. Assessing Uncertainties of Well-To-Tank Greenhouse Gas Emissions from Hydrogen Supply Chains. Sustainability 2017, 9, 1101. https://doi.org/10.3390/su9071101
AMA Style
Ozawa A, Inoue M, Kitagawa N, Muramatsu R, Anzai Y, Genchi Y, Kudoh Y. Assessing Uncertainties of Well-To-Tank Greenhouse Gas Emissions from Hydrogen Supply Chains. Sustainability. 2017; 9(7):1101. https://doi.org/10.3390/su9071101
Chicago/Turabian StyleOzawa, Akito, Mai Inoue, Naomi Kitagawa, Ryoji Muramatsu, Yurie Anzai, Yutaka Genchi, and Yuki Kudoh. 2017. "Assessing Uncertainties of Well-To-Tank Greenhouse Gas Emissions from Hydrogen Supply Chains" Sustainability 9, no. 7: 1101. https://doi.org/10.3390/su9071101
Note that from the first issue of 2016, this journal uses article numbers instead of page numbers. See further details here.