Performance Analysis of an Integrated Heat Pump with Air-Conditioning System for the Existing Hospital Building Application

1
Department of Mechanical and Electro-mechanical Engineering, National Sun Yat-Sen University, Kaohsiung 804, Taiwan
2
Research Center for Energy Technology and Strategy, National Cheng Kung University, Tainan 701, Taiwan
*
Author to whom correspondence should be addressed.
Sustainability 2017, 9(4), 530; https://doi.org/10.3390/su9040530
Submission received: 21 February 2017
/
Revised: 18 March 2017
/
Accepted: 28 March 2017
/
Published: 30 March 2017
(This article belongs to the Section Energy Sustainability)
Abstract
:In this study, a complete evaluation procedure of energy-saving and efficiency improvement for a large-scale hospital retrofit project has been established and successfully validated in Taiwan. The retrofit scheme, in integrating the alternative hot water system, namely, a water source heat pump (WSHP), with the existing HVAC (Heating, Ventilating, and Air-Conditioning) system, enables the capability to meet the cooling and hot water demand simultaneously with a larger safety margin as well as saving energy. In addition, it has been found that the integrated system provides a new source for cooling which can be utilized as a system redundancy in avoiding system shutdown. This is very useful when considering in specific areas in the hospital, such as intensive care unit, or operation rooms, where cooling should not be interrupted on any occasion. In this study, it is validated that the coefficient of performance (COP) of the newly added WSHP system, under heating and cooling mode, is 3.62 and 2.62, respectively. The recorded annual cost reduction by this integrated system is $102,564, with a payback of 1.2 years. The hospital after retrofit has been operating safer, with more redundancy, and more energy-efficient which warrants tremendous potential for implementation in the industry.
1. Introduction
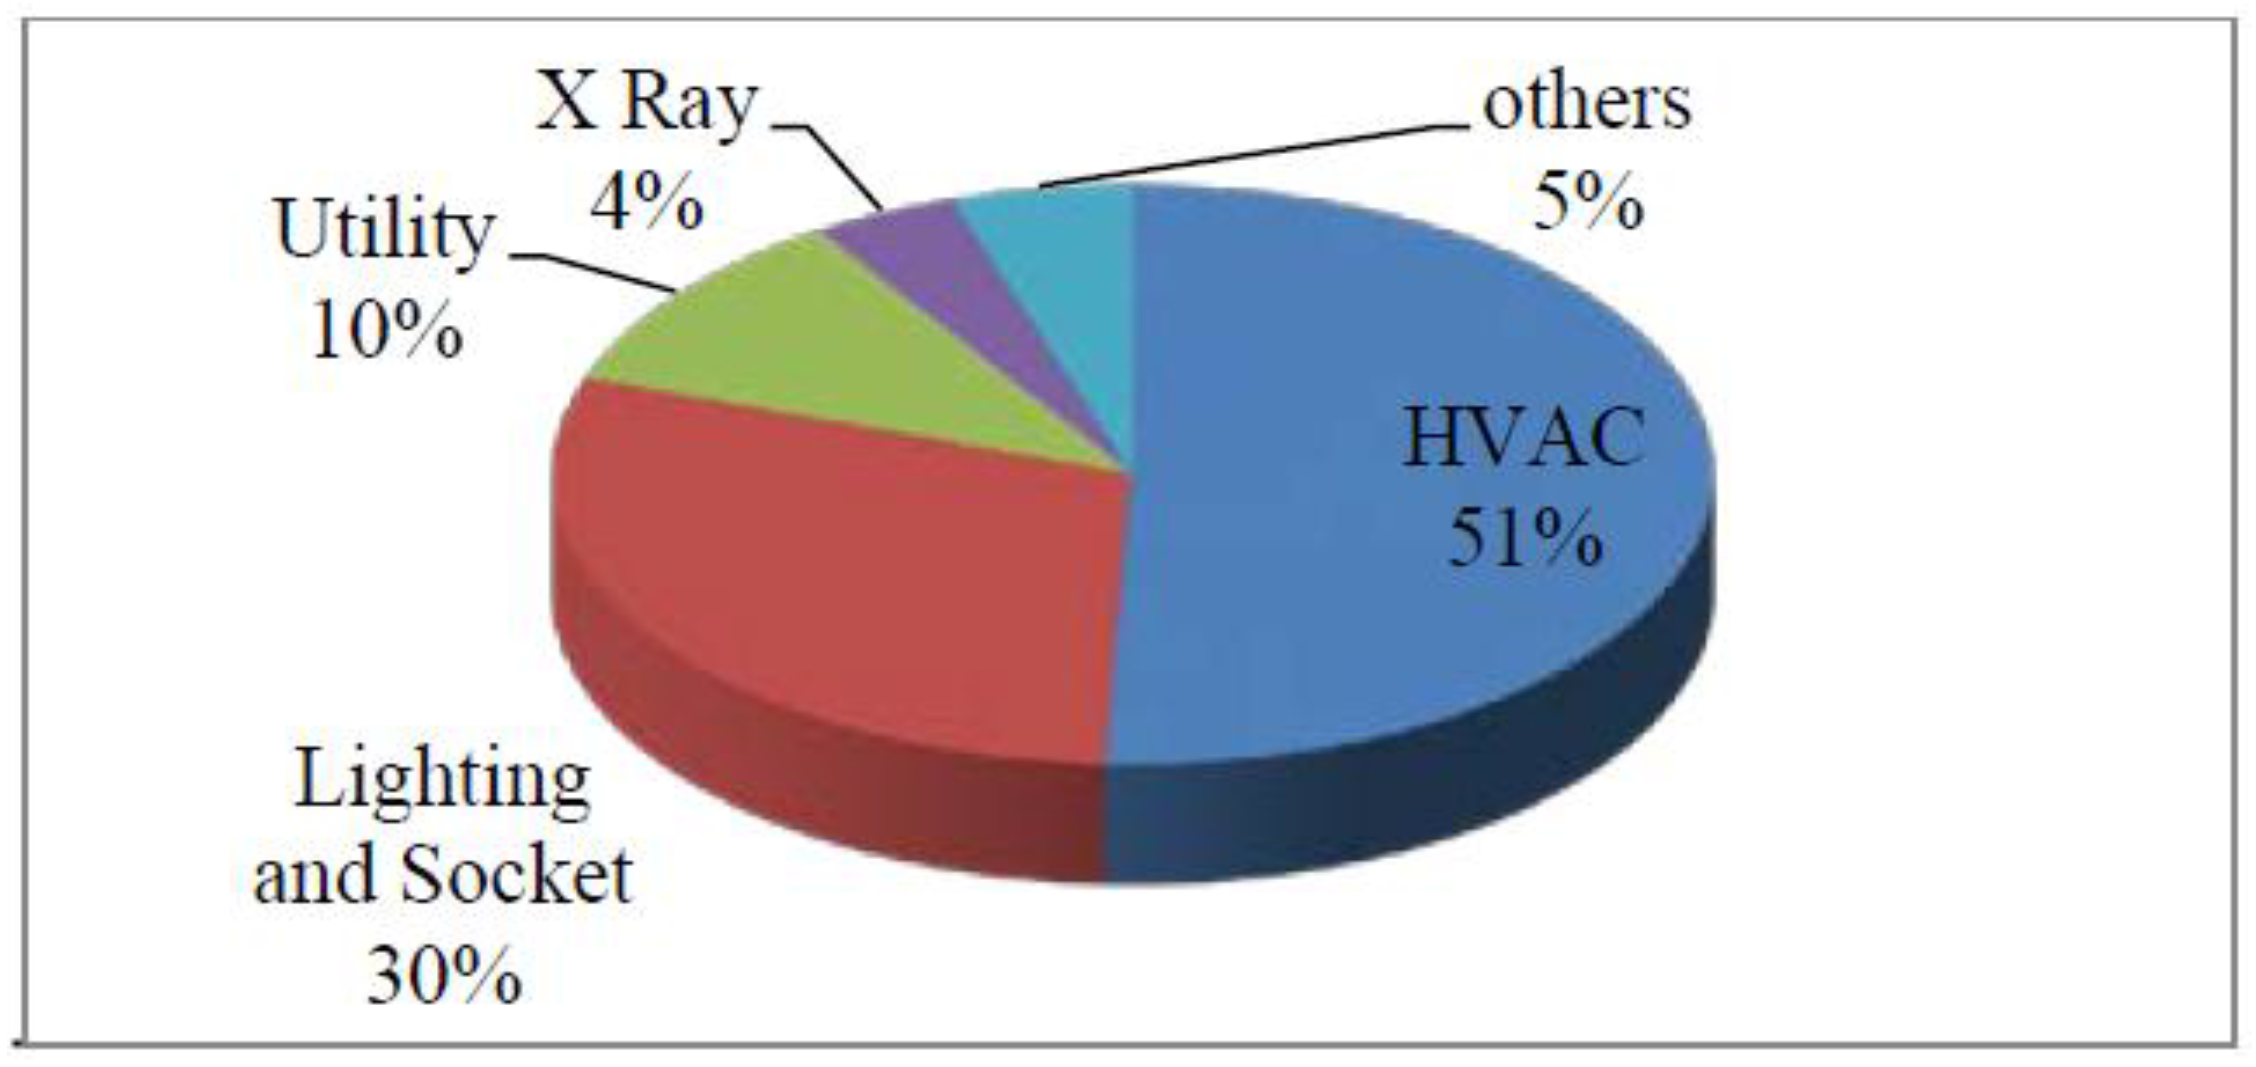
Hospitals are enormously complex buildings with many unique requirements. Architects and owners of the hospitals often overlook energy usage because they are so focused on meeting the hospital’s numerous other requirements. The power consumption distribution of the facility system in a typical hospital shown in Figure 1 indicated that the heating, ventilation, and air conditioning (HVAC) system was the highest power-consuming unit. As shown in Figure 2 [1], the use of wash and dry contribute 58% of total fuel consumption; heating and kitchen use contribute 23%, and the use of shower contribute 17% of total fuel consumption. In the study of Bonnema et al. [2], a comparison of energy use intensities of the hospitals across all U.S. climate zones showed that the energy saving has the better potential in the marine climates than in the climates of cold or dry. The eleven energy design measures were conducted while the heat pumps shared a common condenser loop whose temperature was maintained though the use of a chiller and boiler and attained 50% energy savings in their study.
In general, air-conditioning and hot water system operate 24 h a day year round in the hospital simultaneously. The water-source heat pump (WSHP) can provide an alternative to replace the existing boiler system for heating while providing partial cooling capacity in a hospital. A heat pump is a device transferring heat efficiently from low temperatures to high temperatures at the cost of electrical power consumption. The amount of energy in the heat discharged from a heat pump can be several times larger than the power consumed in driving its compressor. The sources of heat pump systems can extract from air, water or ground. The coefficient of performance (COP) of a heat pump system depends on the design and the quality of installation: from as low as 2.0 for the air source heat pump (ASHP) system in unfavorable conditions, up to around 3.0 for a typical water source heat pump.
Shen et al. [3] analyzed a heat pump system application in a hospital. The result suggested that the centralized cooling/heating system has to make a reasonable installation and configuration because it only occupied a specific space of the hospital. The heating and cooling energy supply should be reorganized for the whole buildings to achieve the goal of energy saving. Shih et al. [4] conducted a case study about the energy efficiency of their hot water supply systems, including oil-fired furnaces and boilers, gas-fired furnaces and boilers, electric boilers, etc., of 10 large-scale domestic medical institutions. The evaluation variables included the total cost of investment, the rationality of energy procedure, and the impact on the environment. Cheng et al. [5] conducted a study about the cost and benefit analysis, the usage of the hot water and the expenses of different heating sources by integrating the chiller plant with heat recovery and hot water heat pump system. The result showed that the hot water heat pump is the best heating source. The study also concluded that the great economic benefit achieved while integrating two systems. According to Shen et al. [6], a heat pump system has been set up to replace a natural gas boiler for the supply of hot water in a medium size hospital in central Taiwan. The total capacity of the heat pump is 280 kW. This system was built in 2007 and has been operated since then. According to the study of Sung et al. [7], the conservation rate of the integration of heat pump system is 77% comparing to the original Liquefied Petroleum Gas (LPG) heating system. The payback period is 1.5–2 years when heating the water between 24 °C and 53 °C and the COP under heating mode is 4.8. Cheng [8] conducted a case study of a hospital by investigating its energy consumption. The results showed that the integrated heat pump system has good performance in working with three different energy sources. In the study, the heat pump draws cold water from the air conditioner and provides hot water for hospital use. At the same time, the heat pump operates successfully in providing air conditioning.
From the literature review above, it has been verified that WSHP has a better COP than that of ASHP [9,10,11] in terms of energy, exergy and economic benefits. It is also a better choice to meet hospital heating and cooling load simultaneously. However, the integration of hospitals’ WSHP with an existing HVAC system was still lacking a more detailed technical support, especially a detailed methodology to follow.
It is the main goal of this study to establish an evaluation procedure in implementing a WSHP to integrate with the existing air-conditioning and hot water system, in achieving energy conservation for a hospital complex retrofit project in Taiwan.
2. The Methodology Developed in This Study
2.1. Establishment of an Evaluation Procedure before and after Retrofits of Hospital Building Energy Systems
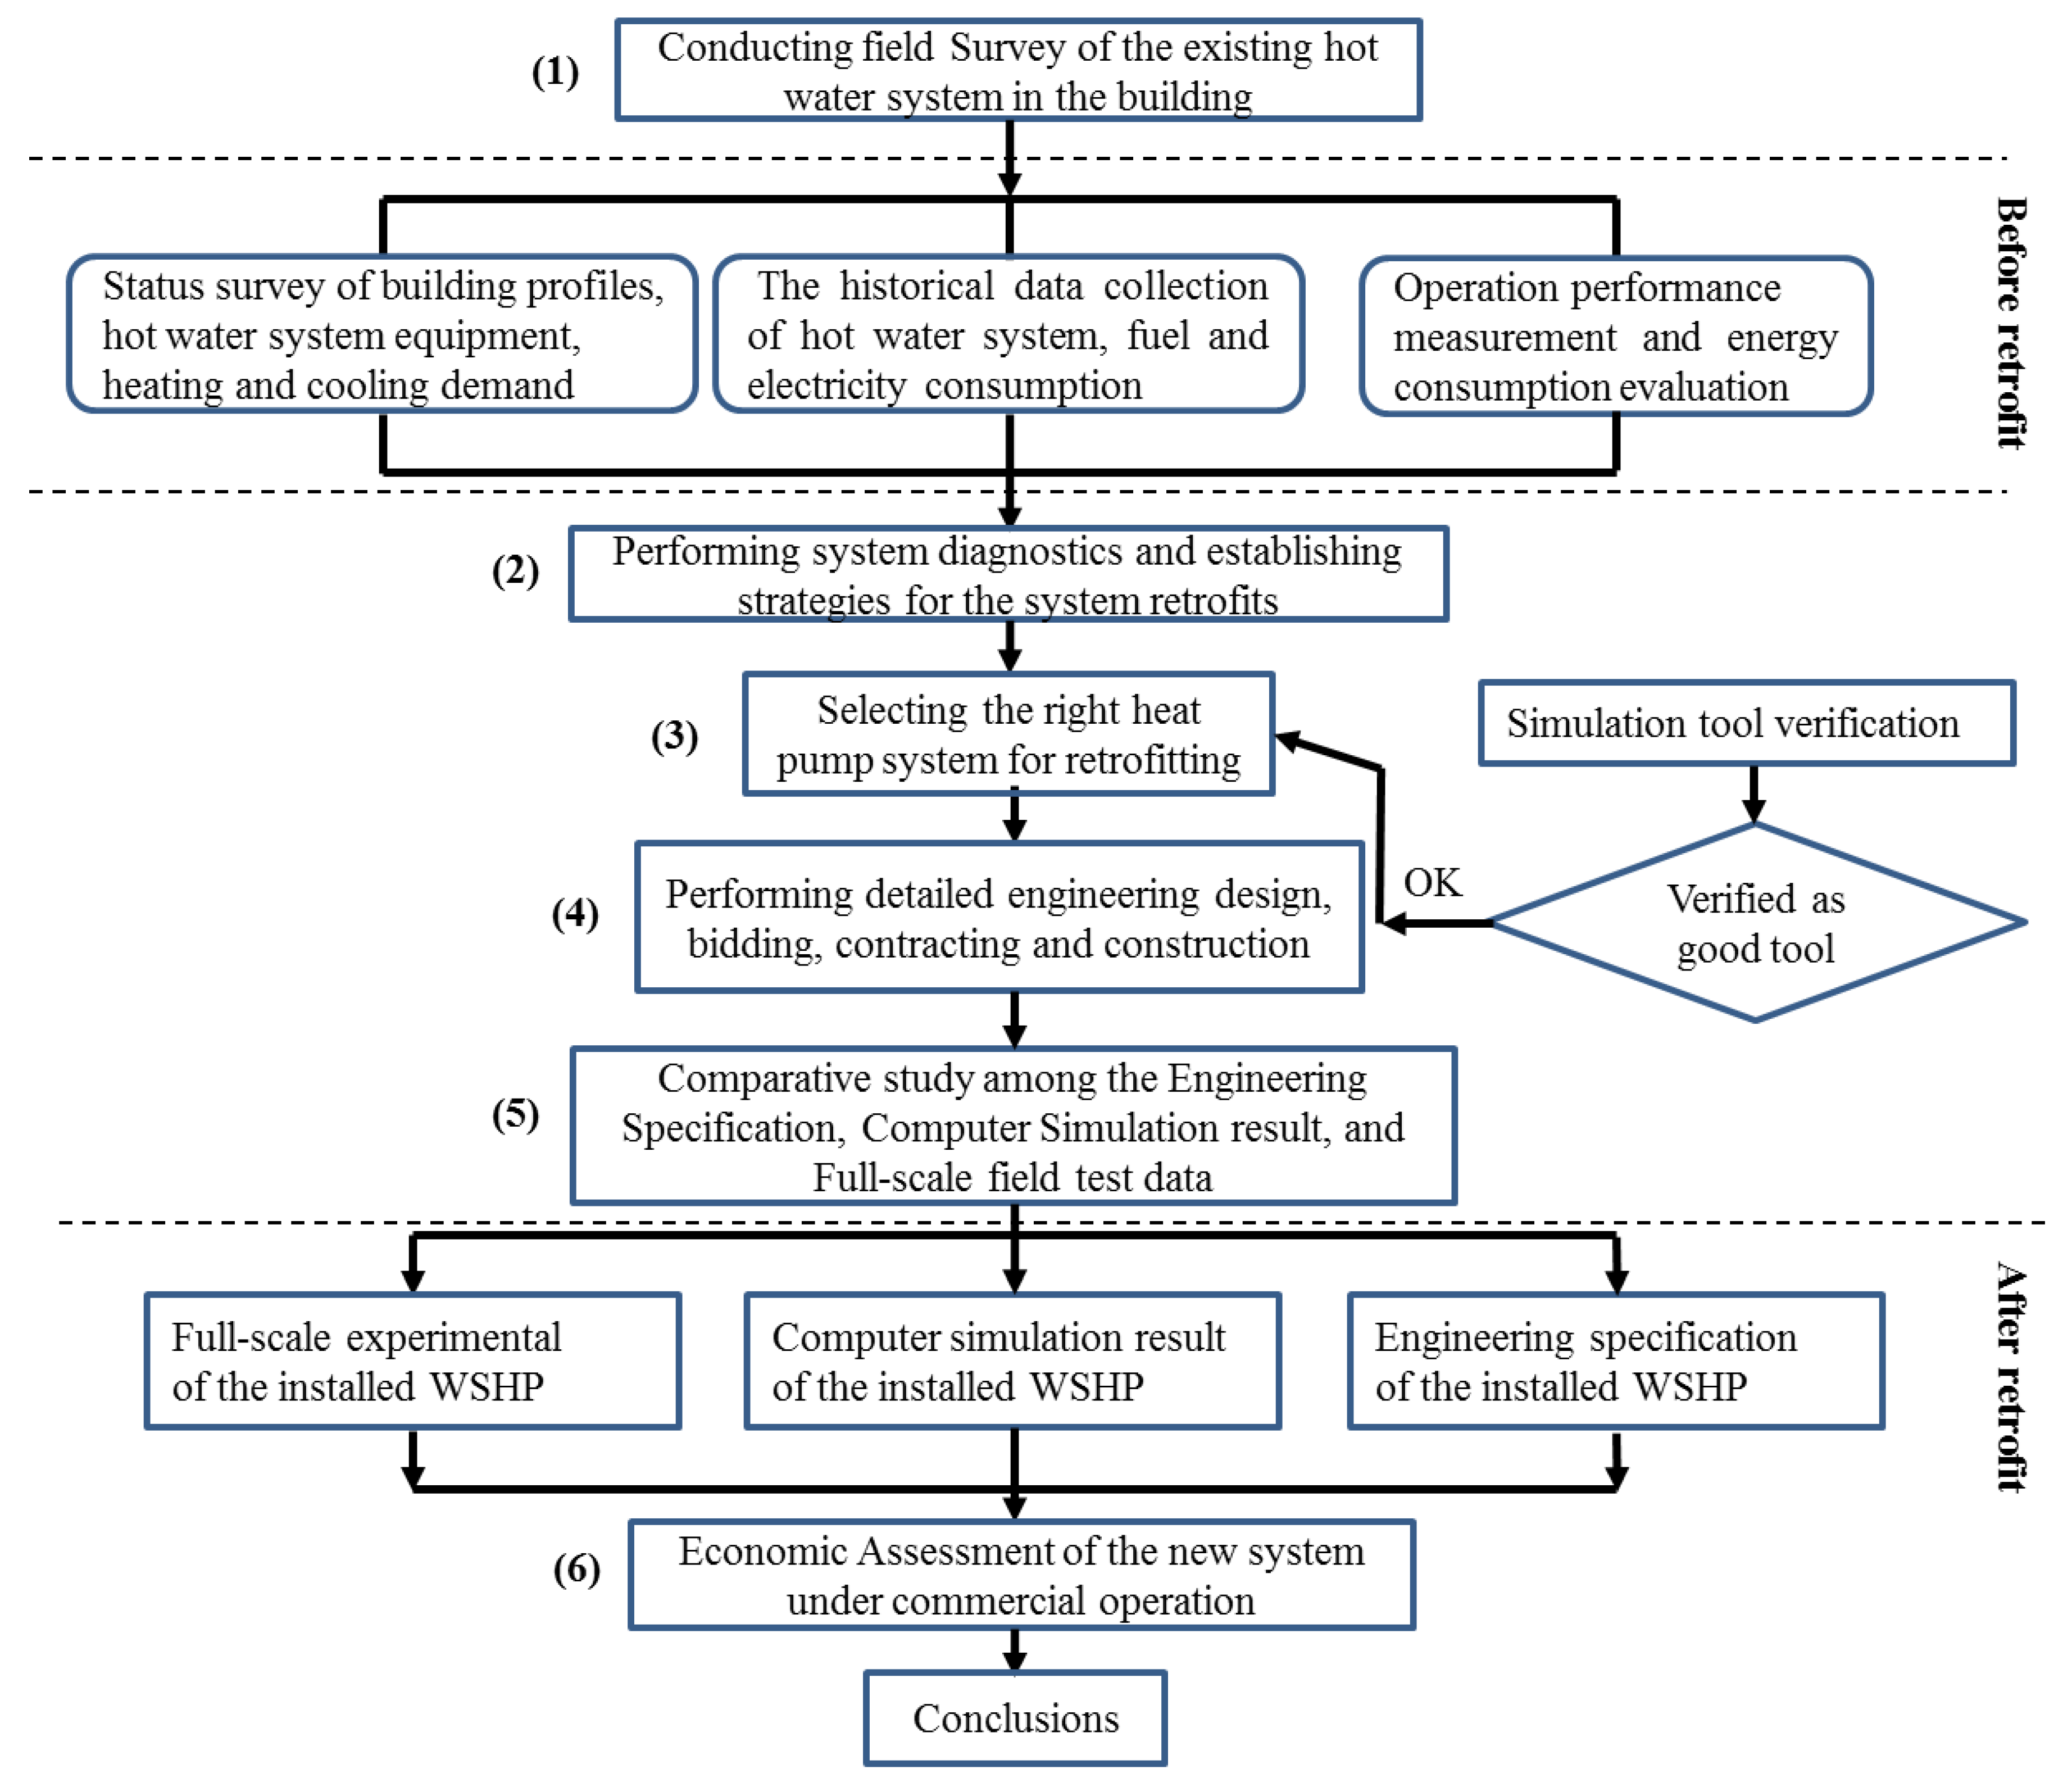
As shown in Figure 3, an evaluation procedure has been conducted according to the following steps:
(1) Conducting field Survey of the existing hot water system in the building
The surveying scope includes the current building energy consumption profile, equipment installed, cooling and heating demand, and the operation data of these systems.
(2) Performing system diagnostics and establishing strategies for the system retrofits
To this end, computer simulation, as a tool, has to be identified and verified first. The manufacturer’s engineering specification of a potential WSHP candidate will be gathered and analyzed. The design parameters stated in the specification, such as condensing and evaporation temperatures and/or pressures, and refrigerant number, will be selected as inputs to the computer simulation software, named Solkane version 8.0 (Solvay Flour Gmbh: Hannover, Germany, 2016), in this project. The computer generated heating and cooling capacity will be compared with the engineering specification data so that percentage of deviations can be identified. This is a crucial step to verify the effectiveness and accuracy that the simulation program could provide in predicting the performance of a WSHP or ASHP.
(3) Selecting the right heat pump system for retrofitting
The computer simulation results will reveal the feasibility of all trial designs to make sure they can cope with the engineering application and are readily available in the industry with reasonable price. System selections with obsolete and unique performance features will be excluded for further consideration.
(4) Performing detailed engineering design, bidding, contracting and construction
After the system design has been finalized, engineering drawings will be completed, signed by a professional engineer and going through the bidding, contracting and construction process, followed by a system TAB (Testing, Adjusting and Balancing) to fine tune its performances.
(5) Comparative study among the engineering specification, computer simulation result, and full-scale field test data
It is an important step to check whether the system installed, which follows the engineering specification, is performing as the computer simulation predicted, through validation using field operation data. If not, a counter-measure would have to be developed to tune-up the system performances.
(6) Economic Assessment of the new system under commercial operation
The new system, supposedly, shall operate more energy-efficiently with much lower power tariff, and will be compared with the original energy cost balance sheet. The tariff savings would then be compared with the capital investment following a simple payback scheme to verify its economic merits and with conclusions drawn.
2.2. Explanation of Present Integrated Design Approaches to a WSHP and an Existing HVAC System
There are further considerations in integrating a WSHP with an existing HVAC system:
- (1)
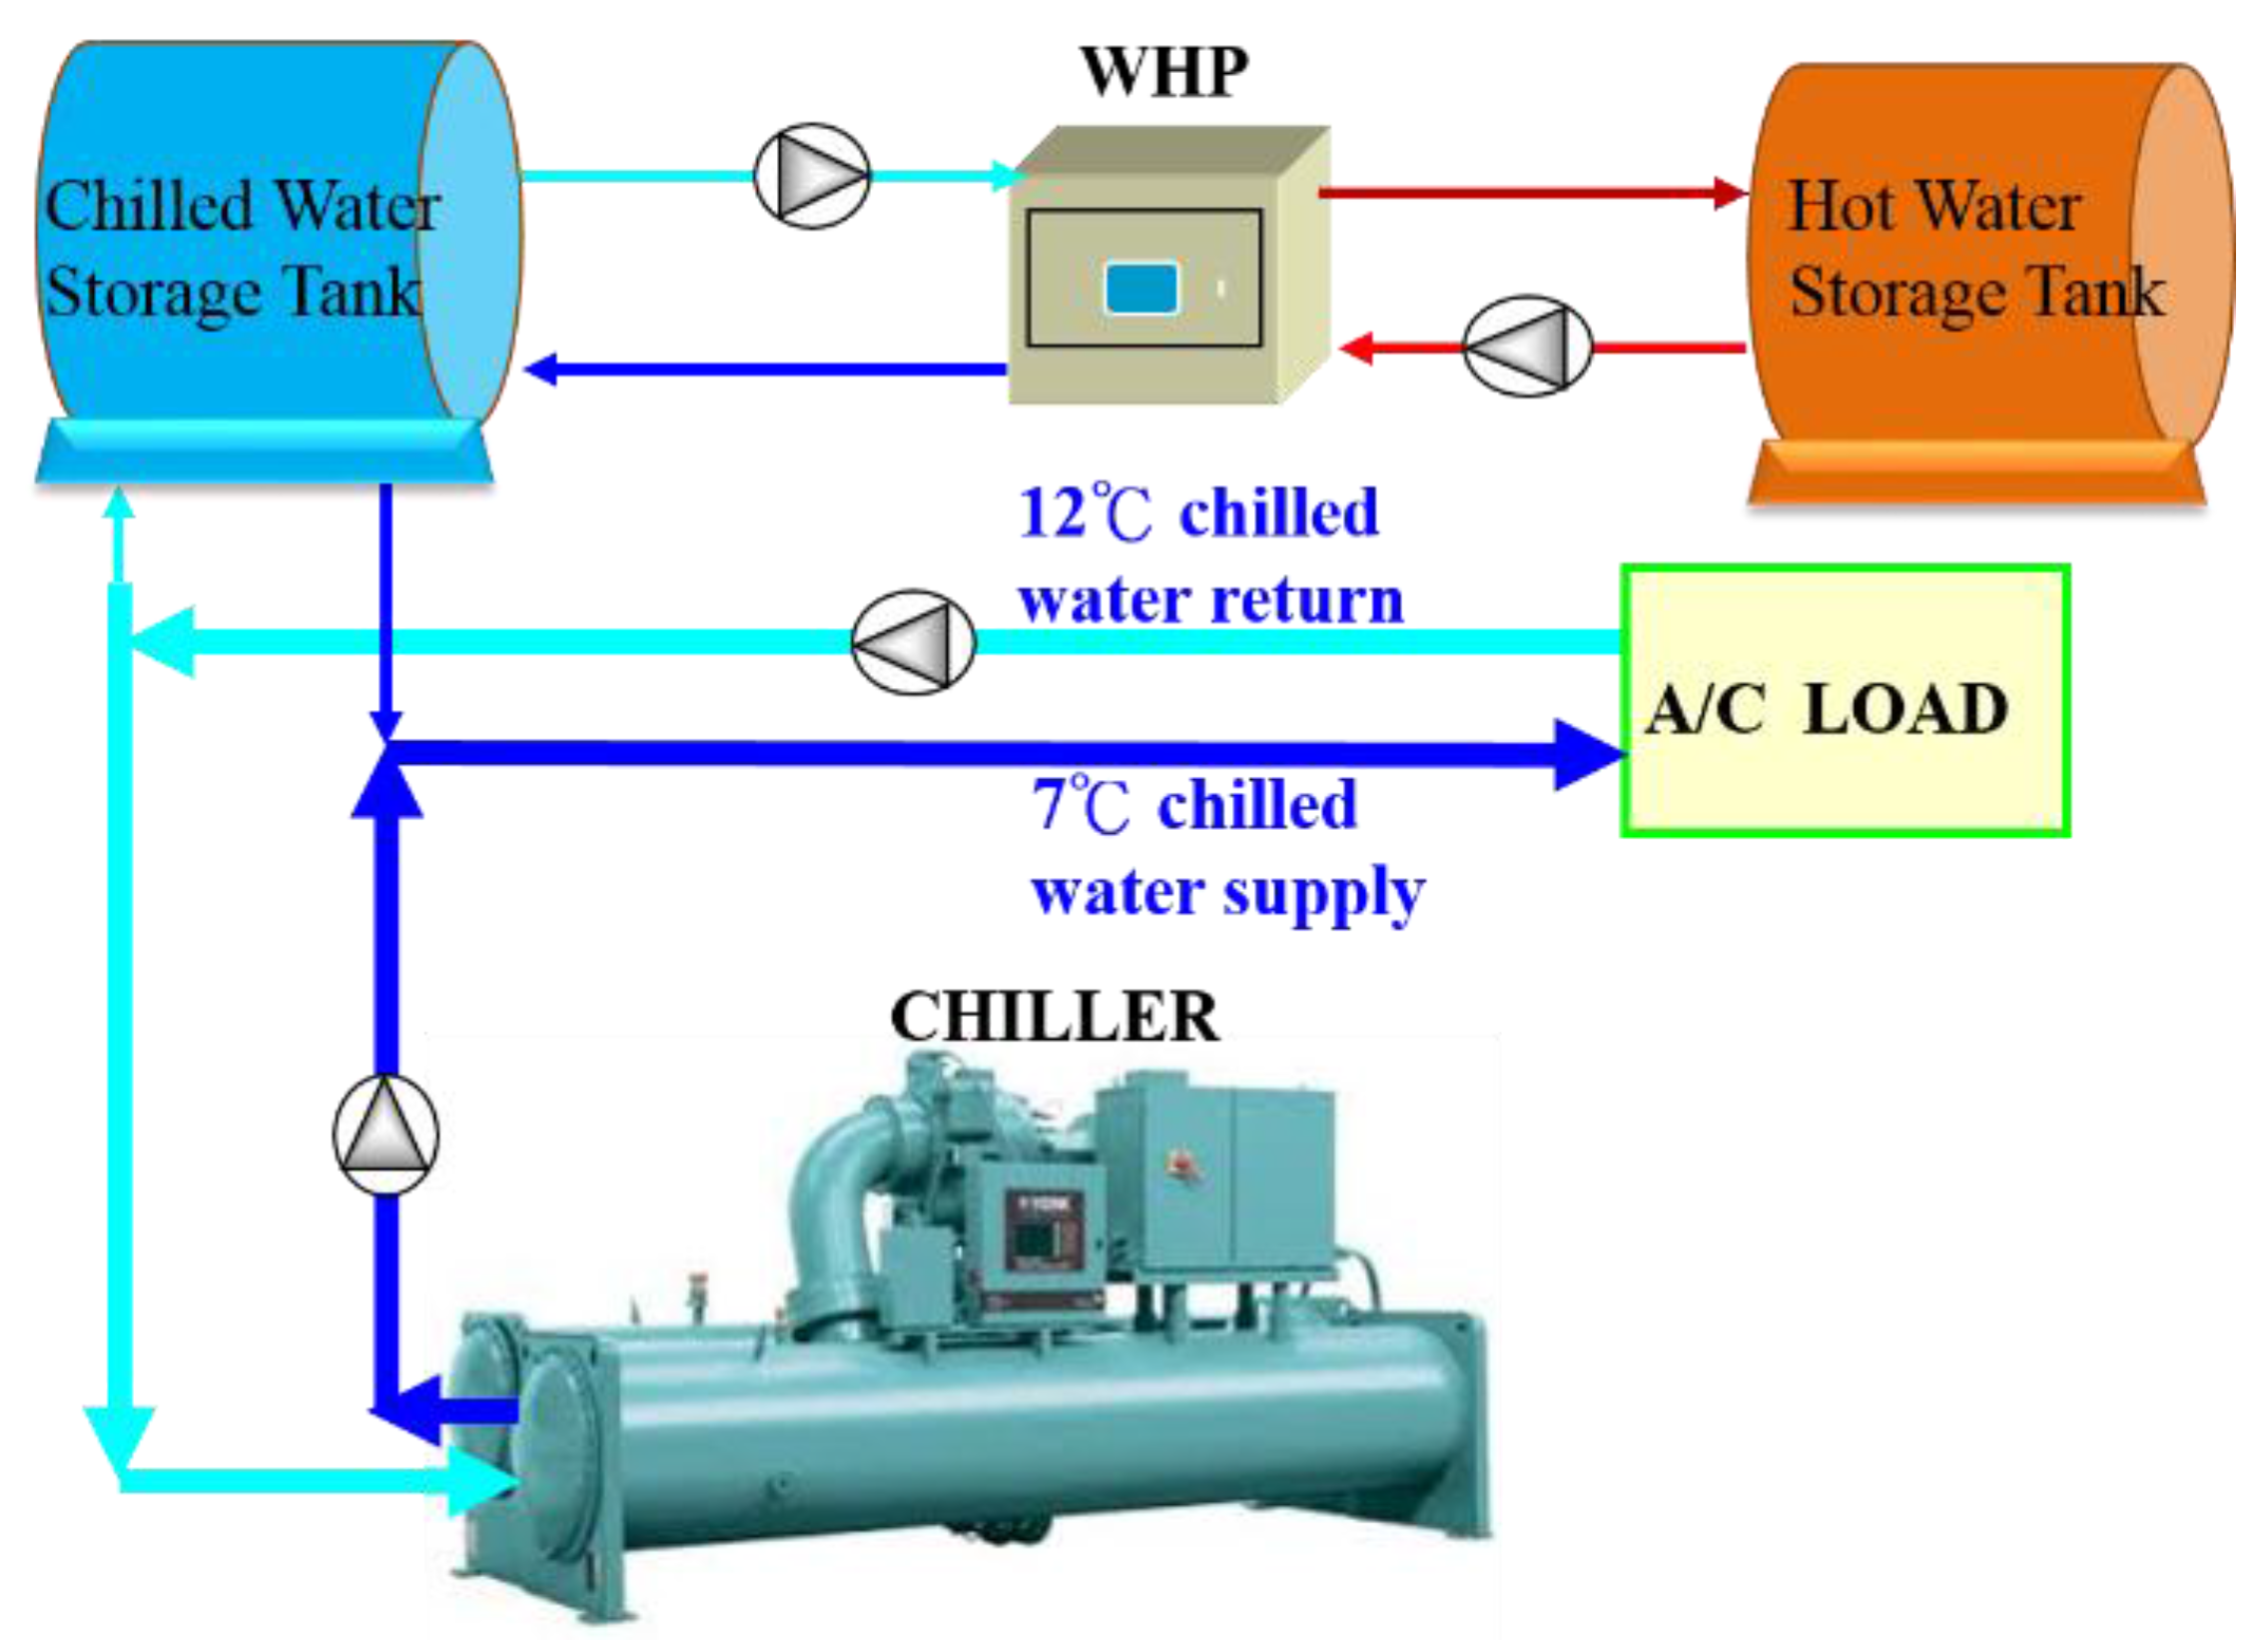
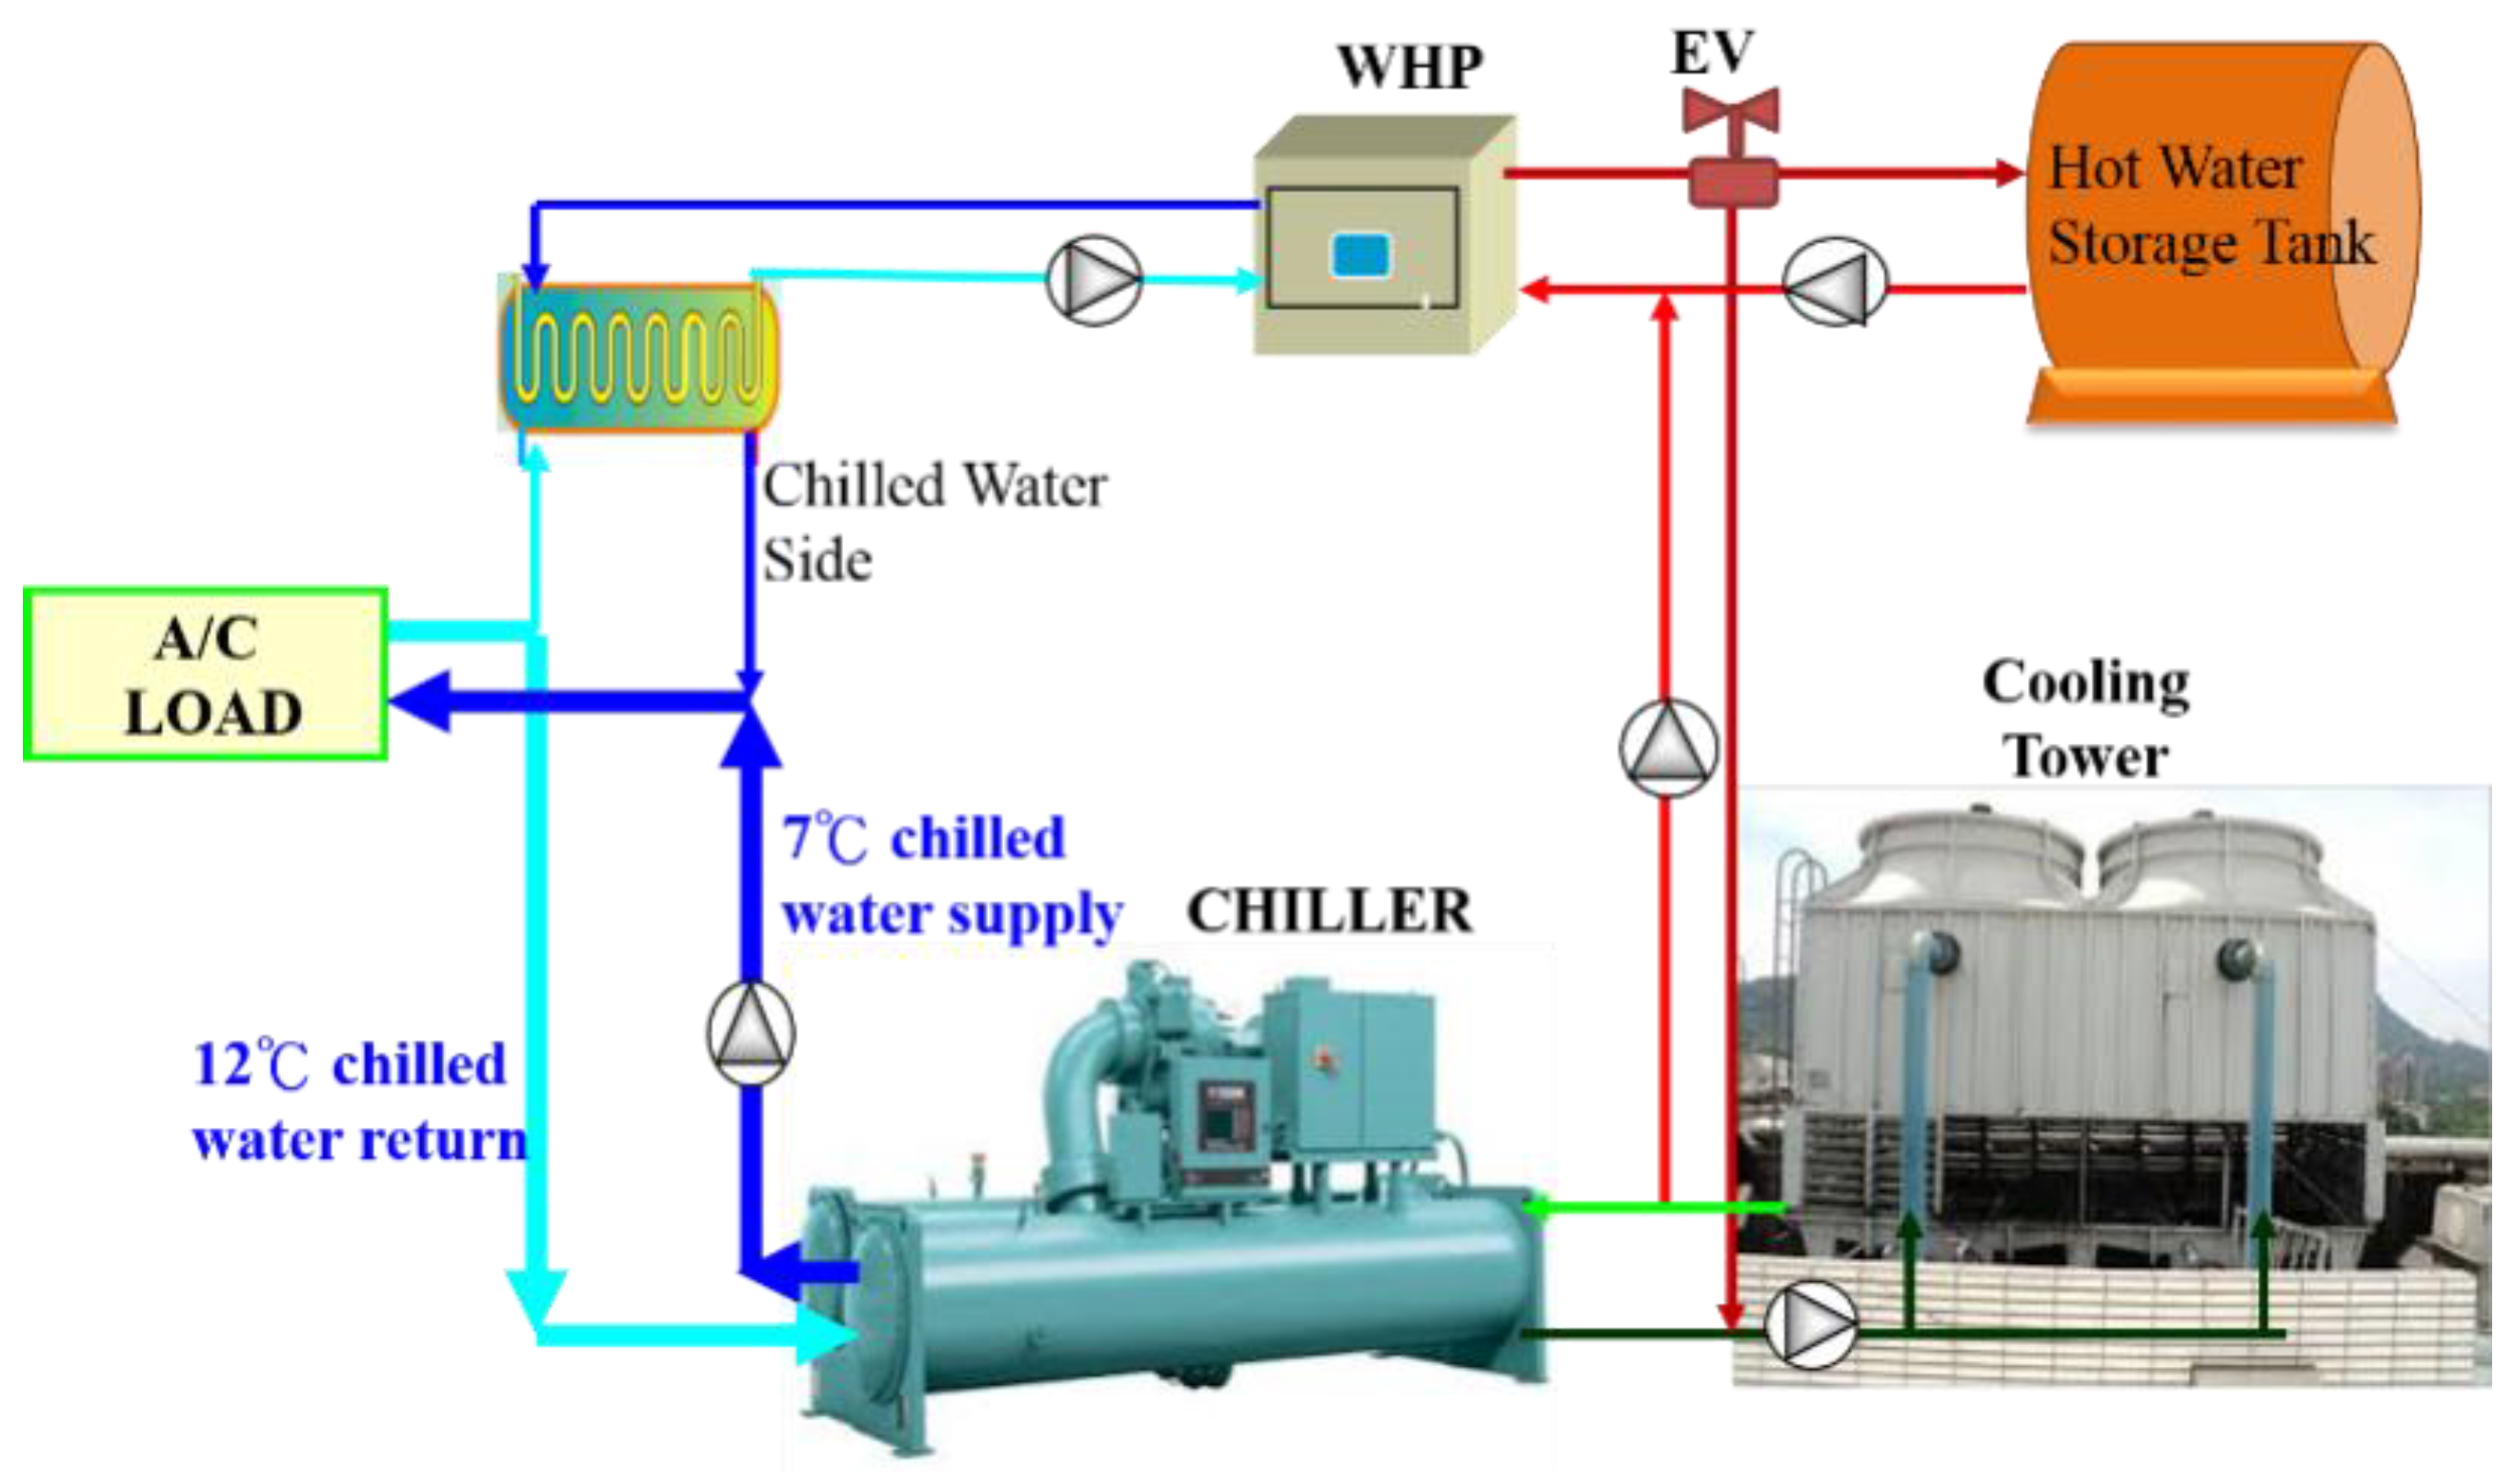
- Figure 4 shows the parallel integration of a chiller and a WSHP with an appropriately-sized chilled water storage tank. The merit is that the cooling capacity generated by the WSHP can be stored continuously in the chilled water storage tank, ensuring a steady heap pump operation. On the contrary, even when the WHSP was shut off temporarily, the HVAC system can work as a chilled water storage system, or use off-peak power to reduce the power tariff.
- (2)
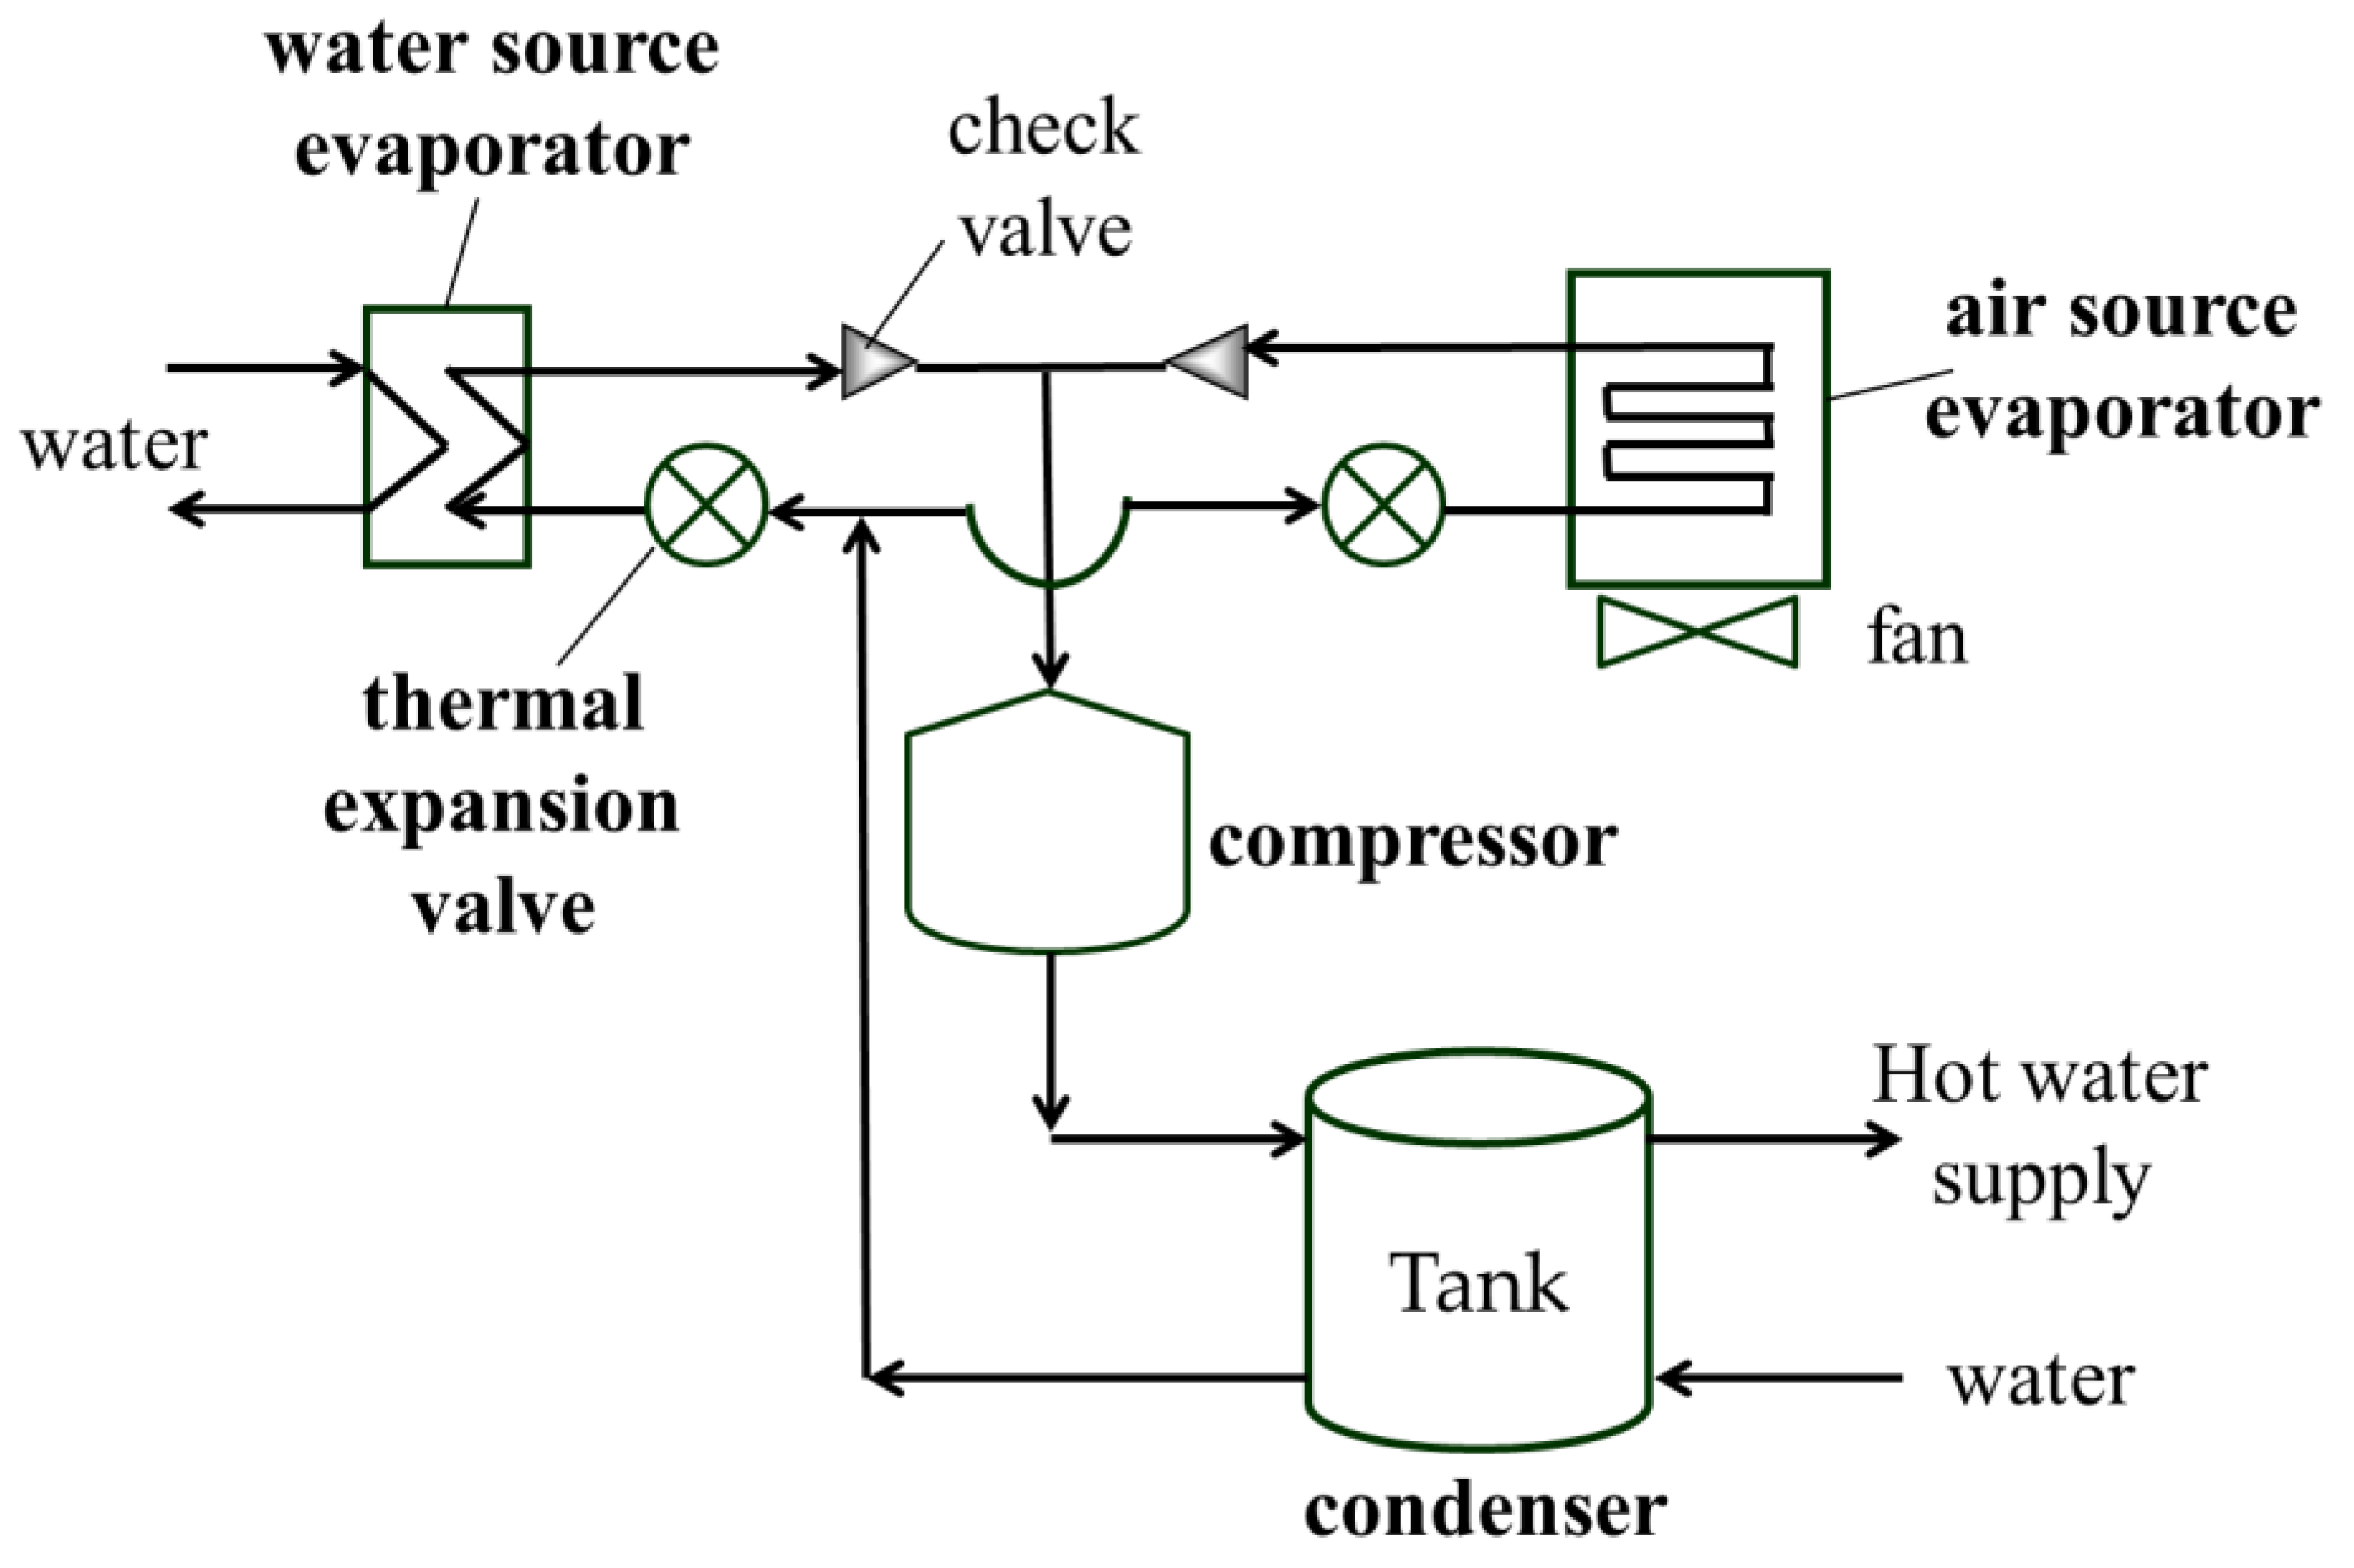
- To meet the seasonal heating and cooling requirements simultaneously, a dual-source heat pump system, using both air and water as energy sources, is a good choice [12]. The evaporator can switch to the air source mode and eject the energy to the ambient when cooling load is lower, as shown in Figure 5. However, the heat pump will suffer from a lower COP under air source mode and the risk of failures may increase because of the frequent switching of the magnetic valves, which could easily become jammed and/or cause leakages, demanding much maintenance work.
- (3)
- Considering that heating is required only in certain periods of time, it could cause a WSHP stop producing chilled water correspondingly. This happens instantly when the hot water storage tank has reached the temperature settings. In this case, a parallel arrangement of dual condensers, one for heat generation and one for heat rejection, as shown in Figure 6, is helpful. When the heat pump system operates in the cooling mode without significant heating demand, it can be operated as a water-cooled chiller. Heat is ejected to the cooling tower by integrating the WSHP cooling water piping system with a water-cooled chiller. In this case, the WSHP continuously generates chilled water for cooling, even though the hospital has a lower cooling load [7].
2.3. Verifying the Simulation Tool, the Solkane Program
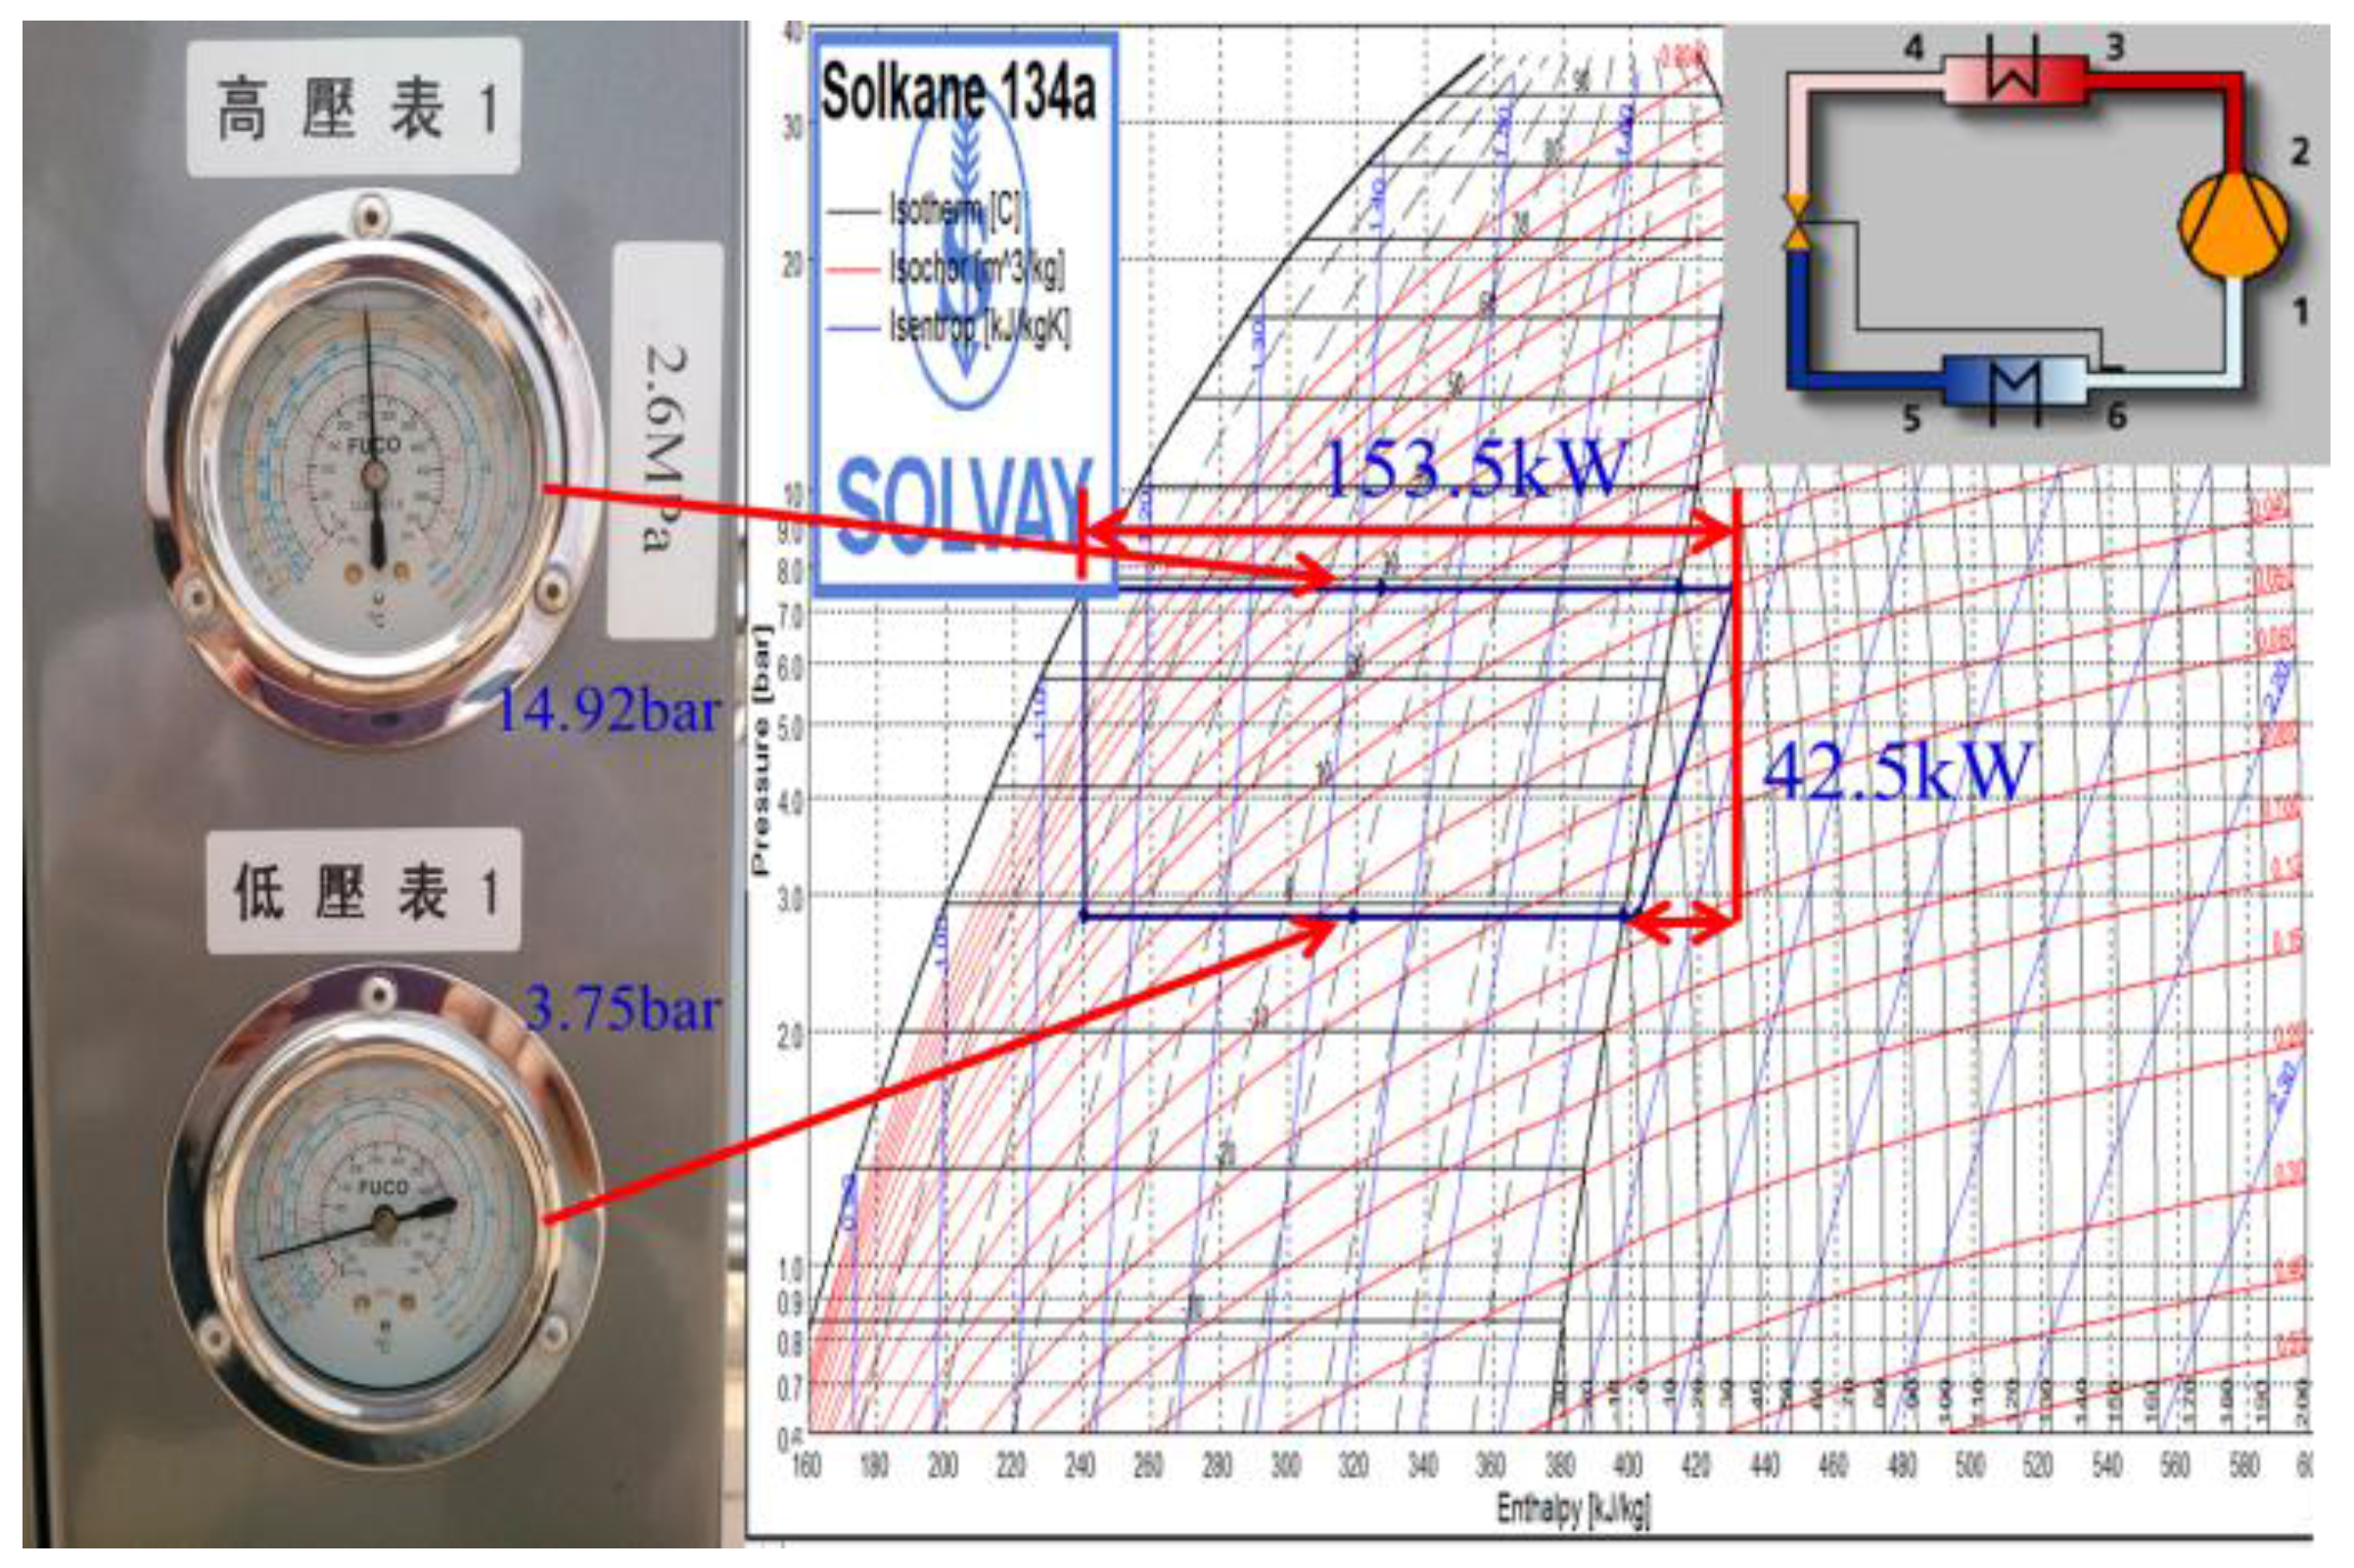
The Solkane program is used to simulate the heat pump working cycle and establish the model that is suitable for the actual operation [13]. The engineering specification from a WSHP manufacturer, as shown in Table 1, has been selected as a means to verify the accuracy of the computer simulation results. By assuming isentropic efficiency to be 80%, using thermal properties of the R134a and cooling capacity of a WSHP as the input parameters of the software, the generated system performances, including power consumption, heating capacity, and cooling capacity, were compared to verify the accuracy of the simulation results.
Table 2 indicates the comparison of both results. The Qe deviated by 0.3%, the Qh deviated by 0.3%, and the system COPh and COPc deviated by 0.5% and 1.1%, respectively, all falling within engineering tolerances. The simulation result is also plotted in Figure 7 where the x-axis denotes the refrigerant specific enthalpy and the y-axis denotes the refrigerant pressure; it is the ph diagram, or Mollier Diagram.
The successful verification of the simulation result warrants the Solkane software to be utilized to evaluate the performance of an ASHP, to see whether it fits in our retrofit project as a potential heat pump candidate.
In addition to the energy-based system performance analysis, an exergy-based analysis is also conducted.
According to the law of energy conservation, the energy in a closed system is conserved. Therefore, the cooling capacity can be used to compare the performance of an ASHP and a WSHP systems [14], as shown below in Equations (1) and (2).
The cooling capacity for a WSHP can be defined as:
The cooling capacity for an ASHP can be defined as:
The cooling capacity of the evaporator will be obtained after calculating data of Equations (1) and (2) was inputted to the Solkane program. The heat exchange components, such as evaporator, condenser, etc., of the heat pump system are regarded as a control volume. No heat and work transfer through the boundary of components are assumed. Additionally, the irreversibility () or destroyed exergy is defined as , the irreversibility equation is shown as below (Equation (3)).
where the flow exergy Ψ can be expressed by as kinetic energy and potential energy are negligible. The h0 and s0 are thermal properties which are based on the ambient temperature T0 = 298 K. If the heat pump uses water as a heat source, the following equation applies for calculating the irreversibility of evaporator.
However, if the heat source of a heat pump is from the air, the irreversibility of evaporator is given by
The equation of the exergy efficiency for evaporator is shown in Equation (6).
The exergy efficiency can be used to evaluate the available energy performance of an ASHP and a WSHP, and further to compare which type of heat pump has higher exergy efficiency. Therefore, the exergy efficiency is defined as shown in Equation (7), namely, the ratio of COP of heat pump between actual and reversible cycle.
where TH and TL are the constant temperatures in the hot and cold reservoirs, respectively. For a heat pump system, TH is the temperature of hot water tank and TL is the temperature of chilled water tank. From the calculation of Equations (4)–(6), the exergy loss of evaporator and exergy efficiency of the heat pump will be obtained.
2.4. Full-Scale Experimental Investigation
In order to evaluate the thermal performance of a chiller or heat pump system before and after the installation without interrupting its operation, the COP will be measured using an ultrasonic water flow meter, together with thermocouples to record its corresponding cold and hot water temperatures. Furthermore, the heat balance among the Qe, P, and Qh [14], that is Equation (8), shall be monitored all the time to validate the data collection.
Qh = Qe + P
The COP of a WSHP under heating mode is defined as:
and COP under cooling mode is defined as:
namely,
where
COPh = COPc + 1
- -
- Qe is the cooling capacity of a WSHP, kW;
- -
- P is the power consumption of a WSHP, kW; and
- -
- Qh is the heating capacity of a WSHP, kW.
In this study, the portable real time dual-loop ultrasonic flow meter has been selected to record all parameters simultaneously in both hot and cold water loop of a heat pump, second by second, together with corresponding power readings.
The COP of the heat pump is measured by the following procedures:
- (1)
- The circumference of one of the hot water pipes and the circumference of one of the insulated cold water pipes shall be measured using a measuring tape. The outer diameter of the hot water pipe shall be computed and the data entered into the portable ultrasonic flow meter.
- (2)
- A rectangular portion of the insulation foam, measuring 60 cm × 12 cm, shall be removed from the exterior of the cold water pipe. On the wall of each piping system chosen from the cold water and hot water loop, a pair of flow rate transducers of the flow meter will be installed by choosing a location of reasonable distance, normally around six pipe diameters in distance away from piping fittings, including elbows and valves to avoid flow turbulence and result in bad readings.
- (3)
- Besides the cold water and hot water flow rates, the following parameters shall be measured every three seconds for three days:
- (a)
- hot water outlet temperature (T1);
- (b)
- hot water inlet temperature (T2);
- (c)
- cold water inlet temperature (T3);
- (d)
- cold water outlet temperature (T4);
- (e)
- condenser output (Qh), as shown in Equation (8); and
- (f)
- evaporator output (Qe), as shown in Equation (8).
- (4)
- The length of measurement time shall be extended until the following criteria are met:
- (a)
- fluctuation of water flow rates to be within the range of ±5%;
- (b)
- fluctuation of all inlet and outlet temperatures to be within the range of ±0.5 °C; and
- (c)
- comply with Equation (8), to stay within 5% engineering tolerances.
A schematic diagram (Figure 8) indicates all the measurement parameters. As the ambient air condition could have varied quite significantly during these days, the control of the condenser presents a useful means in adjusting T2 temperature during the whole measurement period. The average value of P shall be recorded from the power analyzer or the power panel of heat pump accordingly so that Equation (8) could be checked for compliancy all the time. The entire set of readings will be automatically recorded, stored, and saved in the data acquisition system described above, to be analyzed and printed out afterward.
According to Stoecker [15], the COP of a centrifugal chiller is mainly determined by the T2, T3, and the part load factor (L), such that:
where Qe or P can be further correlated and curve-fitted with a bi-quadratic equation.
Qe = f(T2, T3)
P = f(T2, T3, L)
The methodology sets up an important experimental model to compare the operation data of a chiller, before and after the retrofit, and to identify the percentage of its COP improvement, and also applicable on a heat pump. Above all, Equation (8) is used to justify the validity of the measured data to keep the heat balance, based on the first Law of Thermodynamics. Data gathered during measurement which cannot comply with Equation (8) within 5% deviation, will be excluded, as shown in Equation (14):
2.5. Evaluation of Economic Benefits
From the viewpoint of cost analysis, the simple payback method (SPB) is used to calculate the payback years of the heat pump installation (Equation (15)).
where Ct is initial total investment cost and Fs is the yearly cash flow from operating boiler and heat pump systems.
3. Case study
3.1. Description of Building and Installed HVAC and Hot Water Systems
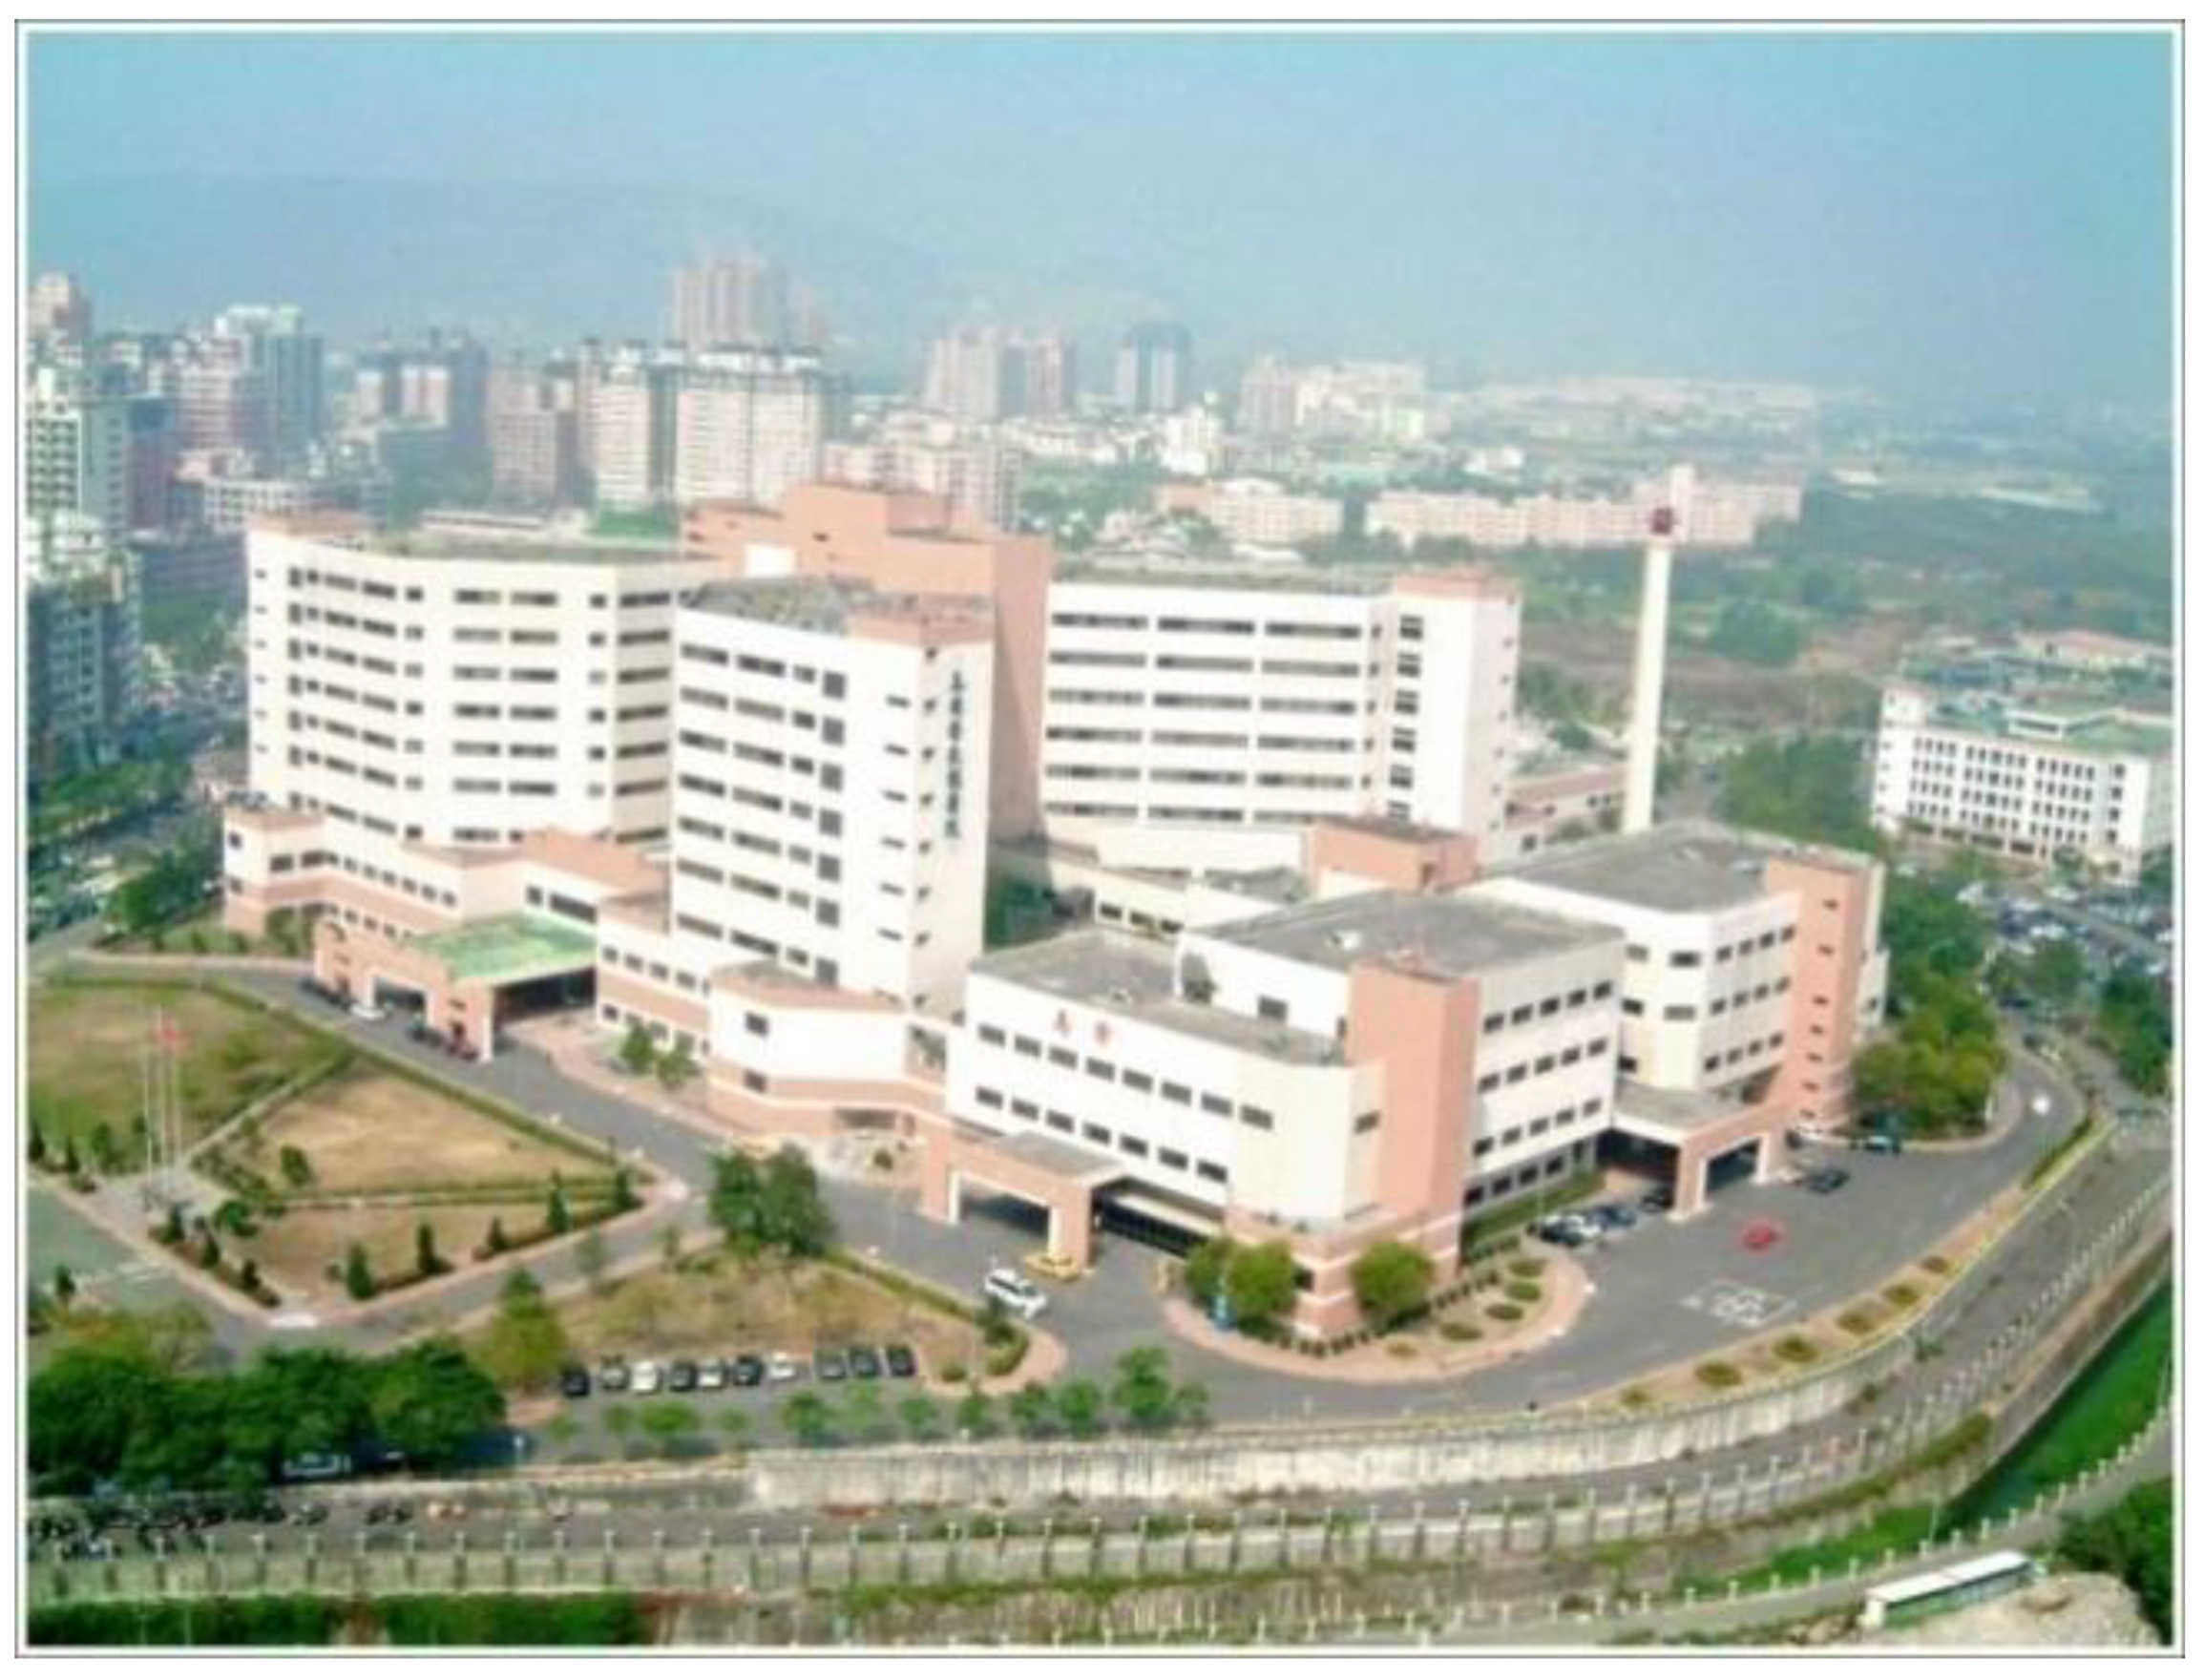
The selected hospital, named K Hospital in this study, is one of the large public medical centers in southern Taiwan. The K Hospital consists of three buildings: Medical Building, Outpatient Building, and Emergency Building. The overview of K Hospital is shown in Figure 9. In K Hospital, there are 1718 employees. Among them, 63% are nursing and medical personnel, 21% are doctors and 16% are administrative and general technical staff. Bed configuration consists of 1019 beds in general area, 102 beds in intensive care, and others account for a total of 1414 beds. The medical building with 10 floors was built in 1990, with the total floor area of 88,392 m2, supplying air-conditioned area of 87,693 m2, and total occupancy around 3000 people. This medical building opens for 24 h a day, such as general wards, nursing stations and so on. The outpatient building is a five-story building with a total floor area of 29,559 m2 and an air-conditioned area of 23,647 m2, and an occupancy of 4000 people. The outpatient building is divided into a heavy–duty medical space operating for 12 h a day (such as testing, pharmacy, and radiation), and another ordinary space operating for another 12 h. The 12-story emergency building is located next to the outpatient building and had been opened since 2003, with a total floor area of 34,834 m2 and with an air-conditioned area of 26,081 m2. The occupancy in the emergency building was approximately 1000 persons, mainly for the purpose of general patients, emergency observation, intensive care of patients, and on-duty medical staff accommodation.
The existing water heating system consists of three high-efficiency flue-tube steam boilers with a steam output capacity of 7.5 ton per hour; two hot water tanks with a storage capacity of 5000 gallons each, equivalent to 20 metric tons in total; and heat exchangers with the rate of energy transfer of 1969 kW. The steam, which is generated by feeding an average water temperature of 20 °C to the optional fuel-burned boiler with gas or heavy oil, is supplied to the sterilization chamber, the nutrition room and the emergency room. In addition, 58 °C hot water was supplied to patients, dormitories and medical operations through steam pipelines and heat exchangers, stored in the hot water tanks with a capacity of 40-tons. The composition of HVAC system is composed of multiple chillers, including two-350 RT, six-600 RT, and a 1000 RT centrifugal units. The water loop consists of primary and secondary chilled water pumps, cooling water pumps, and cooling towers with total cooling capacity of 6625 RT. The airside subsystem includes the AHUs and the FCUs, installed at each floor, such as: operating room, laboratory, central control room, computer room, gas pipeline control room.
The peak power demand was 8300 kW, monitored with a closed-loop building energy management system (BEMS) to manage the HVAC, lightening, electrical, water supply, sewerage and gas systems. The energy consumption was recorded and can be monitored in real time online.
According to BEMS data, the HVAC system accounts for 55% of total power consumption, followed by 15% for the lighting, the offices and administration accounts for 10%, elevators accounts for 5%, and the rest accounts for 15%. Fossil fuel consumption is 58% for drying and washing, 23% in kitchen, and 17% in bathing. The hot water boiler system operating data were recorded manually. According to the statistics, 35% of the total thermal energy was utilized for hot water supply, 32% for disinfection, and 28% for the restaurant. The fuel cost of the existing boiler heating system is approximately US $ 400,000 per year.
3.2. Analysis on the Characteristics of Heating Requirement
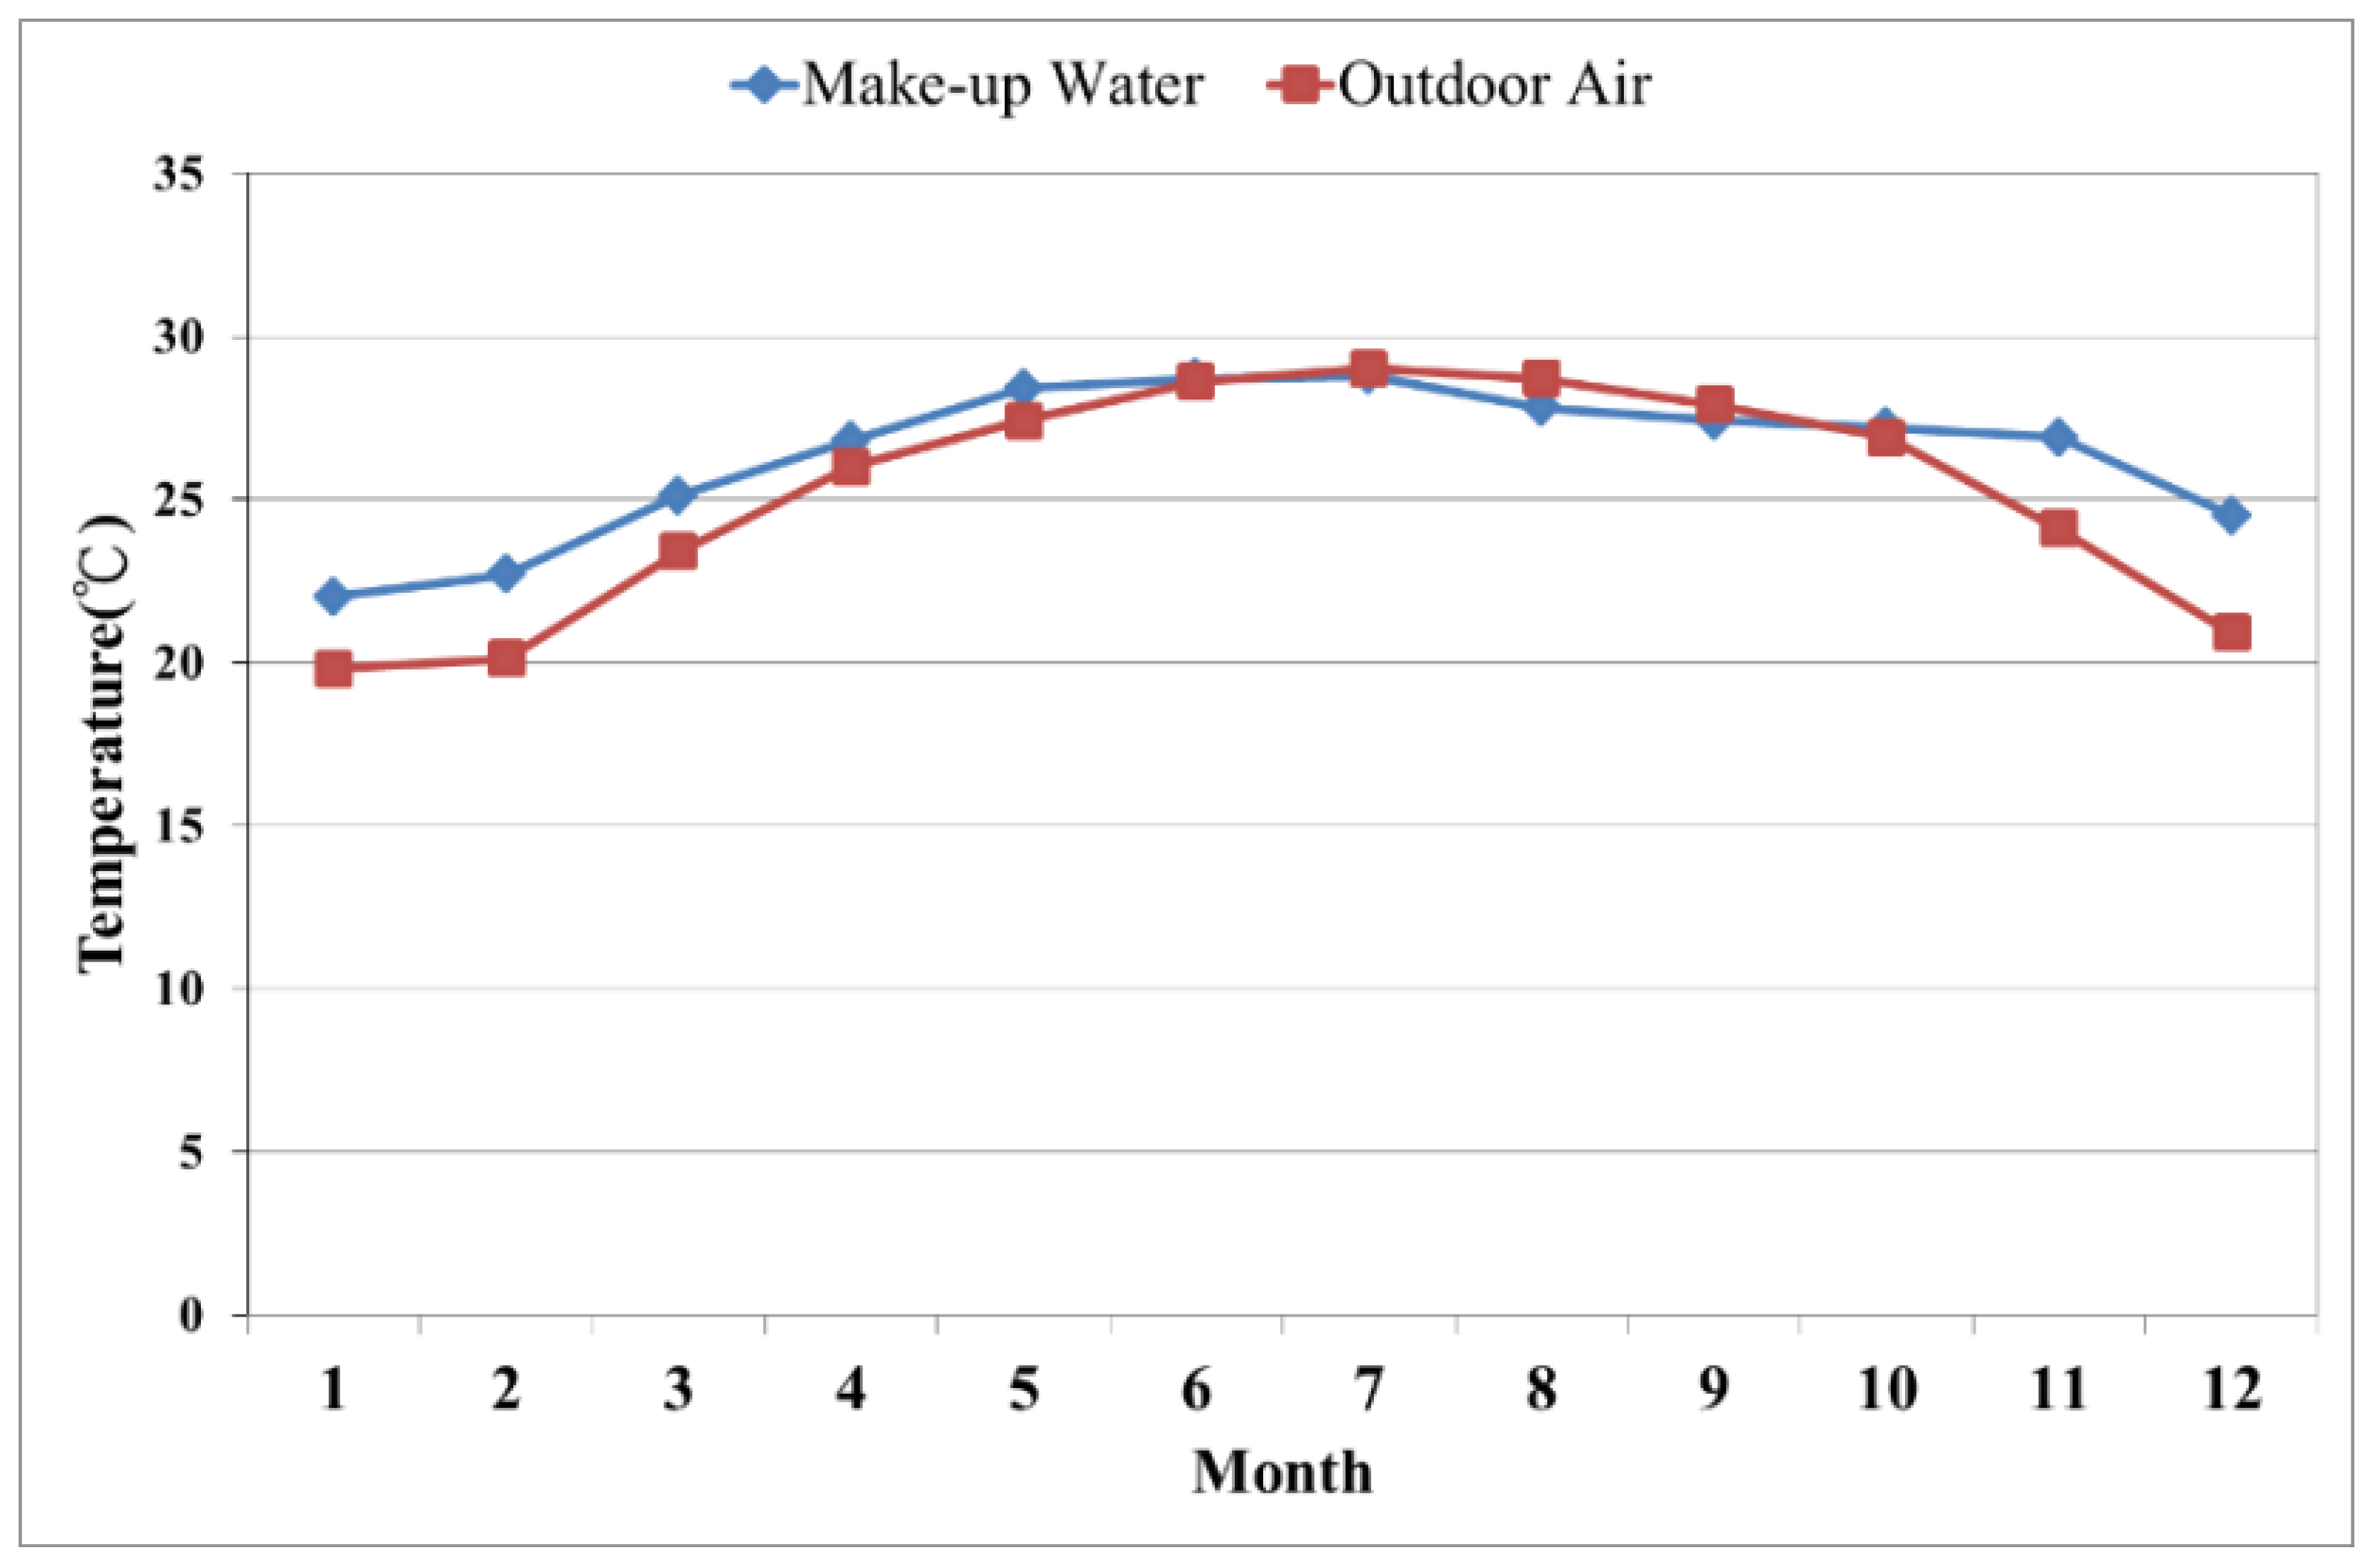
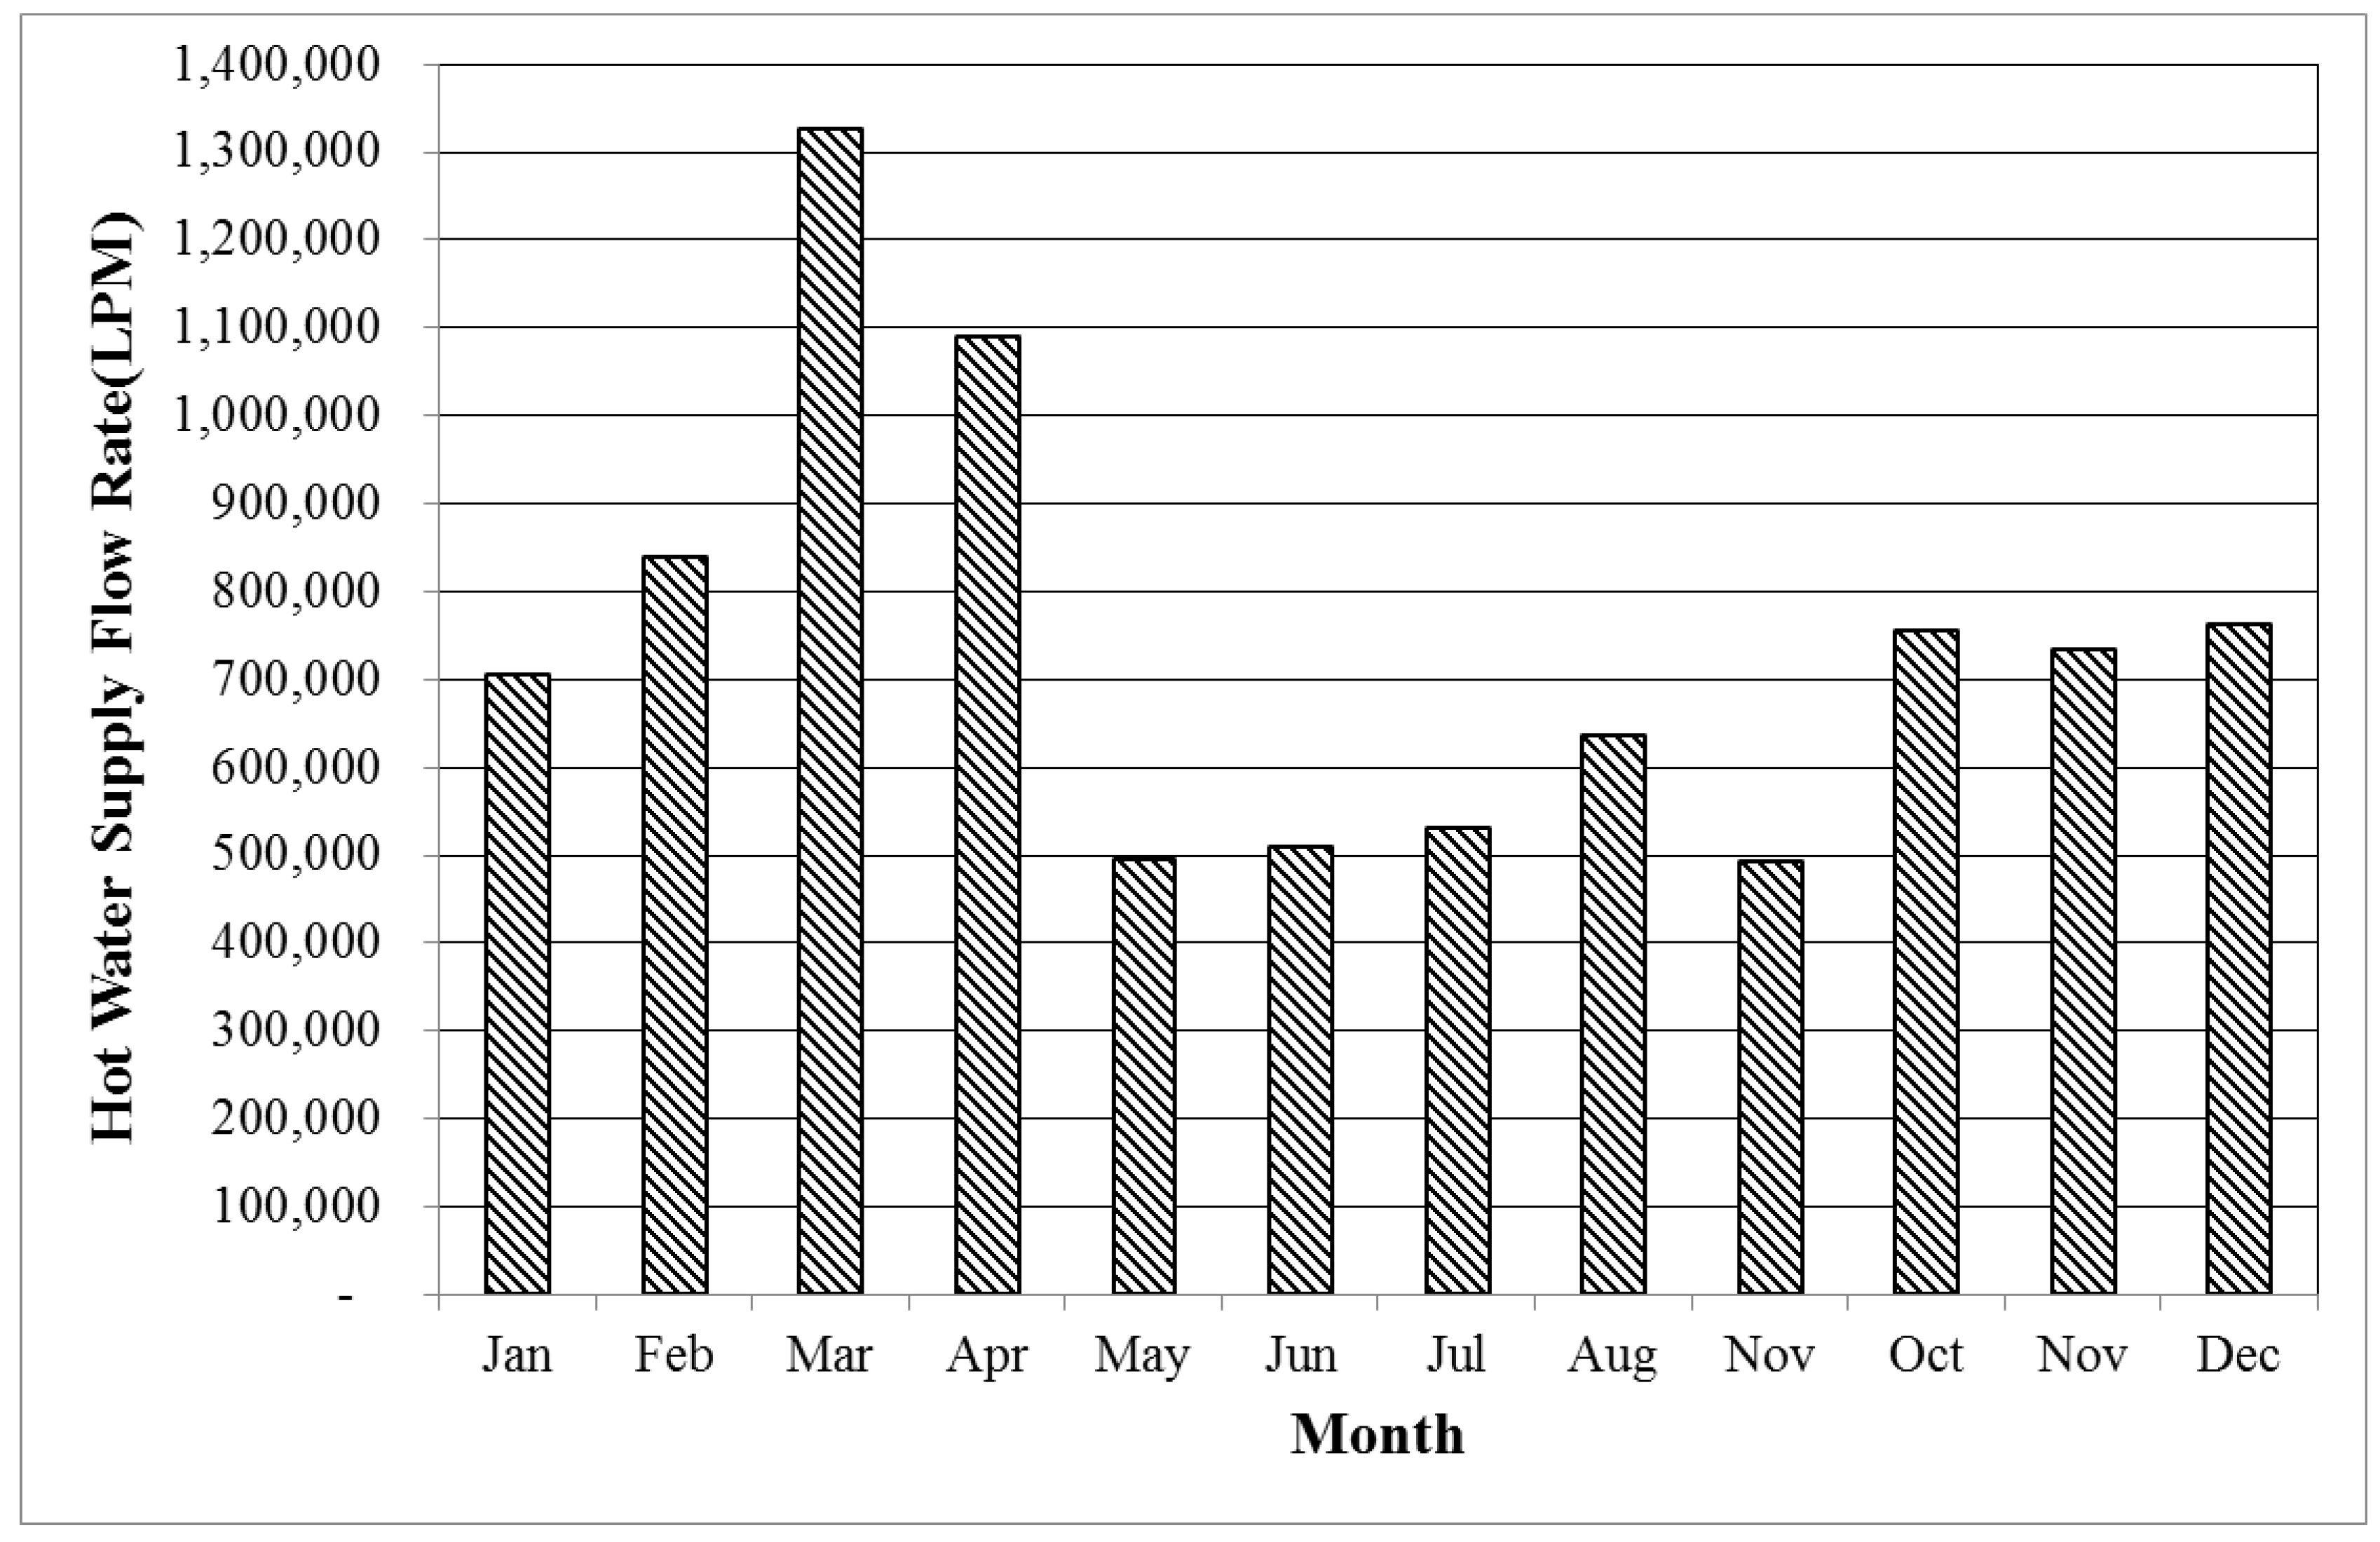
Air conditioning system is located near the boiler system in K Hospital plant room, where cooling and heating are needed simultaneously. The air conditioning system in K Hospital operates all year round, and at least one unit of 600 RT chiller is still required to run in the winter. As such, installing a WSHP system and integrating with the existing air-conditioning system becomes a viable solution during the retrofit. Figure 10 shows the monthly make-up water temperature and the outdoor air temperature of K Hospital in a year. The make-up water temperature is lower than the outdoor air temperature during the periods of November to April. Higher hot water supply flow rates were experienced, as shown in Figure 11, which also occurs when the make-up water temperature was lower. That is, months when the makeup water temperature is lower, the hot water consumption in K Hospital is higher. This result is consistent with Schibuola [16] who found that when the outdoor air temperature is lower than the water source temperature in the winter, the hot water demand is much higher. Lam et al. [9] also showed that an efficient WSHP system can be used to replace the oil-fired boiler system to meet the required hot water supply, while also producing enough cooling capacity for air conditioning.
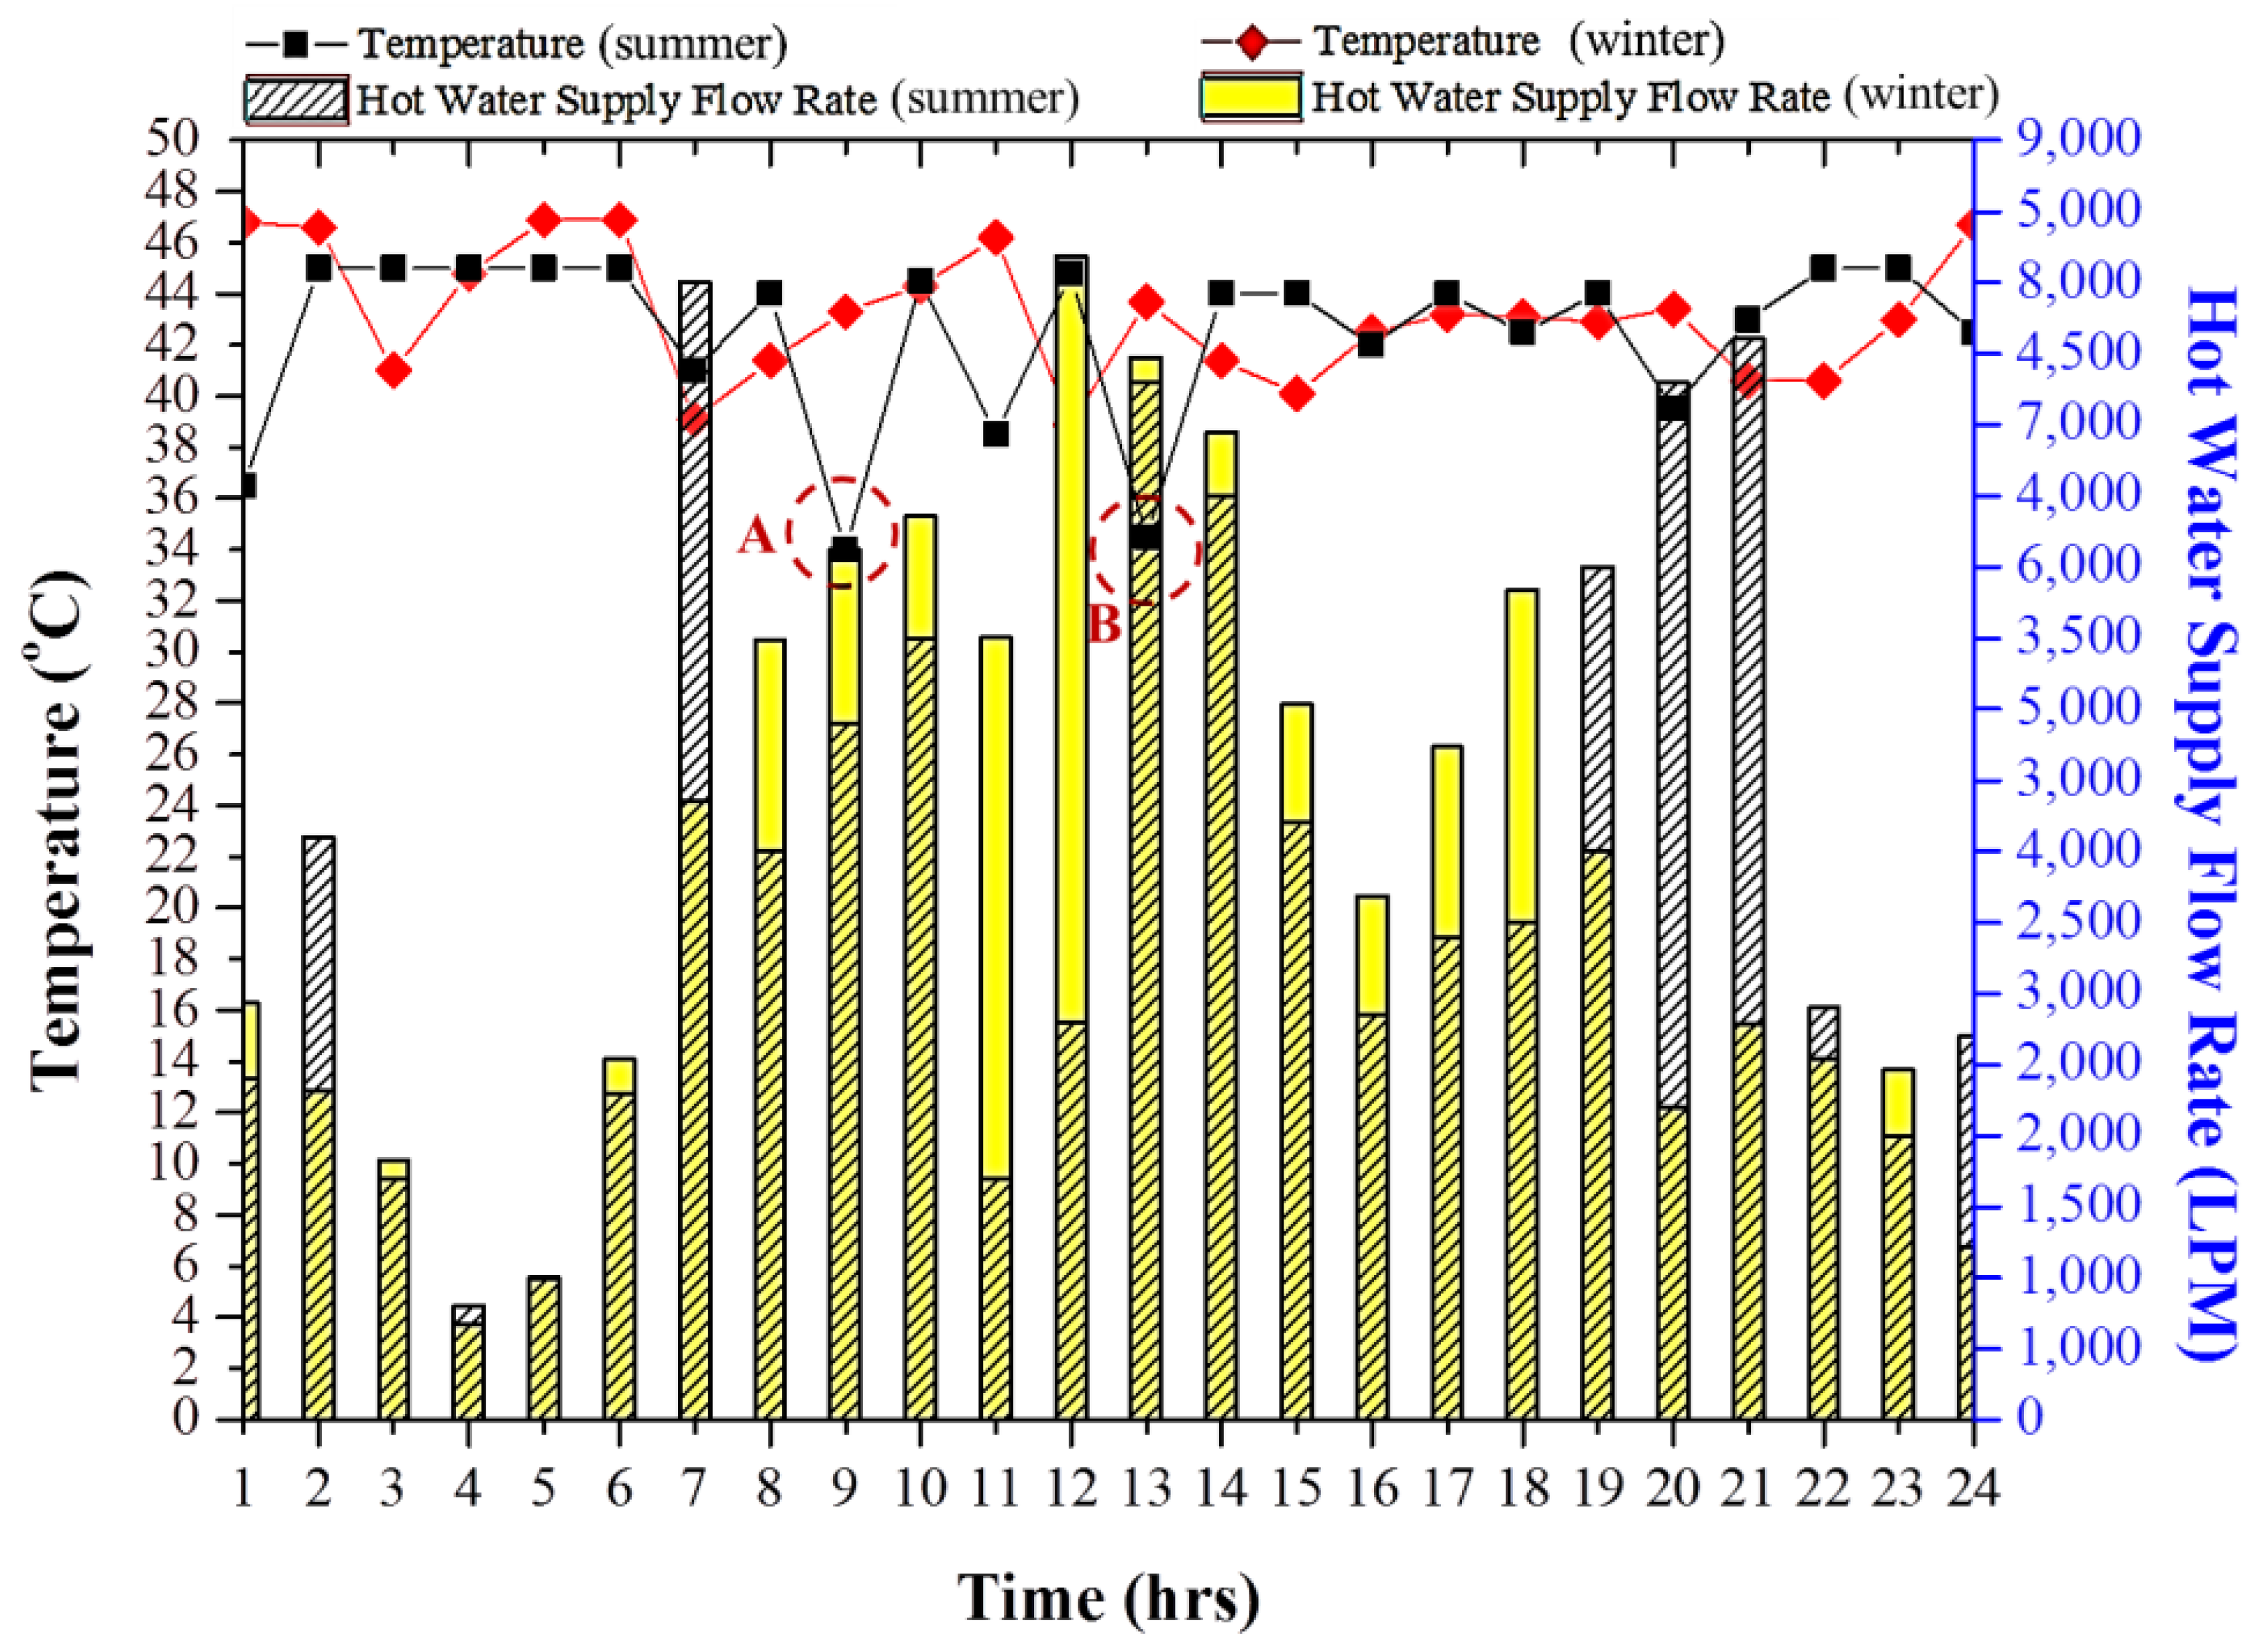
This study analyzed the hot water requirements pattern of K Hospital in the summer and winter as baseline in sizing the capacity of heat pump and hot water storage tanks. Figure 12 show the hourly hot water supply temperature and consumption in K Hospital on regular working days in the summer. The all-day hourly normal make-up water temperature is 27–29 °C in the summer. The boiler produces 45 °C hot water steadily. The boiler is turned on when the water temperature drops to lower than 43 °C and turned off when the temperature is higher than 46 °C. It also indicated that the original system design has a weak point of inadequate hot water storage tank. Thus, when hot water demand was concentrating on a smaller period of time, the cold make-up water entering the system would cause a thermal mixing loss and the hot water supply temperature dropped significantly, as indicated by points A and B in Figure 12. In this case, people who were taking a shower would automatically switch on the faucet and demanding for more hot water, causing a lot of water waste. The make-up water flow rates, as shown in Figure 12, indicated that the hot water is needed almost all day long, and the average flow rate is 2745 L/min. Most patients bath from 7:00 p.m. to 9:00 p.m. after dinner, and the range of flow rates in that period of time is 3794–4593 L/min. Sometimes, the consumption of hot water is high for bathing and cooking at 7:00 a.m. after breakfast, or from 1:00 p.m. to 3:00 p.m. after lunch, when the water flow rates range from 2750 L/min to 4728 L/min. Therefore, the supply water temperature fluctuates as the hot water flow rate changes in these time intervals.
The supply water temperature of hot water equipment changes slightly in the winter, and the average temperature is about 43 °C. As shown in Figure 12, it decreases at 7:00 a.m. and 12:00 p.m., because the hot water consumption increases suddenly and exceeds the supply limit instantaneously. When the hot water requirements increase continuously, as the hot water system capacity is abundant, the supply water temperature is restored to the setting value continuously in full load operation. According to Figure 12, the hot water is required almost all day long in K Hospital in the winter, with the average flow rate of 4000 L/min. The hot water requirements are consumed by sterilizing equipment in operation or diagnosis and treatment process in the morning. The hot water demand is also high at noon, because both the restaurant kitchen and the patients are using hot water at the same time. The hot water flow rate ranges from 6950 L/min to 8183 L/min. Most patients took a bath at 6:00 p.m. after dinner, thus the hot water flow rate is high, at around 5839 L/min. Apparently, the hot water consumption in the winter is higher than that in the summer. Secondly, the peak hours of hot water consumption are concentrated in the winter, whereas the peak hours of hot water consumption are scattered in the summer. Based on the above characteristics, the heating capacity and hot water storage tank capacity for the heat pump system has been designed to meet the peak hot water demand in the winter. In addition, the hot water storage tank has been enlarged during the retrofitting process, to accommodate a larger thermal buffer and to provide the possibility to use the off-peak power to generate hot water, saving power tariffs.
3.3. Simulation Results of the Heat Pump Performances in K Hospital
In selecting a suitable heat pump system for K Hospital, computer simulation was used. As mentioned earlier, the performance of a WSHP was evaluated by using the manufacture’s specification as computer simulation inputs, and verified the computer simulation results.
Furthermore, ASHP was considered as one of the trial designs. By assuming an ASHP equipped with the same cooling capacity as that of the WSHP, it was calculated that the air temperature difference across the evaporator inlet and outlet from Equation (2), in such a case, should be 9.7 °C, which exceeds the heat pump manufacturer’s specification of 5 °C. This result also excluded the possibility in adapting an ASHP in this project.
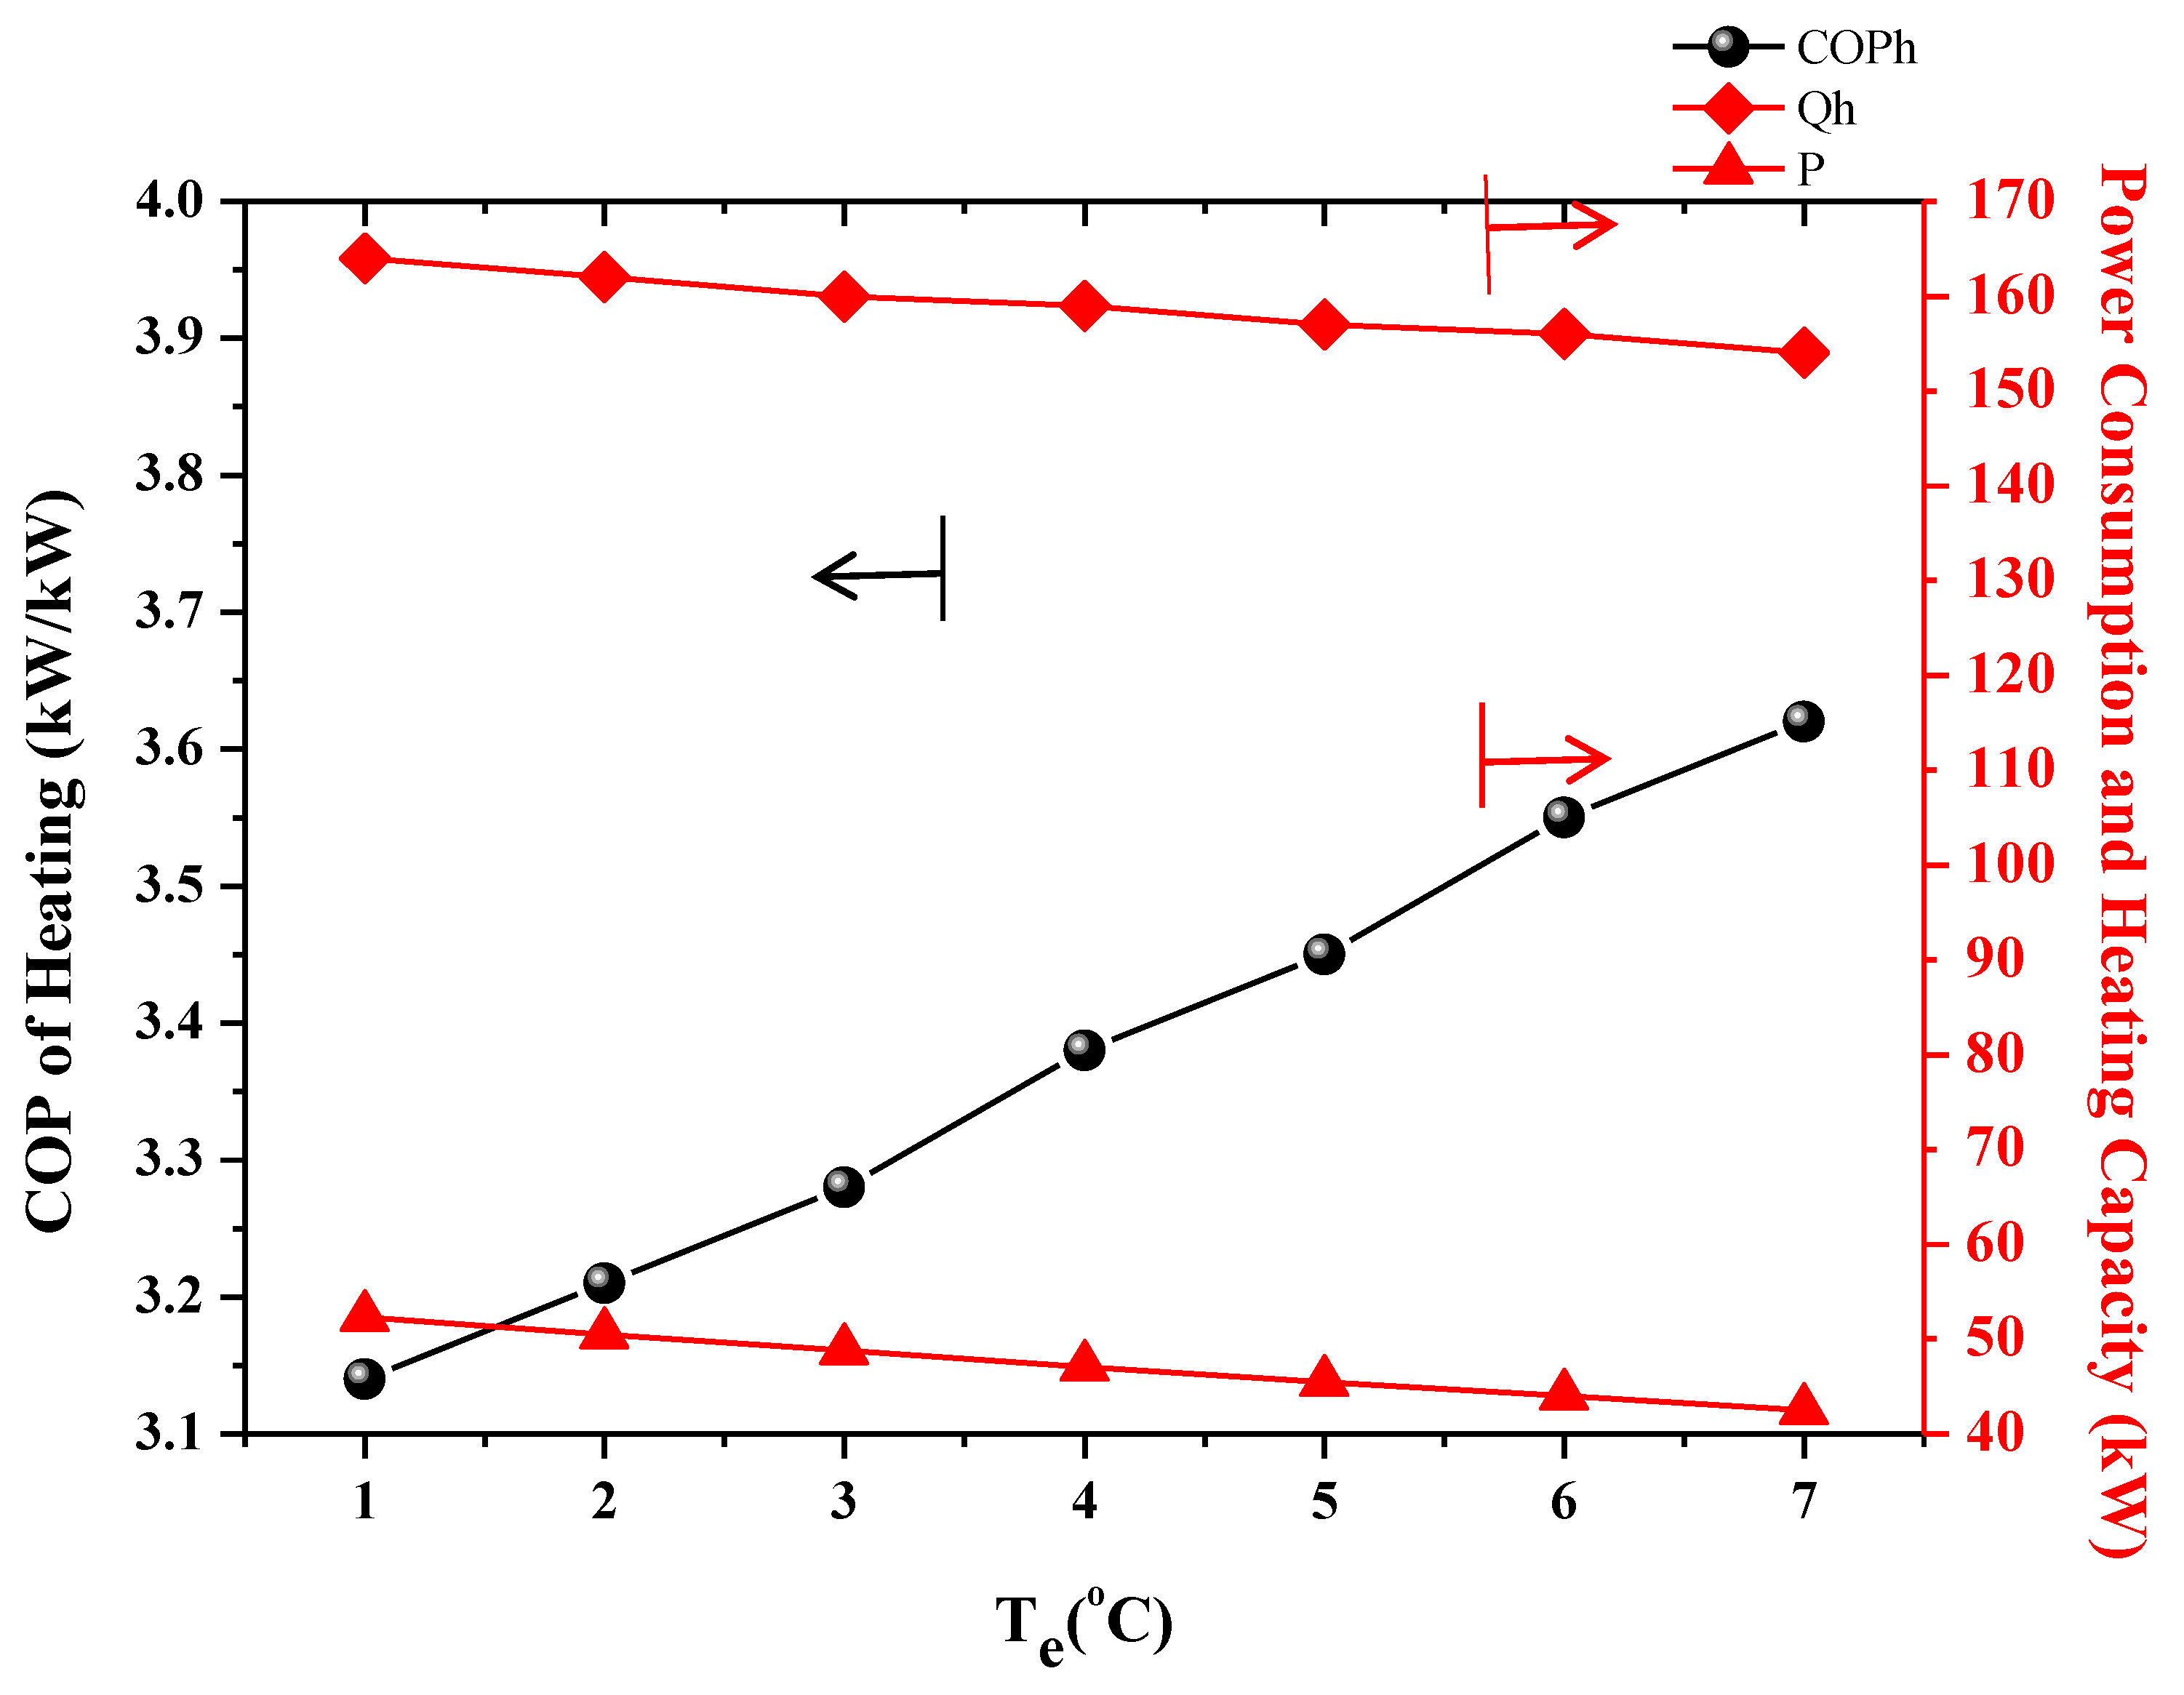
In addition, as shown in Figure 10, the ambient temperature in Taiwan is often much lower than the tap water temperature during autumn and winter, which could makes the thermal performance of an ASHP to degrade. Figure 13, indicated the effect of the variation of evaporation temperatures on the performances of a typical ASHP. The simulation result showed that each 1 °C decrease of the evaporation temperature caused by lower ambient temperatures, will cause the power consumption of a typical ASHP to increase by 3.8% and COP reduced by 2.2%. Therefore, the trial design in using an ASHP was disregarded for further considerations and a WSHP was selected for this retrofit application.
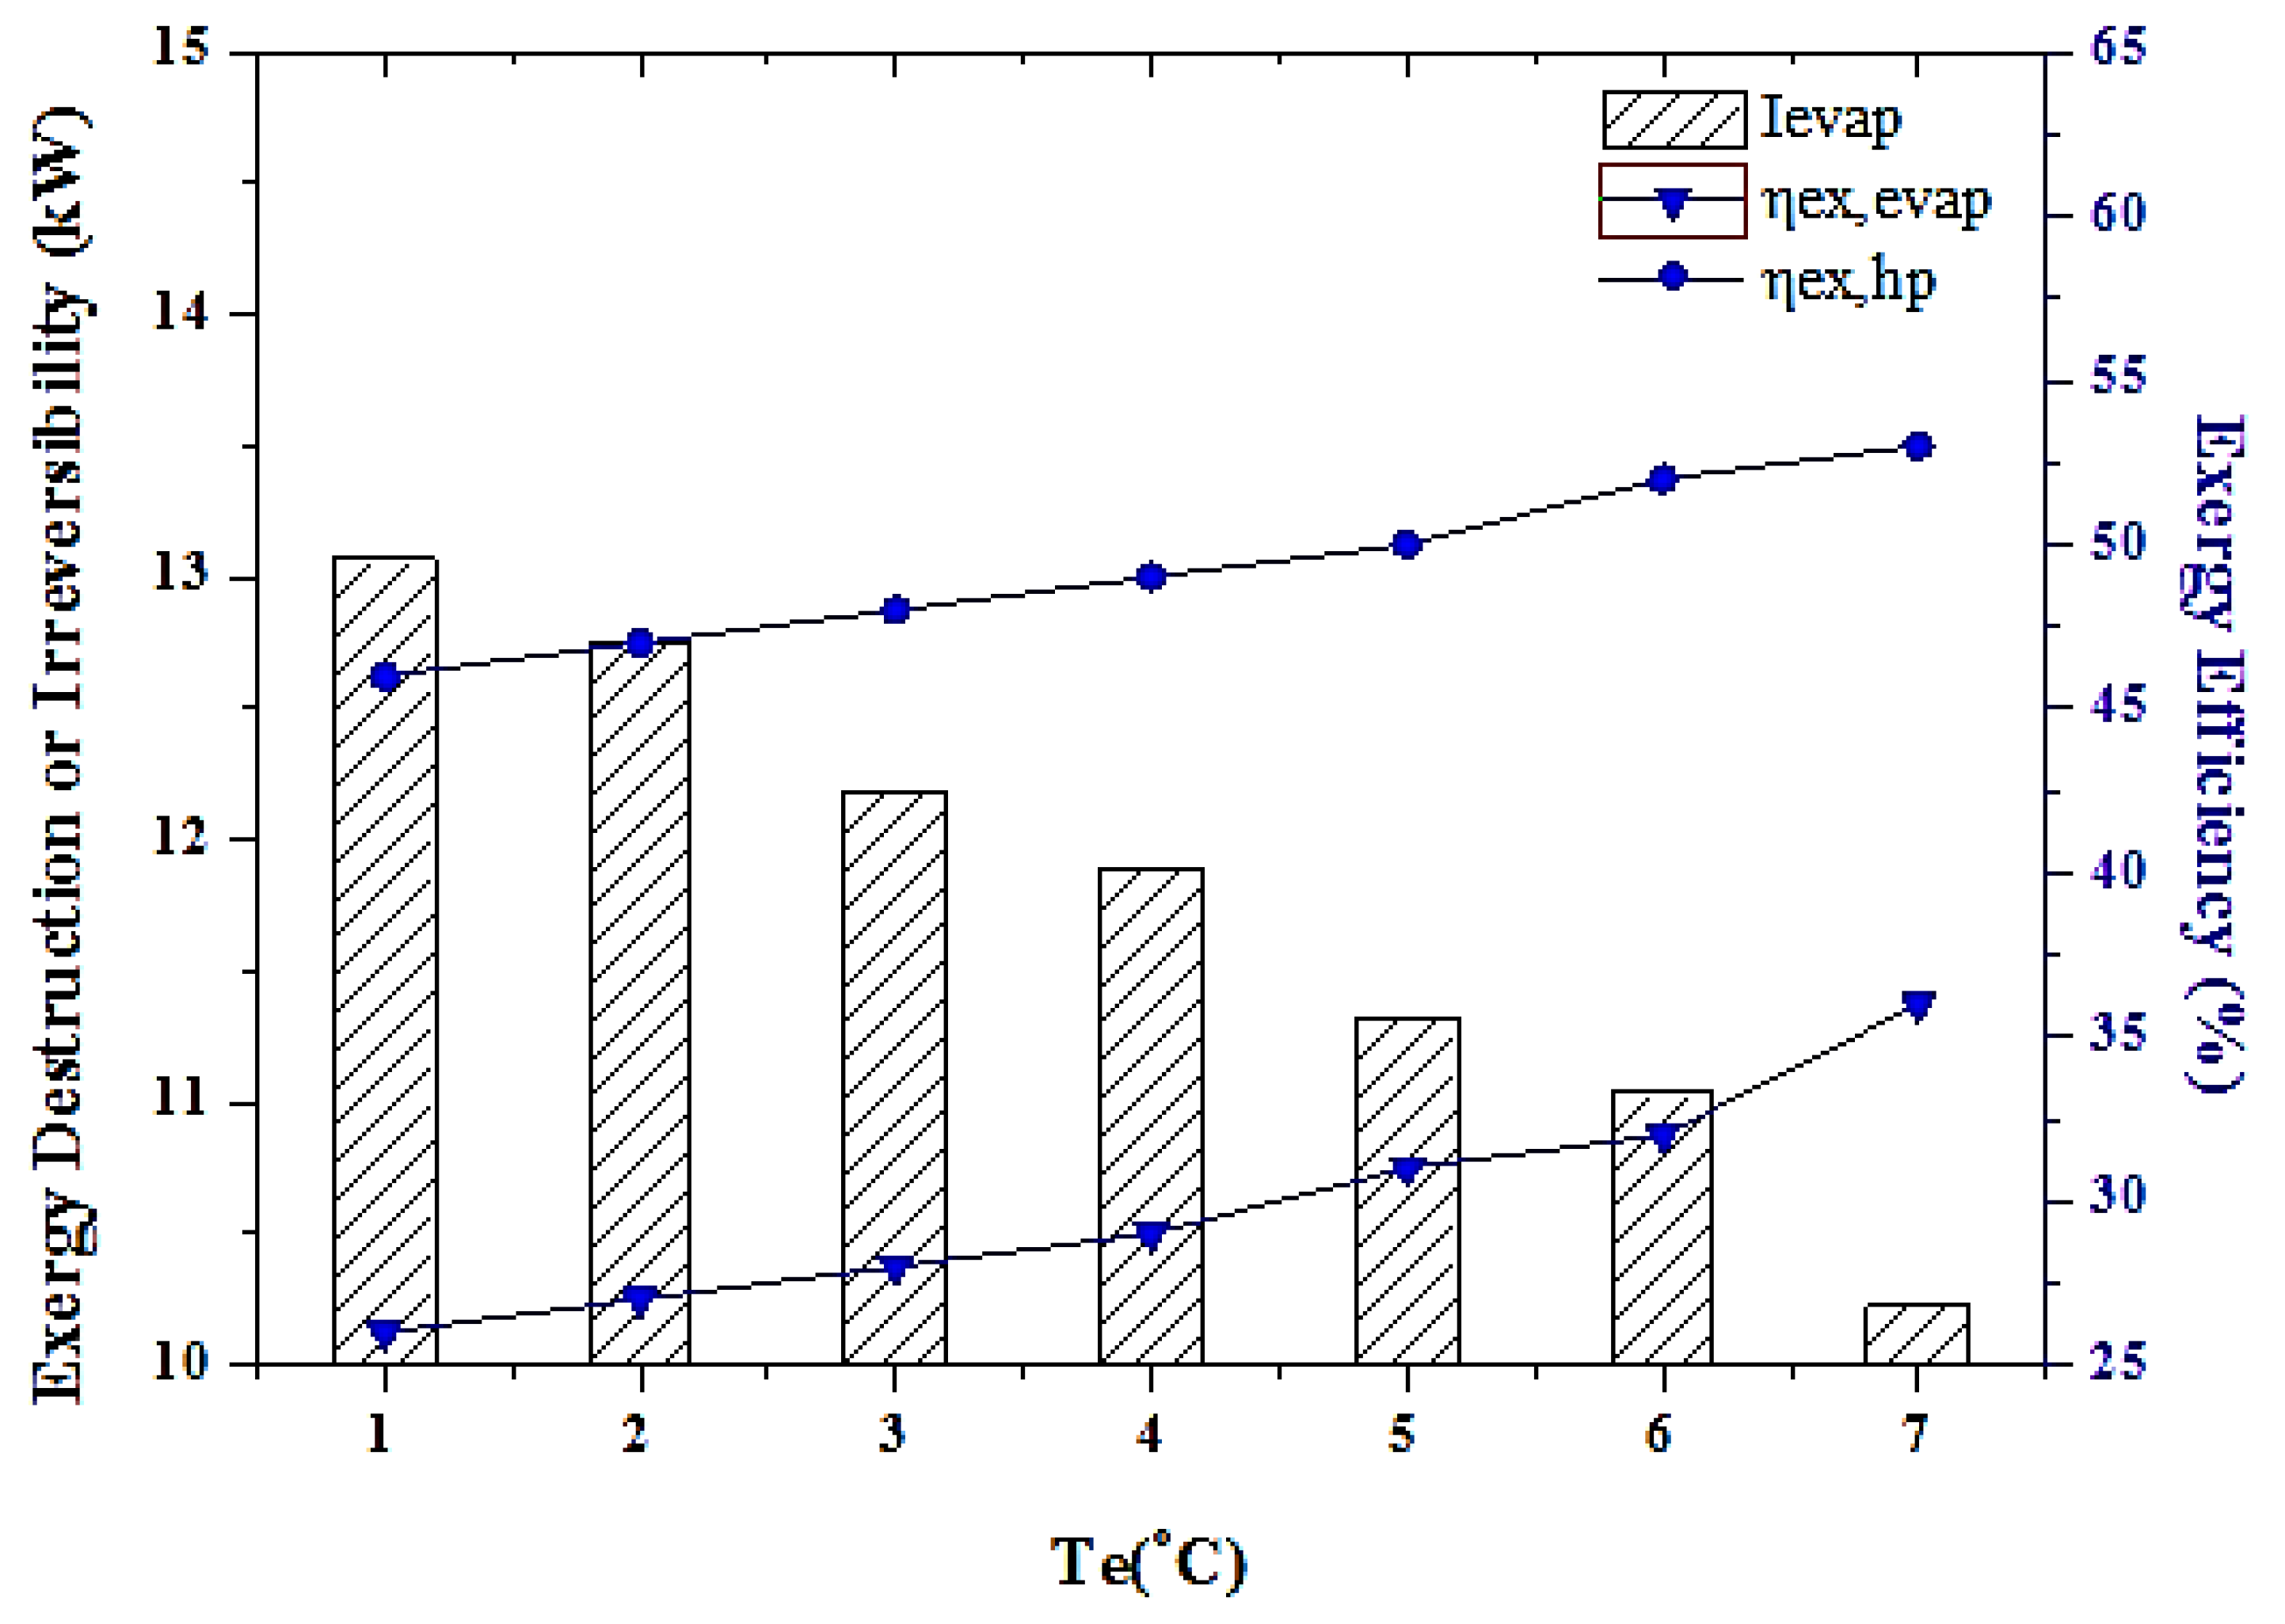
Furthermore, results obtained from the exergy analysis are also compared and discussed as the following. Table 3 shows that when the evaporation temperature an ASHP decreased with a lower outside air temperature, power consumption increased accordingly as shown in Figure 14. In Table 4, the results indicate that the enthalpy of the evaporator outlet is also reduced while the evaporation temperature of the ASHP system is decreased, and the enthalpy difference in the evaporator between inlet and outlet is smaller when the enthalpy of the inlet is not so large. Relatively speaking the mass flow rate of the refrigerant must be increased to maintain the same evaporator cooling capacity at the evaporation temperature of 7 °C as the WSHP. However, the air mass flow rate and temperature difference in the evaporation between the inlet and outlet, at present, are fixed with respect to air side of ASHP system. Therefore, the exergy destruction or irreversibility of the evaporator increases with decreasing evaporation temperature, and the exergy efficiency tends to decrease as shown in Figure 14. To summarize, the application of WSHP is superior to that of the ASHP, whether in terms of the energy performance or exergy efficiency.
According to the simulation results, K Hospital replaces part of the existing boilers with a WSHP system, which is integrated with the existing HVAC system, to establish a proper operation strategy with the consecutive supply of heating and cooling to save the energy consumption, meeting the daily cooling and heating load simultaneously.
3.4. A Practical Design of Installing a WSHP to Integrate with the Existing HVAC System during Retrofitting
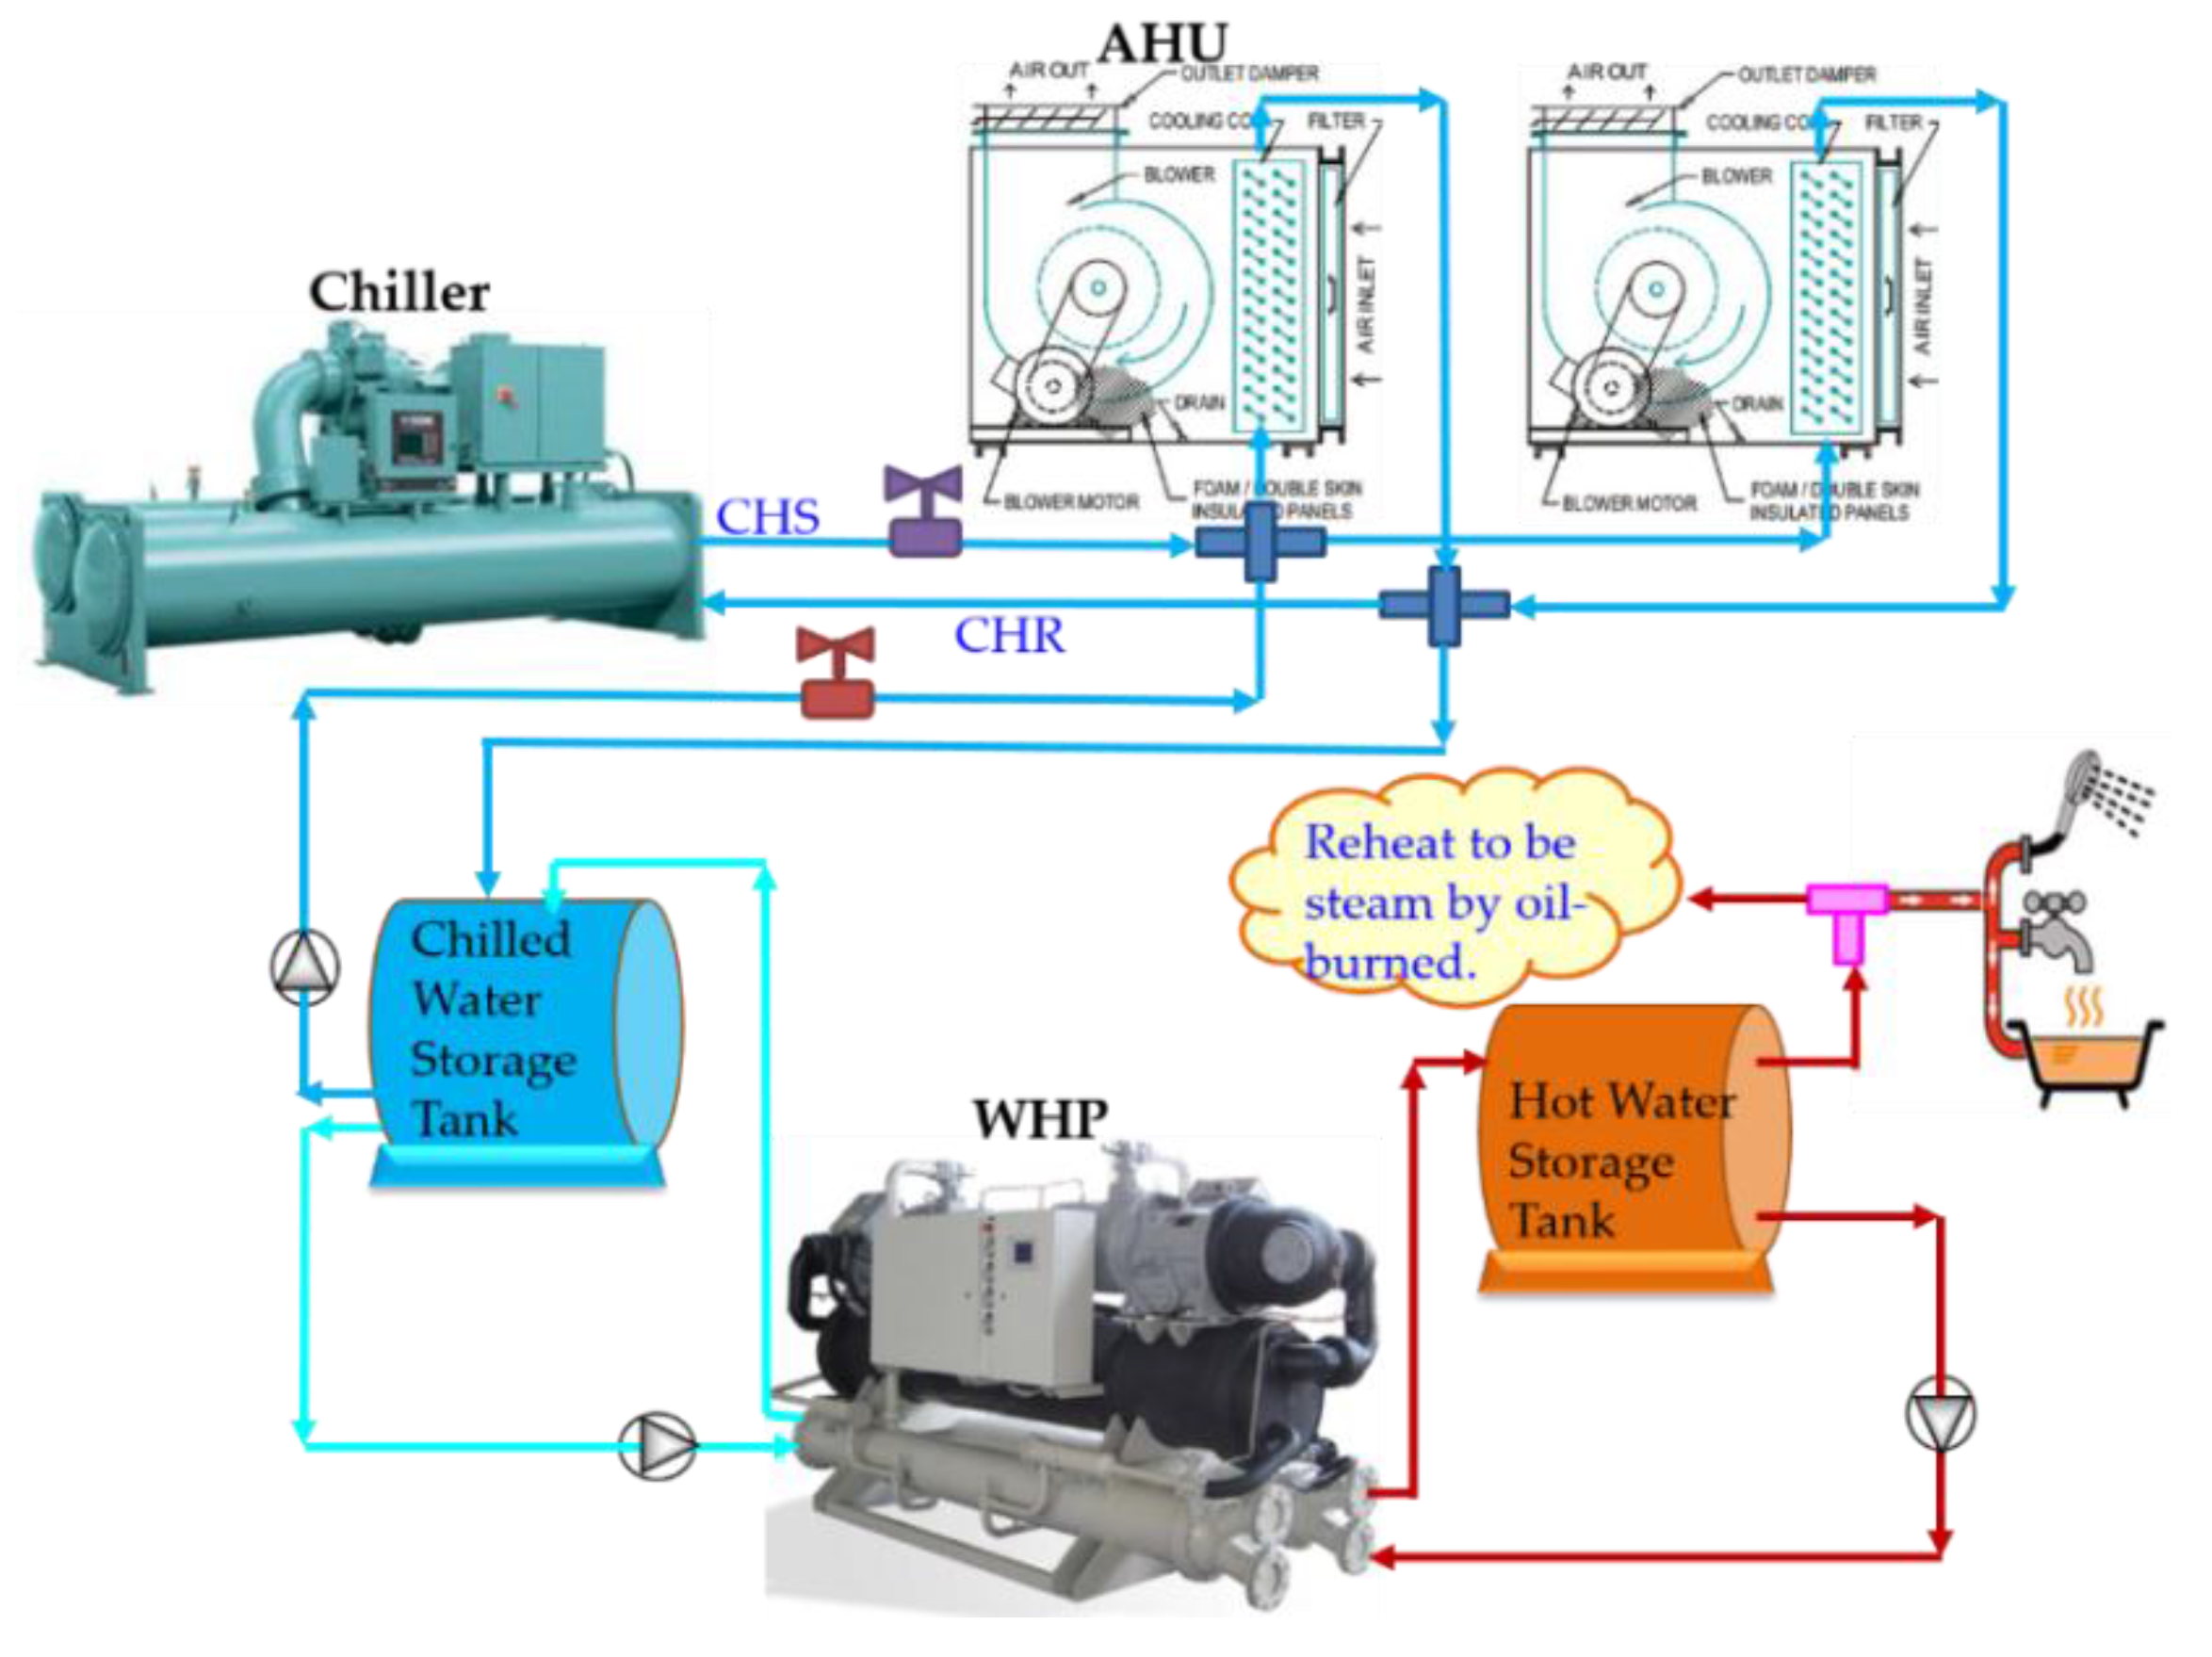
For this design, the installation includes both the WSHP plant and two storage tanks with hot water and chilled water, respectively. The design concept is to heat up the make-up water, from 20 °C to 55 °C, and then, send it to the boilers for further heating and delivered as steam for disinfection, or simply delivered as hot water for bathing and laundry. In addition, the chilled water produced by the heat pump is integrated with the existing HVAC system, to alleviate part of the cooling load of the existing chiller plant. However, if the chiller plant must be shut down for more than 2–3 days during the piping hook up, or, if all chilled water supply to be totally interrupted, it would not be allowable in K Hospital. Therefore, it is a better idea to install a chilled water storage tank and then, send it to the nearby AHU installed at the nutrition room to share part of the cooling load of the existing chiller plant. These AHUs were operating 24 h per day, the WSHP plant chilled water will thus contribute significantly, as shown in Figure 15, to integrate the newly-added WSHP system with the existing HVAC system.
3.5. The Full-Scale Experimental Results and the Comparison with the Engineering Specification and Computer Simulation
After retrofit, a full-scale experimental investigation has been conducted on the WSHP system of K Hospital. Table 5 shows the important parameters that were recorded. A comparison among the engineering specification, the computer simulation result adapted during the design stage, and the experimental results was conducted (Table 6).
The comparative results obtained in Table 6 indicated that the computer simulation result and experimental measurement correlate very well with the engineering specification adapted in this study. The simulation result is with an average deviation of 1.1% in COPc and 0.5% in COPh values, both within engineering tolerances. On the other hand, it is 2.6% and 2.2% in case of experimental measurement vs. engineering data. This successful result warrants a good system thermal performance of the WHSP system designed in this study.
3.6. Economic Assessment and Analysis on Economic Benefits
Based on the hot water load surveying result conducted in K Hospital, the annual hot water demand is 1,520,402 Mcal in total, or equivalent to 1,767,910 kWh. Hot water was supplied by a fossil-fueled boiler system before retrofit, the annual energy cost is US $137,786.
After retrofit, the measured COPh of the newly-added WSHP is 3.62. The specific power consumption of the WSHP can thus be calculated as the following:
COPh = Qh/P
= 153.5 kW/42.5 kW
= 131,571 kcal/42.5 kWh
= 3096 kcal/kWh
= 153.5 kW/42.5 kW
= 131,571 kcal/42.5 kWh
= 3096 kcal/kWh
Therefore,
where Wh is the annual total power consumption of the WSHP under heating mode, in kwh; Qh is the annual hot water demand, in Mcal or kcal; and COPh is the COP of the WSHP under heating mode.
Wh = Qh/COPh
= 1,520,402,000 kcal/3096 kcal/kWh
= 491,086 kWh
= 1,520,402,000 kcal/3096 kcal/kWh
= 491,086 kWh
This amounts to US $47,574 as the annual operation cost of the WSHP, based on the local power tariff, for providing hot water to K Hospital.
On the other hand, the WSHP system can provide extra cooling capacity under cooling mode, at the amount of 127,500 kWh per annum. Therefore, the “equivalent” or resultant annual power consumption of the WSHP can be calculated as:
where Wa is the equivalent power consumption of the WSHP per annum, considering both the heating and cooling mode capacities, in kWh; and We is the power savings generated from the WSHP under cooling mode, in kWh.
Wa = Wh − We
= 491,086 kWh − 127,500 kWh
= 363,586 kWh
= 491,086 kWh − 127,500 kWh
= 363,586 kWh
This is equivalent to US $35,222, as the actual annual operation cost of the WSHP, based on the local power tariff, for providing hot water to K Hospital.
Therefore, the power savings per annum is:
1,767,910 kWh − 363,586 kWh = 1,404,324 kWh
The operation cost savings per annum is:
US $137,786 − US $35,222 = US $102,564.
The total investment for this retrofit project is $120,000; with the saved operation cost being $102,564 per annum after the retrofit, the payback period using the Simple Payback method is calculated as around 1.2 years.
This is summarized in Table 7.
4. Conclusions and Recommendations
In this study, an analytical methodology has been developed for retrofitting a central hot water supplying system in a large general hospital, by integrating a newly-added water source heat pump with the existing air-conditioning system. The procedure consists of performing the jobsite system diagnostics, developing a corresponding retrofit strategy, and performing computer simulation to evaluate its effectiveness, followed by full-scale experiment to validate the results.
Computer simulation has been verified first, in comparing with engineering specification from the WSHP manufacturer, to yield accurate results in predicting WSHP system performances. The deviation is around 1.1% and is well within engineering tolerances. The software was then utilized to evaluate all other options, including ASHPs, and concluded that WSHP is superior in this heat pump retrofit project, in either energy-based or exergy-based analysis.
After the WSHP has been selected, designed, and actually installed, the operation data were recorded during the full-scale experimental investigation. Then, the engineering specification, computer simulation, and experimental results were compared, correspondingly. The comparative result indicated that the newly-installed WSHP has been operating successfully according to the designed engineering specification and with performance well predicted by the computer simulation. The results indicated that the COP of the newly added WSHP under heating and cooling mode is 3.62 and 2.62, respectively, with deviation kept within 2.2% and 2.6% for the heating, and cooling mode.
The success of this project lies in that not only the WSHP is supplying hot water with high energy efficiency, the reclaimed cooling capacity has added significant economic benefits, especially in a hospital where heating and cooling were both needed almost 24 h a day. The retrofit job achieved significant energy savings and operational cost reduction. The recorded annual cost reduction of this integrated system is $102,564, with a payback of 1.2 years. The methodology developed in this study and the positive thermal performances validated by the full-scale experimental investigation with economic assessment results warrants tremendous potential for future implementation in the industry.
Acknowledgments
The authors sincerely thank for the opportunity to perform measurement and verification of heating and cooling COP of water source heat pump plant in Kaohsiung Veterans General Hospital of Taiwan; and the funding support from the Architecture and Building Research Institute of the Ministry of the Interior, namely the ABRI Taiwan BeeUp project, and the project of Ministry of Science and Technology (MOST 106-3113-E-006-006-CC2), were highly appreciated which led to the success of this project.
Author Contributions
Chen-Yu Chiang took charge of experimental investigation, measurement and verification of heating and cooling modes of the WSHP plant, located in K Hospital. At the same time, he also did all the simulated work by using the computer program Solkane. Ru Yang and Shin-Ku Lee performed a theoretic analysis to verify that the WSHP is superior to the ASHP in terms of the exergy-based thermal efficiency. Kuan-Hsiung Yang helped with organizing and planning of the project, correcting and revising the paper and providing guidance, supervision, and financial support .All authors read and approved the final manuscript.
Conflicts of Interest
The authors declare no conflict of interest.
Nomenclature
The following abbreviations, greek letters and subscripts are used in this article:
| ASHP | Air source heat pump |
| WSHP | Water source heat pump |
| AC | Coefficient of performance |
| HP | Heat pump |
| M & V | Measurement and verification |
| C | Specific heat |
| L | Part load factor |
| P | Power consumption of a HP compressor |
| Q | Cooling capacity or heating capacity on the WSHP |
| h | Specific enthalpy |
| s | Specific entropy |
| T | Temperature |
| Mass flow rate | |
| Heat transfer rate | |
| Exergy rate | |
| Irreversibility | |
| The rate of entropy change | |
| Greek Letters | |
| Ψ | flow (specific) exergy |
| η | efficiency |
| Subscripts | |
| a | air side |
| e | evaporation |
| h | heat dissipation/heating process |
| H | high temperature reservoir/hot water tank |
| L | low temperature reservoir/chilled water tank |
| o | ambient or outdoor air |
| p | pressure |
| r | refrigerant side |
| w | water side |
| in | inlet, input |
| out | outlet, output |
| ex | exergy |
| evap | evaporator |
| gen | generation |
| rev | reversible process or cycle |
| 1 | leaving the heat-dissipated component/condenser |
| 2 | entering the heat-dissipated component/condenser |
| 3 | entering evaporator |
| 4 | leaving evaporator |
References
- Bureau of Energy, Ministry of Economic Affairs, Handbook of Energy Savings in Hospital Building. Available online: http://www.ecct.org.tw/print/index.htm (accessed on 1 December 2015).
- Bonnema, E.; Studer, D.; Parker, A.; Pless, S.; Torcellini, P. Large Hospital 50% Energy Savings: Technical Support Document; National Renewable Energy Laboratory: Golden, CO, USA, 2010. [Google Scholar]
- Jin-Ming, S.; Wei-gong, Y. Discussion on cold and heat sources and their systems in hospital buildings. HV AC 2009, 39, 10–14. [Google Scholar]
- Chih-Chang, S. Evaluation of Energy Efficiency for Hot Water Supply System of Medical Establishment. Master’s Thesis, Department of Energy and Refrigeration Air-conditioning Engineering, National Taipei University of Technology, Taipei, Taiwan, 2008. [Google Scholar]
- Jiu, Z. Benefit analysis on combination of the water chiller’s heat recovery and heat pump water heater. Refrigeration 2008, 27, 72–75. [Google Scholar]
- Chih-Chiu, S. Water management of heat pump system for hot water supply in a medium size hospital. World Academy of Science, Engineering and Technology, 2009; Volume 53. Available online: http://citeseerx.ist.psu.edu/viewdoc/download?doi=10.1.1.308.1032&rep=rep1&type=pdf (accessed on 3 August 2015).
- Sung, W.P.; Tsai, T.T.; Huang, H.J.; Zhao, Y.K.; Cheng, D.C.; Lee, Y.K. Energy performance of water-to-water double-effect heat pumps system in large hospital. Int. Sustain. Dev. Res. Conf. 2010, 376–382. Available online: http://m.kl800.com/read/2e7356790afdbbd5c5d1e3a5.html (accessed on 9 December 2015).
- Jen-Jui, C. Study of Heat Pumps for the Application of Air-Conditioning and Heating for Beneficial Energy Saving of Hospital. Master’s Thesis, Department of Electrical Engineering, China University of Science and Technology, Hefei, China, 2010. [Google Scholar]
- Lam, J.C.; Chan, W.W. Energy performance of air-to-water and water-to-water heat pumps in hotel applications. Energy Convers. Manag. 2003, 44, 1625–1631. [Google Scholar] [CrossRef]
- Qiu-Lan, Z.; Shi, L.; Jun, C.; Gui-Ping, L. Comprehensive economic evaluation on heating by a water heat pump. J. North China Electr. Power Univ. 2004, 31, 93–96. [Google Scholar]
- Bilgen, E.; Takahashi, H. Exergy analysis and experimental study of heat pump system. Exergy Int. J. 2002, 2, 259–265. [Google Scholar] [CrossRef]
- Miura, N.; Ito, S. Studies of a heat pump using water and air heat sources in parallel. Heat Transf. Asian Res. 2000, 29, 473–490. [Google Scholar]
- SOLKANE Refrigerant Software Version 8.0. All Rights Reserved by Solvay Flour GmbH Hannover 2012. Available online: http://www.solvay.us/en/binaries/SOLKANE_Refrigerants-238168.pdf (accessed on 23 September 2015).
- Air-Conditioning, Heating, and Refrigeration Institute. Performance Rating of Water-Chilling and Heat Pump Water-Heating Packages Using the Vapor Compression Cycle. AHRI Standard 550/590 (IP). AHRI, 2011; pp. 19–22. Available online: http://www.ahrinet.org/App_Content/ahri/files/STANDARDS/AHRI/AHRI_Standard_550-590_I-P_2015_with_Errata.pdf (accessed on 14 June 2014).
- Stoecker, W.F.; Jones, J.W. Compressors. In Refrigeration and Air Conditioning, 2nd ed.; McGraw-Hill, Inc.: New York, NY, USA, 1982. [Google Scholar]
- Schibuola, L.; Scarpa, M. Experimental analysis of performances of a surface water source heat pump. Energy Build. 2016, 113, 182–188. [Google Scholar] [CrossRef]
Figure 1.
Power consumption distribution of facilities in a typical hospital building [1].
Figure 1.
Power consumption distribution of facilities in a typical hospital building [1].

Figure 2.
The energy consumption proportion of using fuel-consumed facilities for the different purposes in hospital buildings [1].
Figure 2.
The energy consumption proportion of using fuel-consumed facilities for the different purposes in hospital buildings [1].

Figure 3.
The methodology, composed of the six main stages developed in this study.

Figure 4.
A schematic diagram of the parallel integration of the WSHP and chiller.

Figure 5.
Heat pump using dual heat sources in parallel to meet heating and cooling load.

Figure 6.
A schematic diagram of combination design of WSHP with dual-condenser and chiller.

Figure 7.
The simulated results of the COP for operating at high and low pressure.

Figure 8.
A schematic diagram of the WSHP for COP measurement and verification.

Figure 9.
A bird’s eye view of K Hospital in southern Taiwan.

Figure 10.
Monthly mean temperature of outdoor air and mean temperature of tap water supply in Kaohsiung in a year.
Figure 10.
Monthly mean temperature of outdoor air and mean temperature of tap water supply in Kaohsiung in a year.

Figure 11.
Statistical chart of monthly hot water supply flow rate of K Hospital in a year.

Figure 12.
Hourly hot water supply flow rate and temperature in an ordinary working day in the summer before retrofit.
Figure 12.
Hourly hot water supply flow rate and temperature in an ordinary working day in the summer before retrofit.

Figure 13.
The effect of evaporation temperature on the COP for heating, power consumption and heating capacity in a typical ASHP, simulated under the same cooling capacity as the WHSP.
Figure 13.
The effect of evaporation temperature on the COP for heating, power consumption and heating capacity in a typical ASHP, simulated under the same cooling capacity as the WHSP.

Figure 14.
The effect of evaporation temperature on the exergy destruction and exergy efficiency in a typical ASHP, simulated under the same cooling capacity of the WHSP.
Figure 14.
The effect of evaporation temperature on the exergy destruction and exergy efficiency in a typical ASHP, simulated under the same cooling capacity of the WHSP.

Figure 15.
A schematic diagram showing the design of the water source heat pump to integrate with an existing chilled water plant and the AHU.
Figure 15.
A schematic diagram showing the design of the water source heat pump to integrate with an existing chilled water plant and the AHU.


Table 1.
The engineering specification obtained from a WSHP manufacturer.
| Hot Water Pump | ||
| Specification data | Inlet | Outlet |
| Pressure (kg/cm2) | 5.6 | 6.6 |
| Water flow rate (LPM) | 521 | |
| Chilled Water Pump | ||
| Pressure (kg/cm2) | 5.7 | 7.0 |
| Water flow rate (LPM) | 927 | |
| Refrigerant Loop (R134a) | ||
| Pressure (kg/cm2) | evaporator (3.3); condenser (14.1) | evaporator (2.8); condenser (13.6) |
| Cooling capacity (kW) | 107.3 | |
| Heating capacity (kW) | 147.5 | |
| Power consumption (kW) | 39.9 | |
| COP | 2.69 for cooling; 3.70 for heating | |
Table 2.
The comparison of an engineering specification and a computer simulation result.
| Name of Items | Engineering Specification | Computer Simulation |
|---|---|---|
| Qe; Qh (kW) | 107.3; 147.5 | 107.0; 147.0 |
| P (kW) | 39.9 | 39.4 |
| COPc; COPh | 2.69; 3.70 | 2.72; 3.72 |
| Dev. of Qe | base | 0.3% |
| Dev. of Qh | base | 0.3% |
| Dev. of COPc & COPh | base | 1.1%; 0.5% |
Table 3.
Simulation results for enthalpy and entropy by given parameters with ASHP and WSHP.
| Parameters | Evaporating Refrigerant Side | Water Source | Air Source |
|---|---|---|---|
| Te (°C) | 7 | - | - |
| Tin (°C) | - | 12 | 29 |
| Tout (°C) | - | 7 | 24 |
| m (kg/s) | 0.9 | 5.3 | 11.4 |
| hin (kJ/kg) | 278.9 | 50.4 | 94.9 |
| hout (kJ/kg) | 402.5 | 29.4 | 72.4 |
| sin (kJ/kg·K) | 1.28 | 0.18 | 0.33 |
| sout (kJ/kg·K) | 1.72 | 0.11 | 0.26 |
Table 4.
Analysis results on the effect of evaporation temperature on the exergy destruction and exergy efficiency of heat pump.
Table 4.
Analysis results on the effect of evaporation temperature on the exergy destruction and exergy efficiency of heat pump.
| Te (℃) | mr (kg/s) | hr,5 (kJ/kg) | hr,6 (kJ/kg) | sr,5 (kJ/kg) | sr,6 (kJ/kg) | P (kW) | Qh (kW) | COPh | Ievap | ηex,evap (%) | ηex,hp (%) |
| 7 | 0.898 | 278.88 | 402.50 | 1.280 | 1.723 | 42.5 | 154 | 3.62 | 10.23 | 0.36 | 0.53 |
| 6 | 0.902 | 278.88 | 401.94 | 1.280 | 1.724 | 44.0 | 156 | 3.55 | 11.04 | 0.32 | 0.52 |
| 5 | 0.906 | 278.88 | 401.37 | 1.281 | 1.724 | 45.5 | 157 | 3.45 | 11.32 | 0.31 | 0.50 |
| 4 | 0.911 | 278.88 | 400.80 | 1.282 | 1.725 | 47.1 | 159 | 3.38 | 11.89 | 0.29 | 0.49 |
| 3 | 0.915 | 278.88 | 400.22 | 1.283 | 1.725 | 48.8 | 160 | 3.28 | 12.18 | 0.28 | 0.48 |
| 2 | 0.919 | 278.88 | 399.65 | 1.284 | 1.726 | 50.5 | 162 | 3.21 | 12.75 | 0.27 | 0.47 |
| 1 | 0.924 | 278.88 | 399.07 | 1.285 | 1.726 | 52.3 | 164 | 3.14 | 13.07 | 0.26 | 0.46 |
Remark: Subscript 5 stands for evaporator inlet condition, and subscript 6 stands for evaporator outlet condition.
Table 5.
Full-scale experimental data of the WSHP system in K Hospital.
| Date/Time | Power | Chilled Water Flow Rate | Tc,out | Tc,in | Hot Water Flow Rate | Th,out | Th,in | Qc | Qh | % of HB | COPh | COPc |
|---|---|---|---|---|---|---|---|---|---|---|---|---|
| Unit | kW | L/min | °C | °C | L/min | °C | °C | kW | kW | |||
| 8/23 00:20 | 43.2 | 411.0 | 5.6 | 9.3 | 568.0 | 50.8 | 47.1 | 103.57 | 147.11 | 0.23% | 3.41 | 2.40 |
| 8/23 06:35 | 43.2 | 412.0 | 7.4 | 11.3 | 569.0 | 49.9 | 46.0 | 112.48 | 155.34 | −0.22% | 3.60 | 2.60 |
| 8/23 07:15 | 42.9 | 412.0 | 7.4 | 11.3 | 568.0 | 49.7 | 45.8 | 112.48 | 155.06 | −0.20% | 3.61 | 2.62 |
| 8/23 07:25 | 43.2 | 412.0 | 5.5 | 9.1 | 568.0 | 50.8 | 47.1 | 103.82 | 147.11 | 0.06% | 3.41 | 2.40 |
| 8/23 07:55 | 42.6 | 414.0 | 7.4 | 11.3 | 569.0 | 49.5 | 45.6 | 113.02 | 155.34 | −0.18% | 3.65 | 2.65 |
| 8/23 17:35 | 42.6 | 412.0 | 7.4 | 11.4 | 568.0 | 49.5 | 45.6 | 112.48 | 155.06 | −0.01% | 3.64 | 2.64 |
| 8/23 18:00 | 43.1 | 414.0 | 9.5 | 13.5 | 569.0 | 50.0 | 46.0 | 115.92 | 159.32 | 0.19% | 3.70 | 2.69 |
| 8/23 19:05 | 41.1 | 412.0 | 6.2 | 10.1 | 567.0 | 47.7 | 43.9 | 109.59 | 150.82 | 0.09% | 3.67 | 2.67 |
| 8/23 19:35 | 44.0 | 413.0 | 7.3 | 11.2 | 568.0 | 51.3 | 47.5 | 106.97 | 151.09 | 0.08% | 3.43 | 2.43 |
| 8/23 20:00 | 42.2 | 414.0 | 7.5 | 11.5 | 569.0 | 48.8 | 44.9 | 113.02 | 155.34 | 0.07% | 3.68 | 2.68 |
| 8/23 21:10 | 43.4 | 412.0 | 5.9 | 9.5 | 568.0 | 51.1 | 47.4 | 103.82 | 147.11 | −0.08% | 3.39 | 2.39 |
| 8/23 21:35 | 42.7 | 414.0 | 8.6 | 12.6 | 569.0 | 49.2 | 45.3 | 113.02 | 155.34 | −0.25% | 3.64 | 2.65 |
| 8/24 00:45 | 43.2 | 413.0 | 6.2 | 9.8 | 568.0 | 50.7 | 47.0 | 104.08 | 147.11 | −0.11% | 3.41 | 2.41 |
| 8/24 09:40 | 41.6 | 414.0 | 8.9 | 12.9 | 566.0 | 48.1 | 44.2 | 113.02 | 154.52 | −0.07% | 3.71 | 2.72 |
| 8/24 09:55 | 43.3 | 412.0 | 7.9 | 11.9 | 567.0 | 50.4 | 46.4 | 115.36 | 158.76 | 0.06% | 3.67 | 2.66 |
| 8/24 10:00 | 44.2 | 412.0 | 7.0 | 10.7 | 568.0 | 51.0 | 47.2 | 106.71 | 151.09 | 0.12% | 3.42 | 2.41 |
| 8/24 12:05 | 43.1 | 413.0 | 8.3 | 12.3 | 567.0 | 50.2 | 46.2 | 115.64 | 158.76 | 0.01% | 3.68 | 2.68 |
| 8/24 15:20 | 43.6 | 412.0 | 7.9 | 11.9 | 569.0 | 50.4 | 46.4 | 115.36 | 159.32 | 0.23% | 3.65 | 2.65 |
| 8/24 17:25 | 40.9 | 410.0 | 7.5 | 11.6 | 567.0 | 48.3 | 44.3 | 117.67 | 158.76 | 0.12% | 3.88 | 2.88 |
| 8/24 18:15 | 42.1 | 411.0 | 8.1 | 11.9 | 568.0 | 49.1 | 45.3 | 109.33 | 151.09 | −0.22% | 3.59 | 2.60 |
| 8/24 18:30 | 41.6 | 410.0 | 8.5 | 12.4 | 569.0 | 48.4 | 44.4 | 117.67 | 159.32 | 0.03% | 3.83 | 2.83 |
| 8/24 18:55 | 40.1 | 411.0 | 9.4 | 13.4 | 567.0 | 46.6 | 42.7 | 115.08 | 154.79 | −0.25% | 3.86 | 2.87 |
| 8/24 19:15 | 42.0 | 409.0 | 6.2 | 10.1 | 568.0 | 48.9 | 45.1 | 108.79 | 151.09 | 0.19% | 3.60 | 2.59 |
| 8/24 20:30 | 42.0 | 410.0 | 6.6 | 10.3 | 569.0 | 48.9 | 45.1 | 109.06 | 151.35 | 0.19% | 3.60 | 2.60 |
| 8/24 20:40 | 43.1 | 410.0 | 6.9 | 10.8 | 569.0 | 50.1 | 46.2 | 111.93 | 155.34 | 0.20% | 3.60 | 2.60 |
| 8/24 21:20 | 43.2 | 409.0 | 7.8 | 11.8 | 566.0 | 50.1 | 46.2 | 111.66 | 154.52 | −0.22% | 3.58 | 2.58 |
| 8/25 06:35 | 42.5 | 409.0 | 6.6 | 10.4 | 568.0 | 49.8 | 46.0 | 108.79 | 151.09 | −0.14% | 3.56 | 2.56 |
| 8/25 09:00 | 40.6 | 409.0 | 6.2 | 10.0 | 566.0 | 47.6 | 43.9 | 105.93 | 146.59 | 0.04% | 3.61 | 2.61 |
| 8/25 10:35 | 43.3 | 410.0 | 8.1 | 11.8 | 567.0 | 50.8 | 47.1 | 103.32 | 146.85 | 0.16% | 3.39 | 2.39 |
| 8/25 12:25 | 41.8 | 409.0 | 7.1 | 10.9 | 567.0 | 48.9 | 45.1 | 108.79 | 150.82 | 0.15% | 3.61 | 2.60 |
| 8/25 13:05 | 41.4 | 410.0 | 8.8 | 12.9 | 569.0 | 48.2 | 44.2 | 117.67 | 159.32 | 0.16% | 3.85 | 2.84 |
| 8/25 13:30 | 41.3 | 412.0 | 9.1 | 12.9 | 568.0 | 48.7 | 44.9 | 109.59 | 151.09 | 0.13% | 3.66 | 2.65 |
| 8/25 14:45 | 42.2 | 408.0 | 6.3 | 10.1 | 568.0 | 49.6 | 45.8 | 108.53 | 151.09 | 0.24% | 3.58 | 2.57 |
| 8/25 15:55 | 42.8 | 411.0 | 10.4 | 14.3 | 568.0 | 49.9 | 46.0 | 112.20 | 155.06 | 0.04% | 3.62 | 2.62 |
| 8/25 16:00 | 43.0 | 410.0 | 9.0 | 12.9 | 567.0 | 50.2 | 46.3 | 111.93 | 154.79 | −0.09% | 3.60 | 2.60 |
| 8/25 16:05 | 43.2 | 409.0 | 8.0 | 11.8 | 568.0 | 50.8 | 46.9 | 111.66 | 155.06 | 0.13% | 3.59 | 2.58 |
| 8/25 16:50 | 43.2 | 411.0 | 10.1 | 14.1 | 569.0 | 50.2 | 46.3 | 112.20 | 155.34 | −0.04% | 3.60 | 2.60 |
| 8/25 16:55 | 43.7 | 410.0 | 9.2 | 13.1 | 569.0 | 50.7 | 46.8 | 111.93 | 155.34 | −0.19% | 3.55 | 2.56 |
| 8/25 17:35 | 41.6 | 411.0 | 8.9 | 12.7 | 568.0 | 48.6 | 44.8 | 109.33 | 151.09 | 0.11% | 3.63 | 2.63 |
| 8/25 19:25 | 41.8 | 407.0 | 5.3 | 8.9 | 568.0 | 49.4 | 45.7 | 105.41 | 147.11 | −0.07% | 3.52 | 2.52 |
| 8/25 20:25 | 42.5 | 408.0 | 6.2 | 10.0 | 567.0 | 50.0 | 46.2 | 108.53 | 150.82 | −0.14% | 3.55 | 2.55 |
| 8/25 21:40 | 43.1 | 409.0 | 8.2 | 12.1 | 567.0 | 50.1 | 46.2 | 111.66 | 154.79 | 0.02% | 3.59 | 2.59 |
| 8/26 06:50 | 42.6 | 408.0 | 7.2 | 11.1 | 567.0 | 49.6 | 45.8 | 108.53 | 150.82 | −0.20% | 3.54 | 2.55 |
| 8/26 08:15 | 42.4 | 409.0 | 7.2 | 11.1 | 569.0 | 49.6 | 45.8 | 108.79 | 151.35 | 0.11% | 3.57 | 2.57 |
| 8/26 08:50 | 41.7 | 409.0 | 8.6 | 12.6 | 567.0 | 48.2 | 44.2 | 117.38 | 158.76 | −0.20% | 3.81 | 2.81 |
| 8/26 09:20 | 40.2 | 411.0 | 9.9 | 13.9 | 568.0 | 46.7 | 42.8 | 115.08 | 155.06 | −0.14% | 3.86 | 2.86 |
| 8/26 09:25 | 40.1 | 410.0 | 9.0 | 13.0 | 568.0 | 46.1 | 42.2 | 114.80 | 155.06 | 0.11% | 3.87 | 2.86 |
| 8/26 09:55 | 42.6 | 412.0 | 9.6 | 13.6 | 568.0 | 49.5 | 45.6 | 112.48 | 155.06 | −0.01% | 3.64 | 2.64 |
| 8/26 10:00 | 43.3 | 411.0 | 9.3 | 13.2 | 569.0 | 50.0 | 46.1 | 112.20 | 155.34 | −0.11% | 3.59 | 2.59 |
| 8/26 11:15 | 43.4 | 409.0 | 8.2 | 12.1 | 568.0 | 50.2 | 46.3 | 111.66 | 155.06 | 0.00% | 3.57 | 2.57 |
| Average | 42.5 | 411 | 7.8 | 11.7 | 568 | 49.5 | 45.6 | 111.0 | 153.5 | 0.00% | 3.62 | 2.62 |
Table 6.
A comparison among the engineering specification, computer simulation, and the experimental measurement results.
Table 6.
A comparison among the engineering specification, computer simulation, and the experimental measurement results.
| Name of Items | Engineering Specification | Computer Simulation | Experimental Measurement |
|---|---|---|---|
| Qe (kW) | 107.3 | 107.0 | 111.0 |
| Qh (kW) | 147.5 | 147.0 | 153.5 |
| P (kW) | 39.9 | 39.4 | 42.5 |
| COPc; COPh | 2.69; 3.70 | 2.72; 3.72 | 2.62; 3.62 |
| Dev. of Qe | base | 0.3% | 4.1% |
| Dev. of Qh | base | 0.3% | 3.4% |
| Dev. of COPc & COPh | base | 1.1%; 0.5% | 2.6%; 2.2% |
Table 7.
A comparison list of energy saving and economic benefit before and after the retrofit.
| Survey Information before Retrofit | |
| heating value demand | 1,520,402 Mcal |
| Boiler efficiency | 75% |
| electricity consumption for heating(equivalent) | 1,767,910 kWh |
| cost of heating energy 1 | $137,786 |
| Operating Energy Consumption in WSHP after Retrofit | |
| Operation performance (COPc & COPh) | 2.62; 3.62, a full-load operation is assumed |
| electricity consumption for heating | 491,086 kWh |
| cost of heating energy 1 | $47,574 |
| electricity saving for cooling | 127,500 kWh |
| operating electricity and cost saving in total | 1,404,324 kWh; $102,564 |
| Investment Return by Using Simple Payback | |
| 1.2 years | |
1 power tariff = 9.7 cents/kwh in Taiwan.
© 2017 by the authors. Licensee MDPI, Basel, Switzerland. This article is an open access article distributed under the terms and conditions of the Creative Commons Attribution (CC BY) license (http://creativecommons.org/licenses/by/4.0/).
Share and Cite
MDPI and ACS Style
Chiang, C.-Y.; Yang, R.; Yang, K.-H.; Lee, S.-K. Performance Analysis of an Integrated Heat Pump with Air-Conditioning System for the Existing Hospital Building Application. Sustainability 2017, 9, 530. https://doi.org/10.3390/su9040530
AMA Style
Chiang C-Y, Yang R, Yang K-H, Lee S-K. Performance Analysis of an Integrated Heat Pump with Air-Conditioning System for the Existing Hospital Building Application. Sustainability. 2017; 9(4):530. https://doi.org/10.3390/su9040530
Chicago/Turabian StyleChiang, Chen-Yu, Ru Yang, Kuan-Hsiung Yang, and Shin-Ku Lee. 2017. "Performance Analysis of an Integrated Heat Pump with Air-Conditioning System for the Existing Hospital Building Application" Sustainability 9, no. 4: 530. https://doi.org/10.3390/su9040530
Note that from the first issue of 2016, this journal uses article numbers instead of page numbers. See further details here.