
Community Resilience to Cyclone Disasters in Coastal Bangladesh


Abstract
:
1. Introduction
1.1. Bangladesh, Disaster Risk Reduction, and Sustainable Livelihoods
1.2. Vulnerability to Resilience (V2R) Programme
1.3. Research Objectives
- (a)
- To measure whether the selected communities have achieved the resilience characteristics set out by V2R.
- (b)
- To conduct a cost-benefit analysis for the V2R intervention.
- (c)
- To analyse V2R’s impact on the communities in terms of DRR and SL.
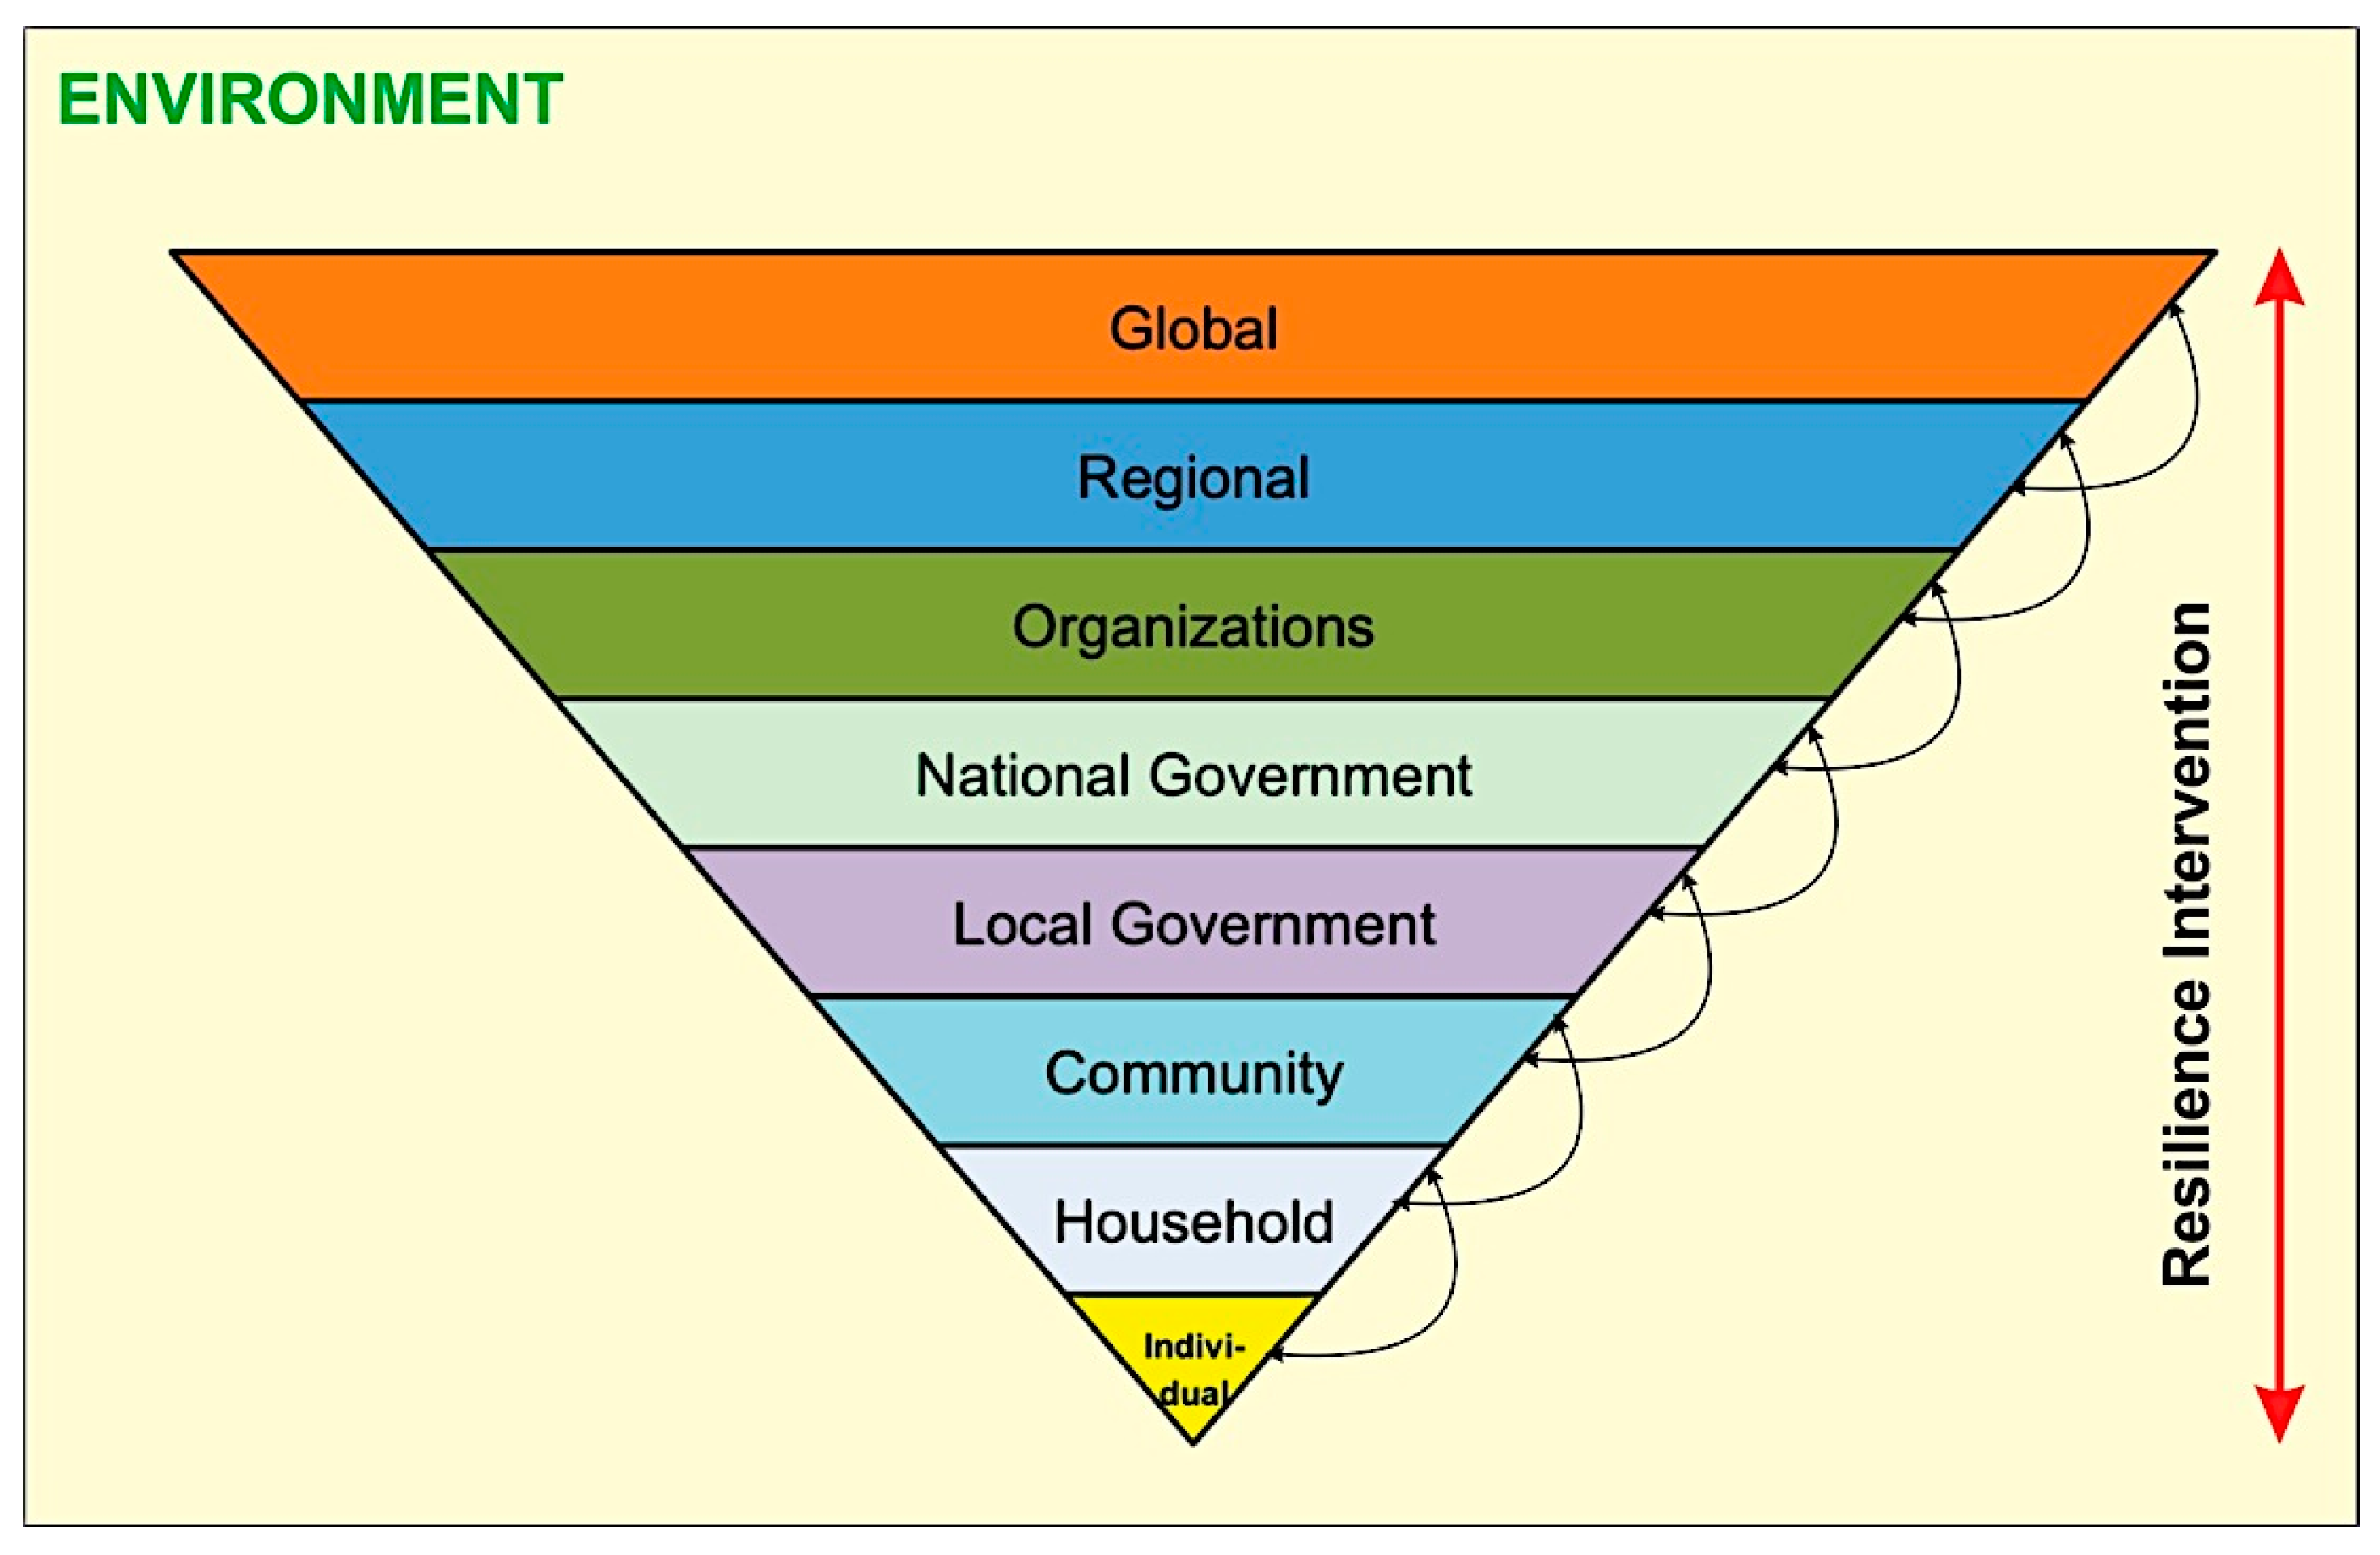
2. Theoretical Framework
- Characteristic 1: is knowledgeable, healthy and can meet its basic needs.
- Characteristic 2: has well-maintained and accessible infrastructure and services.
- Characteristic 3: has economic opportunities.
- Characteristic 4: is socially cohesive.
- Characteristic 5: can manage its natural assets.
- Characteristic 6: is connected.
3. Methodology
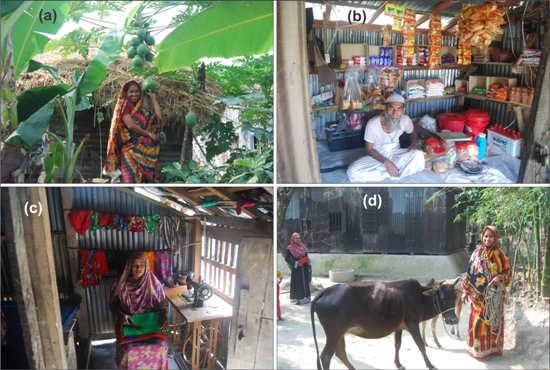
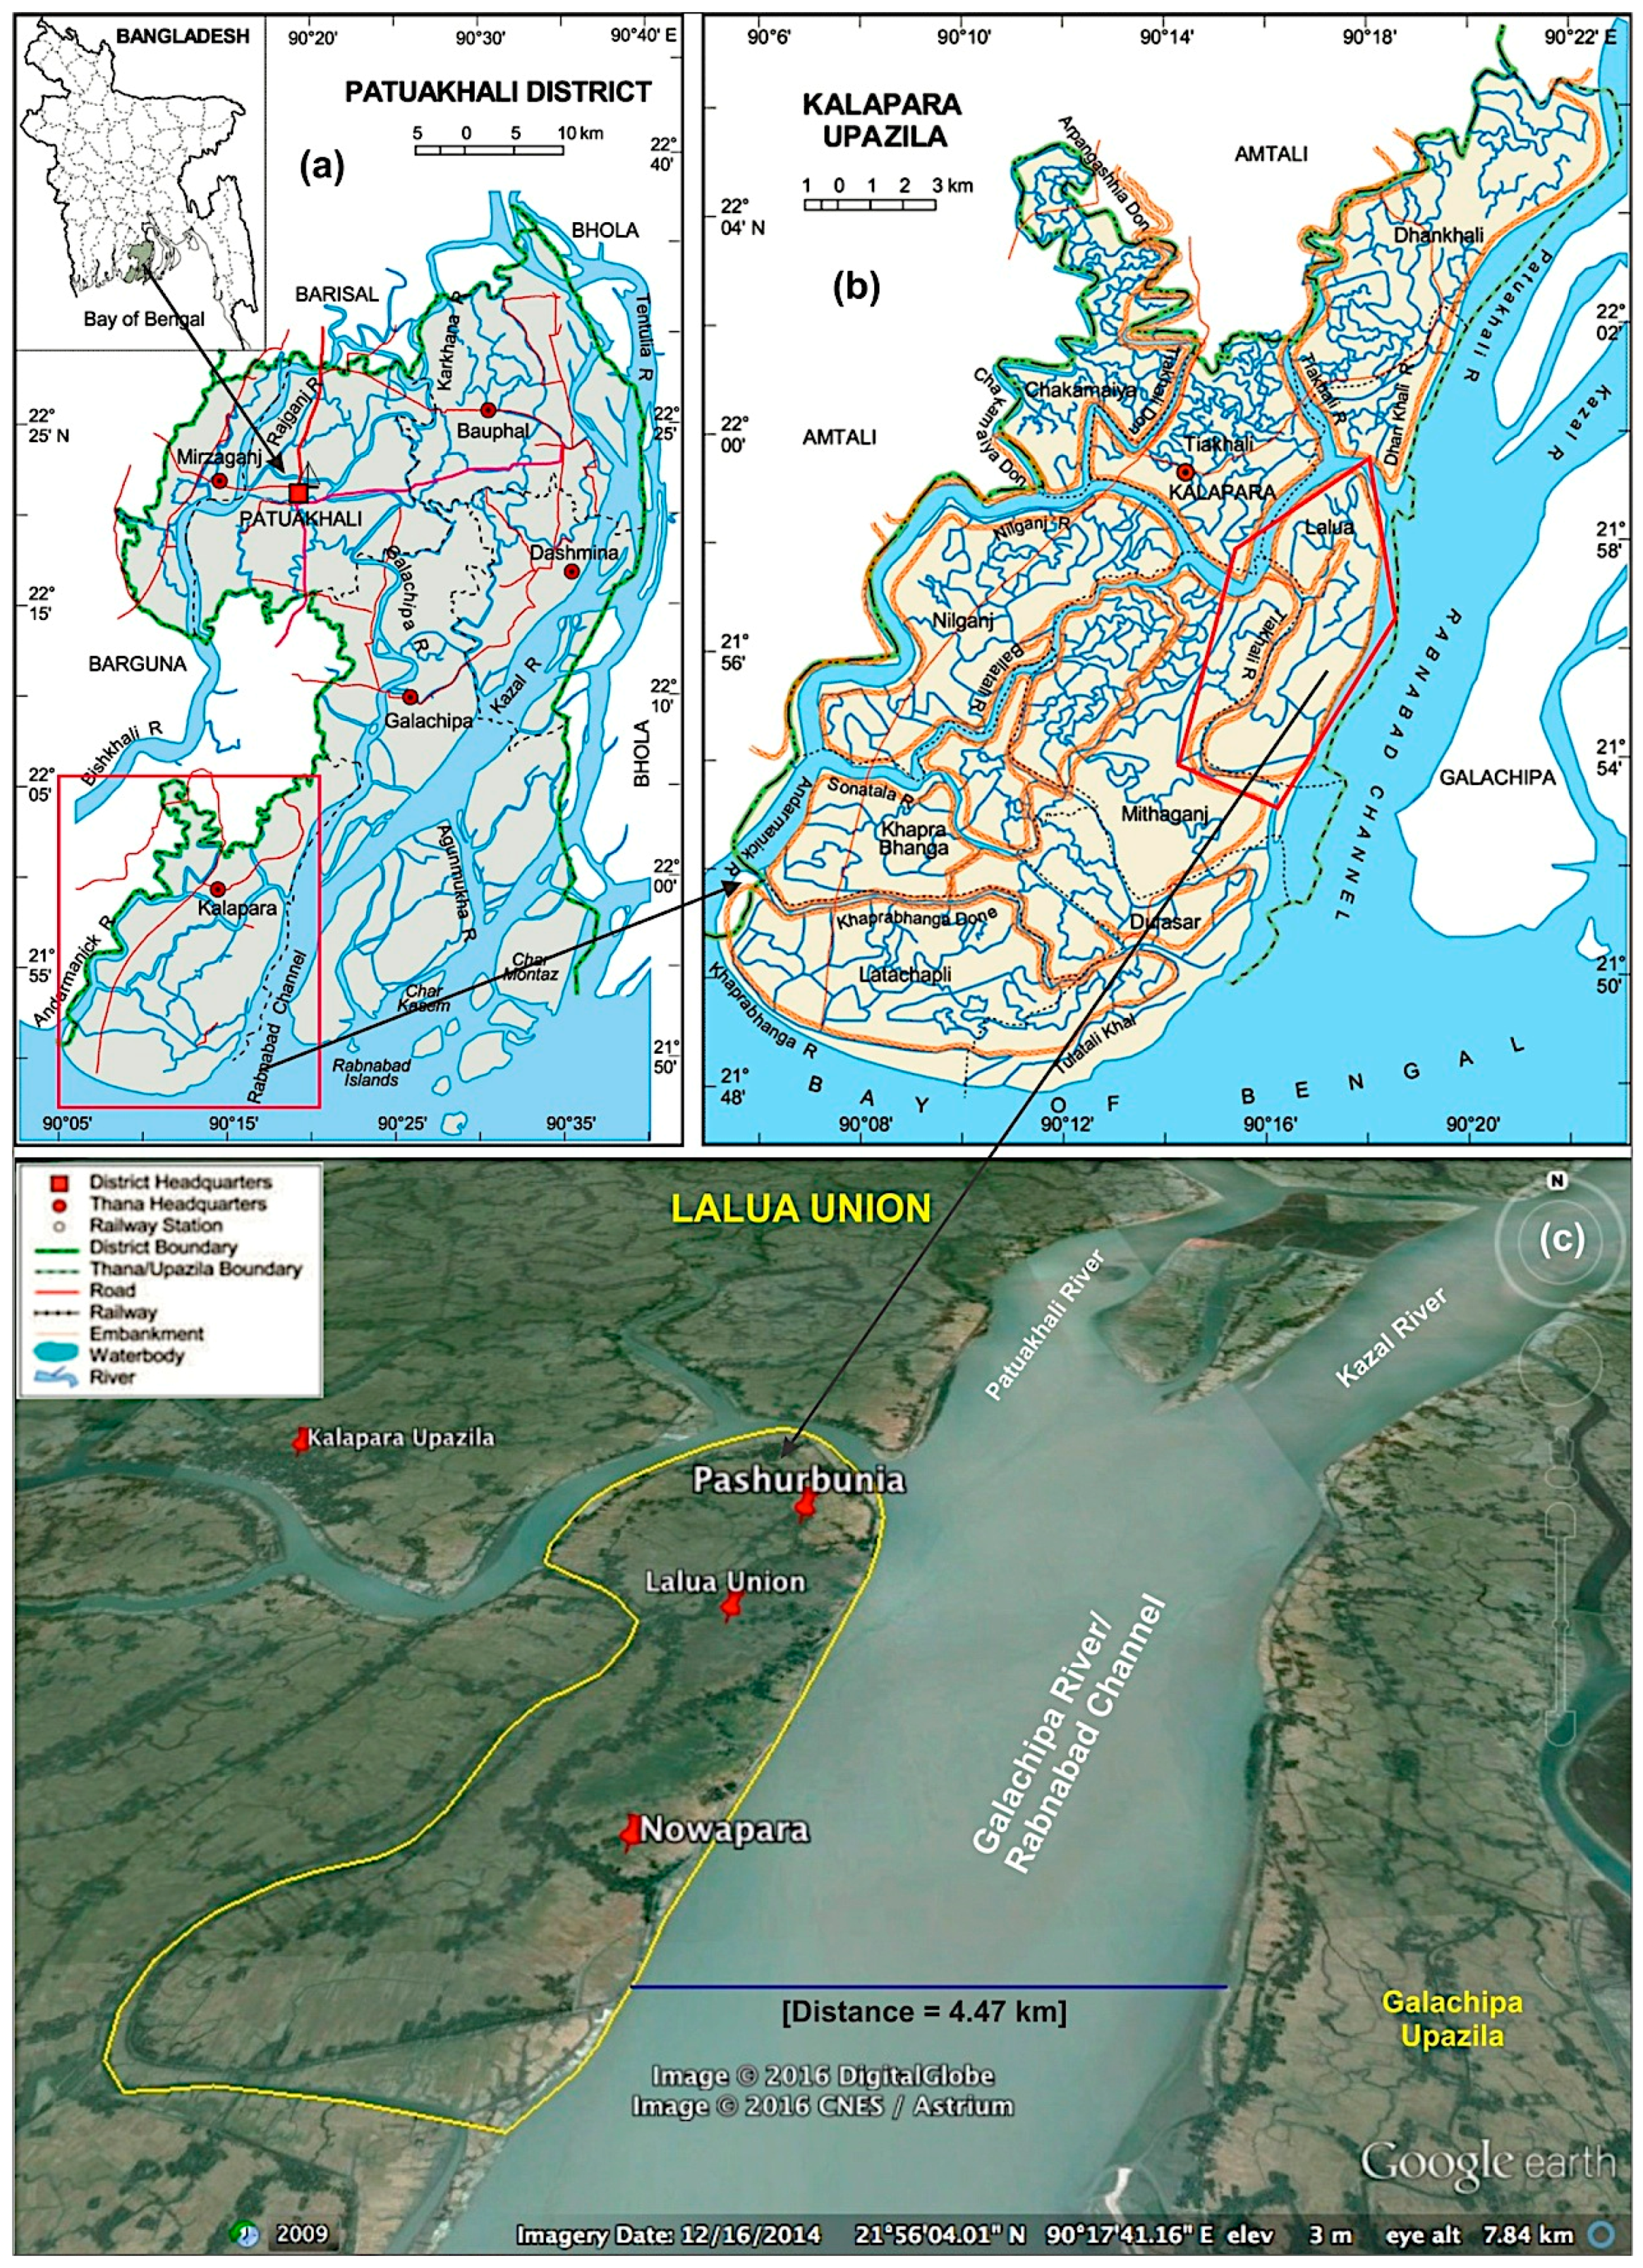
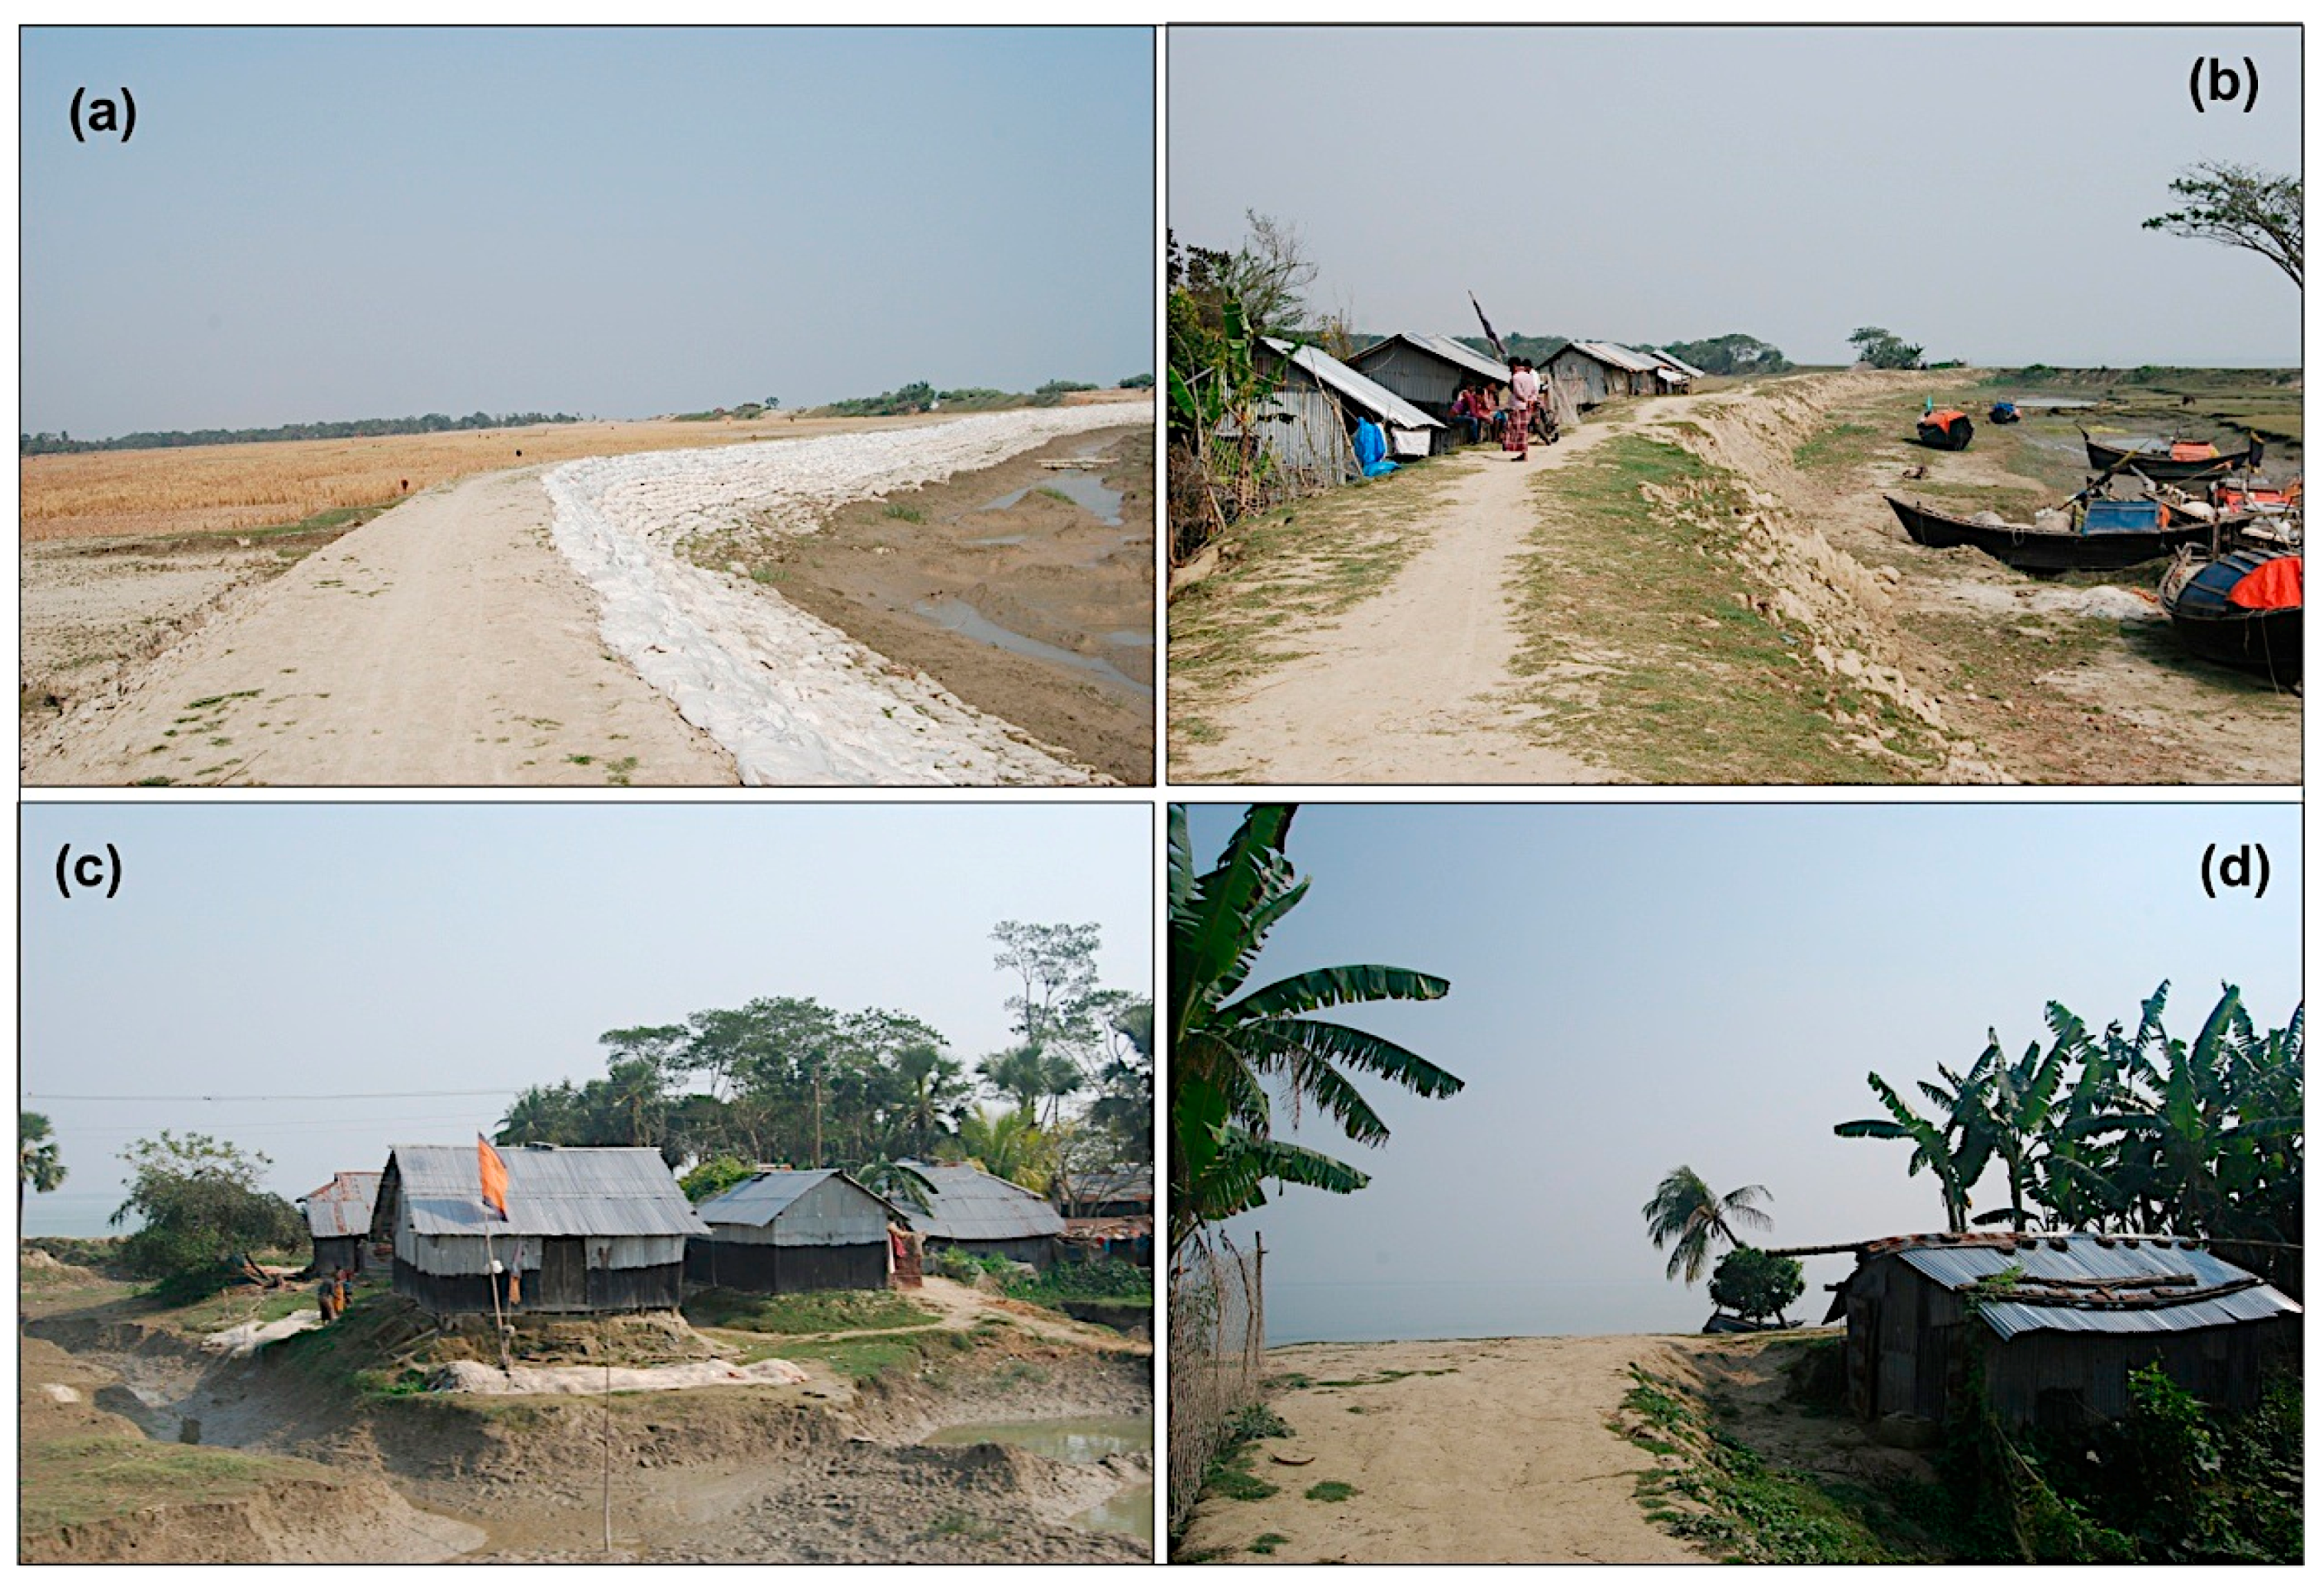
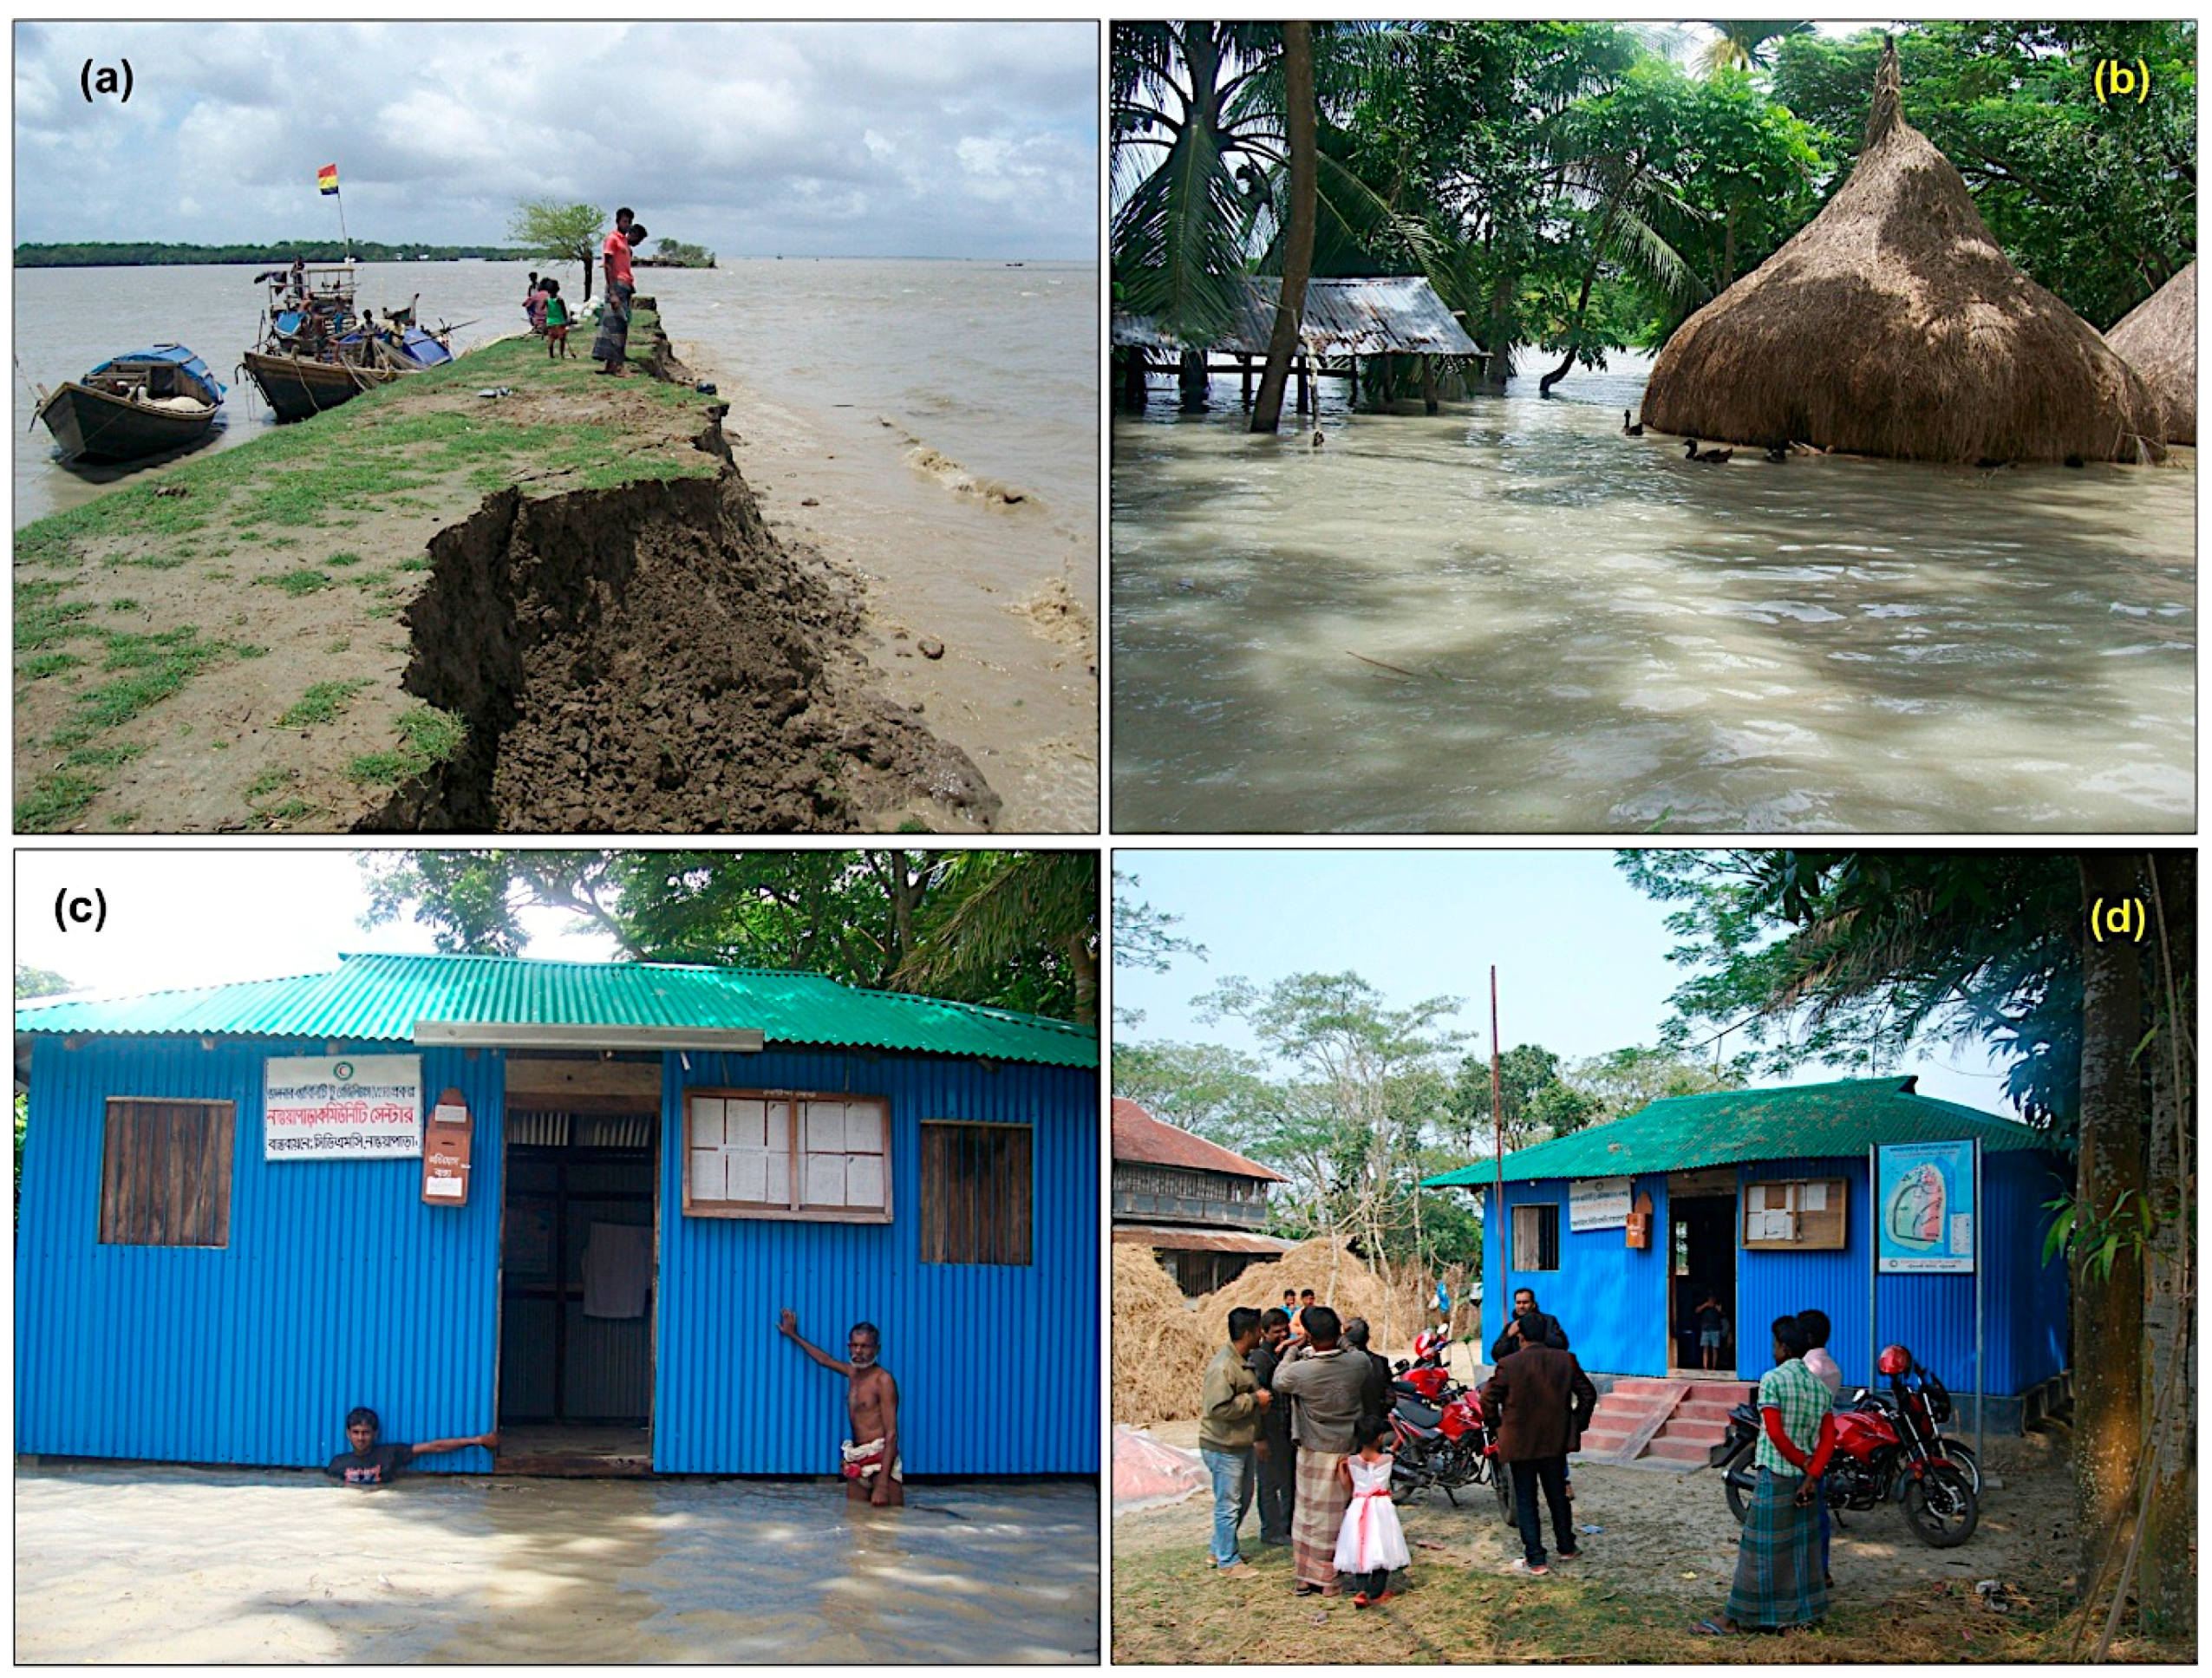
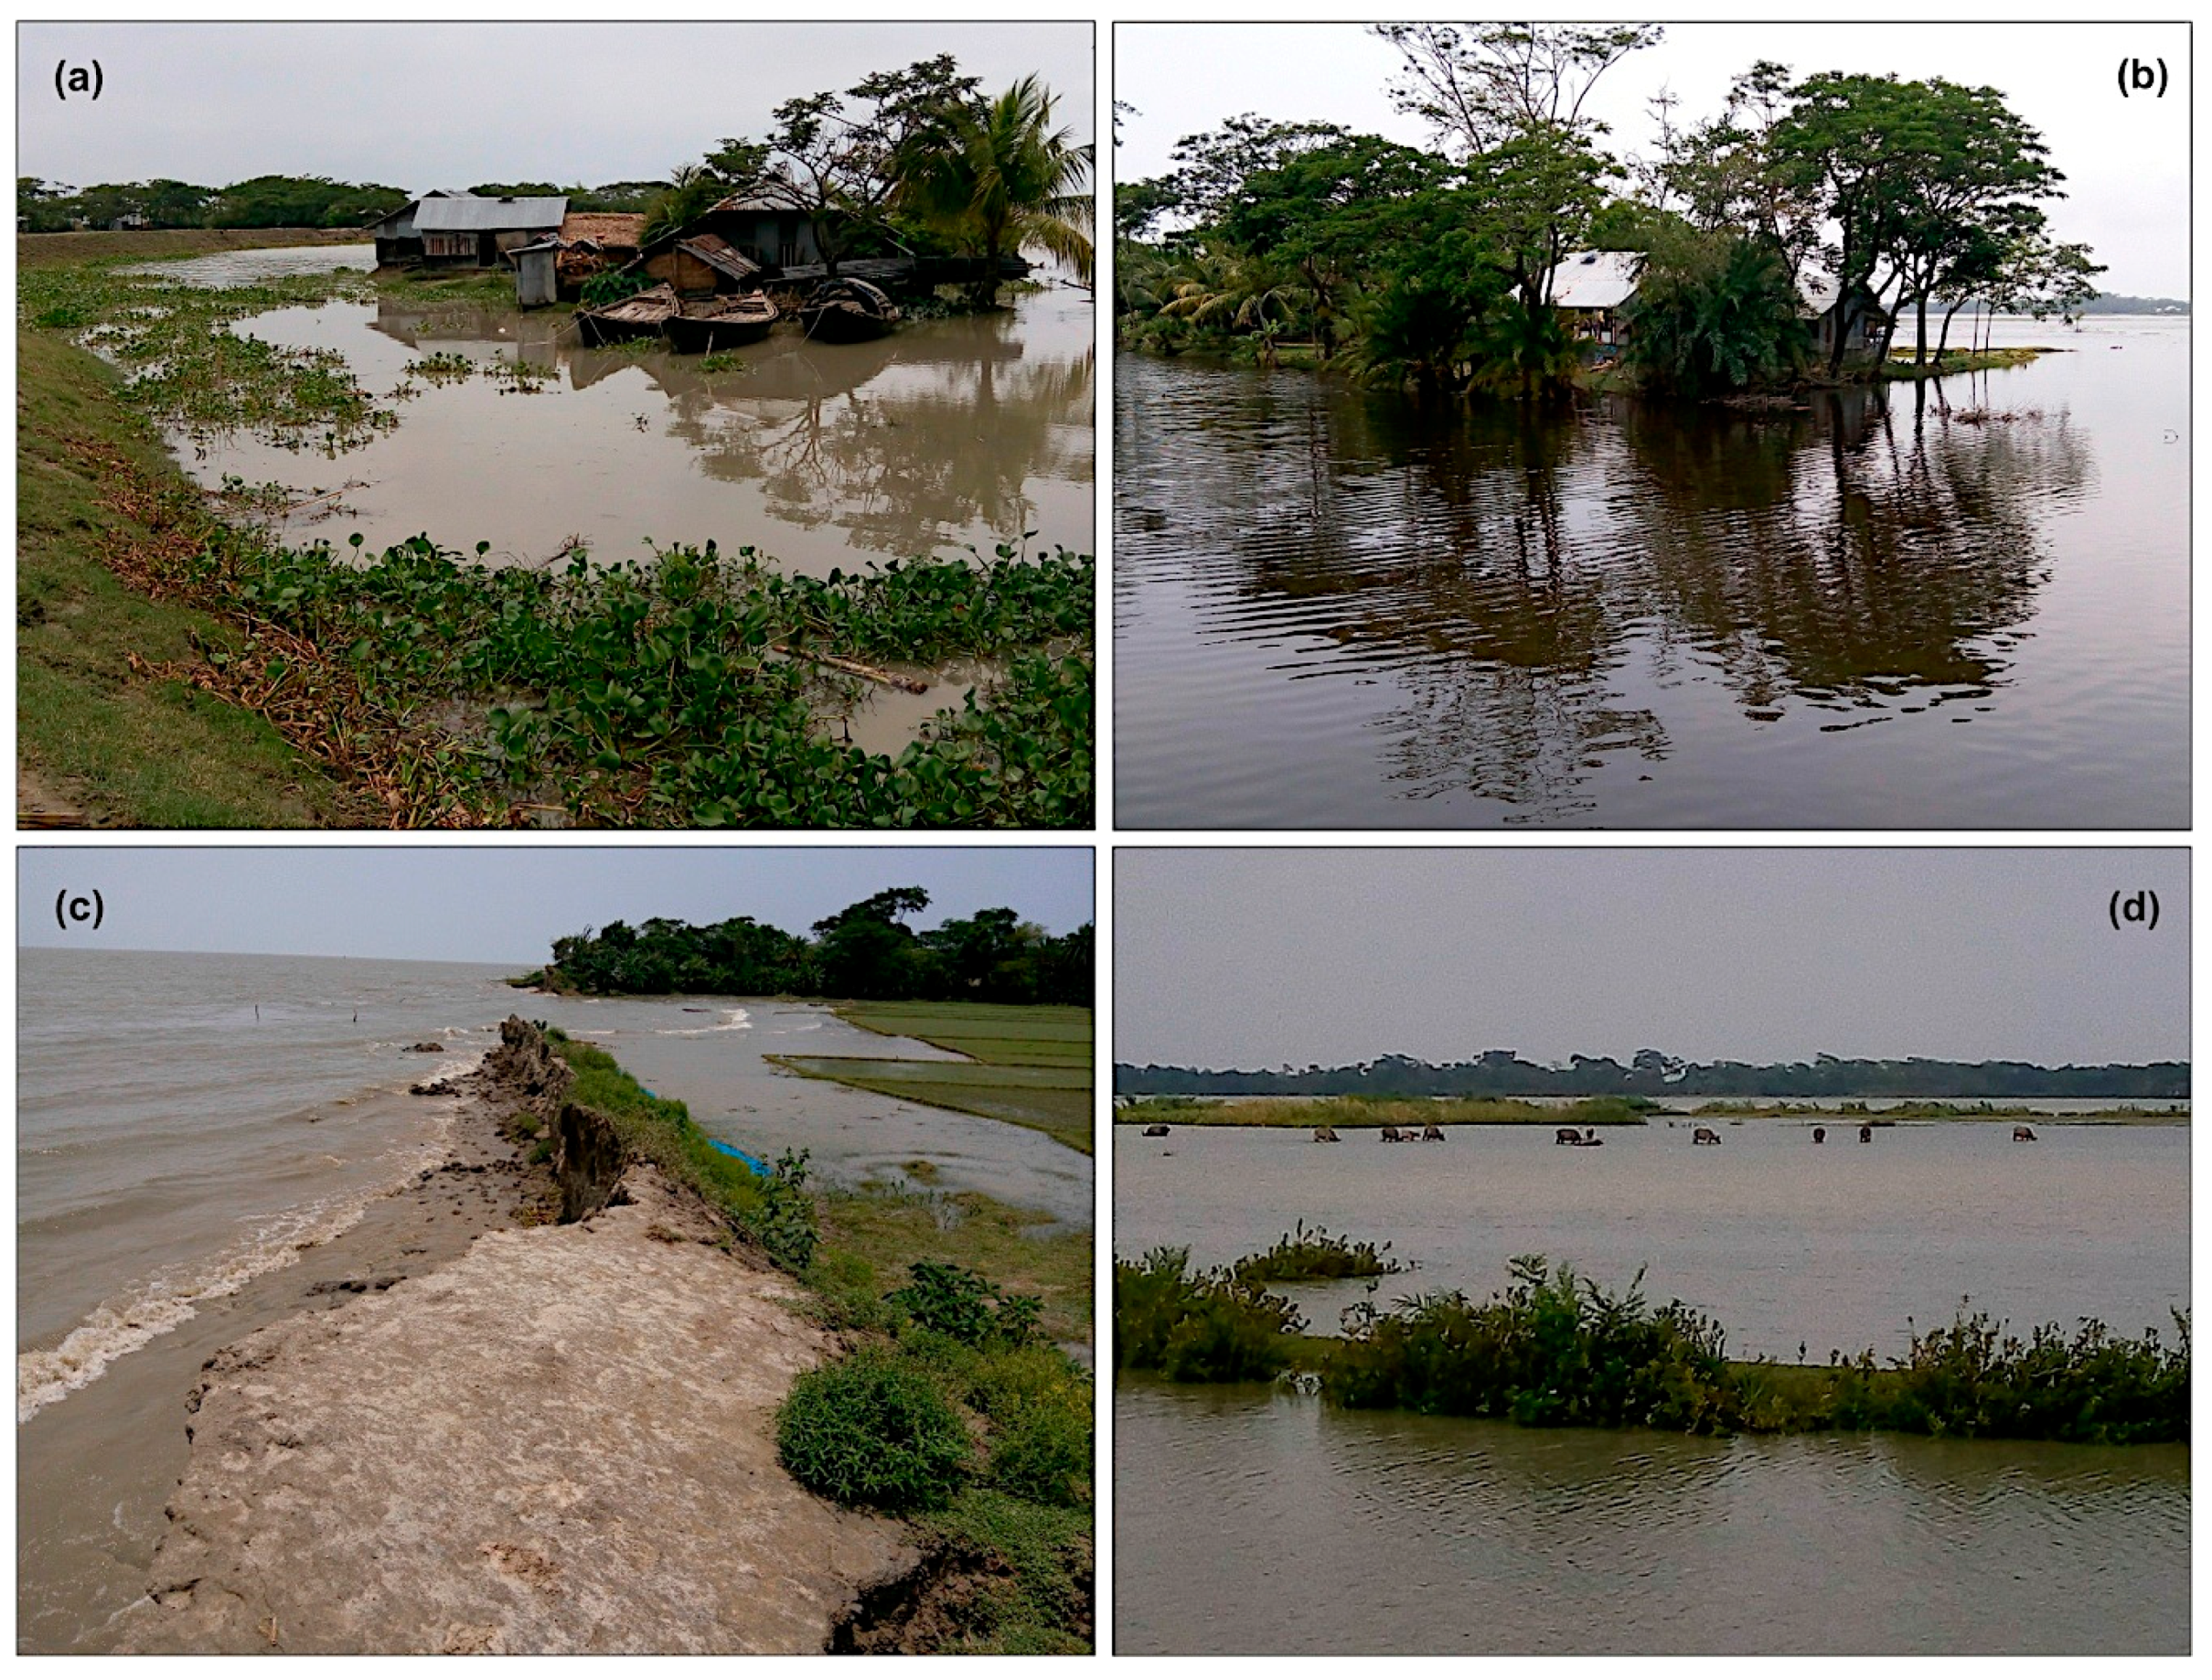
3.1. Study Area
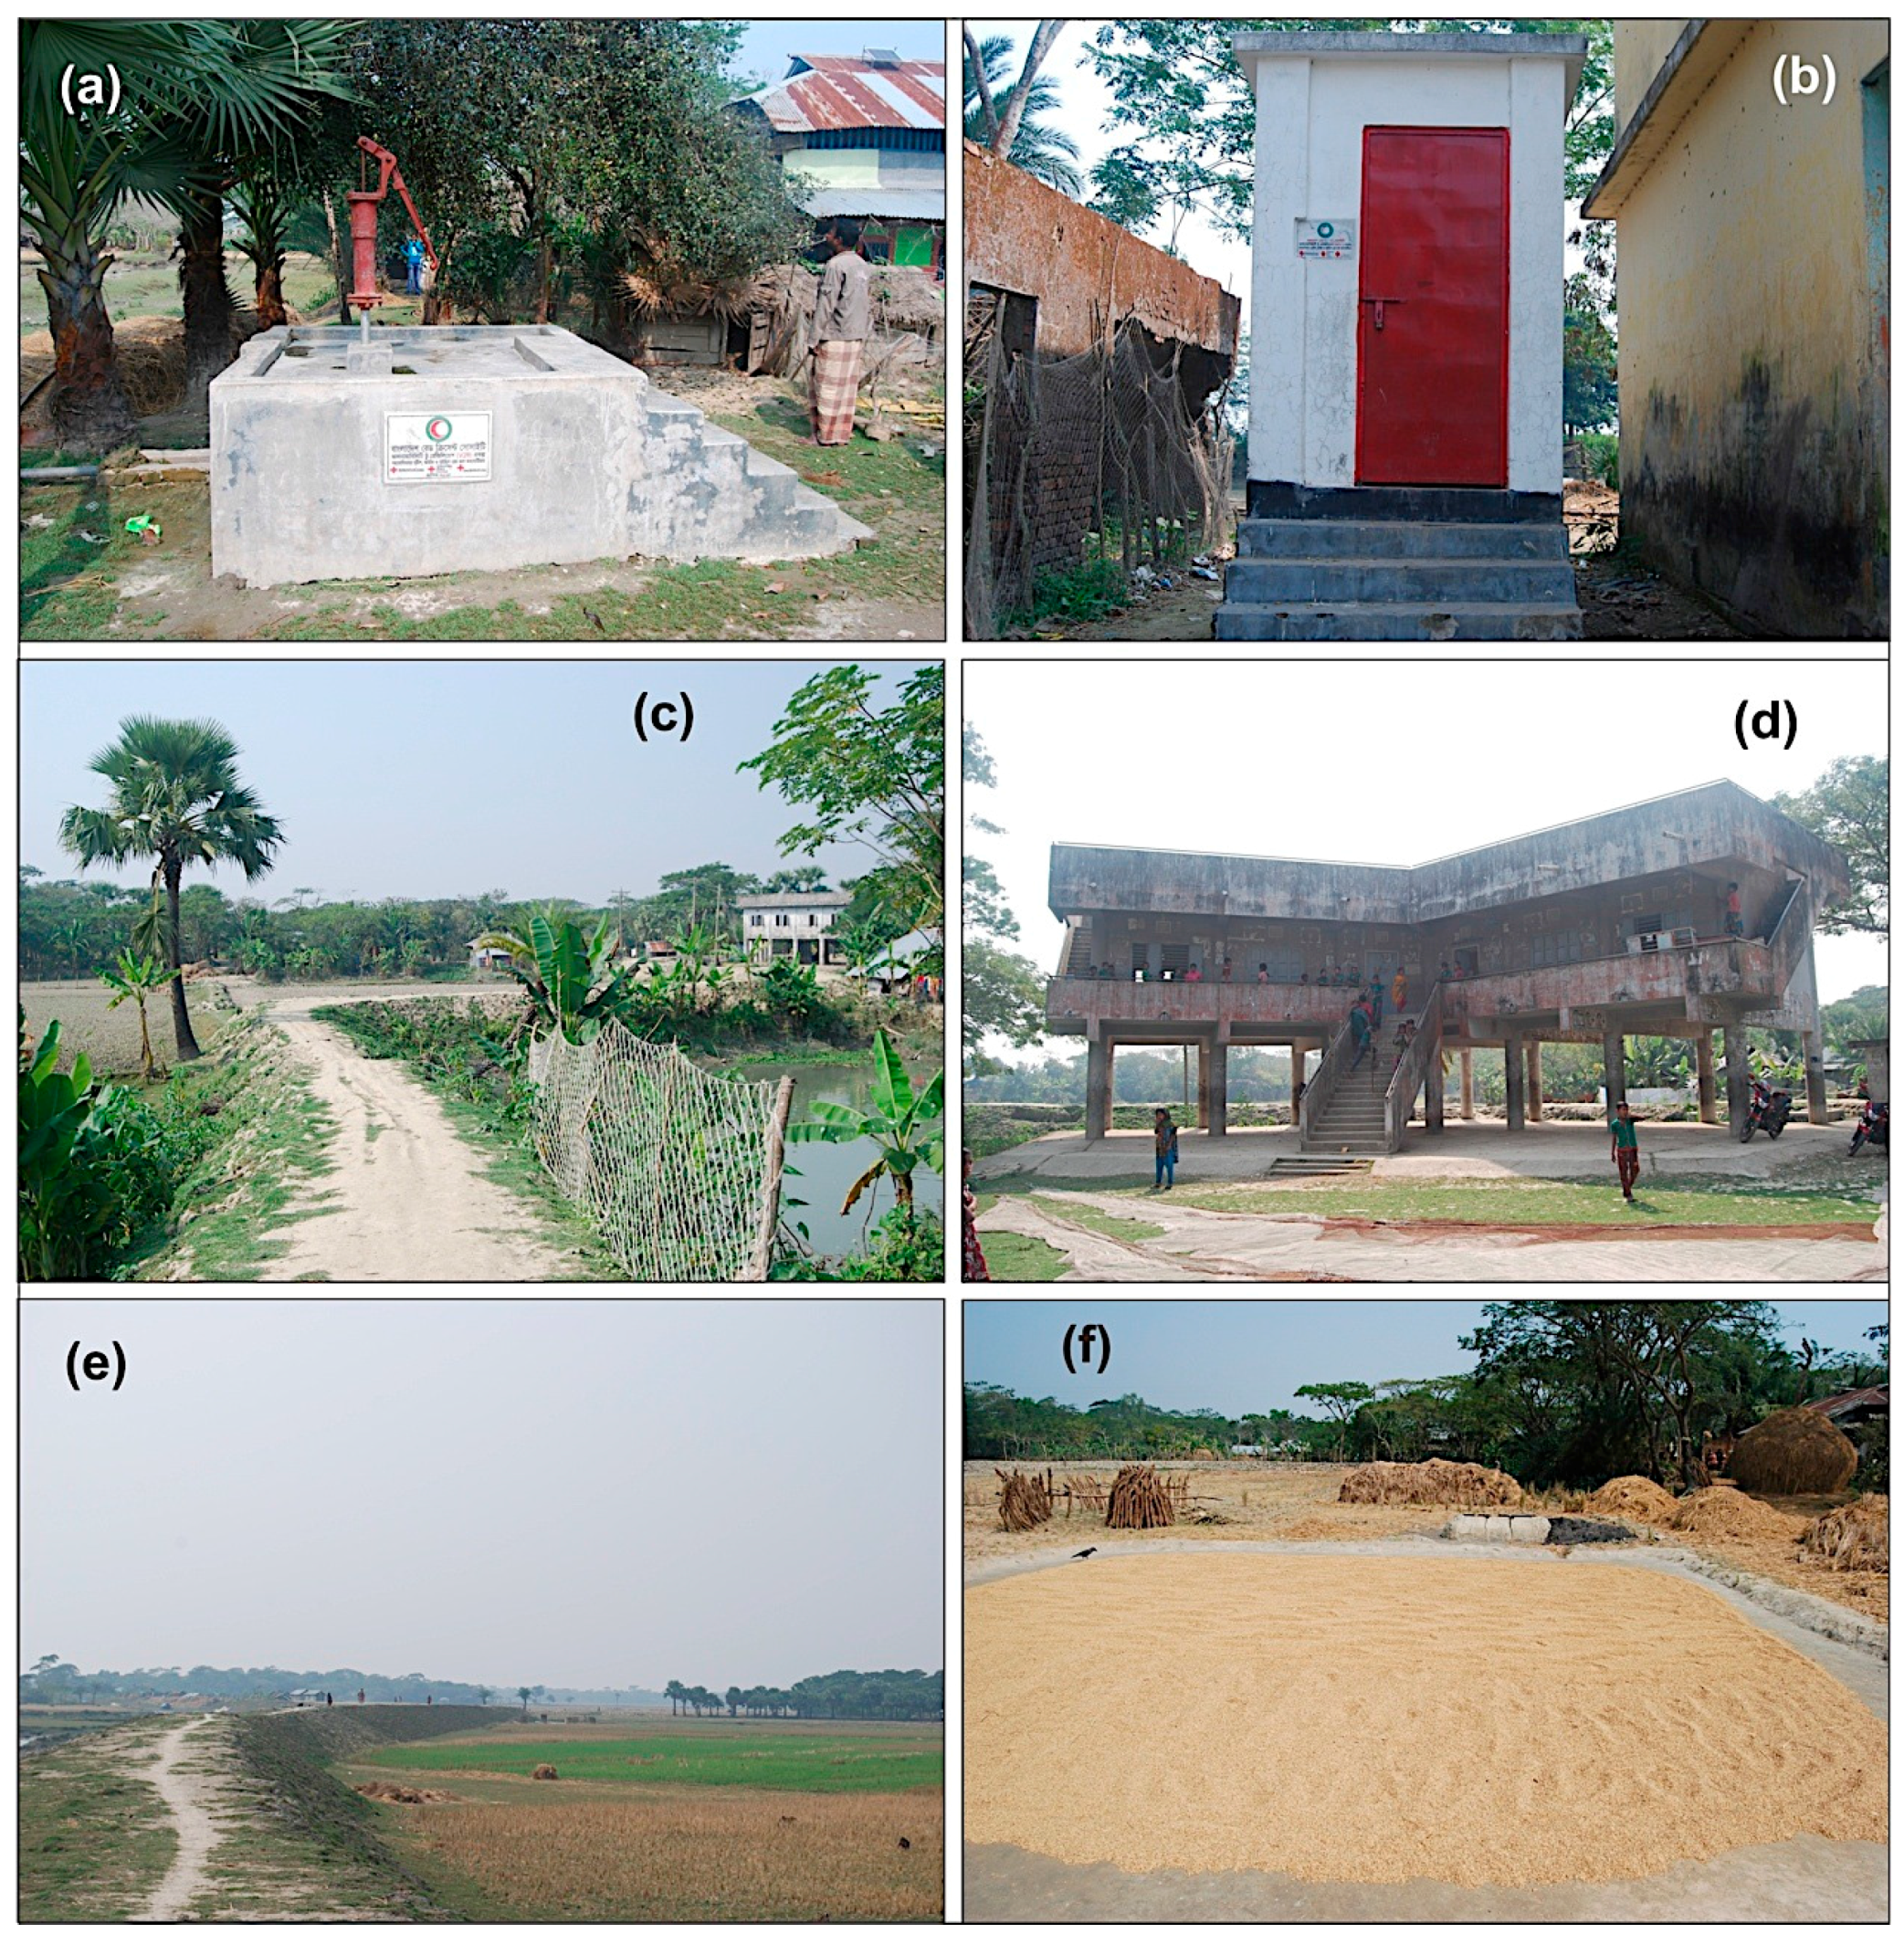
3.2. V2R Project Activities
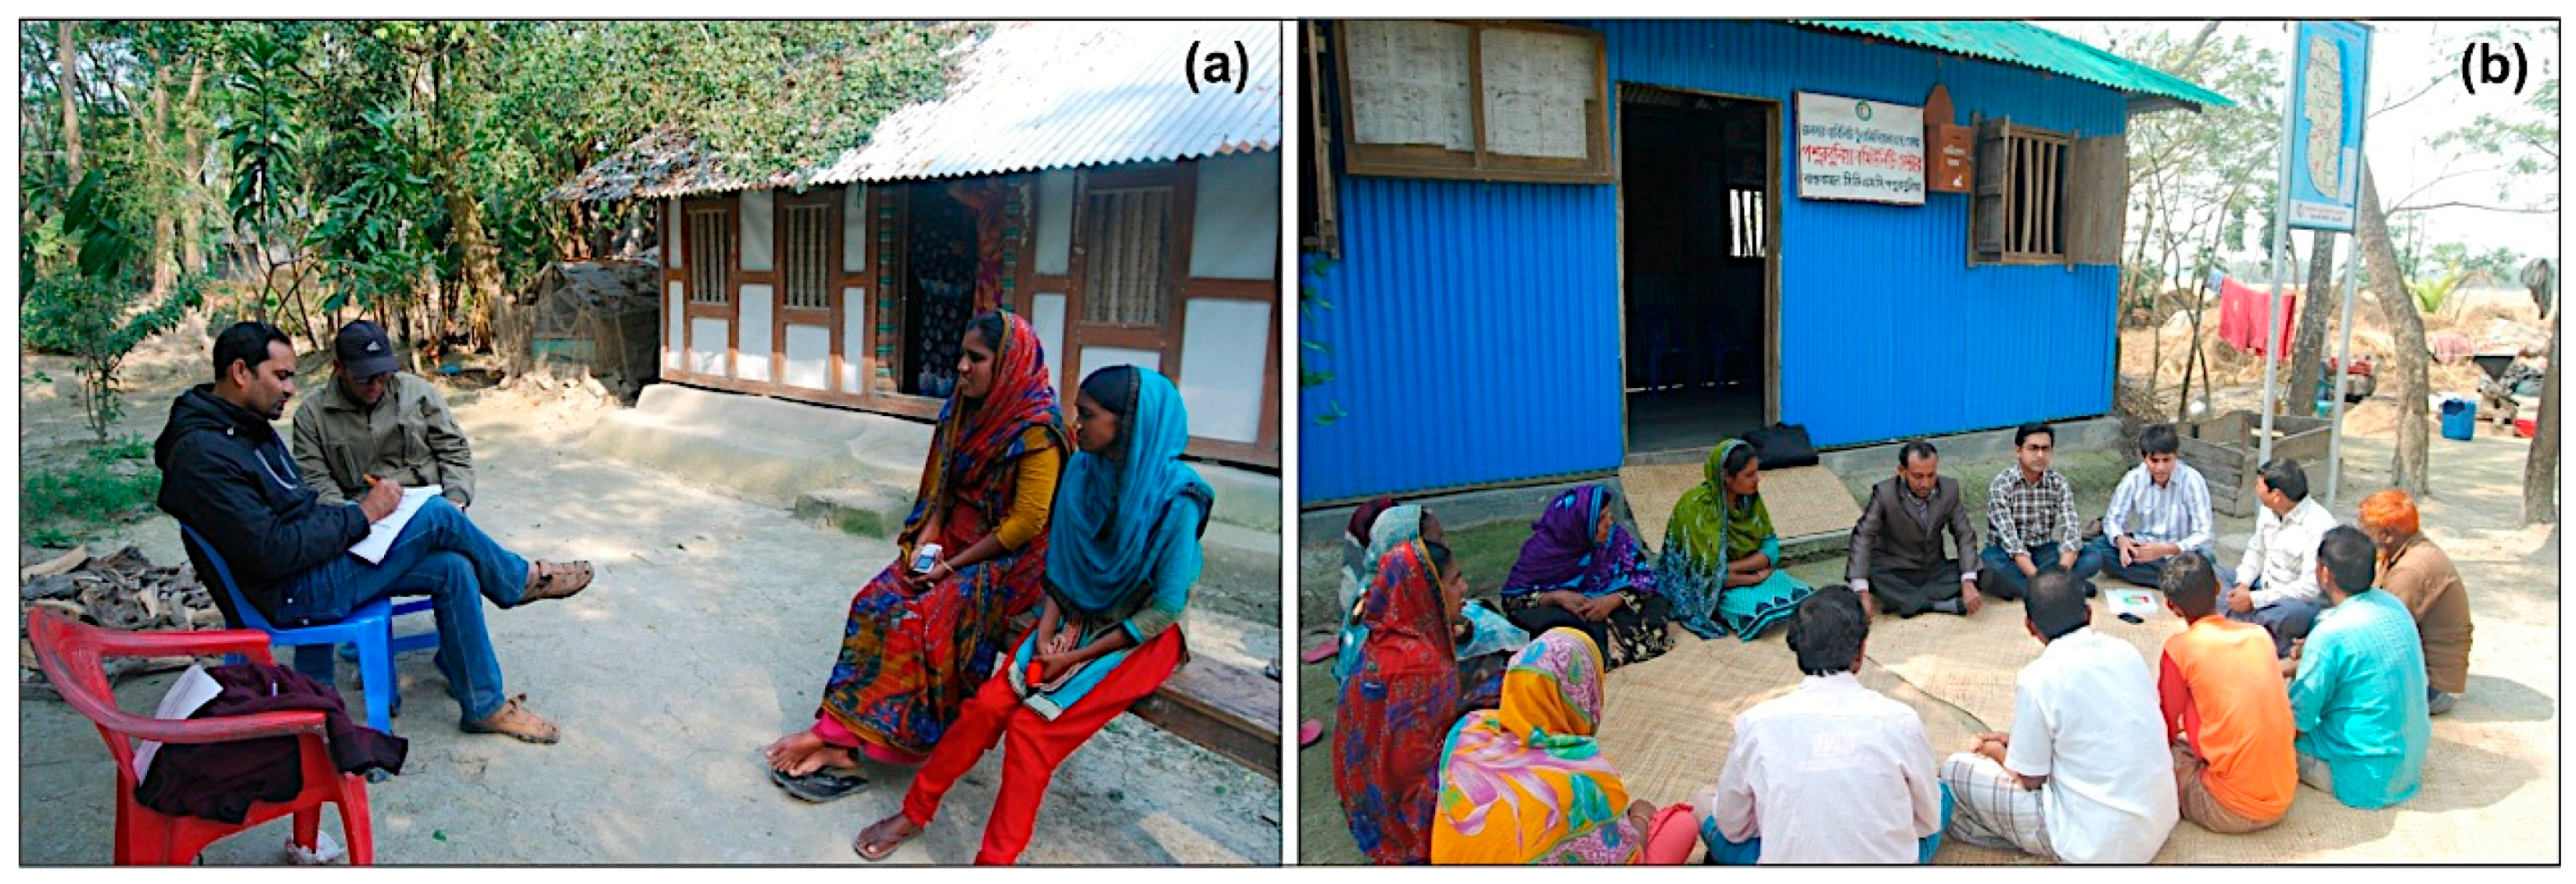
3.3. Household and Community Surveying
3.4. Cost-Benefit Analysis
4. Results and Discussion
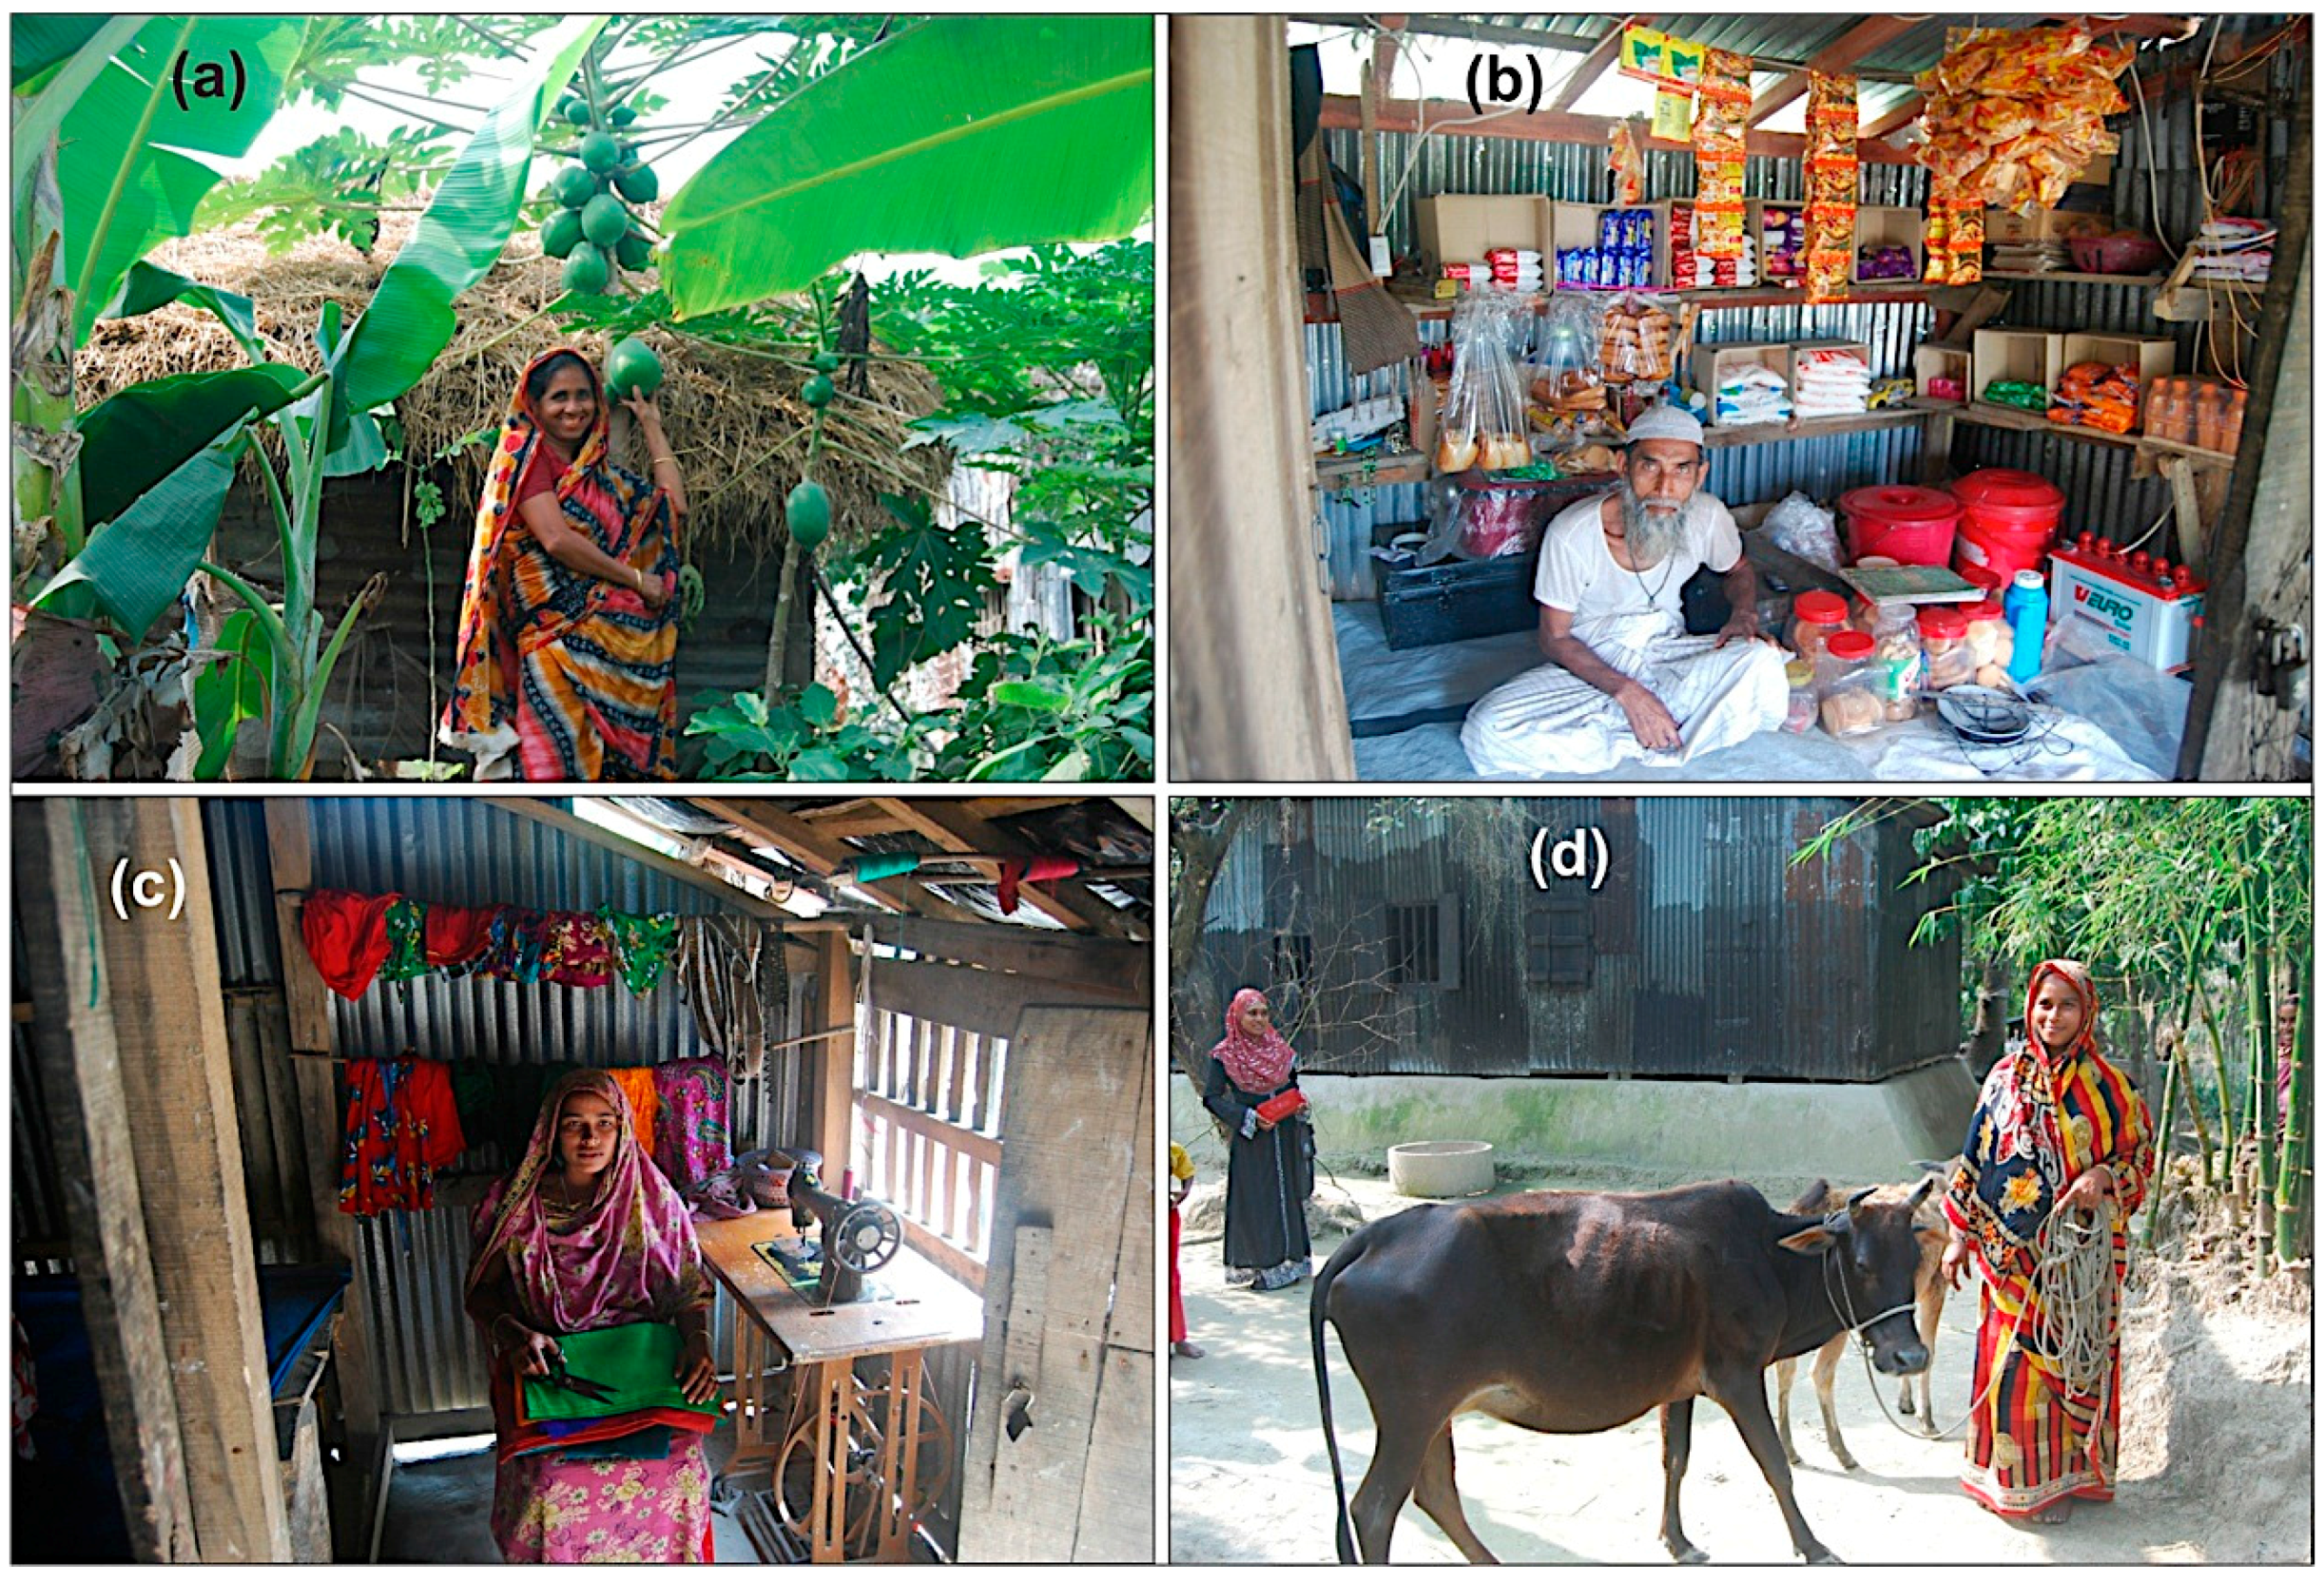
4.1. Household Survey
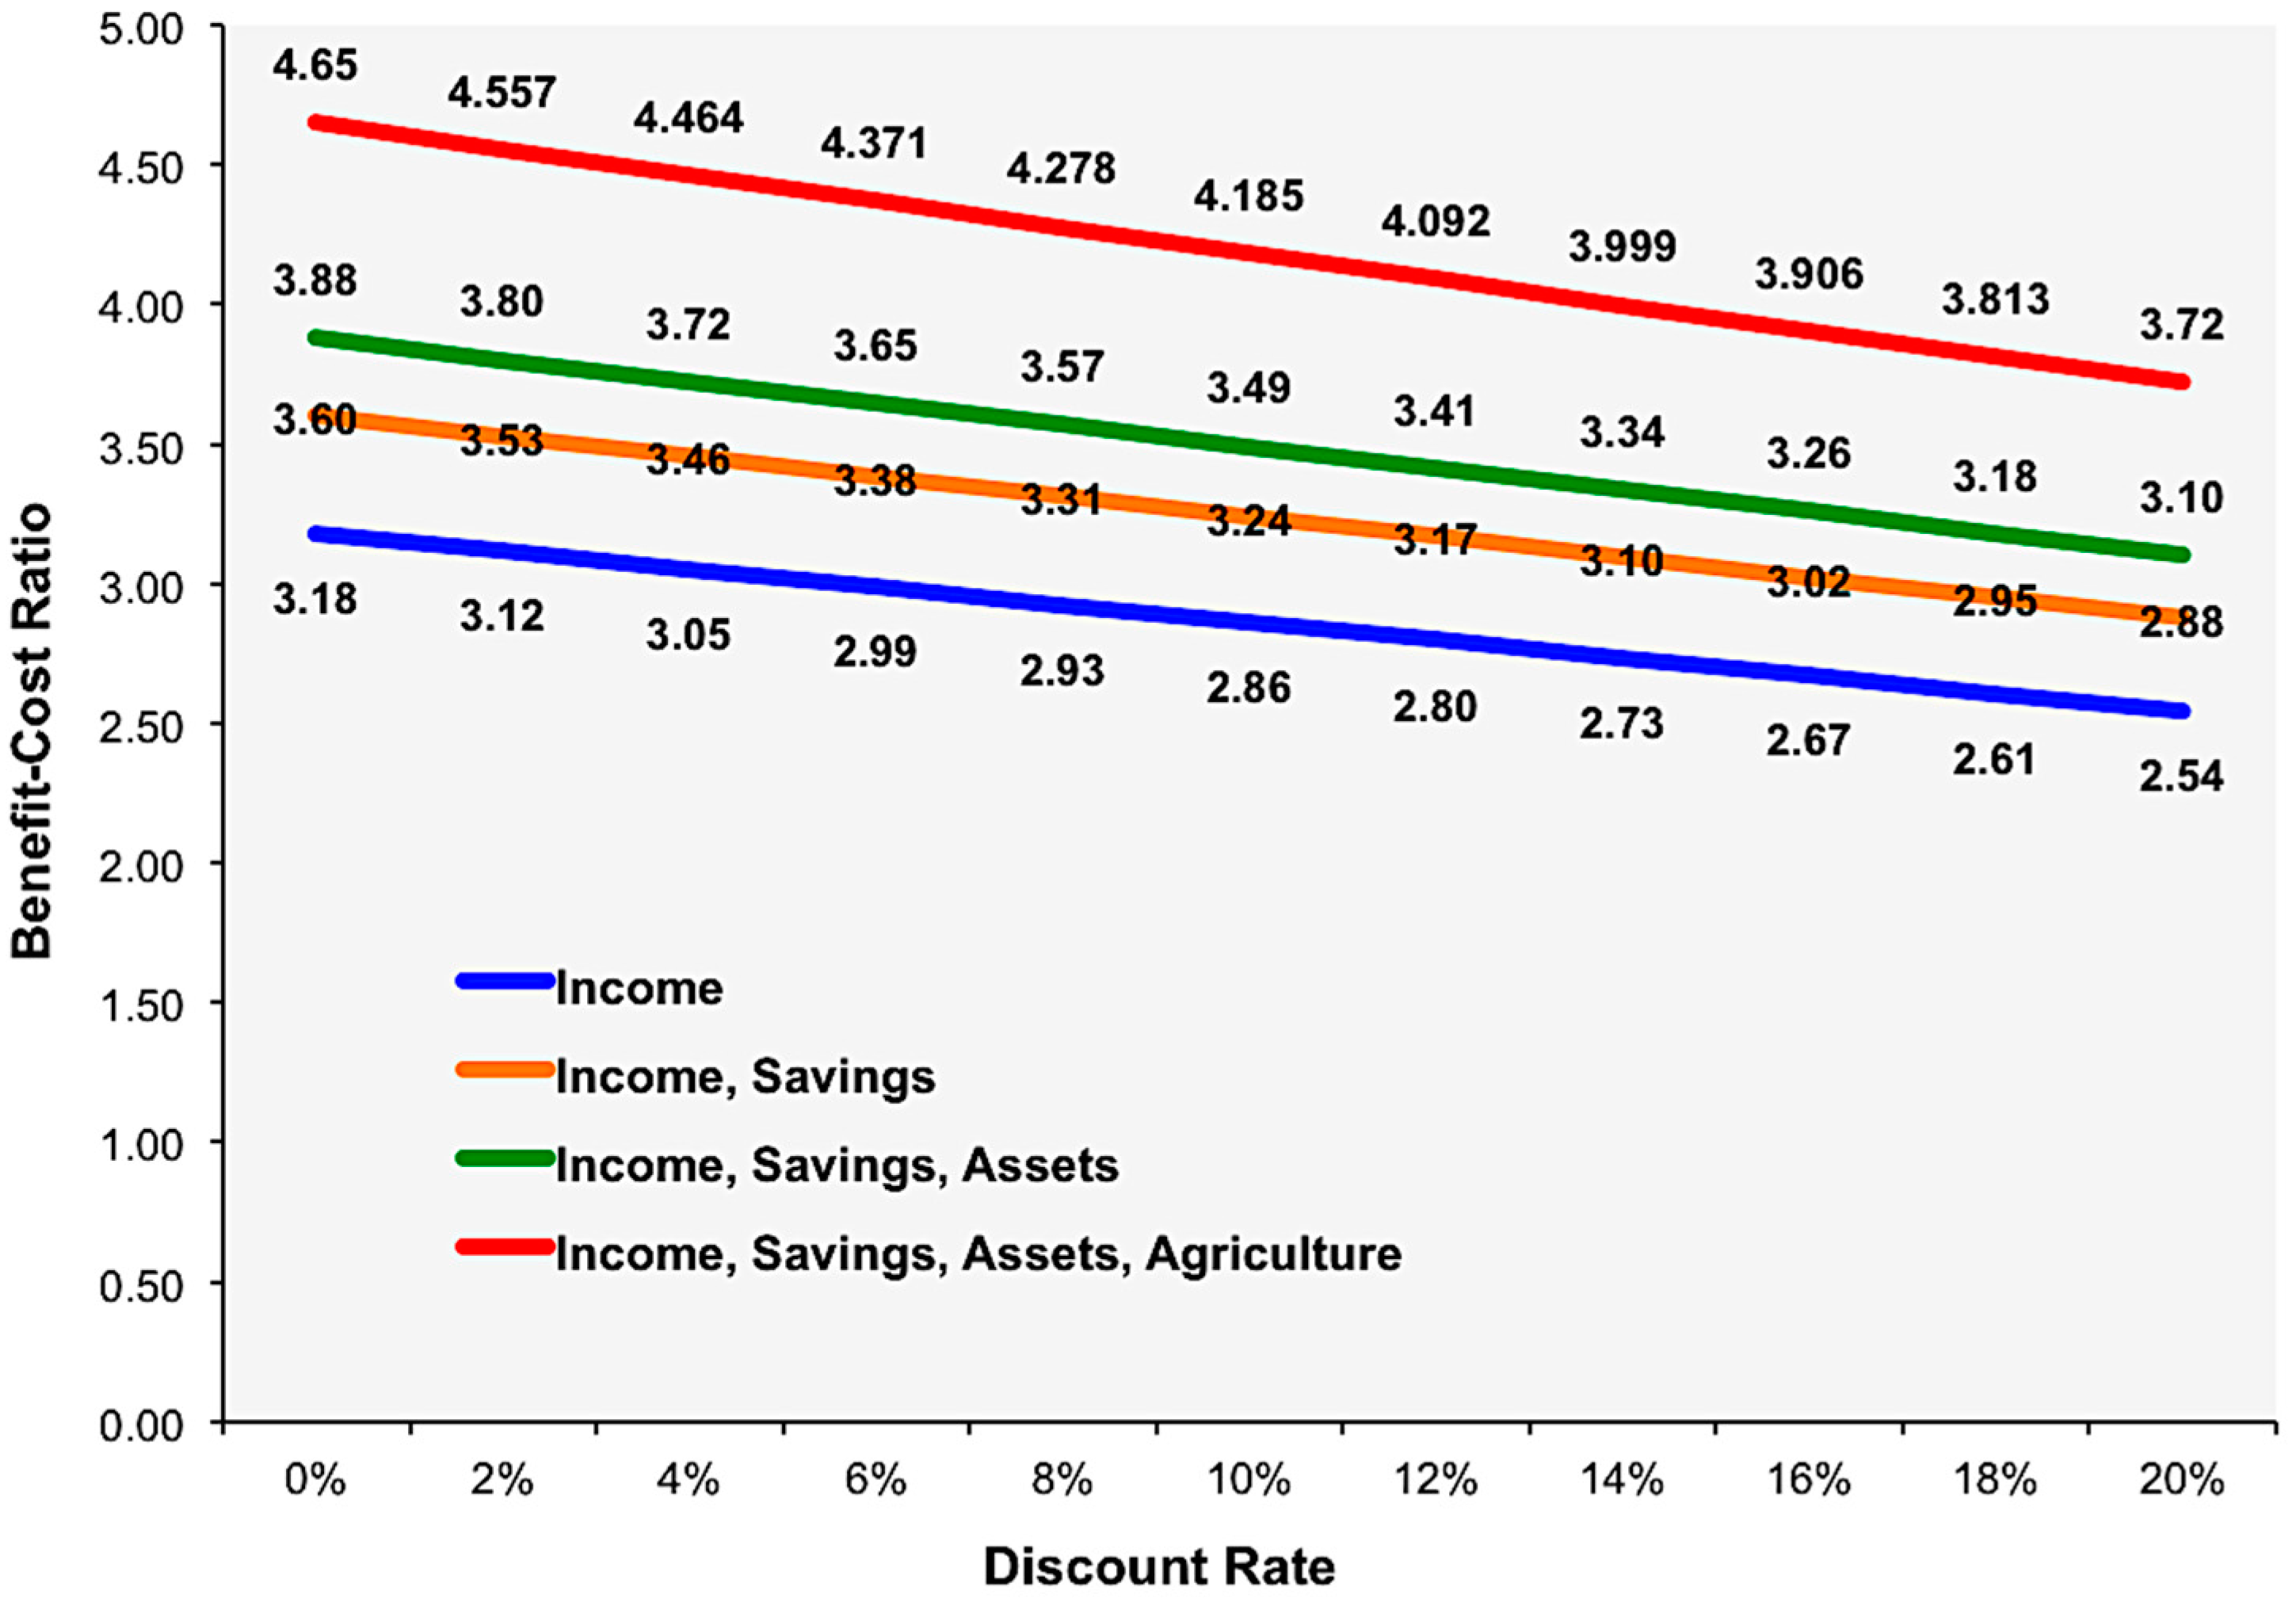
4.2. Cost-Benefit Analysis
- (a) Considering household income
- Average yearly income for each household = 30,532.20 BDT
- BCR = 30532.2/9600 = 3.18
- (b) Considering household income and savings
- Average yearly income for each household = 34,582.86 BDT
- BCR = 34582.86/9600 = 3.60
- (c) Considering household income, savings and asset values
- Average yearly income for each household = 37,266.92 BDT
- BCR = 37266.92/9600 = 3.88
- (d) Considering household income, savings, asset and agricultural product values
- Average yearly income for each household = 44,671.92 BDT
- BCR = 44671.92/9600 = 4.65
4.3. Achieving Resilience Characteristics and SL
4.4. Resilience Characteristics—Field Validation
4.5. Critical Reflection
5. Conclusions
Acknowledgments
Author Contributions
Conflicts of Interest
Abbreviations
| BCR | Benefit-cost ratio |
| BDRCS | Bangladesh Red Crescent Society |
| BDT | Bangladeshi taka |
| BRC | British Red Cross |
| CBA | Cost-benefit analysis |
| CDMC | Community disaster management committee |
| DRR | Disaster risk reduction |
| FGD | Focus group discussion |
| GDP | Gross domestic product |
| IFRC | International Federation of Red Cross and Red Crescent Societies |
| MSL | Mean sea level |
| NGO | Non-government organization |
| SL | Sustainable livelihood |
| V2R | Vulnerability to resilience |
| WASH | Water, sanitation and hygiene |
Appendix A

| P1. Gender | 2013 (%) | 2016 (%) |
| Male | 46.4 | 47.6 |
| Female | 44.1 | 45.8 |
| No. of children (<5 years) | 9.6 | 6.6 |
| P2. Land ownership | 2013 (%) | 2016 (%) |
| Own house | 18.9 | 18.9 |
| Own house and Land | 47.8 | 42.2 |
| Own house with land for farming | 17.8 | 22.2 |
| Own house without Land | 15.6 | 16.7 |
| None | 0.0 | 0.0 |
| P3. School going pupil | 2013 (%) | 2016 (%) |
| One | 72.0 | 66.7 |
| Two | 22.0 | 11.1 |
| Three | 6.0 | 22.2 |
| Four or more | 0.0 | 0.0 |
| P4. Main earning source of HH head | 2013 (%) | 2016 (%) |
| Self-employed (business) | 7.8 | 7.8 |
| Agriculture/farming | 16.7 | 17.8 |
| Poultry rearing | 0.0 | 0.0 |
| Large livestock rearing | 0.0 | 0.0 |
| Small livestock rearing | 0.0 | 1.1 |
| Fishing | 24.4 | 23.3 |
| Handicraft | 1.1 | 3.3 |
| Small business | 5.6 | 7.8 |
| Agricultural day labour | 5.6 | 4.4 |
| Non-agricultural day labour | 38.9 | 33.3 |
| Full time paid employee | 0.0 | 1.1 |
| Others | 0.0 | 0.0 |
| P5. Secondary earning source | 2013 (%) | 2016 (%) |
| Self-employed (business) | 0.0 | 1.1 |
| Agriculture/farming | 5.6 | 13.3 |
| Poultry rearing | 2.2 | 34.4 |
| Cattle rearing | 3.3 | 27.8 |
| Fish culture | 0.0 | 2.2 |
| Fishing at sea/river | 3.3 | 3.3 |
| Handicraft | 2.2 | 3.3 |
| Small business | 0.0 | 0.0 |
| Agricultural day labour | 3.3 | 1.1 |
| Non-agricultural day labour | 4.4 | 6.7 |
| Not applicable | 74.4 | 6.7 |
| Others | 1.1 | 0.0 |
| P6. Ownership of agricultural land | 2013 (%) | 2016 (%) |
| Owned | 20.0 | 27.0 |
| Lease | 3.3 | 4.0 |
| Govt. reserved land | 0.0 | 0.0 |
| Mortgage | 1.1 | 2.0 |
| None | 75.6 | 67.0 |
| P7. Total value of agricultural product (in BDT) | 2013 (%) | 2016 (%) |
| 0–10,001 | 85.7 | 51.7 |
| 10,001–20,000 | 9.5 | 34.5 |
| 20,001–30,000 | 0.0 | 3.4 |
| 30,001–40,000 | 0.0 | 0.0 |
| 40,001–50,000 | 0.0 | 0.0 |
| 50,001–60,000 | 0.0 | 0.0 |
| 60,001–70,000 | 4.8 | 0.0 |
| 70,001–Above | 0.0 | 10.3 |
| P8. No of the household asset | 2013 | 2016 |
| Number (%) | Number (%) | |
| Cows/buffalo | (25) 3.8 | (77) 3.8 |
| Solar panel | (15) 2.2 | (65) 3.2 |
| Goat/sheep | (37) 5.5 | (86) 4.3 |
| Chicken/duck | (523) 77.1 | (1598) 80.0 |
| Pigeon | (50) 7.4 | (77) 3.8 |
| Sewing machine | (4) 0.6 | (10) 0.5 |
| Sanitary latrine | (23) 3.4 | (80) 4.0 |
| Fisherman safety equipment | 0.0 | (5) 0.2 |
| Others | 0.0 | 0.0 |
| Total | 678 (100) | 1998 (100) |
| P9. Total value of household asset (in BDT) | 2013 | 2016 |
| Amount (%) | Amount (%) | |
| Cows/Buffalo | (397,000) 36.6 | (1,259,000) 36.0 |
| Solar Panel | (374,400) 34.5 | (1,305,600) 37.3 |
| Goat/Sheep | (89,500) 8.2 | (241,000) 6.9 |
| Chickens/Ducks | (151,950) 14.0 | (336,600) 9.6 |
| Pigeon | (3,600) 0.3 | (6,600) 0.2 |
| Sewing Machine | (21,000) 1.9 | (60,300) 1.7 |
| Sanitary Latrine | (57,500) 5.3 | (211,500) 6.0 |
| Fisherman Safety Equipment | 0.0 | (14,500) 0.4 |
| Others | 0.0 | (65,500) 1.9 |
| Total | 1,084,950 (100) | 3,500,600 (100) |
| P10. Average monthly income (in BDT) | 2013 (%) | 2016 (%) |
| 0–3,000 | 31.1 | 2.2 |
| 3,001–6,000 | 60.0 | 46.7 |
| 6,001–9,000 | 8.9 | 40.0 |
| 9,001–15,000 | 0.0 | 11.1 |
| P11. Average monthly savings (in BDT) | 2013 (%) | 2016 (%) |
| 0–500 | 100.0 | 54.4 |
| 501–1,000 | 0.0 | 32.3 |
| 1,001–1,500 | 0.0 | 0.0 |
| 1,501–2,000 | 0.0 | 13.2 |
| P12. Where do you seek help/advice related to livelihood | 2013 (%) | 2016 (%) |
| Government line department (Agriculture, livestock, fisheries etc.) | 4.4 | 63.3 |
| Local vendors (seed, fertilizer, pesticides) | 18.9 | 3.3 |
| Trained (self) | 0.0 | 25.6 |
| No facility for help/advice | 24.4 | 0.0 |
| Don’t seek help/advice | 51.1 | 7.8 |
| Others | 1.1 | 0.0 |
| P13. Do you borrow money from any micro-finance organization | 2013 (%) | 2016 (%) |
| Yes | 62.3 | 25.0 |
| No | 37.7 | 75.0 |
| P13.1. If yes, then from how many micro-finance institutions | 2013 (%) | 2016 (%) |
| One | 85.4 | 90.9 |
| Two | 12.2 | 9.1 |
| Three | 2.4 | 0.0 |
| Four or more | 0.0 | 0.0 |
| P13.2. Purpose of using the money | 2016 (%) | |
| Servicing debts | 18.3 | |
| Investing in business | 44.1 | |
| Family maintenance | 24.7 | |
| Food | 1.1 | |
| Education | 3.2 | |
| Health | 7.5 | |
| Buying non-productive asset | 0.0 | |
| Others | 1.1 | |
| P14. Distance to nearest water supply in dry season (m) | 2013 (%) | 2016 (%) |
| 0–200 | 57.8 | 77.8 |
| 201–400 | 0.0 | 4.4 |
| 401–600 | 42.2 | 15.6 |
| 601–800 | 0.0 | 1.1 |
| 801–1,000 | 0.0 | 1.1 |
| P15. Duration to collect water on both-ways in dry season (Minute) | 2013 (%) | 2016 (%) |
| 0–4 | 17.8 | 2.2 |
| 5–10 | 48.9 | 55.6 |
| 11–15 | 0.0 | 14.4 |
| 16–20 | 0.0 | 13.3 |
| 21–25 | 0.0 | 0.0 |
| 26–30 | 33.3 | 12.2 |
| 31–35 | 0.0 | 2.2 |
| >35 | 0.0 | 0.0 |
| P16. Distance to nearest water supply in wet season (m) | 2013 (%) | 2016 (%) |
| 0–200 | 57.8 | 78.9 |
| 201–400 | 42.2 | 4.4 |
| 401–600 | 0.0 | 14.4 |
| 601–800 | 0.0 | 2.2 |
| 801–1,000 | 0.0 | 0.0 |
| P17. Duration to collect water on both-ways in wet season (Minute) | 2013 (%) | 2016 (%) |
| 0–4 | 15.6 | 0.0 |
| 5–10 | 42.2 | 35.6 |
| 11–15 | 0.0 | 15.6 |
| 16–20 | 0.0 | 11.1 |
| 21–25 | 0.0 | 4.4 |
| 26–30 | 42.2 | 16.7 |
| 31–35 | 0.0 | 1.1 |
| >35 | 0.0 | 15.6 |
| P18. Problem with water supply | 2013 (%) | 2016 (%) |
| No | 42.2 | 82.2 |
| Travel long way to collect water | 37.8 | 13.3 |
| Unavailable during dry season | 20.0 | 0.0 |
| Water source out of order | 0.0 | 0.0 |
| Platform flooded by high tide or flash flood | 0.00 | 4.44 |
| P19. Sanitary latrine ownership | 2013 (%) | 2016 (%) |
| Yes | 45.3 | 87.8 |
| No | 54.7 | 12.2 |
| P20. Latrine cleaning frequency | 2013 (%) | 2016 (%) |
| Daily | 0.0 | 66.7 |
| Twice a week | 4.4 | 19.8 |
| Once a week | 20.0 | 7.4 |
| Once a month | 11.1 | 0.0 |
| It is clean enough | 0.0 | 4.9 |
| Never cleaned it | 17.8 | 1.2 |
| Others | 46.7 | 0.0 |
| P21. Household sharing a latrine | 2013 (%) | 2016 (%) |
| Yes | 11.1 | 16.7 |
| No | 88.9 | 83.3 |
| P22. Where do you dispose of your household waste? | 2013 (%) | 2016 (%) |
| Refuse pit | 2.2 | 85.6 |
| Bush | 8.9 | 6.7 |
| Burn | 0.0 | 0.0 |
| Bury | 88.9 | 7.8 |
| Others | 0.0 | 0.0 |
| P23. Importance of hand washing | 2013 (%) | 2016 (%) |
| Before eating | 36.6 | 30.1 |
| After eating | 0.0 | 5.4 |
| Before praying | 0.0 | 2.0 |
| Before breastfeeding | 33.9 | 3.8 |
| Before cooking | 6.2 | 14.7 |
| After defecation | 16.1 | 27.8 |
| After handling child’s faeces | 4.4 | 9.4 |
| When my hands are dirty | 2.7 | 4.7 |
| After cleaning toilet | 0.0 | 2.0 |
| Before handling water containers | 0.0 | 0.3 |
| Others | 0.0 | 0.0 |
| P24. Ways of hand washing | 2013 (%) | 2016 (%) |
| I don’t wash my hands | 0.0 | 0.0 |
| Water with Bar soap | 28.9 | 93.3 |
| Water only | 71.1 | 0.0 |
| Ash | 0.0 | 6.7 |
| Mud/sand | 0.0 | 0.0 |
| Others | 0.0 | 0.0 |
| P25. Diseases you face | 2013 (%) | 2016 (%) |
| Diarrhoea | 36.7 | 2.2 |
| Jaundice | 0.0 | 2.2 |
| Acute respiratory illness/pneumonia | 20.4 | 5.5 |
| Malaria | 0.0 | 0.0 |
| Fever | 22.4 | 14.3 |
| No Illness | 20.4 | 75.8 |
| Others | 0.0 | 0.0 |
| P26. First point of treatment | 2013 (%) | 2016 (%) |
| General clinic | 2.2 | 31.1 |
| Community health worker | 4.4 | 0.0 |
| Pharmacy | 24.4 | 13.3 |
| Private doctor | 22.2 | 0.0 |
| Public hospital | 46.7 | 55.6 |
| Mobile clinic | 0.0 | 0.0 |
| Nurse | 0.0 | 0.0 |
| Traditional healer | 0.0 | 0.0 |
| P27. Signs of diarrhoea | 2013 (%) | 2016 (%) |
| Dysentery | 0.0 | 33.0 |
| Vomits | 0.0 | 28.0 |
| Thirst | 51.5 | 6.8 |
| Sunken eyes | 27.3 | 17.2 |
| Dry mouth and tongue | 0.0 | 7.7 |
| Lethargy or loss of consciousness | 1.5 | 6.33 |
| Skin losing elasticity | 4.6 | 0.4 |
| Not able to drink | 0.0 | 0.4 |
| Little or no urine | 0.0 | 0.0 |
| Muscles cramps | 1.5 | 0.0 |
| Other Specify | 13.6 | 0.0 |
| P28. Diarrhoea measure | 2013 (%) | 2016 (%) |
| Give ORS packet | 30.4 | 46.6 |
| Homemade ORS with sugar, salt and water | 53.6 | 24.3 |
| Increased homemade fluid (thin gruel of rice, maize, potato, coconut juice) | 8.7 | 6.9 |
| Continue breast feeding | 0.0 | 3.2 |
| Zinc treatment | 0.0 | 5.8 |
| Take to the doctor | 5.8 | 6.9 |
| Rehydrate, give water | 1.4 | 0.0 |
| Give medicine (to stop diarrhoea, or antibiotics) | 0.0 | 2.6 |
| Home remedies | 0.0 | 3.7 |
| Others | 0.0 | 0.0 |
| P29. ORS preparation knowledge | 2013 (%) | 2016 (%) |
| Described correctly | 80.0 | 88.9 |
| Described incorrectly | 20.0 | 11.1 |
| P30. Source of info about health, personal and household hygiene | 2013 (%) | 2016 (%) |
| Friends and Neighbours | 6.8 | 1.1 |
| Community health worker/outreach workers | 90.9 | 2.2 |
| Clinics and hospitals | 0.0 | 4.4 |
| School teacher or children | 2.3 | 0.0 |
| Religious leaders | 0.0 | 0.0 |
| Mass media (TV/radio) | 0.0 | 1.1 |
| Newspaper | 0.0 | 0.0 |
| Books/posters/brochures | 0.0 | 0.0 |
| Water and sanitation committee | 0.0 | 3.3 |
| Red Crescent volunteer | 0.0 | 86.7 |
| No body | 0.0 | 1.1 |
| Others | 0.0 | 0.0 |
| P31. Disaster consciousness | 2016 (%) | |
| Great concern | 98.9 | |
| Little concern | 1.1 | |
| No concern | 0.0 | |
| I don’t know/no answer | 0.0 | |
| P32. Households affected by a disaster in the past 3 years | 2016 (%) | |
| Yes | 88.9 | |
| No | 11.1 | |
| P32.1. If Yes, what was the effect | 2016 (%) | |
| Evacuation | 4.4 | |
| Property damage | 32.6 | |
| Agricultural products damaged | 14.8 | |
| Loss of domestic animal | 26.7 | |
| Disruption or loss of income | 20.0 | |
| Serious injury or death | 0.0 | |
| Minor injury | 1.5 | |
| Others | 0.0 | |
| P33. Household preparation | 2013 (%) | 2016 (%) |
| Identify safe shelter for family | 33.3 | 32.8 |
| Identify safe route to shelter | 38.9 | 11.1 |
| Stockpiled food in safe place | 3.7 | 9.2 |
| Stockpiled medicine in a safe place | 0.0 | 1.2 |
| Stockpiled water in a safe place | 1.8 | 1.5 |
| Protect important docs | 7.4 | 5.3 |
| Took animals to safer area | 0.0 | 25.2 |
| Have monetary/financial savings | 0.0 | 4.2 |
| Took action to protect your home | 0.0 | 9.2 |
| Other | 0.0 | 0.0 |
| Do nothing | 13.0 | 0.4 |
| Not sure | 1.8 | 0.0 |
| P34. Early warning info | 2013 (%) | 2016 (%) |
| Yes, always for all disasters | 73.3 | 98.9 |
| Yes, sometimes for all disasters | 26.7 | 1.1 |
| Yes, but only for cyclones | 0.0 | 0.0 |
| No | 0.0 | 0.0 |
| P35. How do you receive information on early warning | 2013 (%) | 2016 (%) |
| Indigenous knowledge | 12.3 | 7.3 |
| Existing CDMC committee | 0.0 | 48.2 |
| Radio | 12.3 | 15.3 |
| TV | 21.9 | 1.5 |
| Mobile phone | 34.2 | 2.2 |
| NGOs | 9.6 | 0.0 |
| Union Parishad (local govt.) | 0.0 | 0.7 |
| Mosque/religious leader | 0.0 | 8.8 |
| Cyclone preparedness program (Govt.) | 9.6 | 16.1 |
| Others | 0.0 | 0.0 |
| P36. After getting early warning | 2013 (%) | 2016 (%) |
| Cyclone shelters | 55.6 | 73.3 |
| Public school building | 6.7 | 13.3 |
| Neighbours/relatives house | 11.1 | 0.0 |
| Mosque/temple/church | 0.0 | 0.0 |
| My house is strong enough, no need to evacuate | 24.4 | 0.0 |
| Don’t go anywhere | 2.2 | 0.0 |
| Killah (raised plinth) | 0.0 | 13.3 |
| No place to go | 0.0 | 0.0 |
| Others | 0.0 | 0.0 |
References
- Bündnis Entwicklung Hilft (Alliance Development Works); United Nations University—Institute for Environment and Human Security (UNU-EHS). World Risk Report, 2015. Available online: http://www.worldriskreport.org/ (accessed on 20 March 2016).
- The International Federation of Red Cross and Red Crescent Societies (IFRC). World Disasters Report: Focus on Culture and Risk; IFRC: Geneva, Switzerland, 2014; Available online: http://www.ifrc.org/world-disasters-report-2014 (accessed on 22 March 2016).
- Etzold, B.; Ahmed, A.U.; Hassan, S.R.; Neelormi, S. Clouds gather in the sky, but no rain falls. Vulnerability to rainfall variability and food insecurity in Northern Bangladesh and its effects on migration. Clim. Dev. 2014, 6, 18–27. [Google Scholar] [CrossRef]
- Haque, M.A.; Budi, A.; Malik, A.A.; Yamamoto, S.S.; Louis, V.R.; Sauerborn, R. Health coping strategies of the people vulnerable to climate change in a resource-poor rural setting in Bangladesh. BMC Public Health 2013, 13, 565. [Google Scholar] [CrossRef]
- Hartmann, B.; Boyce, J.K. A Quiet Violence: View from a Bangladesh Village, 1st ed.; Zed Books: London, UK, 1983. [Google Scholar]
- Ullah, A.A.; Rahman, A.; Murshed, M. Poverty and Migration: Slums of Dhaka City: The Realities, 1st ed.; Association for Rural Development and Studies: Dhaka, Bangladesh, 1999. [Google Scholar]
- Lu, L.; Lu, Q.-C.; Rahman, A.S. Residence and Job Location Change Choice Behavior under Flooding and Cyclone Impacts in Bangladesh. Sustainability 2015, 7, 11612–11631. [Google Scholar] [CrossRef]
- Rabbani, G.; Rahman, S.H.; Faulkner, L. Impacts of Climatic Hazards on the Small Wetland Ecosystems (ponds): Evidence from Some Selected Areas of Coastal Bangladesh. Sustainability 2013, 5, 1510–1521. [Google Scholar] [CrossRef]
- International Centre for Climate Change and Development (ICCCAD). GIBIKA—Livelihood Resilience: Turning Research into Action; ICCCAD: Dhaka, Bangladesh, 2016; Available online: http://www.icccad.net/gibika/ (accessed on 12 June 2016).
- Bangladesh Centre for Advanced Studies (BCAS). Collective Action to reduce Climate Disaster Risks and Enhancing Resilience of the Vulnerable Coastal Communities around the Sundarbans in Bangladesh and India; BCAS: Dhaka, Bangladesh, 2015. [Google Scholar]
- Gaillard, J.C. Resilience of traditional societies in facing natural hazards. Dis. Prev. Manag. 2007, 16, 522–544. [Google Scholar] [CrossRef]
- Lewis, J. Development in Disaster-Prone Places: Studies of Vulnerability; Intermediate Technology: London, UK, 1999. [Google Scholar]
- Wisner, B.; Blaikie, P.; Cannon, T.; Davis, I. At Risk: Natural Hazards, People’s Vulnerability and Disasters, 2nd ed.; Routledge: London, UK, 2004. [Google Scholar]
- Huq, N.; Hugé, J.; Boon, E.; Gain, A.K. Climate Change Impacts in Agricultural Communities in Rural Areas of Coastal Bangladesh: A Tale of Many Stories. Sustainability 2015, 7, 8437–8460. [Google Scholar] [CrossRef]
- Hewitt, K. (Ed.) Interpretations of Calamity from the Viewpoint of Human Ecology, 1st ed.; Allen & Unwin: London, UK, 1983.
- Pasteur, K. From Vulnerability to Resilience: A Framework for Analysis and Action to Build Community Resilience; Practical Action Publishing Ltd., Schumacher Centre for Technology and Development: Bourton-on-Dunsmore, UK, 2011. [Google Scholar]
- Bangladesh Red Crescent Society (BDRSC). Vulnerability to Resilience (V2R); BDRSC: Dhaka, Bangladesh, 2013; Available online: http://www.bdrcs.org/programs-and-projects/vulnerability-resilience-v2r (accessed on 10 March 2016).
- Bangladesh Bureau of Statistics (BBS). Incidence of Poverty 2005. Available online: http://www.bbs.gov.bd/WebTestApplication/userfiles/Image/LatestReports/PovertyMap_UZ_05.pdf (accessed on 16 March 2016).
- Deb, U.; Hoque, Z.; Khaled, N.; Bairagi, S.K. Growth, Income Inequality and Poverty Trends in Bangladesh: Implications for Development Strategy. In Dialogue on “Addressing Regional Inequalities: Policy Options and Strategies”; Centre for Policy Dialogue (CPD): Dhaka, Bangladesh, 2008. [Google Scholar]
- Alexander, D.E. Resilience and disaster risk reduction: An etymological journey. Nat. Hazards Earth Syst. Sci. 2013, 13, 2707–2716. [Google Scholar] [CrossRef]
- Weichselgartner, J. Disaster Mitigation: The Concept of Vulnerability Revisited. Dis. Prev. Manag. 2001, 10, 85–94. [Google Scholar] [CrossRef]
- Bankoff, G.; Frerks, G.; Hilhorst, D. (Eds.) Mapping Vulnerability: Disasters, Development and People, 1st ed.; Earthscan: London, UK, 2004.
- Glantz, M.H.; Jamieson, D. Societal response to hurricane Mitch and intra versus intergenerational equity: Whose norms should apply? Risk Anal. 2000, 20, 869–882. [Google Scholar] [CrossRef] [PubMed]
- Lewis, J. Some realities of resilience: A case-study of Wittenberge. Dis. Prev. Manag. 2013, 22, 48–62. [Google Scholar] [CrossRef]
- The International Federation of Red Cross and Red Crescent Societies (IFRC). IFRC Framework for Community Resilience; IFRC: Geneva, Switzerland, 2014. [Google Scholar]
- Adger, W.N. Vulnerability. Glob. Environ. Chang. 2006, 16, 268–281. [Google Scholar] [CrossRef]
- Rampengan, M.M.F.; Boedhihartono, A.K.; Law, L.; Gaillard, J.C.; Sayer, J. Capacities in Facing Natural Hazards: A Small Island Perspective. Int. J. Dis. Risk Sci. 2014, 5, 247–264. [Google Scholar] [CrossRef]
- Benadusi, M. The two-faced Janus of disaster management: Still vulnerable, yet already resilient. South East Asia Res. 2013, 21, 419–438. [Google Scholar] [CrossRef]
- Tobin, G.A. Sustainability and community resilience: The holy grail of hazards planning? Environ. Hazards 1999, 1, 13–25. [Google Scholar] [CrossRef]
- Cannon, T. Reducing People’s Vulnerability to Natural Hazards: Communities and Resilience. In Proceedings of the WIDER Conference on Fragile States—Fragile Groups: Tackling Economic and Social Vulnerability, Helsinki, Finland, 15–16 June 2007; UNU-WIDER: Helsinki, Finland, 2007. [Google Scholar]
- Krüger, F.; Bankoff, G.; Cannon, T.; Schipper, L. Cultures and Disasters: Understanding Cultural Framings in Disaster Risk Reduction; Routledge: Abingdon, UK, 2015. [Google Scholar]
- Walmsley, J. The Nature of Community: Putting Community in Place. Dialogue 2006, 25, 5–12. [Google Scholar]
- Twigg, J. Characteristics of a Disaster-Resilient Community: A Guidance Note, version 2; UK Department for International Development’s Disaster Risk Reduction Interagency Coordination Group: London, UK, 2009. [Google Scholar]
- Norris, F.H.; Stevens, S.P.; Pfefferbaum, B.; Wyche, K.F.; Pfefferbaum, R.L. Community Resilience as a Metaphor, Theory, Set of Capacities, and Strategy for Disaster Readiness. Am. J. Community Psychol. 2008, 41, 127–150. [Google Scholar] [CrossRef] [PubMed]
- Chambers, R.; Conway, G. Sustainable Rural Livelihoods: Practical Concepts for the 21st Century; Institute of Development Studies (IDS): Brighton, UK, 1992; pp. 7–8. [Google Scholar]
- Government of the People’s Republic of Bangladesh (GoB). Cyclone Sidr in Bangladesh: Damage, Loss, and Needs Assessment for Disaster Recovery and Reconstruction, 2008. Available online: http://reliefweb.int/report/bangladesh/cyclone-sidr-bangladesh-damage-loss-and-needs-assessment-disaster-recovery-and (accessed on 21 March 2016).
- U.S. Agency for International Development (USAID). Bangladesh: Cyclone Fact Sheet #1 (FY 2009), 2009. Available online: http://reliefweb.int/report/bangladesh/bangladesh-cyclone-fact-sheet-1-fy-2009 (accessed on 20 March 2016).
- The International Federation of Red Cross and Red Crescent Societies (IFRC). Bangladesh: Tropical Cyclone Mahasen Emergency Appeal n° MDRBD013 Operation Update No. 1, 2013. Available online: http://reliefweb.int/report/bangladesh/bangladesh-tropical-cyclone-mahasen-emergency-appeal-n%C2%B0-mdrbd013-operation-update (accessed on 22 March 2016).
- The International Federation of Red Cross and Red Crescent Societies (IFRC). Bangladesh: Cyclone Komen Emergency Plan of Action (EPoA) DREF operation n° MDRBD015, 2015. Available online: http://reliefweb.int/report/bangladesh/bangladesh-cyclone-komen-emergency-plan-action-epoa-dref-operation-n-mdrbd015 (accessed on 22 March 2016).
- Islam, M.A.; Mitra, D.; Dewan, A.; Humayun Akhter, S.H. Coastal multi-hazard vulnerability assessment along the Ganges deltaic coast of Bangladesh—A geospatial approach. Ocean Coast. Manag. 2016, 127, 1–15. [Google Scholar] [CrossRef]
- Bangladesh Bureau of Statistics (BBS). District Statistics 2011: Patuakhali, 2013. Available online: www.bbs.gov.bd (accessed on 14 March 2016).
- Banglapedia—The National Encyclopaedia of Bangladesh. Patuakhali District; The Asiatic Society of Bangladesh: Dhaka, Bangladesh, 2015; Available online: http://en.banglapedia.org/index.php?title=Patuakhali_District (accessed on 23 March 2016).
- Banglapedia—The National Encyclopaedia of Bangladesh. Kalapara Upazila; The Asiatic Society of Bangladesh: Dhaka, Bangladesh, 2014; Available online: http://en.banglapedia.org/index.php?title=Kalapara_Upazila (accessed on 23 March 2016).
- National Portal. Lalua Union; Bangladesh National Portal, Government of the People’s Republic of Bangladesh: Dhaka, Bangladesh, 2016. Available online: http://laluaup.patuakhali.gov.bd/ (accessed on 7 March 2016).
- Saroar, M.M.; Routray, J.K. ‘Climate Refugee’ is Not a Hoax. But We can Avoid it. Empirical Evidence from the Bangladesh Coast. In Climate Change Adaptation in Practice: From Strategy Development to Implementation; Schmidt-Thomé, P., Klein, J., Eds.; John Wiley & Sons Ltd.: Oxford, UK, 2013. [Google Scholar]
- Foley, P.; Saha, M.; Rashid, A.; Miaji, H.; Pandit, R.K.; Pasha, S.M. Vulnerability to Resilience: Participatory Livelihoods Review; Bangladesh Red Crescent Society (BDRCS) and British Red Cross (BRC): Dhaka, Bangladesh, 2014. [Google Scholar]
- Peek, L.; Fothergill, A. Using focus groups: Lessons from studying daycare centers, 9/11, and Hurricane Katrina. Qual. Res. 2009, 9, 31–59. [Google Scholar] [CrossRef]
- Kafle, S.K.; Murshed, Z. Community-Based Disaster Risk Management for Local Authorities, Participant’s Handbook, 2006. Available online: http://www.alnap.org/resource/6900 (accessed on 11 August 2016).
- Beckerman, W.; Hepburn, C. Ethics of the discount rate in the Stern Review on the economics of climate change. World Econ. 2007, 8, 187–211. [Google Scholar]
- DeCanio, S.J.; de Lavergne, C.; Palter, E.D. Economic Models of Climate Change: A Critique; Palgrave MacMillan: New York, NY, USA, 2003. [Google Scholar]
- May, W.W. $s for lives: Ethical considerations in the use of cost/benefit analysis by for-profit firms. Risk Anal. 1982, 2, 35–46. [Google Scholar] [CrossRef]
- Venton, C.C. Cost-Benefit Analysis for Community-Based Climate and Disaster Risk Management: Synthesis Report; Tearfund: London, UK, 2010. [Google Scholar]
- Holland, P. Fiji Technical Report—An Economic Analysis of Flood Warning in Navua, Fiji, 2008. Available online: http://ict.sopac.org/VirLib/ER0122.pdf (accessed on 11 August 2016).
- Multihazard Mitigation Council (MMC). Natural Hazard Mitigation Saves: An Independent Study to Assess the Future Savings from Mitigation Activities; MMC, National Institute of Building Sciences: Washington, DC, USA, 2005. [Google Scholar]
- Shreve, C.M.; Kelman, I. Does mitigation save? Reviewing cost-benefit analyses of disaster risk reduction. Int. J. Dis. Risk Reduct. 2014, 10, 213–235. [Google Scholar] [CrossRef] [Green Version]
- White, B.A.; Rorick, M.M. Cost-Benefit Analysis for Community-Based Disaster Risk Reduction in Kailali, Nepal; Mercy Corps Nepal: Lalitpur, Nepal, 2010. [Google Scholar]
- Mechler, R. Cost-benefit Analysis of Natural Disaster Risk Management in Developing Countries; Sector Project: “Disaster Risk Management in Development Cooperation”; Deutsche Gesellschaft fuer Technische Zusammenarbeit (GTZ) GmbH: Eschborn, Germany, 2005. [Google Scholar]
- Rahman, C.M. Surviving Cyclone Roanu. The International Federation of Red Cross and Red Crescent Societies (IFRC): Dhaka, Bangladesh, 2016. Available online: http://www.ifrc.org/en/news-and-media/news-stories/asia-pacific/bangladesh/surviving-cyclone-roanu-72233/ (accessed on 12 June 2016).
- Huq, S. Cyclone Roanu Hits Bangladesh: A Story of Loss and Damage Avoided; The International Institute for Environment and Development (IIED): London, UK, 2016; Available online: http://www.iied.org/cyclone-roanu-hits-bangladesh-story-loss-damage-avoided (accessed on 15 June 2016).
- Manyena, S.B.; O’Brien, G.; O’Keefe, P.; Rose, J. Disaster resilience: A bounce back or bounce forward ability? Local Environ. 2011, 16, 417–424. [Google Scholar]
- Le De, L.; Gaillard, J.C.; Friesen, W.; Matautia Smith, F. Remittances in the face of disasters: A case study of rural Samoa. Environ. Dev. Sustain. 2015, 17, 653–672. [Google Scholar] [CrossRef]
- World Bank. Turn down the Heat: Climate Extremes, Regional Impacts, and the Case for Resilience; A Report for the World Bank by the Potsdam Institute for Climate Impact Research and Climate Analytics; World Bank: Washington, DC, USA, 2013. [Google Scholar]
- Brammer, H. Bangladesh’s dynamic coastal regions and sea-level rise. Clim. Risk Manag. 2014, 1, 51–62. [Google Scholar] [CrossRef]
- Ansary, M.A.; Sharfuddin, M. Proposal for a new seismic zoning map for Bangladesh. J. Civ. Eng. 2002, 30, 77–89. [Google Scholar]
- Steckler, M.S.; Mondal, D.R.; Akhter, S.H.; Seeber, L.; Feng, L.; Gale, J.; Hill, E.M.; Howe, M. Locked and loading megathrust linked to active subduction beneath the Indo-Burman Ranges. Nat. Geosci. 2016. [Google Scholar] [CrossRef]
- Ahmed, B.; Kamruzzaman, M.; Zhu, X.; Rahman, M.S.; Choi, K. Simulating Land Cover Changes and Their Impacts on Land Surface Temperature in Dhaka, Bangladesh. Remote Sens. 2013, 5, 5969–5998. [Google Scholar] [CrossRef] [Green Version]
- Ahmed, B. Landslide susceptibility modelling applying user-defined weighting and data-driven statistical techniques in Cox’s Bazar Municipality, Bangladesh. Nat. Hazards. 2015, 79, 1707–1737. [Google Scholar] [CrossRef]
- Ahmed, B.; Ahmed, R. Modeling Urban Land Cover Growth Dynamics Using Multi‑Temporal Satellite Images: A Case Study of Dhaka, Bangladesh. ISPRS Int. J. Geo-Inf. 2012, 1, 3–31. [Google Scholar] [CrossRef]
- Mallick, B.; Rahaman, K.R.; Vogt, J. Social vulnerability analysis for sustainable disaster mitigation planning in coastal Bangladesh. Dis. Prev. Manag. 2011, 20, 220–237. [Google Scholar] [CrossRef]
- Akter, S.; Mallick, B. The poverty–vulnerability–resilience nexus: Evidence from Bangladesh. Ecol. Econ. 2013, 96, 114–124. [Google Scholar] [CrossRef]


| Project Activity | BDT Spent * |
|---|---|
| Cash for work and cash grant | 3,500,000 |
| Skill enhancement training | 500,000 |
| Workshops with government line departments (e.g., agriculture, fisheries, and livestock) | 300,000 |
| Distribution of rings and slabs for latrines | 1,400,000 |
| Water point installation and rehabilitation | 840,000 |
| Disaster resilient latrines | 200,000 |
| Water point maintenance tool kits | 50,000 |
| Awareness campaigns | 500,000 |
| School sanitation and hygiene education | 100,000 |
| Organisational capacity development for micro-groups and CDMCs | 400,000 |
| Workshop with the Union WATSAN committee | 150,000 |
| Linkages with stakeholders (government and non-governmental) | 200,000 |
| Distribution of first aid kits, early warning kits, and search and rescue kits | 100,000 |
| Awareness campaign on disaster preparedness, risk reduction and mitigation | 150,000 |
| Youth peer education in secondary schools | 100,000 |
| Workshops with local government institutions | 150,000 |
| Total cost | 8,640,000 |
| Indicator (Household Level) | Changes (2013–2016) | Resilience Characteristics * | |||||
|---|---|---|---|---|---|---|---|
| IS | EO | KH | SC | NR | CO | ||
| Micro-groups | Established | ✓ | ✓ | ||||
| CDMC | Established | ✓ | ✓ | ✓ | ✓ | ✓ | ✓ |
| Homestead land ownership | Increased | ✓ | |||||
| Agricultural land ownership | Increased | ✓ | ✓ | ||||
| Children attending school | Increased | ✓ | ✓ | ||||
| Diversified income sources | Increased | ✓ | ✓ | ✓ | |||
| Number of household assets | Increased | ✓ | ✓ | ✓ | |||
| Value of agricultural products | Increased | ✓ | ✓ | ✓ | |||
| Monthly income | Increased | ✓ | ✓ | ||||
| Monthly savings | Increased | ✓ | ✓ | ||||
| Livelihood support advice | Operating | ✓ | ✓ | ✓ | ✓ | ✓ | |
| Training on SL | Increased | ✓ | ✓ | ✓ | ✓ | ||
| Borrow money from MFIs | Decreased | ✓ | ✓ | ||||
| Distance to nearest water point | Decreased | ✓ | ✓ | ✓ | |||
| Drinking water problems | No | ✓ | ✓ | ✓ | |||
| Availability of sanitary latrines | Yes | ✓ | ✓ | ✓ | ✓ | ||
| Open defecation | No | ✓ | ✓ | ✓ | ✓ | ||
| Knowledge on WASH | Increased | ✓ | ✓ | ||||
| Refuse pit for waste disposal | Available | ✓ | ✓ | ✓ | |||
| Water-borne diseases | Decreased | ✓ | ✓ | ✓ | ✓ | ||
| Public hospital and clinics | Operating | ✓ | ✓ | ✓ | ✓ | ✓ | |
| Knowledge on identifying diseases | Increased | ✓ | ✓ | ✓ | ✓ | ||
| Response to diseases | Increased | ✓ | ✓ | ✓ | ✓ | ✓ | |
| Information on WASH and diseases | Available | ✓ | ✓ | ✓ | ✓ | ✓ | |
| Disaster preparedness and recovery | Increased | ✓ | ✓ | ✓ | ✓ | ||
| Getting reliable early warning | Increased | ✓ | ✓ | ✓ | |||
| Knowledge on DRR | Increased | ✓ | ✓ | ✓ | ✓ | ||
| Improved internal road network | Done | ✓ | ✓ | ✓ | ✓ | ✓ | |
| Training on safety and first aid | Done | ✓ | ✓ | ||||
| Market accessibility and business | Established | ✓ | ✓ | ✓ | ✓ | ✓ | |
| Leadership development | Increased | ✓ | ✓ | ||||
| Advocacy on community issues | Increased | ✓ | ✓ | ||||
| Participation in local government activities | Increased | ✓ | ✓ | ||||
| Knowledge on adaptation | Increased | ✓ | ✓ | ||||
© 2016 by the authors; licensee MDPI, Basel, Switzerland. This article is an open access article distributed under the terms and conditions of the Creative Commons Attribution (CC-BY) license (http://creativecommons.org/licenses/by/4.0/).
Share and Cite
Ahmed, B.; Kelman, I.; Fehr, H.K.; Saha, M. Community Resilience to Cyclone Disasters in Coastal Bangladesh. Sustainability 2016, 8, 805. https://doi.org/10.3390/su8080805
Ahmed B, Kelman I, Fehr HK, Saha M. Community Resilience to Cyclone Disasters in Coastal Bangladesh. Sustainability. 2016; 8(8):805. https://doi.org/10.3390/su8080805
Chicago/Turabian StyleAhmed, Bayes, Ilan Kelman, Heather K. Fehr, and Manik Saha. 2016. "Community Resilience to Cyclone Disasters in Coastal Bangladesh" Sustainability 8, no. 8: 805. https://doi.org/10.3390/su8080805