Article

A Comprehensive Evaluation of Urban Sustainable Development in China Based on the TOPSIS-Entropy Method

1
School of Remote Sensing and Information Engineering, Wuhan University, 129 Luoyu Road, Wuhan 430079, China
2
State Key Laboratory of Information Engineering in Surveying, Mapping and Remote Sensing, Wuhan University, 129 Luoyu Road, Wuhan 430079, China
3
Xi’an University of Science and Technology, 58 Yanta Road, Xi’an 710054, China
4
Chinese Academy of Surveying & Mapping, 28 Lianhuachixi Road, Beijing 100830, China
*
Author to whom correspondence should be addressed.
Sustainability 2016, 8(8), 746; https://doi.org/10.3390/su8080746
Submission received: 9 June 2016 / Revised: 27 July 2016 / Accepted: 27 July 2016 / Published: 4 August 2016
(This article belongs to the Section Sustainable Urban and Rural Development)

Abstract

:
The Chinese government started an important project “Geographical conditions monitoring (GCM)” in 2012, which aims at fully revealing the spatial pattern of natural resources, and economic and social development. Urban development assessment and analysis are an important topic of the comprehensive statistics in GCM project. This study quantitatively evaluates the sustainable development level of 287 cities at prefecture level and above in China and analyzes their spatial distribution. Both an index system of urban sustainable development (USI) constructed by three aspects, namely society, economy and environment, and the TOPSIS-Entropy method are adopted. The results show that the overall level of urban sustainable development in China is not high, and obvious differences in urban sustainable development among cities exist. The coordination of social, economic and environmental sustainable development in China is at a low level. In terms of spatial distribution, cities from eastern coastal areas of China are at relatively higher levels of sustainable development with central and northeastern cities ranking second and western ones lowest. Several spatial clusters of urban sustainable development can be found. The “High–High” clusters, in which cities have high levels of sustainable development, are distributed in urban agglomerations. Finally, some suggestions have been provided to achieve all-round sustainable development in China.

1. Introduction

The United Nations Development Summit held in September 2015 formally adopted the agreement “Transforming our world: The 2030 agenda for sustainable development”, embracing the three dimensions of sustainability, economic, social and environmental, aiming at ending global poverty and building a life of dignity for all. The concept of sustainable development was first proposed in the “Our Common Future” report of the 1987 World Environment and Development Committee, that “Sustainable development is development that meets the needs of the prevention without compromising the ability of future generations to meet their own needs” [1], generally accepted by most participants.
In recent decades, many studies have focused on evaluating urban sustainable development [2]. Great efforts have been exerted to study urban sustainability at local/urban, regional, national and international scales (Table 1). A list of evaluation systems for urban sustainability composed of various sets of indicators were proposed by international and regional organizations at early stage, such as “Driving force-State-Response (DSR)” model developed by The United Nations Commission on Sustainable Development (UNCSD) [3], “Pressure-State-Response (PRS)” model employed by the Organization for Economic Cooperation and Development (OCED) [4], “Society-economy-environment” framework proposed by United Nations Environment Programme (UNEP) [5] and “Expanding the Measure of Wealth: Indicators of Environmentally Sustainable Development” developed by the World Bank [6]. However, these index systems pay more attention to constructing theoretical frameworks of sustainable development, and do not meet the actual demands of different countries. Later, these frameworks were used as references for many countries and communities to develop their own systems at national scale, such as member states of the European Union [7,8,9,10], the UK [11] and Singapore [12]. Based on its own actual situation, China also built index systems with Chinese characteristics by different governmental agencies [13,14,15,16,17,18]. Meanwhile, many scholars began to study sustainable development at urban scale. Qualitative and quantitative methods have been used in a number of studies [19]. Qualitative analysis mainly focuses on the process, paths and origin causes of urban development [20,21,22,23,24]; quantitative research chiefly includes the synthetic evaluation of urban sustainable level [25,26,27,28,29,30,31,32], and driving force analysis [25,31] and trend analysis [19,29,30] of urban sustainable development. As an important development mode and the main trend of urbanization, the development of urban agglomerations and regions will promote the construction and development of megacities; thus, sustainable development at the regional scale has garnered attention from researchers [19,33,34,35,36,37]. Although a large number of existing studies concentrate on sustainable development from one scale, there are few articles discussing and analyzing sustainable development at multiple scales.
Standardizing, weighting and aggregating are usually the basic process of urban sustainable development assessment [2]. The weighting methods, which are the critical step of evaluation, can be mainly divided into two categories. One is the subjective method, which determines the weight coefficient of each indicator by comprehensive consulting score, includes analytic hierarchy process(AHP) [40,41,42] and Delphi method [43]. This method possibly tends to exaggerate or reduce the effects of certain indicators, and easily leads to reflecting the relationship among indicators inaccurately. The other is the objective method, which determines the weight of each index based on internal relationship and variation degree among different indicators, can effectively avoid deviation of human factors, includes principal component analysis (PCA) [9,10], the entropy method [19,29,30,31], grey relational analysis [25] and the factor analysis [44].
Since the reform and opening up, the process of China’s urbanization significantly accelerated, and urbanization level increased at an annual rate of more than 1%. From 1978 to 2012, the urban population increased from 170 million to 720 million, and by 2012, the urbanization rate was higher than 53%. Currently, China has 142 cities with a population of more than one million, while there were only 29 cities in 1978. Moreover, there are 25 cities in the world with a population of more than 10 million, and six of them are located in China. China also has 10 cities with a population of between five million and 10 million. Some of these megacities are facing conflicts between their growing population and decreasing urban carrying capacity. What is more, the three urban agglomerations in eastern China, namely Beijing-Tianjin-Hebei, the Yangtze River Delta and the Pearl River Delta, account for only 2.8 percent of the country’s total land area, but they own 18 percent of its total population and contribute 36 percent of its total GDP. Due to the deteriorating environment and increasing global competition, they are now faced with an urgent need for adjustment, optimization, transformation and upgrading. China has made significant progress in urbanization, but there are also many conflicts and unsolved problems. Against these backgrounds, the Chinese government started an important and imperative project “Geographical conditions monitoring (GCM)” in 2012 [45], which aims at fully revealing the spatial pattern of natural resources, and economic and social development situation, and providing decision support and services for the governments, enterprises and the public. Urban development assessment and analysis as an important topic of comprehensive statistics, and is one of the major jobs of GCM project. The project is based on geospatial statistics and spatial analysis, combined with social and economic statistical data, and has extreme importance and significance. By constructing an index system for urban sustainable development as well as further evaluation and spatial pattern analysis of urban sustainability, this paper provides index model and method supports of urban development assessment for comprehensive statistics and analysis, and the evaluation of urban development level in China as well as offers a reference for monitoring the process of urbanization.
To quantitatively evaluate urban sustainable development level in China and reveal its spatial distribution, a comprehensive index system for urban sustainable development from three aspects, society, economy and environment, is established and then the performance of urban sustainable development is evaluated based on the TOPSIS (Technique for Order Preference by Similarity to an Ideal Solution)-Entropy method. The remainder of this article is organized as follows. 
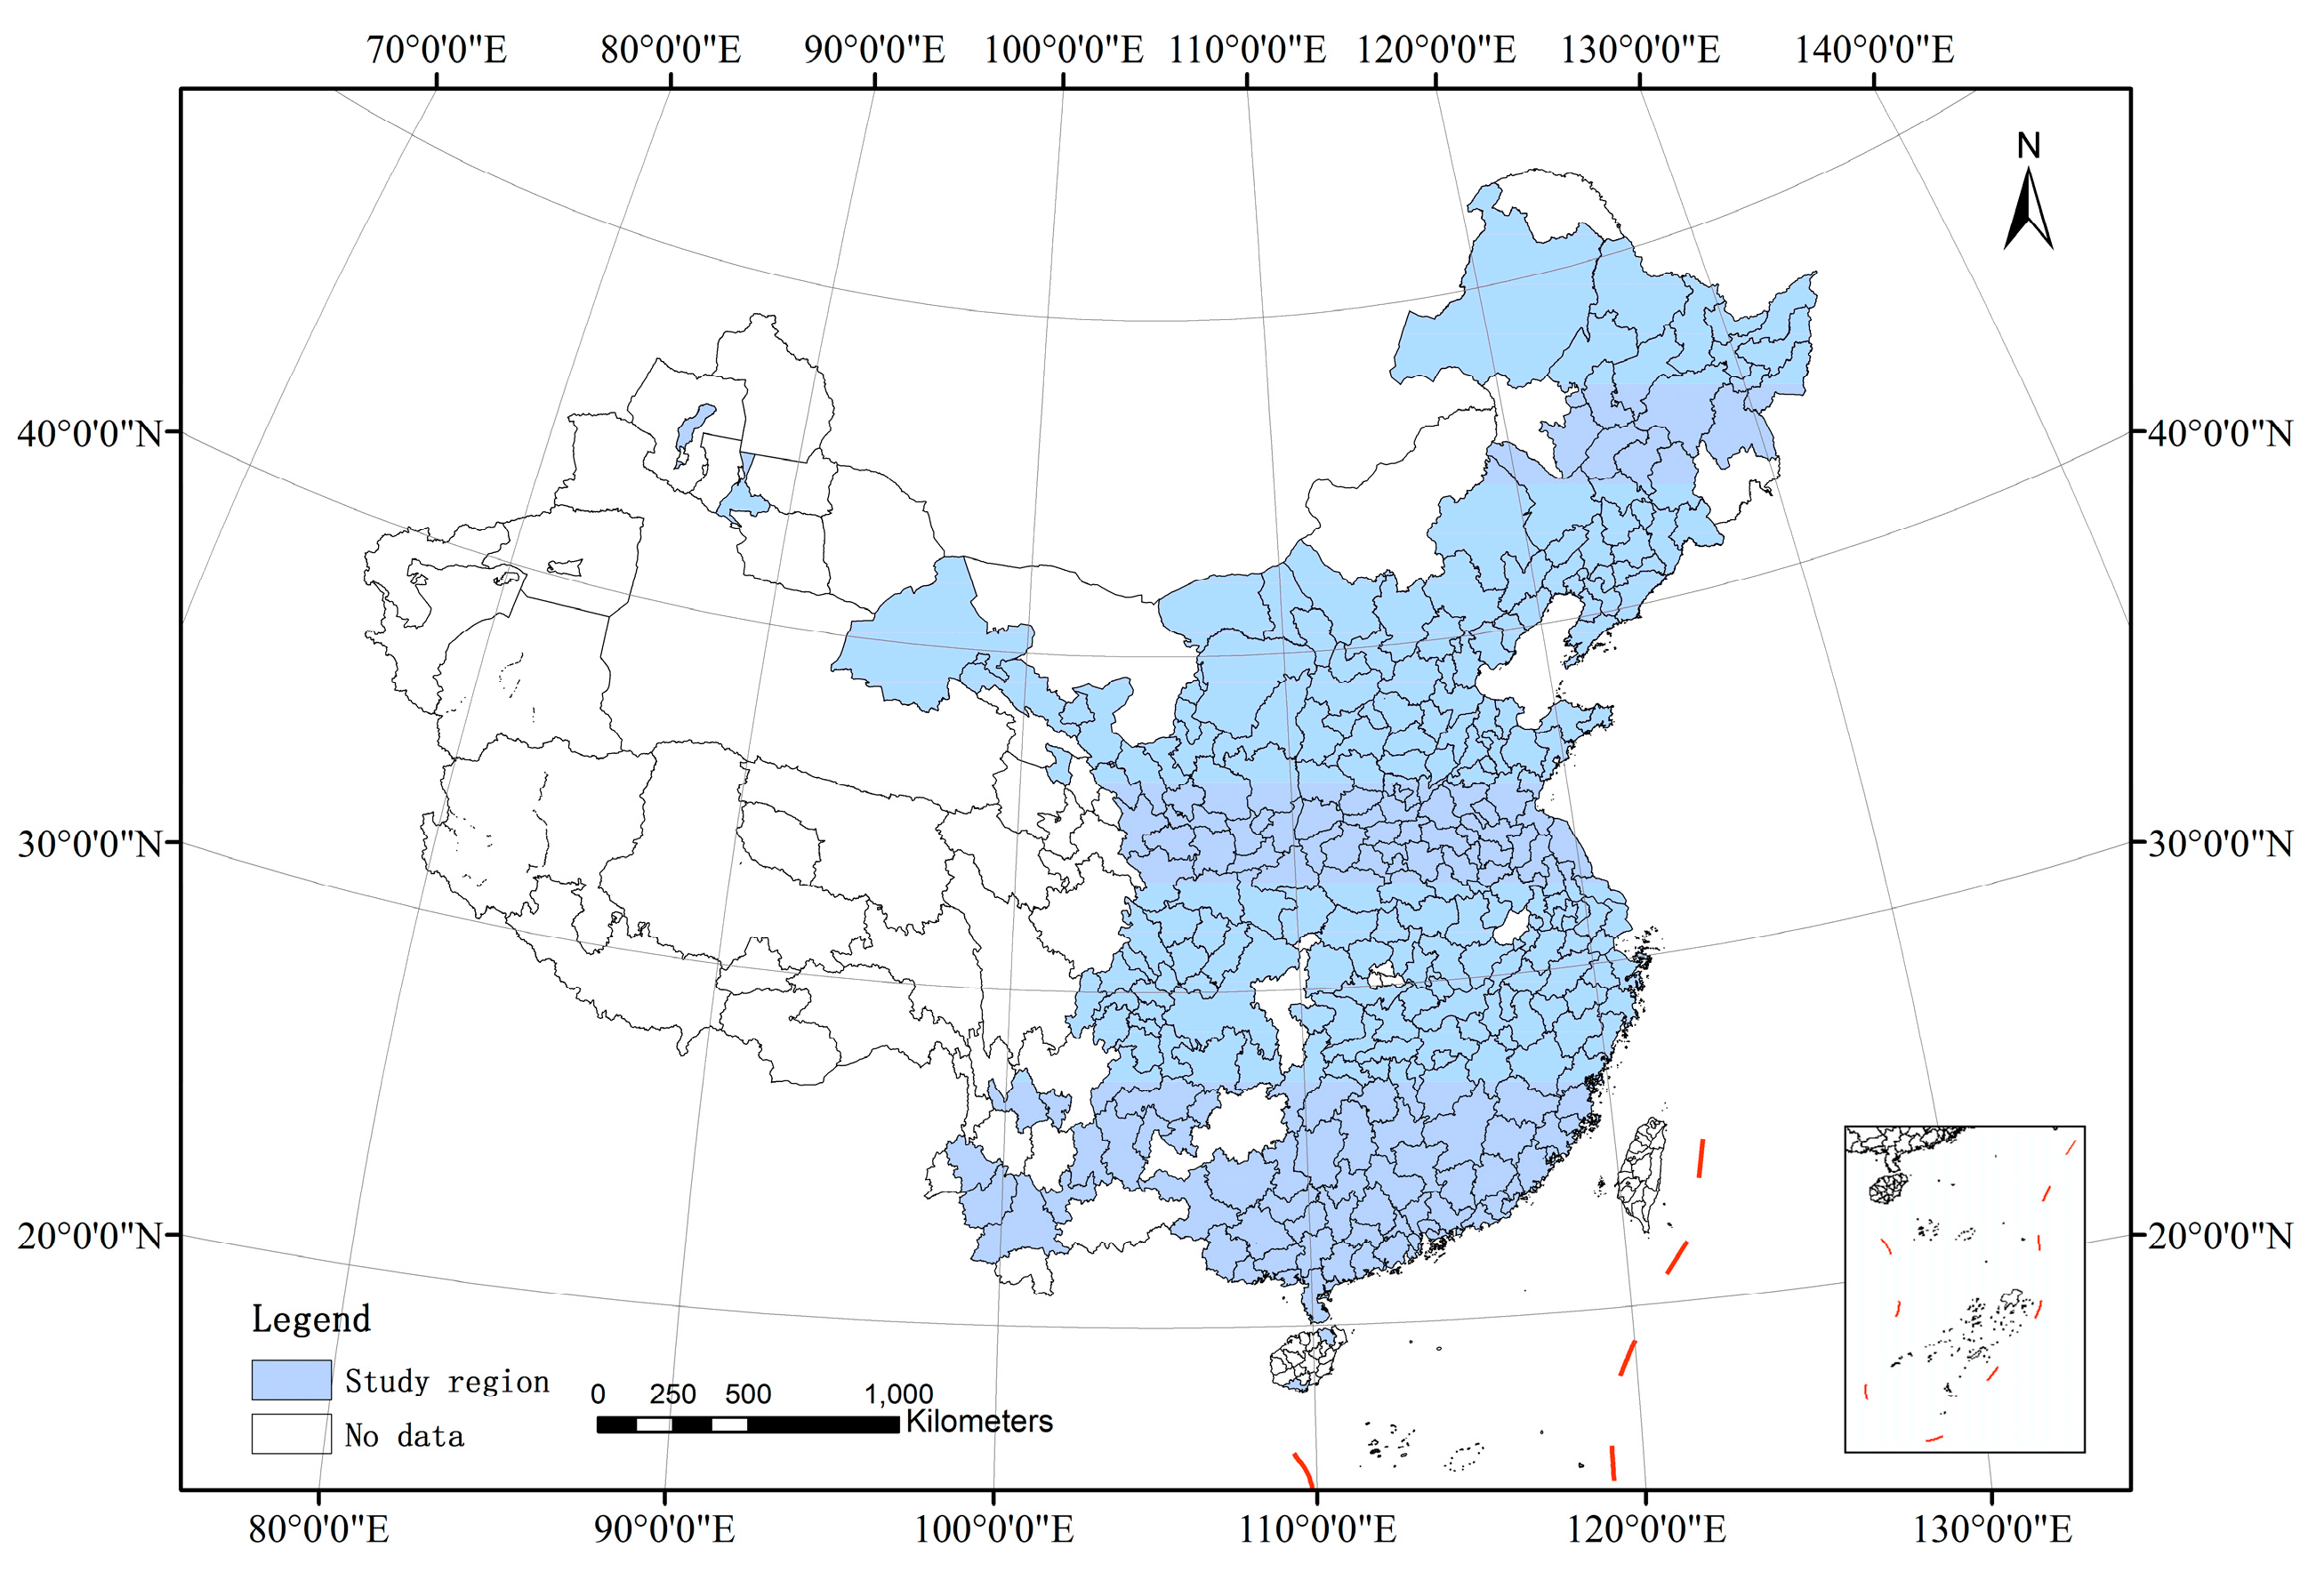
Section 2 introduces the study areas and data. Section 3 presents the study methods, including construction of the index system for urban sustainable development (USI), the evaluation method and the weighting method of index system. Next, the results and discussion are elaborated in Section 4. Finally, this paper makes conclusions and gives suggestions in Section 5.

2. Study Areas and Data

2.1. Study Areas

By the end of 2012, the total number of cities at prefecture level and above in China reached 289, including four municipalities and 285 prefecture-level cities. Due to insufficient data sources, 287 cities, excluding Lhasa and Sansha, were selected for this study (Figure 1). The total population of the cities in the study region is 1.263 billion (93.28% of China’s population), and the gross area studied is 4701,500 square kilometers, accounting for 48.93% of China’s land areas.
According to the explanation about accelerating the construction and development of urban agglomerations in “The Thirteenth Five-Year Plan for National Economic and Social Development of the People’s Republic of China”, 19 urban agglomerations will be built in China. Cities in the study region are distributed into 17 of those urban agglomerations: the Yangtze River Delta, the Pearl River Delta, Beijing-Tianjin-Hebei, Middle Yangtze River, Chengdu-Chongqing, Shandong Peninsula, Hachang, Mid-southern Liaoning, West Taiwan Strait, Guanzhong, Central Plains, Beibu Gulf, Hu-Bao-E-Yu, Jinzhong, Lanzhou-Xining, Dianzhong and Qianzhong.

2.2. Data Resource

The data used in this study are from Chinese social and economic statistical yearbooks database [46], including “China Urban Construction Statistical Yearbook 2012” [47], “China city statistical yearbook 2013” [48] and “China Statistics Yearbook for Regional Economy 2013” [49]. In this study, the weight of each indicator was calculated by programming in C# language, and all the spatial maps were produced using the software ESRI ArcGIS 10.3 (Esri, Redlands, CA, USA). The data sources of the indicators are shown in the Appendix A.

3. Study Methods

3.1. Establishment of the Index System

A City is a complex organism with three key elements: society, economy and environment. Sustainable development of cities is supposed to be the harmonious and all-round development of these three elements, among which environmental sustainable development serves as the basis, economic sustainable development the guarantee, and social sustainable development the ultimate goal. While undergoing the unprecedented urbanization process over the past few decades, China has been faced with a series of problems caused by urban development, such as depletion of resources, unbalanced regional development and expansion of urban–rural differences, which urgently need to be solved by transforming from traditional development modes into sustainable development.
The establishment of an appropriate index system is the fundamental requirement for scientific analysis of urban sustainable development. Synthetic evaluation of sustainability for urban development is affected by many factors, commonly comprising economic, social and environmental aspects [2,5,13,14,15,16,17,18]. In this study, a total of 23 indicators are selected to construct the index system from those three basic aspects, based on the understanding of urban sustainable development, systematic selection of indicators, and data integrity and availability. The specific index system is shown in Table 2.
Specifically, on the social level, the nature of social sustainable development lies in improving the quality of human life, raising the level of human health and creating a social environment guaranteeing people’s equality, freedom, education and human rights. In Table 2, SO1 is chosen to reflect the quality of human life from the perspective of net income; SO2 reveals the gap of net incomes between rural and urban citizens; SO3 is chosen because the population problem is one of important problems of sustainable development and the density of population can represent urbanization level; SO4 and SO6–SO8 reflect the current situation of housing, education, health care and employment, respectively, which are the most basic social problems; SO5 is used to reflect the condition of water supply; SO9 outlines the condition of public transport facilities and the promotion of green travel; and SO10 shows the convenient degree of traffic, which ensures communication and transportation of social and economic activities.
With respect to economy, sustainable development not only pays attention to the quantity of economic growth, but also pursues the quality of economic development. Economic sustainable development requires changing the traditional development modes, characterized by production and consumption patterns with high input, high consumption and high pollution, thereby realizing cleaner production and consumption to increase gains of economic activity, conserve resources and reduce pollution emissions. As one of the important indexes of economic development assessment, EC1 can directly reveal peoples’ living level; EC2 reflects people’s consumption level and purchasing power of social commodities; EC3 shows the proportion of tertiary industrial output value and the industrial structure; EC4 and EC5 are chosen to reveal resource consumption in economic activities; and EC6 manifests fund investment to promote the advancement of science, technology and education.
In the environmental aspect, the contradiction between environment and economic development has been an outstanding problem in China for a long time. Environmental system suffers from great pressure while economy has been growing at a high speed. The problems of resource waste and environmental pollution are still quite serious. Sustainable development, which stresses the synchronism of economic development, the protection and improvement of ecological environment, and the effective control of resources waste and environmental pollution (contamination of water, air, soil, etc.), can satisfy the human need for material and energy as well as preserve the high quality of the environment to provide a comfortable living environment. EN1 and EN2 quantitatively reveal typical air and water pollutant discharge caused by economic development; EN3–EN5 outline the status of pollutants and waste disposal; EN6 is selected to show the overall situation of urban air quality; and EN7 can demonstrate the situation of green cover and the capacity of carbon sequestration.
In Table 2, in addition to indicators adopted by the majority of the existing literature [25,29,30,31,36,37], several important indicators are also used in this paper, such as “water coverage”, “teacher–student ratio in middle school”, “number of health workers per 10,000 persons”, “total retail sales of consumer goods per capita” and “industrial waste water emissions per 10,000 output value”. The respectively reasons for inclusion and consideration of these five indicators are elaborated as follows: (1) water coverage is the basic guarantee of people’s life and an indicator necessary to be considered due to the water shortage problem existing in China; (2) the quality of education not only depends on the commonly adopted indicator of number or rate of students, but also on the teacher–student ratio which can help guarantee the quality of education; (3) both the number of health workers and beds per capita are of importance, and as the two factors show the strong positive correlation through correlation analysis, in this study, the former is chosen because of the critical role of doctors in hospitals; (4) consumption has direct and indirect effects on economic growth, and total retail sale of consumer goods per capita is an economic indicator that reflects the consumption level per capita; and (5) both waste water and waste gas emissions have bad effects on environment. Water environment and water security are directly related to people’s life and the needs of economic and social development. Industrial wastewater emissions per 10,000 output value reflects the status of “Green production” and the influence of water environment caused by industrial production.

3.2. Calculation Method of the Weights

Entropy was introduced into information theory by Shannon in 1948, and was previously a physical concept of thermodynamics. The entropy method is an objective weighting method based on the principle that greater uncertainty about outcomes results in a more uniform probability assigned to them [50]. Nowadays, this method has been widely used in research on urban ecosystems, including evaluation of living environment, ecological environment, economic development, etc. The information entropy can clearly reveal the utility of each indicator and avoid the interference of subjective factors, which ensures that it is more objective and credible than the subjective methods for comprehensive evaluation of multivariate index.
The principles of the entropy method are as follows:
(1)
The raw data of the indicators are taken as an m × n matrix, where m is defined as the number of evaluation objects and n indicates the number of indicators.
Hence, the original data matrix of the index system can be expressed as Equation (1):
X = [ x 11 x 12 x 1 n x 21 x 22 x 2 n x m 1 x m 2 x m n ]
(2)
Data normalization
Taking into account its differences in dimension and magnitude, the original data cannot be directly used for assessment. After collection of the original data, the process of data normalization is necessary. All indicators are classified into two categories: the positive and the negative. The positive indicator is the indicator for which bigger values are better. The negative one refers to the indicator for which smaller values are better.
When xij is the positive indicator, the normalized value yij can be calculated as Equation (2):
y i j = x i j min x i j max x i j min   x i j
When xij is the negative indicator, the normalized value yij can be calculated as Equation (3):
y i j = max   x i j x i j max x i j min   x i j
where xij is the value of the jth indicator of the ith object. maxxij and minxij denote the maximum and minimum values of the jth indicator, respectively.
(3)
Calculation of the entropy value of the jth indicator
To calculate the entropy value of each indicator, the standardized value of indicator j for object i must first be calculated, and is written as Equation (4):
p i j = y i j / i = 1 m y i j
Then, calculate the entropy value of the jth indicator using Equation (5):
e j = k i = 1 m ( p i j ln p i j )
where k = 1/lnm.
(4)
The weighting value of the jth indicator is defined as Equation (6):
w j = 1 e j j = 1 n ( 1 e j )

3.3. TOPSIS Model

TOPSIS model (Technique for Order Preference by Similarity to an Ideal Solution) was first proposed by Hwang and Yoon in 1981 [51]. It is a comprehensive evaluation based on distance and is widely used for multiple attribute decision making [52,53,54,55,56]. This model can objectively and comprehensively reflect the level of sustainable development by calculating the closeness degree between an evaluation value and its ideal solution. Specific steps are as follows:
(1)
Weighted assessment matrix is firstly established as Equation (7).
v i j = w j y i j   ( i = 1 ,   2 ,   ,   m ;   j = 1 ,   2 ,   ,   n )
(2)
Determine the best solution V + and the worst solution V :
V + = { ( max V i j | j J ) , i = 1 , 2 , , m } = { V 1 + , V 2 + , V n + }
V = { ( min V i j | j J ) , i = 1 , 2 , , m } = { V 1 , V 2 , V n }
(3)
Calculate the distance D j + between the evaluation value and the best solution V j + , and the distance D j between the evaluation value and the worst solution V j :
D i + = j = 1 n V i j V j + 2   ( i = 1 ,   2 ,   ,   m )
D i - = j = 1 n V i j V j - 2   ( i = 1 ,   2 ,   ,   m )
(4)
To compare the distance between the evaluation value and two ideal solutions, calculate the relative quality level of the object i using Equation (12):
C i = D i D i + + D i   ( i = 1 ,   2 ,   ,   m )

3.4. Evaluation of Urban Sustainable Development and the Performance of Coordinated Degree

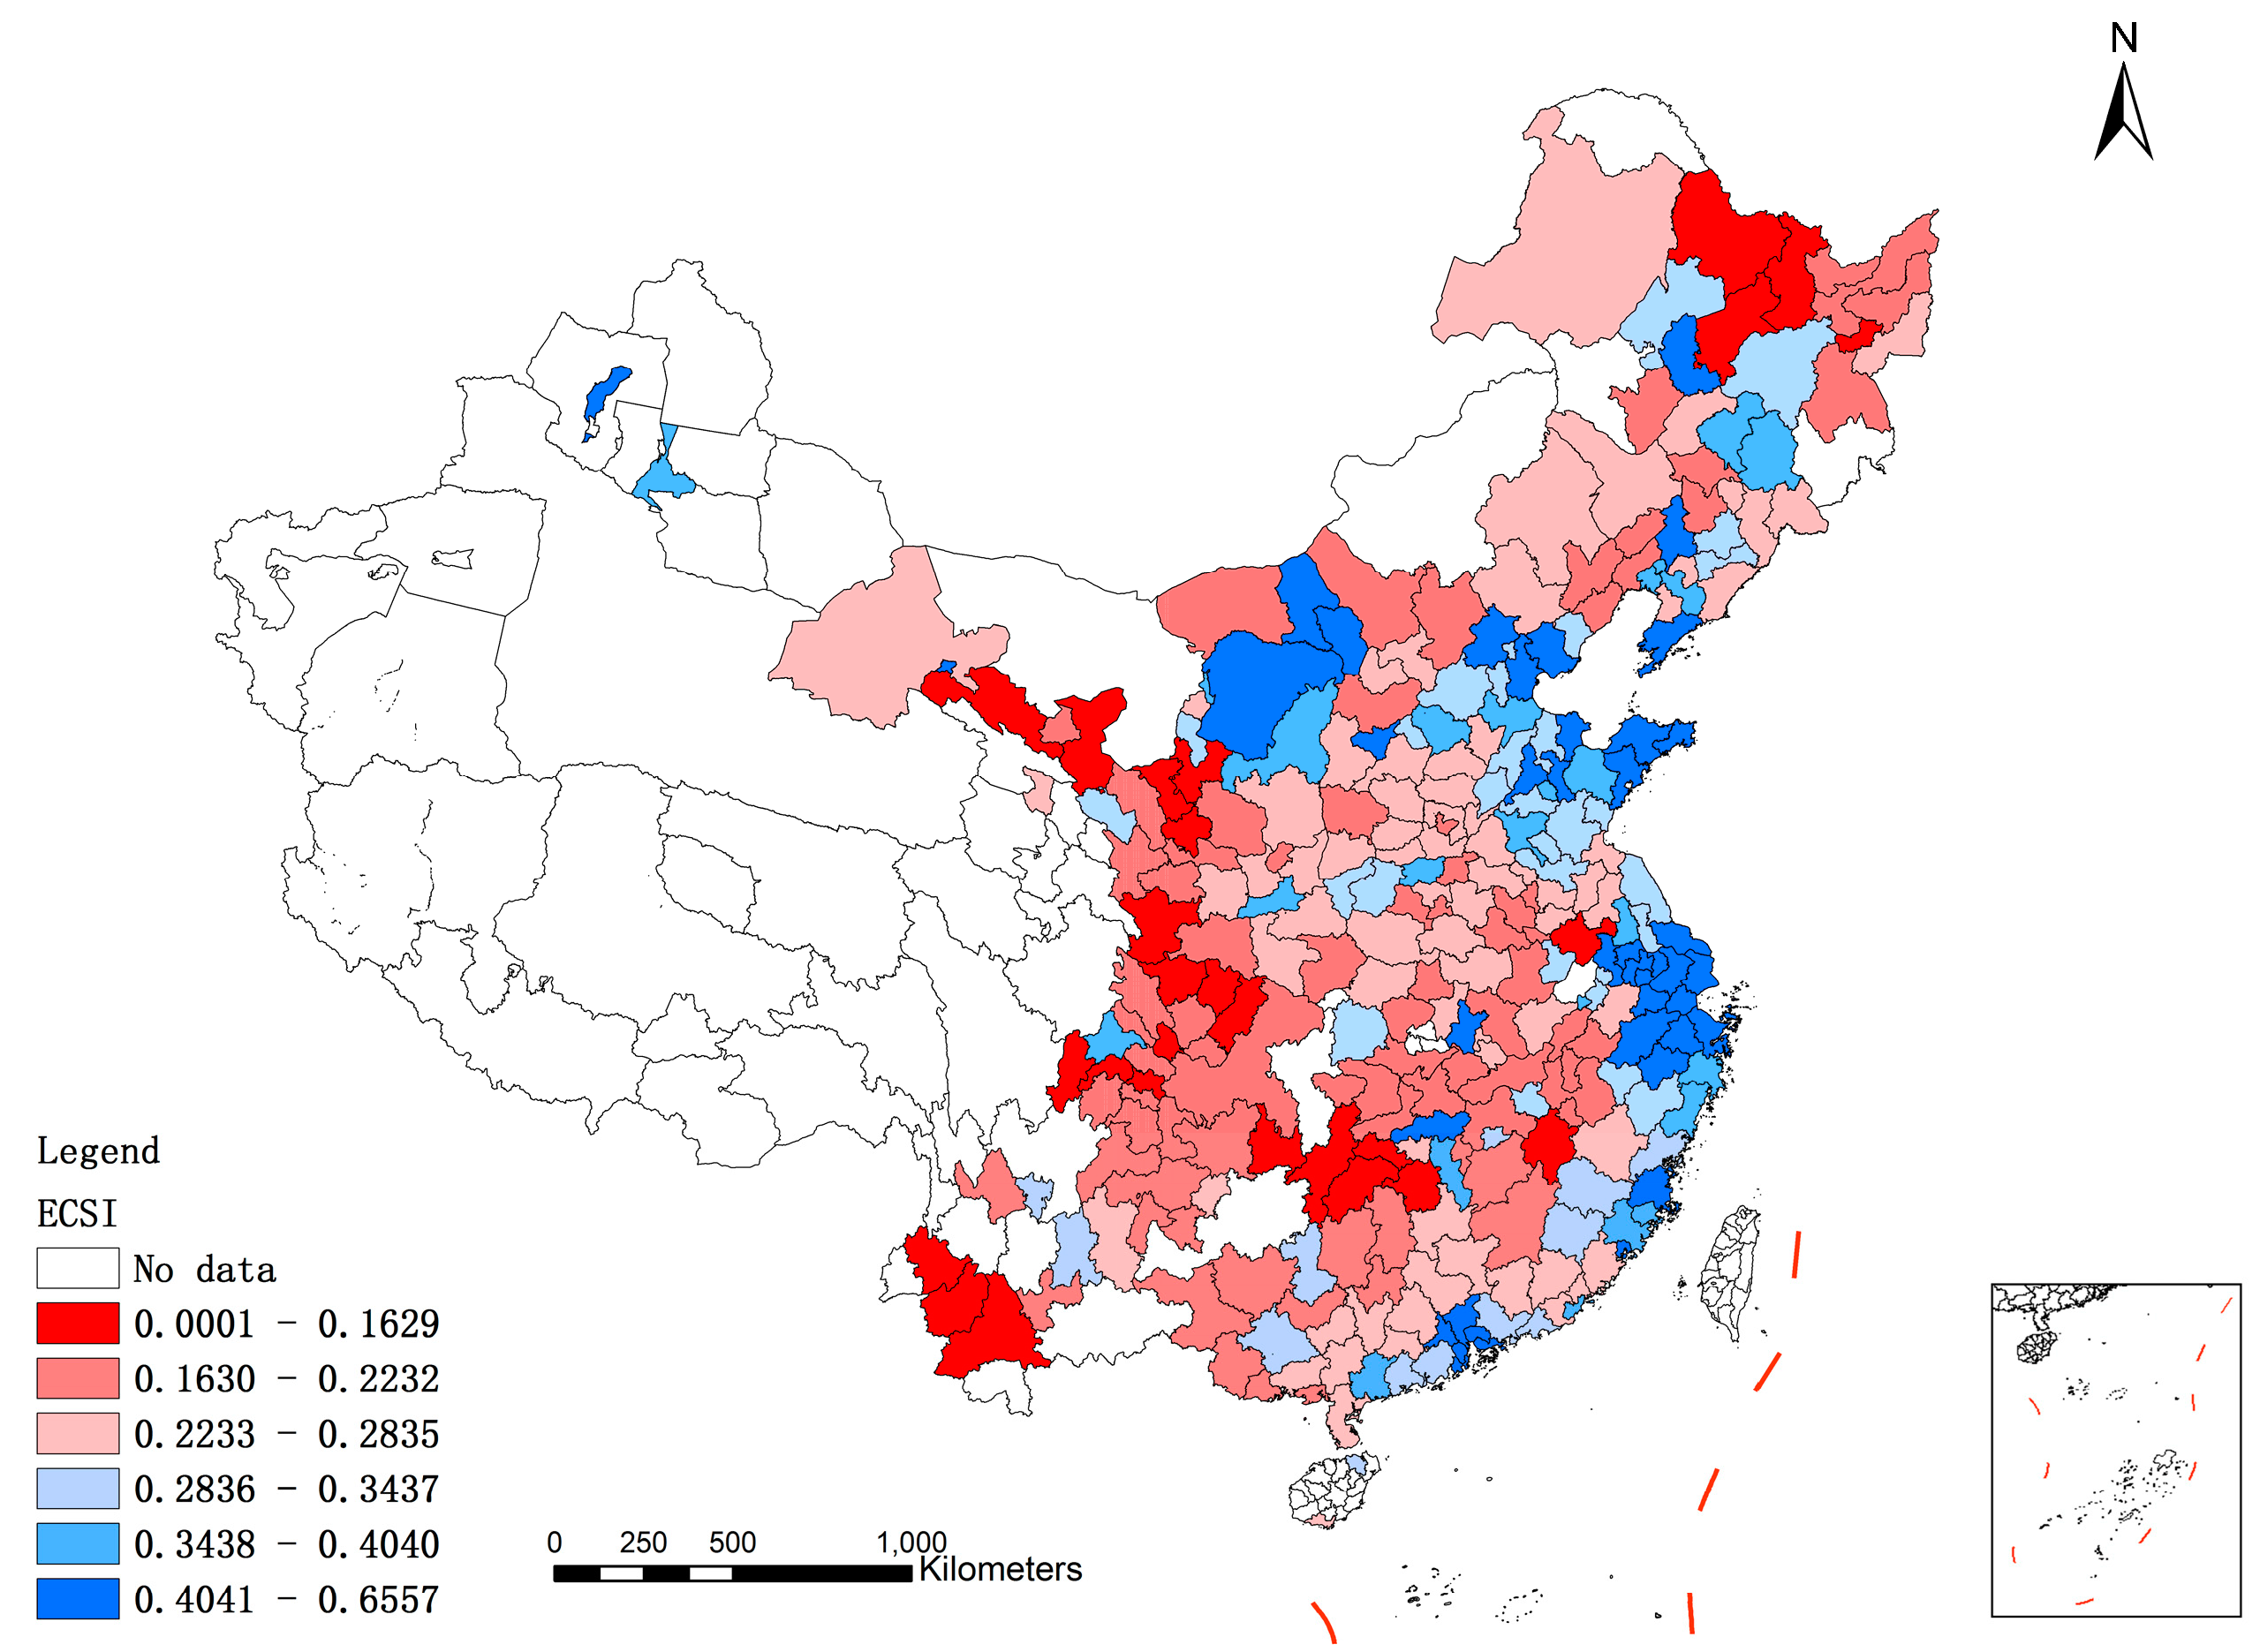
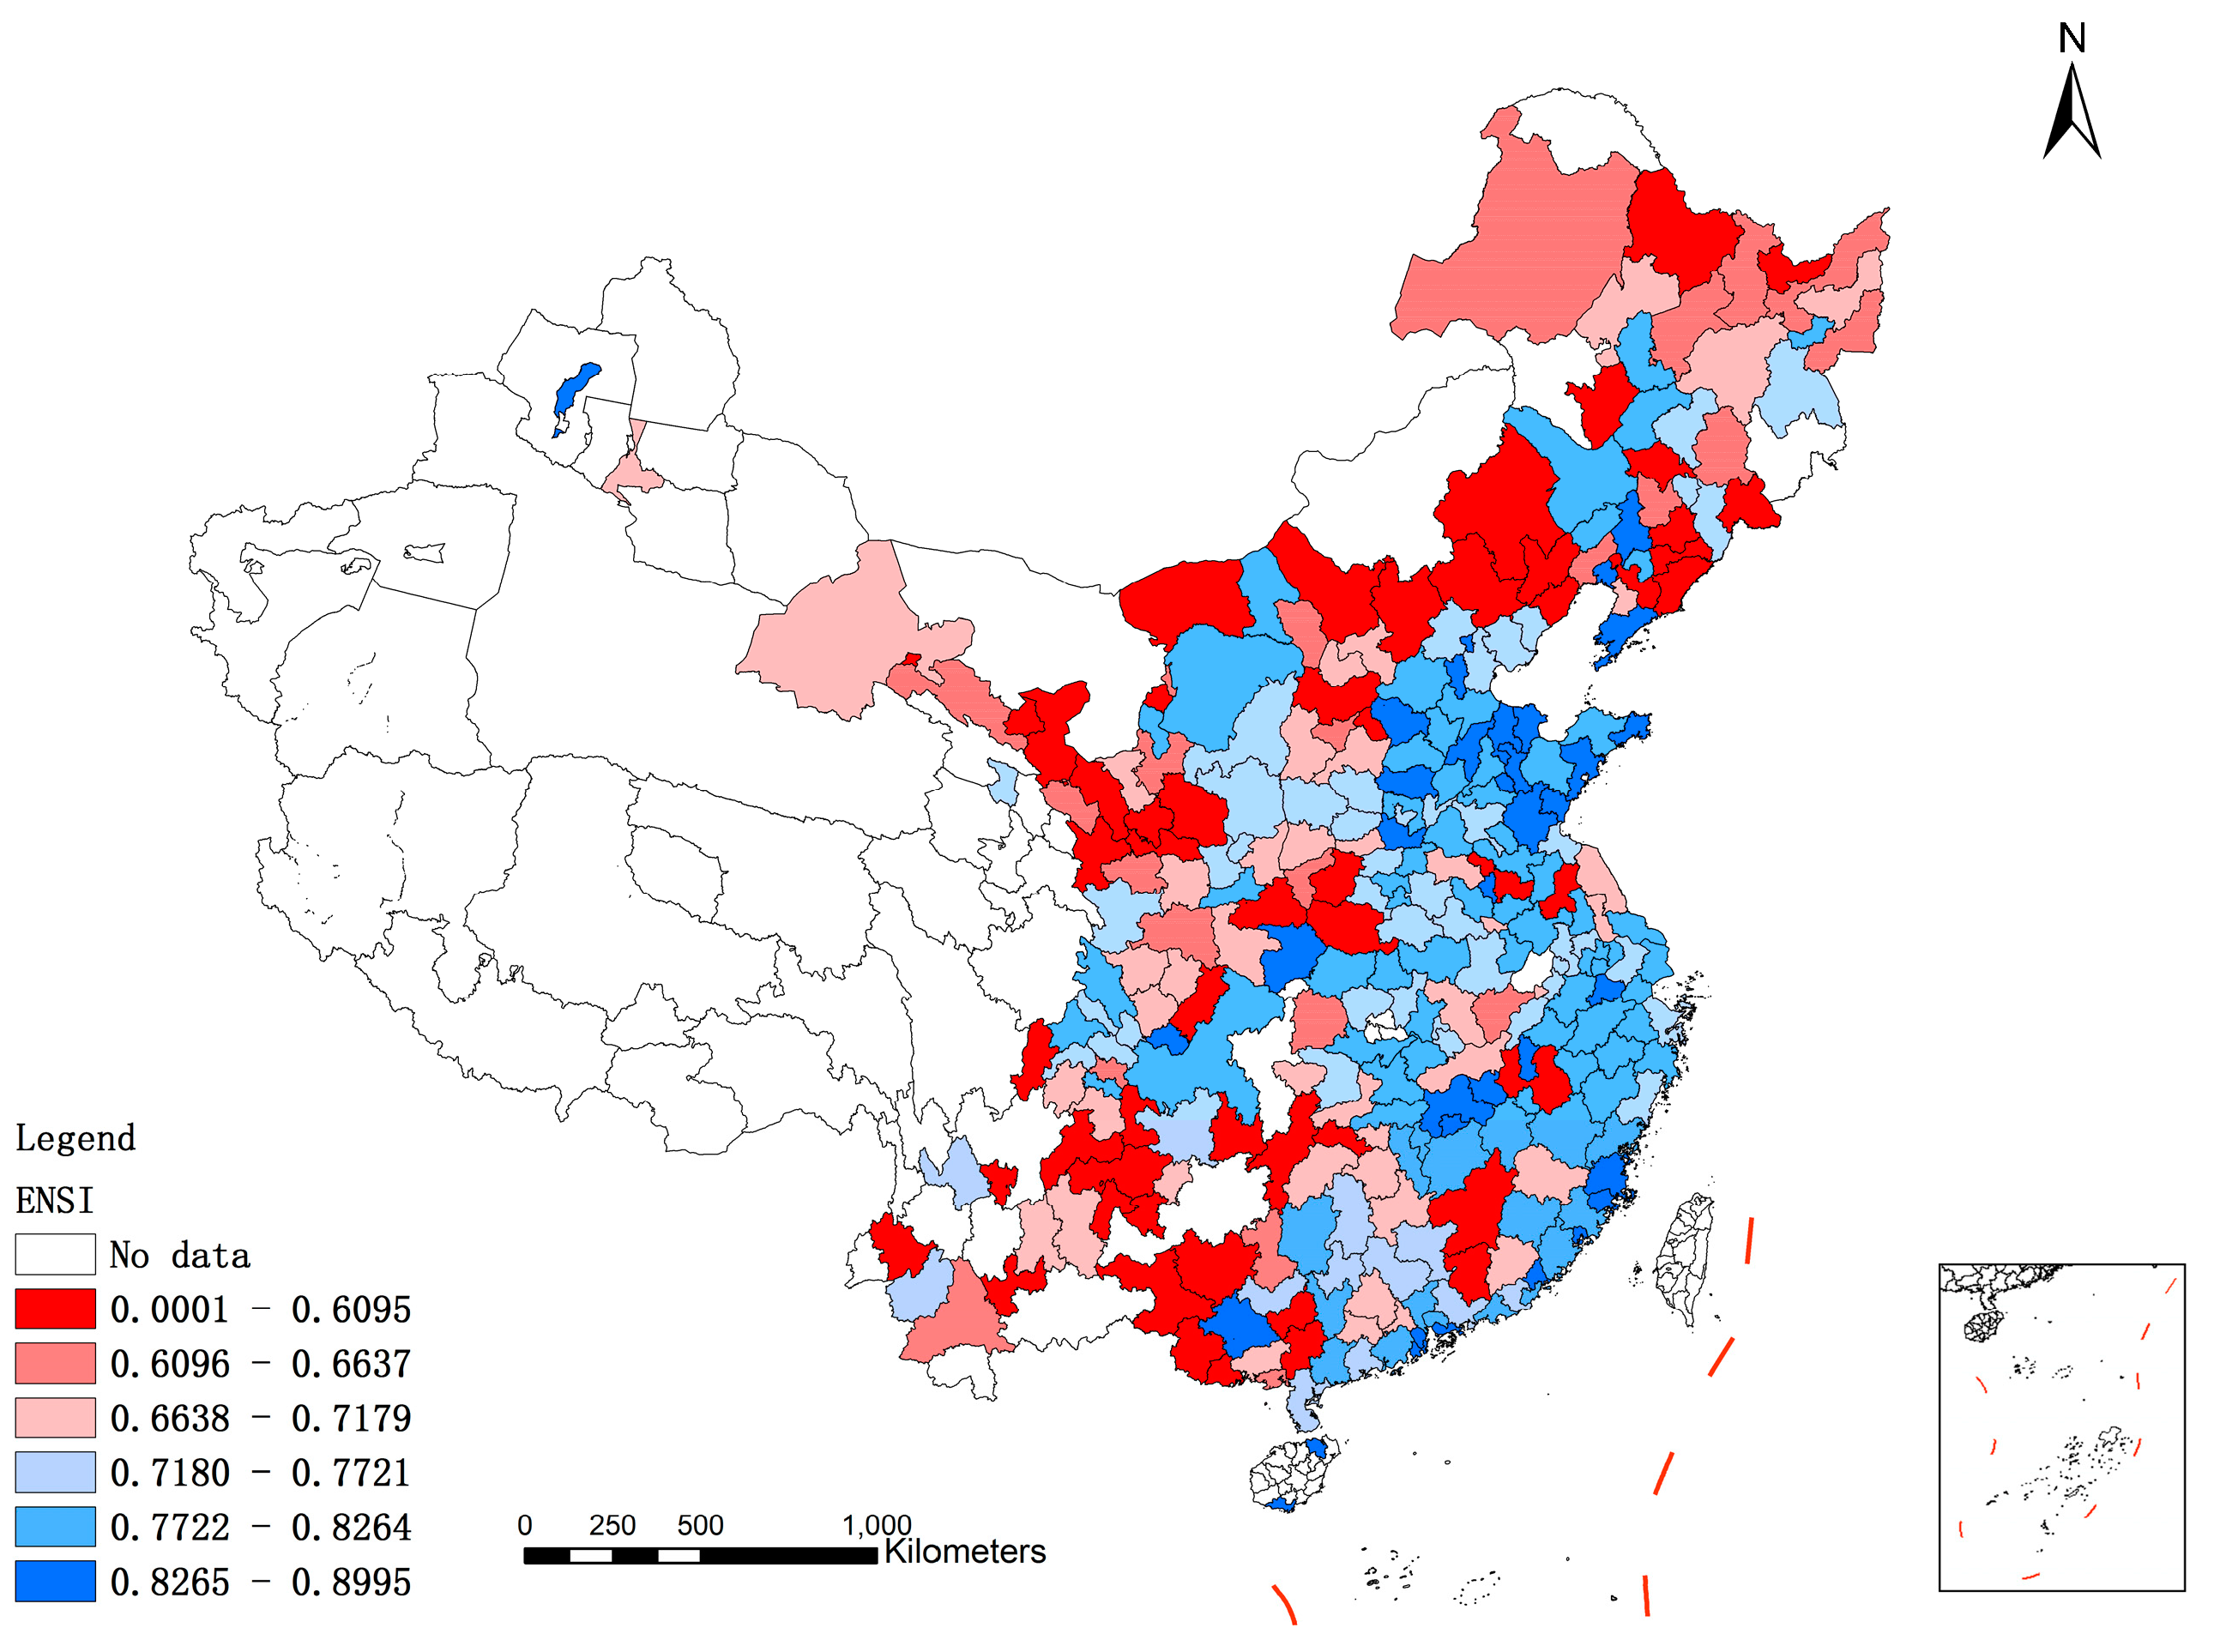
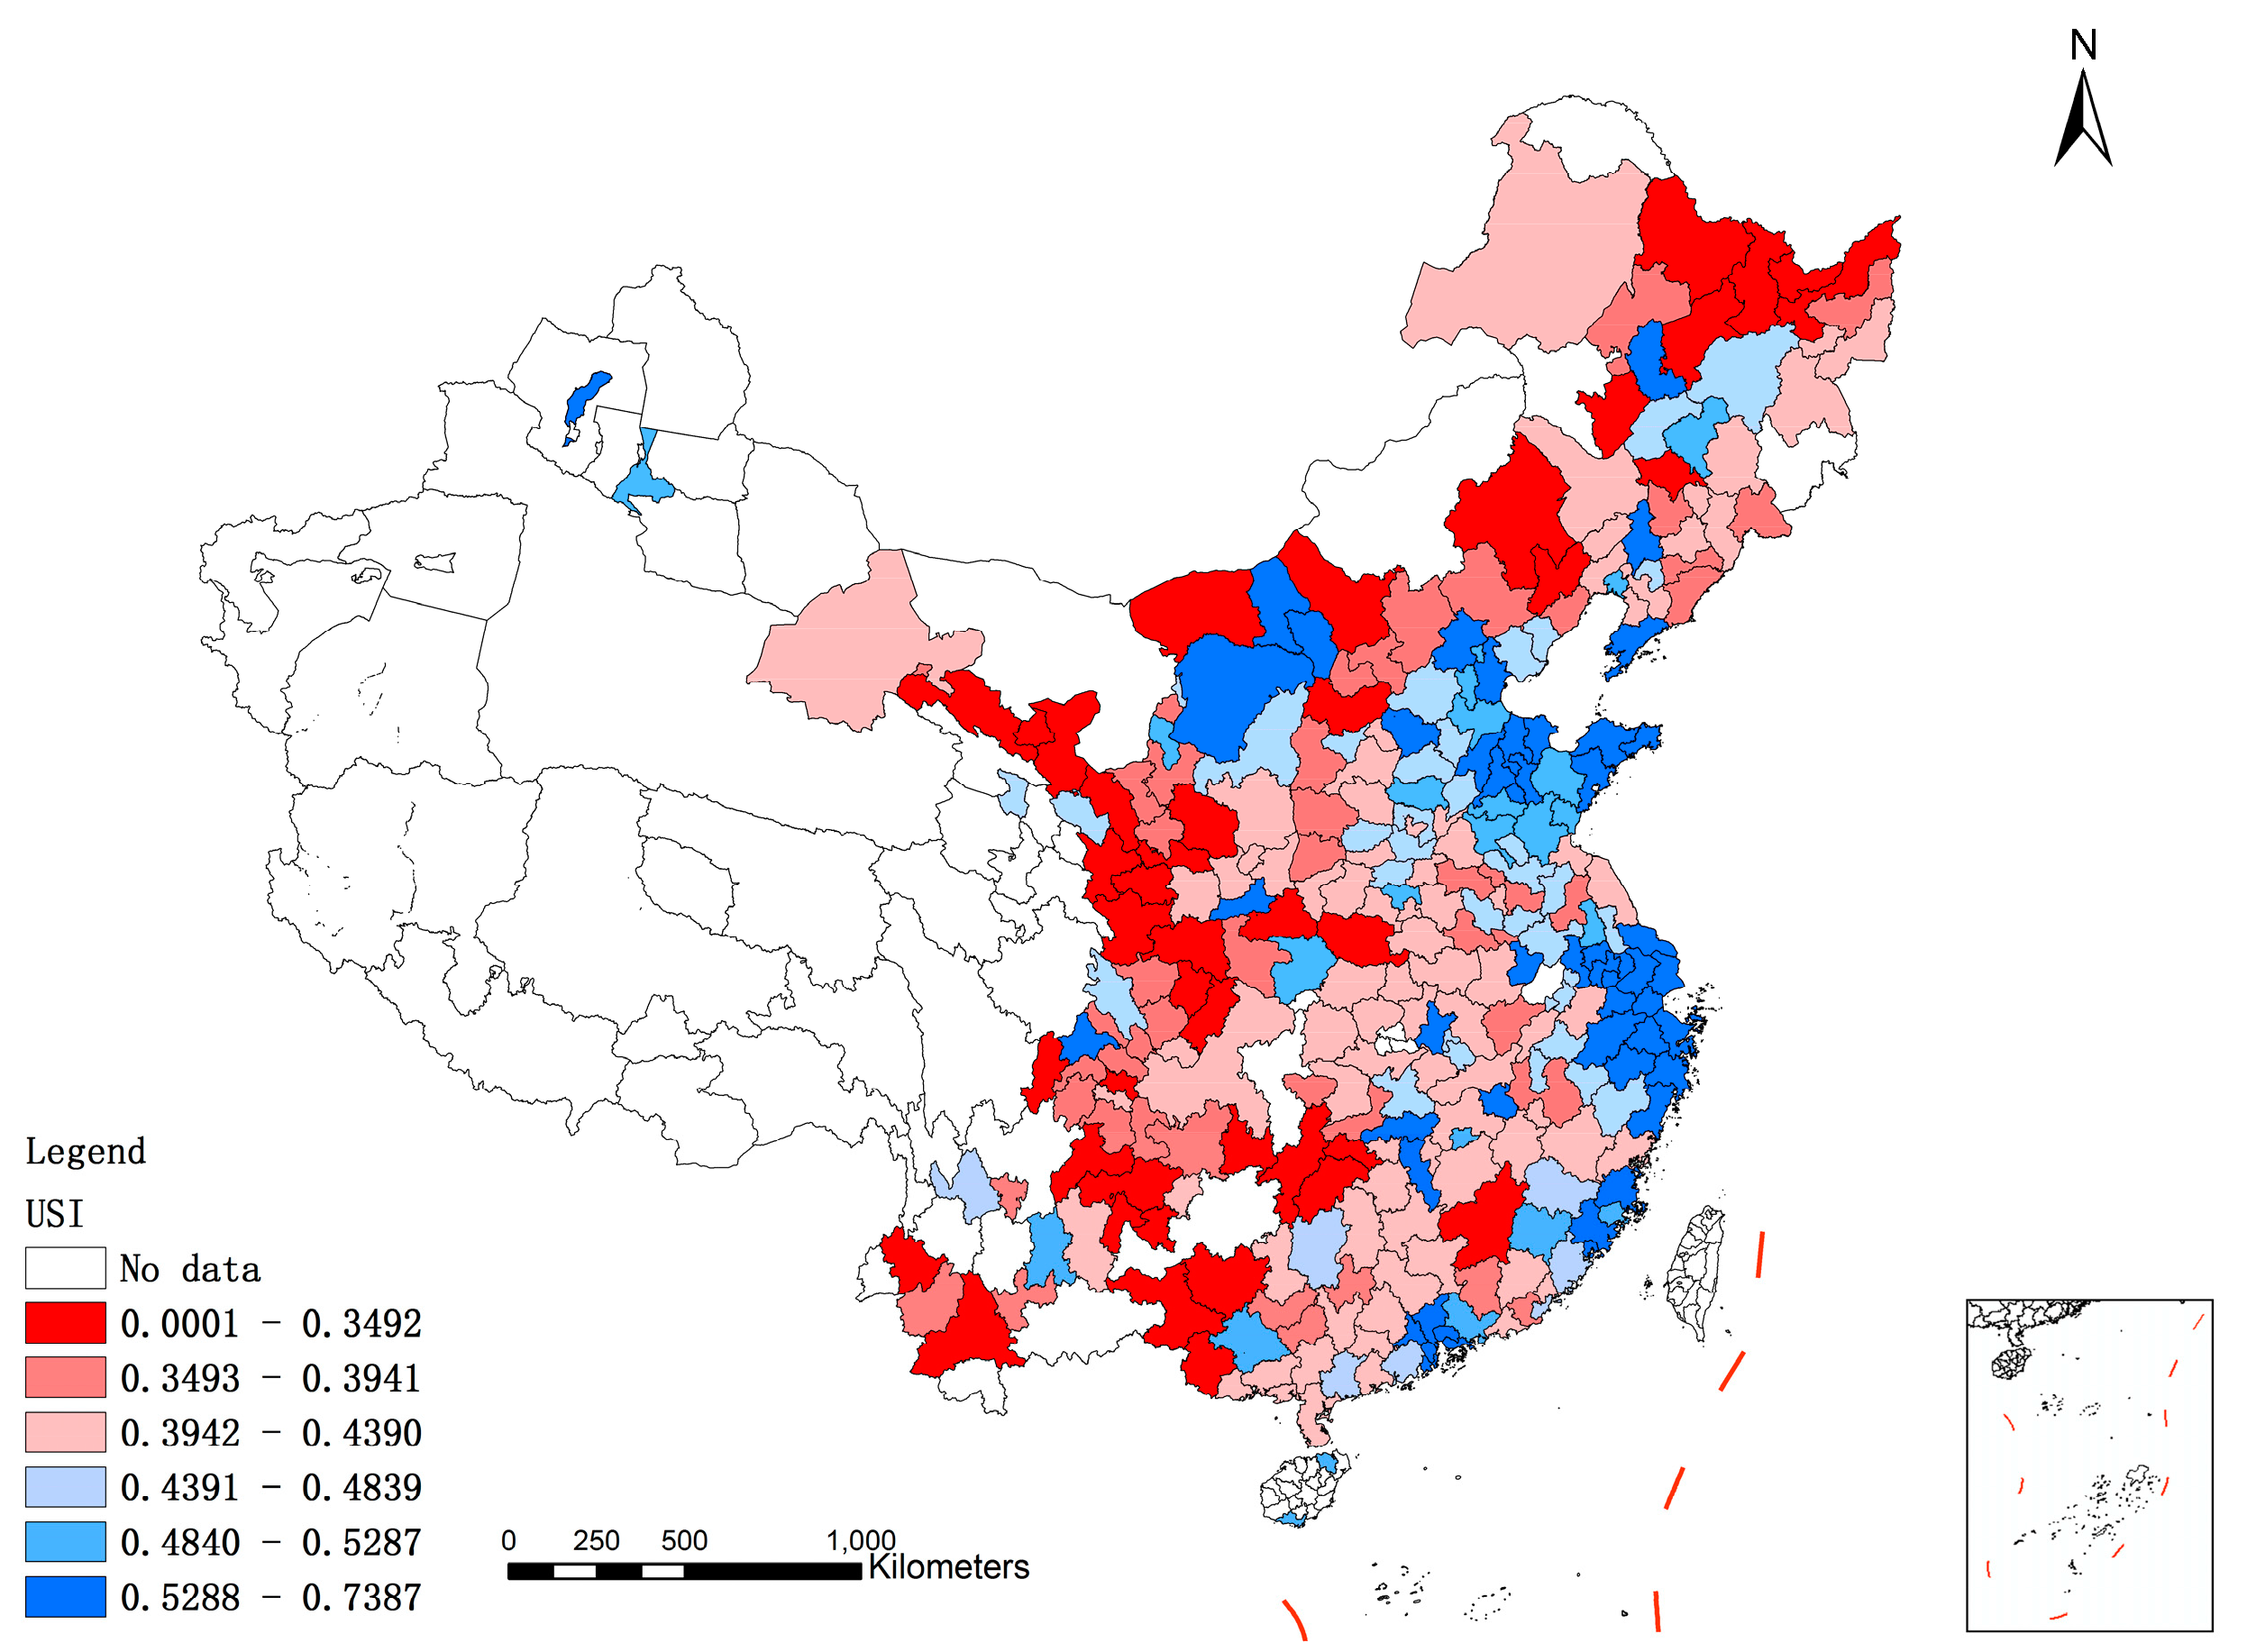
In the context of urban sustainability evaluation, the indicators are classified into three dimensions: society, economy and environment. According to the TOPSIS model, evaluation values of each dimension (Ci(SSI), Ci(ECSI) and Ci(ENSI)) are calculated using Equation (12).
The comprehensive evaluation value of each object can be defined as Equation (13):
C i ( U S I ) = C i ( S S I ) w i ( S S I ) + C i ( E C S I ) w i ( E C S I ) + C i ( E N S I ) w i ( E N S I )   ( i = 1 ,   2 ,   ,   m )
where Ci(SSI), Ci(ECSI) and Ci(ENSI) denote the evaluation values of social, economic and environmental sustainability; and wi(SSI), wi(ECSI) and wi(ENSI) denote the weighting values of social, economic and environmental dimensions, and are calculated using Equation (6).
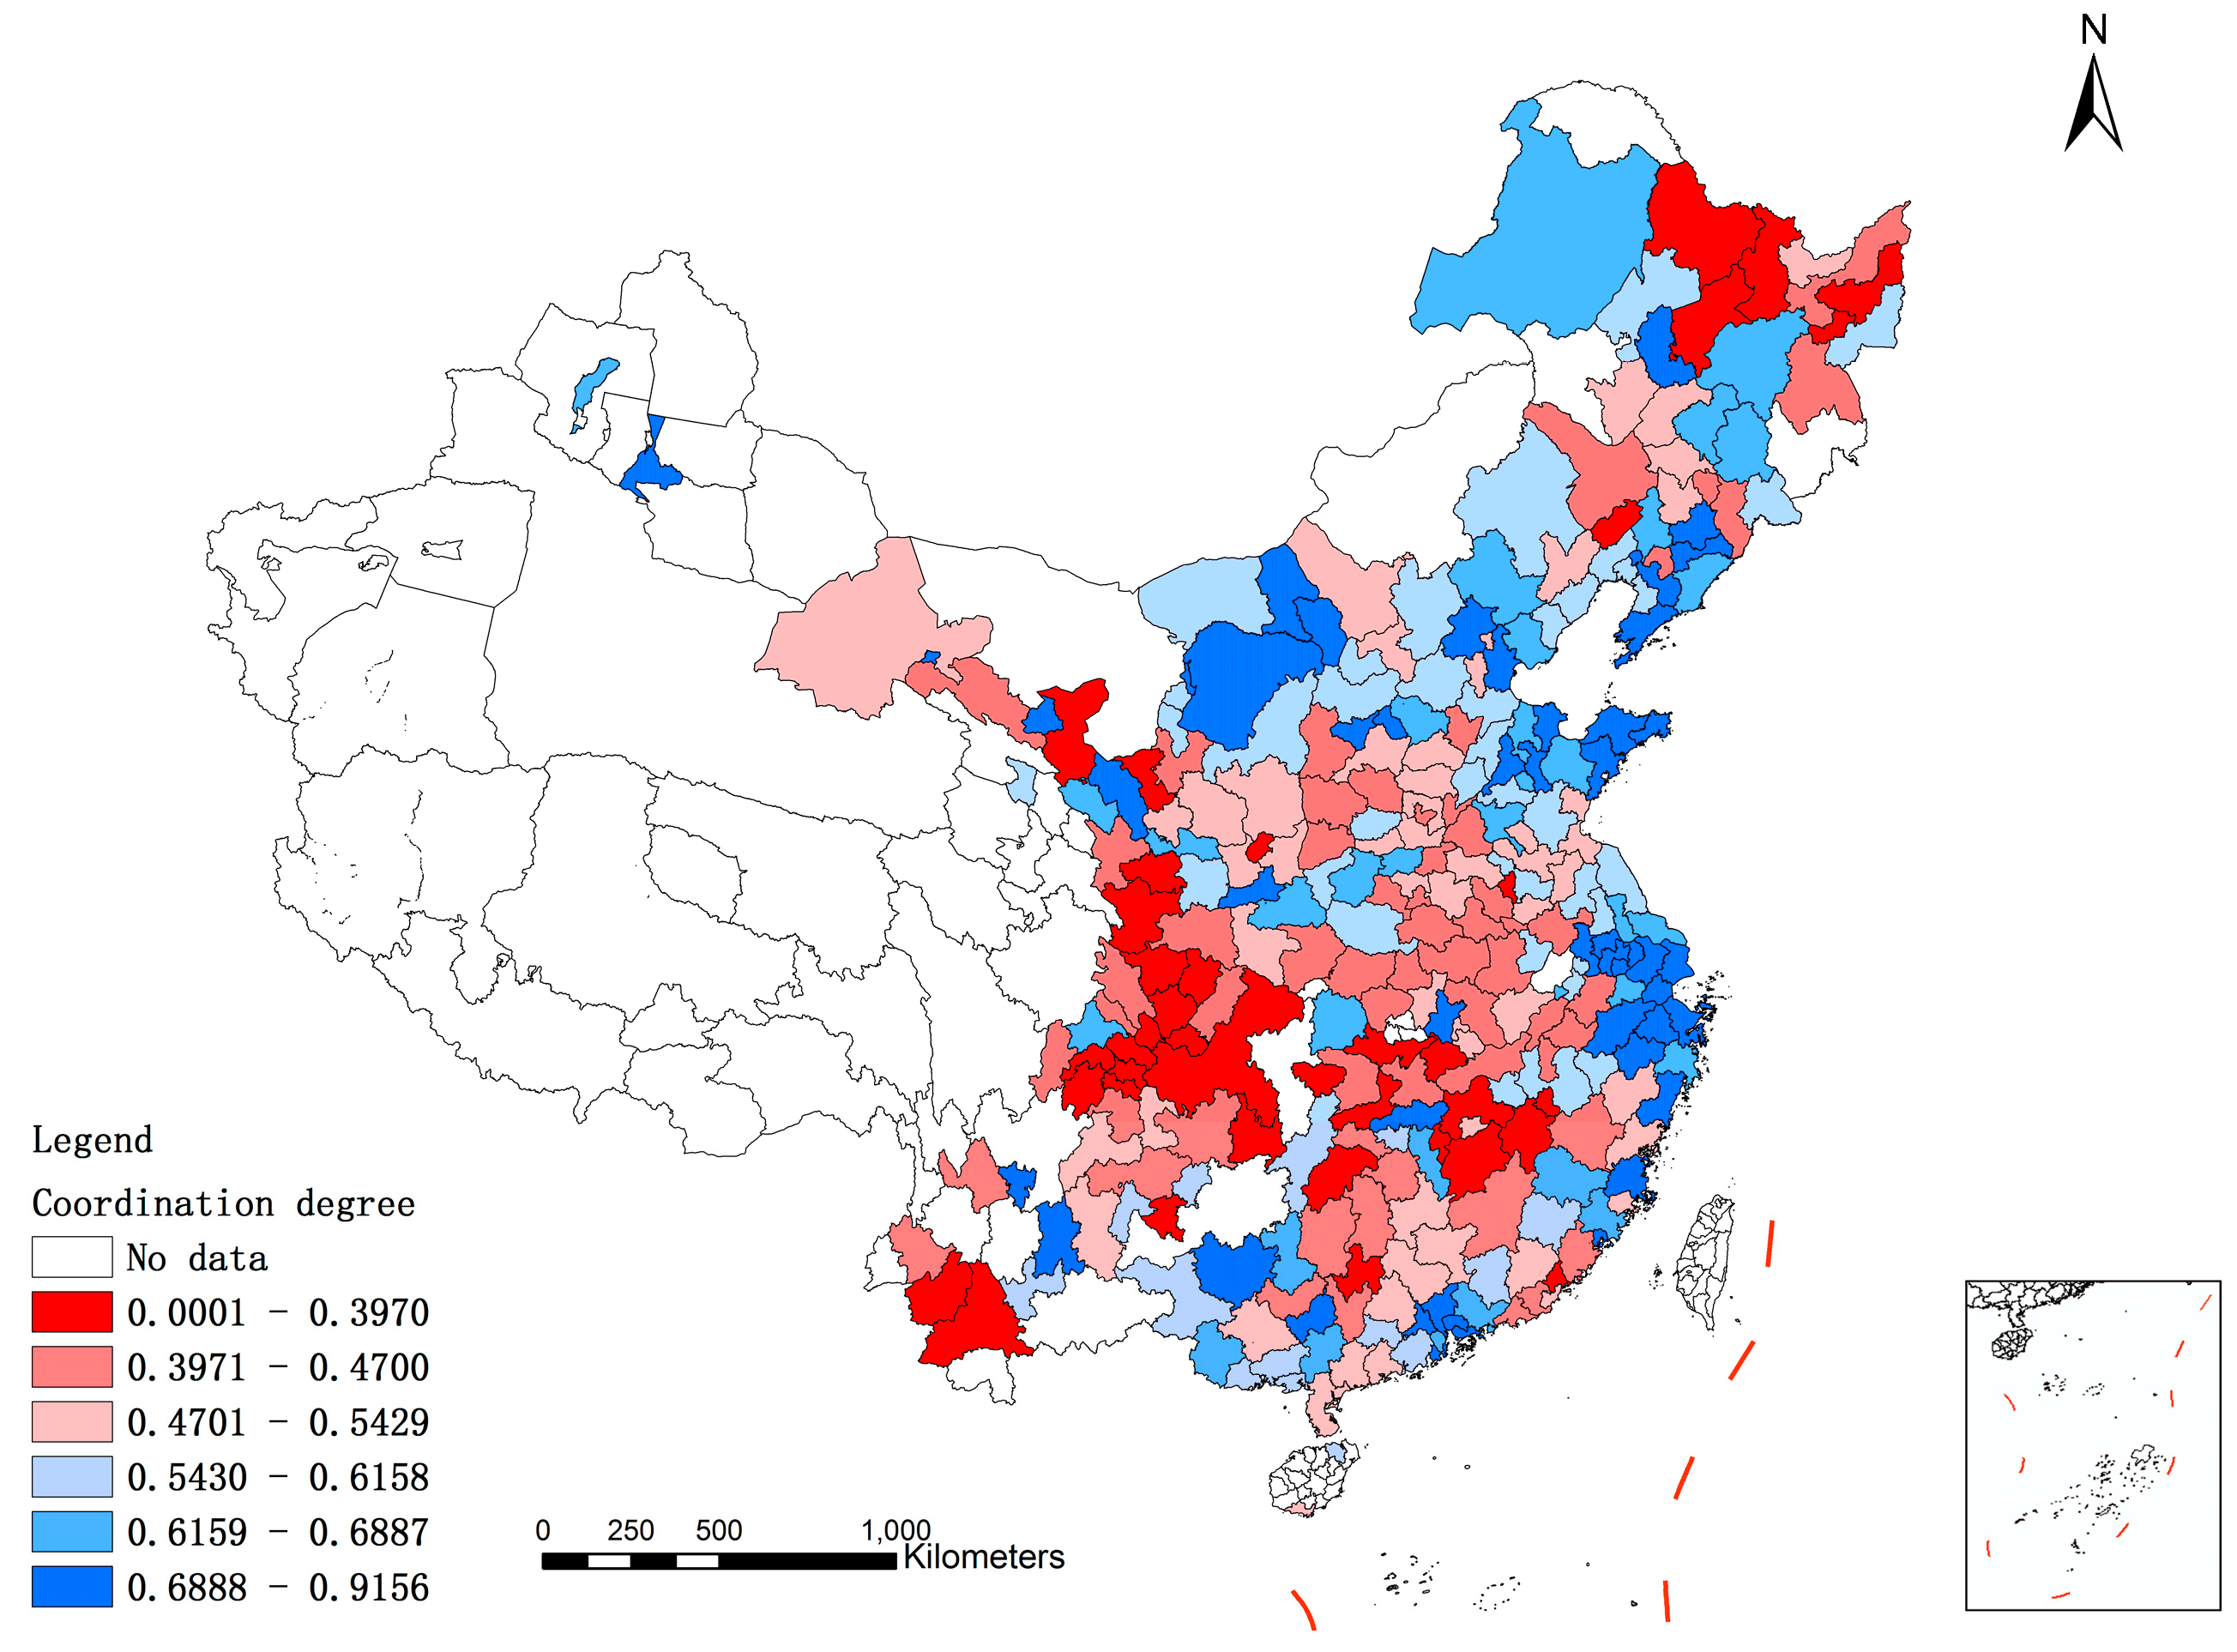
Urban sustainable development is not the single rapid development of society, economy or environment, but the highly coordinated development of these three aspects. Therefore, urban sustainable development should take into account the coordination of social, economic and environmental development. The coordination degree of urban sustainable development is calculated as Equation (14):
S i = 1 1 3 ( C i ( S S I ) C ¯ 2 + C i ( E C S I ) C ¯ 2 + C i ( E N S I ) C ¯ 2 ) C ¯   ( i = 1 ,   2 ,   ,   m )
where Ci(SSI), Ci(ECSI) and Ci(ENSI) denote the evaluation values of social, economic and environmental sustainability; and C ¯ is the average of Ci(SSI), Ci(ECSI) and Ci(ENSI).

4. Results and Discussion

4.1. Analysis of Three Sub-Indices

4.1.1. Analysis of Three Sub-Indices for Cities

The statistical results of the three sub-indices for cities are shown in Figure 2. The mean value of evaluation results represents the overall level of cities in the study region. The CV value shows the development disparity of these cities and the range value indicates the difference between the maximum and the minimum evaluation results.
In Figure 2, combined with the grading range of mean values (see Table 3, Table 4, Table 5 and Table 7), it can be seen that the performances of ECSI, ENSI and USI rank in the fourth level, except for the results of SSI which ranks in the third level, indicating that sustainable development of both the three dimensions and the overall results are at a relatively low level. Through further analysis of CV, the rank of CV values of evaluation on three sub-indices and the overall results are ECSI > SSI > USI > ENSI. The disparity of the economic sustainability of cities is larger than that of the other two dimensions and the overall sustainability.
According to Figure 3, it can be seen that there are considerable differences of social sustainable development level among cities in the study region. Cities in the eastern coastal areas of China are at a relatively good level of social sustainable development (areas with blue color), such as cities in Zhejiang, Shandong, Fujian and Guangdong province, while cities in central and west China are at a disadvantage (areas with red color), covering much of the study region.
The evaluation results of SSI, ECSI, ENSI and USI can be divided into six grades using the average value μ and the standard deviation σ. Specifically, from Level 1 to Level 6 (from the best to the worst levels), the thresholds of evaluation results are, respectively, μ + σ, μ + 0.5 × σ, μ, μ − 0.5 × σ and μ − σ. Specifically, from Table 3, the total number of cities at Levels 1–3 is 117, whereas 10.45% of cities are at the worst position, including cities in Gansu, Yunnan, Guizhou, Sichuan, Heilongjiang, etc.
The results of economic sustainable development show that 42 cities (14.63%) rank in Level 1, which means that those cities have the best performance of economic sustainability in China. The grade map illustrates the significant difference of economic sustainable development of cities in the east and west of China (Figure 4). Cities with the highest scores of ECSI are mainly concentrated in eastern coastal areas. On the contrary, cities in the central, western and northeastern regions are at a disadvantage in economic sustainable development. According to Table 4, it can be found that 179 cities (62.37%) ranking in 4–6 levels are in an unfavorable position, while 42 cities are at the first level of economic sustainable development. Due to the different resource endowments, location, economic infrastructure and industrial system, there are obvious regional differences. With the reform and opening-up policy and economic globalization, cities in eastern coastal areas with rapidly increasing number of companies have accumulated a large amount of capital, providing adequate funds to economically develop rapidly and healthily.
As shown in Figure 5, cities in southern China have a better performance in environmental sustainability than the northern cities, and cities in the east of China have better environmental sustainable levels than those in the west. Specifically, cities with relatively poor environmental sustainable development are mainly located in Heilongjiang, Jilin, Gansu, Shaanxi, Shanxi, and Yunnan Provinces, while cities in Shandong, Zhejiang and Jiangsu Provinces have better environmental sustainable conditions. In Table 5, the total number of cities ranking in Levels 1–3 is 167, while 54 cities (18.82%) are at the lowest level of environmental sustainable development. Compared with grading results of SSI and ECSI, it is worth noting that more cities are at Level 6 of ENSI and in the worst position of environmental sustainable development. Owing to geographical differences, different regions have correspondingly different natural geographical features, including climate, hydrology, topography, vegetation cover, and resource distribution. At the same time, because of the impact of human activities (different industrial and agricultural productions, and different industrial structure), cities in different regions have environmental differences.
The coordination degree of urban sustainable development can reflect the development coordination level and associated efficiency among society, economy and environment. Based on Equation (14), the coordination degrees of evaluation results of three sub-indices in study region have been calculated. Poor coordination means inconsistency among SSI, ECSI and ENSI, while cities with high coordination degrees are at a stage of synchronous development of society, economy and environment. However, it is worth noting that a high coordination degree of a city does not necessarily mean that it is at a high level of sustainable development, as it could still have greater potential for further sustainable development. According to Table 6, coordination degrees of 152 cities are below the average value, which reveals that the coordination of social, economic and environmental sustainable development in most cities in the study region is poor. Moreover, from the grade map of coordination degree (Figure 6), cities with the highest coordination degrees show dispersed distribution, and include most cities in Zhejiang Province, as well as some cities in Shandong, Guangdong, Hubei, Liaoning, Inner Mongolia, Guangxi, Yunnan and Gansu Provinces.

4.1.2. Analysis of Three Sub-Indices for Urban Agglomerations

Statistical results of three sub-indices for urban agglomerations are shown in the following three radar charts. In Figure 7, it can be seen that the Pearl River Delta is the urban agglomeration with the highest level of social sustainable development, followed by Hu-Bao-E-Yu and Shandong Peninsula, and Qianzhong is the one with the lowest grade. Through further analysis of CV, when compared with Pearl River Delta and Hu-Bao-E-Yu, both the range and CV values of Shandong Peninsula are smaller, which reveals that the social sustainable development level of each city in Shandong Peninsula is nearly equal and relatively better. On the contrary, because Chengdu-Chongqing and Lanzhou-Xining have low and very similar scores of mean values, more cities in Chengdu-Chongqing, which is an urban agglomeration with a higher CV value, are at relatively lower level of social sustainable development.
As shown in Figure 8, the top three urban agglomerations in terms of economic sustainable development level are Hu-Bao-E-Yu, Shandong Peninsula and the Pearl River Delta, while Chengdu-Chongqing, Lanzhou-Xining and Qianzhong are listed as the bottom three. Although mean values of evaluation of SSI and ECSI are different, the relative levels of social and economic sustainable development among 17 urban agglomerations are similar, which can be seen from the analogous curves of mean values in Figure 7 and Figure 8, showing the close relationship between social development and economic development. The CV values of evaluation results of ECSI are between 0.1 and 0.4, indicating that all of the urban agglomerations show moderate variability of ECSI. Along with the increase of CV value, the disequilibrium of economic development condition is evident.
Figure 9 shows the statistical results of ENSI in each urban agglomeration. Shandong Peninsula, the Pearl River Delta and the Yangtze River Delta are in the first three places with respect to environmental sustainability, while the last three urban agglomerations are Dianzhong, Beibu Gulf and Lanzhou-Xining. According to mean values of ENSI, it can be seen that a majority of urban agglomerations are at Levels 1–3, in which Shandong Peninsula is the only urban agglomeration at the first level of environmental sustainability in China (the grading rank seen in Table 5). Furthermore, the CV values of ENSI are between 0.05 and 0.22, significantly lower than those of SSI and ECSI, which indicates that the disparities of environmental sustainable development among cities in urban agglomerations are smaller than those of society and economy.

4.2. Analysis of Comprehensive Evaluation of USI

4.2.1. Analysis of Comprehensive Evaluation of USI for Cities

In Figure 10, the overall changing trend is a shift of urban sustainable development level from being the best in the eastern region to being the worst in the western region. According to Table 7, 117 cities rank among Levels 1–3 of urban sustainable development, which are mainly located in the eastern coastal areas of China. These cities ranking in Level 1 seen from the grade map, such as Shenzhen, Ordos, Hangzhou, Wuxi, Zhuhai, Guangzhou, Daqing, Suzhou, Ningbo, and Dongying, are at relatively good level of USI in China. However, 42 cities (14.63%) with the worst grade (Level 6) of USI are mostly located in the less developed areas of China, whose social and economic sustainability are bad (Figure 3 and Figure 4), and environmental sustainable conditions are also poor (Figure 5). Due to natural geographic location and economic geographic location, cities in the eastern coastal areas of China have earlier opening and more opportunities for development, and attract more investment than the western and central regions. As mentioned previously, economic sustainable development serve as the guarantee of social sustainable development, and also provides financial support to environmental protection. Therefore, cites in the eastern coastal regions have good conditions and advantages for development.

4.2.2. Analysis of Comprehensive Evaluation of USI for Urban Agglomerations

Figure 11 shows statistical results of USI for urban agglomerations. As can be seen in this figure, mean values of evaluation results of USI are higher than 0.5 in the Pearl River Delta, Hu-Bao-E-Yu, Shandong Peninsula and the Yangtze River Delta. Those urban agglomerations have relatively better performance of urban sustainable development. Beibu Gulf, Chengdu-Chongqing, Qianzhong and Lanzhou-Xining, with mean values lower than 0.4, are the worst, suggesting that the overall sustainable development levels of those four urban agglomerations are at a disadvantage compared with other urban agglomerations. In addition, the result that the CV value of Central Plains and Shandong Peninsula is below 0.1 implies that cities in this urban agglomeration show weak variability, while the CV value of Hachang is the maximum one, which accordingly indicates that cities in Hachang have bigger disparities of sustainable development than other urban agglomerations. An urban agglomeration is made up of a number of cities, and thus development of these cities is the basis of construction of the urban agglomeration. Because the gap of economic development among cities in the eastern, central and western regions of China has long existed, development of urban agglomerations based on inner cities’ conditions inevitably shows unbalanced patterns. The mutual and close connection of advantageous location, traffic conditions and information channels in eastern regions has a prominent influence on regional economic development, making the cost of the regions’ economic activity relatively low and easier to attract a variety of elements of capital. Therefore, the economic development level in the eastern regions is relatively high. On the contrary, the vast central and western regions, especially the latter, have traffic inconvenience and harsh natural conditions (water resources deficiency, serious soil erosion, resource starvation, etc.). Thus, the central and western regions have low production capacity of land, and their industrial and agricultural development has been severely constrained, in which regional economic development is relatively backward.

4.2.3. Analysis of Comprehensive Evaluation of USI for Economic Regions

To scientifically reflect the status of social and economic development in different parts of China, and provide support for establishing regional development policy, four economic regions are created: East, Central, West and Northeast. According to Table 8, based on mean values of synthetic evaluation results of USI in four economic regions, the rank of sustainable development level is East > Central > Northeast > West. The mean values are generally lower than 0.5, except for East, which scores 0.5152. This implies the low level of sustainable development in these four economic regions. The range value of West is the biggest, East and Northeast follow, while that of Central is the smallest. Further analysis of CV values of these four economic regions, it can be seen that the Central economic region shows weaker variability of sustainable development compared with other three regions. Moreover, all CV values are higher than 0.1 and lower than 1.0, which implies that all economic regions show moderate variability among cities.

4.3. Spatial Clustering Analysis

Local Indicators of Spatial Association (LISA) for each observation provide an indication of the extent of significant spatial clustering of similar values around the observation [57]. Identified areas of positive local autocorrelation (High–High and Low–Low) by LISA analysis are generally located in the areas with a high value surrounded by high values or a low value surrounded by low values. In contrast, areas with negative local autocorrelation (High–Low and Low–High) highlight spatial discontinuities, which tend to be located at the edges of the positive clusters.
LISA cluster maps of SI, ECSI, ENSI and USI are shown in Figure 12, Figure 13, Figure 14 and Figure 15, respectively, and spatial clusters can be found in all four maps. Specifically, in Figure 12, three “High–High” clusters of social sustainable development have been detected, namely local areas in the Yangtze River Delta, Shandong peninsula and the Pearl River Delta, while “Low–Low” clusters are mostly located in western China, only a minor portion in the northeast areas. In Figure 13, several similar clusters between economic and social sustainability have been detected. Besides those generally overlapped clustering areas, other “High–High” clusters of economic sustainable development are found in Beijing-Tianjin-Hebei and Inner Mongolia. However, “Low–Low” clusters of economic sustainability are different from that of social sustainability, which are located in Gansu, Sichuan, Heilongjiang, Yunnan, Guizhou and Hunan province. According to Figure 14, the “High–High” clustering areas of environmental sustainable development expand to Shandong, Anhui, Jiangsu, Zhejiang and Shanghai, generally located in the eastern coastal areas. The “Low–Low” clusters gather in most areas of Gansu and Guangxi Provinces, and local areas of Inner Mongolia, Guizhou and Yunnan Provinces.
As demonstrated in Figure 15, the LISA cluster map of comprehensive evaluation of USI reflects the aggregating status of urban sustainable development. Four distinct “High–High” clusters of comprehensive evaluation results have been detected, separately located in Shandong Peninsula, the Yangtze River Delta, the Pearl River Delta and West Taiwan Strait, while the “Low–Low” clusters are mainly distributed in western and northeastern regions of China, such as Gansu, Guizhou, Sichuan, Heilongjiang, Guangxi and Yunnan Provinces. Except for those clusters above, few “High–Low” and “Low–High” clusters can be found, mostly near “High–High” and “Low–Low” clusters. The “Low–High” clusters near the “High–High” areas have strong development potential, while “High–Low” clusters close to the “Low–Low” areas can become the driving force for the development of the local regions.
Based on the results of spatial clustering analysis above, it is revealed that cities in the central regions show weak spatial autocorrelation, which means that spatial pattern of sustainable development level among cities in this region tends to randomly distribute. However, especially in the eastern coastal regions in China, such as Shandong Peninsula, the Yangtze River Delta and the Pearl River Delta, urban sustainable development presents positive spatial autocorrelation, indicating that a strong promoting influence on the surrounding cities from the core cities in those clusters. Meanwhile, in western regions, where urban development is relatively backward, urban sustainable development also presents positive spatial autocorrelation.

5. Conclusions and Suggestions

In this paper, an index system for urban sustainable development is proposed, which is established by 23 indicators from the three aspects society, economy and environment. The TOPSIS-Entropy method is used in the evaluation of 287 cities at prefecture level and above in China. The results can be summarized as follows:
(1)
The 287 cities at prefecture level and above in China studied in this paper present the phenomenon of spatial clustering not only in terms of comprehensive evaluation (USI), but also in regard to three sub-indices (SSI, ECSI and ENSI). Specifically, the “High–High” clustering areas can be found in the eastern coastal regions, while the “Low–Low” clusters are mainly distributed in the western regions. These clusters are the areas that are more correlated or associated than other non-aggregated areas. Moreover, according to spatial distribution of urban agglomerations in China, it can be seen that these “High–High” clusters are located in certain urban agglomerations. Cities in these “High–High” clusters with relatively high level of sustainable development can fully share resources, optimize industrial structure, and then utilize their respective advantages to promote the level of sustainable development. This implies that cities in a cluster generally have close relationship and mutual influence on sustainable development. The core cities in an urban cluster can promote the sustainable development of the surrounding cities.
(2)
At regional scale, construction of urban agglomeration can effectively gather urban resources, enhance mutual learning, promote coordinated and rapid development, and narrow development gap among cities. From this study, the Pearl River Delta, Hu-Bao-E-Yu, Shandong Peninsula and the Yangtze River Delta are the urban agglomerations with relatively better performance of urban sustainable development, while Beibu Gulf, Chengdu-Chongqing, Qianzhong and Lanzhou-Xining are at the lower level. From the perspective of economic regional development, although the level of sustainable development in all four economic regions is at a low level, USI disparity still exists. The central economic region shows weaker variability of sustainable development compared with other three regions.
(3)
At urban scale, the overall level of urban sustainable development in China is not high, and noticeable disparities in urban sustainable development among cities exist. According to the grading results, nearly 60% of cities have relatively low scores of USI, while the percentage of cities at the best level is only 17.77%. In terms of spatial distribution, cities with the high level of USI are mainly located in the eastern coastal areas, while cities in the underdeveloped regions are at relatively low level of sustainable development. With respect to the three sub-indices, the coordination of social, economic and environmental sustainable development in China is also at a low level. The majority of cities’ coordination degrees of sustainable development in study region are below the average value. In terms of spatial distribution of grading results, there are similarities among SSI, ECSI and ENSI. Cities from eastern coastal China are at relatively higher level of sustainable development while central and northeastern cities come second and western ones last.
Given the disparity and numerous problems existing in urban sustainable development, taking the road of sustainable development is an inevitable choice for China, in front of whom there is still a long way to go to achieve this goal. Therefore, based on our study, some suggestions regarding urban sustainable development in China are provided.
(1)
Balance sustainable development of society, economy and environment should be advanced. Economic development should not depend on excessive resource consumption; meanwhile, environmental sustainable development should be considered more important. The coordinated development of society, economy and environment can promote urban sustainable development. From this study, cities with the high level of urban sustainable development generally have high coordination degrees of three sub-indices, which can confirm the necessity of balanced development.
(2)
The government should take effective measures to reduce the development disparity between the West and the East to ensure the balanced development of the whole China. In this study, the noticeable differences of sustainable development between the West and other regions are found, in terms of social, economic and environmental indices as well as the overall situation. Compared with other regions, the disparity among the western cities is more distinct. As for the reasons, the long-term national development policies for different regions in China can account for the regional disparity and the diverging levels of sustainability in various urban agglomerations. In order to realize coordinated development of eastern, central and western regions, the preferential policies for less developed areas, such as the “West Development Strategy”, “Revitalizing the Finance in the Northeast Old Industrial Base” and the “Rise of Central China”, can provide more state support and help these areas to gradually alleviate development differences with the eastern region.
(3)
The spatial clustering analysis should be used to help the government find aggregated regions with high or low levels of sustainable development. In the high-level clustering regions, the synchronous development of surrounding cities should be supported by the core cities of these clusters. At the same time, each city should find its own position in promoting its own development to effectively promote the construction of this cluster. In contrast, the clustering regions with the low level lack a strong driving force of development. The government should provide these regions more policy and financial supports with emphasis.
(4)
Accelerating the transformation of the mode of urban development by construction of a new type of urbanization should be emphasized. The new type of urbanization particularly emphasizes the interaction of urbanization, industrialization, informationization, agricultural modernization, and the integrated and coordinated development of urban and rural areas.
(5)
Exploring effective evaluation methods and feedback mechanisms for urban sustainable development should be supported. On the one hand, evaluation methods may qualitatively or quantitatively reflect the level of sustainable development, while, on the other hand, feedback mechanisms could help the government find the problems hindering urban sustainable development

Acknowledgments

This research was funded by Guangzhou science and technology project (201604020070), innovative project of Wuhan University (2042016kf0179 and 2042016kf1019) and special funds project on public welfare industry research of Surveying and mapping geographic information (201512027). We give sincere thanks to Jie Shan, Yajie Shang, and Yabo Shang and the anonymous reviewers for their valuable suggestions, who provided great help in improving our manuscript.

Author Contributions

Lin Ding and Zhenfeng Shao conceived and designed the experiments; Lin Ding performed the experiments; Cong Xu and Hanchao Zhang analyzed the data; Dewen Wu contributed analysis tools; and Lin Ding wrote the paper.

Conflicts of Interest

The authors declare no conflict of interest.

Appendix A

Table A1. Index system for urban sustainable development (USI).
IndicatorsUnitData Source
SO1 a Per capita disposable income of urban residentsYuanCSYRE
SO2 b Urban–rural income ratio%CSYRE *
SO3 a Density of populationPerson/km2CCSY
SO4 a Per capita housing aream2CUCSY
SO5 a Water coverage%CUCSY
SO6 b Teacher–student ratio in middle school%CCSY
SO7 a Unemployment rate%CCSY *
SO8 b Number of health workers per 10,000 personsPersonCCSY
SO9 a Number of buses per 10,000 personsVehicleCCSY
SO10 a Urban road area per capitam2CCSY
EC1 a GDP per capitaYuanCCSY
EC2 b Total retail sales of consumer goods per capitaYuanCCSY
EC3 a Proportion of GDP contributed by tertiary industry%CCSY
EC4 b Electricity consumption of per 10,000 output valueKWhCUCSY
EC5 b Water consumption of per 10,000 output valueTonCUCSY
EC6 b Proportion of funds expenditure on education, science and technology%CCSY *
EN1 b Industrial sulfur dioxide emissions per 10,000 output valueTonCCSY
EN2 b Industrial waste water emissions per 10,000 output valueTen thousand tonsCCSY
EN3 a Ratio of industrial solid wastes comprehensively utilized%CCSY *
EN4 a Disposal rate of living garbage harmless%CCSY *
EN5 a Ratio of waste water centralized treated%CCSY
EN6 a Days of air quality equal to or above grade II (API < 100)DayCCSY *
EN7 a Green coverage rate of built district%CUCSY
Note: a data for these indicators can be directly obtained; b data for these indicators need to be calculated; CUCSY, “China Urban Construction Statistical Yearbook, 2012” [47]; CCSY, “China City Statistical Yearbook, 2013” [48]; CSYRE, “China Statistical Yearbook for Regional Economy, 2013” [49]; * need data supplement from 2012 statistical bulletin of certain city whose data is missing in corresponding statistical yearbook.

References

  1. WCED. Our Common Future; Oxford University Press: New York, NY, USA, 1987. [Google Scholar]
  2. Singh, R.K.; Murty, H.R.; Gupta, S.K.; Dikshit, A.K. An overview of sustainability assessment methodologies. Ecol. Indic. 2012, 15, 281–299. [Google Scholar]
  3. Commission on Sustainable Development. Indicators of Sustainable Development: Guidelines and Methodologies; United Nations Department of Economic and Social Affairs: New York, NY, USA, 2001. [Google Scholar]
  4. Organization for Economic Co-Operation and Development (OECD). OECD Environmental Indicators: Towards Sustainable Development; OECD: Paris, France, 2001. [Google Scholar]
  5. Global Reporting Initiative (GRI). Sustainability Reporting Guidelines; Global Reporting Initiative: Amsterdam, The Netherlands, 2002. [Google Scholar]
  6. World Bank. Global City Indicator Programme Report; World Bank: Washington, DC, USA, 2008. [Google Scholar]
  7. European Commission. Towards Environmental Pressure Indicators for the EU; Office for Official Publications of the European Communities: Luxembourg City, Luxembourg, 1999. [Google Scholar]
  8. A European Thematic Network on Construction and City Related Sustainability Indicators. Available online: http://cic.vtt.fi/eco/crisp/Greece-2.pdf (accessed on 1 April 2001).
  9. Grzebyk, M.; Stec, M. Sustainable development in EU countries: Concept and rating of levels of development. Sustain. Dev. 2015, 23, 110–123. [Google Scholar]
  10. Bolcárová, P.; Kološta, S. Assessment of sustainable development in the EU 27 using aggregated SD index. Ecol. Indic. 2015, 48, 699–705. [Google Scholar]
  11. Department of the Environment of United Kingdom. Indicators of Sustainable Development for the United Kingdom; HMSO: London, UK, 1994.
  12. Chua, L.H. The Singapore Green Plan 2012; Ministry of the Environment and Water Resource: Singapore, 2002. [Google Scholar]
  13. Ministry of Science and Technology (MOST). The Management Method of National Sustainable Development Experimental Zone. Available online: http://www.most.gov.cn/fggw/zfwj/zfwj2001/200512/t20051214_55012.htm (accessed on 11 June 2001).
  14. Ministry of Environmental Protection of the People’s Republic of China (MEP). Building Indicators for Ecological County, City and Province. Available online: http://www.most.gov.cn/fggw/zfwj/zfwj2002/zf02wj/zf02bfw/200312/t20031209_31488.htm (accessed on 25 December 2012).
  15. National Development and Reform Commission (NDRC). The Main Thinking of the 12th Five-Year Plan for National Economic and Social Development; People’s Publishing House: Beijing, China, 2009.
  16. National Development and Reform Commission (NDRC). National and Regional Outline of the Twelfth Five-Year Plan for Economic and Social Development; People’s Publishing House: Beijing, China, 2011.
  17. China City Development Academy (CCDA). 2010 Comprehensive Evaluation Report of Chinese Urban Scientific Development; Press of Social Science: Beijing, China, 2010. [Google Scholar]
  18. Institute of Urban Environment (IUE). Report of China’s Sustainable Urban Development in 2010; Press of Social Science: Beijing, China, 2010. [Google Scholar]
  19. Zhou, D.; Xu, J.; Wang, L.; Lin, Z. Assessing urbanization quality using structure and function analyses: A case study of the urban agglomeration around Hangzhou Bay (UAHB), China. Habitat Int. 2015, 49, 165–176. [Google Scholar] [CrossRef]
  20. Bai, X.; Shi, P.; Liu, Y. Realizing China’s urban dream. Nature 2014, 509, 158–160. [Google Scholar] [CrossRef] [PubMed]
  21. Cao, S.; Lv, Y.; Zheng, H.; Wang, X. Challenges facing China’s unbalanced urbanization strategy. Land Use Policy 2014, 39, 412–415. [Google Scholar] [CrossRef]
  22. Chen, M.; Huang, Y.; Tang, Z.; Lu, D.; Liu, H.; Ma, L. The provincial pattern of the relationship between urbanization and economic development in China. J. Geogr. Sci. 2014, 24, 33–45. [Google Scholar] [CrossRef]
  23. Chen, M.; Liu, W.; Tao, X. Evolution and assessment on China’s urbanization 1960–2010: Under-urbanization or over-urbanization? Habitat Int. 2013, 38, 25–33. [Google Scholar] [CrossRef]
  24. Goncalves, R.M.; da Pacheco, A.P.; Xavier Tanajura, E.L.; da Silva, L.M. Costal urbanization and shading in Boa Viagem Beach, Recife-PE, Brazil. Rev. Geogr. Norte Gd. 2013. [Google Scholar] [CrossRef]
  25. Chen, X.; Liu, X.; Hu, D. Assessment of sustainable development: A case study of Wuhan as a pilot city in China. Ecol. Indic. 2015, 50, 206–214. [Google Scholar] [CrossRef]
  26. Li, F.; Liu, X.; Hu, D.; Wang, R.; Yang, W.; Li, D.; Zhao, D. Measurement indicators and an evaluation approach for assessing urban sustainable development: A case study for China’s Jining City. Landsc. Urban Plan. 2009, 90, 134–142. [Google Scholar] [CrossRef]
  27. Moussiopoulos, N.; Achillas, C.; Vlachokostas, C.; Spyridi, D.; Nikolaou, K. Environmental, social and economic information management for the evaluation of sustainability in urban areas: A system of indicators for Thessaloniki, Greece. Cities 2010, 27, 377–384. [Google Scholar] [CrossRef]
  28. Musakwa, W.; van Niekerk, A. Monitoring sustainable urban development using built-up area indicators: A case study of Stellenbosch, South Africa. Environ. Dev. Sustain. 2015, 17, 547–566. [Google Scholar] [CrossRef] [Green Version]
  29. Zhao, J.; Chai, L. A novel approach for urbanization level evaluation based on information entropy principle: A case of Beijing. Phys. A Stat. Mech. Appl. 2015, 430, 115–125. [Google Scholar] [CrossRef]
  30. Shen, L.; Zhou, J.; Skitmore, M.; Xia, B. Application of a hybrid Entropy-McKinsey Matrix method in evaluating sustainable urbanization: A China case study. Cities 2015, 42, 186–194. [Google Scholar] [CrossRef]
  31. Wang, Q.; Yuan, X.; Zhang, J.; Gao, Y.; Hong, J.; Zuo, J.; Liu, W. Assessment of the sustainable development capacity with the entropy weight coefficient method. Sustainability 2015, 7, 13542–13563. [Google Scholar] [CrossRef]
  32. Yin, K.; Wang, R.; An, Q.; Yao, L.; Liang, J. Using eco-efficiency as an indicator for sustainable urban development: A case study of Chinese provincial capital cities. Ecol. Indic. 2014, 36, 665–671. [Google Scholar] [CrossRef]
  33. Shen, L.Y.; Ochoa, J.J.; Shah, M.N.; Zhang, X. The application of urban sustainability indicators—A comparison between various practices. Habitat Int. 2011, 35, 17–29. [Google Scholar] [CrossRef]
  34. Zhan, S.F.; Zhang, X.C.; Ma, C.; Chen, W.P. Dynamic modelling for ecological and economic sustainability in a rapid urbanizing region. Procedia Environ. Sci. 2012, 13, 242–251. [Google Scholar] [CrossRef]
  35. Wang, Q.; Yuan, X.; Cheng, X.; Mu, R.; Zuo, J. Coordinated development of energy, economy and environment subsystems—A case study. Ecol. Indic. 2014, 46, 514–523. [Google Scholar] [CrossRef]
  36. Xu, C.; Wang, S.; Zhou, Y.; Wang, L.; Liu, W. A comprehensive quantitative evaluation of new sustainable urbanization level in 20 Chinese urban agglomerations. Sustainability 2016, 8, 91. [Google Scholar] [CrossRef]
  37. Tan, F.; Lu, Z. Assessing regional sustainable development through an integration of nonlinear principal component analysis and Gram Schmidt orthogonalization. Ecol. Indic. 2016, 63, 71–81. [Google Scholar] [CrossRef]
  38. Wursthorn, S.; Poganietz, W.R.; Schebek, L. Economic-environmental monitoring indicators for European countries: A disaggregated sector-based approach for monitoring eco-efficiency. Ecol. Econ. 2011, 70, 487–496. [Google Scholar] [CrossRef]
  39. Shi, Y.; Zhou, C.; Wang, R.; Xu, W. Measuring China’s regional ecological development through “ecoDP”. Ecol. Indic. 2012, 15, 253–262. [Google Scholar] [CrossRef]
  40. Krajnc, D.; Glavič, P. A model for integrated assessment of sustainable development. Resour. Conserv. Recycl. 2005, 43, 189–208. [Google Scholar] [CrossRef]
  41. Reza, B.; Sadiq, R.; Hewage, K. Sustainability assessment of flooring systems in the city of Tehran: An AHP-based life cycle analysis. Constr. Build. Mater. 2011, 25, 2053–2066. [Google Scholar] [CrossRef]
  42. Veisi, H.; Liaghati, H.; Alipour, A. Developing an ethics-based approach to indicators of sustainable agriculture using analytic hierarchy process (AHP). Ecol. Indic. 2016, 60, 644–654. [Google Scholar] [CrossRef]
  43. García-Melón, M.; Gómez-Navarro, T.; Acuña-Dutra, S. A combined ANP-delphi approach to evaluate sustainable tourism. Environ. Impact Assess. Rev. 2012, 34, 41–50. [Google Scholar] [CrossRef]
  44. Lee, T.H. Influence analysis of community resident support for sustainable tourism development. Tour Manag. 2013, 34, 37–46. [Google Scholar] [CrossRef]
  45. Zhang, J.X.; Li, W.S.; Zhai, L. Understanding geographical conditions monitoring: A perspective from China. Int. J. Digit. Earth 2015, 8, 36–55. [Google Scholar] [CrossRef]
  46. China Statistical Yearbooks Database. Available online: http://tongji.cnki.net/kns55/index.aspx (accessed on 23 November 2011).
  47. Ministry of Housing and Urban-Rural Development of the People’s Republic of China. China Urban Construction Statistical Yearbook; China Planning Press: Beijing, China, 2013.
  48. Department of Urban Surveys of National Bureau of Statistics. China City Statistical Yearbook; China Statistics Press: Beijing, China, 2013.
  49. Department of Comprehensive Statistics of National Bureau of Statistics. China Statistical Yearbook for Regional Economy; China Statistics Press: Beijing, China, 2013.
  50. Jha, R.; Singh, V.P. Evaluation of riverwater quality by entropy. KSCE J. Civ. Eng. 2008, 12, 61–69. [Google Scholar] [CrossRef]
  51. Hwang, C.L.; Yoon, K. Multiple Attribute Decision Making: Methods and Applications a State-of-the-Art Survey; Springer Science & Business Media: Medford, MA, USA, 2012; Volume 186. [Google Scholar]
  52. Li, Y.; Zhao, L.; Suo, J. Comprehensive assessment on sustainable development of highway transportation capacity based on entropy weight and TOPSIS. Sustainability 2014, 6, 4685–4693. [Google Scholar] [CrossRef]
  53. Huang, J. Combining entropy weight and TOPSIS method for information system selection. In Proceedings of the 2008 IEEE Conference on Cybernetics and Intelligent Systems, Chengdu, China, 21–24 September 2008; pp. 1965–1968.
  54. Wang, Y.M.; Elhag, T.M.S. Fuzzy TOPSIS method based on alpha level sets with an application to bridge risk assessment. Expert Syst. Appl. 2006, 31, 309–319. [Google Scholar] [CrossRef]
  55. Torlak, G.; Sevkli, M.; Sanal, M.; Zaim, S. Analyzing business competition by using fuzzy TOPSIS method: An example of Turkish domestic airline industry. Expert Syst. Appl. 2011, 38, 3396–3406. [Google Scholar] [CrossRef]
  56. Sun, C.C.; Lin, G.T.R. Using fuzzy TOPSIS method for evaluating the competitive advantages of shopping websites. Expert Syst. Appl. 2009, 36, 11764–11771. [Google Scholar] [CrossRef]
  57. Anselin, L. Local indicators of spatial association—LISA. Geogr. Anal. 1995, 27, 93–115. [Google Scholar] [CrossRef]
Figure 1. Spatial distribution of cities in China studied for urban sustainable development.
Sustainability 08 00746 g001
Figure 2. Statistical results of sustainable development of the three sub-indices and USI for cities.
Sustainability 08 00746 g002
Figure 3. Grade map of evaluation results of SSI for cities.
Sustainability 08 00746 g003
Figure 4. Grade map of evaluation results of ECSI for cities.
Sustainability 08 00746 g004
Figure 5. Grade map of evaluation results of ENSI for cities.
Sustainability 08 00746 g005
Figure 6. Grade map of coordination degree of three sub-indices for cities.
Sustainability 08 00746 g006
Figure 7. Statistical results of social sustainable development for urban agglomerations.
Sustainability 08 00746 g007
Figure 8. Statistical results of economic sustainable development for urban agglomerations.
Sustainability 08 00746 g008
Figure 9. Statistical results of environmental sustainable development for urban agglomerations.
Sustainability 08 00746 g009
Figure 10. Grade map of comprehensive evaluation on sustainable development for cities.
Sustainability 08 00746 g010
Figure 11. Statistical results of comprehensive evaluation on sustainable development for urban agglomerations.
Sustainability 08 00746 g011
Figure 12. LISA (Local Indicators of Spatial Association) cluster map of evaluation values of social sustainable development.
Sustainability 08 00746 g012
Figure 13. LISA cluster map of evaluation values of economic sustainable development.
Sustainability 08 00746 g013
Figure 14. LISA cluster map of evaluation values of environmental sustainable development.
Sustainability 08 00746 g014
Figure 15. LISA cluster map of comprehensive evaluation results of urban sustainable development.
Sustainability 08 00746 g015
Table 1. Studies of urban sustainable development at different scales.
Study Scale/RegionLiteratures
Local/urbanLi et al. [26], Moussiopoulos et al. [27], Yin et al. [32], Musakwa W. et al. [28], Zhao et al. [29], Shen et al. [30], Chen et al. [25], Wang et al. [31]
RegionalShen et al. [33], Zhan et al. [34], Wang et al. [35], Zhou et al. [19], Xu et al. [36], Tan et al. [37]
Nationalthe United States [30], Wursthorn et al. [38], Shi et al. [39], Grzebyk et al. [9], Bolcárová et al. [10]
InternationalUNCSD [3], UNEP [5], the Word Bank [6], European Commission [7,8]
Table 2. Index system for urban sustainable development (USI).
Sub-IndicesIndicatorsReferences
Social sustainable indices (SSI)SO1 Per capita disposable income of urban residents[13,14,15,16,17,25,30,31,37]
SO2 Urban–rural income ratio[29,30,36,37]
SO3 Density of population[25,29,30]
SO4 Per capita housing area[17,29,30,36,37]
SO5 Water coverage[36]
SO6 Teacher–student ratio in middle school[31] *
SO7 Unemployment rate[13,15,17,29,30,36,37]
SO8 Number of health workers per 10,000 persons[13,30]
SO9 Number of buses per 10,000 persons[16,17,29,30,36]
SO10 Urban road area per capita[17,29,30,31]
Economic sustainable indices (ECSI)EC1 GDP per capita[13,14,15,17,18,25,29,30,31,36,37]
EC2 Total retail sales of consumer goods per capita[36,37]
EC3 Proportion of GDP contributed by tertiary industry[13,14,15,16,17,18,25,30,31,37]
EC4 Electricity consumption of per 10,000 output value[13,14,15,16,25,30,36,37]
EC5 Water consumption of per 10,000 output value[13,14,15,16,18,25,30,36]
EC6 Proportion of funds expenditure on education, science and technology[13,15,16,17,18,30,31,36]
Environmental sustainable indices (ENSI)EN1 Industrial sulfur dioxide emissions per 10,000 output value[13,15,16,17,18,25,30,31]
EN2 Industrial waste water emissions per 10,000 output value[30,31] *
EN3 Ratio of industrial solid wastes comprehensively utilized[13,14,16,17,18,30,31,36,37]
EN4 Disposal rate of living garbage harmless[25,29,30,31,37]
EN5 Ratio of waste water centralized treated[13,14,15,16,18,30,31,36,37]
EN6 Days of air quality equal to or above grade II (API < 100)[15,25,29,30]
EN7 Green coverage rate of built district[25,29,30,31,36]
Note: * represents a similar indicator.
Table 3. Grading results of SSI for cities.
RankRangeNumber of CitiesPercentage of Cities/%
Level 1>0.43355017.42
Level 20.3852–0.4335227.67
Level 30.3368–0.38514515.68
Level 40.2885–0.33676924.04
Level 50.2402–0.28847124.74
Level 60–0.24013010.45
Table 4. Grading results of ECSI for cities.
RankRangeNumber of CitiesPercentage of Cities/%
Level 1>0.40414214.63
Level 20.3438–0.4040248.36
Level 30.2835–0.34374214.63
Level 40.2233–0.28347325.44
Level 50.1630–0.22327927.53
Level 60–0.1629279.41
Table 5. Grading results of ENSI for cities.
RankRangeNumber of CitiesPercentage of Cities/%
Level 1>0.82653512.20
Level 20.7722–0.82647526.13
Level 30.7180–0.77215719.86
Level 40.6638–0.71794314.98
Level 50.6096–0.6637238.01
Level 60–0.60955418.82
Table 6. Grading results of coordination degree of sustainable development for cities.
RankRangeNumber of CitiesPercentage of Cities/%
Level 1>0.68885017.42
Level 20.6159–0.68873411.85
Level 30.5430–0.61585117.77
Level 40.4701–0.54295318.47
Level 50.3971–0.47006020.91
Level 60–0.39703913.59
Table 7. Grading results of comprehensive evaluation on urban sustainable development.
RankRangeNumber of CitiesPercentage of Cities/%
Level 1>0.52885117.77
Level 20.4840–0.5287238.01
Level 30.4391–0.48394314.98
Level 40.3942–0.43908027.87
Level 50.3493–0.3941.4816.72
Level 60–0.34924214.63
Table 8. Grading results of comprehensive evaluation of USI for economic regions.
Economic RegionMeanRangeCV 1
Central0.42430.28770.1260
West0.38800.40650.2063
East0.51520.36690.1557
Northeast0.40590.34220.1935
1 CV, coefficient of variation, a value of 0.1 indicates weak variability, 0.1–1.0 indicates moderate variability, >1 indicates strong variability. Range, Maximum−Minimum.

