Article

Comparative Advantage of Maize- and Grass-Silage Based Feedstock for Biogas Production with Respect to Greenhouse Gas Mitigation

1
Leibniz-Institute for Agricultural Engineering Potsdam-Bornim, Max-Eyth-Allee 100, 14469 Potsdam, Germany
2
Faculty of Life Sciences, Albrecht Daniel Thaer-Institute of Agricultural and Horticultural Sciences, Humboldt-University of Berlin, Hinter der Reinhardtstr. 8-18, 10115 Berlin, Germany
*
Author to whom correspondence should be addressed.
Sustainability 2016, 8(7), 617; https://doi.org/10.3390/su8070617
Submission received: 19 May 2016 / Revised: 23 June 2016 / Accepted: 24 June 2016 / Published: 30 June 2016
(This article belongs to the Special Issue Biomass Energy Conversion)

Abstract

:
This paper analyses the comparative advantage of using silage maize or grass as feedstock for anaerobic digestion to biogas from a greenhouse gas (GHG) mitigation point of view, taking into account site-specific yield potentials, management options, and land-use change effects. GHG emissions due to the production of biogas were calculated using a life-cycle assessment approach for three different site conditions with specific yield potentials and adjusted management options. While for the use of silage maize, GHG emissions per energy unit were the same for different yield potentials, and the emissions varied substantially for different grassland systems. Without land-use change effects, silage maize-based biogas had lower GHG emissions per energy unit compared to grass-based biogas. Taking land-use change into account, results in a comparative advantage of biogas production from grass-based feedstock produced on arable land compared to silage maize-based feedstock. However, under current frame conditions, it is quite unrealistic that grass production systems would be established on arable land at larger scale.

1. Introduction

The production of biogas from agricultural feedstock has been propagated as a promising pathway for reducing fossil CO2 emissions from energy use [1]. However, bioenergy systems may not only relieve the environment by substituting fossil fuels but also contribute to environmental problems especially associated with the cultivation of energy crops [2]. Nevertheless, the production and use of biogas from agricultural wastes and animal manure has the advantage that the energy of these resources can be utilized, which otherwise cannot be used efficiently.
In Germany, rather strong incentives have been set to produce biogas with the Renewable Energy Sources Act in the year 2000 and several following amendments, which triggered a boom of biogas from dedicated energy crops [3]. In 2015, about 8000 biogas plants digested agricultural feedstock in Germany [4]. Since energy density is low in animal manure, additional feedstocks such as energy plants contribute to the energy production from biogas to a great extent. The most prominent energy plant for anaerobic digestion is maize [Zea maize], followed by mixtures of different grass and herb species from grasslands, and cereals [2], which generally are ensilaged as whole plant before digesting in specific reactors. As a consequence, the area dedicated for energy plants for biogas production in Germany summed up to more than 1.2 million ha, which is 7.5% of the total utilized agricultural area [5]. While silage maize is still the dominant energy crop in anaerobic digestion in Germany, efforts are being made to foster the use of other crops for the production of bioenergy. Feedstock from grassland has the advantage of being abundantly available in Europe at low opportunity costs [6]. However, feedstock costs per energy unit are often higher for feedstock from grassland compared to silage maize [7], which creates an incentive to use silage maize instead of feedstock from grassland for biomass digestion. Furthermore, the use of feedstock from grassland, especially from conservation areas, may complicate the fermentation process due to the structure of this feedstock [6,8,9,10], which creates another disincentive for the use of this feedstock for biogas production.
The use of agricultural feedstock for biogas production may contribute to the mitigation of greenhouse gases (GHG) by substituting fossil energy for electricity and heat production [11]. The GHG mitigation potential, however, may be substantially reduced if direct or indirect land-use change effects apply, which may result in a net GHG emission effect of the use of energy crops [12]. While direct land-use change effects can be estimated with the history of land use of the fields considered for energy cropping, indirect land-use change effects are subject to market forces and occur on other fields than those designated for energy cropping. In Europe, different land-use change processes have been identified, which either result in sequestration of carbon in the soil in the case of land-use change from cropland to forest or grassland, or result in net CO2 flux from the soil to the atmosphere [13] in the case of conversion of grassland or forest. The grassland area in Germany decreased by 500 tsd. ha from 5.1 million ha in 2001 to 4.6 million ha in 2011 [14], which at least partly can be explained by an increased demand for cropland. Britz and Delzeit [3] estimate in model simulations a reduction of 200 tsd. ha grassland as a consequence of the amendment to the Renewable Energy Act in 2009 after eleven years.
The aim of this paper is to compare the GHG mitigation potential of grass and silage maize from sites with different crop yield potentials, taking possible effects of direct land-use change into account.

2. Materials and Methods

2.1. Scope, System Boundaries and Land-Use Change Scenarios

The presented analysis is based on a modelling approach, based on input–output relationships of typical silage maize-based and grass-based biogas production systems from sites with different crop yield potentials in Northeast Germany.
The analysis is performed with a cradle to gate life cycle assessment (LCA) approach according to Cherubini [15]. The system boundary is defined by the agricultural activities to produce the agricultural feedstock and produce biogas with an anaerobic digester (Figure 1). The system of investigation consists of processes and reference processes, which are linked to the production of biogas and related GHG emissions. For simplification, the term “grass” is used for a mixture of different grass and herbal plant species, which can be grown on permanent grassland or cropland. While cropland is characterized by periodical tillage and sequential cultivation of different crops, grassland is understood as vegetation, which is composed of perennial or self-seeding annual forage species, which may persist indefinitely [16]. While, in Germany, maize is the dominant energy crop for biogas production from arable land, grass is used predominantly, if it is abundantly available from grassland for which no better land use option exists. Grass may also be sown on arable land and maize may be planted on converted grassland. Both land-use changes (conversion of grassland to arable land and conversion of arable land to grassland) impact carbon changes in the soils, which were accounted for according to the meta-analysis of Poeplau et al. [17]. While with the conversion of cropland to grassland an increase of 40% in soil organic carbon was assumed, the conversion of grassland to cropland was assumed to induce a decrease of 36% in soil organic carbon over a period of 20 years. With respect to different initial carbon stocks, this amounts to a yearly carbon sequestration of 0.9 Mg/ha or a carbon loss of yearly 2.1 Mg/ha, respectively. In the reference system, no economic use of the grass was assumed, which reflects the fact that more and more grasslands in Germany cannot be used economically anymore [6]. Unless the grassland can be used for animal feeding purposes, farmers need to mulch grasslands once a year to receive the EU payments for these fields. The avoided emissions from the decomposition of grass in the field have been modelled as credit equaling the N2O emissions that can be assumed due to the decomposition of the nitrogen (N) contained in the mulched biomass (60 kg N/ha). An overview over the analyzed direct land-use change effects and associated processes which were taken into account in the inventory analysis is provided with Table 1.
Even though the GHG mitigation effect is commonly expressed per energy units, the GHG mitigation effect of energy crops per ha land use is an increasingly important characteristic to identify efficient land-use options. Both indicators together provide a more comprehensive picture of the impact of the use of energy crops [15]. This is important not only for comparison of different energy cropping options but also for other GHG mitigation strategies, which require land, such as reduced fertilizer input [18]. Thus, the functional units were electric energy (1 kWhel) and land used for energy cropping (1 ha).

2.2. Data and Assumptions Regarding the Bioenergy Production Systems

Data on inputs to the agricultural systems for producing the feedstock for anaerobic digestion and associated crop and methane yields were taken from Hanff et al. [19] for three different yield classes for silage maize (Maize I, Maize II, Maize III) and for grassland (Grassland I, Grassland II, Grassland III) representative for the State of Brandenburg (Table 2), where yield class I has a higher crop yield potential than yield class II and so forth. While, for maize, we modeled only one management system for each yield class, we defined different cutting frequencies for the grassland systems. Furthermore, we defined one low intensity grassland system (Grassland II with two cuts), which receives no fertilizer. Fertilizer applications to the other systems were calculated according to the needs of the plants taking into account the recycling nutrient credits as described in [11]. As a result, P and K fertilizer were considered to be totally recycled with the digestate. In contrast, losses of N as leached nittrate or volatized ammonium were calculated with typical losses as described in [11]. With the digestate, not only nutrients but also carbon is turned back to the fields. We assumed a similar carbon cycling in the grass-based systems and the silage maize-based systems, and no significant impact from carbon cycling in the different systems on the GHG balance of both systems. Yield losses due to silage and storage were assumed to be 9% for silage maize and 15% for grass feedstock according to [19].
For the biogas production system, we supposed a typical farm-based biogas plant in Brandenburg with an installed electric capacity of 500 kWel, operated 8200 h full-load operating time per year. We assumed an electric efficiency of 38% and a power consumption of 8% of the produced electricity, a range that corresponds to the current status quo at German biogas plants [20]. Methane leakage was estimated at 1% of the produced methane.
Maize silage and grass silage were assumed to be digested together with cattle manure under mesophilic conditions (38 °C). Even though anaerobic digestion of cattle manure may affect net GHG emissions and the availability of plant nutrients when applied on the fields as digestate, GHG emissions and credits due to digestion of the cattle manure were not taken into account here because the focus of the paper is on the relative contribution of silage maize and grass as renewable energy source. The biogas is assumed to be converted into electric and thermal energy in a combined heat and power unit. Electric energy is fed into the public grid. Thermal energy heats the digester in order to maintain the anaerobic process. An additional use of 20% of the excess heat has been taken into account as heat that can be used in adjacent municipal households during the winter months and substitutes natural gas according to Vogt [21].
The different crop yields per ha and methane yields per kg feedstock result in a different acreage needed to yield the same amount of energy as the functional unit (Table 3). To convert the emission and mitigation potentials to the agricultural acreage (ha), the total emissions were divided by the area needed to produce the same amount of electric energy (4.2 million kWhel).
To appropriately account for the GHG emissions associated with the transport of the feedstock, average transport distances (d) were calculated for each feedstock and yield class as a function of the acreage (A) feedstock needed to produce the same amount of energy (Equation (1)). According to calculations made by Toews [22], it was assumed that 10% of the surrounding area was available for energy cropping and to spread the digestate after fermentation. To account for the availability of roads to access the fields, the average field to farm distance was assumed to be twice the average linear distance according to Equation (1):
d [ m ] = 2 A [ m 2 ] 2 × π

2.3. Estimation of GHG Emissions

The supply and conversion of energy crops to electric energy via biogas results in GHG emissions, which originate from cropping, manufacturing of inputs, biomass transport, N2O emissions from the soil and emissions due to the digestion of the feedstock. The key greenhouse gases of concern in agriculture are CO2, CH4 and N2O [23]. The global warming potential (GWP) of these gases for a time horizon of 100 years was taken into account according to the 5th Assessment Report of the International Panel on Climate Change [23] and is expressed in CO2 equivalents (CO2eq). GHG emissions due to the production of biogas were compared with three reference energy supply systems according to LCA standards following Cherubini [15]. The reference systems were (1) brown coal; (2) natural gas and (3) the current energy mix in Germany, based on brown coal, black coal and natural gas.
All emissions due to the energy crop production including input of seeds, machinery, fuel, fertilizer and pesticides as well as the manufacturing and supply of these inputs were taken into account (Table 4). Direct and indirect N2O emissions were taken into account according to the Intergovernmental Panel on Climate Change (IPCC) Guidelines for National Greenhouse Gas Inventories [24].
All GHG emissions for the production of the biogas including the emissions due to cultivation of the energy crops and methane leakages were calculated according to the emission factors as described in Meyer-Aurich et al. [11], where best available technology was assumed. Emissions and credits were calculated for silage maize and grass feedstock on three different sites with different management options for grassland (Table 2), taking into account the credits for nutrient cycling with the digestate (see Section 2.2). The GHG mitigation effects were calculated as the difference between the reference value of the fossil feedstock and the GHG emissions due to biogas based electric energy from grass or silage maize.

2.4. Uncertainty Analysis

An uncertainty analysis was performed for all GHG calculations considering the uncertainties of the input parameters and the emission factors relevant for the N transformation processes in the considered systems (Table 5). Unless noted otherwise all parameters were modelled in a Monte Carlo simulation with a triangular distribution. The upper and lower bounds of crop and biogas yields were estimated as ±10% from the default value, which is in accordance with review results provided by Prochnow et al. [6] for grass and Herrmann and Rath for silage maize [32]. Assumptions on methane leakages, power consumption of the biogas plant and electric efficiency of the power unit were the same as published in Meyer-Aurich et al. [11]. Uncertainties due to soil organic carbon change after land-use change were taken into account according to the results from the meta-analysis of Poeplau et al. [17]. Both the initial carbon stock and the change in soil organic carbon, were modelled according to the provided information on the data distribution as normal distributions with the moments of the distributions provided by Poeplau et al. [17].

3. Results and Discussion

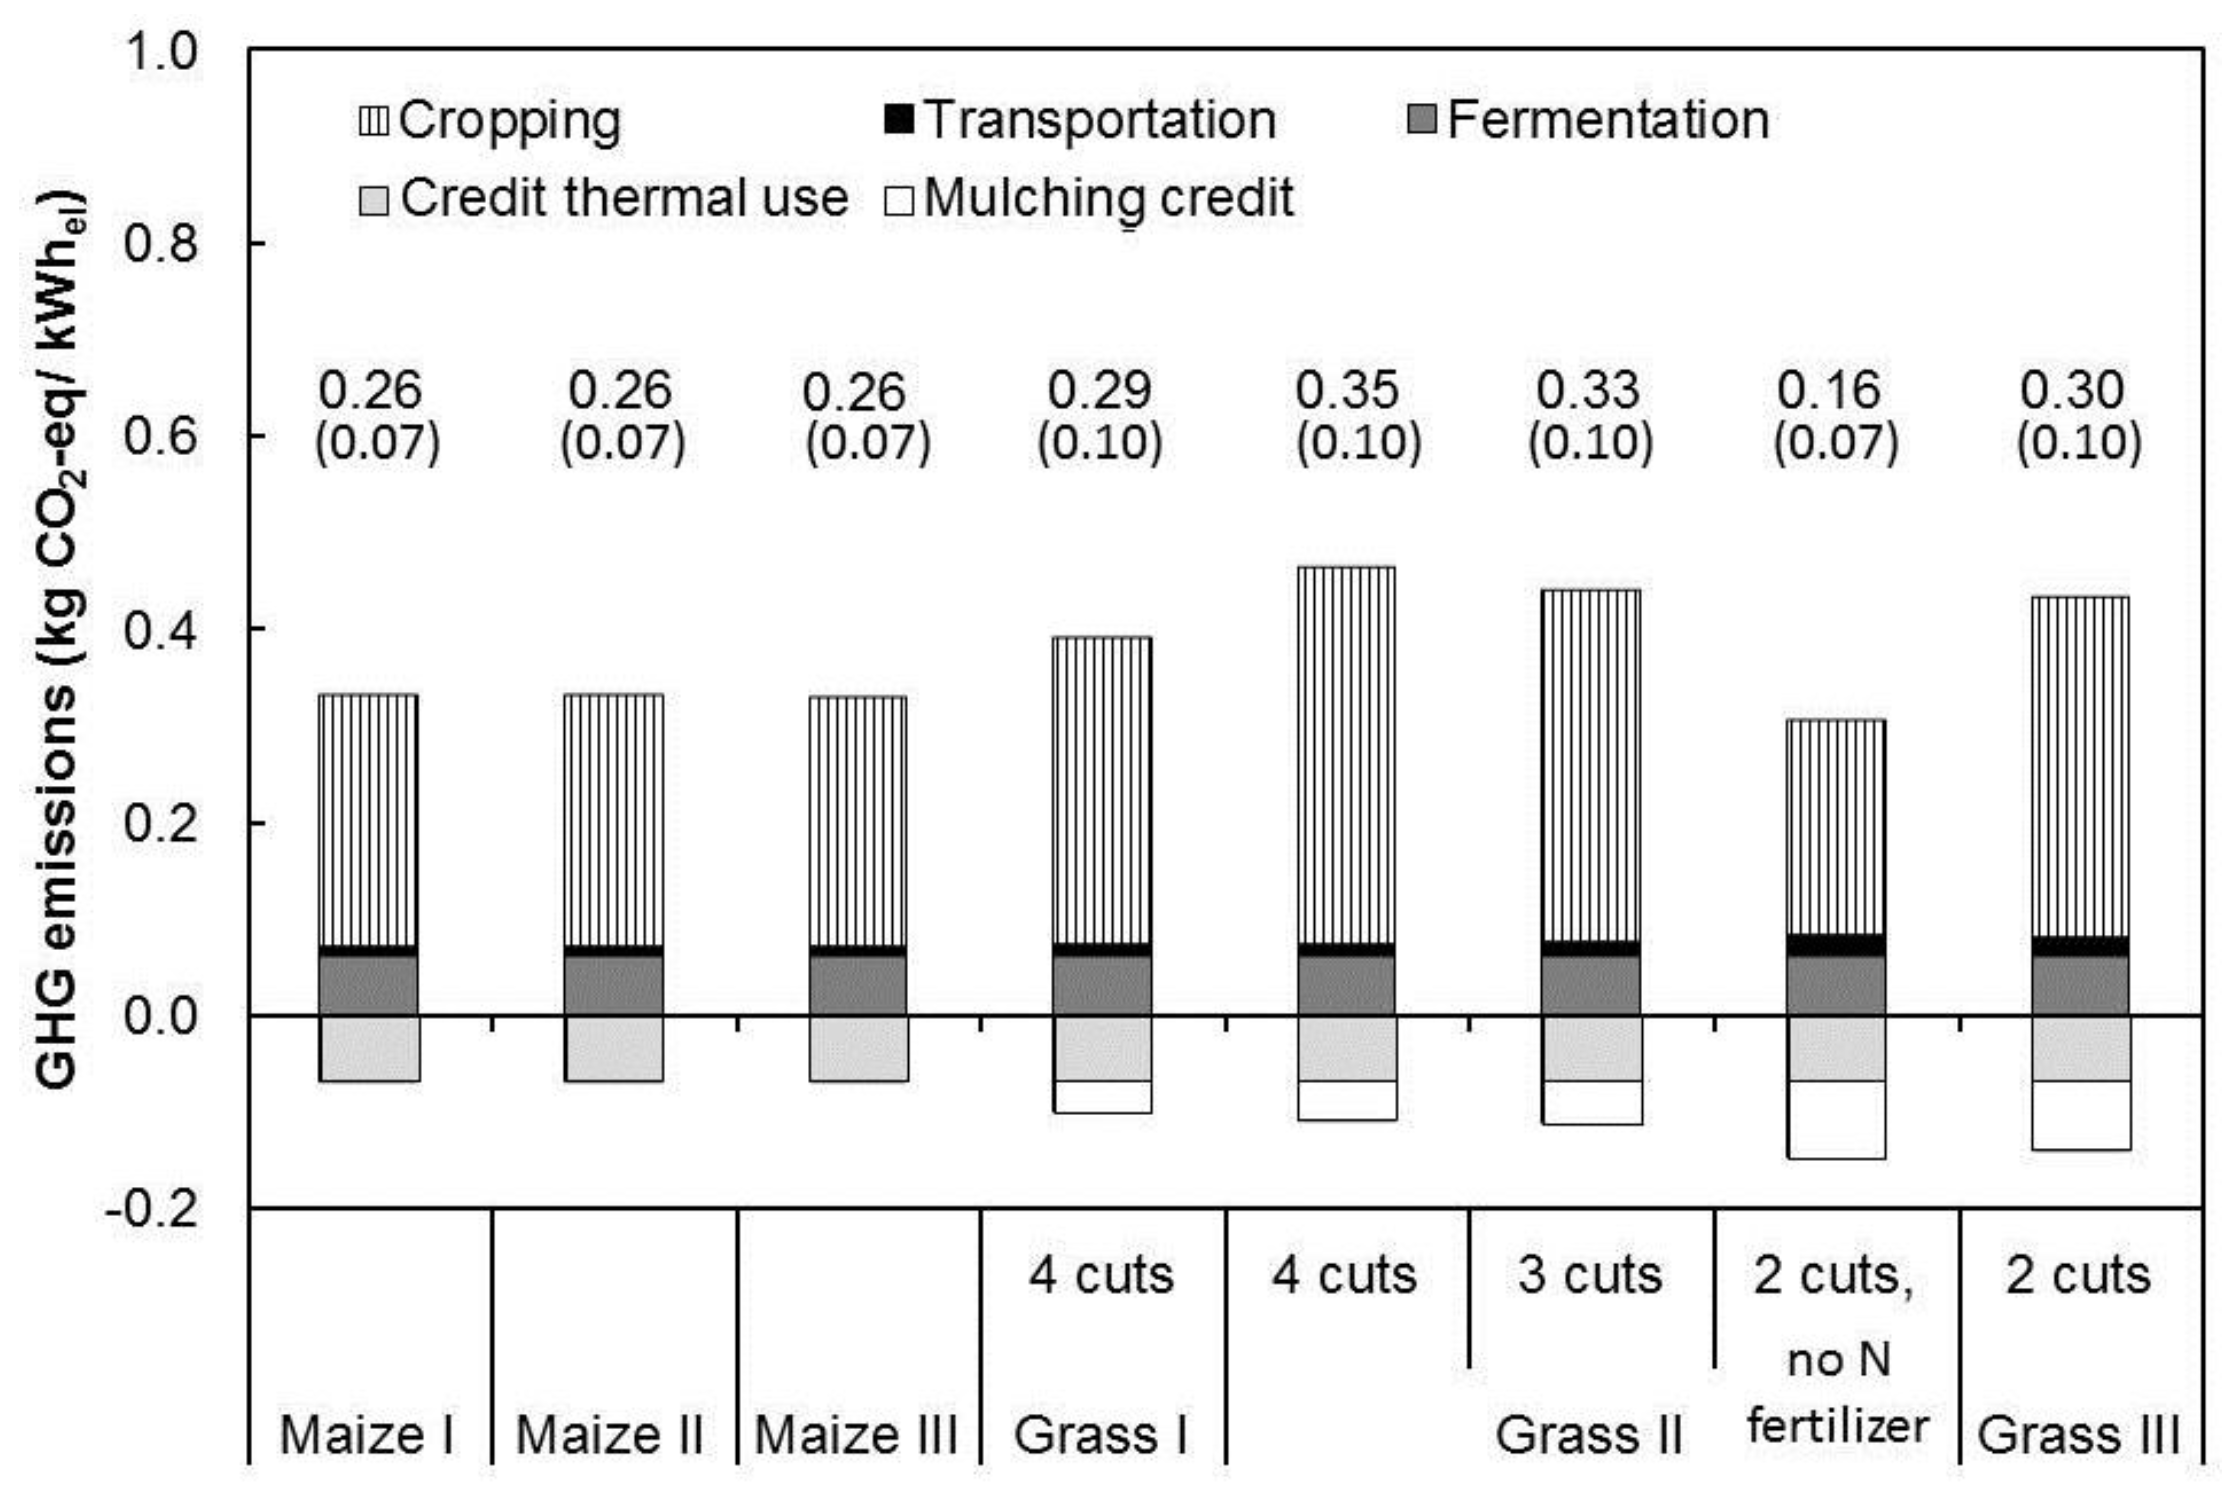
3.1. GHG Emissions Due to the Production of Biogas from Silage Maize and Grass without Land-Use Change Effects

The range of per unit electric energy emitted GHGs due to the biogas production from silage maize and grass is shown in Figure 2 along with the standard deviation of the data generated by the Monte Carlo simulation as a function of following processes: (1) cropping, which contains all emissions related to crop production, including direct and indirect emissions; (2) transportation, which includes all emissions due to transporting of the necessary feedstock amount to the biogas plant and of digested crop residues back to the field and (3) digestion, which includes emissions due to losses of methane from the biogas plant and depreciated emissions due to the construction of the plant. While the emissions from the silage maize production are about the same irrespective to different yield classes, the emissions due to the grass supply vary substantially for the various production systems. The results for silage maize correspond well to the findings of Grassini and Cassmann [34], who found that high inputs and low GHG emissions are not conflicting goals. However, for grassland management this thesis is not supported. In grassland management the lowest emissions were found with the system with low intensity (Grass II, 2 cuts), while all other grassland management systems had higher GHG emissions compared to silage maize. Grassland management systems with the same cutting frequency showed higher GHG emissions on sites with lower crop yield potential. The same grassland management system on sites with different crop yield potential showed higher GHG emissions per unit kWhel on sites with lower crop yield potential (Grass II), compared to those on sites with higher crop yield potential (Grass I), while the GHG emissions per hectare were lower on sites with lower crop yield potential (Grass II) compared to those on sites with higher crop yield potential (Grass I). This is due to the fact that energy efforts for mowing and harvesting of the grass are quite high, which are counterbalanced better with higher crop yields when the electric energy is used as a reference. The emissions for transportation increase with lower crop yield potential, since more biomass needs to be transported to produce the same amount of energy. In addition, the feedstock with low methane yield potential, like grass, managed at low fertilizer intensity, requires even more input to produce the same amount of energy use. In any case, this effect is small against the effects due to cropping. In the silage maize production systems, the different transportation distances due to the different yield potentials affect the net GHG emissions by less than 1% of the total emissions. The relative advantage of grass and silage maize as feedstock for biogas production has also been investigated for example by Rösch et al. [35]. Similar to our findings, they found higher per ha GHG emissions of silage maize production compared to grass production, while the GHG emissions per unit electric energy were lower based on silage maize compared to grass. The relative GHG emissions of grass-based biogas compared to silage maize-based biogas production could change if the silage maize-based system was included in a “double cropping” system. Graß et al. [36] have shown that “double cropping” systems can have higher biomass yields than sole crop systems. However, in their study, the dry matter yield of the best double cropping system was only about 10% higher compared to the sole silage maize system. Taking into account additional efforts for seeding and harvesting would counterbalance the GHG emissions to some extent so that the overall net effect would be small.
GHG credits for the substitution of fossil thermal energy and for the savings of emissions from mineralized mulched biomass have been taken into account (Figure 2). The credit for heat use as well as the fermentation emissions stays constant through all variants owing to the model assumptions as described in Section 2.2. The credit for not mulching the grassland in the case of bioenergy use varies according to the land acreage needed to produce a unit of electric energy (Table 3).
The netting out of the GHG emissions and the GHG credits varies from 0.16 to 0.35 kg CO2eq/kWhel depending on feedstock, site conditions and cutting frequency of the grass (Figure 2). The coefficient of variance ranges from 27% to 44%, with the highest coefficient of variance in the grass-based biogas systems (data not shown). This is mainly due to lower crop yields and lower methane yields resulting in the necessity to produce grass on more hectares of land with more N fertilizer being involved, which is the main driver for the variance of the results. The emission levels are within the range of other studies on GHG emissions due to biogas production [37,38,39]. The great range of calculated emissions between the systems illustrates the potential and the importance of adequate design and accounting of different management systems especially in the grassland system. Using silage maize as feedstock resulted in 0.26 kg CO2eq/kWhel for all silage maize production systems (Figure 2), even though crop yields and necessary transports differ substantially (Table 3, Table 6). This value is higher than the emission calculations which can be found for example in Pucker et al. [39] for energy crops, who did not consider indirect emissions in their inventory, or in Dressler et al. [40], who assumed higher silage maize yields and higher thermal use of 30%–60%.

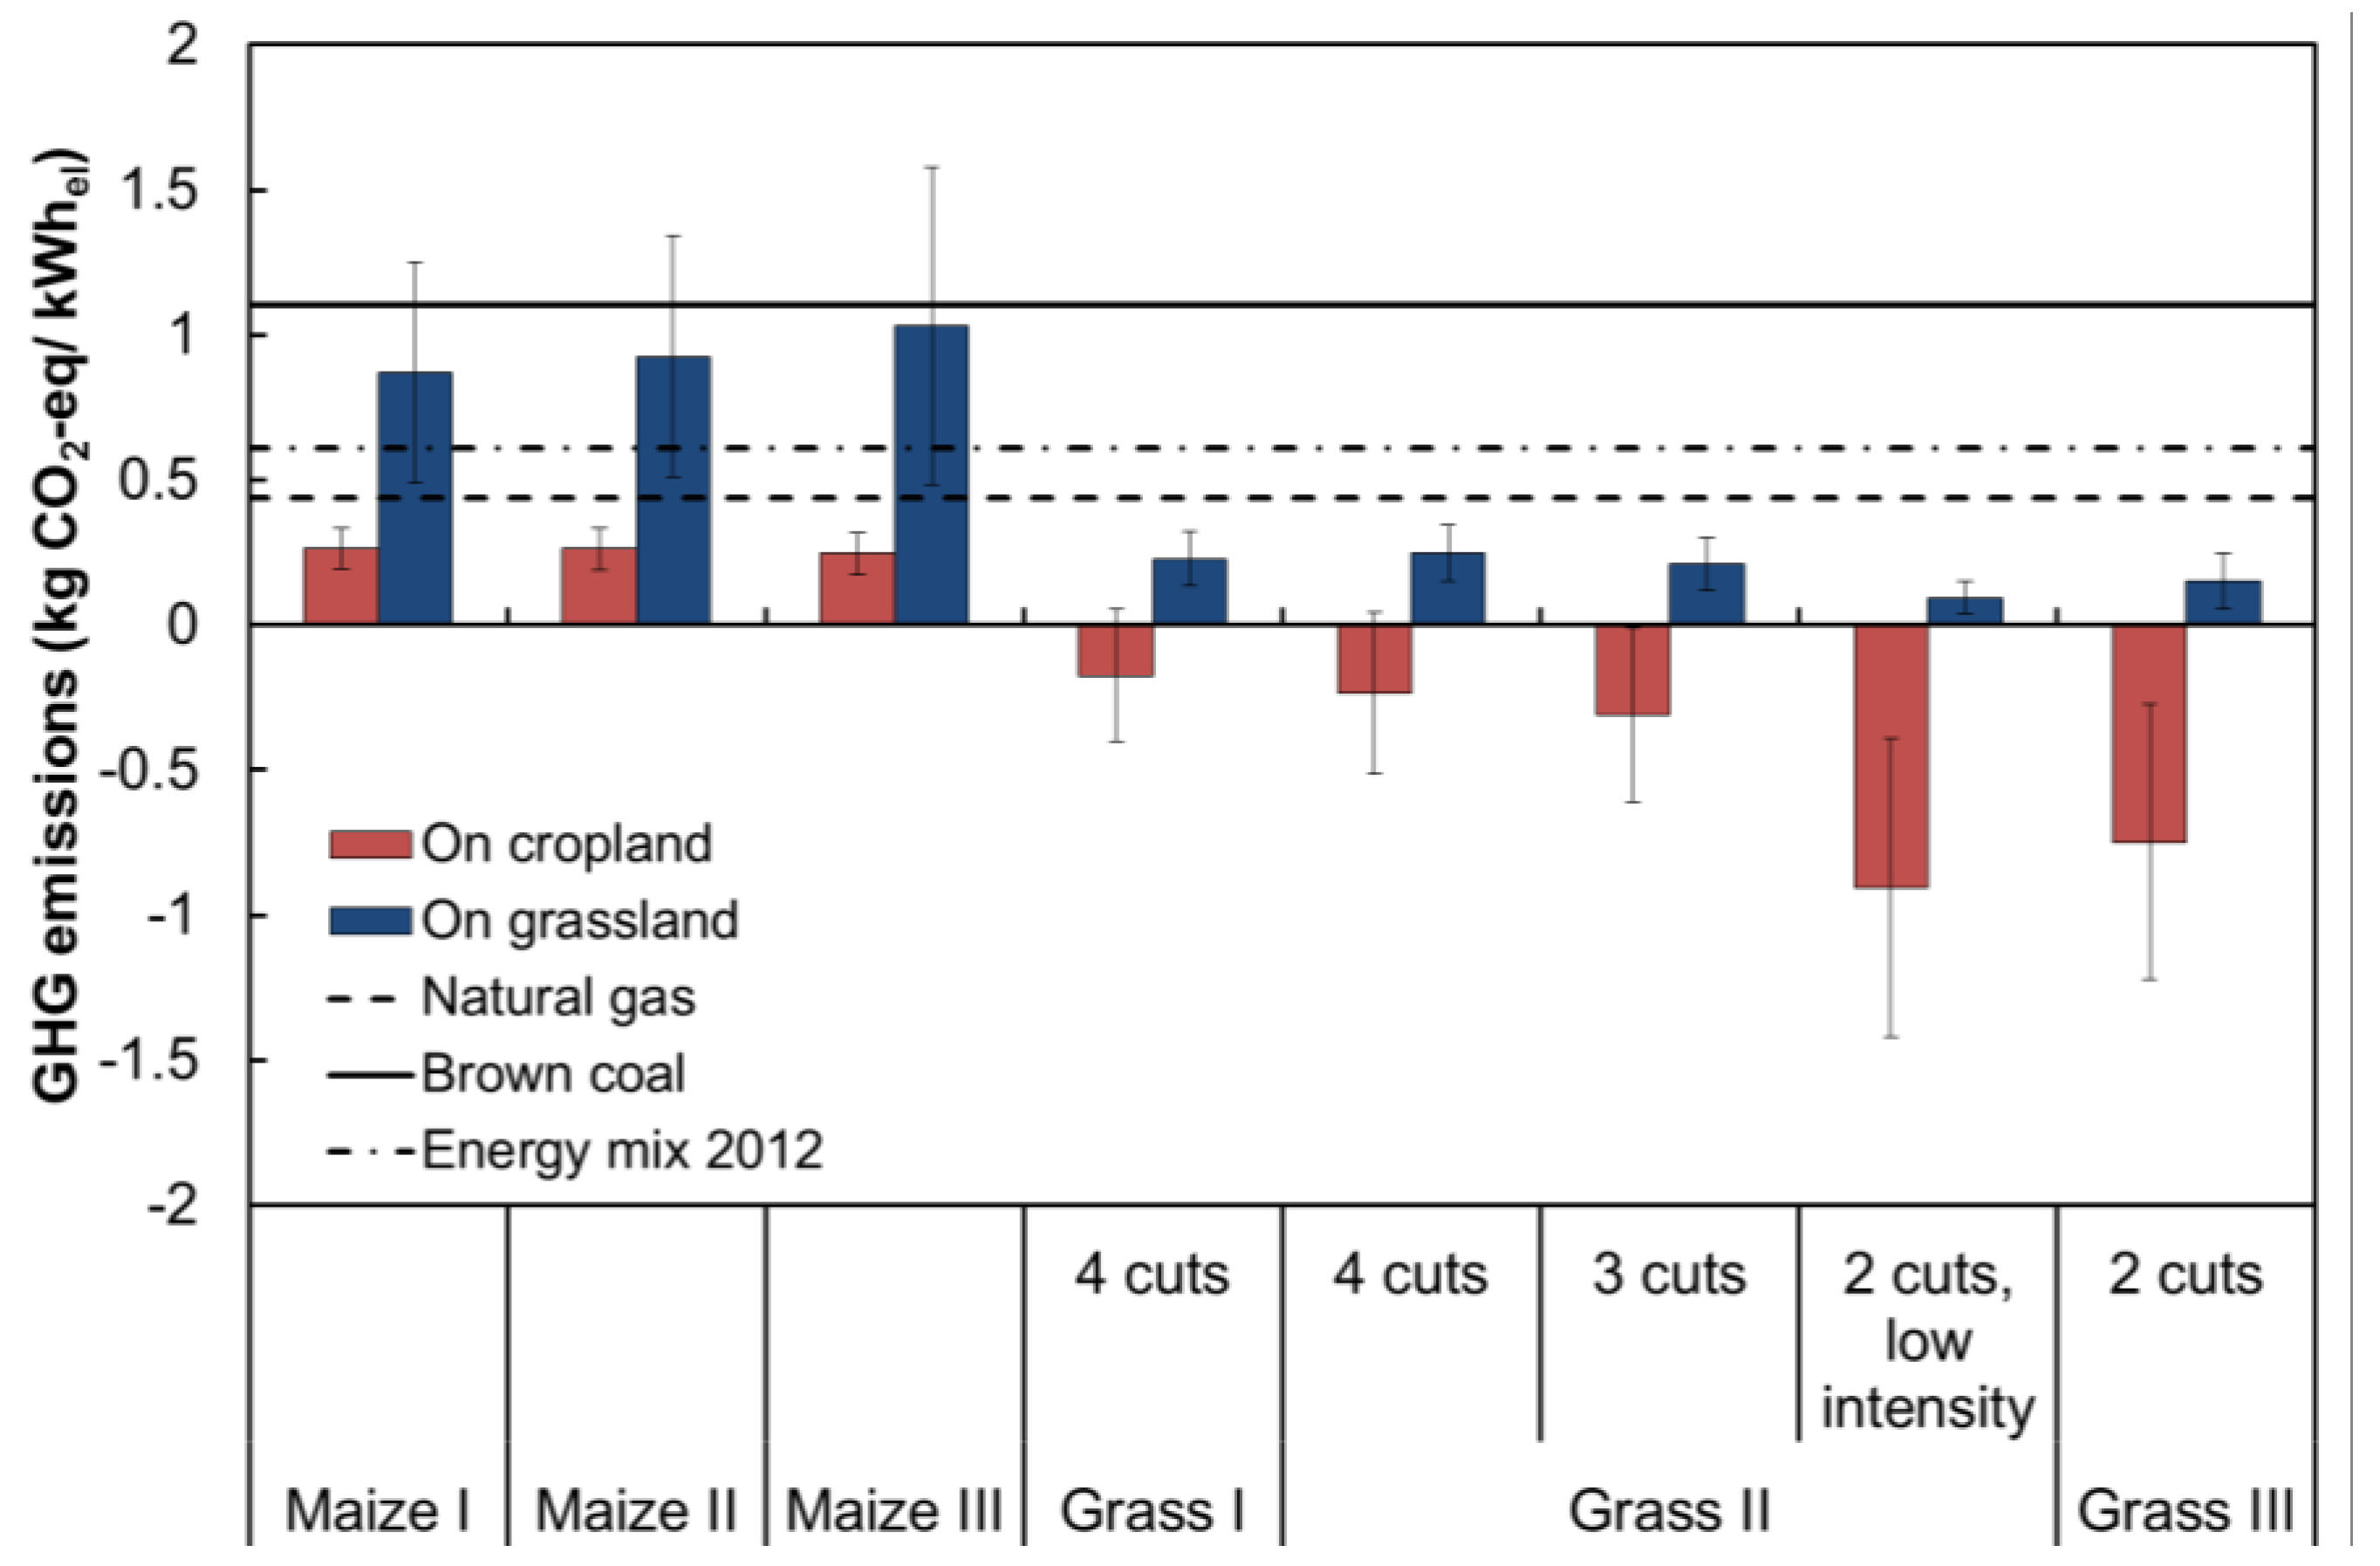
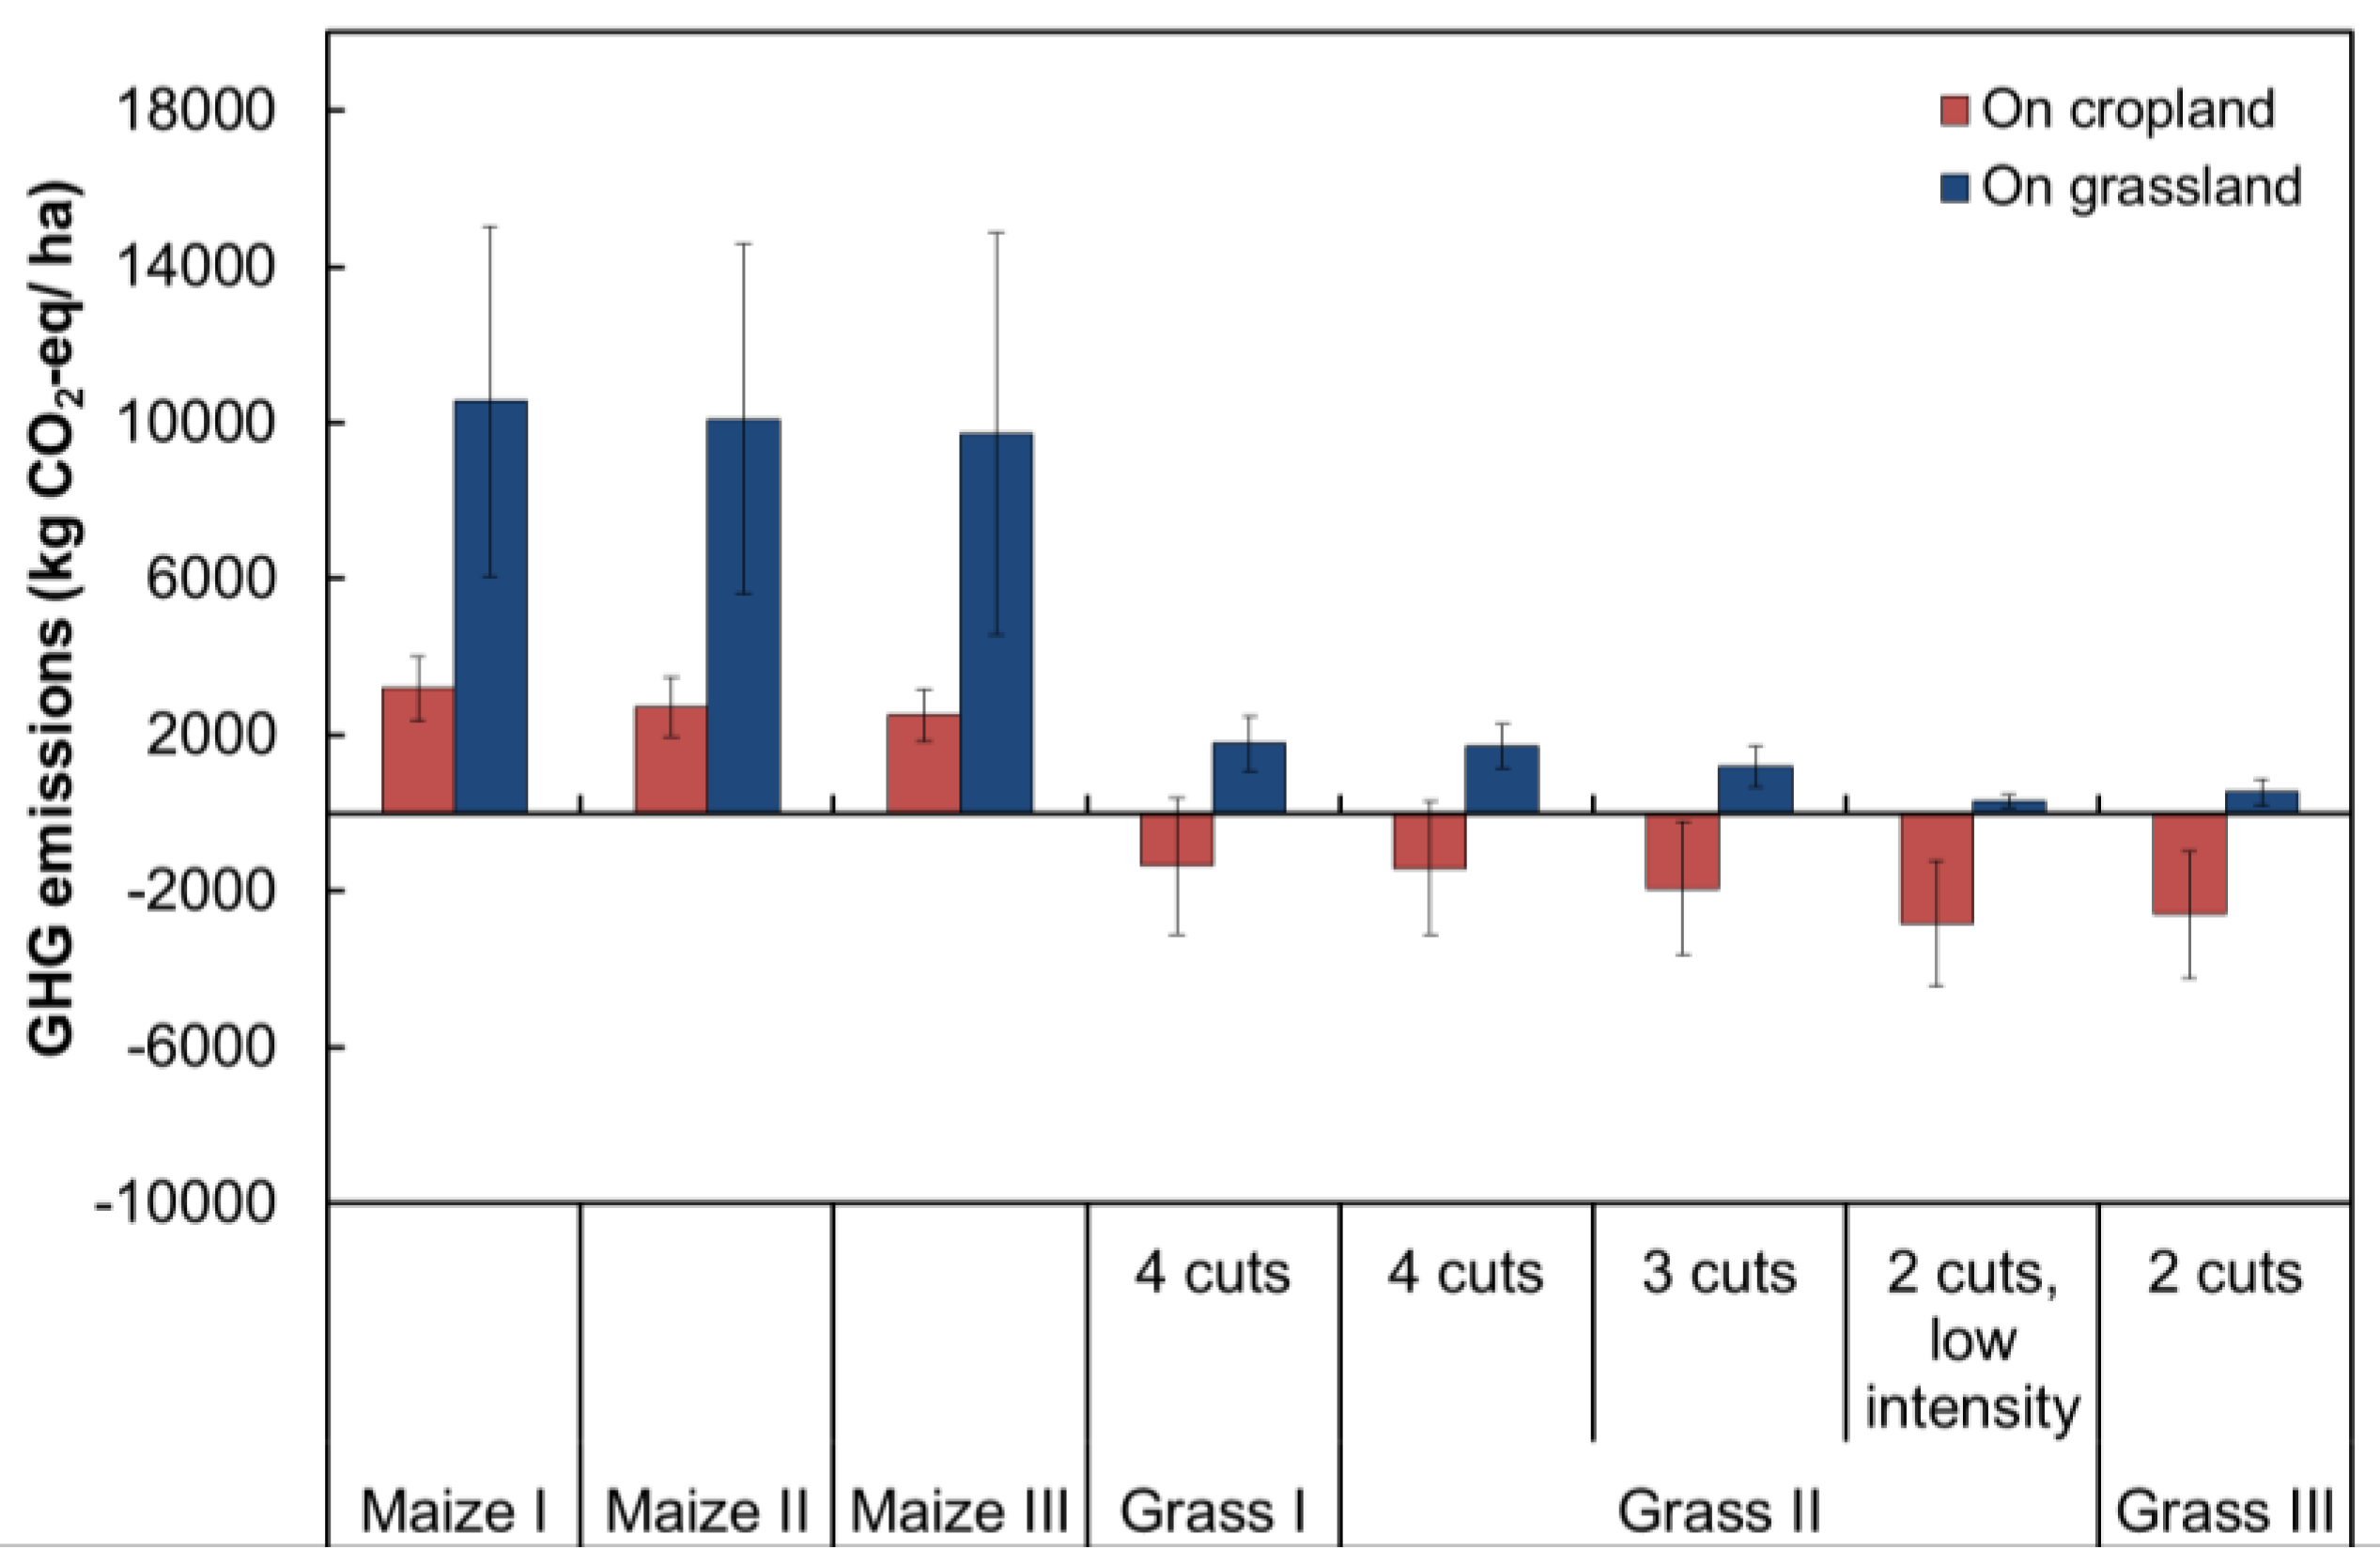
3.2. GHG Emissions Due to the Biogas Production from Silage Maize and Grass of Energy Cropping Including Direct Land-Use Change Effects

Including direct land-use change effects influences significantly the range of GHG emitted during the biogas production from silage maize and grass. Direct land-use change has a dramatic effect on the total GHG emissions of silage maize, which more than double or even triple, if silage maize is cultivated on former grassland (Figure 3 and Figure 4 per kWhel and per ha, respectively). By grass-based biogas production direct land-use change leads to the transformation of GHG emissions into GHG savings due to carbon sequestration. The figures further provide information regarding the distributions of the data produced by the Monte Carlo simulation. Systems with direct land-use change show a much higher standard deviation than biogas systems without direct land-use change. This is not surprising, since an additional source of variance has been added. However, the analysis of the regression coefficients of the multivariate regression analysis shows that the variance of the direct land-use change variables determine the variance of the overall emissions to a greater extent than most other variables (Table 6). The uncertainty of the initial carbon stock has a higher impact on the uncertainty of the overall GHG emissions due to biogas production than the uncertainty of the change rate of the carbon stock after land-use change. In absence of direct land-use change, N2O emissions from N fertilizer use (EFN2O) and variables related to N transformation processes had the highest impact on the variance of GHG emissions related to biogas production. While uncertainties of methane leakages had a moderate impact on the variance of GHG emissions, the variability of crop yields and methane yields had a minor importance for the variability of GHG emissions.
Figure 3 includes three reference GHG emissions from brown coal, natural gas and the current energy mix in Germany. The production of electric energy from biogas production based on silage maize from arable land (without land-use change) and from biogas based on all considered grass systems results in less GHG emissions than the production of electric energy from natural gas, which is regarded as the fossil energy source with the lowest GHG emissions. The production of electric energy based on silage maize from converted grassland, however, emits almost as many GHGs as power generation with brown coal. With lower crop yield potential (Maize I to Maize III) GHG emissions per kWh increase because the production of silage maize on land with a lower crop yield potential requires more land with more direct land-use change related emissions to achieve the same amount of electric energy produced. On cropland, though, the GHG emissions per unit of electric energy produced are the same for all silage maize production systems because crop yield proportionally increases with N fertilizer input. The area related GHG emissions show a similar pattern as the energy related emissions, but they decrease with lower crop yield potential because of reduced input of N fertilizer (Figure 4).

3.3. GHG Mitigation Potential of Using Grass and Silage Maize as Feedstock for Biogas

The generation and use of electric power from biogas in a combined heat and power unit results in GHG mitigation unless the emissions of biogas production are higher than the emissions from a reference system. Figure 3 shows the three reference GHG emissions and the range of possible GHG mitigation with the use of these energy crops as feedstock. Table 7 provides the values of GHG mitigation potentials per ha land use for the three reference systems as a result of the difference of the GHG emissions of the biogas system and the reference system. The GHG mitigation potentials vary considerably from −5765 to 10,027 kg CO2eq/ha, where negative mitigation rates indicate net GHG emission and positive mitigation rates indicate net GHG mitigation. This range of possible effects on GHG mitigation exceeds the range found by others. For example, Rösch et al. [35] found area related GHG mitigations with wet fermentation of silage maize and grass between 4000 and 7000 kg CO2eq/ha, where area-related GHG mitigation potentials based on wet fermentation of silage maize were higher than the mitigation levels based on wet fermentation of grass. However, they did not account for possible land-use change effects associated with the use of silage maize.
Our results show that the conversion of grassland to arable land for growing silage maize for biogas production leads to a remarkable additional net release of GHG, which are not compensated by substituting electric energy based on natural gas or the current energy mix (Table 7). For biogas production based on silage maize on former grassland, a net mitigation effect occurs only if brown coal is assumed as reference for electric energy production. Even on arable land, the production and anaerobic digestion of grass results in higher GHG mitigation potentials per ha than considering silage maize as an energy crop unless brown coal is considered as reference. Cropping of silage maize only in this case achieves higher GHG mitigation potentials than cropping of grass. Within the yield class II, low intensity grass has a slightly higher GHG mitigation potential than the use of intensive grass with natural gas as reference. With the current energy mix and brown coal as reference, the mitigation potential of intensive grassland use is higher compared to the low intensive grassland use. This indicates that assumptions regarding the reference systems have a major impact on GHG mitigation potentials, which need to be taken into account carefully. In any case, the mitigation of GHGs with biogas based on grass from grassland is higher than biogas production based on silage maize on those fields.

4. Conclusions

Silage maize as a feedstock for biogas production results in lower GHG emissions per kWhel than grass unless grass is used at a low level of intensity without use of mineral fertilizer. Without land-use change, biogas production from silage maize as co-substrate can contribute to higher GHG mitigation potential than grassland based biogas. This result is consistent over various silage maize and grass production systems with different crop yield potentials in Brandenburg. The use of grass from arable land as co-substrate to biogas production results in higher GHG mitigation than the use of silage maize taking changes in soil organic matter into account. However, converting cropland to permanent grassland is not likely to happen without regulation or compensation, since farmers may not be allowed to use the land as cropland after using the land as grassland for some years. Even though the specific GHG emissions per unit of electric energy are lower for silage maize than for grass, the net mitigation effect is higher in the grass systems due to carbon sequestration in the soil. If grassland is converted to arable land to produce silage maize for biogas production, no net GHG mitigation effect can be detected taking the current energy mix as the reference system. The most effective mitigation potential is subject to the fossil reference system, which is to be substituted. With the shift towards more climate friendly fossil energy production systems, the mitigation efficiency of using grasslands as a resource for bioenergy production will increase further relative to silage maize. These results are subject to uncertainties, especially with the GHG fluxes associated with land-use change. Besides land-use change, uncertainties regarding the N2O emission factor and leaching of N strongly determine the variance of GHG emissions due to biogas production from silage maize and grass.

Acknowledgements

The publication of this article was funded by the Open Access fund of the Leibniz Association.

Author Contributions

Andreas Meyer-Aurich and Yulia Lochmann designed the conceptional models for the calculations. Andreas Meyer-Aurich provided calculations for the GHG emissions due to crop production. Yulia Lochmann analyzed the data, Andreas Meyer-Aurich performed the monte-carlo simulation and the sensitivity analysis. All authors contributed to the writing of the manuscript.

Conflicts of Interest

The authors declare no conflict of interest.

References

  1. Weiland, P. Production and energetic use of biogas from energy crops and wastes in Germany. Appl. Biochem. Biotechnol. 2003, 109, 263–274. [Google Scholar] [CrossRef]
  2. Herrmann, A. Biogas production from maize: Current state, challenges and prospects. 2. Agronomic and environmental aspects. Bioenergy Res. 2013, 6, 372–387. [Google Scholar] [CrossRef]
  3. Britz, W.; Delzeit, R. The impact of German biogas production on European and global agricultural markets, land use and the environment. Energy Policy 2013, 62, 1268–1275. [Google Scholar] [CrossRef]
  4. Fachagentur Nachwachsende Rohstoffe e.V. (FNR). Entwicklung Biogasanlagen in Deutschland. Available online: https://www.unendlich-viel-energie.de/mediathek/grafiken/entwicklung-von-biogasanlagen-in-deutschland (accessed on 11 May 2016). (In German)
  5. Fachagentur Nachwachsende Rohstoffe e.V. (FNR). Anbau Nachwachsender Rohstoffe in Deutschland. Gülzow, Germany: Federal Ministry of Food, Agriculture and Consumer Protection (BMELV) and FNR. Available online: http://mediathek.fnr.de/media/downloadable/files/samples/r/z/rz_fnr4_0302_grafik_nawaro_anbau_de_neu.jpg (accessed on 11 May 2016). (In German)
  6. Prochnow, A.; Heiermann, M.; Plöchl, M.; Linke, B.; Idler, C.; Amon, T.; Hobbs, P.J. Bioenergy from permanent grassland—A review: 1. Biogas. Bioresour. Technol. 2009, 100, 4931–4944. [Google Scholar] [CrossRef] [PubMed]
  7. Blokhina, Y.; Prochnow, A.; Plöchl, M.; Luckhaus, C.; Heiermann, M. Concepts and profitability of biogas production from landscape management grass. Bioresour. Technol. 2011, 102, 2086–2092. [Google Scholar] [CrossRef] [PubMed]
  8. Herrmann, C.; Prochnow, A.; Heiermann, M.; Idler, C. Biomass from landscape management used for biogas production: effects of harvest date and silage additives on feedstock quality and methane yields. Grass Forage Sci. 2014, 69, 549–566. [Google Scholar] [CrossRef]
  9. Thamsiriroj, T.; Murphy, J.D. The difficulties associated with mono-digestion of grass as exemplified by commissioning a pilot scale digester. Energy Fuel 2010, 24, 4459–4469. [Google Scholar] [CrossRef]
  10. Thamsiriroj, T.; Nizami, A.S.; Murphy, J.D. Why does mono-digestion of grass silage fail in long term operation? Appl. Energy 2012, 95, 64–76. [Google Scholar] [CrossRef]
  11. Meyer-Aurich, A.; Schattauer, A.; Hellebrand, H.J.; Klauss, H.; Plöchl, M.; Berg, W. Impact of uncertainties on greenhouse gas mitigation potential of biogas production from agricultural resources. Renew. Energy 2012, 37, 277–284. [Google Scholar] [CrossRef]
  12. Lange, M. The GHG balance of biofuels taking into account land use change. Energy Policy 2011, 39, 2373–2385. [Google Scholar] [CrossRef]
  13. Poeplau, C.; Don, A. Sensitivity of soil organic carbon stocks and fractions to different land-use changes across Europe. Geoderma 2013, 192, 189–201. [Google Scholar] [CrossRef]
  14. Statistische Ämter des Bundes und der Länder. Regionaldatenbank Deutschland; Statistische Ämter des Bundes und der Länder: Düsseldorf, Germany; Available online: http://www.regionalstatistik.de (accessed on 3 December 2014). (In German)
  15. Cherubini, F. GHG balances of bioenergy systems—Overview of key steps in the production chain and methodological concerns. Renew. Energy 2010, 35, 1565–1573. [Google Scholar] [CrossRef]
  16. Allen, V.G.; Batello, C.; Berretta, E.J.; Hodgson, J.; Kothmann, M.; Li, X.; McIvor, J.; Milne, J.; Morris, C.; Peeters, A.; et al. An international terminology for grazing lands and grazing animals. Grass Forage Sci. 2011, 66, 2–28. [Google Scholar] [CrossRef]
  17. Poeplau, C.; Don, A.; Vesterdal, L.; Leifeld, J.; van Wesemael, B.; Schumacher, J.; Gensior, A. Temporal dynamics of soil organic carbon after land-use change in the temperate zone—Carbon response functions as a model approach. Glob. Chang. Biol. 2011, 17, 2415–2427. [Google Scholar] [CrossRef]
  18. Meyer-Aurich, A.; Olesen, J.; Prochnow, A.; Brunsch, R. Greenhouse gas mitigation with scarce land: The potential contribution of increased nitrogen input. Mitig. Adapt. Strateg. Glob. Chang. 2013, 18, 921–932. [Google Scholar] [CrossRef]
  19. Hanff, H.; Neubert, G.; Brudel, H. Datensammlung für die Betriebsplanung und die Betriebswirtschaftliche Bewertung Landwirtschaftlicher Produktionsverfahren im Land Brandenburg. Available online: http://www.mil.brandenburg.de/cms/detail.php/bb1.c.218009.de (accessed on 23 June 2016). (In German)
  20. Fachagentur Nachwachsende Rohstoffe e.V. (FNR). Biogas—An Introduction, 2nd ed. Available online: http://www.fnr-server.de/ftp/pdf/literatur/pdf_329-biogas---an-introduction_engl.pdf (accessed on 11 May 2016).
  21. Vogt, R. Basisdaten zu THG-Bilanzen für Biogas-Prozessketten und Erstellung Neuer THG-Bilanzen. Available online: http://www.ifeu.de/oekobilanzen/pdf/THG_Bilanzen_Bio_Erdgas.pdf (accessed on 11 May 2016). (In German)
  22. Toews, T. Ökonomie. In Anbausysteme für Energiepflanzen; Vetter, A., Heiermann, M., Toews, T., Eds.; DLG Verlags GmbH: Frankfurt, Germany, 2009; pp. 227–286. (In German) [Google Scholar]
  23. Myhre, G.; Shindell, D.; Bréon, F.-M.; Collins, W.; Fuglestvedt, J.; Huang, J.; Koch, D.; Lamarque, J.-F.; Lee, D.; Mendoza, B.; et al. Anthropogenic and natural radiative forcing. In Climate Change 2013: The Physical Science Basis. Contribution of Working Group I to the Fifth Assessment Report of the Intergovernmental Panel on Climate Change; Stocker, T., Qin, D., Plattner, G.-K., Tignor, M., Allen, S., Boschung, J., Nauels, A., Xia, Y., Bex, V., Midgley, P., Eds.; Cambridge University Press: New York, NY, USA, 2013. [Google Scholar]
  24. Intergovernmental Panel on Climate Change (IPCC). Guidelines for National Greenhouse Gas Inventories; Intergovernmental Panel on Climate Change: Geneva, Switzerland, 2006. [Google Scholar]
  25. Brentrup, F.; Pallière, C. GHG Emissions and Energy Efficiency in European Nitrogen Fertiliser Production and Use; Proceedings No. 639; IFS (International Fertiliser Society): York, UK, 2008; pp. 1–28. [Google Scholar]
  26. Davis, J.; Haglund, C. Life Cycle Inventory (LCI) of Fertiliser Production: Fertiliser Products Used in Sweden and Western Europe; SIK—The Swedish Institute for Food and Biotechnology: Göteborg, Sweden, 1999. [Google Scholar]
  27. Patyk, A.; Reinhardt, G.A. Düngemittel—Energie und Stoffstrombilanzen; Vieweg Verlag: Wiesbaden, Germany, 1997. (In German) [Google Scholar]
  28. Kaltschmitt, M.; Reinhardt, G.A. Nachwachsende Energieträger. Grundlagen, Verfahren, Ökologische Bilanzierung; Vieweg Verlag: Wiesbaden, Germany, 1997. (In German) [Google Scholar]
  29. Jolliet, O. Ökobilanz thermischer, mechanischer und chemischer Kartoffelkrautbeseitigung. Landwirtsch. Schweiz 1993, 6, 675–682. (In German) [Google Scholar]
  30. Meyer-Aurich, A. Economic and environmental analysis of sustainable farming practices—A Bavarian case study. Agric. Syst. 2005, 86, 190–206. [Google Scholar] [CrossRef]
  31. IINAS. GEMIS Global Emission Model of Integrated Systems. Available online: http://www.iinas.org/gemis-de.html (accessed on 11 December 2014).
  32. Herrmann, A.; Rath, J. Biogas Production from Maize: Current State, Challenges, and Prospects. 1. Methane Yield Potential. Bioenergy Res. 2012, 5, 1027–1042. [Google Scholar] [CrossRef]
  33. Döhler, H.; Eurich-Menden, B.; Dämmgen, U.; Osterburg, B.; Lüttich, M.; Berg, W.; Brunsch, R. BMVEL/UBA-Ammoniak-Emissionsinventar der Deutschen Landwirtschaft und Minderungsszenarien bis Zum Jahr 2010; UBA-Texte 05/02; Verlag: Berlin, Germany, 2002. (In German) [Google Scholar]
  34. Grassini, P.; Cassman, K.G. High-yield maize with large net energy yield and small global warming intensity. Proc. Natl. Acad. Sci. USA 2012, 109, 1074–1079. [Google Scholar] [CrossRef] [PubMed]
  35. Rösch, C.; Skarka, J.; Raab, K.; Stelzer, V. Energy production from grassland—Assessing the sustainability of different process chains under German conditions. Biomass Bioenergy 2009, 33, 689–700. [Google Scholar] [CrossRef]
  36. Graß, R.; Heuser, F.; Stülpnagel, R.; Piepho, H.-P.; Wachendorf, M. Energy crop production in double-cropping systems: Results from an experiment at seven sites. Eur. J. Agron. 2013, 51, 120–129. [Google Scholar] [CrossRef]
  37. Bacenetti, J.; Negri, M.; Fiala, M.; Gonzáles-García, S. Anaerobic digestion of different feedstocks: Impact on energetic and environmental balances of biogas process. Sci. Total Environ. 2013, 463–464, 541–551. [Google Scholar] [CrossRef] [PubMed]
  38. Gerin, P.A.; Vliegen, F.; Jossart, J.-M. Energy and CO2 balance of maize and grass as energy crops for anaerobic digestion. Bioresour. Technol. 2008, 99, 2620–2627. [Google Scholar] [CrossRef] [PubMed]
  39. Pucker, J.; Jungmeier, G.; Siegl, S.; Pötsch, E.M. Anaerobic digestion of agricultural and other substrates—Implications for greenhouse gas emissions. Animal 2013, 7, 283–291. [Google Scholar] [CrossRef] [PubMed]
  40. Dressler, D.; Loewen, A.; Nelles, M. Life cycle assessment of the supply and use of bioenergy: impact of regional factors on biogas production. Int. J. Life Cycle Assess. 2012, 17, 1104–1115. [Google Scholar] [CrossRef]
Figure 1. System boundaries and processes under consideration for this study (solid arrows indicate mass or energy flows, dashed arrows indicate additional data flow for life cycle assessment).
Sustainability 08 00617 g001
Figure 2. GHG emissions and credits due to the biogas production from grass and maize without land-use change effects (yield classes and management systems according to Table 3, net effects as numbers above columns, standard deviation of Monte Carlo simulations in brackets).
Sustainability 08 00617 g002
Figure 3. Energy related GHG emissions of utilization of grass and maize for biogas production including land-use change effects (yield classes and management systems according to Table 3, bars indicate standard deviations of the Monte Carlo simulations).
Sustainability 08 00617 g003
Figure 4. Area related GHG emissions of utilization of grass and silage maize for biogas production with direct land-use change effects (yield classes and management systems according to Table 3, bars indicate standard deviations of Monte Carlo simulations).
Sustainability 08 00617 g004
Table 1. Scenarios of land use in consequence of biogas production.
Initial Land UseFeedstock for Biogas ProductionDirect Land-Use ChangeInduced Changes of GHG
GrasslandGrassNoCredit for not mulching
MaizeGrassland to croplandCredit for not mulching, Soil carbon (reduced)
CroplandGrassCropland to grasslandSoil carbon (increased)
MaizeNo-
Table 2. Investigated maize and grass production systems with crop yields and inputs in different yield classes in Brandenburg and methane yields according to [19] (yield class I: high yielding zone; yield class II: average yielding zone; yield class III: low yielding zone).
MaizeGrassland
Yield classIIIIIIIIIIIIIIII
No. of cuts a 44322
Unit
Crop yieldDM b (Mg/ha) 10.9210.018.657.655.955.954.254.25
Methane yield(l kg/ODM c) 338338338329329307239265
N FertilizerN (kg/ha) 162149128143139104060
P FertilizerP (kg/ha) 3028242721211515
K FertilizerK (kg/ha) 158145125198154140100
CaCO3Ca (kg/ha) 32028022000000
Plant protectionAi d (kg/ha) 1.5131.5131.5131.5130.290.290.290.17
Fuel use(L/ha) 65.761.155.582.278.363.142.943.8
a Only for grassland systems; b DM: dry matter; c ODM: organic dry matter; d Ai: active ingredient.
Table 3. Acreage needed and mean distance of field to biogas plant according to different crop yield classes and methane yields of the feedstock (electric energy 4.2 MWh/year).
CropYield ClassNo. of Cuts (Grassland)Acreage (ha)Mean Distance (km)
MaizeI 2774.2
II 3034.4
III 3504.7
GrasslandI44305.2
II45535.9
II35916.1
II210668.2
III29607.8
Table 4. Greenhouse gas (GHG) emissions due manufacturing and supply of inputs.
ParameterUnitGHG EmissionsSource
Nitrogen fertilizer: calcium ammonium nitrate kg CO2eq/kg fertilizer1.68[25]
Phosphate fertilizer: triple super phosphatekg CO2eq/kg fertilizer0.69[26]
Potassium fertilizerkg CO2eq/kg K2O0.67[27]
Calcium fertilizerkg CO2eq/kg CaO0.97[27]
Pesticideskg CO2eq/kg5.38[28]
Fuelskg CO2eq/L2.90[28]
Manufacturing and repairing the machines akg CO2eq/kg of machinery8.00[29,30]
Plastic film for bunker silokg CO2eq/kg film2.26[31]
Maize seeds bkg CO2eq/kg0.55[19,28], own calculations
Grass seeds bkg CO2eq/kg1.30[19,28], own calculations
a The GHG emissions due to machinery use was calculated based on its expected service life during agricultural production; b Sowing rates amount to 32 kg/ha for maize, 10 kg/ha for grassland with three or four cuts per year and 5 kg/ha for grassland with only two cuts per year for the conditions in Brandenburg.
Table 5. Distribution functions and parameters for the Monte Carlo simulation.
VariableDistribution FunctionParametersSource
Crop yieldTriangleDefault (See Table 3: Crop yield), Min 90%, Max 110%[6,32]
Methane yieldTriangleDefault (See Table 3: Methane yield), Min 90%, Max 110%[6,32]
Methane leakageTriangleDefault 1%, Min 0%, Max 2%[11]
Power consumption of the biogas plant (% of gross electric energy provided by CHP)TriangleDefault 8%, Min 5%, Max 12%[11]
Electric efficiency of the CHPTriangleDefault 38%, Min 32%, Max 40%[11]
N2O-N emission factor from all N inputs (EFN2O)Log TriangleDefault 1%, Min 0.3%, Max 3%[24]
N2O-N emission factor from N volatilization and re-deposition (EFN2O_indirect_I)Log TriangleDefault 1%, Min 0.2%, Max 5%[24]
N2O-N emission factor from leaching or runoff (EFN2O_indirect_II)Log TriangleDefault 0.75%, Min 0.05%, Max 2.5%[24]
N losses by leaching/runoff (FRACLeach)Log TriangleDefault 30%, Min 10%, Max 80%[24]
Volatilization from synthetic fertilizer (NH3-N/Fertilizer-N; FRACGasF)Log TriangleDefault 10%, Min 3%, Max 30%[24]
Volatilization from digestate (NH3-N/NH4-N; FRACGasD)Log TriangleDefault 30%, Min 4%, Max 39%[33]
LUC Initial stock (Grassland)NormalMean 46.2, Standard deviation 20.7[17]
LUC Initial stock (Cropland)NormalMean 115, Standard deviation 66.3[17]
SOC change rate after LUC (Grassland to Cropland)NormalMean −36, Standard deviation 11[17]
SOC change rate after LUC (Cropland to Grassland)NormalMean 40, Standard deviation 4.6[17]
CHP combined heat and power plant, LUC land-use change, SOC soil organic change.
Table 6. Regression coefficiencts of uncertainty variables from stepwise multivariate regression analysis for different maize and grass production systems.
VariableMaize I on Crop-LandMaize I on Grass-LandMaize III on Crop-LandMaize III on Grass-LandGrass I, 4 Cuts, on Crop-Land Grass I, 4 Cuts, on Grass-Land Grass II, Low Intensity on Crop-LandGrass II, Low Intensity on Grass-Land
r² = 0.93r² = 0.99r² = 0.93r² = 0.93r² = 0.97r² = 0.92r² = 0.97r² = 0.93
Crop yield−0.147−0.095−0.140−0.0730.031−0.107−0.085−0.067
Methane yield−0.161−0.097−0.156−0.0790.023−0.120−0.0680.083
Methane leakage0.3460.0730.3410.0530.1030.270−0.041−0.453
Power consumption of the biogas plant0.0570.0350.0610.035−0.0070.0490.029−0.029
Electric efficiency−0.193−0.102−0.196−0.0870.012−0.151−0.0630.131
EFN2O0.6300.1190.6290.0840.2340.395−0.0740
EFN2O_indirect_I0.1130.0240.1100.0150.0590.144−0.014−0.155
EFN2O_indirect_II0.1600.0320.1580.0230.0790.189−0.036−0.351
FRACLeach0.4940.0950.4970.0650.2890.703−0.073−0.702
FRACGasF0.0290.0050.02300.0080.0200.0040
FRACGasD0.2180.0420.2130.0280.1400.337−0.025−0.242
LUC Initial stockn/a0.955n/a0.839−0.864n/a0.931n/a
SOC change rate after dLUCn/a−0.104n/a−0.449−0.221n/a0.283n/a
EFN2O: N2O-N emission factor from all N inputs; EFN2O_indirect_I: N2O-N emission factor from N volatilization and redeposition; EFN2O_indirect_II: N2O-N emission factor from leaching or runoff; FRACLeach: N losses by leaching/runoff; FRACGasF: Volatilization for synthetic fertilizer; FRACGasD: Volatilization from digestate (NH3-N/NH4-N); LUC Initial stock: Initial carbon stock before land-use change; SOC: Soil organic carbon; dLUC: Direct land-use change, variables with highest three regression coefficients in italics.
Table 7. GHG mitigation potential (kg CO2eq/ha) of different feedstock with reference to natural gas, energy mix and brown coal (numbers in intalics indicate cropping option with highest mitigation potential).
CropYield ClassNo. of CutsNatural GasEnergy MixBrown Coal
On Arable LandOn Grass-LandOn Arable LandOn Grass-LandOn Arable LandOn Grass-Land
MaizeI 1993−53684074−328710,0272666
II 1827−55343735−362691921830
III 1596−57653243−41187956595
GrasslandI4418710665530240993716250
II435304094574145375624441
II336715504648152774434322
(low intensity)II239788574520139960692947
III235834624184106359052784

