Article

Understanding Grassland Degradation and Restoration from the Perspective of Ecosystem Services: A Case Study of the Xilin River Basin in Inner Mongolia, China

1
College of Life Sciences, Inner Mongolia University, Hohhot 010021, China
2
Sino-US Center for Conservation, Energy, and Sustainability Science, Inner Mongolia University, Hohhot 010021, China
3
Department of Geography and Planning, University at Albany, State University of New York, Albany, NY 12222, USA
4
College of Environment and Resources, Dalian Nationalities University, Dalian 116600, China
*
Author to whom correspondence should be addressed.
Sustainability 2016, 8(7), 594; https://doi.org/10.3390/su8070594
Submission received: 25 April 2016 / Revised: 6 June 2016 / Accepted: 15 June 2016 / Published: 24 June 2016
(This article belongs to the Section Environmental Sustainability and Applications)

Abstract

:
Ecosystem services (ESs) and their transformations in northern China play a crucial role in regional sustainability. During the past several decades, grassland degradation has become one of the most important ecological and economic issues in this region. Therefore, understanding the impacts of grassland degradation and restoration on ESs is essential for maintaining ecological resilience and social security of Northern China. Our objective was to explore the relationship between ESs and grassland changes induced by vegetation succession in the Xilin River Basin, Inner Mongolia, China. Using vegetation maps derived from remotely sensed imagery collected in 1983, 1989, 2000, and 2011, we calculated the degree of grassland degradation using the Grassland Degradation Index (GDI). Aboveground biomass (AGB), soil conservation (SC), and water retention (WR) were also estimated to assess ESs for each year. Our results show that: (1) GDI increased during 1983–2000 and decreased during 2000–2011 indicating that after experiencing two decades of severe degradation the grassland has been restored since 2000. (2) AGB and SC were significantly negatively correlated with GDI. Changes in grassland conditions significantly affected WR and SC with both declining during 1983–2000 and increasing afterwards. The increase of SC, however, was slow compared to AGB and WR, which is an indication of time lag in soil restoration. (3) Grasslands in the middle and lower reaches experienced worse degradation than in the upper reaches. (4) AGB and SC exhibited a synergy, while trade-offs existed between AGB and WR and SC and WR. In summary, significant changes in grassland ecosystems in the Xilin River Basin over the past three decades affected the dynamics of ESs among which SC and WR require special attention in the future.

1. Introduction

Ecosystem services (ESs) are the benefits people obtain from ecosystems [1]. Not only do they provide a multitude of goods and services, including clean air, fresh water, food, fuel, and other services, but they also play a critical role in maintaining and improving human well-being, which is essential for regional landscape sustainability [1,2,3]. However, over the past 50 years, approximately 60% of the studied ESs have been degraded due to increases in global population and economic growth, especially in drylands [1]. To provide a better understanding of changes of degrading ecosystems and the potential for ecosystem restoration, ESs has been identified as an ecological concept important for policymakers and practitioners in recent years.
Grasslands in China cover 41.7% of land area [4], with nearly 80% of them occurring in arid and semiarid regions [5]. During the past several decades, grassland degradation has reduced its ecosystem productivity and biodiversity and led to sandstorms and desertification making it a significant environmental problem of northern China [6,7]. Grassland degradation, the primary form of land desertification, is defined as the process of retrogressive succession of grassland ecosystems resulting from human activities (overgrazing, reclamation) and unfavorable natural conditions [6]. The attributes of grassland degradation include the decline of suitability of vegetation for multiple uses (grazing, biodiversity conservation and recreation), the increase of proportion of less palatable plants, the increase of erodability of topsoil, and the decrease of root-zone moisture holding capacity [8,9]. Many studies have examined grassland degradation at local scales in Inner Mongolia, China [10,11], but monitoring grassland degradation with sufficient detail at the regional scale has been lacking [8]. Ground observations of grassland degradation allowed researchers to identify five levels of degradation: non-degraded, lightly degraded, moderately degraded, severely degraded, and extremely degraded [6,12,13]. These studies contributed to the progress of understanding of grassland successions and the practice of grassland restoration. At the same time, modern remote sensing and GIS have become critical tools of monitoring grassland degradation [14]. Grassland degradation can be effectively mapped and monitored with the help of these technologies [15,16,17]. Yet, most studies are still based on the Normalized Difference Vegetation Index (NDVI) from satellite data [18,19]. Such NDVI data are largely inadequate for understanding changes in structure and composition, as well as other complex ecological processes in degrading grasslands. As a remedy to this problem, the grassland degradation index (GDI) was developed to quantify the degree of degradation and changes of spatiotemporal patterns. The index allows assessing the condition and spatial extent of steppe ecosystems [8,20]. Grassland degradation is a complex process that integrates various aspects, including changes in soil conditions, biodiversity, productivity, and socio-economics [21]. Therefore, comprehensive assessment of grassland degradation and restoration is increasingly important.
ESs provide a new perspective for better understanding the process of grassland degradation and restoration. They have been categorized into four types: provisioning, regulating, cultural, and supporting services [1]. The early research on ESs was mainly focused on defining important concepts and terminology [2,22] and service valuation [23,24]. The Millennium Ecosystem Assessment (MA) by the United Nations has increased the worldwide popularity of ESs. With the rapidly growing research on ESs, more attention has been paid to quantitative modeling and mapping of ESs [25,26,27], analyses of trade-offs and synergies between multiple ESs [28,29,30], integration of ESs into conservation, restoration, and sustainability science [3,31,32]. It is therefore important to adapt the ESs concept to the understanding of grassland degradation and restoration [32,33]. To date, research on how ESs respond to grassland degradation and restoration efforts have been lacking in arid and semiarid regions [34]. Degradation of grasslands in arid and semiarid regions has accelerated in the recent decades, which requires spatially explicit impact assessment and ESs restoration strategies. This was our motivation exploring the relationship between ESs and grassland changes induced by vegetation succession.
In this case study, we selected Xilin River Basin in Inner Mongolia, China, which is one of the most representative typical grasslands of the region. The following problems have been investigated: (1) quantification of spatiotemporal patterns of grassland degradation and ESs of the Xilin River Basin during 1983–2011; (2) analysis of changes and correlations between grassland degradation and ESs; (3) discuss the potential trade-offs and synergies among ESs. This study will provide valuable scientific information for the assessment of grassland restoration and regional landscape sustainability in arid and semiarid regions.

2. Materials and Methods
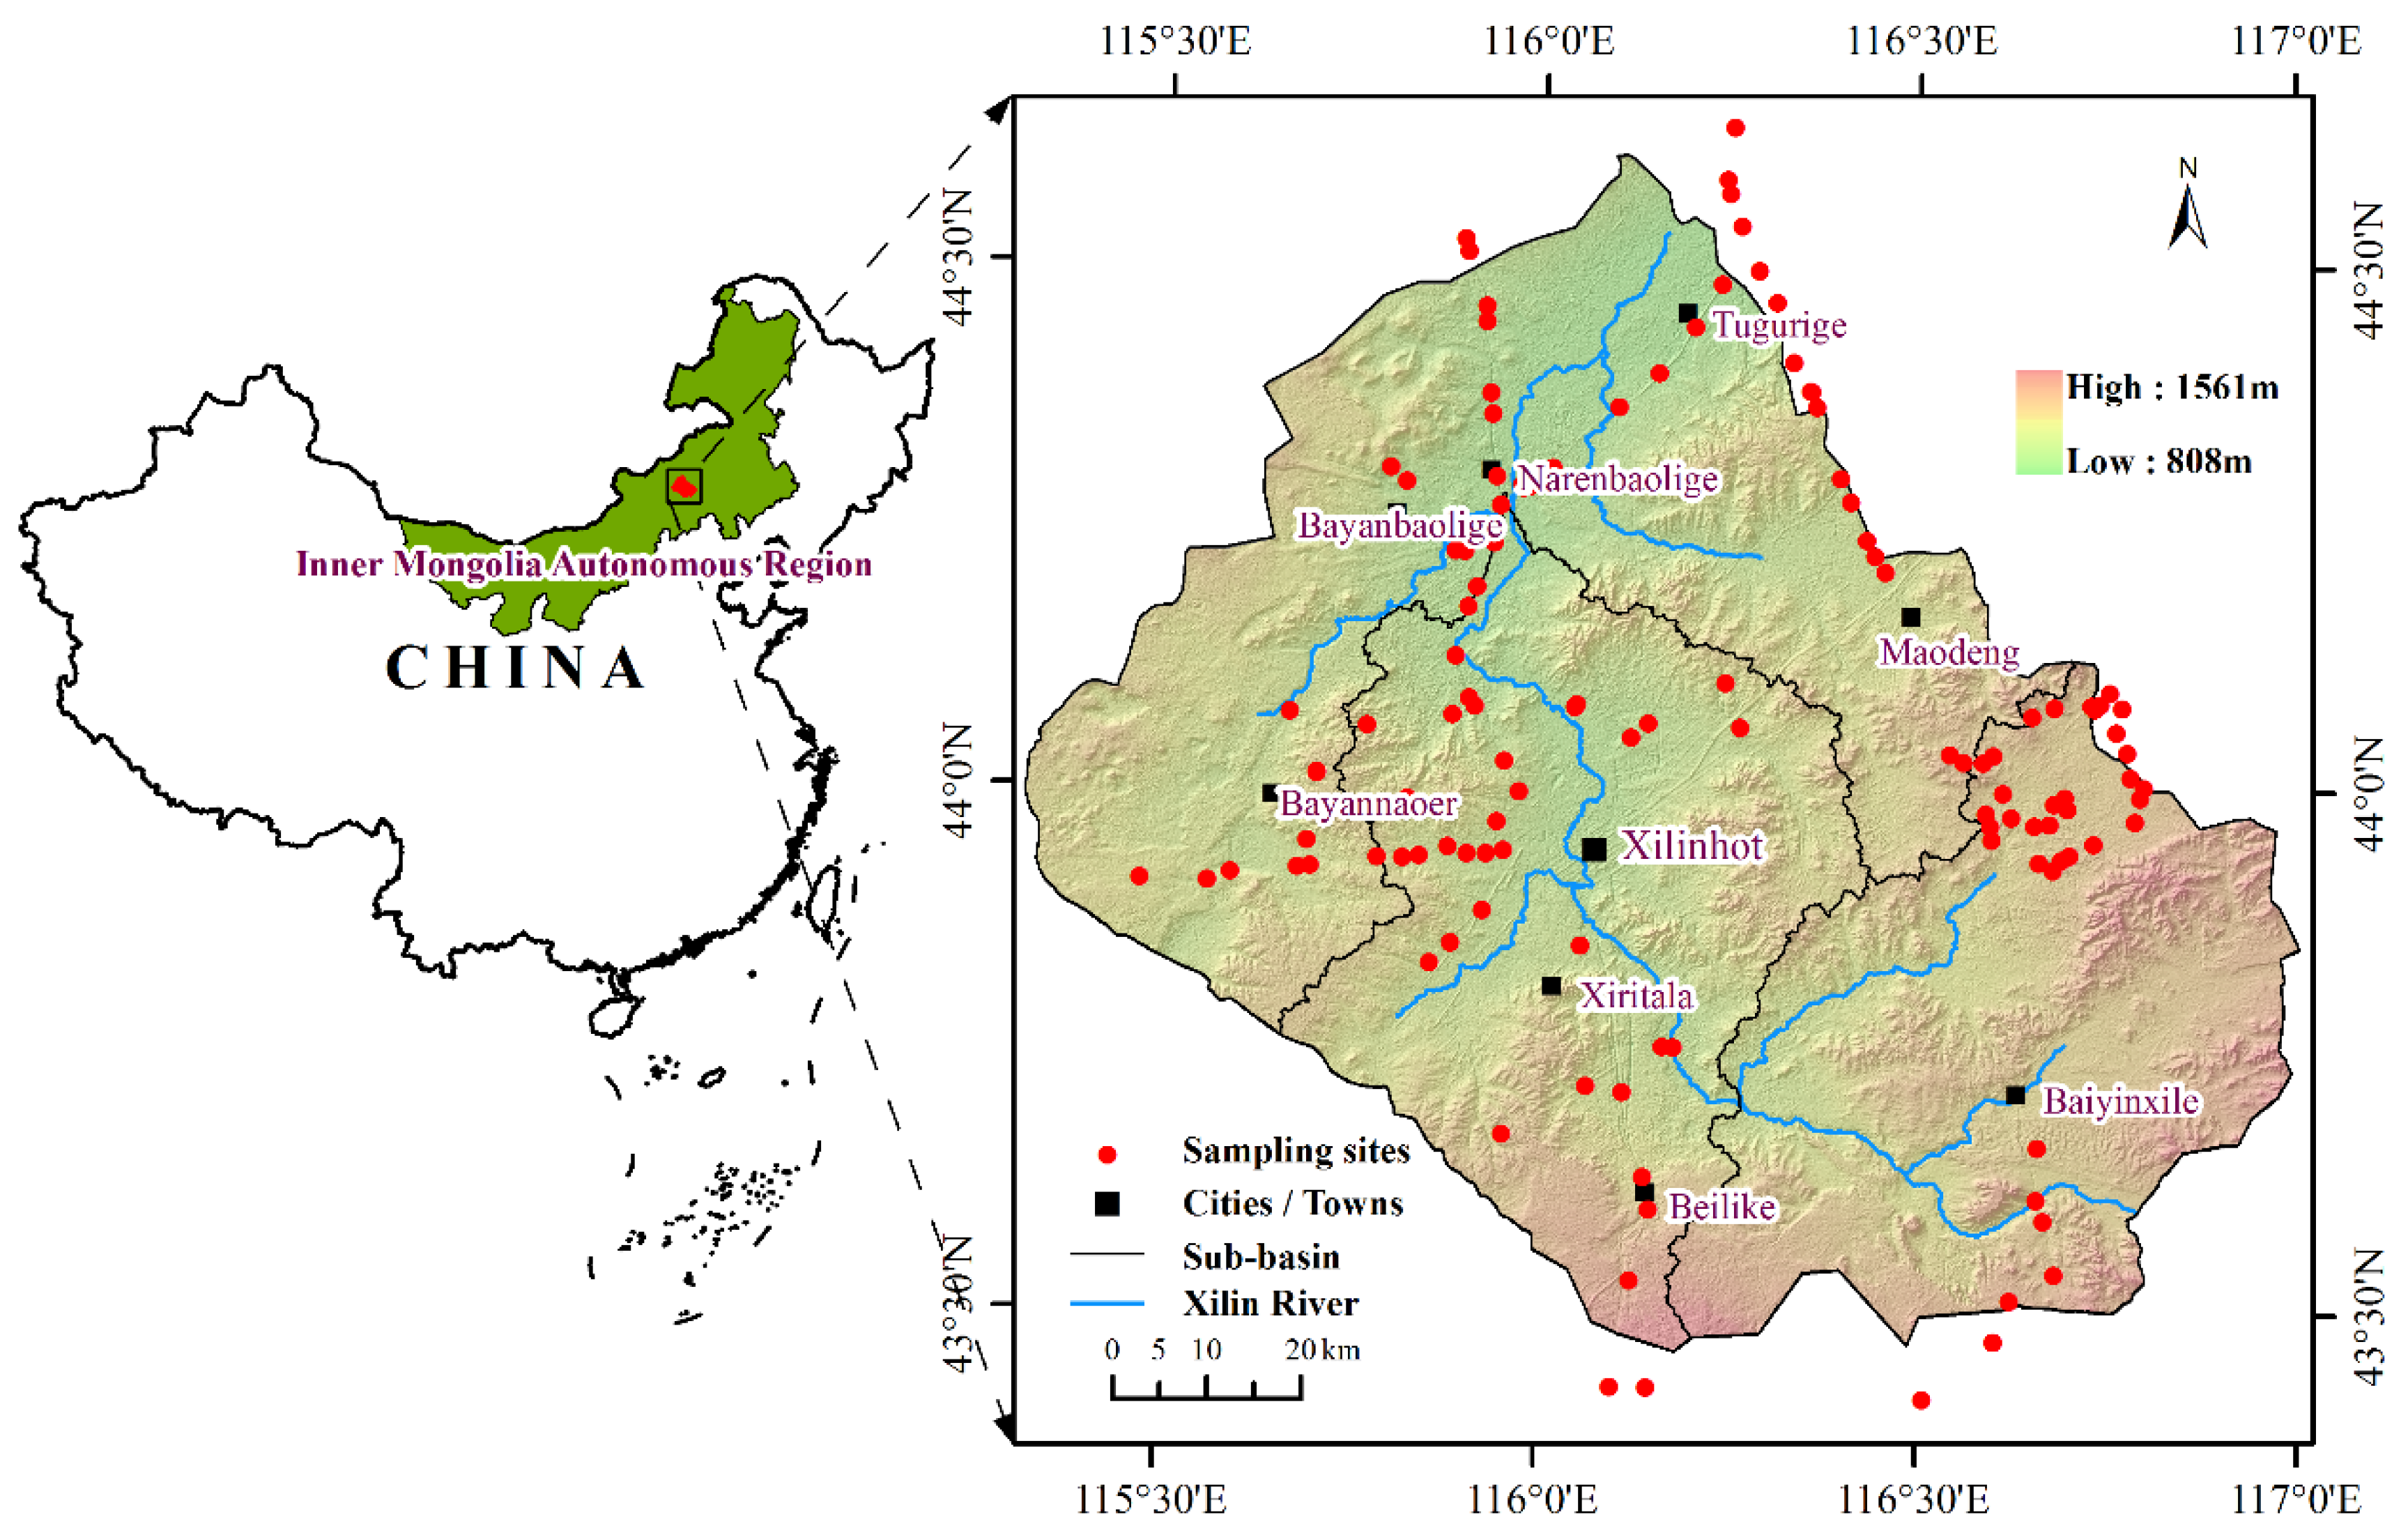
2.1. Study Area

The Xilin River Basin (43°26′N–44°39′N, 115°32′E–117°12′E) is located in central Inner Mongolia Autonomous Region, China (Figure 1) and occupies 9786 km2. From southeast to northwest, the topography gradually decreases from about 1500 m to 902 m above sea level. The temperate semi-arid continental climate of the area is characterized by the annual temperature of 1 °C–4 °C. Annual precipitation changes from 350 mm in the southeast to 250 mm in the northwest and occurs mainly between June and August. The weather is cold and dry in the winter but warm and wet in the summer [35]. Dominant soil types are chestnut, chernozem, and aeolian [36]. The area has diverse plant communities found throughout much of the steppe region of northern China [35]. Most common steppe species are Stipa grandis, Stipa Krylovii, and Leymus chinensis. Being one of the Biosphere Reserves by the Man and Biosphere Programme Xilin River Basin is representative of the vast steppe of northern China (Figure 1) [35].

2.2. Data Collection and Processing

Data used for calculating GDI in the basin were based on 1983, 1989, 2000, and 2011 grassland vegetation maps produced from Landsat TM and MSS images. One set of Landsat MSS images and three sets of Landsat TM images (path 124/row 29, path 124/row 30, cloud cover <10%) were acquired on 12 July 1983, 5 August 1989, 18 July 2000, and 2 August 2011, respectively. All images were downloaded from the United States Geological Survey [37] and georeferenced and atmospherically corrected using ENVI 4.7 software [38] using 1:50,000 topographic maps as the reference. Vegetation classifications were performed using TWINSPAN (Two-way Indicator Species Analysis) software [39] derived from the 120 field sites of vegetation surveys during 2009–2011. The layers with vegetation patches were generated using eCongnition 8.0 software [40] with multi-resolution segmentation approach (set scale parameter to 90) based on these Landsat images, then the vegetation maps were interpreted by ArcGIS 10.0 software [41] and expert knowledge derived from published vegetation maps and field surveys [42]. Five vegetation subtypes (meadow steppe, typical steppe, sand vegetation, meadow and others), 17 formations and 22 association groups were mapped (Table 1) [42,43]. We calculated the Normalized Difference Vegetation Index (NDVI) from Landsat TM and MSS images to derived maps of vegetation cover. The National Oceanic and Atmospheric Administration/Advanced Very High Resolution Radiometer (NOAA/AVHRR) NDVI (1981–1999) and Moderate-Resolution Imaging Spectroradiometer (MODIS) NDVI product (MOD13A2, 2000–2015) in growing season (April–October) were downloaded from the Cold and Arid Regions Sciences Data Center [44] and the NASA [45], respectively. In addition, ASTER Global Digital Elevation Model (ASTER GDEM) data at 30×30 m resolution were downloaded from the Japan Space Systems [46]. Meteorological data, including precipitation and temperature, were obtained from the Inner Mongolia Meteorological Bureau. Lastly, maps of soil type, soil texture, and soil depth, were provided by the Inner Mongolia Grassland Ecosystem Research Station, Chinese Academy of Sciences.

2.3. Methods

2.3.1. Grassland Degradation Index (GDI)

The GDI, developed to detect steppe communities with different degrees of degradation [8], is calculated as follow:
GDI = i = 1 3 W i A i A k , i =   0 ,   1 ,   2 ,   3
where i denotes 4 levels of degradation (undegraded and slightly, moderately, and heavily degraded, respectively) (Table 1), Wi is weights of grassland degradation rank i, Ai is areas of the degraded grassland of rank i, and Ak is the spatial extent of the geographic areas under consideration. Wi is equal to 0, 1, 1.5 and 2.0 for undegraded, slightly degraded, moderately degraded, and heavily degraded steppes, respectively. Ai is calculated from the relationship between vegetation classifications and degradation rankings (Table 1) based on the grassland vegetation maps in 1983, 1989, 2000, and 2011.

2.3.2. Quantification of Grassland Ecosystem Services (ESs)

Aboveground Biomass (AGB)

The primary function of the ecosystem is the provisioning of raw materials [47], so biomass can be used as a measure for raw materials of grassland ecosystems. To assess AGB we adopted the regression model (R2 = 0.47, p < 0.001) developed for our study area using remote sensing and field data [48]:
AGB = 1101.711 NDVI + 454.638
where NDVI is the Normalized Difference Vegetation Index, calculated as follows:
NDVI = NIR RED NIR + RED
where NIR and RED correspond to spectral reflectance in the near-infrared band and the red band, respectively.

Soil Conservation (SC)

SC is calculated as the difference between potential and actual soil losses computed using the Revised Universal Soil Loss Equation (RUSLE) [49]:
A p = R K L S
where Ap is the potential soil loss (t·ha−1·yr−1), R is the rainfall erosivity factor (MJ·mm·ha−1·h−1·yr−1), K is the soil erodibility factor (t·ha·h·ha−1·MJ−1·mm−1), LS is the topographic factor.
A r = R K L S C P
where Ar is the actual soil loss (t·ha−1·yr−1), C is the vegetation cover factor, and P is the conservation practices factor.
Soil conservation (Ac) can be estimated as follows:
A c = A P A r = R K L S ( 1 C P )

Water Retention (WR)

We used the water retention model to assess WR function of grassland ecosystems. The model is based on the water balance principle, according to which the annual water yield under different conditions is used as the evaluation indicator for ecosystem water retention function [50]. It is calculated as follows [51]:
WR = Min ( 1 , 249 Velocity ) Min ( 1 , 0 . 3 TI ) Min ( 1 , K sat 300 ) WY
where Velocity is the flow coefficient, TI is the topographic index, Ksat is the soil saturated hydraulic conductivity, and WY is the water yield, which is defined as the amount of water that runs off the landscape (precipitation minus storage and evapotranspiration losses) in the Integrated Valuation of Ecosystem Services and Tradeoffs (InVEST) program [52]. The formula for the water yield model is based on the Budyko curve and the annual average precipitation [53]:
WY x j = ( 1 A E T x j P x ) P x
where WYxj is the annual water yield at pixel x of land cover type j, AETxj is the annual actual evapotranspiration for pixel x with land cover j, Px is the annual precipitation for pixel x, AETxj/Px is based on the expression of the Budyko curve [54] given as:
A E T x j P x = 1 + P E T x j P x [ 1 + ( P E T x j P x ) ω ] 1 / ω
where PETxj is the potential evapotranspiration for pixel x with land cover j, ω is a non-physical parameter that characterizes the natural climatic-soil properties, which is defined as:
ω x = Z A W C x P x + 1.25
where AWCx is the volumetric (mm) plant available water content at pixel x, which is estimated using soil texture, soil depth, and root depth of vegetation [52,55], Z is the seasonal rainfall factor known as Zhang coefficient, which represents annual precipitation distribution and can be any real number in the range from 1 to 30. In our study area, we set Z to 7, according to the InVEST User’s Guide [52].

2.3.3. Correlations and Trade-offs Analysis

Correlation analysis was used to estimate the influence of grassland degradation on the ESs. Pearson correlation coefficients between GDI and individual grassland ESs, including their variations, were calculated using ArcGIS 10.0 [41] and SPSS 19 [56] based on a random sample of 1000 points across the basin.
Trade-offs and synergies are used to describe interactions between ESs. Trade-offs occur when one service increases in value and another one decreases, whereas synergies describe situations in which both services either increase or decrease [57]. These interactions could be identified by the correlation coefficients of ESs and their changes [58,59], where negative represents the trade-offs and positive represents the synergies.

3. Results

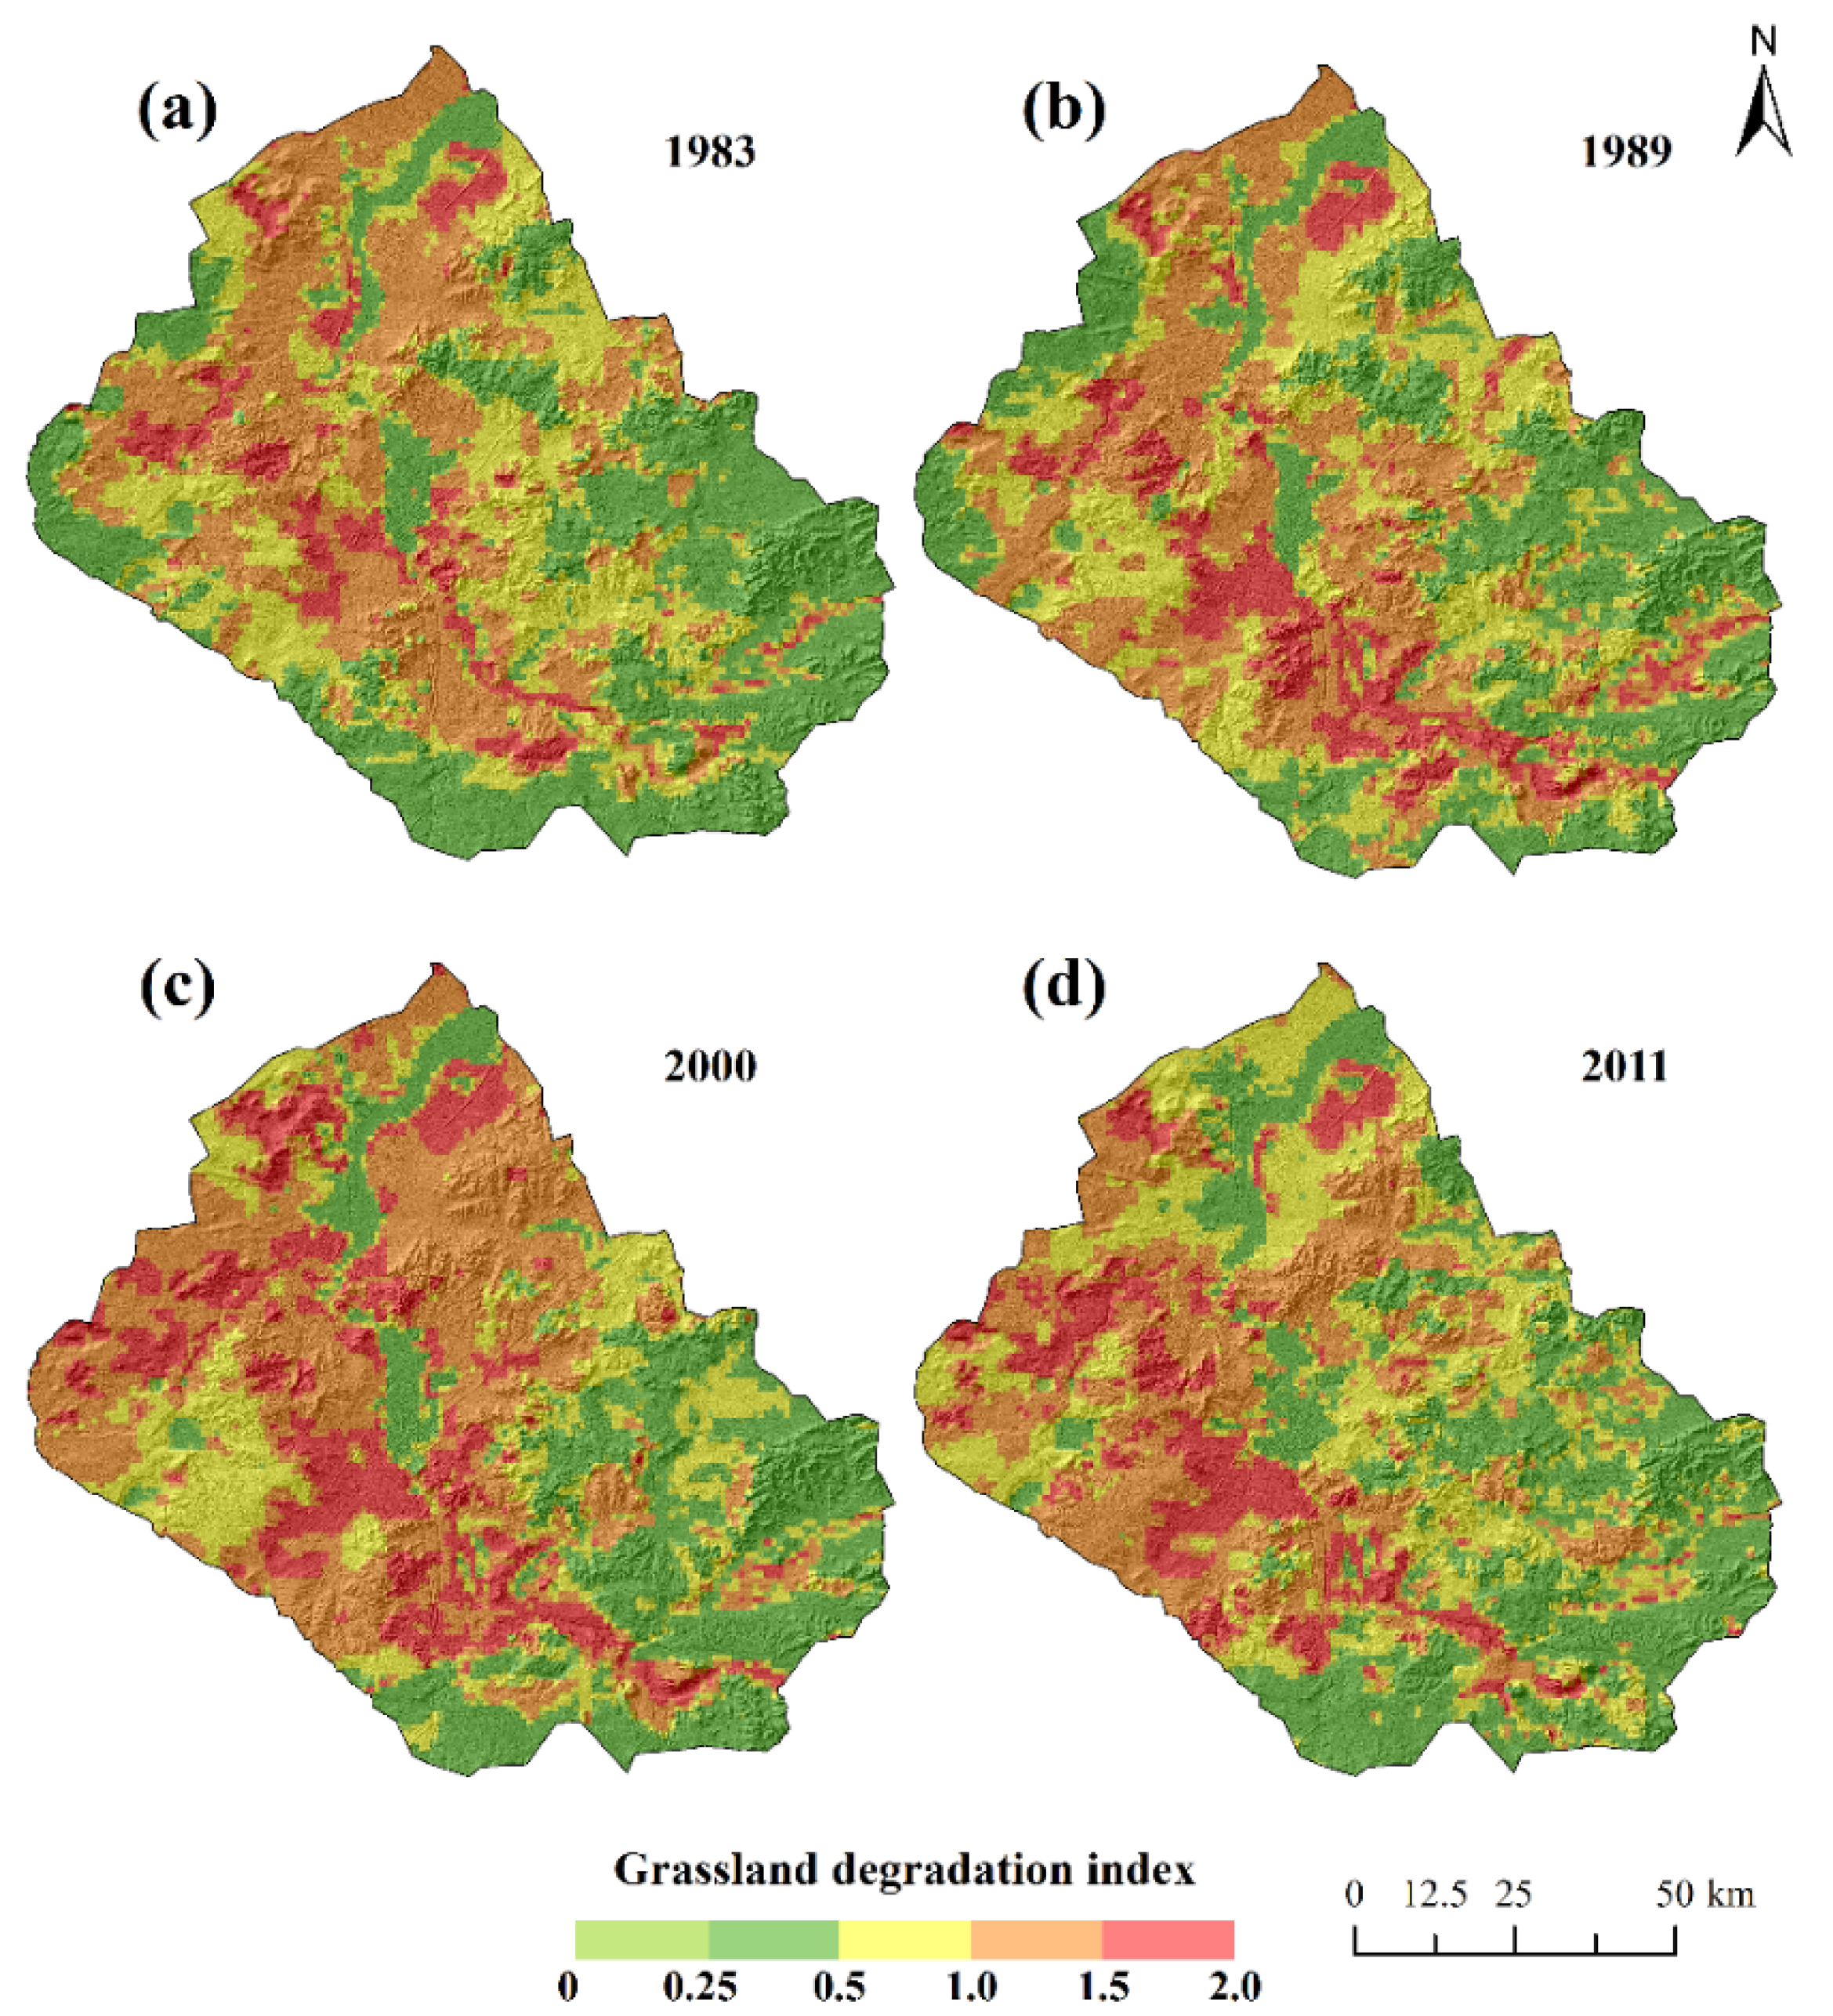
3.1. Spatiotemporal Patterns of GDI

During 1983–2011 GDI exhibited the spatial gradient of decreasing from southeast to northwest on both sides of the Xilin River (Figure 2). Mean GDI increased from 0.79 in 1983 to 0.99 in 2000, and then it decreased to 0.86 in 2011 (Figure 3a). GDI in the upper reaches was lower than in the lower parts of the basin. The increase of GDI in 2000 was mostly due to its dramatic increases in the middle and lower reaches (Figure 2 and Figure 3a). While GDI decreased slightly in 2011 it was still higher than in 1983 (Figure 3a).

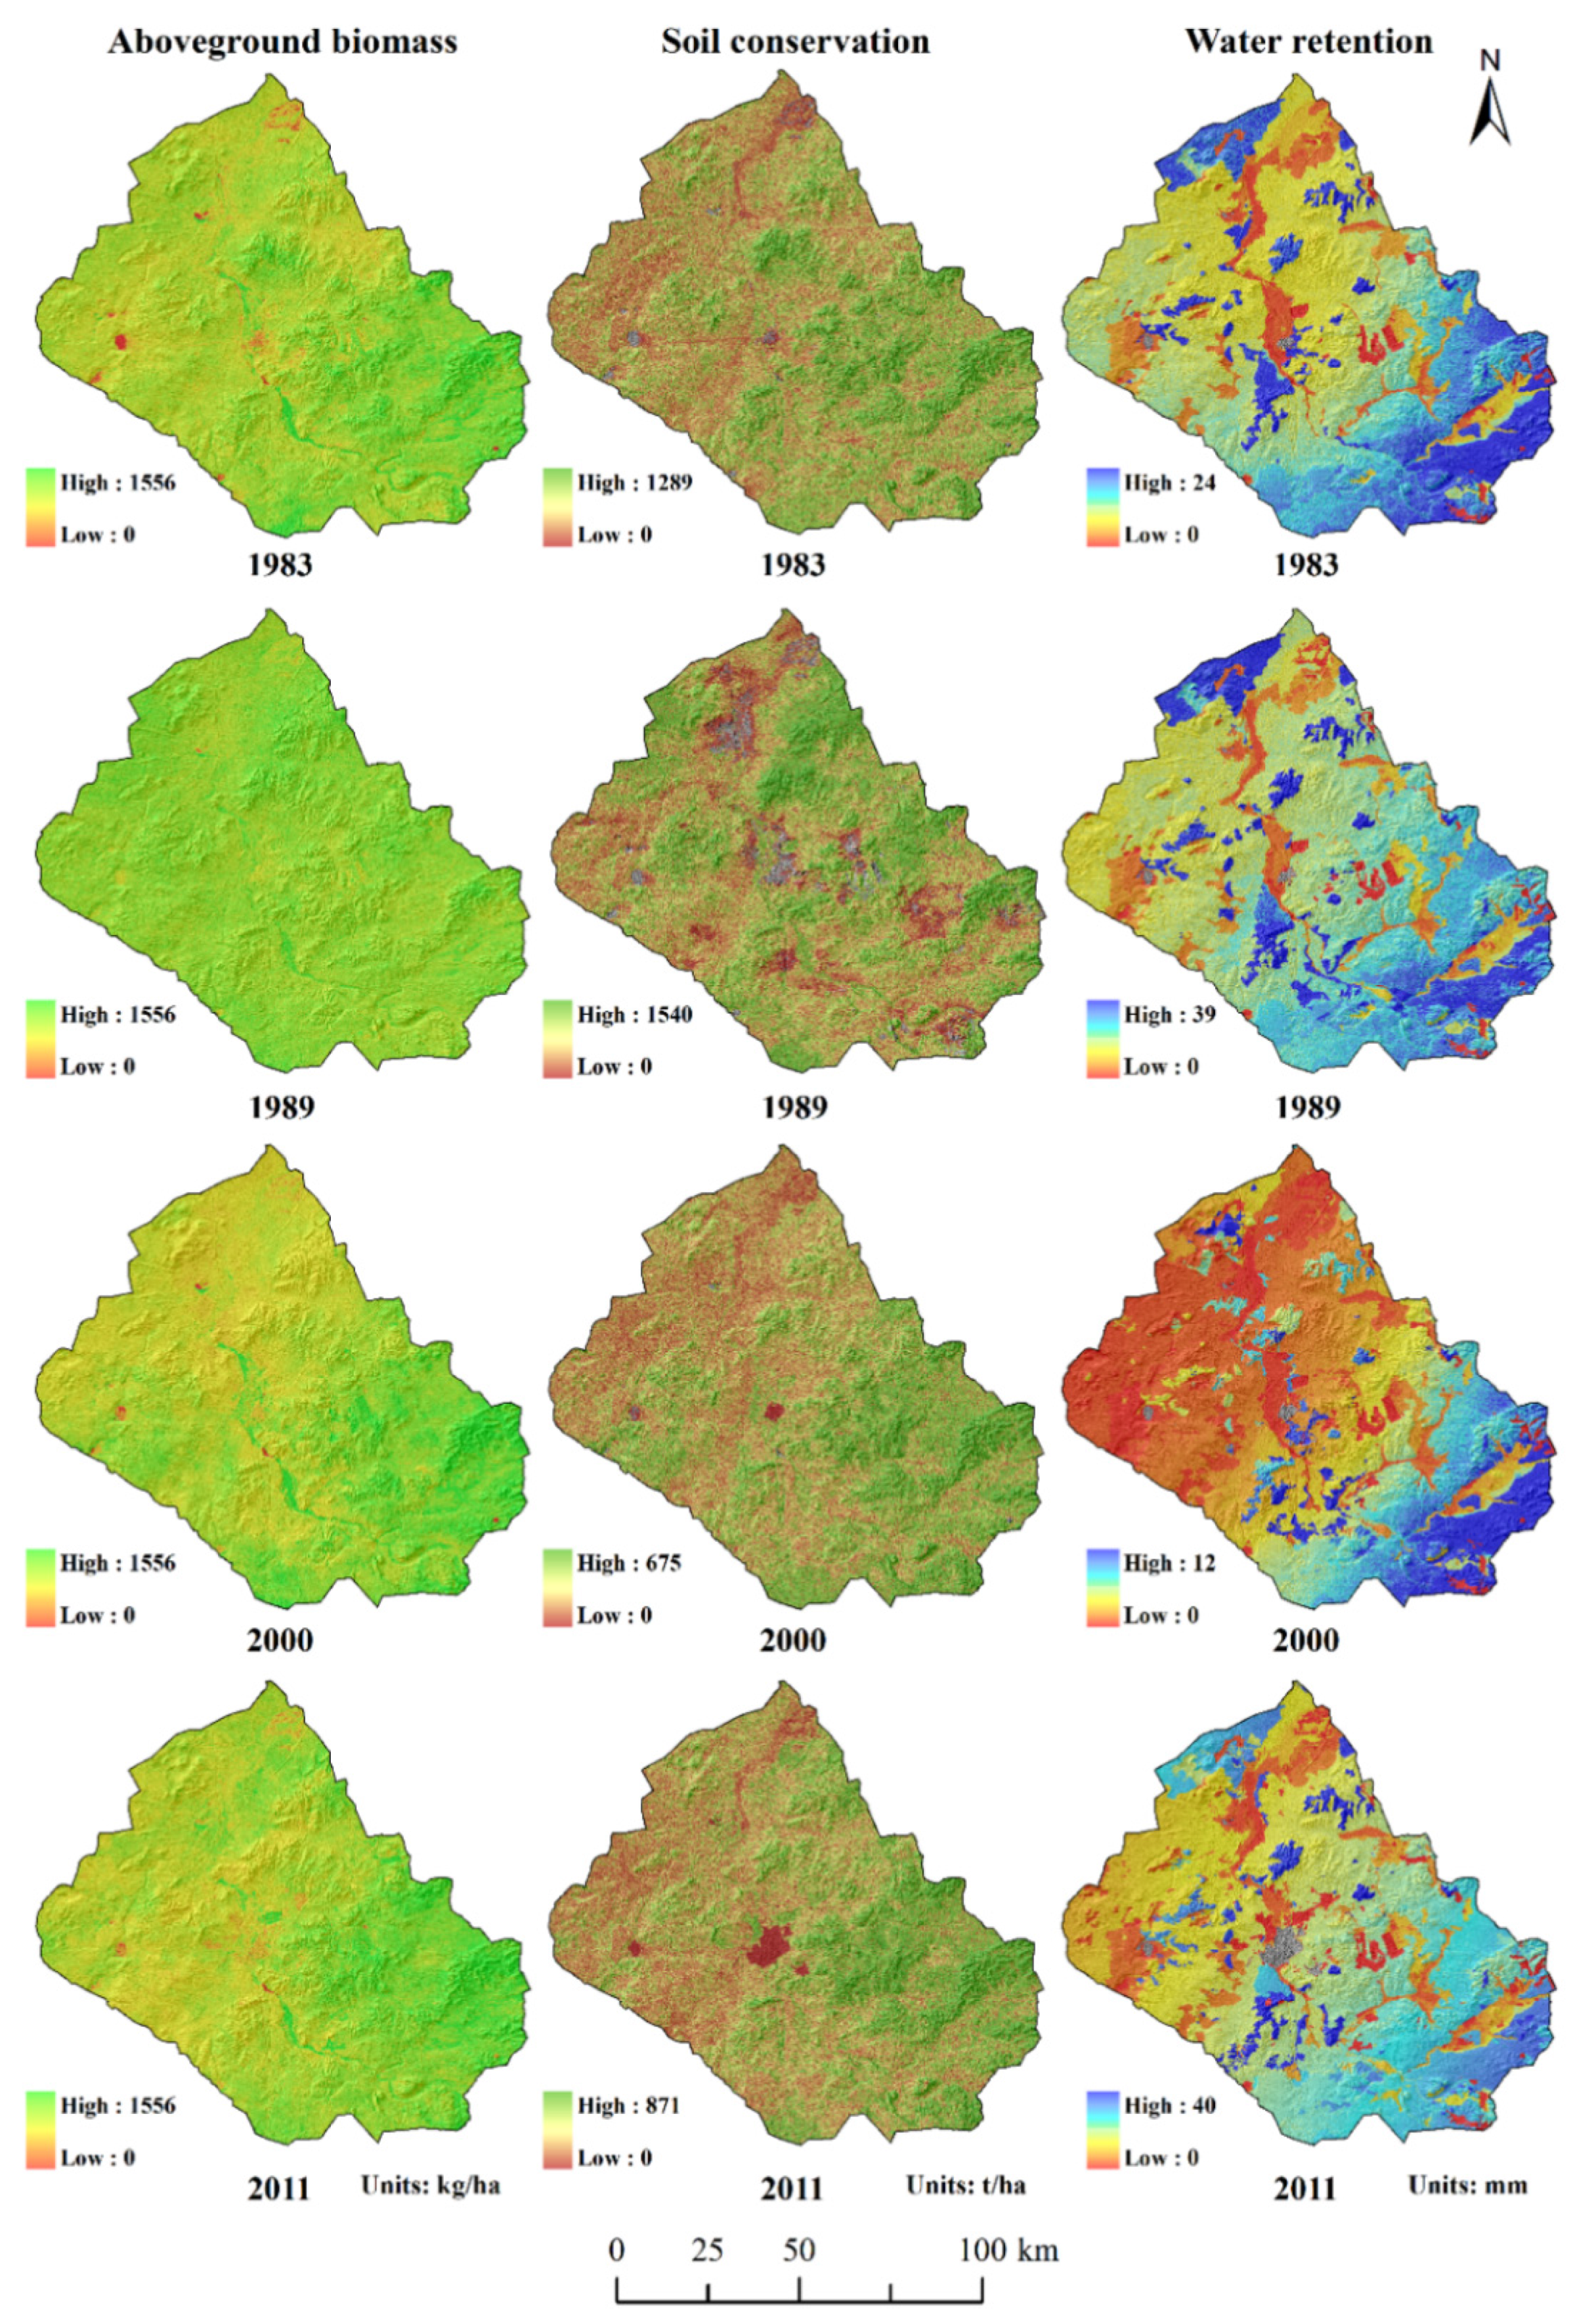
3.2. Spatiotemporal Patterns of Grassland ESs

3.2.1. Aboveground Biomass (AGB)

AGB generally decreases following the southeast-northwest spatial gradient (Figure 4). Its temporal dynamics generally mirrored that of the GDI by decreasing from about 707 kg/ha to just 581.37 kg/ha in 2000 and increasing to 775.06 kg/ha in 2011 (Figure 3b). Upper sub-basin had consistently higher AGB, while it was near equal in the middle and lower sub-basins, except in 2000. According to long-term satellite data biomass in the basin has been decreasing during 1981–2015 (Figure 5a,c and Figure 6a). However, a significant increasing trend can be seen starting from 2003 despite that precipitation started decreasing after 2008 (Figure 6). This is an indication of successful grassland restoration in recent years.

3.2.2. Soil Conservation (SC)

Spatial pattern of SC was very similar to AGB with low values in the northwest and high in the southeast (Figure 4). It decreased significantly between 1983 and 2000 and restored slightly in 2011 with the pattern being consistent across the three sub-basins (Figure 3c). The maximum amplitude of change in SC across space and time can reach 22 t/ha. Overall, SC decreased by 46.43%, from 18.50 t/ha in 1983 to 9.91 t/ha in 2011.

3.2.3. Water Retention (WR)

WR generally repeats the spatial pattern of AGB and SC by increasing from the northwest to the southeast (Figure 4). It did not show any trend by increasing from 4.43 mm in 1983 to 7.54 mm in 1989 and then decreasing sharply to 1.31 mm in 2000 and returning to 7 mm in 2011 (Figure 3d). The maximum temporal amplitude of change in WR across sub-basins can be 9 mm.

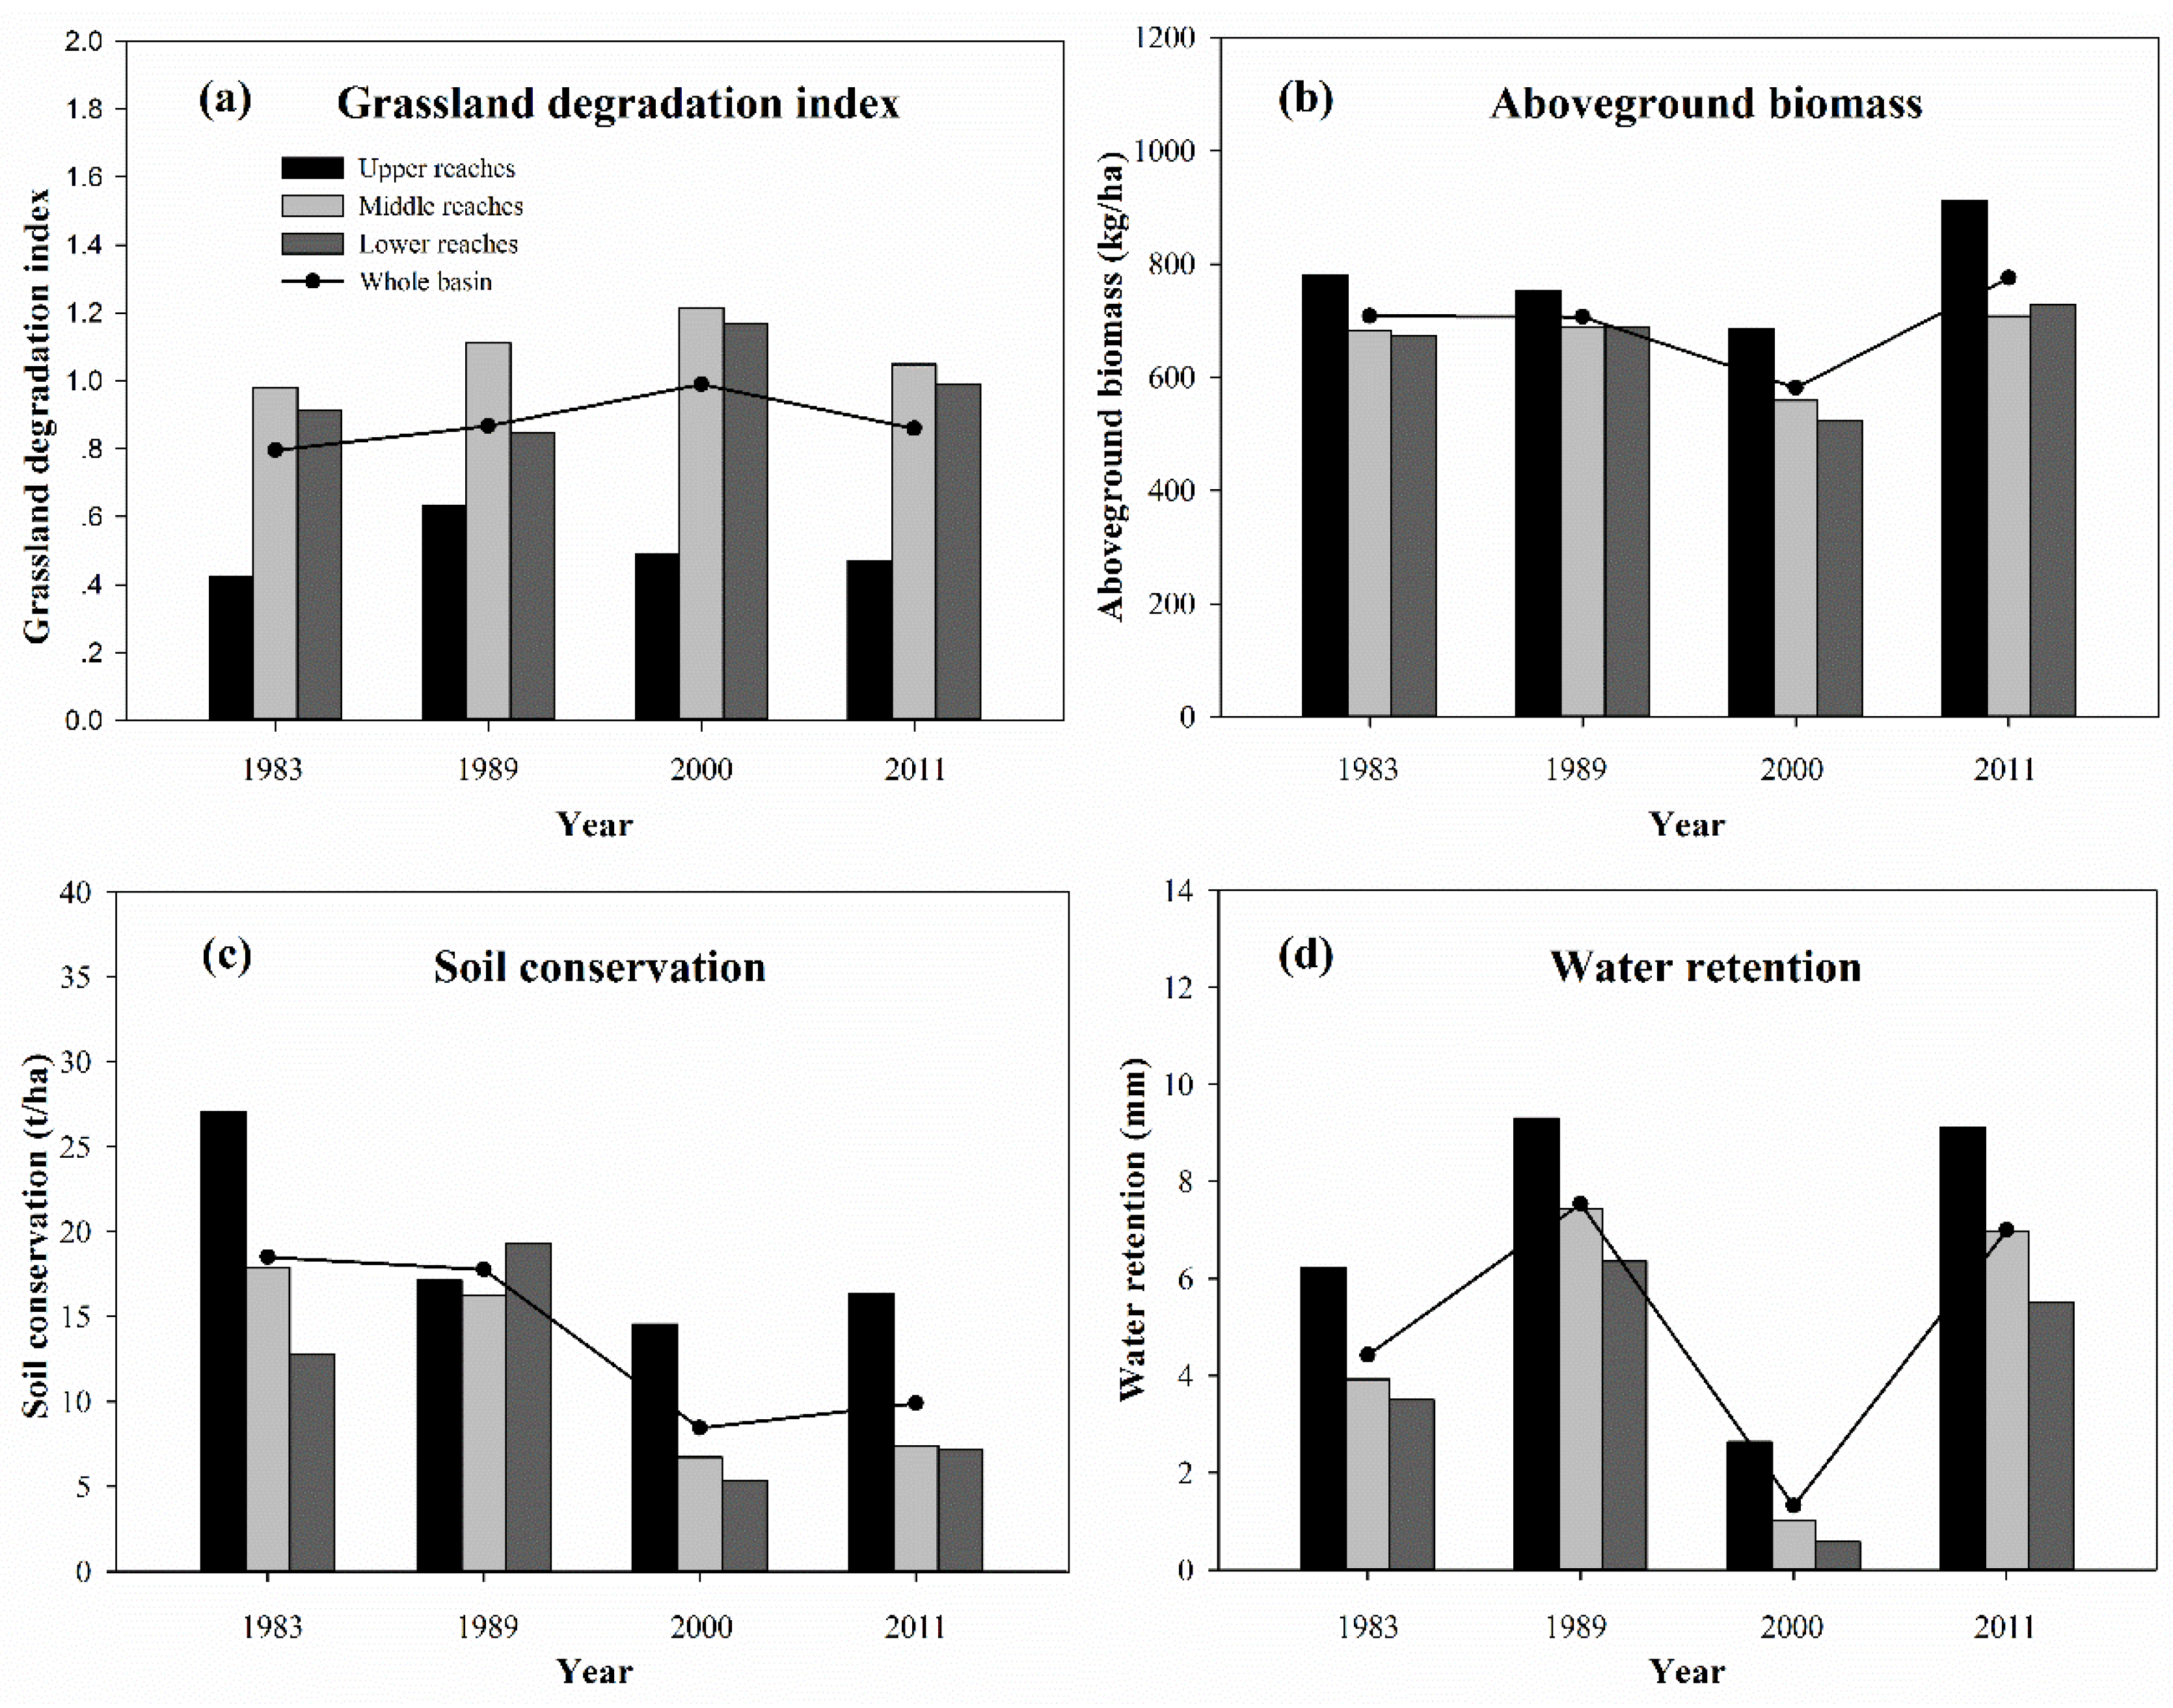
3.3. Grassland Degradation and Changes in ESs at the Sub-basin Level

GDI in all sub-basins first increased and then decreased during 1983–2011 (Table 2, Figure 3a). It was significantly higher in the middle and lower sub-basins. It peaked in the 1980s in the upper reaches and in the 1990s in the middle and lower sub-basins. This suggests degradation intensified first in the upper reaches and it was gradually picked up downstream in the next decade. This is further corroborated by the dynamics of the GDI rate of change (Table 2).
ESs in sub-basins decreased between 1983 and 2000 and then increased afterwards (Figure 3). The decrease was the fastest during 1989–2000. At the same time, the rate of change of ESs was high during this period with AGB, SC, and WR significantly decreasing (Table 2). During 2000–2011, ESs have largely restored. However, the increase of SC was quite slow compared to that of AGB and WR, which suggests a time lag in soil restoration. Overall, grassland in the middle and lower reaches experienced more severe degradation than in upper reaches.

3.4. Relationships Between Grassland Degradation and ESs

We found significant negative correlations between GDI and all grassland ESs (at 0.01 level) for individual years and between changes in GDI and AGB and SC (at 0.01 level). Correlations between changes in GDI and WR were positive but not significant. When ESs were compared with each other, AGB and SC, as well as their changes during the four time periods, all were positively correlated (at 0.01 level). AGB and SC were also positively correlated with WR while their changes were negative correlations with WR except for the period of 1989–2000 (Table 3). Our findings suggest a distinct synergy between AGB and SC, while AGB and SC exhibited trade-offs with WR (Table 3).

4. Discussion

4.1. Impacts of Grassland Degradation and Restoration on ESs

Our results show that grasslands in the Xilin River Basin experienced severe degradation during the 1980–90s, but they have been undergoing restoration since 2000. Degradation affected composition, structure, and ecosystem processes of grasslands, which diminished the provisioning and delivery of ESs. While precipitation has been found, the primary driver of spatial and temporal dynamics of biomass in grasslands of northern China [60,61,62], which is further confirmed by long-term satellite NDVI and precipitation data (Figure 6), changes in land use policies may also have played an important role. The slope trends of the relationship between AGB and year were calculated in pixel scale across the study areas during 1981–2015. The results show that AGB in the area exhibited a weak decreasing trend (Figure 5a,c and Figure 6a). AGB significantly declined across 23.0% of the study area and increased significantly nearly 20.6% across of the study area. AGB did not change significantly during 1981–2015 in 56.4% of the study area (Figure 5a,c). Although AGB in the area had a predominantly decreasing, although very weak trend, it changed to a significant increase after 2000 (Figure 5b,d and Figure 6a), which is largely attributed to the implementation of grassland restoration policies. AGB significantly increased across 6.1% of the study area and increased but not significantly nearly 81.7% across of the study area (Figure 5b,d). AGB increase with improving grassland conditions is supported by correlations between GDI and AGB (Table 3). Other recent studies of this region corroborate this finding by showing significant increases in AGB since 2000 [63,64].
Soil conditions are the critical resource for maintaining ESs in semi-arid environment of the Xilin River Basin. However, SC has declined significantly in the past 30 years. Currently, levels of soil degradation and erosion have become one of the most serious ecological problems of Northern China [65]. While soil is at the core of the structure and function of ecosystems and delivery of essential ESs, which maintain the food production, water regulation, and carbon storage services [66], grassland soil conservation in Northern China has been significantly lacking [43]. Conservation efforts in the Xilin River Basin increased since 2000, although they showed less dynamics compared to sufficiently improved AGB and WR. There is clearly a time lag in soil improvement, which suggests that SC should be considered a key indicator of grassland restoration.
WR is dependent upon vegetation cover. During the study periods, WR generally decreased, which can be attributed to changes in precipitation and evapotranspiration, the key factors determining the water supply of ecosystems according to the water balance principle [52]. The first factor reflects recent climate change in the area, and the second is directly linked to vegetation processes. During 1983–2011, annual precipitation decreased slightly in the area (Figure 6b). Meanwhile, annual potential evapotranspiration also decreased in the past 30 years [67]. Changes in WR should therefore be considered in the context of both climate change and human activities, primarily human-induced changes in vegetation pattern, which has significant repercussions on evapotranspiration [68]. Several previous studies showed that vegetation cover in Xilin River Basin has changed significantly in the last 30 years [42,69,70]. As a result, evapotranspiration rates decreased and WR capacity greatly reduced. We conclude that changes in vegetation patterns play a significant role in maintaining the water cycle and hydrological processes in the basin.

4.2. Relationships between Grassland ESs

Understanding the relationships between grassland ESs is helpful for developing grassland restoration strategies and ensuring environmental sustainability in arid and semiarid regions. Such relationships can also change with time and spatial scales. Studies have found that provisioning and regulating services always exhibit trade-offs at the regional scale, with growth in provisioning services leading to declines in regulating services [57,58,59,71]. However, our results demonstrate a synergy between provisioning (AGB) and regulating services (SC) (Table 3), which may be driven by overgrazing and other human activities. It means that changes in AGB and SC share the same driving forces. More specifically, over the past three decades, land managers have maximized the consumption of provisioning services (fodder, meat, and milk) provided by grasslands in the basin with declines in AGB being an inevitable outcome. The decrease caused the reduction of regulating services (SC). The rational use of provisioning services is likely to slow the degradation and enhance regulating services. Our study found significant correlation between changes in ESs suggesting trade-offs between AGB and WR and between SC and WR (Table 3) and confirming the dynamic nature of relationships between the ESs found previously [72]. We believe changes in vegetation cover due to successions have played an important role in these relationships. It is important to consider grassland ES trade-offs in management and restoration strategies in the future.

4.3. Drivers of Grassland Degradation

Overgrazing and human population growth are the most important driving factors of grassland degradation in the Xilin River Basin. Such degradation is caused by multiple natural and human factors including long-term droughts, wind erosion, water erosion, sandstorms, and overgrazing [6,73]. For the Xilin River Basin specifically, it has been shown that human activities (especially overgrazing) are the main factors of grassland degradation [6,8,9,35,74,75,76]. This is the result of rapid growth of livestock and human population in the basin over the past three decades. Livestock in the basin exhibited a sharp increase during 1983–1999 and then decreased rapidly (Figure 7). Human population also grew significantly by showing a 100% increase during 1983–2011 (Figure 7). We also note a slight decrease in annual precipitation during 1983–2011 (Figure 6b). Our findings of temporal patterns of GDI are consistent with the number of livestock during the study periods and confirm that, compared to precipitation, overgrazing played a greater role in grassland degradation during the last several decades.
Implementation of rational grassland management practices is expected to enhance grassland ESs and increase resilience of the arid and semiarid region, which has recently experienced urbanization, cropland expansion, industrial development, and intensification of mining [42,78]. Grasslands in the study area have restored since 2000 after experiencing two decades of severe degradation. It is a consequence of implementation of the Household Production Responsibility System (HPRS), also known as the Double Contracts System in grassland areas. The HPRS was launched in 1998 to deal with grassland degradation caused by social and institutional problems in the study area [79]. The policy was successful in controlling the number of livestock since 2000 (Figure 7). In addition, other ecological restoration programs, including the Grain for Green Project, the Beijing and Tianjin Sand Source Control Project, and ecological compensation (payment for ESs) project, all have contributed to the grassland restoration [80].

4.4. Uncertainties in Mapping and Modeling Grassland ESs

We identify the following uncertainties in ES assessments in our study. The lack of previous ground data forced us to rely on regression modeling in estimating aboveground biomass for 1983, 1989, and 2000. The regression was constructed using AGB data from 2011 and remote sensing data. SC was based on the RUSLE model, which is a standard method to calculate soil loss, but it has several limitations. The model predicts erosion from sheet wash alone (erosion from plains in gentle slopes) [81]. This model does not include rills, gullies, or stream-bank erosion/deposition processes. Moreover, the model was developed for the Great Plains region in the US and was never tested in our study area. Additionally, individual effects of each variable are not considered in the model. WR estimation was based on the water yield model in InVEST [50,51], which calculates water cycling in a basin without considering human consumption. Besides, surface water–groundwater interactions are neglected entirely. We therefore conclude that WR estimation may likely be prone to uncertainties.

5. Conclusions

To explore the relationship between ESs and grassland changes induced by vegetation succession, we calculated the degree of grassland degradation in the Xilin River Basin using GDI in 1983, 1989, 2000, and 2011. AGB, SC, and WR were also estimated to assess ESs for same years. Main conclusions are as follows: (1) GDI increased during 1983-2000 and decreased during 2000–2011 indicating that grasslands in the study area have recently undergone restoration after experiencing two decades of severe degradation. (2) Temporal dynamics of ESs were consistent with changes in GDI, which correlated negatively with AGB and SC. WR and SC are significantly affected by grassland conditions. They both declined in 1983–2000 and increased in the recent ten years. The increase of SC, however, was slower than that of AGB and WR, which suggests a time lag in soil restoration. (3) Grasslands in the middle and lower reaches have experienced severe degradation due to intensive human activities. (4) AGB and SC appeared to be synergistic ESs, while trade-offs existed between AGB and WR and between SC and WR. Overall, grassland ecosystems in the Xilin River Basin have changed considerably during the last three decades. Improving AGB should not be the only measure of grassland restoration. Other ESs, such as SC and WR, should be taken into account in the future.

Acknowledgments

We thank two anonymous reviewers for their valuable comments on an earlier version of the paper. This research was supported by the National Basic Research Program of China (Grant No. 2012CB722201), National Natural Science Foundation of China (Grant No. 31060320) and National Science and Technology Support Program (Grant No. 2011BAC07B01).

Author Contributions

Conceived and designed the paper: Xuefeng Zhang, Jianming Niu. Collected, analyzed data, wrote the paper: Xuefeng Zhang. Improved language: Alexander Buyantuev, Jianming Niu. Partial data collection and processing: Qing Zhang, Jianjun Dong, Sarula Kang, Jing Zhang.

Conflicts of Interest

The authors declare no conflict of interest.

References

  1. Millennium Ecosystem Assessment. Ecosystems and Human Well-being: Synthesis; Island Press: Washington, DC, USA, 2005. [Google Scholar]
  2. Sala, O.E.; Paruelo, J.M. Ecosystem services in grasslands. In Nature’s Services: Societal Dependence on Natural Ecosystems; Daily, G., Ed.; Island Press: Washington, DC, USA, 1997; pp. 237–251. [Google Scholar]
  3. Wu, J. Landscape sustainability science: Ecosystem services and human well-being in changing landscapes. Landsc. Ecol. 2013, 28, 999–1023. [Google Scholar] [CrossRef]
  4. Ren, J.Z.; Hu, Z.Z.; Zhao, J.; Zhang, D.G.; Hou, F.J.; Lin, H.L.; Mu, X.D. A grassland classification system and its application in China. Rangeland J. 2008, 30, 199–209. [Google Scholar] [CrossRef]
  5. National Bureau of Statistics of China. China Statistical Yearbook 2008; China Statistics Press: Beijing, China, 2008.
  6. Li, B. The rangeland degradation in North China and its preventive strategy. Sci. Agric. Sin. 1997, 30, 1–9. [Google Scholar]
  7. Akiyama, T.; Kawamura, K. Grassland degradation in China: Methods of monitoring, management and restoration. Grassl. Sci. 2007, 53, 1–17. [Google Scholar] [CrossRef]
  8. Tong, C.; Wu, J.; Yong, S.; Yang, J.; Yong, W. A landscape-scale assessment of steppe degradation in the Xilin River Basin, Inner Mongolia, China. J. Arid Environ. 2004, 59, 133–149. [Google Scholar] [CrossRef]
  9. Li, S.; Verburg, P.H.; Lv, S.; Wu, J.; Li, X. Spatial analysis of the driving factors of grassland degradation under conditions of climate change and intensive use in Inner Mongolia, China. Reg. Environ. Change 2012, 12, 461–474. [Google Scholar] [CrossRef]
  10. Wang, W.; Liang, C.; Liu, Z. Basic characteristics of recovery succession of degraded steppes. Acta Phytoecol. Sin. 1996, 24, 449–459. [Google Scholar]
  11. Bao, Y.; Chen, M. Plant community succession after shallow plowing in a degraded Leymus chinensis grassland. In Proceedings of the International Symposium on Grassland Resources, Huhehot, China, 16–18 August 1993; China Agriculture Science and Technology Press: Beijing, China, 1994. [Google Scholar]
  12. Liu, Z.; Wang, W.; Liang, C.; Hao, D. The regressive succession pattern and its diagnostic of Inner Mongolia steppe in sustained and superstrong grazing. Acta Agrestia Sin. 1998, 6, 244–251. [Google Scholar]
  13. Liu, Z.; Wang, W.; Hao, D.; Liang, C. Probes on the degeneration and recovery succession mechanisms of Inner Mongolia steppe. J. Arid Land Resour. Environ. 2002, 16, 84–91. [Google Scholar]
  14. Geerken, R.; Ilaiwi, M. Assessment of rangeland degradation and development of a strategy for rehabilitation. Remote Sens. Environ. 2004, 90, 490–504. [Google Scholar] [CrossRef]
  15. Tanser, F.C.; Palmer, A.R. The application of a remotely-sensed diversity index to monitor degradation patterns in a semi-arid, heterogeneous, South African landscape. J. Arid Environ. 1999, 43, 477–484. [Google Scholar] [CrossRef]
  16. Schmidt, H.; Karnieli, A. Remote sensing of the seasonal variability of vegetation in a semi-arid environment. J. Arid Environ. 2000, 45, 43–59. [Google Scholar] [CrossRef]
  17. Liu, J.; Xu, X.; Shao, Q. Grassland degradation in the “three-river headwaters” region, Qinghai province. J. Geogr. Sci. 2008, 18, 259–273. [Google Scholar] [CrossRef]
  18. Kawamura, K.; Akiyama, T.; Yokota, H.; Tsutsumi, M.; Yasuda, T.; Watanabe, O.; Wang, G.; Wang, S. Monitoring of forage conditions with MODIS imagery in the Xilingol steppe, Inner Mongolia. Int. J. Remote Sens. 2005, 26, 1423–1436. [Google Scholar] [CrossRef]
  19. Cao, X.; Gu, Z.; Chen, J.; Liu, J.; Shi, P. Analysis of human-induced steppe degradation based on remote sensing in Xilin Gole, Inner Mongolia, China. Chin. J. Plant Ecol. 2005, 30, 268–277. [Google Scholar]
  20. Gao, Q.; Li, Y.; Wan, Y.; Lin, E.; Xiong, W.; Jiangcun, W.; Wang, B.; Li, W. Grassland degradation in Northern Tibet based on remote sensing data. J. Geogr. Sci. 2006, 16, 165–173. [Google Scholar] [CrossRef]
  21. Andrade, B.O.; Koch, C.; Boldrini, I.I.; Vélez-Martin, E.; Hasenack, H.; Hermann, J.M.; Kollmann, J.; Pillar, V.D.; Overbeck, G.E. Grassland degradation and restoration: A conceptual framework of stages and thresholds illustrated by southern Brazilian grasslands. Nat. Conservaçao 2015, 13, 95–104. [Google Scholar] [CrossRef]
  22. De Groot, R.S.; Wilson, M.A.; Boumans, R.M.J. A typology for the classification, description and valuation of ecosystem functions, goods and services. Ecol. Econ. 2002, 41, 393–408. [Google Scholar] [CrossRef]
  23. Costanza, R.; d’Arge, R.; de Groot, R.; Farber, S.; Grasso, M.; Hannon, B.; Limburg, K.; Naeem, S.; O’Neill, R.V.; Paruelo, J. The value of the world’s ecosystem services and natural capital. Nature 1997, 387, 253–260. [Google Scholar] [CrossRef]
  24. Daily, G. Nature’s Services: Societal Dependence on Natural Ecosystems; Island Press: Washington, DC, USA, 1997. [Google Scholar]
  25. Müller, F.; de Groot, R.; Willemen, L. Ecosystem services at the landscape scale: The need for integrative approaches. Landsc. online 2010, 23, 1–11. Available online: http://www.landscapeonline.de/103097lo201023 (accessed on 21 June 2016). [Google Scholar]
  26. Ayanu, Y.Z.; Conrad, C.; Nauss, T.; Wegmann, M.; Koellner, T. Quantifying and mapping ecosystem services supplies and demands: A review of remote sensing applications. Environ. Sci. Technol. 2012, 46, 8529–8541. [Google Scholar] [CrossRef] [PubMed]
  27. Martínez-Harms, M.J.; Balvanera, P. Methods for mapping ecosystem service supply: A review. Int. J. Biodiversity Sci. Ecosystem Ser. Manag. 2012, 8, 17–25. [Google Scholar] [CrossRef]
  28. Rodríguez, J.P.; Beard, J.T.D.; Bennett, E.M.; Cumming, G.S.; Cork, S.J.; Agard, J.; Dobson, A.P.; Peterson, G.D. Trade-offs across space, time, and ecosystem services. Ecol. Soc. 2006, 11, 28. [Google Scholar]
  29. Kragt, M.E.; Robertson, M.J. Quantifying ecosystem services trade-offs from agricultural practices. Ecol. Econ. 2014, 102, 147–157. [Google Scholar] [CrossRef]
  30. Qiu, J.; Turner, M.G. Spatial interactions among ecosystem services in an urbanizing agricultural watershed. Proc. Natl. Acad. Sci. USA 2013, 110, 12149–12154. [Google Scholar] [CrossRef] [PubMed]
  31. Egoh, B.; Rouget, M.; Reyers, B.; Knight, A.T.; Cowling, R.M.; van Jaarsveld, A.S.; Welz, A. Integrating ecosystem services into conservation assessments: A review. Ecol. Econ. 2007, 63, 714–721. [Google Scholar] [CrossRef]
  32. Trabucchi, M.; Ntshotsho, P.; O'Farrell, P.; Comín, F.A. Ecosystem service trends in basin-scale restoration initiatives: A review. J. Environ. Manag. 2012, 111, 18–23. [Google Scholar] [CrossRef] [PubMed] [Green Version]
  33. McDonagh, J.; Stocking, M.; Lu, Y. Global Impacts of Land Degradation; Overseas Development Group, University of East Anglia Norwich, for the Scientific and Technical Panel of the Global Environment Facility: Washington, DC, USA, 2006. [Google Scholar]
  34. Bai, Y.; Huang, J.; Zheng, S.; Pan, Q.; Zhang, L.; Zhou, H.; Xu, H.; Li, Y.; Ma, J. Drivers and regulating mechanisms of grassland and desert ecosystem services. Chin. J. Plant Ecol. 2014, 38, 93–102. [Google Scholar]
  35. Li, B.; Yong, S.; Li, Z. The vegetation of the Xilin River Basin and its utilization. In Research on Grassland Ecosystem; Inner Mongolia Grassland Ecosystem Research Station; Science Press: Beijing, China, 1988; Volume 3, pp. 84–183. [Google Scholar]
  36. Li, L.; Chen, Z.; Wang, Q.; Liu, X.; Li, Y. Changes in soil carbon storage due to over-grazing in Leymus chinensis steppe in the Xilin River Basin of Inner Mongolia. J. Environ. Sci. 1997, 9, 104–108. [Google Scholar]
  37. The United States Geological Survey. Available online: http://glovis.usgs.gov/ (accessed on 21 April 2015).
  38. ENVI, version 4.7; Exelis Visual Information Solutions: Boulder, CO, USA, 2009.
  39. TWINSPAN for Windows, version 2.3; Centre for Ecology and Hydrology and University of South Bohemia: Huntingdon, UK; Ceske Budejovice, Czech Republic, 2005.
  40. eCongnition Developer, version 8.0; Definiens: Munich, Germany, 2010.
  41. ArcGIS Desktop, version 10.0; Environmental Systems Research Institute: Redlands, CA, USA, 2011.
  42. Han, Y.; Niu, J.; Zhang, Q.; Dong, J.; Zhang, X.; Kang, S. The changing of vegetation pattern and its driven forces of grassland in Xilin River Basin in thirty years. Chin. J. Grassl. 2014, 36, 70–77. [Google Scholar]
  43. Zhang, X.; Niu, J.; Zhang, Q.; Dong, J.; Zhang, J. Soil conservation function and its spatial distribution of grassland ecosystems in Xilin River Basin, Inner Mongolia. Acta Pratac. Sin. 2015, 24, 12–20. [Google Scholar]
  44. The Cold and Arid Regions Sciences Data Center. Available online: http://westdc.westgis.ac.cn (accessed on 5 January 2016).
  45. The MODIS Level 1 and Atmosphere Archive and Distribution System in NASA. Available online: https://ladsweb.nascom.nasa.gov/ (accessed on 5 January 2016).
  46. Japan Space Systems. Available online: http://www.jspacesystems.or.jp/en_/ (accessed on 1 June 2014).
  47. Kumar, P. The Economics of Ecosystems and Biodiversity: Ecological and Economic Foundations; Earthscan: London, UK, 2010. [Google Scholar]
  48. Dong, J. Estimation of Primary Productivity of Typical Grasslands based on Multi-source Satellite Data. Master’s Thesis, Inner Mongolia University, Hohhot, China, 2013. [Google Scholar]
  49. Renard, K.G.; Foster, G.R.; Weesies, G.A.; McCool, D.; Yoder, D. Predicting Soil Erosion by Water: A Guide to Conservation Planning with the Revised Universal Soil Loss Equation (RUSLE); United States Government Printing Office: Washington, DC, USA, 1997.
  50. Kareiva, P.; Tallis, H.; Ricketts, T.H.; Daily, G.C.; Polasky, S. Natural Capital: Theory and Practice of Mapping Ecosystem Services; Oxford University Press: London, UK, 2011. [Google Scholar]
  51. Yu, X.; Zhou, B.; Lü, X.; Yang, Z. Evaluation of water conservation function in mountain forest areas of Beijing based on InVEST model. Sci. Silvae Sin. 2012, 48, 1–5. [Google Scholar]
  52. Sharp, R.; Tallis, H.; Ricketts, T.; Guerry, A.; Nelson, E.; Ennaanay, D.; Wolny, S.; Olwero, N.; Vigerstol, K.; Pennington, D.; et al. InVEST User’s Guide; The Natural Capital Project: Stanford, CA, USA, 2014. [Google Scholar]
  53. Budyko, M.I. Climate and Life; Academic Press: New York, NY, USA, 1974. [Google Scholar]
  54. Zhang, L.; Hickel, K.; Dawes, W.R.; Chiew, F.H.S.; Western, A.W.; Briggs, P.R. A rational function approach for estimating mean annual evapotranspiration. Water Resour. Res. 2004. [Google Scholar] [CrossRef]
  55. Zhou, W.; Liu, G.; Pan, J.; Feng, X. Distribution of available soil water capacity in China. J. Geogr. Sci. 2005, 15, 3–12. [Google Scholar] [CrossRef]
  56. IBM SPSS Statistics for Windows, version 19; IBM Corp: Armonk, NY, USA, 2010.
  57. Bennett, E.M.; Peterson, G.D.; Gordon, L.J. Understanding relationships among multiple ecosystem services. Ecol. Lett. 2009, 12, 1394–1404. [Google Scholar] [CrossRef] [PubMed]
  58. Su, C.; Fu, B.; He, C.; Lü, Y. Variation of ecosystem services and human activities: A case study in the Yanhe watershed of China. Acta Oecol. 2012, 44, 46–57. [Google Scholar] [CrossRef]
  59. Pan, Y.; Wu, J.; Xu, Z. Analysis of the tradeoffs between provisioning and regulating services from the perspective of varied share of net primary production in an alpine grassland ecosystem. Ecol. Complex. 2014, 17, 79–86. [Google Scholar] [CrossRef]
  60. Bai, Y.; Han, X.; Wu, J.; Chen, Z.; Li, L. Ecosystem stability and compensatory effects in the Inner Mongolia grassland. Nature 2004, 431, 181–184. [Google Scholar] [CrossRef] [PubMed]
  61. Fang, J.; Piao, S.; Zhou, L.; He, J.; Wei, F.; Myneni, R.B.; Tucker, C.J.; Tan, K. Precipitation patterns alter growth of temperate vegetation. Geophys. Res. Lett. 2005. [Google Scholar] [CrossRef]
  62. Ma, W.; Yang, Y.; He, J.; Zeng, H.; Fang, J. Above-and belowground biomass in relation to environmental factors in temperate grasslands, Inner Mongolia. Sci. China Life Sci. 2008, 51, 263–270. [Google Scholar] [CrossRef] [PubMed]
  63. Sun, X.; Liu, P.; Li, P. The dynamic state of the NDVI index in Xilingol grassland during 1981–2010. Chin. J. Grassl. 2014, 36, 23–28. [Google Scholar]
  64. Wang, M.; Feng, X.; Wu, L. The evaluation of ecological service value in a typical grassland nature reserve under the context of global climate changes. J. Desert Res. 2015, 35, 1700–1707. [Google Scholar]
  65. Rao, E.; Ouyang, Z.; Yu, X.; Xiao, Y. Spatial patterns and impacts of soil conservation service in China. Geomorphology 2014, 207, 64–70. [Google Scholar] [CrossRef]
  66. Wall, D.H.; Bardgett, R.D.; Behan-Pelletier, V.; Herrick, J.E.; Jones, T.H.; Six, J.; Strong, D.R. Soil Ecology and Ecosystem Services; Oxford University Press: Oxford, UK, 2013. [Google Scholar]
  67. Bai, M.; Hao, R.; Hou, Q.; Di, R.; Yang, J. Impact of climatic vacillation on potential evaporation on typical grassland. T. Atmos. Sci. 2011, 34, 351–355. [Google Scholar]
  68. Geng, X.; Wang, X.; Yan, H.; Zhang, Q.; Jin, G. Land use/land cover change induced impacts on water supply service in the upper reach of Heihe River Basin. Sustainability 2014, 7, 366–383. [Google Scholar] [CrossRef]
  69. Chen, S.; Liu, J.; Zhuang, D.; Xiao, X.; Steve, B. Quantifying land use and land cover change in Xilin river basin using multi-temporal Landsat TM/ETM sensor data. Acta Geogr. Sin. 2003, 58, 45–52. [Google Scholar]
  70. Yan, Y.; Alatengtuya; Hu, Y.; Liu, Y.; Yu, G. The tendency and its spatial pattern of grassland changes in the east Xilin Gol from 1975 to 2009. J. Geo-Inform. Sci. 2011, 13, 549–555. [Google Scholar] [CrossRef]
  71. Raudsepp-Hearne, C.; Peterson, G.D.; Bennett, E.M. Ecosystem service bundles for analyzing tradeoffs in diverse landscapes. Proc. Natl. Acad. Sci. USA 2010, 107, 5242–5247. [Google Scholar] [CrossRef] [PubMed]
  72. Zheng, Z.; Fu, B.; Hu, H.; Sun, G. A method to identify the variable ecosystem services relationship across time: A case study on Yanhe Basin, China. Landsc. Ecol. 2014, 29, 1689–1696. [Google Scholar] [CrossRef]
  73. Millennium Ecosystem Assessment. Ecosystems and Human Well-being: Current State and Trends; Island Press: Washington, DC, USA, 2005. [Google Scholar]
  74. Wu, J.; Loucks, O. The Xilingol grassland. In Grasslands and Grassland Sciences in Northern China; US National Research Council, Ed.; National Academy Press: Washington, DC, USA, 1992; pp. 67–84. [Google Scholar]
  75. Chen, Z.; Zhao, B. Steppe ecosystem degradation and management in the Xilingol Biosphere Reserve. In Management of the Degraded Ecosystem in Xilingol Biosphere Reserve; Han, N., Jiang, G., Li, W., Eds.; Tsinghua University Press: Beijing, China, 2002; pp. 117–132. [Google Scholar]
  76. Jiang, Y.; Bi, X.; Huang, J.; Bai, Y. Patterns and drivers of vegetation degradation in Xilin River Basin, Inner Mongolia, China. Chin. J. Plant Ecol. 2010, 34, 1132–1141. [Google Scholar]
  77. Xilinhot Statistic Bureau. Statistic Yearbook of Xilinhot; Xilinhot Statistic Bureau: Xilinhot, China, 1980–2012.
  78. Chen, S.; Liu, J.; Zhuang, D.; Xiao, X. Characterization of land cover types in Xilin River Basin using multi-temporal Landsat images. J. Geogr. Sci. 2003, 13, 131–138. [Google Scholar]
  79. Li, W.J.; Ali, S.H.; Zhang, Q. Property rights and grassland degradation: A study of the Xilingol Pasture, Inner Mongolia, China. J. Environ. Manag. 2007, 85, 461–470. [Google Scholar]
  80. Jiang, G.; Han, X.; Wu, J. Restoration and management of the Inner Mongolia grassland require a sustainable strategy. AMBIO 2006, 35, 269–270. [Google Scholar] [CrossRef] [PubMed]
  81. Food and Agriculture Organization of the United Nations (FAO). FAOSTAT. Available online: http://faostat.fao.org/site/291/default.aspx (accessed on 31 August 2015).
Figure 1. Location of the study area.
Sustainability 08 00594 g001
Figure 2. Spatial distribution of GDI in the Xilin River Basin during 1983–2011. (a), (b), (c), and (d) were the spatial distribution of GDI in 1983, 1989, 2000, and 2011 respectively.
Sustainability 08 00594 g002
Figure 3. Changes of GDI and ESs in the Xilin River Basin during 1983–2011. (a) was the changes of grassland degradation index during 1983–2011; (b), (c), and (d) were the changes of aboveground biomass; soil conservation, and water retention respectively.
Sustainability 08 00594 g003
Figure 4. Spatial distribution of ESs in the Xilin River Basin during 1983–2011.
Sustainability 08 00594 g004
Figure 5. Trend analysis of AGB in the Xilin River Basin during 1981–2015. (a) and (b) were the spatial distribution of the slope trends in aboveground biomass (AGB); (c) and (d) were the proportion of the study area that significantly increased, increased but not significantly, decreased but not significantly, and significantly decreased. AGB is based on the maximum value composite of NOAA/AVHRR NDVI (1981–1999) and MODIS NDVI (2000–2015).
Sustainability 08 00594 g005
Figure 6. Changes of AGB and precipitation in the Xilin River Basin during 1981–2015.
Sustainability 08 00594 g006
Figure 7. Population and livestock in the Xilin River Basin during 1983–2011. Data source: Xilinhot City Statistic Yearbook (1980–2012) [77] (data are taken at the end of year).
Sustainability 08 00594 g007
Table 1. Vegetation classification of degradation rankings of plant communities in the Xilin River Basin.
Vegetation SubtypesFormation TypesAssociationDegradation Ranking
Meadow steppeMesophyious forbs meadow steppeL. chinensis + forbsUndegraded
Typical steppeLeymus chinensis steppeL. chinensis + Stipa. spp.Undegraded
L. chinensis + Artemisia frigidaModerately degraded
Stipa grandis steppeS. grandisUndegraded
S. grandis + L. chinensisUndegraded
S. grandis + Cleistogenes squarrosaSlightly degraded
Stipa krylovii steppeS. krylovii + S. gobicaUndegraded
S. krylovii + L. chinensisSlightly degraded
S. krylovii + C. squarrosaModerately degraded
Cleistogenes squarrosa steppeC. squarrosa + A. frigidaHeavily degraded
Caragana microphylla thicketization of steppeCaragana microphylla – grass + forbsHeavily degraded
Sand vegetationPioneer plants in sand dunesAgriophyllum pungens + Corispermum spp.Heavily degraded
Artemisia intramongolica formationA. intramongolicaUndegraded
C. microphylla scrubC. microphyllaA. intramongolicaUndegraded
MeadowCarex korshinskyi meadowCarex spp. + forbsHeavily degraded
Achnatherum splendens meadowA. splendensUndegraded
OthersOthersFarmland, Waters, Saline and alkali land, Bare land, Urban or residential area, Industry and mining landUndegraded
Table 2. Change rate of GDI and ESs in the sub-basins during 1983–2011.
Sub-BasinsChange Rate (%)
1983–19891989–20002000–2011
GDIAGBSCWRGDIAGBSCWRGDIAGBSCWR
Upper reaches49.15−3.45−36.6849.25−22.36−9.02−15.07−71.64−4.0532.8912.49245.34
Middle reaches13.241.12−9.2389.639.40−18.99−58.58−86.19−13.7226.749.89577.33
Lower reaches−7.422.4251.4181.2538.13−23.97−72.20−90.86−15.4239.0233.90848.12
Whole basin9.09−0.17−3.9370.4514.13−17.76−52.49−82.58−13.1633.3217.30432.63
GDI: Grassland degradation index; AGB: Aboveground biomass; SC: Soil conservation; WR: Water retention.
Table 3. Correlations of GDI and grassland ESs.
Year/PeriodGDI vs. AGBGDI vs. SCGDI vs. WRAGB vs. SCAGB vs. WRSC vs. WR
1983−0.488**−0.354**−0.312**0.679**0.492**0.393**
1989−0.307**−0.339**−0.205**0.732**0.120*0.209**
2000−0.706**−0.592**−0.389**0.768**0.543**0.510**
2011−0.652**−0.451**−0.228**0.762**0.247**0.306**
1983–1989−0.421**−0.414**0.0750.848**−0.051−0.015
1989–2000−0.582**−0.539**0.0160.565**0.0270.196**
2000–2011−0.374**−0.198**0.0490.733**−0.144**−0.051
1983–2011−0.153**−0.143**0.0310.143**−0.116*−0.479**
GDI: Grassland degradation index; AGB: Aboveground biomass; SC: Soil conservation; WR: Water retention.
** Correlation is significant at the 0.01 level (2-tailed).
* Correlation is significant at the 0.05 level (2-tailed).

