Article

Wet Grasslands as a Green Infrastructure for Ecological Sustainability: Wader Conservation in Southern Sweden as a Case Study

1
Forest-Landscape-Society Research Network, School for Forest Management, Swedish University of Agricultural Sciences, Skinnskatteberg SE 739 21, Sweden
2
Institute of Forest Biology and Silviculture, Faculty of Forest Science and Ecology, Aleksandras Stulginskis University, Akademija LT 53361, Lithuania
3
Conservation Ecology Group, IFM Biology, Linköping University, Linköping SE 581 83, Sweden
*
Author to whom correspondence should be addressed.
Sustainability 2016, 8(4), 340; https://doi.org/10.3390/su8040340
Submission received: 28 January 2016 / Revised: 28 March 2016 / Accepted: 30 March 2016 / Published: 6 April 2016

Abstract

:
Biosphere Reserves aim at being role models for biodiversity conservation. This study focuses on the unsuccessful conservation of waders (Charadrii) on wet grasslands in the Kristianstad Vattenrike Biosphere Reserve (KVBR) in southern Sweden. Predation on nests and young has been proposed as one reason contributing to the decline of waders. We explored this hypothesis by comparing two landscapes, one with declining (KVBR) and one with stable (Östergötland) wader populations on managed wet grasslands in southern Sweden. Specifically, we tested three predictions linked to predation on wader nests and young, namely that (1) the relative abundance of avian predators and waders; (2) the avian predator abundance; and (3) the predation rate on artificial wader nests, should all be higher in declining versus stable populations. All predictions were clearly supported. Nevertheless, predation may not be the ultimate factor causing wader population declines. We discuss the cumulative effects of landscape change linked to increased food resources for predators, reduced wet grassland patch size and quality. Holistic analyses of multiple wet grassland landscapes as social-ecological systems as case studies, including processes such as predation and other factors affecting waders, is a promising avenue towards collaborative learning for wet grasslands as a functional green infrastructure. However, if governance and management approaches can be improved is questionable without considerable investment in both ecological and social systems.

1. Introduction

Implementation of policies about ecological sustainability towards successful conservation of species, habitats and processes in social-ecological systems, i.e., landscapes, is a paramount contemporary challenge. The policy concepts biodiversity and ecosystem services are two good examples [1]. In response to difficulties in communicating these concepts to actors and stakeholders, policy about green infrastructure has appeared (e.g., [2]). To support the implementation of policies aiming at sustainable landscapes on the ground, Biosphere Reserve, Ecomuseum, Model Forest and other concepts were developed to enhance collaborative learning towards tangible results [3,4]. In the Millennium Ecosystem Assessment [5] one of several examples brought forward as a success story in terms of implementation of sustainability policy was the Kristianstad Vattenrike Biosphere Reserve (KVBR) [6]. The KVBR is one of southern Sweden’s most valuable inland wetland ecosystems of natural and anthropogenic origin [7], hence the name “Vattenrike” (i.e., “water kingdom”). After nominations as a Ramsar wetland in 1974, and an Ecomuseum in 1989, a Biosphere Reserve was established to promote and demonstrate a balanced relationship between people and nature in 2005. One of the KVBR’s key tasks was to improve conservation efforts for Sweden’s largest inland wet grassland complex [8]. Indeed, the wetlands of the KVBR, including the lakeshore grasslands with a rich bird life, were prioritized by the inhabitants of Kristianstad Municipality as the most important areas for conservation [9].
A suite of studies on governance aiming at ecological sustainability and resilience of social-ecological systems has been made about the KVBR. The results of Hahn et al. [6] suggested that adaptive co-management had enhanced the social capacity to respond to unpredictable change, and had developed a trajectory towards resilience of a desirable social-ecological system. Similarly, Schultz et al. [10] reported that ecosystem management was dependent on multi-level collaboration, and Olsson et al. [11,12] showed that the multi-level governance networks of the KVBR were suitable to co-manage the complex socio-economic system. Finally, Hahn [13] showed that the governance network of the KVBR complements the socio-economic systems and representative democracy. These studies have improved the understanding of the sustainable development processes both locally in the KVBR, and also partly in the entire catchment of the Helge å River [14]. This research has been disseminated as a success story of sustainable development as a societal process (e.g., [15]). However, the final step in the policy implementation process, i.e., understanding the extent to which a promising governance arrangement actually results in ecological sustainability as part of resilience of social-ecological systems (e.g., [16,17]), is poorly studied. A recent study on Greylag Goose (Anser anser) [18] illustrates the need to go beyond studies of social innovations to understanding the factors that determine the distribution and abundance of focal species. For the KVBR, wet grasslands is the focal land cover, and waders (Charadrii) the focal species group [8,9].
Sweden provides a gradient in the viability of wader populations. In northern Sweden wader populations of near-natural systems such as mountain heaths and large boreal wetlands are largely stable or even increasing, whilst in southern Sweden’s anthropogenic wetlands they are generally declining [19]. For ten wader species found in both regions, a 2% increase per year in the north and a 3.5% decline per year in the south was found during the period 1998–2012 [20]. The role of habitat loss for waders in southern Sweden is by no means a new phenomenon. Already in 1858, Nilsson [21] reported declines in Black-tailed Godwit (Limosa limosa) populations on the large island Gotland in southern Sweden, and linked this to the draining of wet grasslands, which affected both habitat quality and quantity. Similar conclusions have been made for Scania County in southernmost Sweden [7].
In southern Sweden traditional farming practices based on animal husbandry and the associated large area of mowed and grazed wet grasslands, which provided habitats for many species, have been turned into intensive cropping systems [22,23]. Today, the remaining wet grasslands are dependent on environmental subsidies to maintain livestock grazing and mowing [24]. This development also applies to the KVBR. To understand the role of governance systems versus other factors for explaining the states and trends of waders, there is hence a need to compare wader landscapes with different conservation status.
The lowland areas of the Helge å River catchment in NE Scania is a traditional focal area for wetland bird conservation in southern Sweden [8]. Many of the unique values of the area are associated with wet grasslands, which today depend on grazing and hay-making subsidized by EU funding, and the irregular inundation by the Helge å River. As a consequence, to enhance wader conservation, protected wetland areas have been established. Since the late 1980s several wet grassland patches of today’s KVBR have also been actively managed with the aim to meet habitat requirements of waders [8]. In response, the wader population initially increased by 59% over a seven-year period [25,26,27,28]. However, these efforts have not been sustained long-term, and the breeding populations of red-listed wader species of the wet grasslands have subsequently declined [26]. There is a whole suite of factors that may affect the distribution and abundance of waders.
Globally, wetlands are one of the most threatened and degraded ecosystems [29,30], including lowland wet grassland systems. Being biologically productive, naturally dynamic wet grasslands have been expanded by human management during millennia. Grazing and traditional hay making on wet grasslands thus expanded, resulting in a cultural landscape favoring waders [31,32]. However, more recently, wet grasslands have been severely reduced [33,34] through a range of human-induced factors including intensification of agriculture [35,36], hydrological changes [33], eutrophication [30,37], land abandonment [38], forest expansion [39,40], urbanization [41], climate change [42] and land management shifts [43,44]. These factors have resulted in land cover changes that has directly and indirectly influenced species’ habitats as well as population structure of species assemblages [34,45,46]. Fragmentation and loss of habitat negatively affects wader breeding in both natural and anthropogenic wetlands in Western Europe [42,47,48,49]. In contrast, in landscapes where land management practices have remained traditional, less intensive and less intrusive, wet grassland ecosystems as cultural landscapes are more intact [32,38].
Species’ distribution, behavior and abundance are generally affected by habitat change, fragmentation and edge effects [47,50]. Thus, the degradation of wet grasslands has contributed to a sharp decline in waders throughout Europe over the past three to four decades [48,51,52,53,54]. In particular, several studies show that wader decline is most commonly linked to a decrease in vegetation quantity and quality [52,53,55], and predation [42,56,57,58,59,60]. Ottvall et al. [24] highlight the intrusion of shrubs and trees on wet grasslands as a key factor for the decline of waders. Koivula [60] showed that the loss of open habitat through tree encroachment impacts wader defense strategies by limiting early predator detection. In a review of wader population trends in south Sweden, Ottvall and Smith [24] found that wader breeding density had declined in parallel with intensified agriculture and local changes in grazing management. Finally, a meta-analysis of five major wader species by Roodbergen et al. [42] showed that the present population declines in Europe are caused by a decrease in reproduction, not adult survival, and that their reproductive output by loss of eggs, chicks and young birds is presently too low to compensate for adult mortality.
The hypothesis that predation on eggs and chicks limit wader populations [61,62,63] stresses the need for comparisons of predator assemblages and predation pressure among entire wader landscapes that represent declining and stable populations. The aim of this study is to compare a rapidly declining wader population and a stable wader population. Specifically, we tested three predictions linked to predation on wader nests and young, namely that (1) the relative abundance of avian predators and waders; (2) the avian predator abundance; and (3) the predation rate on artificial wader nests, should all be higher in declining versus stable populations.

2. Materials and Methods

2.1. Study Areas

Testing predictions on the predation hypothesis requires study area extents that reflect not only movement patterns of individual waders at the local scale, but also the overall abundance of predators in the landscape. With both avian and mammalian predators having larger home ranges than waders, comparison of local habitat wet grassland patches alone is insufficient. Therefore, the landscape scale should also be considered (e.g., [64]), as it is linked to predator species’ life history traits [65]. In analyses of relationships between land cover and fragmentation versus occurrence of avian and mammalian predators using multiple landscapes, Angelstam et al. [66] and Mikusiński et al. [67] used sampling areas of ca. 100 km2 and 2500 km2, respectively. Additionally, sufficiently large areas with different habitat quality in a broad sense need to be compared. We thus use entire landscapes, and not only the wet grassland patches, as case studies [68,69].
The wader landscape of Kristianstad (approx. 55N, 14E) contains an archipelago of anthropogenic wet grasslands along the lower part of the Helge å River, surrounded by agricultural land, urban areas, and forest patches. Waders within the wet grasslands have declined in recent years (Figure 1). This applies in particular to Dunlin (Calidris alpina schinzii) which is no longer breeding in the area, Ruff (Philomachus pugnax) which only breeds sporadically, and Black-tailed Godwit [26]. In addition, more abundant species such as Lapwing (Vanellus vanellus), Redshank (Tringa totanus) and Curlew (Numenius arquata) are declining, albeit at a lower rate [26].
For comparison we identified three other potentially suitable landscapes for comparison. One was located on the south Swedish mainland in Östergötland County, and two on the large islands of Gotland and Öland in the Baltic Sea. We thus focused on the southern Swedish mainland by exploring a suite of wet grassland patches in central Östergötland (N = 39; 907 ha) [70] in addition to the KVBR wet grasslands (N = 21; 1660 ha) [71] (see Figure 2). These two landscapes were selected as the base for comparisons of wet grasslands managed for waders. To be comparable the wet grassland patches should all have “favorable management status”. This is defined as a wet grassland patch that is managed and prioritized for the conservation of waders through grazing, mowing, flooding and ongoing maintenance, and is known to host breeding waders [26,70]. Based on wader population trend data from wet grasslands with favorable management status in Kristianstad (N = 7; 844 ha) [26] and Östergötland (N = 14; 434 ha) [70] we found that in Kristianstad the trends in wader populations, biomass and metabolic weight of waders [72] were clearly negative, while in Östergötland there was no trend (Table 1 and confidence intervals therein). As the 14 wet grasslands selected in Östergötland were located in three different nature reserves (Figure 2), those data were first summed to site-wise records.
To include a sufficiently large area in the context of landscape-level differences in predator assemblages, we focused on wet grasslands within Kristianstad Municipality (1484 km2) and the central lowlands in Östergötland County (2604 km2) (Figure 2). Land cover proportions for both landscapes were calculated using Swedish Land Surveying Authority data and GIS software [73]. The land cover proportions of the entire study landscapes, and the distribution at different spatial scales around the wet grassland patches with favorable management status (using buffer zones 0.5, 1, 2, 4 and 8 km) is illustrated in Figure 3.

2.2. Field Observations

2.2.1. Relative Abundance of Avian Predators and Waders

Based on the management status of each wet grassland patch, and presence of population trend data, we selected seven wet grasslands covering 844 ha in Kristianstad and nine wet grasslands covering 407 ha in Östergötland. The study took place in April 2013, during the beginning of the wader breeding season, by visiting wet grassland patches in Kristianstad and Östergötland and counting all present corvid birds, birds of prey, and waders. At each wet grassland patch, a 30-min count sweep was conducted once using binoculars and a spotting scope from dawn to mid-afternoon under favorable weather conditions.
The relative abundance of avian predators and waders, i.e., an index of predation pressure, was calculated separately for corvids and birds of prey, respectively, and expressed as the ratio of predators to the sum of predators and waders. Using the software Comprehensive Meta-Analysis 2.2 (www.meta-analysis.com, Biostat, Inc.: Engelwood, NJ, USA), we then calculated an overall average “predation pressure index” for the KVBR and Östergötland using the random model.

2.2.2. Landscape Avian Predator Counts

During the latter part of the breeding period, in early June 2013, avian predators were counted with focus on corvid birds and birds of prey in the landscape surrounding the wet grassland patches in both KVBR and Östergötland. To estimate the abundance of avian predators known to prey on wader nests and young we divided the study areas into 1-km grid cells. Using GIS [73] each grid cell was populated with land cover proportions using data from the Swedish Land Surveying Authority. Based on the main land cover types, six strata were identified: (1) wet grasslands; (2) urban areas (>40% coverage); (3) agricultural fields (forest cover ~0%); (4) mixed field and forest (forest cover 5%–20%); (5) mixed forest and field (forest cover 40%–60%); and (6) forests (forest cover 80%–95%). The forest cover intervals were chosen to reflect clearly fragmented areas (i.e., <20% forest cover), areas without severe fragmentation, and contiguous forest [47]. For each of the two case study areas and each stratum, a total of 30 individual 1-km2 grid cells were randomly selected. At the center of each grid cell a 5-min, continuous 360 degree point sweep with binoculars was undertaken to count all corvid birds and birds of prey. The point counts were suspended in adverse weather conditions, such as when windy and rainy. Average counts per land cover type were calculated on ln(1 + x)-transformed data, and then back-transformed for display purpose.

2.2.3. Artificial Nest Predation

Following Pehlak and Lõhmus [62], artificial wader nests were placed in five randomly selected wet grasslands and in five randomly selected open agricultural field habitat patches surrounding the wet grasslands [55]. In each landscape case study area, nests were exposed during a 10 day period during the wader breeding season in 2013. Within each habitat patch, 10 artificial wader nests containing two brown chicken eggs (i.e., n = 50 per stratum in each case study landscape) were placed at night (cf. [74]). Artificial nests were located in microsites with open vegetation height varying between 0 and 30 cm, and at a minimum distance of 100 m from each other. The aim was to simulate wader nests, which are simply eggs laid on the ground. Each nest was then inspected during the night for predation and the perpetrator after 5 and 10 days, respectively [59,62]. To establish the perpetrator, signs such as peck holes, feathers, footprints, tire tracks or farming operations (e.g., slashing and ploughing) were also identified. Site-wise nest predation data were entered into a meta-analysis that then estimated the predation (event rate) in Kristianstad and Östergötland using the random model and the software Comprehensive Meta-Analysis.

3. Results

3.1. Relative Abundance of Avian Predators and Waders at the Beginning of the Breeding Season

The index of avian predation pressure was higher on the wet grasslands with favorable management status in Kristianstad than in Östergötland for corvid birds, but not for birds of prey (Figure 4). The index was three times higher for corvids in Kristianstad than for Östergötland. In total 11 species among 517 wader individuals, 6 corvid species among 556 individuals, and 6 birds of prey species among 66 individuals, were observed during the relative abundance of avian predator and wader field work (Table 2).

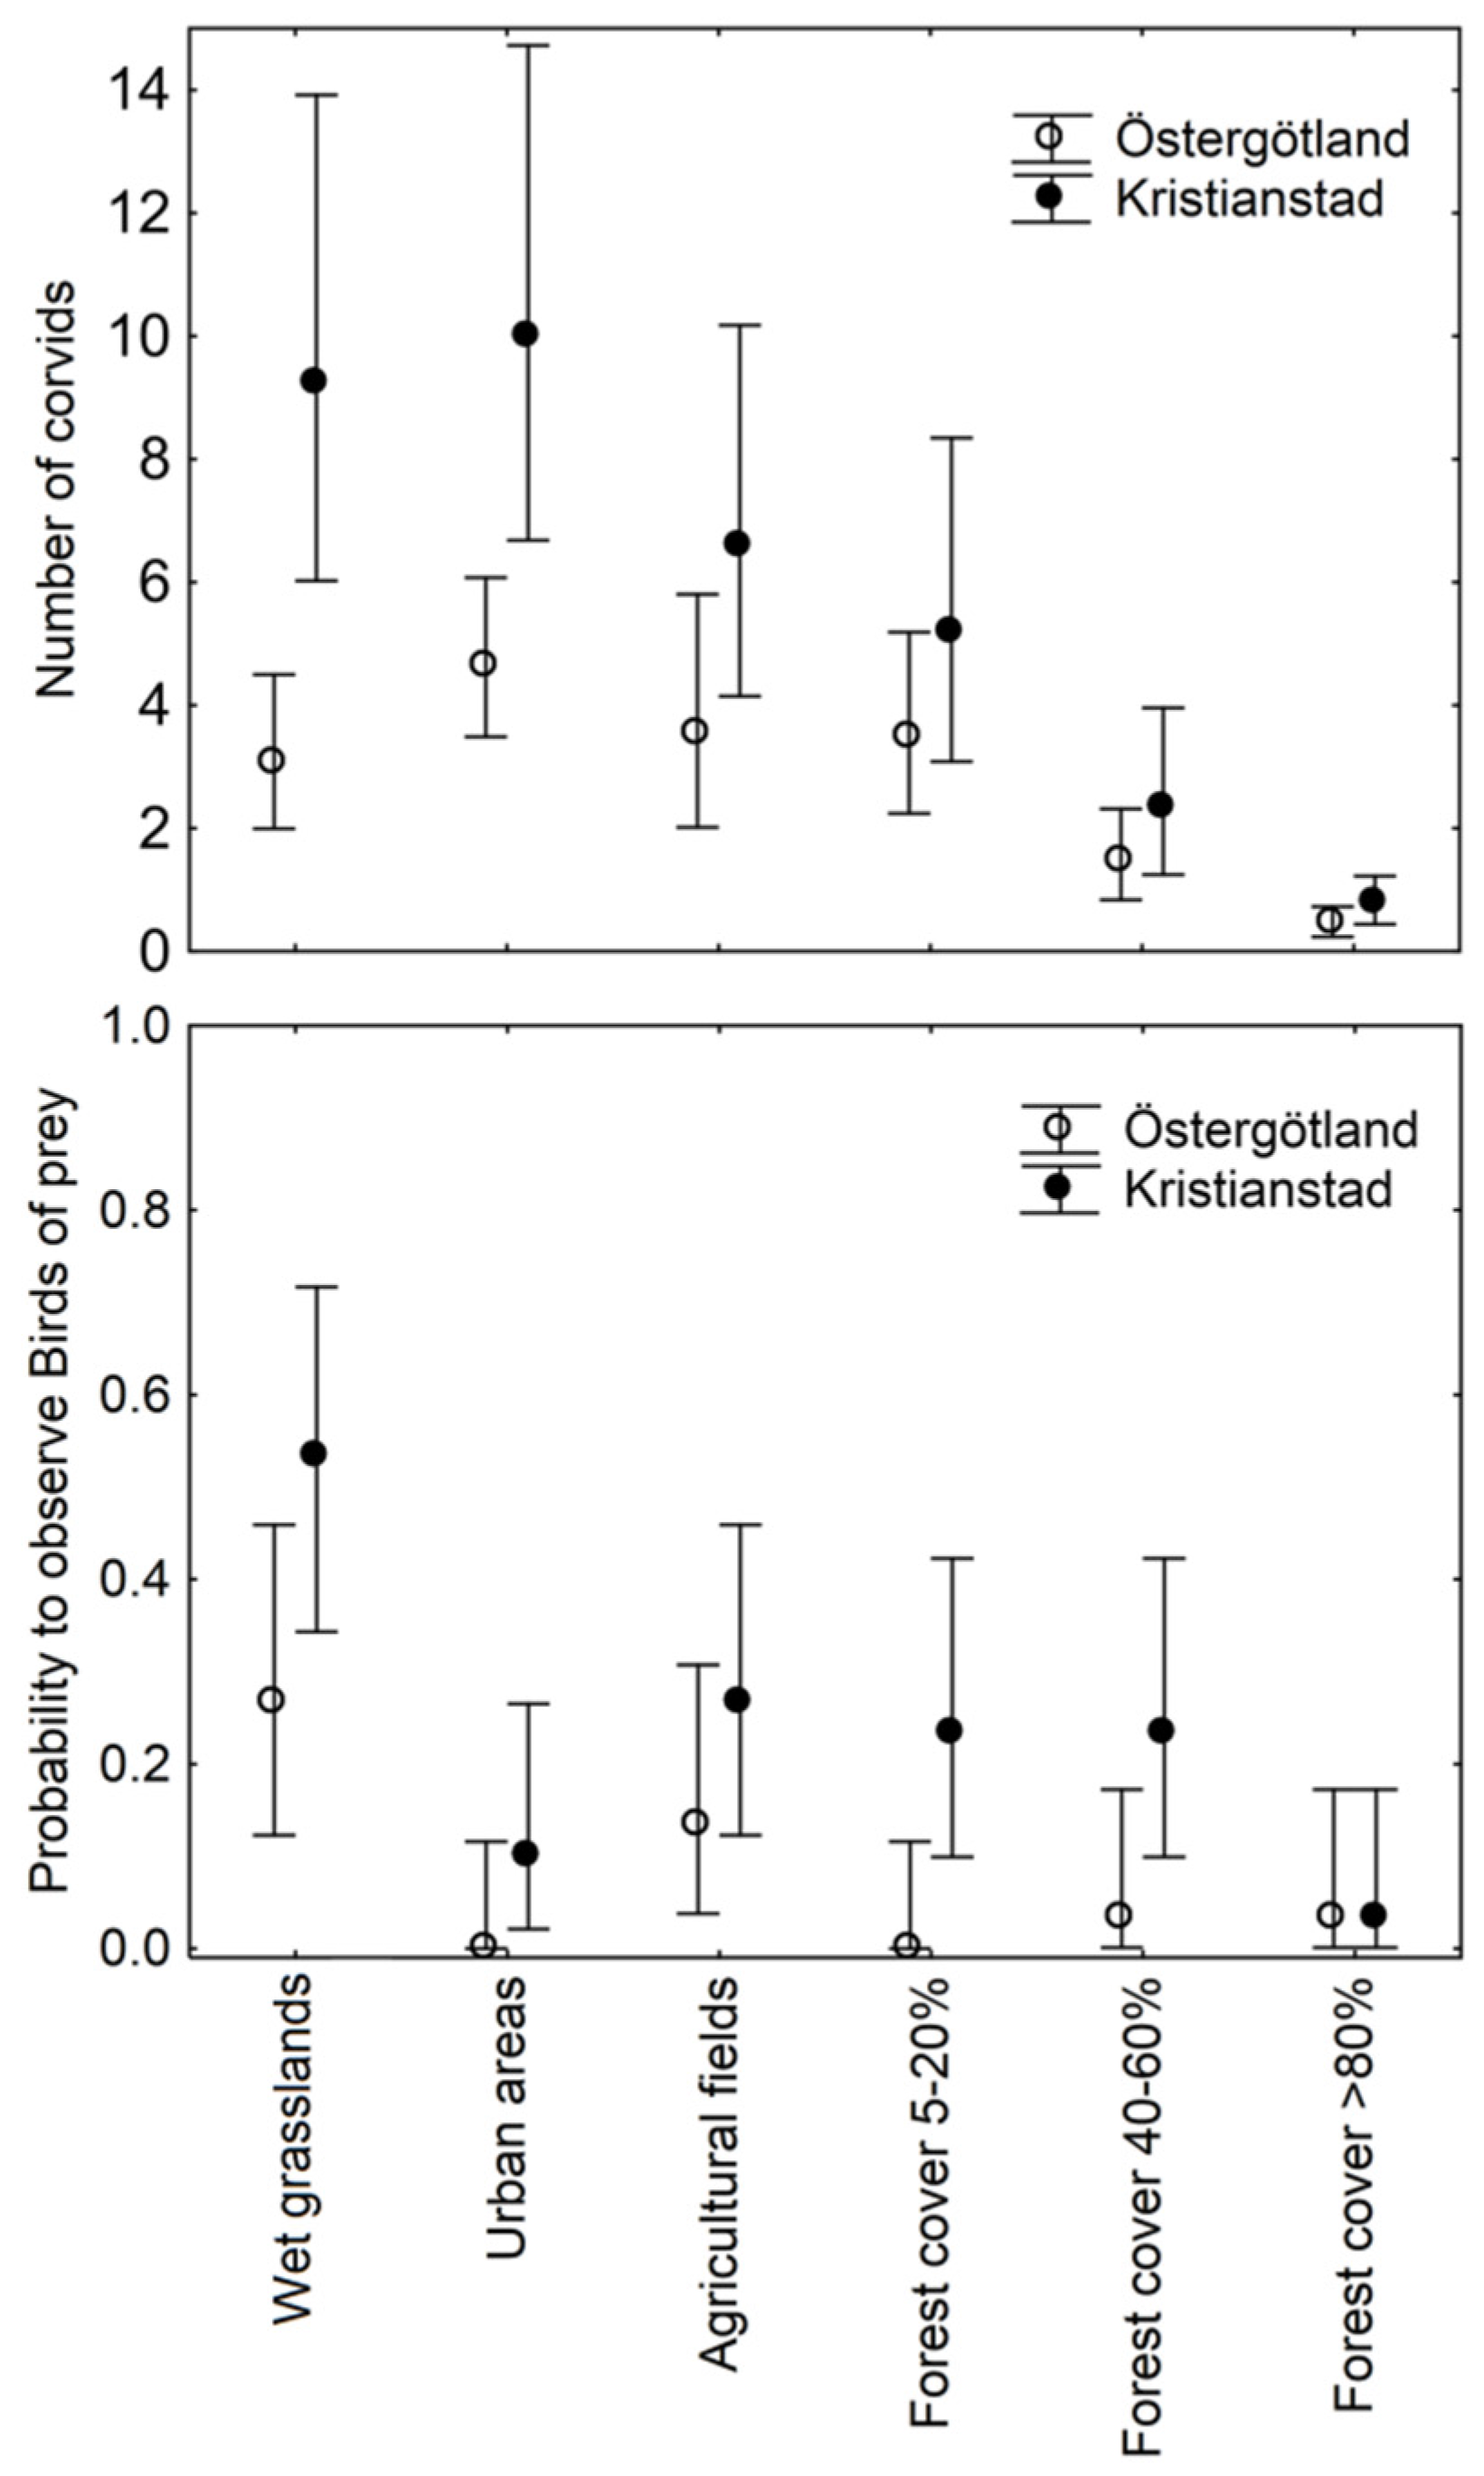
3.2. Landscape Avian Predator Counts during the Latter Part of the Breeding Season

Mean corvid numbers were higher in Kristianstad compared to Östergötland for all land cover strata, and significantly higher for two: wet grasslands and urban areas (Figure 5). In addition, for birds of prey, Kristianstad exhibited higher mean numbers than Östergötland for all land covers except when forest cover was >80%. However, confidence intervals overlapped for the other land covers (Figure 5). In total 6 corvid species among 2695 individuals, and 7 birds of prey species among 88 individuals, were observed during the landscape avian predator counts (Table 2).

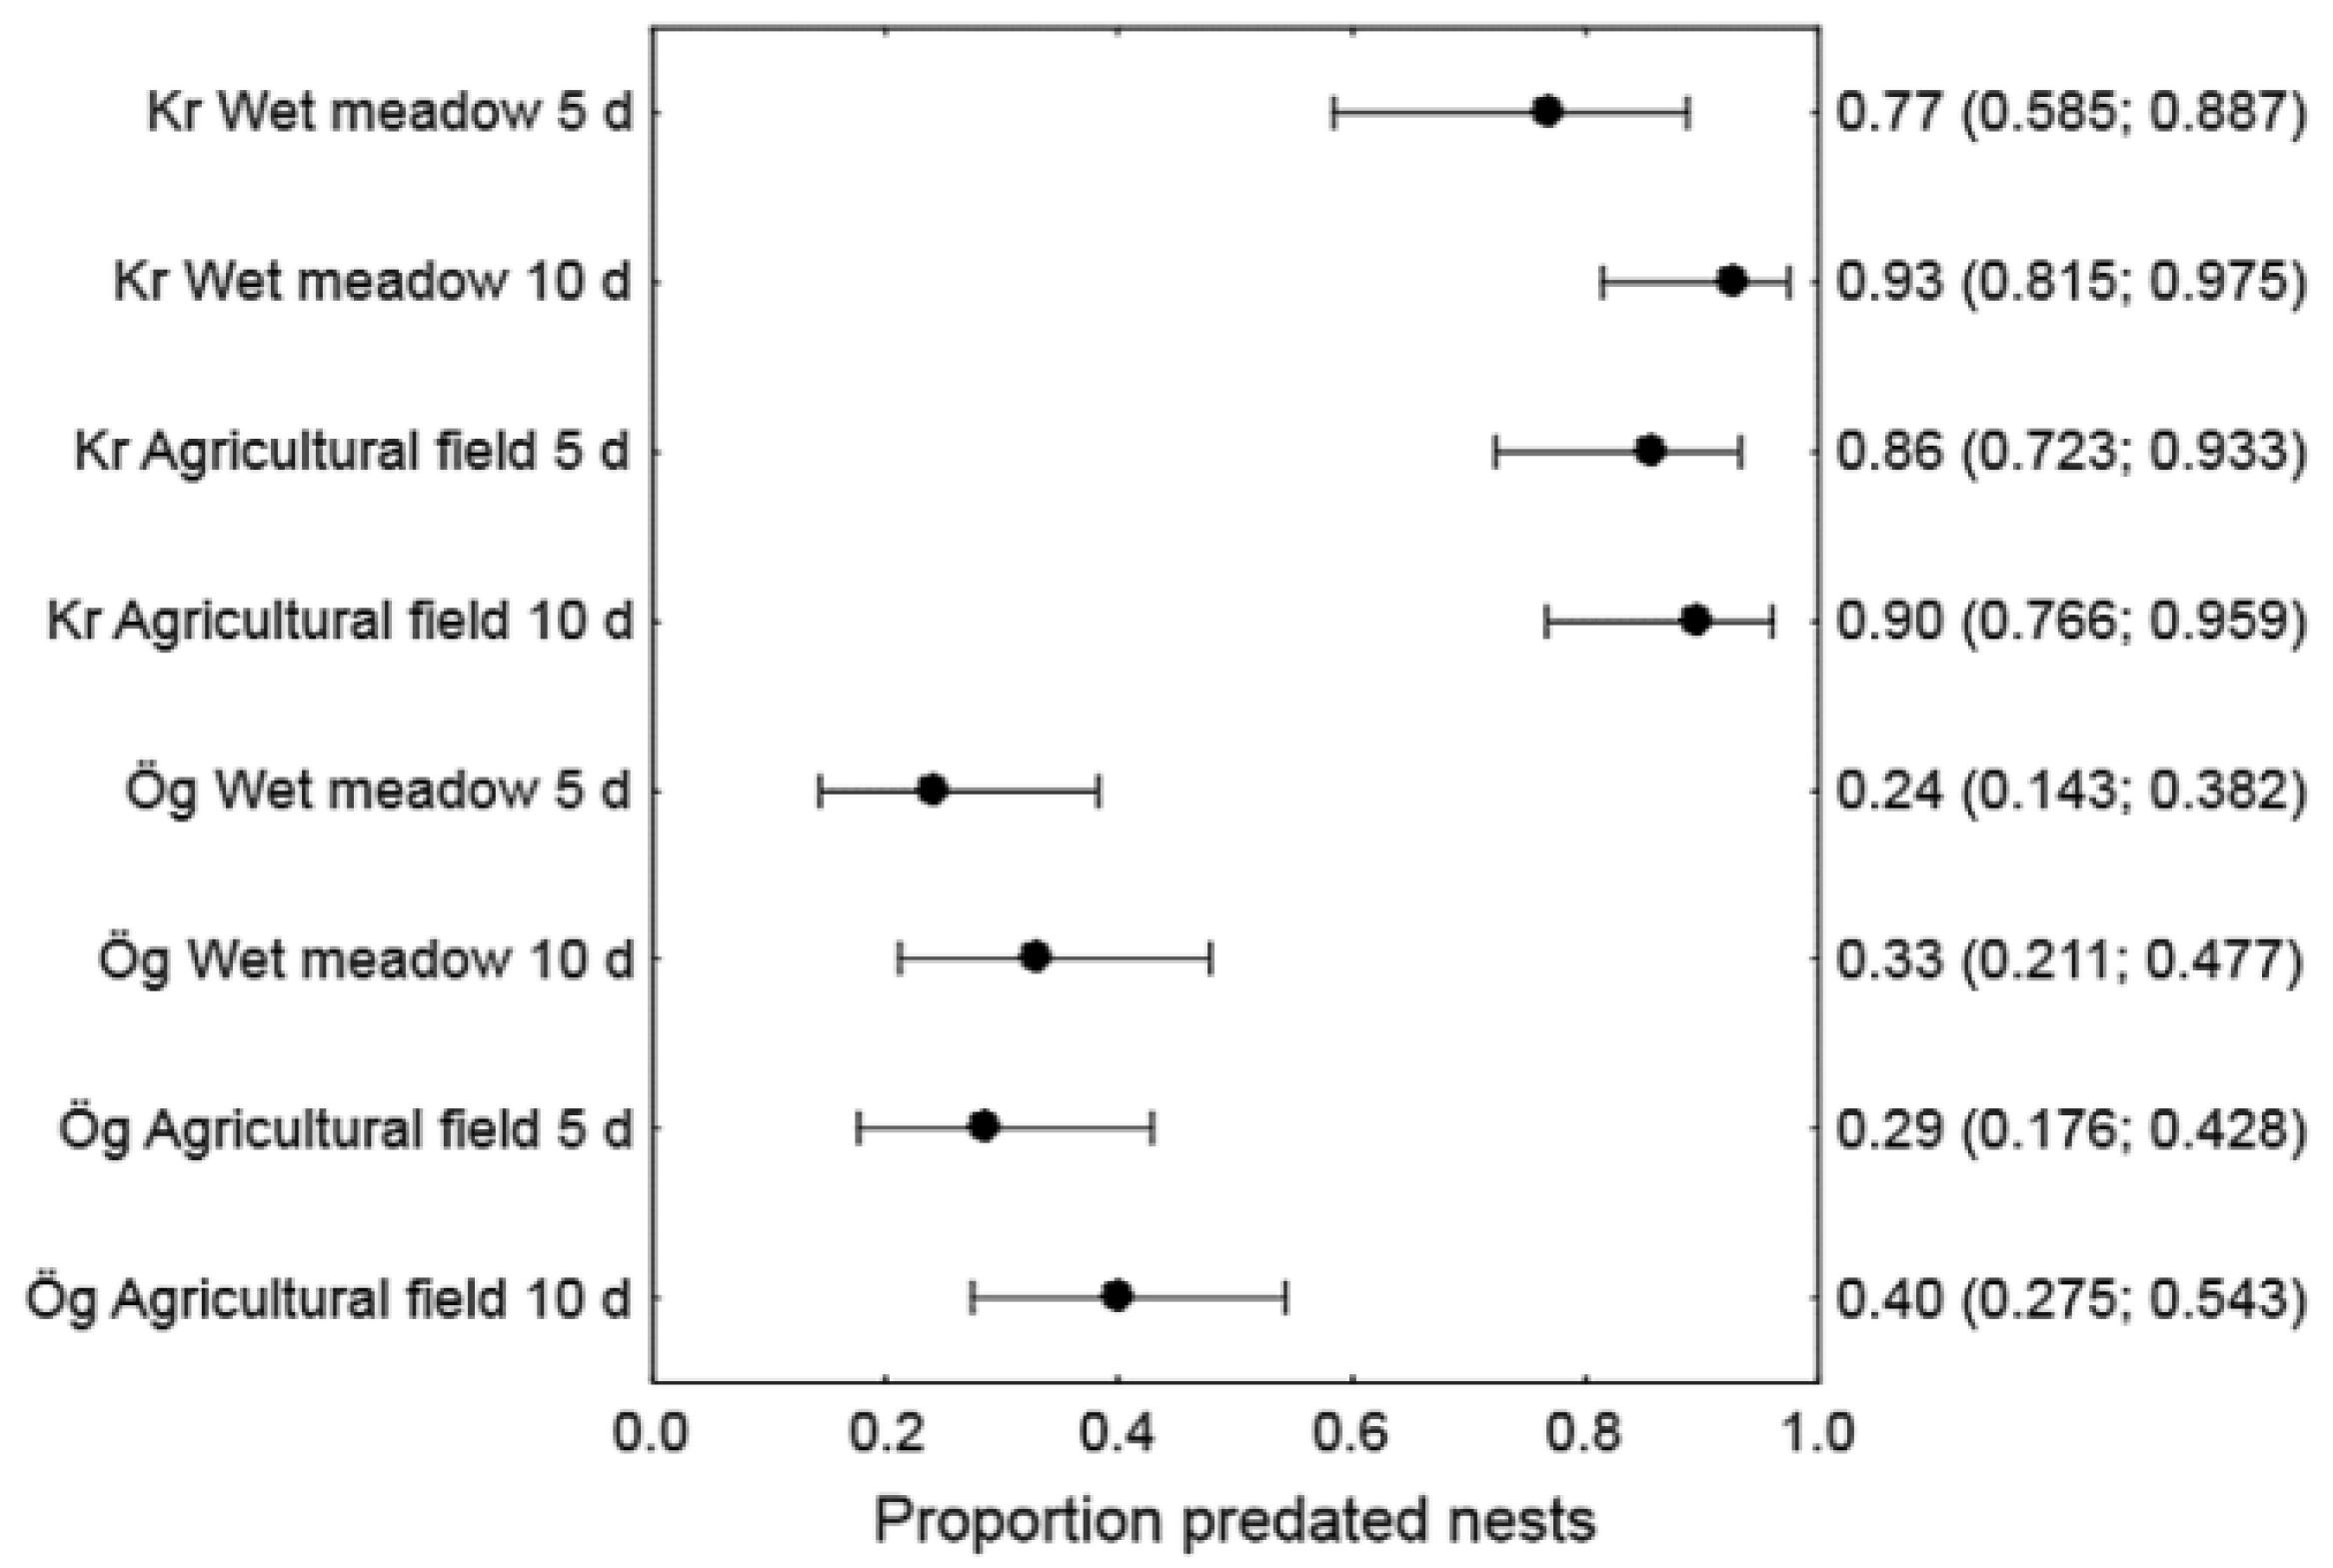
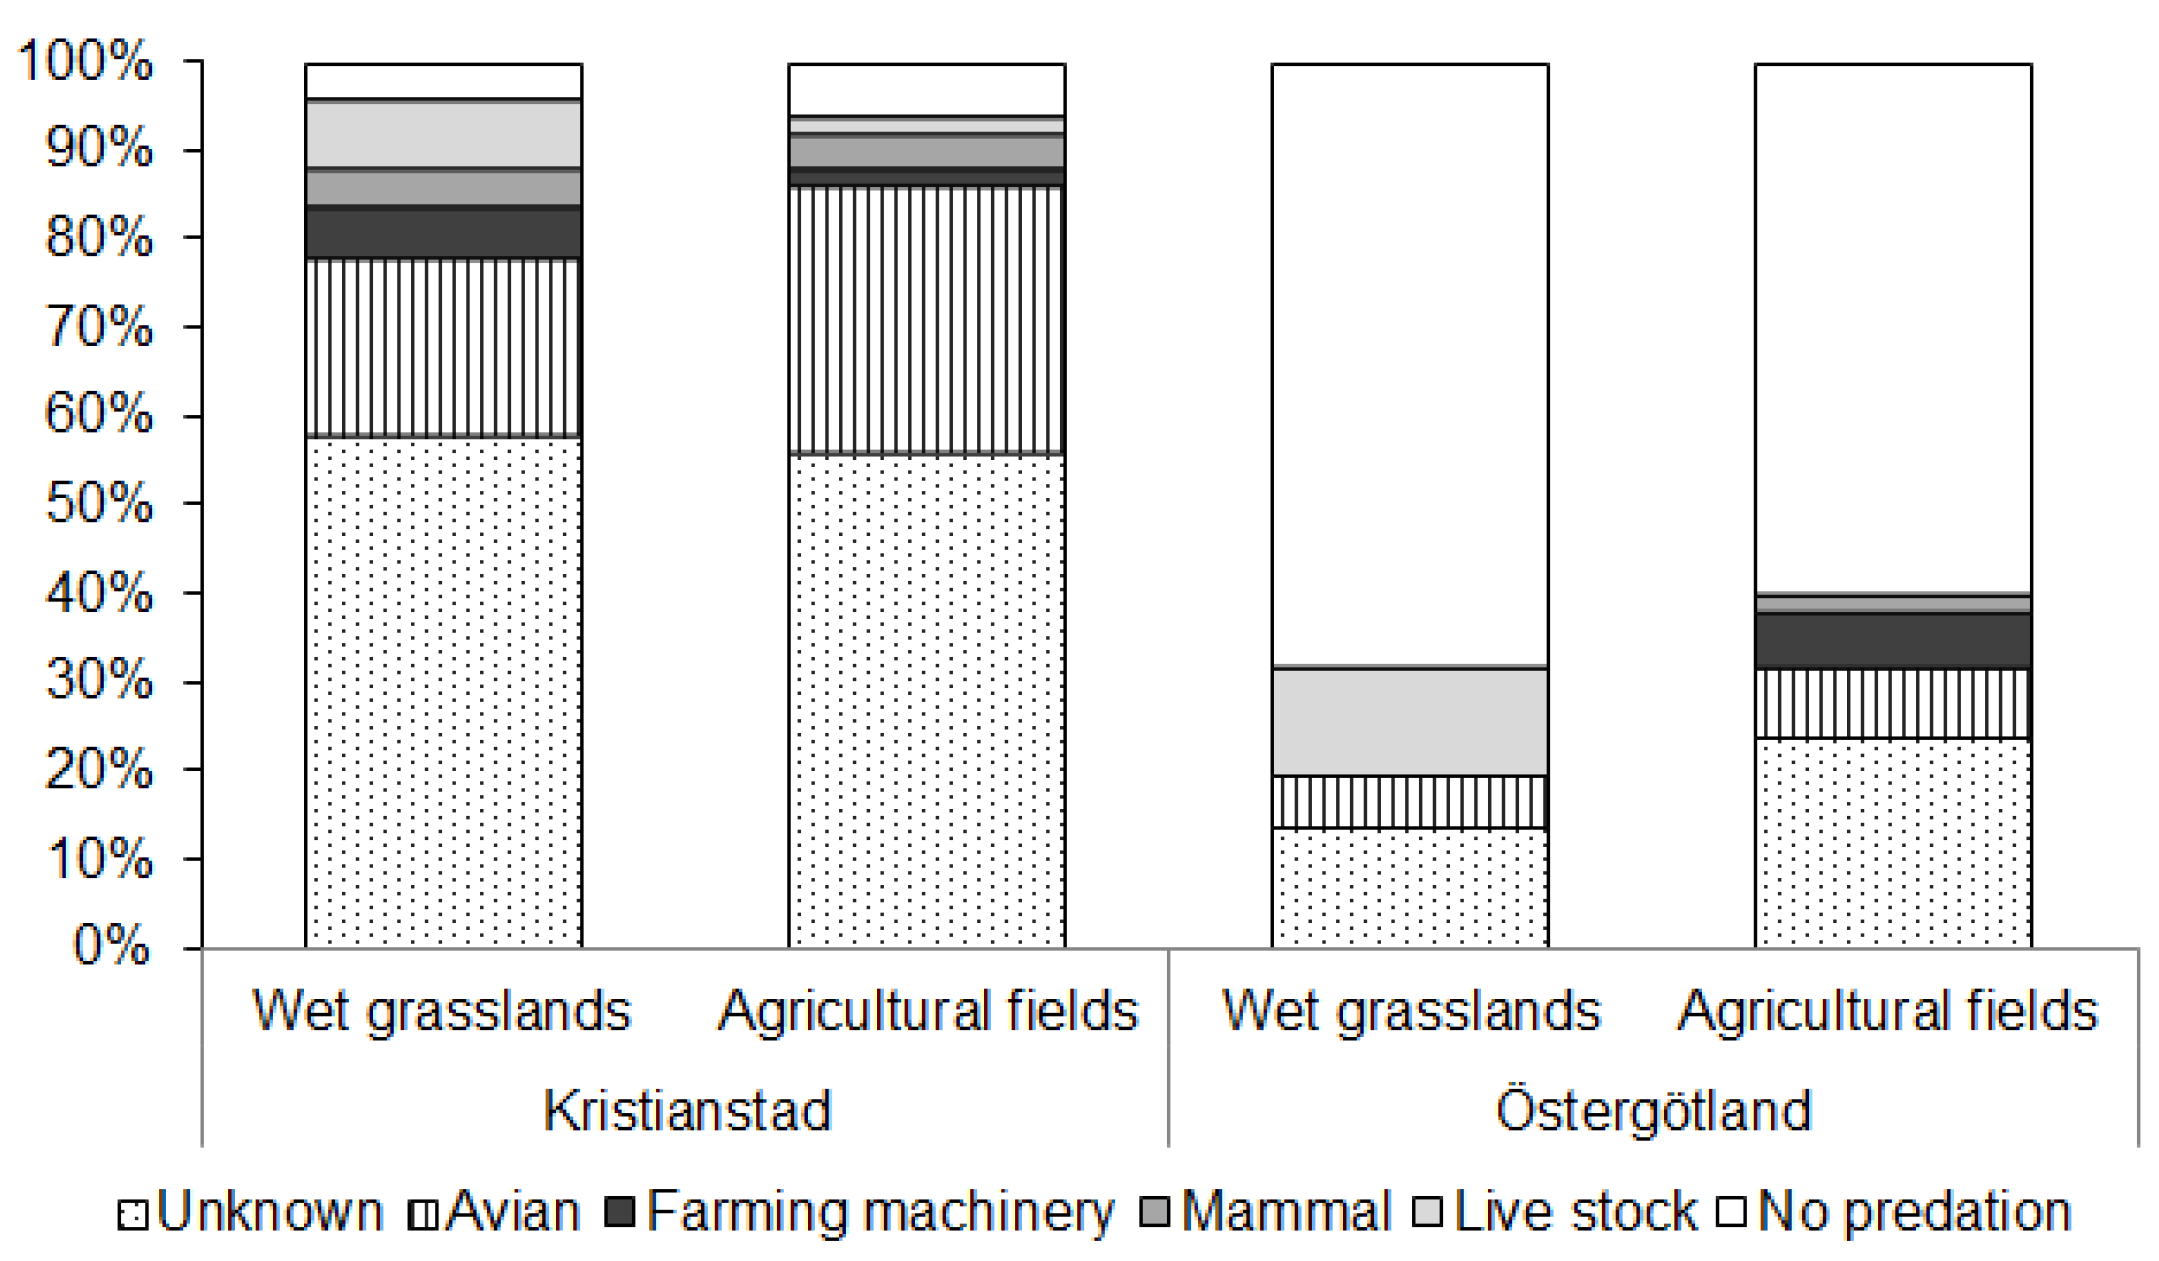
3.3. Artificial Nest Predation

The predation rates on artificial nests over the 10-day period were on average 95% in Kristianstad versus 36% in Östergötland. This applied both to wet grasslands and agricultural fields (Figure 6). The cause of predation/destruction of artificial nests was sometimes visible. Avian predators, mammals, livestock and human farming practices all contributing to the demise of the artificial nests (Figure 7). Nevertheless, for the majority of the eggs that were damaged or missing a perpetrator could not be distinguished and were categorized as unknown. Even though the majority of the eggs were gone with no obvious signs, we assume that the eggs were preyed upon by either avian predators or mammals. On several occasions during the field work, crows traversing the sky carrying eggs were observed. Red Fox (Vulpes vulpes) were observed also with in the vicinity of the nest predation experiments in the KVBR landscape. Trampling from cows and horses was clearly higher in the wet grasslands compared to the agricultural fields.

4. Discussion

4.1. Management of Trophic Interactions and Land Covers

All three predictions made based on the hypothesis that predation of nests and young is a factor that contributes to the difference between rapidly declining and stable wader populations were upheld. First, the rapid assessment of the avian predation index ratio in the wet grasslands with favorable management status resulted in a three times as high ratio in Kristianstad compared to Östergötland. Second, the corvid observations, and to some extent the birds of prey observations, were higher in wet grasslands within the Kristianstad landscape compared to the Östergötland landscape. Third, the predation rates on artificial nests were much higher in Kristianstad compared to Östergötland. Therefore, we cannot reject the hypothesis that high predation pressure contributes to wader decline in Kristianstad. Hence, this is a factor that should be considered when planning and implementing wader conservation strategies.
In southern Sweden, corvids, birds of prey and gulls are the main avian predators. Populations of both corvids and birds of prey have grown in numbers over the past 30 years in southern Sweden. Corvid birds are often positively linked to human presence and activity [75], and have an adverse influence on breeding success of ground-nesting birds such as waders (e.g., [46,56,76,77]). Birds of prey have increased from historically low levels in the mid-1970s, which was caused by hunting and pollution from farm chemicals in Sweden [24,78,79]. Efforts to rehabilitate populations of birds of prey have been successful in southernmost Sweden’s Scania County where Kristianstad is located. For example, the Red Kite (Milvus milvus) population has been supported successfully by winter feeding in Scania and is becoming common [79,80]. Moreover, corvids are resident all year round and Scania provides wintering grounds for a number of birds of prey (Table 3). Ultimately, however, the increase in avian predator populations may be caused by a number of factors, such as changes in land use, vegetation change, re-introduction programs, milder winters and reductions in hunting and policy change that protects avian predators [81,82].
Also in other studies, predation has been reported to negatively affect wader populations. Berg [82] and Seymour et al. [85] suggest that a declining wader population could lead to reduced effectiveness of active adult defense against nest and chick predation and that smaller populations of waders maybe more susceptible to predation. Additionally, Bolton et al. [86] indicated that predator control can result in increased wader breeding success, but only at sites where predator densities are high. Indeed, some avian predator removal experiments have shown that the nesting success of ground nesting birds increases when predators are removed (e.g., [87,88]). However, Norrdahl et al. [89] suggest that the presence of certain birds of prey, e.g., Kestrels (Falco tinnunculus), may benefit wader populations by keeping other predators away, but only if predator numbers and species are actively managed.
In addition to birds, mammals such as Red Fox, Badger (Meles meles), Hedgehog (Erinaceus europaeus) and Mink (Mustela lutreola), are also recognized as predators of waders [56,57,90,91]. In a Danish study, Olsen [92] showed that mammals also heavily prey upon on wader eggs, and pointed out that wader defense mechanisms are not effective against the nocturnal foraging habits of many mammals. Smart et al. [55] states that ground predators, such as mammals, prefer to use dry site corridors to forage in wet areas. Thus, the trend of drainage and drier grasslands, as in Kristianstad, may aid mammal predation on waders. Therefore, further analyses of the role of predation need to be complemented by comparative studies of mammal predators and mammal predation.
The protection of nesting sites and nests via fences and nest cages provide short term solutions against predation, but does not provide a realistic long term solution to wader decline [92,93]. Observations by Smith et al. [94] and Ivan and Murphy [95], show that fences and cages can increase wader hatching success, but as a consequence the rate of predation on incubating adult waders increases. Whilst fences and cage may work on a small scale they are costly, and require ongoing maintenance. Our use of artificial nests as a proxy to indicate the risk of avian predation on wader nests is appropriate for comparative studies among wader landscapes. However it does not take into account the natural defense mechanisms (e.g., alarm calling, mobbing and nesting location) of waders which often guard nests against avian and mammal predators (cf. [96]). Moreover, Dyrcz et al. [96] showed wader nest survival is greater in open areas with larger populations and where nests are situated closer together.
Pearce-Higgins and Grant [97] and Wilson et al. [98] showed that the rate of predation on wader nests greatly increases when bushes, shrubs and trees are present on or near habitat patches, thus providing perches for predators. In contrast, a study by Ottvall et al. [99] indicates that wader nest survival rates were not related to the distance to habitat edges or other features used by predators. Accordingly, as noted by Ottvall [91] reductions of predator habitat solely within in wet grasslands may not lead to a decrease predation on waders. In addition to predation, grazing livestock destroyed artificial nests (cf. [100]). Studies indicate that cattle become problematic to wader breeding when cattle are stocked at >2 head·ha−1 [100], and may then trample between 35% and 70% of wader nests [101].
To conclude, this study indicates that the number of predators in a landscape with wet grasslands could be one factor that influences the breeding success of waders in southern Sweden (cf. [82]). Increased numbers of avian predators may thus lead to higher nest predation rates, and subsequently cause local extirpation, or drive waders to seek alternate breeding areas (see also Norrdahl et al. [89], Loman and Göransson [102]). We therefore, agree with Bell and Merton [103] and Stien et al. [87] that generalist predators, such as corvids, may act to accelerate the decline in wader populations, and consequently contribute to increasing the risks of local population extinction. Hence, predator behavior and composition need to be considered at the landscape scale as applied in this study.
Generally, including the KVBR, the Black-tailed Godwit is used as a flagship species for habitat restoration and management of wet grasslands [35,104,105]. In Western Europe Gill et al. [34] suggested that Black-tailed Godwit decline is linked to agricultural intensification. In contrast to the general decline trend in Western Europe, Lapwing and Black-tailed Godwit populations on the German Wadden Sea Islands have increased over the past three decades through immigration and not due to improved breeding success [106]. Likewise, the Icelandic Black-tailed Godwit (Limosa limosa islandica) population has rapidly increased through a believed improvement in climatic conditions and habitat leading to larger and better quality breeding and foraging areas [34]. However, it should also be noted that Iceland has only one mammal predator, the Arctic fox (Alopex lagopus) [107], and only one corvid species, the Raven [108].

4.2. Towards Governance of Wet Grasslands as a Green Infrastructure

Unfortunately, the results of habitat restoration for the conservation of waders have not been successful in the long term [52,109]. In Kristianstad, attempts to restore habitat have shown similar results with increases in waders for several years before continuing to decline [25]. Thus, habitat restoration requires habitat maintenance with a long-term strategy [59]. There are strong arguments for targeting several locally limiting factors for wader populations simultaneously, instead of focusing on mitigation of one factor alone [58,110]. Furthermore, there is increasing evidence that the abundance and breeding success of waders within patches of high quality habitat are not only dependent on processes within their patch, but also on processes and quality of habitat within the surrounding landscape [64]. Thus, habitat is not only about patch quality and size linked to vegetation characteristics, but also about trophic interactions, such as predation in this study [53,111,112]. Therefore, wetland management and habitat restoration efforts cannot just focus on the wet grasslands patches, but need to expand into the surrounding landscape and include both pattern and process. This complexity of wader conservation thus requires taking a landscape approach perspective [3,69,113,114,115]. This implies the inclusion of both entire ecological systems at multiple spatial scales, and social systems in terms of managers and governors of land use at multiple levels [116].
Regarding ecosystems, the first step is to extend the spatial scale from individual habitat patches for waders, to the spatial extent relevant for predator communities. Our comparison of avian predator assemblages and predation pressure in entire wet grassland landscapes with declining and stable wader populations supports this approach. Other hypotheses include the amount and quality of habitat and the spatial configuration of each wet grassland patch and the surrounding area. Such hypotheses can be tested by making comparisons of landscapes with different wader population status, or by applying retrospective studies using historical land cover maps and historical wader data analogous to the work by Paltto et al. [117]. The first approach is to use multiple landscapes as case studies, which should vary in size, habitat type and quality, assemblages of breeding wader populations and predators as well as landscape management practices, including both unfavorable and favorable conservation status. For example, Wallin et al. [118] analyzed surveys of waders during a 10-year period on 89 wet grassland patches on the island of Öland in SE Sweden. For most waders, they found significant relationships between breeding density and grassland management. However, the variation explained was low. To address regional level differences in Europe, the near-natural trans-border Pripyat-Stokhid-Prostyr Ramsar wetland area across the Belarus-Ukraine border, and the downstream Turov grasslands in Belarus, are good examples of wet grassland landscapes still hosting abundant wader populations [119]. The second approach is to compare long-term wader trends with analyses of land cover and land use change over time. For Dunlin, Ruff and Black-tailed Godwit, Thorup [120] showed that there were strongly divergent population trends among Danish areas with different management. This clearly indicates that the recent declines are caused by factors within the breeding areas rather than by more general factors like climate change or pollution. Thorup’s [32] review of breeding birds and factors influencing them on the wet grasslands at Tipperne in Denmark is a lucid example. Being cultural landscapes, wet grassland transform into marsh or scrub unless they are mowed or grazed. Additional factors were drainage, fertilization as well as effects of mammalian predators and birds of prey. Long-term studies on the influence of climate on the abundance of wintering waders show substantial shifts of up to 115 km, generally in a north-easterly direction [121].
Additionally, social system factors at multiple levels need to be included in wader conservation. Locally, the important contribution from amateur ornithologists, who provide the base data for documenting wader population trends needs to be acknowledged and encouraged (e.g., [122]). Similarly, the EU has introduced agro-environmental schemes by offering land managers financial incentives to conserve, manage and restore wet grassland habitats for cultural and biodiversity purposes [54]. However, knowledge about ecosystems and management actions of stakeholders at multiple levels from habitat patches to entire landscapes need to be integrated among different sectors and levels of governance. Indeed these principles are advocated by the Ramsar [123] and Biosphere Reserve [124] concepts. Conservation objectives may also conflict with each other, such as the conservation of birds of prey and waders [125,126]. In Kristianstad the efforts to conserve wader habitat was paralleled by encouraging breeding of Peregrine Falcon (Falco peregrinus) on the city’s water tower located in the center of the KVBR wetland complex, and less than a km from one of the main wet grassland patches for Black-tailed Godwits. Good breeding results of adult Peregrine Falcons were stopped by illegal poisoning in 2012. When subsequently inspecting their nest box, remnants of five Black-tailed Godwits were found, one of them ringed as adult breeding in 1999 in the KVBR area [127]. This interestingly highlights the delicate balance among different conservation goals. Therefore, to conserve waders, wetland landscapes must be treated as coupled ecological and social systems, both of which need to be diagnosed with respect to functionality.
Following the Seville strategy [124], Biosphere Reserves are designed to reconcile conservation of biodiversity, the quest for economic and social development, and the maintenance of associated cultural values. To meet the requirements of the Biosphere Reserves’ conservation, development, and logistic support functions an effective Biosphere Reserve should thus involve natural and social scientists, conservation and development groups, management authorities and local communities [128]. Correspondingly, Ecomuseums, founded by Rivière and Varine in France in the early 1970s [129], are designed to function with a joint partnership between a public authority and the local community. The aim is to actively engage the community to preserve, interpret, and manage their heritage by providing a sense of identity to society, conserving natural and cultural assets and promoting economic growth [130,131]. The Ecomuseum philosophy focuses on the local community as the most important stakeholder and is driven by community empowerment and democracy towards sustainable development [129,132]. Therefore, the ultimate aim of these concepts are thus clearly to contribute to the implementation of ecological sustainability and resilience.
This study shows that, in spite of extensive praise (e.g., [5,15]) these innovative multi-level governance arrangements have so far not succeeded in maintaining viable populations of waders as focal species for ecological sustainability of wet grasslands in Kristianstad. The same conclusion applies to upstream and downstream ecological sustainability issues such as brownification within the Helge å River catchment [133], and the effects the rapid increase of Greylag geese has had on Lake Hammarsjön and the surrounding wetland vegetation [8,18].
To succeed with wet grassland conservation for waders, improved knowledge of what constitutes good habitat is needed, including land use and land cover at multiple scales, as well as trophic interactions. Additionally, improved collaboration among landscape stewards and land managers is needed both regarding land cover management, and management of factors affecting predator densities. This includes both knowledge production and learning (see [134]) about ecological sustainability among public actors such as the regional county administrative boards, municipalities and a large number of individual farmers. In both Kristianstad and Östergötland there are many land owners, which creates challenges for the implementation of a landscape approach based on collaborative management across land ownership borders. For example, at the habitat patch level the beneficiaries of agri-environmental schemes are individual farmers as business enterprises. This complicates co-ordination among neighboring land owners, which results in short-term commitments to manage individual wet grassland patches, which often have several land owners. Additionally, different levels of governance are poorly integrated [135,136]. We emphasize the need for integrated studies that assess the present governance process and its outputs in terms of management actions, and finally the consequences on the ground, such as wet grasslands as a functional green infrastructure for viable populations of waders (see [16]). Additionally, values and attitudes of stakeholders and actors must be understood (e.g., [9]), as well as incentives that may promote a landscape approach for wader conservation at multiple spatial scales. However, if governance approaches can be improved is questionable without considerable financial and human investment in both ecological and social systems.
Whilst the emphasis of this study is placed on ecological sustainability for wader conservation, it should be noted that the KVBR is ultimately managed and governed to achieve a general balance between ecological, economic and social systems. Within the Kristianstad landscape, society has been encouraged to consider the importance of green infrastructure not only for species conservation, but also for human well-being [137,138]. The KVBR in the Kristianstad landscape provides a good example of human green space interactions with tourism and outdoor recreation being highly promoted, accommodated for and undertaken [139]. Wet grasslands are one such highlight within the KVBR that draws in visitors to experience Crane (Grus grus) feeding during migration, cattle grazing, bird watching or to just experience nature for recreational purposes. Hence, future studies of wet grasslands as green infrastructures should encompass both the viability of focal wild species, and different aspects of human well-being.

5. Conclusions

Contrary to the aim of Ecomuseums and Biosphere Reserves as learning sites for sustainable development, and as emerging novel governance arrangements towards ecological sustainability and resilience, wader conservation in Kristianstad has not been successful. This study cannot reject the hypothesis that predation contributes to wader decline. However, ultimately, predation might not be the only or even most important factor causing wader decline. Complex long-term changes in land management that affects habitat quality and amount, as well as trophic interactions, at multiple scales from patches to entire landscapes requires further research. We therefore stress the need to use multiple landscapes as case studies that represent viable, declining and extirpated wader populations. Additionally, different approaches to landscape governance need to be examined to understand if and how wader populations can be sustained in the long term.

Acknowledgments

We acknowledge the valuable input from Adam Bergner, Hans Cronert, Jonas Dahl, Sven-Erik Magnusson, Per Saarinen and Erik Ederlöf, and a special thanks to, Johan Elmberg, Tomas Hahn, Jennifer Hauck and Ole Thorup for inspiring comments on the manuscript. This work was funded by a grant from the Swedish research council FORMAS to PA.

Author Contributions

Michael Manton and Per Angelstam conceived and designed the experiments; Michael Manton and Per Angelstam performed the experiments; Michael Manton, Per Angelstam and Per Milberg analyzed the data; Michael Manton, Per Angelstam, Per Milberg and Marine Elbakidze wrote the paper.

Conflicts of Interest

The authors declare no conflict of interest. The funding sponsors had no role in the design of the study; in the collection, analyses, or interpretation of data; in the writing of the manuscript, and in the decision to publish the results.

Abbreviations

The following abbreviations are used in this manuscript:
KVBRKristianstad Vattenrike Biosphere Reserve

References

  1. Norgaard, R.B. Ecosystem services: From eye-opening metaphor to complexity blinder. Ecol. Econ. 2010, 69, 1219–1227. [Google Scholar] [CrossRef]
  2. European Commission. Green Infrastructure (GI)—Enhancing Europe’s Natural Capital. Available online: http://eur-lex.europa.eu/legal-content/EN/TXT/?uri=celex%3A52013DC0249 (accessed on 28 March 2016).
  3. Axelsson, R.; Angelstam, P.; Elbakidze, M.; Stryamets, N.; Johansson, K.-E. Sustainable development and sustainability: Landscape approach as a practical interpretation of principles and implementation concepts. J. Landsc. Ecol. 2011, 4, 5–30. [Google Scholar] [CrossRef]
  4. Elbakidze, M.; Hahn, T.; Mauerhofer, V.; Angelstam, P.; Axelsson, R. Legal framework for biosphere reserves as learning sites for sustainable development: A Comparative analysis of Ukraine and Sweden. Ambio 2013, 42, 174–187. [Google Scholar] [CrossRef] [PubMed]
  5. Millennium Ecosystem Assessment. Ecosystems and Human Well-Being: Synthesis; Island Press: Washington, DC, USA, 2005. [Google Scholar]
  6. Hahn, T.; Olsson, P.; Folke, C.; Johansson, K. Trust-building, knowledge generation and organizational innovations: The role of a bridging organization for adaptive comanagement of a wetland landscape around Kristianstad, Sweden. Hum. Ecol. 2006, 34, 573–592. [Google Scholar] [CrossRef]
  7. Ekberg, B.; Nilsson, L. Skånes Fåglar Idag och i Gången tid; Signum: Lund, Sweden, 1994. (In Swedish) [Google Scholar]
  8. Magnusson, S.-E.; Magntorn, K.; Wallsten, E.; Cronert, H.; Thelaus, M. Kristianstads Vattenrike Biosphere Reserve Nomination Form; Springer: Berlin, Germany, 2004. [Google Scholar]
  9. Lindström, M.; Johansson, M.; Herrmann, J.; Johnsson, O. Attitudes towards the conservation of biological diversity—A case study in Kristianstad Municipality, Sweden. J. Environ. Plan. Manag. 2006, 49, 495–513. [Google Scholar] [CrossRef]
  10. Schultz, L.; Folke, C.; Olsson, P. Enhancing ecosystem management through social-ecological inventories: Lessons from Kristianstads Vattenrike, Sweden. Environ. Conserv. 2007, 34, 140–152. [Google Scholar] [CrossRef]
  11. Olsson, P.; Folke, C.; Galaz, V.; Hahn, T.; Schultz, L. Enhancing the fit through adaptive co-management: Creating and maintaining bridging functions for matching scales in the Kristianstads Vattenrike Biosphere Reserve Sweden. Available online: http://www.ecologyandsociety.org/vol12/iss1/art28/ (accessed on 28 March 2016).
  12. Olsson, P.; Schultz, L.; Folke, C.; Hahn, T. Social networks for ecosystem management: A case study of Kristianstads Vattenrike, Sweden. In The Centre for Interdisciplinary Environmental Research (CTM); Stockholm University: Stockholm, Sweden, 2007. [Google Scholar]
  13. Hahn, T. Self-Organized Governance Networks for Ecosystem Management: Who Is Accountable? Available online: http://www.diva-portal.org/smash/record.jsf?pid=diva2%3A468735&dswid=-3101 (accessed on 28 March 2016).
  14. Tuvendal, M. Ecosystem Services—A Tool in Sustainable Landscape Management. Ph.D. Thesis, Stockholm University, Stockholm, Sweden, 2012. [Google Scholar]
  15. Walker, B.; Salt, D. Resilience Thinking: Sustaining Ecosystems and People in a Changing World; Island Press: Washington, DC, USA, 2006. [Google Scholar]
  16. Rauschmayer, F.; Berghöfer, A.; Omann, I.; Zikos, D. Examining processes or/and outcomes? Evaluation concepts in European governance of natural resources. Environ. Policy Gov. 2009, 19, 159–173. [Google Scholar] [CrossRef]
  17. Lundquist, L. Implementation Steering. An Actor-Structure Approach; Studentlitteratur: Lund, Sweden, 1987. [Google Scholar]
  18. Tuvendal, M.; Elmberg, J. A handshake between markets and hierarchies: Geese as an example of successful collaborative management of ecosystem services. Sustainability 2015, 7, 15937–15954. [Google Scholar] [CrossRef]
  19. Ottosson, U.; Ottvall, R.; Elmberg, J.; Green, M.; Gustafsson, R.; Haas, F.; Holmqvist, N.; Lindström, Å.; Nilsson, L.; Svensson, M.; et al. Fåglarna i Sverige—Antal och Förekomst; SOF: Halmstad, Swedish, 2012. [Google Scholar]
  20. Lindström, Å.; Green, M. Monitoring Population Changes of Birds in Sweden; Annual Report for 2012; Department of Biology, Lund University: Lund, Sweden, 2013; p. 80. [Google Scholar]
  21. Nilsson, S. Skandinavisk Fauna. Foglarna; Första Bandet. Available online: http://www.bokborsen.se/S-Nilsson/Skandinavisk-Fauna-Foglarna-Andra-Bandet/5515892 (accessed on 28 March 2016). (In Swedish)
  22. Ihse, M. Swedish agricultural landscapes—Patterns and changes during the last 50 years, studied by aerial photos. Landsc. Urban Plan. 1995, 31, 21–37. [Google Scholar] [CrossRef]
  23. Wretenberg, J.; Lindström, A.; Svensson, S.; Pärt, T. Linking agricultural policies to population trends of Swedish farmland birds in different agricultural regions. J. Appl. Ecol. 2007, 44, 933–941. [Google Scholar] [CrossRef]
  24. Ottvall, R.; Edenius, L.; Elmberg, J.; Engström, H.; Green, M.; Holmqvist, N.; Lindström, Å.; Pärt, T.; Tjernberg, M. Population trends for Swedish breeding birds. Ornis Svec. 2009, 19, 117–192. [Google Scholar]
  25. Cronert, H. Strandängsfåglar längs nedre Helgeån i Kristianstads Vattenrike 2009—Med jämförelser bakåt i tiden. Anser 2010, 2, 79–94. (In Swedish) [Google Scholar]
  26. Cronert, H. Strandängsfåglar i Vattenriket. Häckfågelkarteringarna och simultanräkningar. Spoven 2014, 1, 1–19. (In Swedish) [Google Scholar]
  27. Cronert, H.; Lindblad, T. Strandängsinventering—Längs nedre Helgeån i Kristianstads Vattenrike våren 2003. Anser 2004, 43, 65–78. [Google Scholar]
  28. Ottvall, R.; Cronert, H.; Flyckt, G.; Lindblad, T.; Olofsson, P.; Strandberg, R.; Waldemarsson, N. Rödspoven i Kristianstads Vattenrike 2008. Anser 2009, 48, 1–10. [Google Scholar]
  29. Bildstein, K.L.; Bancroft, G.T.; Dugan, P.J.; Gordon, D.H.; Erwin, R.M.; Nol, E.; Payne, L.X.; Senner, S.E. Approaches to the conservation of coastal wetlands in the western hemisphere. Wilson Bull. 1991, 103, 218–254. [Google Scholar]
  30. Brinson, M.M.; Malvárez, A. Temperate freshwater wetlands: Types, status, and threats. Environ. Conserv. 2002, 29, 115–133. [Google Scholar] [CrossRef]
  31. Antrop, M. The transformation of the Mediterranean landscapes: An experience of 25 years of observations. Landsc. Urban Plan. 1993, 24, 3–13. [Google Scholar] [CrossRef]
  32. Thorup, O. Ynglefuglene på Tipperne 1928–1992. Dansk Ornitol. Foren. Tidskr. 1998, 92, 1–192. (In Swedish) [Google Scholar]
  33. Beintema, A.J. Man-made polders in the Netherlands: A traditional habitat for shorebirds. Colonial Waterbirds 1986, 9, 196–202. [Google Scholar] [CrossRef]
  34. Gill, J.A.; Langston, R.H.W.; Alves, J.A.; Atkinson, P.W.; Bocher, P.; Cidraes Vieira, N.; Crockford, N.J.; Gélinaud, G.; Groen, N.; Gunnarsson, T.G.; et al. Contrasting trends in two Black-tailed Godwit populations: A review of causes and recommendations. Wader Study Group Bull. 2007, 114, 43–50. [Google Scholar]
  35. Schekkerman, H.; Teunissen, W.; Oosterveld, E. The effect of “mosaic management” on the demography of Black-tailed Godwit Limosa limosa on farmland. J. Appl. Ecol. 2008, 45, 1067–1075. [Google Scholar]
  36. Newton, I. The recent declines of farmland bird populations in Britain: An appraisal of causal factors and conservation actions. Ibis 2004, 146, 579–600. [Google Scholar] [CrossRef]
  37. Alvarez-Cobelas, M.; Cirujano, S.; Sánchez-Carrillo, S. Hydrological and botanical man-made changes in the Spanish wetland of Las Tablas de Daimiel. Biol. Conserv. 2001, 97, 89–98. [Google Scholar] [CrossRef]
  38. Illyés, E.; Botta-Dukát, Z.; Molnár, Z. Patch and landscape factors affecting the naturalness-based quality of three model grassland habitats in Hungary. Acta Bot. Hung. 2008, 50, 179–197. [Google Scholar] [CrossRef]
  39. Durant, D.; Tichit, M.; Kernéïs, E.; Fritz, H. Management of agricultural wet grasslands for breeding waders: Integrating ecological and livestock system perspectives—A review. Biodivers. Conserv. 2008, 17, 2275–2295. [Google Scholar] [CrossRef]
  40. Wretenberg, J.; Lindström, Å.; Svensson, S.; Thierfelder, T.; Pärt, T. Population trends of farmland birds in Sweden and England: Similar trends but different patterns of agricultural intensification. J. Appl. Ecol. 2006, 43, 1110–1120. [Google Scholar] [CrossRef]
  41. Catry, T.; Alves, J.A.; Andrade, J.; Costa, H.; Dias, M.P.; Fernandes, P.; Leal, A.; Lourenco, P.M.; Martins, R.C.; Moniz, F.; et al. Long-term declines of wader populations at the Tagus estuary, Portugal: A response to global or local factors? Bird Conserv. Int. 2011, 21, 438–453. [Google Scholar] [CrossRef]
  42. Roodbergen, M.; Werf, B.; Hötker, H. Revealing the contributions of reproduction and survival to the Europe-wide decline in meadow birds: Review and meta-analysis. J. Ornithol. 2011, 153, 53–74. [Google Scholar] [CrossRef]
  43. Donald, P.F.; Sanderson, F.J.; Burfield, I.J.; van Bommel, F.P.J. Further evidence of continent-wide impacts of agricultural intensification on European farmland birds, 1990–2000. Agric. Ecosyst. Environ. 2006, 116, 189–196. [Google Scholar] [CrossRef]
  44. Rönkä, A. Distribution, status and population trends in the Temminck’s Stint Calidris temminckii in the Finnish Bothnian Bay. Ornis Fenn. 1996, 73, 1–11. [Google Scholar]
  45. Raudonikis, L. Black-tailed Godwit: Bird of 1998 in Lithuania. Acta Zool. Litu. 1999, 9, 215–218. [Google Scholar] [CrossRef]
  46. Schekkerman, H.; Teunissen, W.; Oosterveld, E. Mortality of Black-tailed Godwit Limosa limosa and Northern Lapwing Vanellus vanellus chicks in wet grasslands: Influence of predation and agriculture. J. Ornithol. 2009, 150, 133–145. [Google Scholar] [CrossRef]
  47. Fahrig, L. Effects of habitat fragmentation on biodiversity. Annu. Rev. Ecol. Evol. Syst. 2003, 34, 487–515. [Google Scholar] [CrossRef]
  48. Thorup, O. Breeding Waders in Europe 2000; International Wader Study: Norfolk, UK, 2005; Volume 14. [Google Scholar]
  49. Schekkerman, H. Precocial Problems: Shorebird Chick Performance in Relation to Weather, Farming, and Predation; Alterra, Wageningen University and Research Centre: Wageningen, the Netherlands, 2008. [Google Scholar]
  50. Fuller, R.J. Avian responses to transitional habitats in temperate cultural landscapes: Woodland edges and young-growth. In Birds and Habitat. Relationships in Changing Landscapes; Cambridge University Press: Cambridge, UK, 2012. [Google Scholar]
  51. International Wader Study Group. Waders are declining worldwide. Wader Study Group Bull. 2003, 101–102, 8–12. [Google Scholar]
  52. Wilson, A.M.; Ausden, M.; Milsom, T.P. Changes in breeding wader populations on lowland wet grasslands in England and Wales: Causes and potential solutions. Ibis 2004, 146, 32–40. [Google Scholar] [CrossRef]
  53. Eglington, S.M.; Gill, J.A.; Bolton, M.; Smart, M.A.; Sutherland, W.J.; Watkinson, A.R. Restoration of wet features for breeding waders on lowland grassland. J. Appl. Ecol. 2008, 45, 305–314. [Google Scholar] [CrossRef]
  54. Ottvall, R.; Smith, H.G. Effects of an agri-environment scheme on wader populations of coastal meadows of southern Sweden. Agric. Ecosyst. Environ. 2006, 113, 264–271. [Google Scholar] [CrossRef]
  55. Smart, J.; Gill, J.A.; Sutherland, W.J.; Watkinson, A.R. Grassland-breeding waders: Identifying key habitat requirements for management. J. Appl. Ecol. 2006, 43, 454–463. [Google Scholar] [CrossRef]
  56. Isaksson, D.; Wallander, J.; Larsson, M. Managing predation on ground-nesting birds: The effectiveness of nest exclosures. Biol. Conserv. 2007, 136, 136–142. [Google Scholar] [CrossRef]
  57. Wallander, J.; Isaksson, D.; Lenberg, T. Wader nest distribution and predation in relation to man-made structures on coastal pastures. Biol. Conserv. 2006, 132, 343–350. [Google Scholar] [CrossRef]
  58. Teunissen, W.; Schekkerman, H.; Willems, F.; Majoor, F. Identifying predators of eggs and chicks of Lapwing Vanellus vanellus and Black-tailed Godwit Limosa limosa in the Netherlands and the importance of predation on wader reproductive output. Ibis 2008, 150, 74–85. [Google Scholar] [CrossRef]
  59. Macdonald, M.A.; Bolton, M. Predation on wader nests in Europe. Ibis 2008, 150, 54–73. [Google Scholar] [CrossRef]
  60. Koivula, K.; Rönkä, A. Habitat deterioration and efficiency of antipredator strategy in a meadow-breeding wader, Temminck’s stint (Calidris temminckii). Oecologia 1998, 116, 348–355. [Google Scholar] [CrossRef]
  61. Martin, T.E. Processes organizing open-nesting bird assemblages: Competition or nest predation? Evol. Ecol. 1988, 2, 37–50. [Google Scholar] [CrossRef]
  62. Pehlak, H.; Lõhmus, A. An artificial nest experiment indicates equal nesting success of waders in coastal meadows and mires. Ornis Fenn. 2008, 85, 66–71. [Google Scholar]
  63. Elmberg, J.; Gunnarsson, G. Manipulated density of adult mallards affects nest survival differently in different landscapes. Can. J. Zool. 2007, 85, 589–595. [Google Scholar] [CrossRef]
  64. Baillie, S.R.; Sutherland, W.J.; Freeman, S.N.; Gregory, R.D.; Paradis, E. Consequences of large-scale processes for the conservation of bird populations. J. Appl. Ecol. 2000, 37, 88–102. [Google Scholar] [CrossRef]
  65. Wiens, J.A. Spatial scaling in ecology. Funct. Ecol. 1989, 3, 385–397. [Google Scholar] [CrossRef]
  66. Angelstam, P.; Mikusiński, G.; Fridman, J. Natural forest remnants and transport infrastructure: Does history matter for biodiversity conservation planning? Ecol. Bull. 2004, 51, 149–162. [Google Scholar]
  67. Mikusiński, G.; Angelstam, P. Occurrence of mammals and birds with different ecological characteristics in relation to forest cover in Europe: Do macroecological data make sense? Ecol. Bull. 2004, 51, 265–275. [Google Scholar]
  68. Flyvbjerg, B. Case study. In The Sage Handbook of Qualative Research, 4th ed.; Denzin, N.K., Lincoln, Y.S., Eds.; Sage: Thousand Oaks, CA, USA, 2011; pp. 301–316. [Google Scholar]
  69. Angelstam, P.; Elbakidze, M.; Axelsson, R.; Dixelius, M.; Tornblom, J. Knowledge production and learning for sustainable landscapes: Seven steps using social-ecological systems as laboratories. Ambio 2013, 42, 116–128. [Google Scholar] [CrossRef] [PubMed]
  70. Bergner, A. Fåglar på Strandängar i Östergötland—Inventeringar 1996–2013; Länsstyrelsen: Östergötland, Sweden, 2013. (In Swedish) [Google Scholar]
  71. Oveson, P. Markhävdkartering 2008. Hävdtillståndet på Betesmarker och Slåtterängar Inom Nedre Helgeåns Våtmarksområde i Kristianstads Vattenrike; Länsstyrelsen i Skåne län: Biosfärkontoret, Sweden; Kristianstads, Sweden; Vattenrike, Sweden, 2009. (In Swedish) [Google Scholar]
  72. Lasiewski, R.C.; Dawson, W.R. A re-examination of the relation between standard metabolic rate and body weight in birds. Condor 1967, 69, 13–23. [Google Scholar] [CrossRef]
  73. Environmental Systems Research Institute. ArcGIS Desktop: Release 10.1; Environmental Systems Research Institute: Redlands, CA, USA, 2012. [Google Scholar]
  74. Angelstam, P. Predation on ground-nesting birds’ nests in relation to predator densities and habitat edge. Oikos 1986, 47, 365–373. [Google Scholar] [CrossRef]
  75. Andrén, H. Corvid density and nest predation in relation to forest fragmentation: A landscape perspective. Ecology 1992, 73, 794–804. [Google Scholar] [CrossRef]
  76. Andrén, H.; Angelstam, P. Elevated predation rates as an edge effect in habitat islands: Experimental evidence. Ecology 1988, 69, 544–547. [Google Scholar] [CrossRef]
  77. Brazaitis, G.; Kurlavičius, P. Green tree retention and bird communities on clearcuts in Lithuania. Balt. For. 2003, 9, 63–70. [Google Scholar]
  78. Cramp, S. Handbook of the Birds of Europe, the Middle East, and North Africa: The Birds of the Western Palearctic; Hawks to Bustards; Oxford University Press: Oxford, UK, 1980; Volume 2. [Google Scholar]
  79. Bomholt, P. Bestanden af Rød Glente Milvus milvus i et censusområde i det sydøstlige Jylland, 1980–1995. Dansk Ornithol. Foren. Tidsskr. 1997, 91, 53–58. (in Danish). [Google Scholar]
  80. Kjellén, N.; Roos, G. Population trends in Swedish raptors demonstrated by migration counts at Falsterbo, Sweden 1942–97. Bird Study 2000, 47, 195–211. [Google Scholar] [CrossRef]
  81. Valkama, J.; Korpimäki, E.; Arroyo, B.; Beja, P.; Bretagnolle, V.; Bro, E.; Kenward, R.; Mañosa, S.; Redpath, S.M.; Thirgood, S.; et al. Birds of prey as limiting factors of gamebird populations in Europe: A review. Biol. Rev. 2005, 80, 171–203. [Google Scholar] [CrossRef] [PubMed]
  82. Berg, Å. Predation on artificial, solitary and aggregated wader nests on farmland. Oecologia 1996, 107, 343–346. [Google Scholar] [CrossRef]
  83. Cramp, S.; Perrins, C.M.; Brooks, D.J. Handbook of the Birds of Europe, the Middle East, and North Africa: The Birds of the Western Palearctic; Crows to Finches; Oxford University Press: Oxford, UK, 1980; Volume 8. [Google Scholar]
  84. Svensson, L.; Grant, P.J.; Mullarney, K.; Zetterström, D.; Christie, D. Collins Bird Guide; HarperCollins: London, UK, 2009. [Google Scholar]
  85. Seymour, A.S.; Harris, S.; Ralston, C.; White, P.C.L. Factors influencing the nesting success of Lapwings Vanellus vanellus and behaviour of Red Fox Vulpes vulpes in Lapwing nesting sites. Bird Study 2003, 50, 39–46. [Google Scholar] [CrossRef]
  86. Bolton, M.; Tyler, G.; Smith, K.E.N.; Bamford, R.O.Y. The impact of predator control on lapwing Vanellus vanellus breeding success on wet grassland nature reserves. J. Appl. Ecol. 2007, 44, 534–544. [Google Scholar] [CrossRef]
  87. Stien, J.; Yoccoz, N.G.; Ims, R.A. Nest predation in declining populations of common eiders Somateria mollissima: An experimental evaluation of the role of hooded crows Corvus cornix. Wildl. Biol. 2010, 16, 123–134. [Google Scholar] [CrossRef]
  88. Baines, D.; Moss, R.; Dugan, D. Capercaillie breeding success in relation to forest habitat and predator abundance. J. Appl. Ecol. 2004, 41, 59–71. [Google Scholar] [CrossRef]
  89. Norrdahl, K.; Suhonen, J.; Hemminki, O.; Korpimäki, E. Predator presence may benefit: Kestrels protect curlew nests against nest predators. Oecologia 1995, 101, 105–109. [Google Scholar] [CrossRef]
  90. Green, R.E.; Hawell, J.; Johnson, T.H. Identification of predators of wader eggs from egg remains. Bird Study 1987, 34, 87–91. [Google Scholar] [CrossRef]
  91. Ottvall, R. Breeding success and adult survival of Redshank Tringa totanus on coastal meadows in SE Sweden. Ardea 2005, 93, 225–236. [Google Scholar]
  92. Olsen, H. Patterns of Predation on Ground Nesting Meadow Birds. Ph.D. Thesis, Royal Veterinarian and Agricultural University, Copenhagen, Denmark, 2002. [Google Scholar]
  93. Jackson, D.B. Experimental removal of introduced hedgehogs improves wader nest success in the Western Isles, Scotland. J. Appl. Ecol. 2001, 38, 802–812. [Google Scholar] [CrossRef]
  94. Smith, R.K.; Pullin, A.S.; Stewart, G.B.; Sutherland, W.J. Is nest predator exclusion an effective strategy for enhancing bird populations? Biol. Conserv. 2011, 144, 1–10. [Google Scholar] [CrossRef]
  95. Ivan, J.S.; Murphy, R.K. What preys on Piping Plover eggs and chicks? Wildl. Soc. Bull. 2005, 33, 113–119. [Google Scholar] [CrossRef]
  96. Dyrcz, A.; Witkowski, J.; Okulewicz, J. Nesting of “timid” waders in the vicinity of “bold” ones as an antipredator adaption. Ibis 1981, 123, 542–545. [Google Scholar] [CrossRef]
  97. Pearce-Higgins, J.W.; Grant, M.C. Relationships between bird abundance and the composition and structure of moorland vegetation. Bird Study 2006, 53, 112–125. [Google Scholar] [CrossRef]
  98. Wilson, J.D.; Anderson, R.; Bailey, S.; Chetcuti, J.; Cowie, N.R.; Hancock, M.H.; Quine, C.P.; Russell, N.; Stephen, L.; Thompson, D.B.A. Modelling edge effects of mature forest plantations on peatland waders informs landscape-scale conservation. J. Appl. Ecol. 2014, 51, 204–213. [Google Scholar] [CrossRef]
  99. Ottvall, R.; Larsson, K.; Smith, H.G. Nesting success in Redshank Tringa totanus breeding on coastal meadows and the importance of habitat features used as perches by avian predators. Bird Study 2005, 52, 289–296. [Google Scholar] [CrossRef]
  100. Ottvall, R. Nest survival among waders breeding on coastal meadows: The relative importance of predation and trampling damages by livestock. Ornis Svec. 2005, 15, 89–96. [Google Scholar]
  101. Beintema, A.J.; Muskens, G.J.D.M. Nesting success of birds breeding in Dutch agricultural grasslands. J. Appl. Ecol. 1987, 24, 743–758. [Google Scholar] [CrossRef]
  102. Loman, J.; Göransson, G. Egg shell dumps and Crow Corvus cornix predation on simulated birds’ nests. Oikos 1978, 30, 461–466. [Google Scholar] [CrossRef]
  103. Bell, B.; Merton, D. Critically endangered bird populations and their management. In Conserving Bird Biodiversity: General Principles and Their Application; Norris, K., Pain, D.J., Eds.; Cambridge University Press: Cambridge, UK, 2002. [Google Scholar]
  104. Melman, T.C.P.; Schotman, A.G.M.; Hunink, S.; de Snoo, G.R. Evaluation of meadow bird management, especially Black-tailed Godwit (Limosa limosa L.), in the Netherlands. J. Nat. Conserv. 2008, 16, 88–95. [Google Scholar] [CrossRef]
  105. Oosterveld, E.B.; Nijland, F.; Musters, C.J.M.; Snoo, G.R. Effectiveness of spatial mosaic management for grassland breeding shorebirds. J. Ornithol. 2011, 152, 161–170. [Google Scholar] [CrossRef]
  106. Schroeder, J.; Heckroth, M.; Clemens, T. Against the trend: Increasing numbers of breeding Northern Lapwings Vanellus vanellus and Black-tailed Godwits Limosa limosa on a German Wadden Sea island. Bird Study 2008, 55, 100–107. [Google Scholar] [CrossRef]
  107. Hersteinsson, P.; Angerbjörn, A.; Frafjord, K.; Kaikusalo, A. The arctic fox in fennoscandia and Iceland: Management problems. Biol. Conserv. 1989, 49, 67–81. [Google Scholar] [CrossRef]
  108. Gjerde, B.; Dahlgren, S. Corvid birds (Corvidae) act as definitive hosts for Sarcocystis ovalis in moose (Alces alces). Parasitol. Res. 2010, 107, 1445–1453. [Google Scholar] [CrossRef] [PubMed]
  109. Wilson, A.; Vickery, J.; Pendlebury, C. Agri-environment schemes as a tool for reversing declining populations of grassland waders: Mixed benefits from environmentally sensitive areas in England. Biol. Conserv. 2007, 136, 128–135. [Google Scholar] [CrossRef]
  110. Martin, T.E. Avian life history evolution in relation to nest sites, nest predation, and food. Ecol. Monogr. 1995, 65, 101–127. [Google Scholar] [CrossRef]
  111. Van Horne, B. Density as a misleading indicator of habitat quality. J. Wildl. Manag. 1983, 47, 893–901. [Google Scholar] [CrossRef]
  112. Brazaitis, G.; Roberge, J.-M.; Angelstam, P.; Marozas, V.; Pėtelis, K. Age-related effects of clear-cut–old forest edges on bird communities in Lithuania. Scand. J. For. Res. 2005, 20, 59–67. [Google Scholar] [CrossRef]
  113. Angelstam, P.; Grodzynskyi, M.; Andersson, K.; Axelsson, R.; Elbakidze, M.; Khoroshev, A.; Kruhlov, I.; Naumov, V. Measurement, collaborative learning and research for sustainable use of ecosystem services: Landscape concepts and Europe as laboratory. Ambio 2013, 42, 129–145. [Google Scholar] [CrossRef] [PubMed]
  114. Bergman, K.-O.; Jansson, N.; Claesson, K.; Palmer, M.W.; Milberg, P. How much and at what scale? Multiscale analyses as decision support for conservation of saproxylic oak beetles. For. Ecol. Manag. 2012, 265, 133–141. [Google Scholar] [CrossRef]
  115. Musa, N.; Andersson, K.; Burman, J.; Andersson, F.; Hedenström, E.; Jansson, N.; Paltto, H.; Westerberg, L.; Winde, I.; Larsson, M.C. Using sex pheromone and a multi-scale approach to predict the distribution of a rare saproxylic beetle. PLoS ONE 2013, 8, e66149. [Google Scholar] [CrossRef] [PubMed]
  116. Folke, C.; Hahn, T.; Olsson, P.; Norberg, J. Adaptive governance of social-ecological systems. Annu. Rev. Environ. Resour. 2005, 30, 441–473. [Google Scholar] [CrossRef]
  117. Paltto, H.; Nordén, B.; Götmark, F.; Franc, N. At which spatial and temporal scales does landscape context affect local density of Red Data Book and Indicator species? Biol. Conserv. 2006, 133, 442–454. [Google Scholar] [CrossRef]
  118. Wallin, M.; Wallin, K.; Truvé, J. Fågelfaunan på Ölands Sjömarker—Inventeringar 1988–2008; Länsstyrelsen: Kalmar, Sweden, 2009. [Google Scholar]
  119. Verkuil, Y.I.; Karlionova, N.; Rakhimberdiev, E.N.; Jukema, J.; Wijmenga, J.J.; Hooijmeijer, J.C.E.W.; Pinchuk, P.; Wymenga, E.; Baker, A.J.; Piersma, T. Losing a staging area: Eastward redistribution of Afro-Eurasian ruffs is associated with deteriorating fuelling conditions along the western flyway. Biol. Conserv. 2012, 149, 51–59. [Google Scholar] [CrossRef]
  120. Thorup, O. Status of populations and management of Dunlin Calidris alpina, Ruff Philomachus pugnax and Black-tailed Godwit Limosa limosa in Denmark. Dansk Ornitol. Foren. Tidsskr. 2004, 98, 7–20. [Google Scholar]
  121. Maclean, I.M.D.; Austin, G.E.; Rehfisch, M.M.; Blew, J.A.N.; Crowe, O.; Delany, S.; Devos, K.; Deceuninck, B.; Gunther, K.; Laursen, K.; et al. Climate change causes rapid changes in the distribution and site abundance of birds in winter. Glob. Chang. Biol. 2008, 14, 2489–2500. [Google Scholar] [CrossRef]
  122. Greenwood, J.J.D. Citizens, science and bird conservation. J. Ornithol. 2007, 148, 77–124. [Google Scholar] [CrossRef]
  123. Smart, M.; Canters, K.J. Ramsar participation and wise use. Landsc. Urban Plan. 1991, 20, 269–274. [Google Scholar] [CrossRef]
  124. The United Nations Educational, Scientific and Cultural Organization. Biosphere Reserves: The Seville Strategy & the Statutory Framework of the World Network; UNESCO: Paris, France, 1996. [Google Scholar]
  125. Morris, K. Wetland Connectivity: Understanding the Dispersal of Organisms that Occur in Victoria's Wetlands; Arthur Rylah Institute for Environmental Research, Department of Sustainability and Environment: Heidelberg, Germany, 2012. [Google Scholar]
  126. Hout, P.J.V.D. Struggle for Safety: Adaptive Responses of Wintering Waders to Their Avian Predators; University of Groningen: Groningen, the Netherlands, 2010. [Google Scholar]
  127. Svahn, K. Fåglar i Skåne. Available online: http://www.falsterbofagelstation.se/sales/varuspec.php?artikel=168&artkat=2&lan=sve (accessed on 28 March 2016). (In Swedish)
  128. Batisse, M. The biosphere reserve: A tool for environmental conservation and management. Environ. Conserv. 1982, 9, 101–111. [Google Scholar] [CrossRef]
  129. Murtas, D.; Davis, P. The Role of The Ecomuseo Dei Terrazzamenti E Della Vite, (Cortemilia, Italy) in Community Development. Mus. Soc. 2009, 7, 150–186. [Google Scholar]
  130. Davis, P. Ecomuseums: A Sense of Place; Bloomsbury Publishing: New York, NY, USA, 2011. [Google Scholar]
  131. Riviére, G.H. Images of the ecomuseum. Museum 1985, 37, 182–244. [Google Scholar]
  132. De la Rocha Mille, R. Museums without Walls: The Museology of Georges Henri Riviere. Ph.D. Thesis, City University London, London, UK, 2011. [Google Scholar]
  133. Tuvendal, M.; Elmqvist, T. Ecosystem services linking social and ecological systems: River brownification and the response of downstream stakeholders. Ecol. Soc. 2011, 16, 21. [Google Scholar] [CrossRef]
  134. Daniels, S.E.; Walker, G.B. Working through Environmental Conflict: The Collaborative Learning Approach; Praeger: London, UK, 2001. [Google Scholar]
  135. Sandström, U.G.; Angelstam, P.; Khakee, A. Urban comprehensive planning—Identifying barriers for the maintenance of functional habitat networks. Landsc. Urban Plan. 2006, 75, 43–57. [Google Scholar] [CrossRef]
  136. Elbakidze, M.; Angelstam, P.; Sandström, C.; Stryamets, N.; Crow, S.; Axelsson, R.; Stryamets, G.; Yamelynets, T. Biosphere Reserves for conservation and development in Ukraine? Legal recognition and establishment of the Roztochya initiative. Environ. Conserv. 2013, 40, 157–166. [Google Scholar] [CrossRef]
  137. Grahn, P.; Stigsdotter, U.A. Landscape planning and stress. Urban For. Urban Green. 2003, 2, 1–18. [Google Scholar] [CrossRef]
  138. Grahn, P.; Stigsdotter, U.K. The relation between perceived sensory dimensions of urban green space and stress restoration. Landsc. Urban Plan. 2010, 94, 264–275. [Google Scholar] [CrossRef]
  139. Stoltz, J.; Björk, J.; Grahn, P.; Mattisson, K.; Skärbäck, E. Klassificering av Utemmiljöer i Kristianstad för Hälsa och Välbefinnande. Available online: pub.epsilon.slu.se/9538/1/stoltz_et_al_130315.pdf (accessed on 28 March 2016). (In Swedish)
Figure 1. Wader trends over a 22-year period for 6 priority species within the favorably managed wet grassland areas in the Kristianstad landscape [26].
Sustainability 08 00340 g001
Figure 2. Map of the wet grassland landscape case study areas Kristianstad and Östergötland in southern Sweden.
Sustainability 08 00340 g002
Figure 3. Land cover proportions at different spatial scales expressed as buffers surrounding the wet grassland patches with favorable management status in the Kristianstad study area (1484 km2) (bottom) and in the Östergötland study area (2604 km2) (top).
Sustainability 08 00340 g003
Figure 4. Avian predator pressure index (ratio between the predators divided by the sum of predators and waders) in the two study areas; error bars indicate CI95%. Numbers to the right indicate estimates with CI95% to facilitate inclusion in future meta-analyses.
Sustainability 08 00340 g004
Figure 5. Number of corvid observations per survey plot (top) and probability of observing birds of prey (bottom) by land cover classes in Kristianstad and Östergötland. Error bars indicate CI95%.
Sustainability 08 00340 g005
Figure 6. Proportion of artificial nests lost on wet grasslands and agricultural fields in Kristianstad (Kr) and Östergötland (Ög). Error bars indicate CI95%. Numbers to the right indicate estimates with CI95% to facilitate inclusion in future meta-analyses.
Sustainability 08 00340 g006
Figure 7. Proportions of nest loss types among land covers in the two case study areas Kristianstad and Östergötland.
Sustainability 08 00340 g007
Table 1. Annual rate of change of wader population proxy variables at the wet grassland sites with favorable management status in the KVBR, and in Östergötland. Data were extracted from Cronert [26] for the Kristianstad landscape and from Bergner [70] for the Östergötland landscape.
Study AreasKVBR (SE)Östergötland (SE)
Body mass (g/ha)−27.4 (2.45)0.39 (0.918)
Metabolic weight (g/ha)−4.81 (0.488)−0.060 (0.2529)
Nests (No./ha)−0.061 (0.00723)0.00063 (0.00368)
Table 2. Number of species and individual waders, corvids and birds of prey observed during the early and late breeding season field surveys in the Kristianstad (Kr) and in Östergötland (Ög) landscapes, in southern Sweden.
Wader ObservationsRelative Abundance Field Observations
(Early Season)
Landscape Field Observations
(Late Season)
KrÖgKrÖg
Oystercatcher (Haematopus ostralegus)62NANA
Lapwing (Vanellus vanellus)215131NANA
Wood Sandpiper (Tringa glareola)13NANA
Common Sandpiper (Actitis hypoleucos)20NANA
Redshank (Tringa totanus)540NANA
Greenshank (Tringa nebularia)54NANA
Black-tailed Godwit (Limosa limosa)29NANA
Curlew (Numenius arquata)273NANA
Snipe (Gallinago gallinago)3812NANA
Ruff (Phylomachus pugnax)09NANA
Ringed Plover (Charadrius hiaticula)03NANA
Total301216NANA
Corvid Observations
Magpie (Pica pica)16476122
Jay (Garrulus glandarius)0089
Jackdaw (Corvus monedula)1018572908
Rook (Corvus frugilegus)4600435
Hooded Crow (Corvus cornix)33818149377
Raven (Corvus corax)2411623
Total525318211874
Birds of Prey Observations
White-tailed Eagle (Haliaetus albicilla)1301
Osprey (Pandion haliaetus)6010
Red Kite (Milvus milvus)130330
Marsh Harrier (Circus aeruginosus)12111410
Buzzard (Buteo buteo)190205
Kestrel (Falco tinnunculus)0001
Hobby (Falco subbuteo)0021
Peregrine Falcon (Falco peregrinus)1000
Total52147018
NA = Not applicable.
Table 3. Summary of avian predator assemblages for Kristianstad (Kr) and Östergötland (Ög) and the 10 and 30 year population trends for southern Sweden.
SpeciesTrends [24]Status [78,83,84]Waders in Diet [78,83,84]
Corvids1996–20061977–2006KrÖg
Magpie (Pica pica)RRE, Y
Jay (Garrulus glandarius)RRE, Y
Jackdaw (Corvus monedula)RRE, Y
Rook (Corvus frugilegus)↑+RRA, E, Y
Hooded Crow (Corvus cornix)RRA, E, Y
Raven (Corvus corax)↑+RRA, E, Y
Birds of Prey
White-tailed Eagle (Haliaetus albicilla)↑+↑+RBA, E, Y
Osprey (Pandion haliaetus)↑+BBFish
Golden Eagle (Aquila chrysaetos)RRA, Y
Red Kite (Milvus milvus)↑+↑+RMA, E, Y
Marsh Harrier (Circus aeruginosus)↑+BBA, E, Y
Hen Harrier (Circus cyaneus)MBA, E, Y
Montagu’s Harrier (Circus pygargus)BBA, E, Y
Rough-legged Buzzard (Buteo lagopus)MMA, Y
Buzzard (Buteo buteo)BBA, Y
Honey Buzzard (Pernis apivorus)↓−BBInsects
Sparrowhawk (Accipiter nisus)RRA, Y
Goshawk (Accipiter gentilis)RRA, Y
Kestrel (Falco tinnunculus)↑+↑+BBA, Y
Hobby (Falco subbuteo)BBA, Y
Peregrine Falcon (Falco peregrinus)↑+↑+RRA, Y
Merlin (Falco columbarius)BMA, Y
Trends, ↑+ = Large increase, ↑ = Slight increase, ↔ = Stable, ↓ = Slight decline, ↓− = Large decline. Status R = Resident, B = Breeding and M = Migrating. Waders in Diet A = Adults, E = Eggs and Y = Young.

