Article

The Establishment of a Green Supplier Selection and Guidance Mechanism with the ANP and IPA

1
Institute of Engineering Science and Technology, National Kaohsiung First University of Science and Technology, Kaohsiung City 824, Taiwan
2
Graduate Institute of Technological and Vocational Education, National Pingtung University of Science and Technology, Pingtung 912, Taiwan
*
Author to whom correspondence should be addressed.
Sustainability 2016, 8(3), 259; https://doi.org/10.3390/su8030259
Submission received: 25 January 2016 / Revised: 29 February 2016 / Accepted: 7 March 2016 / Published: 10 March 2016
(This article belongs to the Section Economic and Business Aspects of Sustainability)

Abstract

:
This study aims to establish a green supplier selection and guidance mechanism by integrating the features of an ANP (Analytic Network Process) and an IPA (Importance–Performance Analysis) to achieve sustainable management for green supply chains. Using an expert survey, this study developed green supplier selection criteria. It adopted an ANP, which allows for interdependencies and feedback between the various criteria, to select competitive green suppliers. Then, it used an IPA, which can analyze the criteria’s significance and performance levels, to provide green suppliers with direction for guidance and improvements. The green supplier selection and guidance mechanism featuring an ANP and IPA is thus established and validated through case studies. The research results showed the following: (1) the green supplier selection criteria comprise a total of 11 performance evaluation criteria from the three dimensions of operation, competence, and environmental consciousness; (2) as shown by the APN evaluation results, environmental benefits, environmental regulations, finance, technological competence, and delivery time are the top five among the overall green criteria of the company; the performance of the various suppliers is thus arranged in order, and the most competitive supplier is selected; (3) an IPA is used to analyze the criteria’s significance and supplier performance levels and to provide the suppliers with suggestions on priority improvements, including implementing the requirements in the environmental regulations, establishing comprehensive financial management procedures, improving corporate technological competence, and consolidating customer service; (4) it is suggested that an ANP and IPA should be integrated in the applications, which could simplify the green supplier selection and guidance mechanisms and increase the efficiency of supplier management, thus creating a three-win situation for the clients, the company, and the suppliers.

1. Introduction

Currently, to win a competitive advantage in the market, many enterprises need to strengthen their product quality and technology and should pay attention to the integration of upstream and downstream of the entire supply chain so that customers, suppliers, and relevant organizations have increasingly closer cooperation [1,2]. Therefore, the quality of suppliers is related to the operation of the supply chain and also deeply influences the success of enterprises. Enterprises should regularly seek competitive new suppliers and conduct performance evaluations on them and existing suppliers to analyze each supplier’s performance and introduce guidance and improvement suggestions [3,4]. In this way, they expect to find suppliers to cooperate for the long term and establish complete supply chain relations to meet the enterprise’s needs and therefore achieve a win-win result for both suppliers and enterprises.
Different enterprises have different corporate cultures and attributes and focus on various performance evaluation indexes; thus, enterprises should determine supplier performance evaluation indexes based on their own attributes, requirements, and experiences so as to find conforming suppliers [5]. In the era of the globalization of coexistence in which the sustainable operation of enterprises is emphasized, it is important to comply with the European Union’s environmental protection requirements and focus on green trends for enterprises to improve competitiveness [6]. Therefore, it is necessary to incorporate a green environmental protection index into supplier performance evaluation indexes [7]; moreover, suppliers are required to respond and abide by these indexes to meet the requirements of green and environmental protection concepts if they are preparing to enter the European Union market.
Next, among many green supplier performance evaluation indexes, there certainly exist correlations and interactions; moreover, different suppliers have different degrees of recognition of these indexes and express them in different ways. Therefore, in this paper, the ANP (Analytic Network Process) is suitable to solve multi-criteria decision problems, and the existence of dependence and feedback features is adopted as a tool for green supplier selection [8]. In addition, this study emphasizes the guidance-based improvement of suppliers; thus, the IPA (Importance–Performance Analysis) is able to analyze index importance, and performance relevance is adopted to further analyze each supplier’s expression level of performance indexes so as to provide effective guidance and improvement suggestions [9,10]. Thus, the establishment of effective “Green Supplier Selection and Guidance Mechanism with ANP and IPA” and development of a complete sustainable management mode for green supply chains is expected to achieve a triple-win situation for customers, enterprises, and suppliers.

2. Literature Review

This paper first discusses the supply chain evolution and the establishment of supplier mode to understand the connotations of supplier relationship management; then, it discusses supplier selection and green supplier selection criteria to determine green supplier selection and a basis for guidance.

2.1. Supply Chain Evolution

With scientific and technological progress and the changes in market composition and range, there are diversified customer demands; therefore, the main body of the product supply chain is expanded from the individuals to the overall supply chain system for product production. According to the quasi integration theory set forth by Houssiaux [11], a long-term cooperative relationship can be achieved through investment in suppliers’ or buyers’ partial activities. Through the vertical integration between enterprises, the competitive advantages of their core careers are strengthened to seek maximization of quasi-rent [12,13]. In this way, the cooperation mode, in which completely different technologies’ production and distribution are integrated with other economic activities, has evolved into the organizational vertical market [14,15] so that enterprises change operation modes from emphasizing professional work division and local optimization to instead improving overall integration performance.
Thus, in the highly competitive environment of market globalization, to improve performance, increase profit, extend market occupancy rate, and strengthen competitive positioning, enterprises must perform well in supplier relationship management [16,17]. According to the concept of cooperation set forth by Brandenburger & Nalebuff [18], an organization is faced with competition and cooperation in the market [19]. Through value creation and sharing, enterprises can gain knowledge and economic value [20]; an opposing and short-sighted supplier relationship is thus transformed into a cooperative partnership between enterprises [21,22]. This establishes a win-win pattern. However, it is quite complicated to establish a supplier partnership because the implementation effect is not as good as expected; meanwhile, the new relationship is unable to be maintained in the long term. Under the supply chain architecture, each member of the supplier relationship will be highly involved in each other’s sales and purchase systems to reduce the two parties’ storage, insurance, management, disposition, and other inventory costs, therefore creating more economic value through information sharing and the operation mode of technological cooperation between enterprises and suppliers as well as customers [23,24]. Only a partnership that is established on a powerful foundation can be sustainable [25]. Therefore, in this study, it is proposed that selecting a potential supplier is the first and foremost condition of successful supplier management.

2.2. Establishment of Supplier Mode

It is necessary to stimulate efficient “supplier development activity,” which is the efforts made by manufacturers to improve suppliers’ performance and ability, so as to increase the added value of products, services, and information [26]. According to Walley [27], through the application of competition and cooperation strategies, improving enterprise performance is a topic worthy of discussion so that the risk and performance of supply chain actors can be shared to achieve a better integration [28]. The economic transaction level in the buyer–seller relationship is improved to create a partnership of high mutual trust and cooperation [2]. The following five features are required for a small quantity of suppliers so that the two sides keep their promises and are able to solve problems jointly, exchange information frequently, and adapt to market changes [29,30] to achieve the purpose of supplier development: (1) improve incoming material quality; (2) increase the accuracy of supplier delivery; (3) enhance supplier service; (4) reduce purchasing costs; and (5) strengthen suppliers’ technical capacity [31,32]. The key to success for supplier development activity is as follows: (1) there is a good communication system between suppliers; and (2) the suppliers with better performance should have more resources, such as formal supplier evaluation and guidance, supplier employee training, and a supplier incentive plan [33].
In conclusion, this paper proposes that to realize effective supplier management, there should be many suppliers with the potential for competition. Furthermore, a good communication system should be established on the basis of mutual trust, and supplier guidance mechanisms should be effectively implemented. Only in this way can suppliers carry out efficient improvement measures. Therefore, the supplier management mode established herein will include the two categories of supplier selection and guidance.

2.3. Supplier Selection

The strategic key of supplier chain management is cost, quality, responsiveness, customer service, competitive advantage, and technology management [34]. Therefore, in the long term, suppliers shall be selected based on their comprehensive performance, resource allocation, and decision-making environment [35]. For example, de Boer & Van der Wegen [36] proposed a formal decision-making model and proved the usefulness of such a model in the entire supplier selection process and under different purchase conditions by use of four empirical cases. Ha & Krishnan [37] adopted a multiple-technology evaluation process to select competitive suppliers [38]. Bruno et al. [39] solved the supplier evaluation problem through the Analytical Hierarchical Process [40]. In addition, Labib [41] set forth the supplier evaluation model to integrate FL (Fuzzy Logic) and the AHP to help enterprises to identify the best suppliers in the changing environment [42,43]. Bruno et al. [44] suggested solving the supplier selection problem through the AHP and Fuzzy Set Theory (FST) in response to the multi-stakeholder environment.
In conclusion, the supplier selection problem has been roughly solved. However, to respond to today’s complicated and changing environment, selection indexes are increasing in quantity and are mostly dependent on each other [45,46]. Therefore, in this study, the ANP that has dependency between indexes is utilized as the supplier selection tool [47]. In addition, based on ANP evaluation results, individual suppliers are further analyzed using the IPA concept to serve as improvement suggestions for supplier guidance and to achieve sustainable supply chain management goals.

2.4. Green Supplier Selection Criteria

Regarding supplier selection criteria, Yang and Chen [48] have sorted through the related documents of supplier selection indexes and have reported that they include quality, finance, customer service, production capacity, design and technical capacity, and information technology [31,49,50]. To summarize, the supplier selection mechanism is well developed. However, supplier selection mechanisms must change with the times. After entering the 21st century, the EU has advocated the supply chain effect of green product requirements, which is one of the most popular topics in today’s industry circles [6,51]. The more developed countries of the EU have actively expressed their environmental demands through legislation and have implemented the WEEE (Waste Electrical and Electronic Equipment Directive), RoHS (Restriction of Hazardous Substances Directive), etc. with the hope of leading the entire world’s manufacturing industry into a new era that is more environmentally friendly; the EU’s huge commercial market will hopefully serve as a backup force [7,52].
Therefore, national governments have started to request that enterprises integrate the relationship between customers and suppliers to effectively achieve environmental management [53,54]. In addition, the supplier selection in the past was mostly focused on quality, delivery period, and cost, but this is insufficient in today’s market due to fiercer competition and quicker responses. Many huge companies have begun to consider environmental issues and evaluate suppliers’ environmental performance [55,56,57]. According to Jia et al. [58], based on the concept of the TBL (Triple Bottom Line) of economy, environment, and society, which includes three categories with 12 standards in total, technique for order preference by similarity to an ideal solution (TOPSIS) is adopted for supplier selection. In environmental performance indicators; Azzone and Bertele [59] proposed four indicators: (1) external environmental benefit; (2) environmental benefit; (3) green image; and (4) environmental adaptability. This proposal corresponds to the view set forth by Noci [53], which states that green performance evaluation items include (1) conformance to environmental specifications, (2) environmental benefit, (3) the supplier’s green image, and (4) net life cycle cost [60,61]. According to Sarkis and Talluri [35], more complete green supplier evaluation items include (1) environmental design; (2) life cycle analysis; (3) comprehensive quality environmental management; (4) green supply chain; and (5) SO14000 EMS requirements. Rao [62] has proposed the concept of greening, including green marketing, green purchasing, green design, and green production. Environmental management is the key to success for enterprises to implement green supply chain management; environmental awareness will place pressure on supply chain partnerships and further encourage suppliers to maintain better environmental performance [63,64]. Therefore, it is important to integrate the concept of greening into original supply chain [51]. When environmental awareness rises with the appearance of the “greening” concept, enterprises should reconsider the measurement categories of the performance measurement system to include the “environmental” category [65]. The main purpose of green supply chain management is to integrate the required greening conditions into product production procedures in combination with the existing raw materials, logistics management system, information management system and process operation system of enterprises to form a collective environment management system [66]. Therefore, according to Govindan et al. [67], when green supplier management becomes one environmental strategy, the individual organization’s environmental performance has been improved, and the entire supplier chain has been accepted by the industry.
In conclusion, supplier chain management can help enterprises to develop a win-win strategy to achieve interest and market sharing goals and to reduce environmental risks and impact [68]. The purpose of green supply chain management is to achieve the dual goals of environmental protection and economic development [69]. Therefore, supplier selection is no longer only limited to price, and enterprises have gradually begun to emphasize other factors such as environmental protection, environmental assessment, technical capacity, and customer service [70]. Therefore, suppliers’ environmental performance assessments have gradually become one of the most important items for supplier selection. From this perspective, the green supplier selection mechanism is divided in this paper into (1) operation (finance, green image, quality certification, R&D cost, and operation cost); (2) production management (quality abnormity treatment, productivity, technical capacity; education and training, green research, and development ability); (3) customer management (customer, service, delivery time, and response capacity); and (4) greening (environmental specification, environmental assessment, environmental benefit, hazardous substance specification, and recycling), for a total of four categories and 18 criteria. This mechanism is expected to help in the selection of competitive suppliers to establish long-term cooperation relationships and improve the competitiveness of enterprises.

3. Research Method and Design

After a literature review and the establishment of our purposes or research, the research method was selected, and the research process was designed. First, the ANP was used as a tool to select suppliers for green supplier selection. Second, the IPA was used as a tool for supplier performance analysis and improvement for green supplier guidance. In addition, to improve research and data analysis efficiency, this study integrates the advantages of the ANP and IPA and proposes an ANP–IPA integration application to serve as a sustainable supplier selection and guidance mechanism for enterprises. This is expected to simplify the supplier selection and guidance procedures to achieve a win-win situation for the sustainable management of the supply chain.

3.1. ANP (Analytic Network Process)

The motive for adopting the ANP is that the ANP is based on the AHP and is a common tool in decision making. In the solution procedure of the AHP, it is supposed that factors at all levels should be independent, but in reality, many problems cannot be constructed in a hierarchy model because the relationship of mutual effect and dependence is likely to hide between factors at both high and low levels. The importance of the criteria may influence the selection of the solution, and the solution may influence the importance of the criteria. Therefore, Saaty corrected this theory and proposed the ANP after taking into consideration the relationship of dependence and feedback [71].
The ANP is applied to many problems that require a decision to be made. The main steps to use the ANP for decision procedure assessment are as follows [72,73]: (1) define the problem and confirm the decision architecture; (2) establish a network hierarchy structure; (3) conduct a pairwise comparison and calculation in which the nine-point scale developed by Saaty and Kearns [74] is adopted to evaluate the relative importance of two pairwise comparison items; in the matrix, 1 shows that two items are of equal importance, and 9 shows that one item is much more important than the other. The “items” in this study include three categories with 11 criteria: (4) to establish a supermatrix and conduct a limiting calculation; (5) to calculate the relative weight; and (6) to rank the solutions in priority.
In conclusion, concerning multi-objective and multi-criteria decisions, when there are different options, the ANP is able to analyze the priority of each solution and tell the decision maker to select the best solution [45,47]. In addition, the ANP can be used in an importance analysis of enterprise performance indexes and as the basis of strategy implementation and resource allocation [75,76]. Therefore, in this paper, the ANP is used as a tool to select green suppliers with competitive potential. Moreover, in this paper, based on the analysis data in the ANP implementation process such as index importance priority ranking and each supplier’s performance level evaluation results for each index, a further analysis is developed with the IPA to provide an importance reference basis for subsequent supplier guidance and improvement suggestions.

3.2. IPA (Importance–Performance Analysis)

In terms of a supplier guidance mechanism, this study uses the IPA as an analysis tool. The IPA was first proposed by Martilla and James [77]. At first, this mode was used for the analysis of product attributes in the motorcycle industry; the main concept was a two-dimensional matrix that was drawn based on the average scores of degree of importance and degree of performance. The degree of performance is taken as axis X, and the degree of importance as axis Y; the two-dimensional matrix is used to distinguish the relative position of different average score attributes and analyze the relationship between importance and performance to further provide practical suggestions and strategy applications for specific quality attributes. The IPA also can be applied in various fields of enterprise management [78], and it is specifically applied in brand, product, service, and correction analysis of advantages and disadvantages of point of sale establishment [79,80]. According to the IPA, it is assumed that consumer satisfaction with products is sourced from their expectations and evaluations of product or service performance [81]. According to O’Sullivan [82], with the average score of degree of satisfaction (axis X) and degree of emphasis (axis Y) as a separation point, the space is divided into four quadrants (I, II, III, and IV), and the actual degrees of satisfaction and emphasis are drawn in the two-dimensional matrix. The meaning of each quadrant is specified as follows:
  • Quadrant I: keep up the good work: with a high degree of emphasis and a high degree of satisfaction, this area is also called the “advantage keeping area”;
  • Quadrant II: concentrate here: with a high degree of emphasis and a low degree of satisfaction, this area is also called the “preferential improvement area”;
  • Quadrant III: low priority: with a low degree of emphasis and a low degree of satisfaction, this area is also called the “secondary improvement area”;
  • Quadrant IV: possible overkill: with a low degree of emphasis and a high degree of satisfaction, this area is also called the “excessive emphasis area.”
In conclusion, in this paper, a correction is made with reference to the practice of O’Sullivan [82]; the application of the ANP and IPA is integrated, and no “supplier performance index level and performance index importance questionnaire” is additionally distributed. The ANP determines calculations using Super Decision software, and the supplier performance index level priority score (axis X) and performance index importance score (axis Y) are obtained to serve as the analysis basis of the IPA. Quadrants I, II, III, and IV are used to analyze the relationship between supplier performance and index importance and further provide supplier guidance and improvement suggestions.

3.3. Research Design

This study aims to establish a green supplier selection and guidance mechanism through the integration of the advantages of the ANP and IPA, and the research process includes three main stages, as shown in Figure 1. In stage 1, through a literature review and an expert questionnaire survey, green supplier selection indexes are completed; in stage 2, green suppliers with competitive potential are selected with the ANP; and finally, the results of the IPA are presented as green supplier guidance and improvement suggestions.

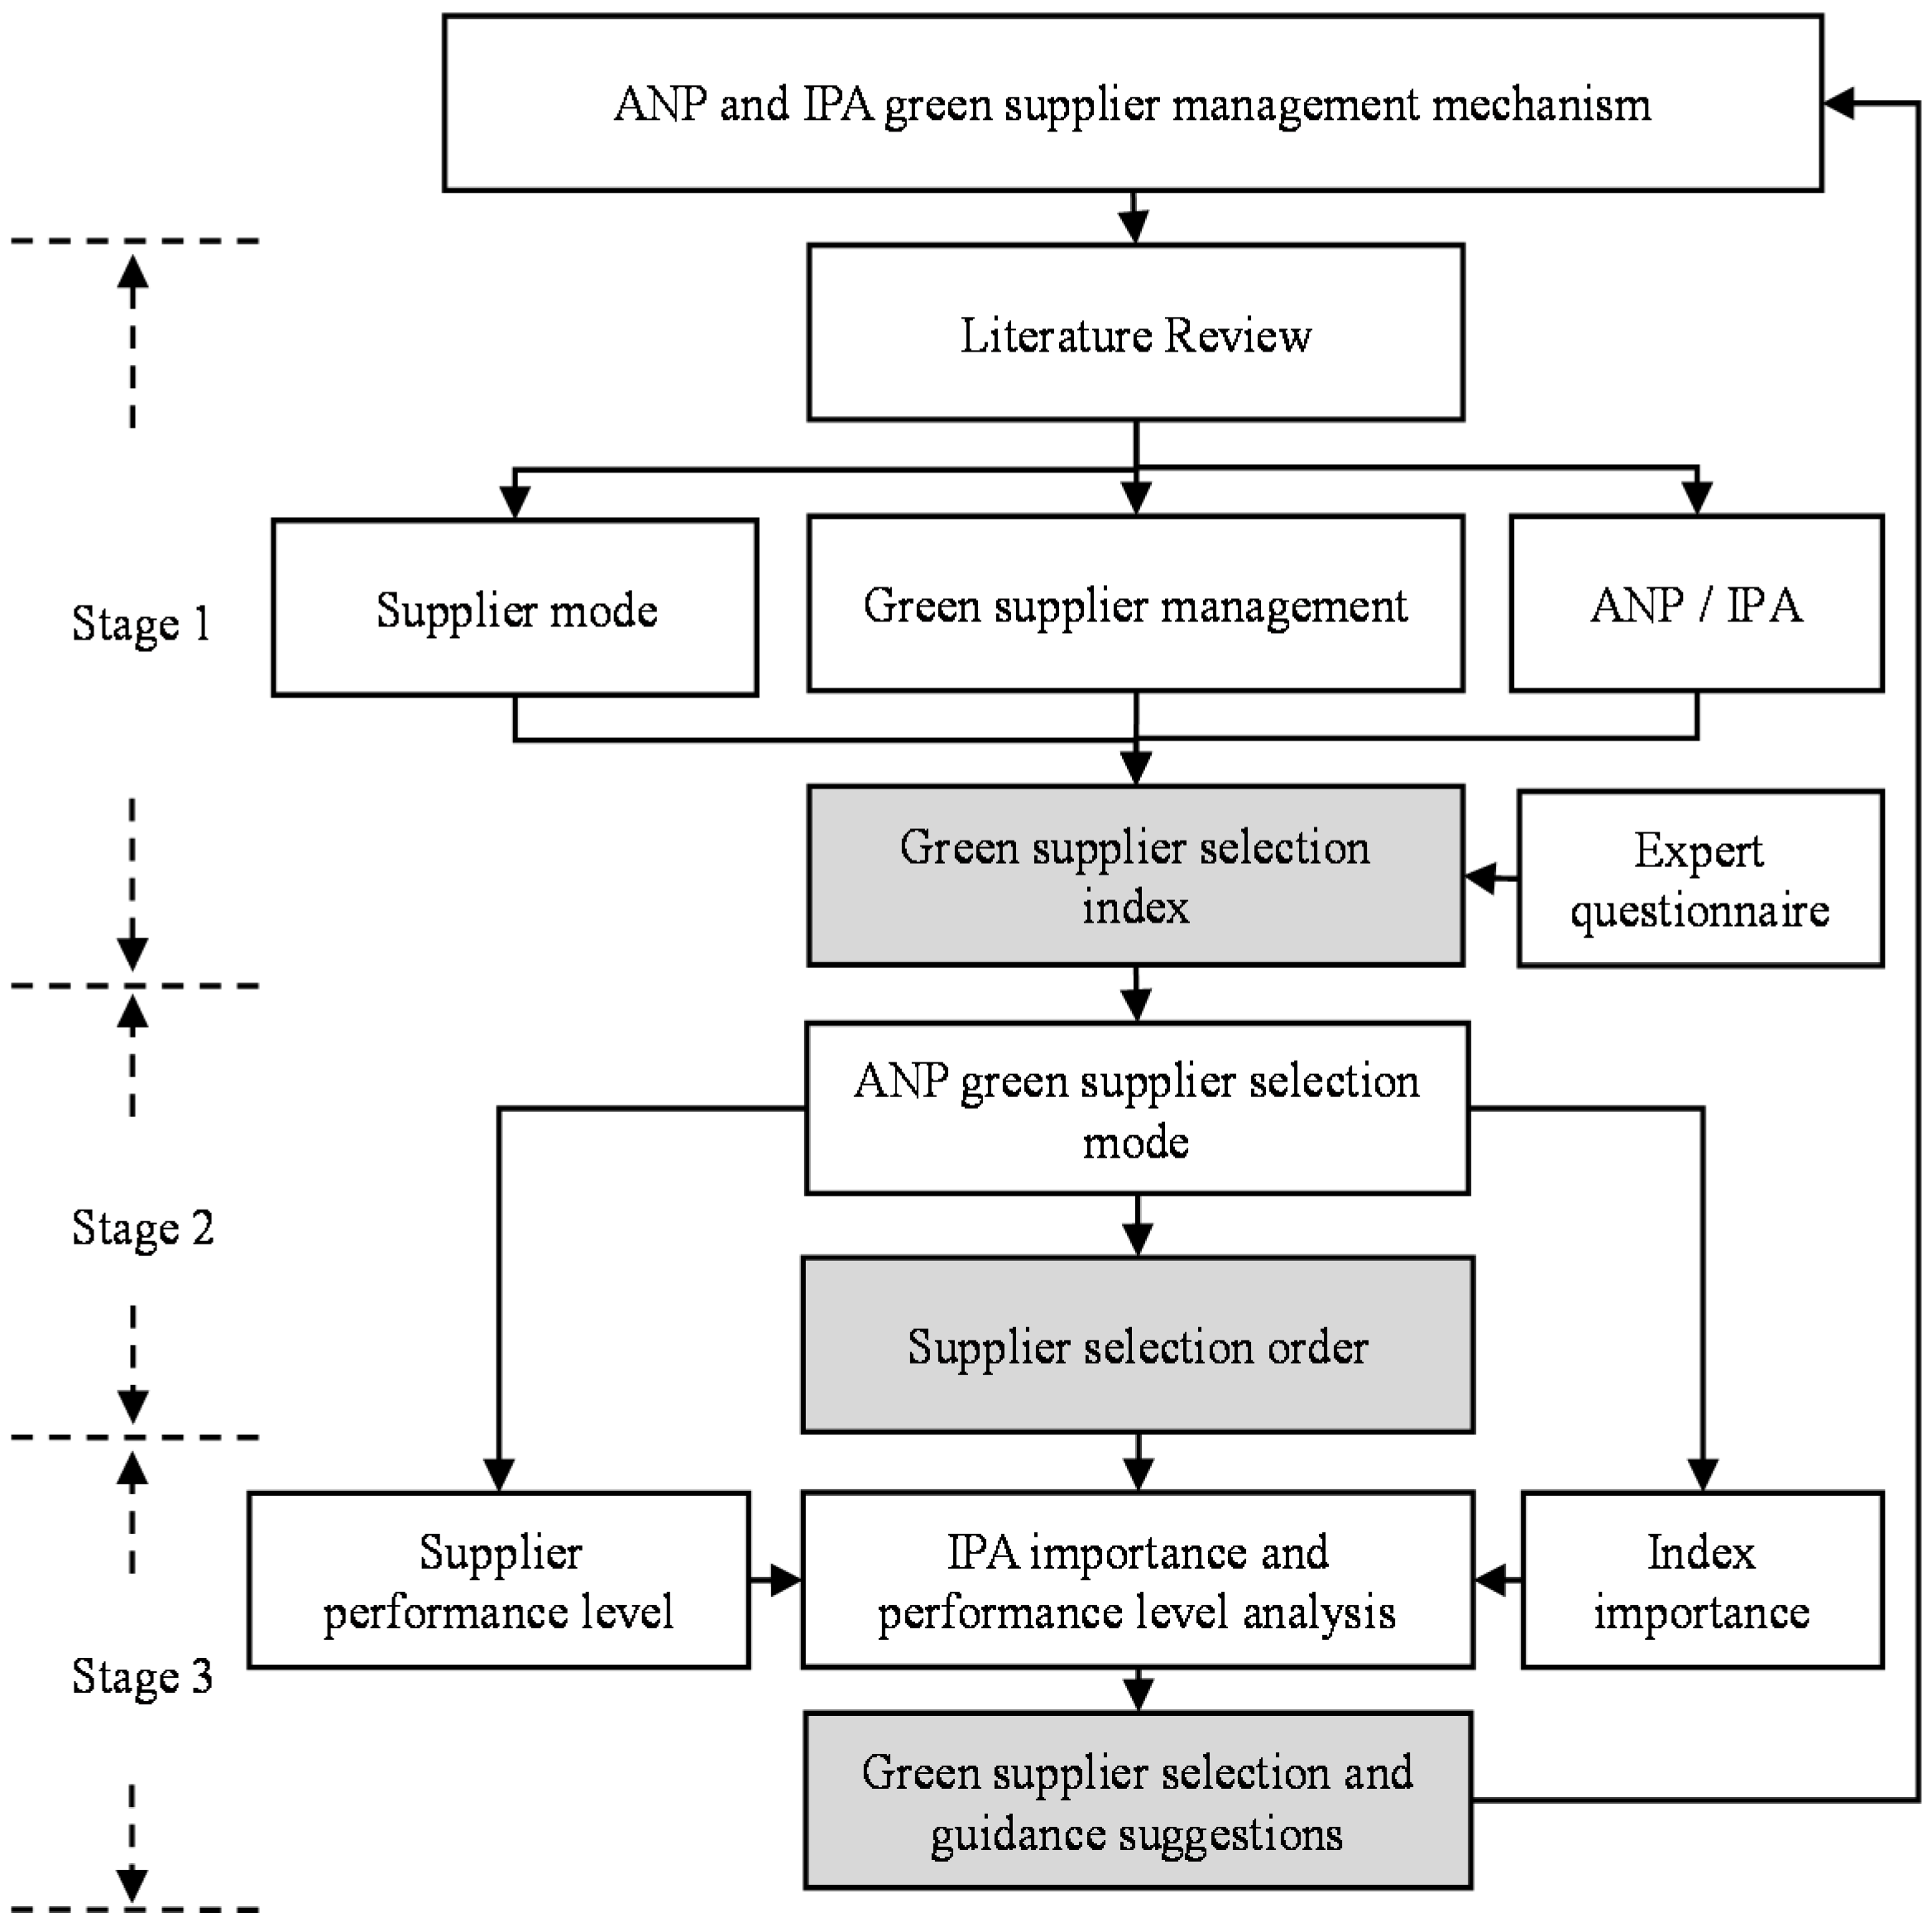
3.3.1. Research Process

  • Stage 1: determination of green supplier evaluation indexes
Using the literature review on supplier mode, green supplier management, ANP, IPA, and the expert questionnaire survey, green supplier selection indexes are introduced and used as the basis for the ANP green supplier selection.
2.
Stage 2: green supplier ANP selection analysis
Using the ANP as the green supplier selection tool, experts are invited to score suppliers based on their index importance weight and the suppliers’ performance level in each index; using a 2 × 2 comparison matrix, supplier priority rankings are obtained to select green suppliers with competitive potential.
3.
Stage 3: green supplier IPA guidance analysis
According to the company’s needs, the top two or three suppliers, namely green supplier groups with competitive potential, are selected to form a list of suppliers with sustainable development. Next, the IPA is used to further analyze the index importance and performance level of these suppliers, and the analysis results are regarded as an important reference basis for supplier guidance and improvement suggestions.

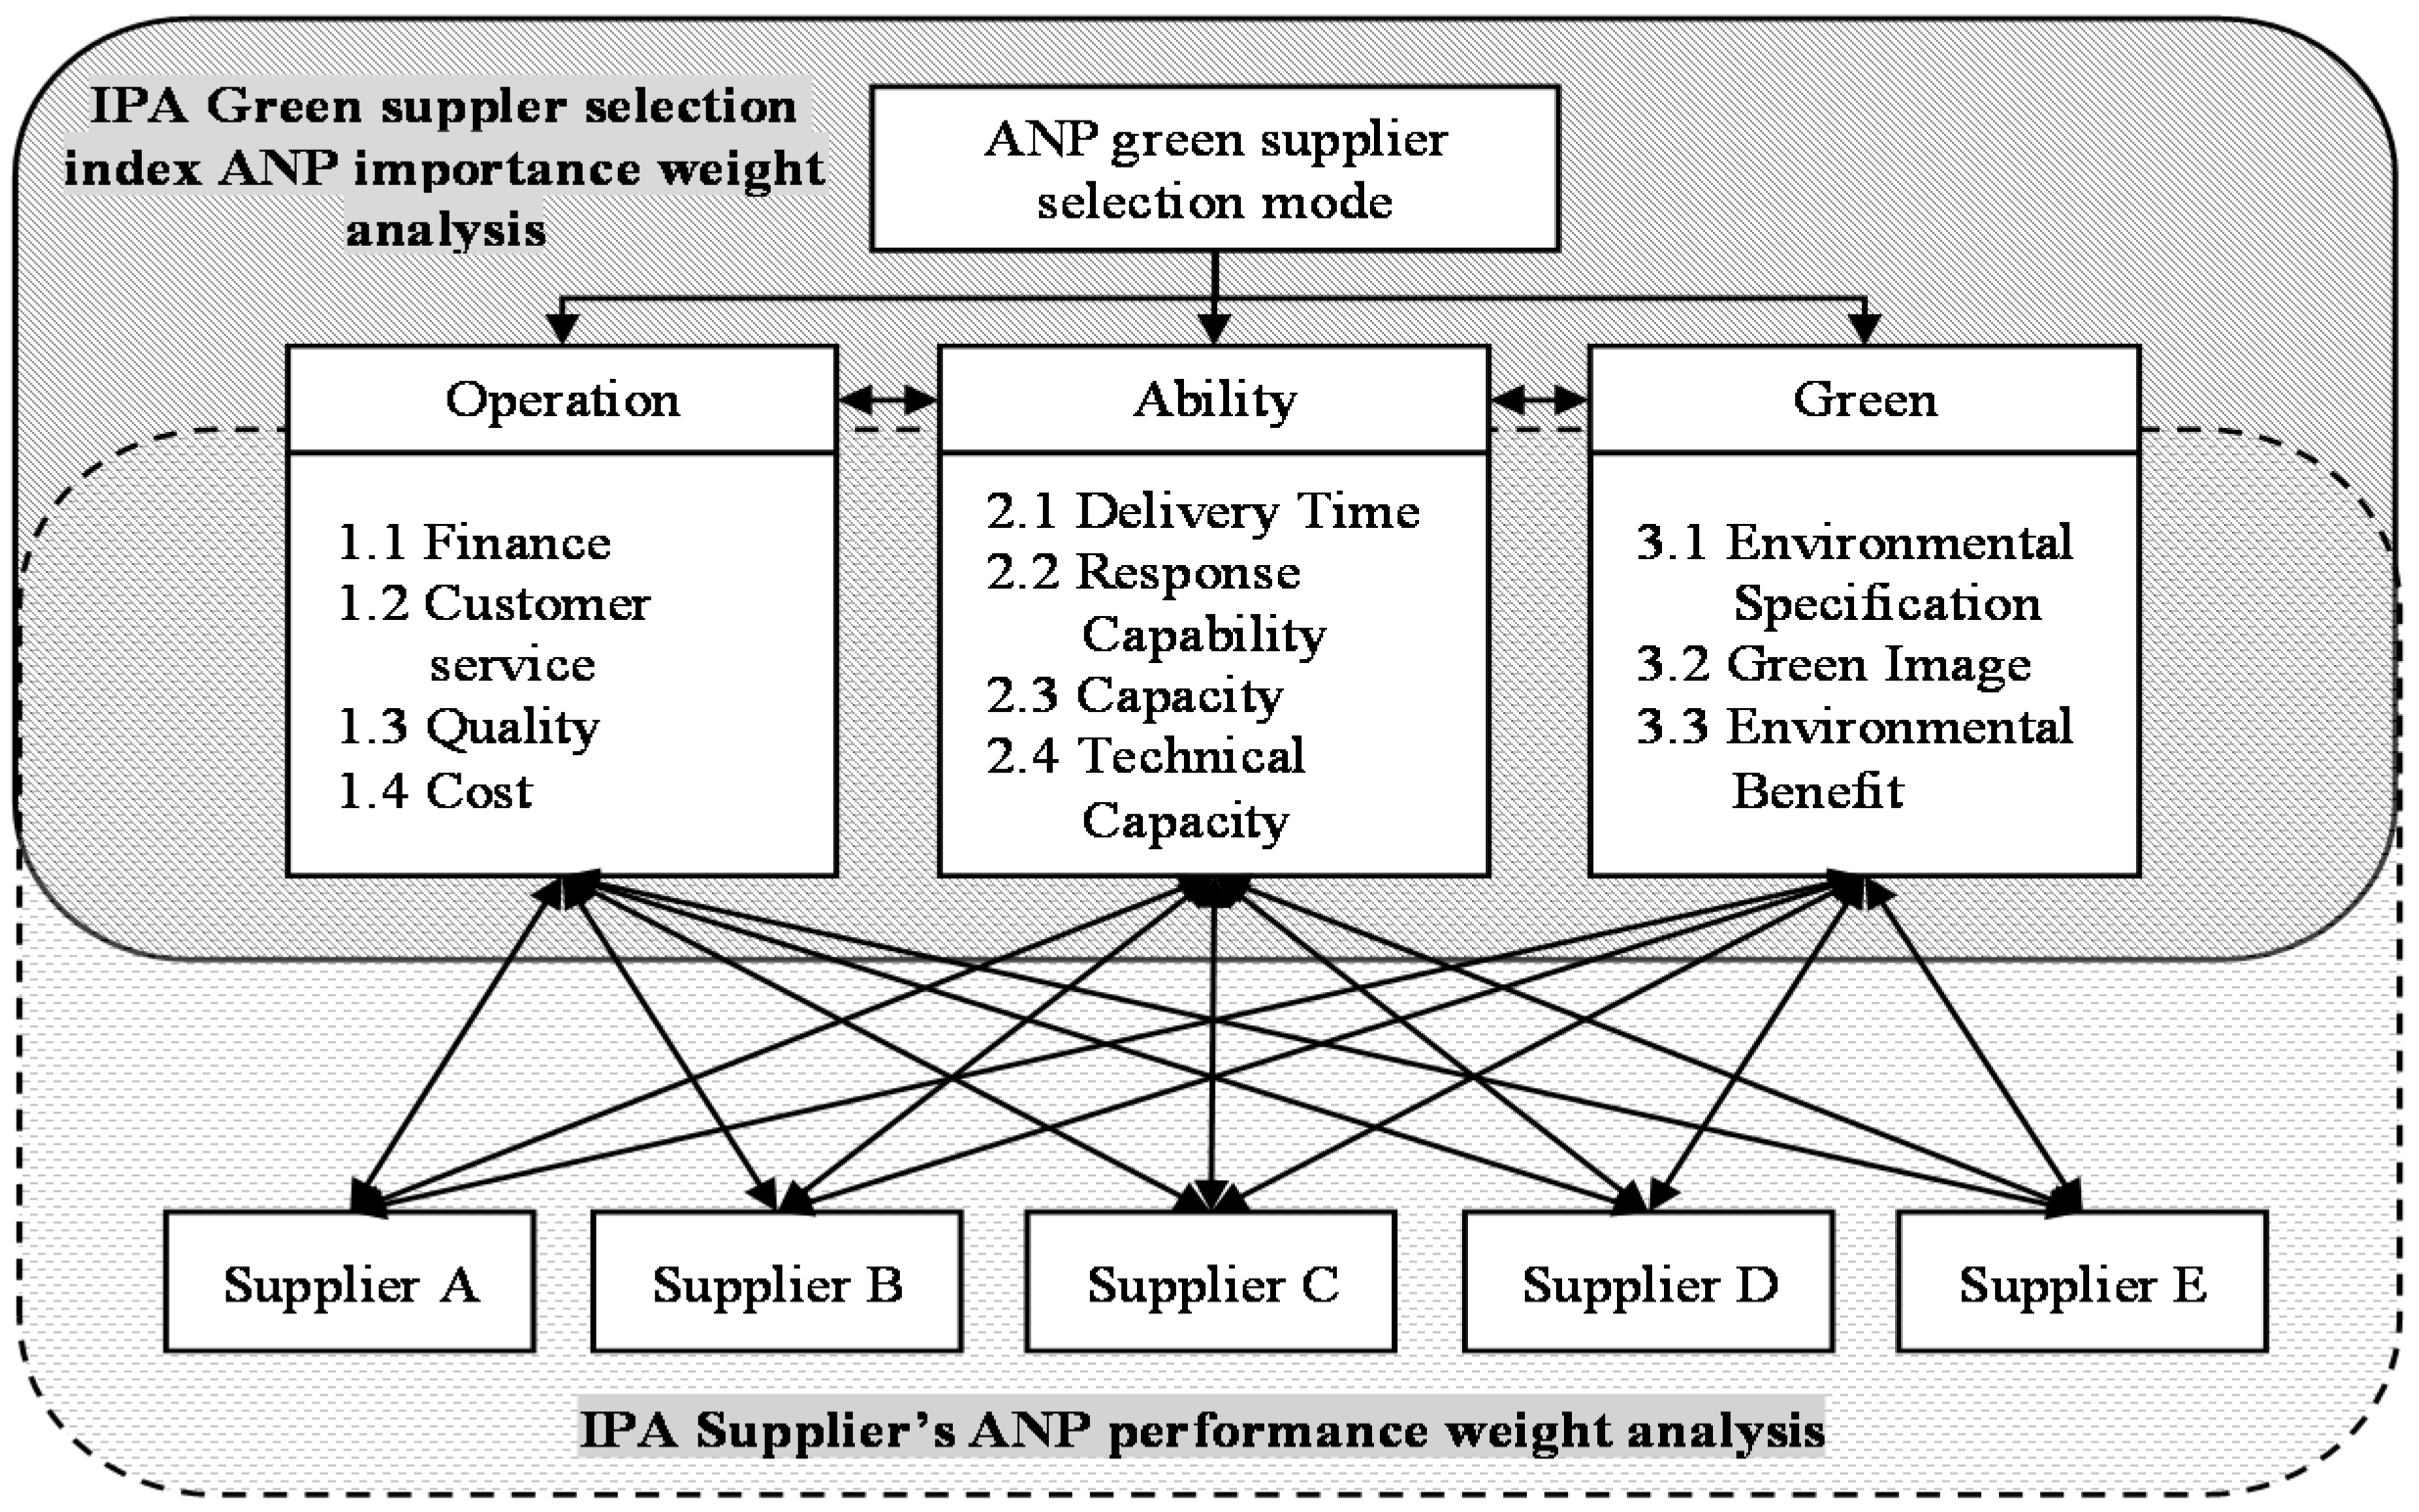
3.3.2. Connotation of the Integrated Application of ANP and IPA

It can be observed from Figure 1 that the ANP in stage 2 obtains supplier priority rankings based on index importance weight and supplier performance level in each index. The IPA in stage 3 analyzes the index importance and performance level of each supplier to provide direction for guidance and improvement. In stages 2 and 3, the scores of index importance and supplier performance level in each index are obtained. Consequently, this paper proposes the integrated application of the ANP and IPA as follows:
  • ANP stage
The collected ANP expert questionnaires are input in the ANP exclusive software “Super Decisions” to obtain performance priority rankings for five suppliers under the importance weights of three criteria and 11 indexes, in which the top three (namely the suppliers with competitive potential) are selected as suppliers for the long term.
2.
ANP and IPA integration stage
Based on the independent feedback features of the ANP and the convenience of the Super Decisions software, the importance weights of 11 indexes in three major categories as well as five suppliers’ performance scores in the 11 indexes can be calculated, which comprises the original analysis data of the IPA. Thus, the implementation of the IPA can be simplified and the questionnaire data flow collected; moreover, the analysis results of the ANP can be used for extended application.
3.
IPA stage
Based on the analysis results of the ANP, including (1) the importance weights of 11 indexes and (2) five suppliers’ performance level scores in the 11 indexes, suppliers with competitive potential are analyzed using the IPA in terms of their advantages and disadvantages in 11 indexes. The results serve as a basis for long-term supplier management and guidance.

4. Case Analysis

This paper analyzes green supplier selection results of a company and discusses the subsequent guidance and suggestions using the ANP and IPA green supplier selection and guidance mode to verify the feasibility and effectiveness of this mode.

4.1. About the Company

The case studied here is a bicycle manufacturer in Taiwan. This company was founded in 1980 and was dominated by OEM and the pursuit for mass production until the early 1990s. However, after failures in the investment branches in the USA and Germany as well as changes in the industrial environment, the entrepreneur began to consider overhauling the company’s operating strategy. Supplier performance would thus be influenced by the relationship between manufacturers or the strategy network between them [83,84]; therefore, in 1994, based on combination of internal and external resources, the company started to establish a supply chain management and developed folding bicycle products through joint R&D and brand sharing with suppliers. However, currently, with rising environmental consciousness becoming a trend, the company needed to introduce green supplier management [85].

4.2. Green Supplier Selection and Guidance of a Case Company

In this study, a project team is composed of eight first-level directors, including a president, general manager, and assistant managers of the R&D, business, production, management, materials control, and quality assurance departments. The project team is composed of 12 members who are responsible for the case study company’s green supplier selection and guidance work, including the following: (1) determination of green supplier evaluation indexes; (2) green supplier ANP selection analysis; and (3) green supplier IPA guidance analysis.

4.2.1. Determination of Green Supplier Evaluation Indexes

Based on a literature review and the company’s experience, four major green supplier selection categories are summarized: (1) operation management; (2) production management; (3) customer management; and (4) green management. A total of 18 evaluation indexes are involved [49,62,65,68], as shown in Table 1. The case company’s project team conducts an experts’ questionnaire survey; the appropriateness of the above green supplier evaluation indexes is scored from 1 to 10, and related suggestions are given. Then, the 12 experts’ scores are summed and averaged. After meeting for discussion and scoring, a 7.00 score is taken as the threshold value, and three major categories, including (1) operation; (2) ability; and (3) greening are included with 11 evaluation indexes involved, as shown in Figure 2. Thus, the ANP expert questionnaire is designed, and the project team carries out the expert questionnaire survey.

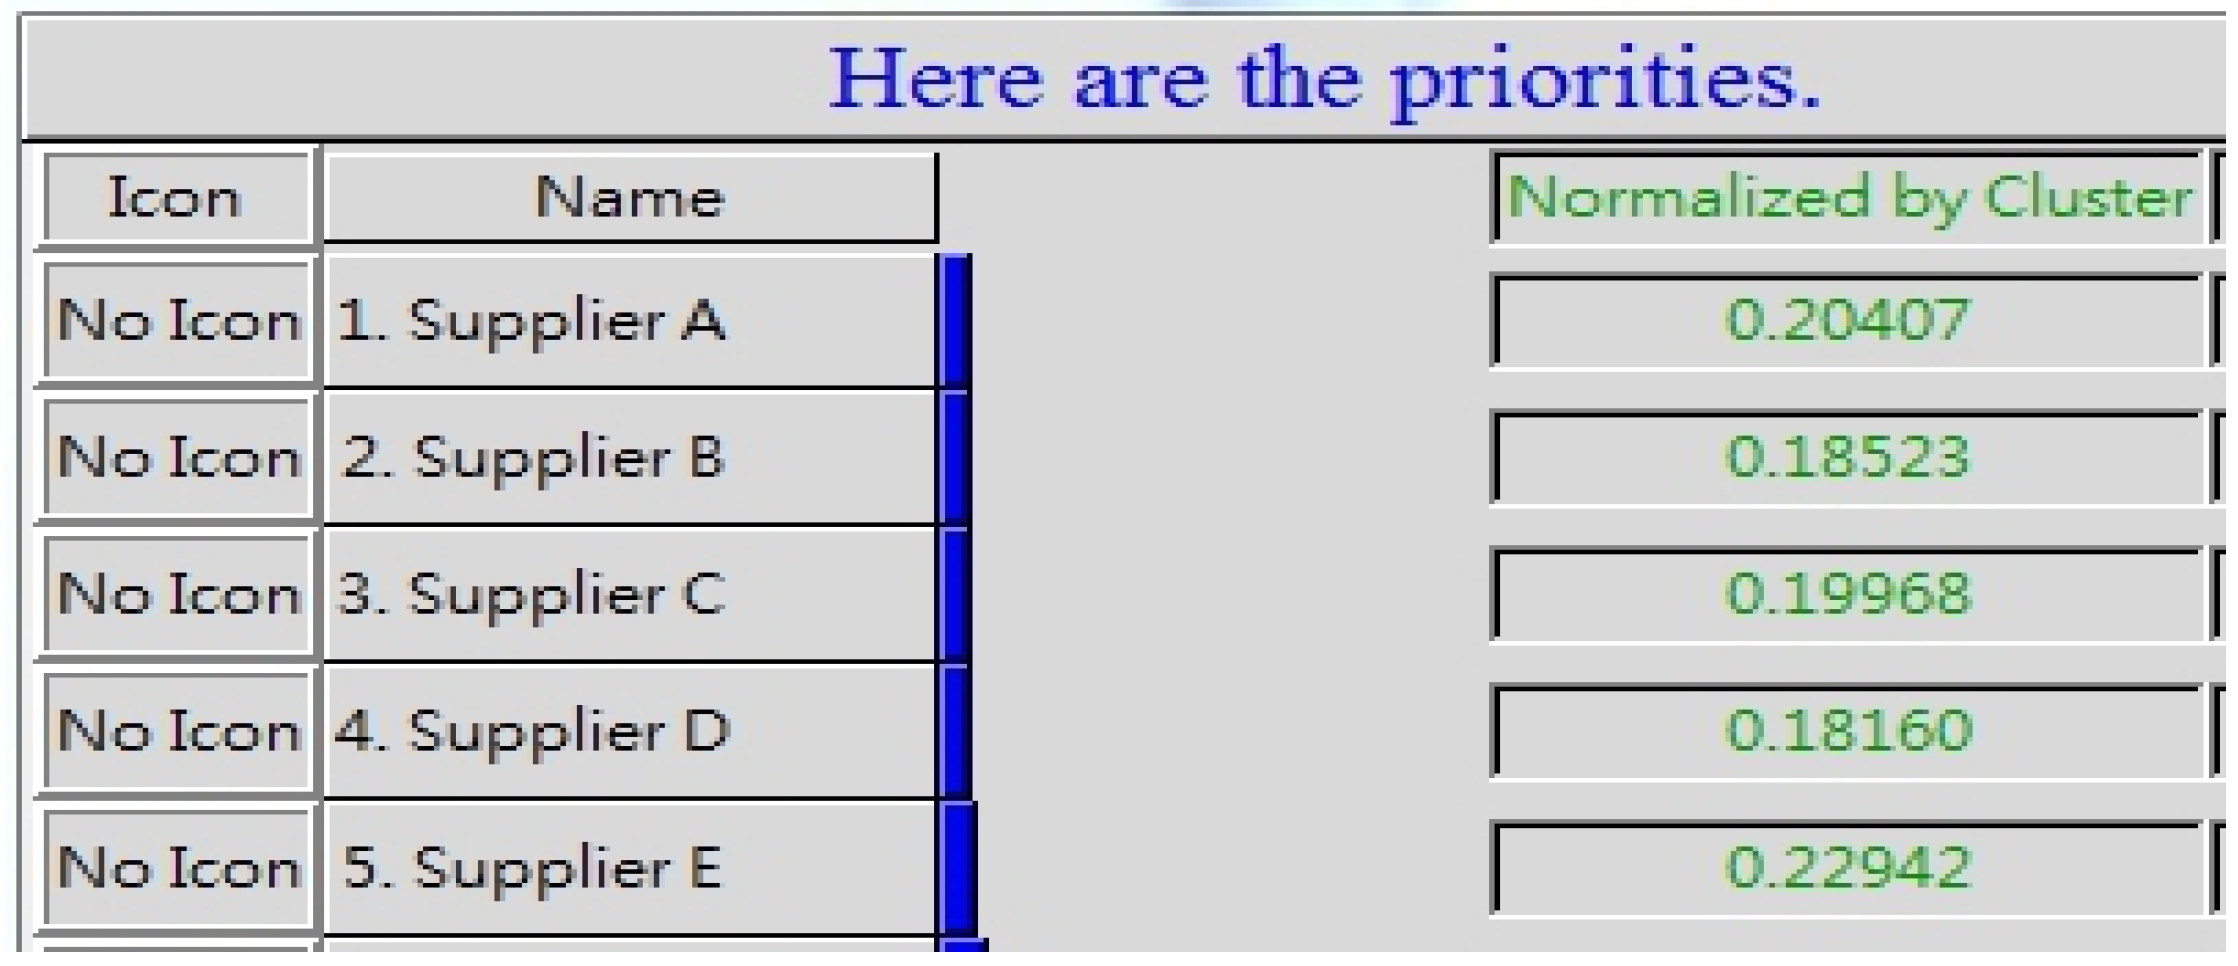
4.2.2. Green Supplier ANP Selection Analysis

According to the experts’ questionnaire survey results in the previous section, green supplier ANP selection analysis is conducted, as shown in Figure 2. Each expert’s paired comparison ANP questionnaire is calculated using the Super Decisions software package to verify whether each expert’s evaluation matrix is in line with the conformance requirements; if not, reconfirmation with the expert is required. In this study, the ANP experts’ questionnaire survey results are all less than 0.1 in the consistency analysis, which is in line with the consistency requirements [72,73]; the questionnaire results can be further integrated using geometric means to establish a comparison matrix.
In this paper, the experts’ performance scores for five major suppliers under each green supplier selection index are input into the Super Decisions software to be calculated. Under the three major green supplier selection categories a paired comparison analysis is conducted, and the evaluation indexes are independent to highlight the influence of each evaluation criterion on the other criteria. After a paired comparison between the categories and criteria, the three super matrices of the ANP (the unweighted, weighted, and limiting supermatrix) are derived, as shown in Appendix A, Appendix B and Appendix C, respectively. Regarding green supplier selection, we can see the five suppliers’ rankings under the three major green supplier selection categories and 11 evaluation indexes of the company, as shown in Figure 3. Supplier E has the highest score (0.22942), followed by supplier A (0.20407), supplier C (0.19968), and supplier B (0.18523), with supplier D having the lowest score (0.18160). Supplier E has the best performance in the green supplier evaluation indexes proposed by the company. Supplier E is the first choice of the company’s green suppliers, while suppliers A and C are candidates of the company’s green suppliers.
In conclusion, using suppliers’ ANP performance level weight analysis, the supplier with the best performance in green supplier selection indexes, namely supplier E, is selected based on the company’s green supplier selection indexes. In this way, the rankings for supplier alternatives can be obtained.

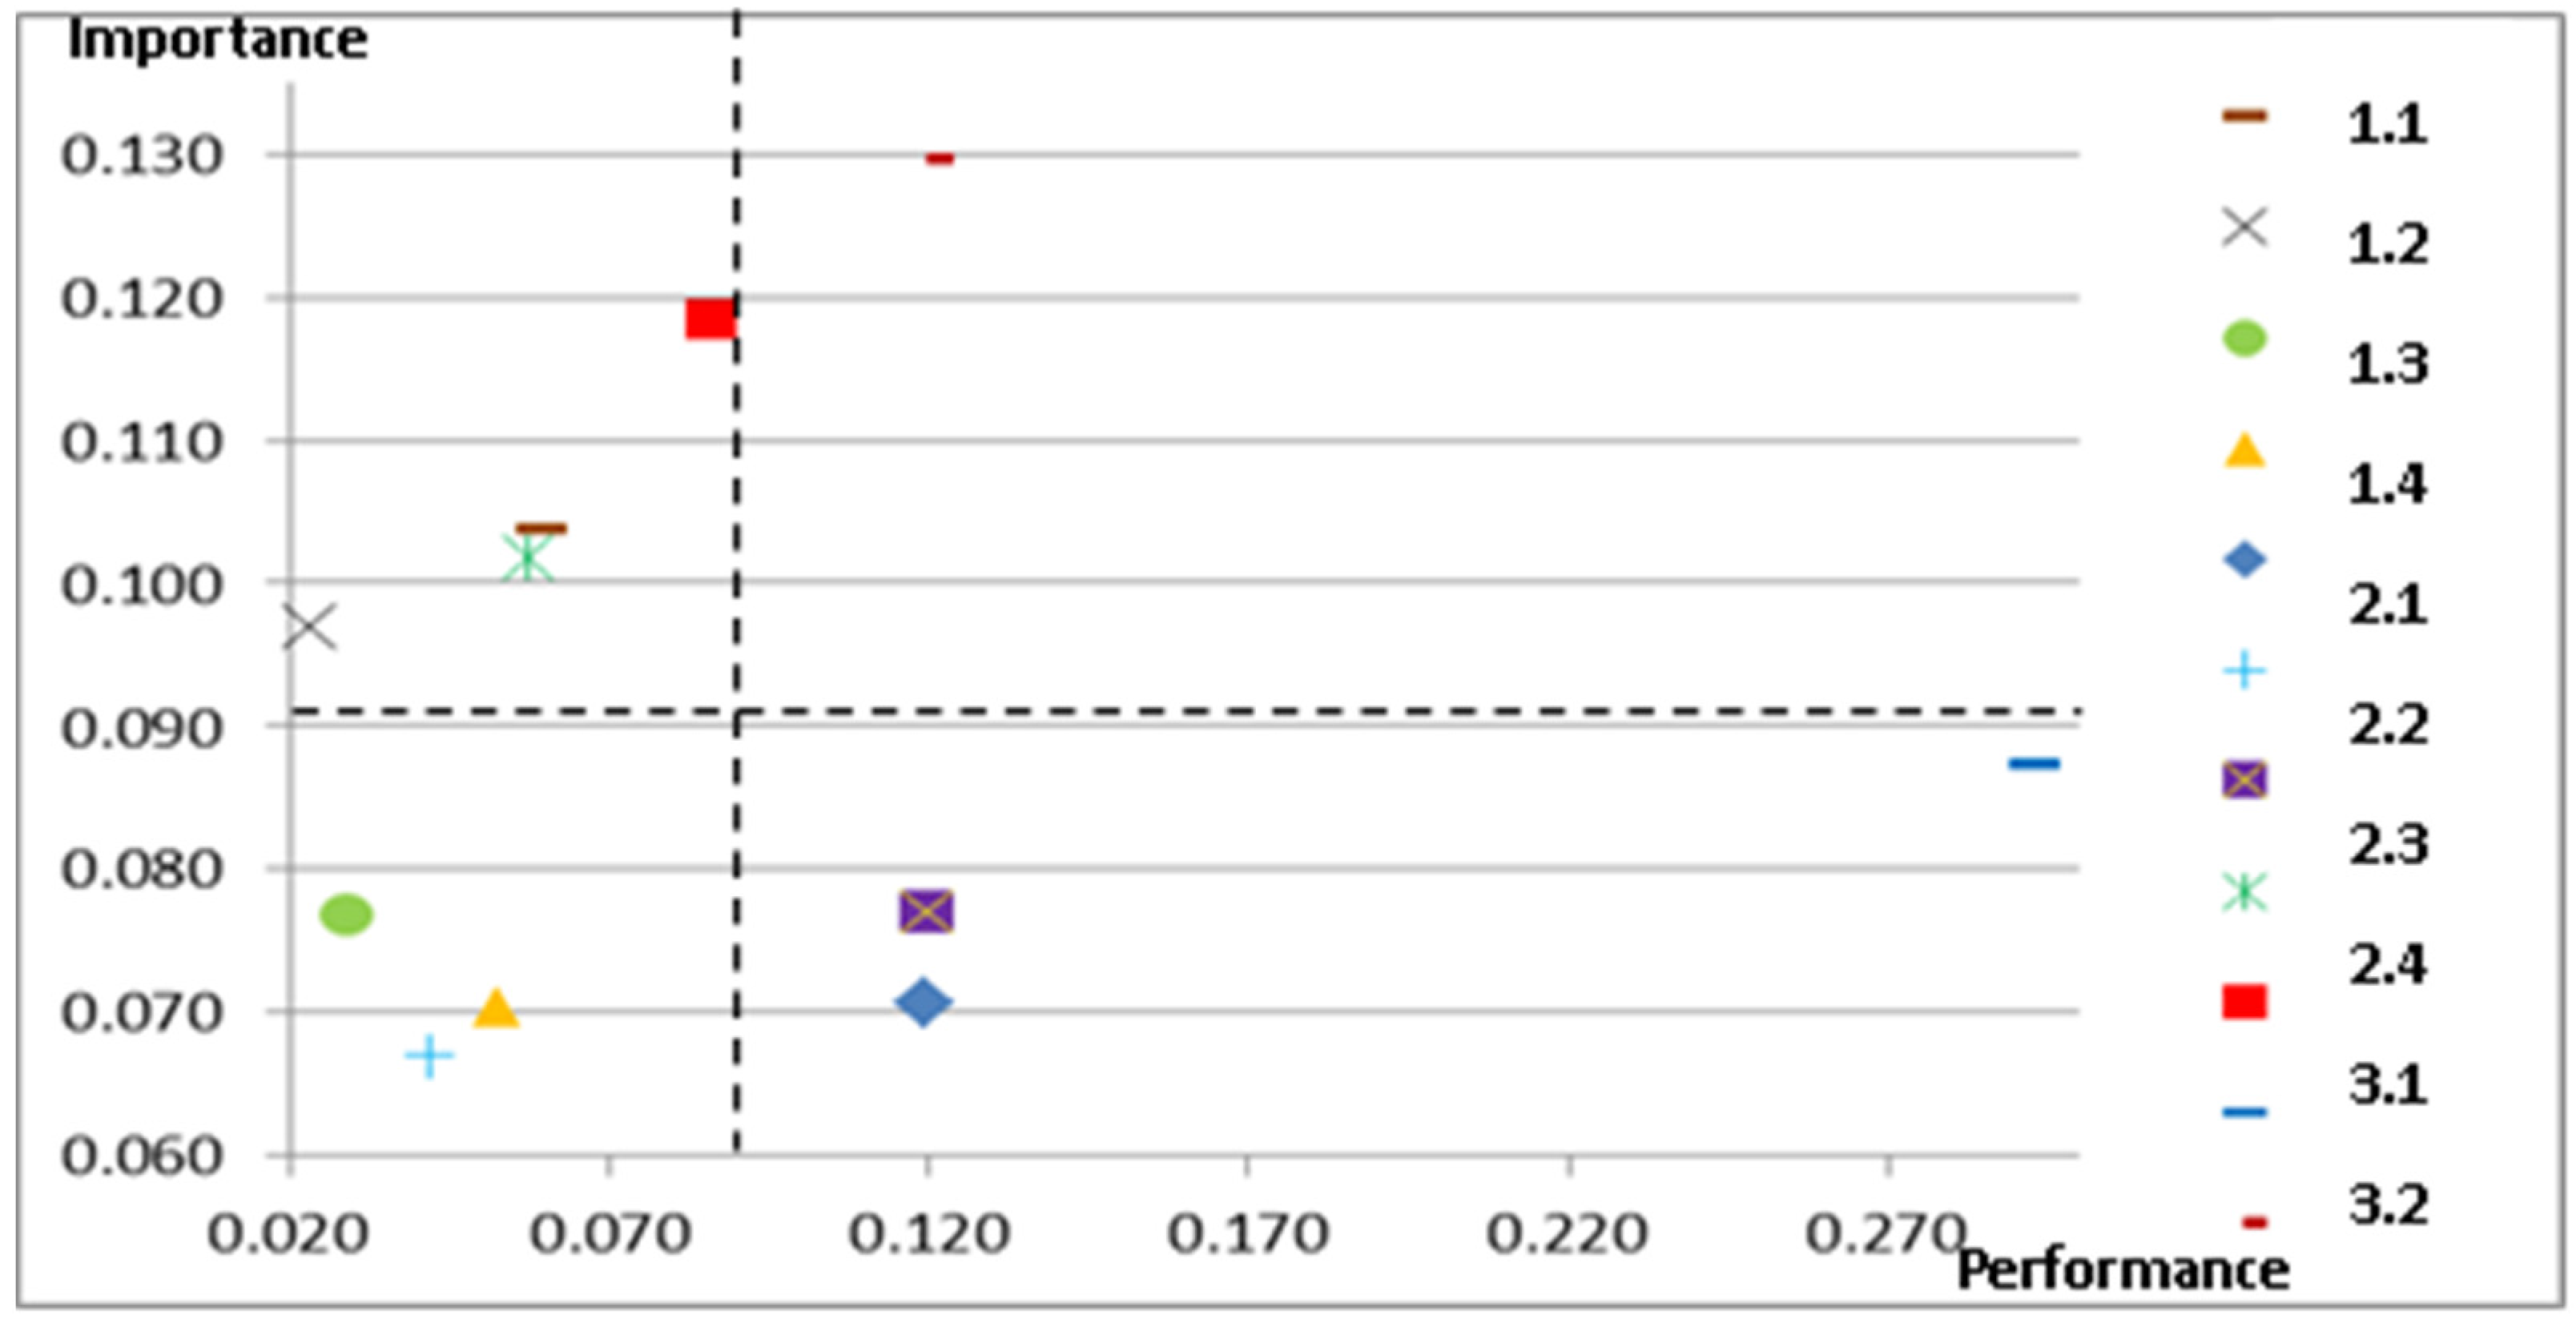
4.2.3. Green Supplier IPA Guidance Analysis

In this paper, the IPA is used to further verify supplier performance in each green supplier evaluation index, and the company’s supplier guidance mechanism is established to serve as a reference for each supplier in subsequent internal improvement so as to achieve a win-win result.
This paper proposes the use of the ANP analysis results as follows: use the importance weight of 11 indexes and the five suppliers’ performance scoring in these 11 indexes as the data source of the IPA to analyze each supplier’s performance in 11 green supplier evaluation indexes and provide relevant guidance suggestions.

Analysis of the Importance of Evaluation Indexes

Using Super Decisions software, the case company’s green supplier evaluation index importance weight (excluding supplier performance) can be conveniently obtained, as shown in Figure 2 (full-line square part). After a paired comparison between the categories and criteria is obtained, three super matrixes of the ANP are derived, as shown in Appendix D, Appendix E, and Appendix F.
As shown in Table 2, according to the case study company, the three categories of green supplier evaluation indexes are ranked in terms of importance, namely, operation (0.348), green (0.335), and ability (0.317), and then the importance ranking of indexes under these three categories is further analyzed. Under the operation category, the 1.1 financial index has the highest importance (0.298), which is followed by the 1.2 customer service index (0.279). Under the ability category, the 2.4 technical capacity index has the highest importance (0.322), followed by the 2.3 capacity index (0.244). Under the green category, the 3.3 environmental benefit index has the highest importance (0.386), which is followed by the 3.1 environmental specification index (0.353).
In addition, in overall index importance weight performance, the company’s top five major green supplier selection indexes are the 3.3 environmental benefit index (0.130), 3.1 environmental specification index (0.118), 1.1 financial index (0.104), 2.4 technical capacity index (0.102), and 2.1 delivery time index (0.087). These results show that in supplier selection indexes, the company pays significant attention to the 3.3 environmental benefit index and the 3.1 environmental specification index under the green category. In addition, the company emphasizes the 1.1 financial index under the operation category. The company focuses on the 2.4 technical capacity index and the 2.1 delivery time index under the ability category.
In conclusion, using a green supplier selection index importance weight analysis, the company’s emphasis on each green supplier selection index can be determined. In terms of the categories, the case study company affirms that the supplier’s overall performance in the operation category is most important. As far as each category is concerned, the company pays more attention to the 1.1 financial index under the operation category, the 2.4 technical capacity index under the ability category, and the 3.3 environmental benefit index under the green category. In addition, as far as overall category indexes are concerned, the top five major green supplier selection indexes emphasized by the company are, in increasing order, the 3.3 environmental benefit index, 3.1 environmental specification index, 1.1 financial index, 2.4 technical capacity index, and 2.1 delivery time index.

Supplier Performance Analysis

Using Super Decisions software, each supplier’s performance in the case study company’s green supplier evaluation index can be conveniently obtained, as shown in Figure 2 (dotted-line square). After a paired comparison between the categories and criteria, three super matrixes of the ANP are derived, as shown in Appendix G, Appendix H, and Appendix I. (Due to space limitions, only supplier E’s supermatrix data will be provided).
Each supplier’s performance in the case study company’s green supplier selection indexes is summarized and shown in Table 3, which clearly presents each supplier’s performance and emphasis in each index. Supplier A focuses on performance in environmental specification and green image (0.196, 0.163); supplier B focuses on performance in environmental specification and green image (0.232, 0.145); supplier C focuses on performance in green image and environmental benefit (0.197, 0.167); supplier D focuses on performance in environmental specification and environmental benefit (0.249, 0.166); and supplier E focuses on performance in green image and environmental benefit (0.293, 0.120).
In conclusion, using the supplier performance analysis, it can be determined that each supplier has good performance in indexes in the green category. This result indicates that all suppliers accept the case company’s requirements for green specifications. However, green supplier management is comprehensive, and coordination with the case study company’s attributes is necessary; therefore, a further comprehensive analysis is needed.

Green Supplier’s IPA Explanation

First, calculating the threshold value is required. Under the condition that the company gives 11 evaluation indexes with a total score of 1, the threshold value is 0.091. Based on the importance scores in the 11 indexes (Table 2) and supplier E’s performance scores on the 11 indexes (Table 3), as shown in Table 4, supplier E’s IPA distribution diagram is drawn, as shown in Figure 4. Due to space limitations, supplier E is the only example shown.
It can be determined from supplier E’s IPA distribution diagram that in quadrant I, the advantage keeping area, supplier E only has a 3.3 environmental benefit index. Because the company places this index in a very important position and supplier E has good performance in the 3.3 environmental benefit index, supplier E’s overall performance is ranked first based on the condition of weighted scoring. This 3.3 environmental benefit index will be maintained to supplier E’s advantage. In addition, in quadrant II, the priority improvement area, there are a total of four items, including the 3.1 environmental specification index, 1.1 financial index, 2.4 technical capacity index, and 1.2 customer service index. Although supplier E is ranked first of the five suppliers, it can be determined after the IPA that supplier E still has significant room for improvement. The company strongly focuses on the above four indexes; thus, supplier E should list these four indexes as top priorities for improvement. Furthermore, it should re-verify the operation mode of the company’s resources and use its limited resources in places where they will make a greater difference [86], such as by implementing environmental specification requirements, building a complete financial management flow, improving the company’s technical capacity, and strengthening customer service, all of which would improve the company’s performance and lead to the company’s demands being satisfied and the establishment of complete supply chain relations with the company. Moreover, in quadrant III, the secondary improvement area, there are a total of three items, including the 1.3 quality index, 1.4 cost index, and 2.2 response capacity index, which will be provided to supplier E for reference. These three indexes are listed as secondary improvement items or are integrated into other items in their implementation process to be considered to improve supplier E’s overall performance. Finally, in quadrant IV, the excessive emphasis area, there are a total of three items, including the 3.2 green image index, 2.3 capacity index, and 2.1 delivery time index. Although supplier E has better performance in these three indexes, they are not the indexes that the company has prioritized. In terms of the green image index, the company’s requirement is to obtain related green certifications, such as for its carbon footprint or energy-efficient products, to reach certain standards. The suppliers included in the evaluations all possess the related certifications so that the green image index is not a high priority for the company. In addition, as for capacity and delivery time, the company’s requirement for suppliers also falls into basic conditions in which more orders will be given to the supplier with higher capacity rather than those with lower capacities. Therefore, supplier E and the company differ in their policy direction; as a result, there is a small difference between the two parties with regard to the input in the emphasis indexes. If the company is an important customer of supplier E, it is suggested that supplier E may adjust its strategy direction and invest its resources in the correct item to develop the greatest economic benefit [75,76].
In conclusion, this study uses the IPA for supplier guidance and improvement and presents specific quantitative analysis results so that the difference in strategy directions between the case study company and the supplier, as well as the deficiency in supplier performance, can be effectively understood to serve as a reference for supplier guidance and improvement. Through the supplier guidance and improvement mechanism proposed in this study, good interactions between enterprises can be increased to form closer cooperative relationships in the supply chain, which ultimately aids in the suppliers’ sustainable management and the creation of a win-win result [70].

5. Conclusion and Implications

This paper establishes a green supplier selection and guidance mechanism using the ANP and IPA, emphasizes the integrated application mode of the ANP and IPA, and analyzes the application mode with a specific company as an example to discuss the feasibility of this mode. The conclusion and management implications are specified in the following paragraphs.
First, with regard to the green supplier selection indexes listed by a company’s executives, an ANP importance weight analysis is conducted to help a company clearly understand its current policy and direction. Overall, a company’s emphasis on green supplier selection is as follows: the supplier is required to pay attention to environmental benefit performance, satisfy the environmental specification requirements, and have normal and transparent financial operations; moreover, the supplier’s technical capacity and product delivery time assessment is emphasized. In terms of management implications, this paper analyzes the importance rankings of green supplier selection indexes with the ANP, which can be provided to companies intending to introduce or that have already introduced green supplier management based on green supplier performance evaluations. In addition, a company may refer to this research process and obtain green supplier performance selection index importance rankings that meet that company’s needs and policy directions.
Second, based on the company’s emphasis on each green supplier selection index as well as each supplier’s performance in these indexes, the ANP is adopted to evaluate each supplier’s performance rankings in the indexes, provided that the company’s needs are satisfied. In the case study, the top two suppliers in the performance rankings are supplier E followed by supplier A. These two suppliers have competitive potential and are used as the basis for the establishment of green supplier management. In terms of management implications, this paper used the ANP as the green supplier selection analysis tool. A complete analysis is conducted on the company and suppliers, with an emphasis on the green supplier performance index. The related ANP green supplier selection process can be provided to bicycle-related industries for reference in green supplier selection.
Finally, in this paper, the ANP analysis results are integrated to serve as analysis data for the IPA to further analyze each supplier’s index importance and performance. In the IPA matrix, each supplier’s advantages and disadvantages can be clearly observed, and then the company may provide relevant improvement suggestions to each supplier. In this way, a complete supplier guidance mechanism is established to achieve a win-win result, thus providing a more consistent policy target for both the company and the suppliers. Therefore, in terms of management implications, the establishment of a supplier partnership of mutual trust is suggested that uses the IPA as the analysis tool for supplier guidance management. This use of the supplier guidance mechanism will be an improvement for the suppliers and create a win-win situation.
In addition, based on the ANP and IPA integration mode given here, the analysis data required by the IPA can be obtained with the ANP. The application of the ANP can thus be extended so that the ANP can evaluate the index and supplier priority rankings and carry out an in-depth analysis with the IPA to be used as a basis for guidance and improvement. Therefore, it is suggested that in future research, when the ANP is used as the analysis tool, the IPA can also be integrated into the analysis tool to serve as the extended analysis application of the ANP.

Author Contributions

Shi-Jer Lou and Li-Chung Chao conceived and designed the experiments; Chih-Chao Chung and Shi-Jer Lou performed the experiments; Chih-Chao Chung and Li-Chung Chao analyzed the data; Chih-Chao Chung and Shi-Jer Lou contributed reagents/materials/analysis tools; Chih-Chao Chung wrote the paper.

Conflicts of Interest

The authors declare no conflict of interest.

Appendix

Appendix A

Table A1. Supplier’s ANP performance unweighted supermatrix.
Suppliers1. Operation2. Ability3. Green
ABCDE1.11.21.31.42.12.22.32.43.13.23.3
SuppliersA000000.3150.1690.1740.1350.2320.0680.2000.0930.0900.3750.373
B000000.1070.3430.0750.2620.0750.3210.1040.3100.1870.0790.164
C000000.1480.1840.0820.2870.0800.2980.0970.2830.2910.1870.133
D000000.1970.2210.3740.0730.1070.2140.2000.1530.2700.1130.212
E000000.2330.0830.2940.2430.5060.0990.4000.1610.1620.2470.118
11.10.3110.3030.2000.2260.36300.3500.3150.32700.3160.4900.5110.4210.3300.290
1.20.2580.2750.3130.1350.1400.36500.3470.3490.6000.333000.2180.5110.153
1.30.2280.1940.2550.2990.1770.3280.33100.3240.40000.5100.263000.120
1.40.2030.2290.2310.3400.3200.3070.3190.338000.35100.2260.3610.1600.437
22.10.3060.3450.1910.1870.35400.5010.340000.3450.3180.3240.50000
2.20.2580.2500.3010.3000.12400.499000.32600.3180.31700.3330.348
2.30.2350.1920.2610.3810.3540.66700.33500.3490.33600.358000.315
2.40.2010.2120.2480.1320.1690.33300.32500.3250.3190.36500.5000.6670.338
33.10.3930.4650.2720.5000.1720.3320.3330.5120000.6000.33300.4170.429
3.20.3270.2910.3940.1670.5870.36300.488000000.50600.571
3.30.2800.2450.3340.3330.2400.3050.66700000.4000.6670.4940.5830

Appendix B

Table B1. Supplier’s ANP performance weighted supermatrix.
Suppliers1. Operation2. Ability3. Green
ABCDE1.11.21.31.42.12.22.32.43.13.23.3
SuppliersA000000.0430.0230.0240.0510.0910.0270.0530.0240.0220.0930.092
B000000.0150.0470.0100.0990.0290.1260.0270.0820.0460.0190.041
C000000.0200.0250.0110.1090.0320.1170.0250.0750.0720.0460.033
D000000.0270.0300.0510.0280.0420.0840.0530.0400.0670.0280.052
E000000.0320.0110.0400.0920.1990.0390.1050.0430.0400.0610.029
11.10.0510.0500.0330.0370.05900.0780.0700.20300.0980.1020.1070.0800.0630.055
1.20.0420.0450.0510.0220.0230.08200.0780.2160.1870.104000.0410.0970.029
1.30.0370.0320.0420.0490.0290.0730.07400.2010.12500.1060.055000.023
1.40.0330.0370.0380.0560.0520.0690.0710.076000.10900.0470.0690.0300.083
22.10.1030.1170.0640.0630.11900.1330.090000.1020.0630.0640.12400
2.20.0870.0850.1020.1010.04200.132000.09600.0630.06300.0820.086
2.30.0790.0650.0880.1290.1190.17700.08900.1030.09900.071000.078
2.40.0680.0720.0840.0450.0570.08800.08600.0960.0940.07200.1240.1650.083
33.10.1960.2320.1350.2490.0860.1240.1250.1920000.1980.11000.1310.135
3.20.1630.1450.1970.0830.2930.13600.182000000.16000.180
3.30.1400.1220.1670.1660.1200.1140.24900000.1320.2200.1560.1840

Appendix C

Table C1. Supplier’s ANP performance limiting supermatrix.
Suppliers1. Operation2. Ability3. Green
ABCDE1.11.21.31.42.12.22.32.43.13.23.3
SuppliersA0.0410.0410.0410.0410.0410.0410.0410.0410.0410.0410.0410.0410.0410.0410.0410.041
B0.0380.0380.0380.0380.0380.0380.0380.0380.0380.0380.0380.0380.0380.0380.0380.038
C0.0410.0410.0410.0410.0410.0410.0410.0410.0410.0410.0410.0410.0410.0410.0410.041
D0.0370.0370.0370.0370.0370.0370.0370.0370.0370.0370.0370.0370.0370.0370.0370.037
E0.0470.0470.0470.0470.0470.0470.0470.0470.0470.0470.0470.0470.0470.0470.0470.047
11.10.0690.0690.0690.0690.0690.0690.0690.0690.0690.0690.0690.0690.0690.0690.0690.069
1.20.0610.0610.0610.0610.0610.0610.0610.0610.0610.0610.0610.0610.0610.0610.0610.061
1.30.0480.0480.0480.0480.0480.0480.0480.0480.0480.0480.0480.0480.0480.0480.0480.048
1.40.0510.0510.0510.0510.0510.0510.0510.0510.0510.0510.0510.0510.0510.0510.0510.051
22.10.0600.0600.0600.0600.0600.0600.0600.0600.0600.0600.0600.0600.0600.0600.0600.060
2.20.0560.0560.0560.0560.0560.0560.0560.0560.0560.0560.0560.0560.0560.0560.0560.056
2.30.0620.0620.0620.0620.0620.0620.0620.0620.0620.0620.0620.0620.0620.0620.0620.062
2.40.0770.0770.0770.0770.0770.0770.0770.0770.0770.0770.0770.0770.0770.0770.0770.077
33.10.1090.1090.1090.1090.1090.1090.1090.1090.1090.1090.1090.1090.1090.1090.1090.109
3.20.0920.0920.0920.0920.0920.0920.0920.0920.0920.0920.0920.0920.0920.0920.0920.092
3.30.1110.1110.1110.1110.1110.1110.1110.1110.1110.1110.1110.1110.1110.1110.1110.111

Appendix D

Table D1. Green supplier selection index importance unweighted supermatrix.
1. Operation2. Ability3. Green
1.11.21.31.42.12.22.32.43.13.23.3
11.100.3500.3150.32700.3160.4900.5110.4210.3300.290
1.20.36500.3470.3490.6000.333000.2180.5110.153
1.30.3280.33100.3240.40000.5100.263000.120
1.40.3070.3190.338000.35100.2260.3610.1600.437
22.100.5010.340000.3450.3180.3240.50000
2.200.499000.32600.3180.31700.3330.348
2.30.66700.33500.3490.33600.358000.315
2.40.33300.32500.3250.3190.36500.5000.6670.338
33.10.3320.3330.5120000.6000.33300.4170.429
3.20.36300.488000000.50600.571
3.30.3050.66700000.4000.6670.4940.5830

Appendix E

Table E1. Green supplier selection index importance weighted supermatrix.
1. Operation2. Ability3. Green
1.11.21.31.42.12.22.32.43.13.23.3
11.100.0920.0830.32700.1580.1370.1430.1070.0840.074
1.20.09600.0910.3490.3000.167000.0560.1300.039
1.30.0860.08700.3240.20000.1430.074000.031
1.40.0810.0840.089000.17600.0630.0920.0410.111
22.100.1580.107000.1720.0890.0910.16400
2.200.157000.16300.0890.08900.1100.114
2.30.21000.10600.1740.16800.100000.103
2.40.10500.10200.1620.1590.10200.1640.2190.111
33.10.1400.1410.2160000.2640.14700.1730.179
3.20.15300.206000000.21100.238
3.30.1280.28100000.1760.2940.2060.2430

Appendix F

Table F1. Green supplier selection index importance limiting supermatrix.
1. Operation2. Ability3. Green
1.11.21.31.42.12.22.32.43.13.23.3
11.10.1040.1040.1040.1040.1040.1040.1040.1040.1040.1040.104
1.20.0970.0970.0970.0970.0970.0970.0970.0970.0970.0970.097
1.30.0770.0770.0770.0770.0770.0770.0770.0770.0770.0770.077
1.40.0700.0700.0700.0700.0700.0700.0700.0700.0700.0700.070
22.10.0710.0710.0710.0710.0710.0710.0710.0710.0710.0710.071
2.20.0670.0670.0670.0670.0670.0670.0670.0670.0670.0670.067
2.30.0770.0770.0770.0770.0770.0770.0770.0770.0770.0770.077
2.40.1020.1020.1020.1020.1020.1020.1020.1020.1020.1020.102
33.10.1180.1180.1180.1180.1180.1180.1180.1180.1180.1180.118
3.20.0870.0870.0870.0870.0870.0870.0870.0870.0870.0870.087
3.30.1300.1300.1300.1300.1300.1300.1300.1300.1300.1300.130

Appendix G

Table G1. Supplier E’s index performance unweighted supermatrix.
1. Operation2. Ability3. Green
1.11.21.31.42.12.22.32.43.13.23.3
11.100.3500.3150.32700.3160.4900.5110.4210.3300.290
1.20.36500.3470.3490.6000.333000.2180.5110.153
1.30.3280.33100.3240.40000.5100.263000.120
1.40.3070.3190.338000.35100.2260.3610.1600.437
22.100.5010.340000.3450.3180.3240.50000
2.200.499000.32600.3180.31700.3330.348
2.30.66700.33500.3490.33600.358000.315
2.40.33300.32500.3250.3190.36500.5000.6670.338
33.10.3320.3330.5120000.6000.33300.4170.429
3.20.36300.488000000.50600.571
3.30.3050.66700000.4000.6670.4940.5830

Appendix H

Table H1. Supplier E’s index performance weighted supermatrix.
1. Operation2. Ability3. Green
1.11.21.31.42.12.22.32.43.13.23.3
11.100.0920.0830.32700.1580.1370.1430.1070.0840.074
1.20.09600.0910.3490.3000.167000.0560.1300.039
1.30.0860.08700.3240.20000.1430.074000.031
1.40.0810.0840.089000.17600.0630.0920.0410.111
22.100.1580.107000.1720.0890.0910.16400
2.200.157000.16300.0890.08900.1100.114
2.30.21000.10600.1740.16800.100000.103
2.40.10500.10200.1620.1590.10200.1640.2190.111
33.10.1400.1410.2160000.2640.14700.1730.179
3.20.15300.206000000.21100.238
3.30.1280.28100000.1760.2940.2060.2430

Appendix I

Table I1. Supplier E’s index performance limiting supermatrix.
1. Operation2. Ability3. Green
1.11.21.31.42.12.22.32.43.13.23.3
11.10.1040.1040.1040.1040.1040.1040.1040.1040.1040.1040.104
1.20.0970.0970.0970.0970.0970.0970.0970.0970.0970.0970.097
1.30.0770.0770.0770.0770.0770.0770.0770.0770.0770.0770.077
1.40.0700.0700.0700.0700.0700.0700.0700.0700.0700.0700.070
22.10.0710.0710.0710.0710.0710.0710.0710.0710.0710.0710.071
2.20.0670.0670.0670.0670.0670.0670.0670.0670.0670.0670.067
2.30.0770.0770.0770.0770.0770.0770.0770.0770.0770.0770.077
2.40.1020.1020.1020.1020.1020.1020.1020.1020.1020.1020.102
33.10.1180.1180.1180.1180.1180.1180.1180.1180.1180.1180.118
3.20.0870.0870.0870.0870.0870.0870.0870.0870.0870.0870.087
3.30.1300.1300.1300.1300.1300.1300.1300.1300.1300.1300.130

References

  1. Barney, J.B. Purchasing, supply chain management and sustained competitive advantage: The relevance of resource-based theory. J. Supply Chain Manag. 2012, 48, 3–6. [Google Scholar] [CrossRef]
  2. Lee, H.L. The triple-A supply chain. Harv. Bus. Rev. 2004, 82, 102–113. [Google Scholar] [PubMed]
  3. Chopra, S.; Sodhi, M.S. Managing risk to avoid supply-chain breakdown. MIT Sloan Manag. Rev. 2004, 46, 53. [Google Scholar]
  4. Shepherd, C.; Günter, H. Measuring Supply Chain Performance: Current Research And Future Directions, in Behavioral Operations in Planning and Scheduling; Springer: Berlin, Germany, 2010; pp. 105–121. [Google Scholar]
  5. Tayur, S.; Ganeshan, R.; Magazine, M. Quantitative Models For Supply Chain Management; Springer Science & Business Media: Berlin, Germany, 2012. [Google Scholar]
  6. Jayaram, J.; Avittathur, B. Green supply chains: A perspective from an emerging economy. Int. J. Prod. Econ. 2015, 164, 234–244. [Google Scholar] [CrossRef]
  7. Green, K.W., Jr.; Kenneth, W.; Zelbst, P.J.; Meacham, J.; Bhadauria, V.S. Green supply chain management practices: Impact on performance. Supply Chain Manag. Int. J. 2012, 17, 290–305. [Google Scholar] [CrossRef]
  8. Chen, C.-C.; Shih, H.-S.; Shyur, H.-J.; Wu, K.-S. A business strategy selection of green supply chain management via an analytic network process. Comput. Math. Appl. 2012, 64, 2544–2557. [Google Scholar] [CrossRef]
  9. Abalo, J.; Varela, J.; Manzano, V. Importance values for Importance–Performance Analysis: A formula for spreading out values derived from preference rankings. J. Bus. Rese. 2007, 60, 115–121. [Google Scholar] [CrossRef]
  10. Coghlan, A. Facilitating reef tourism management through an innovative importance-performance analysis method. Tour. Manag. 2012, 33, 767–775. [Google Scholar] [CrossRef]
  11. Houssiaux, J. Le concept de" quasi-integration" et le role des sous-traitants dans l'industrie. Revue écon. 1957, 8, 221–247. (in French). [Google Scholar]
  12. Blois, K.J. Vertical Quasi-Integration. J. Ind. Econ. 1972, 20, 253–272. [Google Scholar] [CrossRef]
  13. Aoki, M. Information, Incentives and Bargaining in the Japanese Economy: A Microtheory of the Japanese Economy; Cambridge University Press: New York, NY, USA, 1988. [Google Scholar]
  14. Colombo, M.G.; Mariotti, S. Organizing vertical markets: The Italtel case. Eur. J. Purch. Supply Manag. 1998, 4, 7–19. [Google Scholar] [CrossRef]
  15. Klein, B.; Crawford, R.G.; Alchian, A.A. Vertical Integration, Appropriable Rents, and the Competitive Contracting Process. J. Law Econ. 1978, 21, 297–326. [Google Scholar] [CrossRef]
  16. Dornier, P.-P.; Ernst, R. The logistics impact of the channel tunnel. Interfaces 1997, 27, 39–59. [Google Scholar] [CrossRef]
  17. Stadtler, H. Supply Chain Management: An Overview, in Supply Chain Management and Advanced Planning; Springer: Berlin, Germany, 2015; pp. 3–28. [Google Scholar]
  18. Nalebuff, B.; Brandenburger, A.; Maulana, A. Co-Opetition; HarperCollinsBusiness: London, UK, 1996. [Google Scholar]
  19. Brandenburger, A.M.; Nalebuff, B.J. Co-Opetition; Crown Business: Haarlem, the Netherlands, 2011. [Google Scholar]
  20. Padula, G.; Dagnino, G.B. Untangling the rise of coopetition: The intrusion of competition in a cooperative game structure. Int. Stud. Manag. Org. 2007, 37, 32–52. [Google Scholar] [CrossRef]
  21. Grittner, P. Four elements of successful sourcing strategies. Manag. Rev. 1996, 85, 41. [Google Scholar]
  22. Reck, R.F.; Long, B.G. Purchasing: A competitive weapon. J. Purch. Mater. Manag. 1988, 24, 2–8. [Google Scholar]
  23. Asanuma, B. Manufacturer-supplier relationships in Japan and the concept of relation-specific skill. J. Jpn. Int. Econ. 1989, 3, 1–30. [Google Scholar] [CrossRef]
  24. Esposito, E.; Raffa, M. The evolution of Italian subcontracting firms: Empirical evidence. Eur. J. Purch. Supply Manag. 1994, 1, 67–76. [Google Scholar] [CrossRef]
  25. Ross, D.F. Competing through Supply Chain Management: Creating Market-Winning Strategies through Supply Chain Partnerships; Springer Science & Business Media: Berlin, Germany, 2013. [Google Scholar]
  26. Stock, J.R.; Lambert, D.M. Strategic Logistics Management; McGraw-Hill/Irwin: Boston, MA, USA, 2001; Volume 4. [Google Scholar]
  27. Walley, K. Coopetition: An introduction to the subject and an agenda for research. Int. Stud. Manag. Org. 2007, 37, 11–31. [Google Scholar] [CrossRef]
  28. Nenni, M.E.; Giustiniano, L. Increasing integration across the supply chain through an approach to match performance and risk. Am. J. Appl. Sci. 2013, 10, 1009–1017. [Google Scholar] [CrossRef]
  29. Landeros, R.; Monczka, R.M. Cooperative Buyer/Seller Relationships and A Firm's Competi. J. Purch. Mater. Manag. 1989, 25, 9–18. [Google Scholar]
  30. Jangga, R.; Ali, N.M.; Ismail, M.; Sahari, N. Effect of Environmental Uncertainty and Supply Chain Flexibility towards Supply Chain Innovation: An exploratory Study. Procedia Econ. Finance 2015, 31, 262–268. [Google Scholar] [CrossRef]
  31. Watts, C.A.; Hahn, C.K. Supplier development programs: An empirical analysis. Int. J. Purch. Mater. Manag. 1993, 29, 10–17. [Google Scholar] [CrossRef]
  32. Sako, M. Prices, Quality and Trust: Inter-Firm Relations in Britain & Japan; Cambridge University Press: Cambridge, UK, 1992. [Google Scholar]
  33. Krause, D.R.; Ellram, L.M. Success Factors in Supplier Development. Int. J. Phys. Distrib. Log. Manag. 1997, 27, 39–52. [Google Scholar] [CrossRef]
  34. Stevenson, M.; Spring, M. Flexibility from a supply chain perspective: Definition and review. Int. J. Oper. Prod. Manag. 2007, 27, 685–713. [Google Scholar] [CrossRef]
  35. Sarkis, J.; Talluri, S. A model for strategic supplier selection. J. Supply Chain Manag. 2002, 38, 18–28. [Google Scholar] [CrossRef]
  36. De Boer, L.; van der Wegen, L.L.M. Practice and promise of formal supplier selection: A study of four empirical cases. J. Purch. Supply Manag. 2003, 9, 109–118. [Google Scholar] [CrossRef]
  37. Ha, S.H.; Krishnan, R. A hybrid approach to supplier selection for the maintenance of a competitive supply chain. Expert Syst. Appl. 2008, 34, 1303–1311. [Google Scholar] [CrossRef]
  38. Seuring, S. A review of modeling approaches for sustainable supply chain management. Decis. Support Syst. 2013, 54, 1513–1520. [Google Scholar] [CrossRef]
  39. Bruno, G.; Esposito, E.; Genovese, A.; Passaro, R. AHP-based approaches for supplier evaluation: Problems and perspectives. J. Purch. Supply Manag. 2012, 18, 159–172. [Google Scholar] [CrossRef]
  40. Mani, V.; Agrawal, R.; Sharma, V. Supplier selection using social sustainability: AHP based approach in India. Int. Strat. Manag. Rev. 2014, 2, 98–112. [Google Scholar] [CrossRef]
  41. Labib, A.W. A supplier selection model: A comparison of fuzzy logic and the analytic hierarchy process. Int. J. Prod. Res. 2011, 49, 6287–6299. [Google Scholar] [CrossRef]
  42. Rezaei, J.; Fahim, P.B.M.; Tavasszy, L. Supplier selection in the airline retail industry using a funnel methodology: Conjunctive screening method and fuzzy AHP. Exp. Syst. Appl. 2014, 41, 8165–8179. [Google Scholar] [CrossRef]
  43. Bozdağ, C.E.; Kahraman, C.; Ruan, D. Fuzzy group decision making for selection among computer integrated manufacturing systems. Comput. Ind. 2003, 51, 13–29. [Google Scholar] [CrossRef]
  44. Bruno, G.; Esposito, E.; Genovese, A.; Simpson, M. Applying supplier selection methodologies in a multi-stakeholder environment: A case study and a critical assessment. Exp. Syst. Appl. 2016, 43, 271–285. [Google Scholar] [CrossRef]
  45. Gölcük, İ.; Baykasoğlu, A. An analysis of DEMATEL approaches for criteria interaction handling within ANP. Exp. Syst. Appl. 2016, 46, 346–366. [Google Scholar] [CrossRef]
  46. Büyüközkan, G.; Çifçi, G. A novel hybrid MCDM approach based on fuzzy DEMATEL, fuzzy ANP and fuzzy TOPSIS to evaluate green suppliers. Exp. Syst. Appl. 2012, 39, 3000–3011. [Google Scholar] [CrossRef]
  47. Dargi, A.; Anjomshoae, A.; Galankashi, M.R.; Memari, A.; Tap, M.B.M. Supplier Selection: A Fuzzy-ANP Approach. Procedia Comput. Sci. 2014, 31, 691–700. [Google Scholar] [CrossRef]
  48. Yang, C.-C.; Chen, B.-S. Key quality performance evaluation using fuzzy AHP. J. Chin. Instit. Ind. Eng. 2004, 21, 543–550. [Google Scholar] [CrossRef]
  49. Choi, T.Y.; Hartley, J.L. An exploration of supplier selection practices across the supply chain. J. Oper. Manag. 1996, 14, 333–343. [Google Scholar] [CrossRef]
  50. Weber, C.A.; Current, J.R.; Benton, W.C. Vendor selection criteria and methods. Eur. J. Operational Res. 1991, 50, 2–18. [Google Scholar] [CrossRef]
  51. Wisner, J.; Tan, K.-C.; Leong, G. Principles of supply chain management: A balanced approach; Cengage Learning: Boston, MA, USA, 2015. [Google Scholar]
  52. Tognetti, A.; Grosse-Ruyken, P.T.; Wagner, S.M. Green supply chain network optimization and the trade-off between environmental and economic objectives. Int. J. Prod. Econ. 2015, 170, 385–392. [Google Scholar] [CrossRef]
  53. Noci, G. Designing “green” vendor rating systems for the assessment of a supplier's environmental performance. Eur. J. Purch. Supply Manag. 1997, 3, 103–114. [Google Scholar] [CrossRef]
  54. Teixeira, A.A.; Jabbour, C.J.C.; de Sousa Jabbour, A.B.L.; Latan, H.; de Oliveira, J.H.C. Green training and green supply chain management: Evidence from Brazilian firms. J. Clean. Prod. 2016, 116, 170–176. [Google Scholar] [CrossRef]
  55. Carter, C.R.; Easton, P.L. Sustainable supply chain management: Evolution and future directions. Int. J. Phys. Distrib. Log. Manag. 2011, 41, 46–62. [Google Scholar]
  56. Diabat, A.; Govindan, K. An analysis of the drivers affecting the implementation of green supply chain management. Resour. Conserv. Recycl. 2011, 55, 659–667. [Google Scholar] [CrossRef]
  57. Humphreys, P.K.; Li, W.L.; Chan, L.Y. The impact of supplier development on buyer–supplier performance. Omega 2004, 32, 131–143. [Google Scholar] [CrossRef]
  58. Jia, P.; Govindan, K.; Choi, T.-M.; Rajendran, S. Supplier selection problems in fashion business operations with sustainability considerations. Sustainability 2015, 7, 1603–1619. [Google Scholar] [CrossRef]
  59. Azzone, G.; Bertelè, U. Exploiting green strategies for competitive advantage. Long Range Plan. 1994, 27, 69–81. [Google Scholar] [CrossRef]
  60. Mokhlesian, S. How Do Contractors Select Suppliers for Greener Construction Projects? The Case of Three Swedish Companies. Sustainability 2014, 6, 4133–4151. [Google Scholar] [CrossRef]
  61. Zhao, H.; Guo, S. Selecting Green Supplier of Thermal Power Equipment by Using a Hybrid MCDM Method for Sustainability. Sustainability 2014, 6, 217–235. [Google Scholar] [CrossRef]
  62. Rao, P. Greening the supply chain: A new initiative in South East Asia. Int. J. Oper. Prod. Manag. 2002, 22, 632–655. [Google Scholar] [CrossRef]
  63. Kuo, T.; Hsu, C.-W.; Li, J.-Y. Developing a Green Supplier Selection Model by Using the DANP with VIKOR. Sustainability 2015, 7, 1661–1689. [Google Scholar] [CrossRef]
  64. Zhu, Q.; Cote, R.P. Integrating green supply chain management into an embryonic eco-industrial development: A case study of the Guitang Group. J. Clean. Prod. 2004, 12, 1025–1035. [Google Scholar] [CrossRef]
  65. Sarkis, J. A strategic decision framework for green supply chain management. J. Clean. Prod. 2003, 11, 397–409. [Google Scholar] [CrossRef]
  66. Zhu, Q.; Sarkis, J. An inter-sectoral comparison of green supply chain management in China: Drivers and practices. J. Clean. Prod. 2006, 14, 472–486. [Google Scholar] [CrossRef]
  67. Govindan, K.; Muduli, K.; Devika, K.; Barve, A. Investigation of the influential strength of factors on adoption of green supply chain management practices: An Indian mining scenario. Resour. Conserv. Recycl. 2016, 107, 185–194. [Google Scholar] [CrossRef]
  68. Zhu, Q.; Sarkis, J.; Lai, K.-H. Green supply chain management: Pressures, practices and performance within the Chinese automobile industry. J. Clean. Prod. 2007, 15, 1041–1052. [Google Scholar] [CrossRef]
  69. Hall, J. Environmental supply chain dynamics. J. Clean. Prod. 2000, 8, 455–471. [Google Scholar] [CrossRef]
  70. Sarkis, J.; Zhu, Q.; Lai, K.-H. An organizational theoretic review of green supply chain management literature. Int. J. Prod. Econ. 2011, 130, 1–15. [Google Scholar] [CrossRef]
  71. Saaty, T.L. Fundamentals of the analytic network process—Dependence and feedback in decision-making with a single network. J. Syst. Sci. Syst. Eng. 2004, 13, 129–157. [Google Scholar] [CrossRef]
  72. Satty, T.L. Decision Making with Dependence and Feedback: The Analytic Network Process; RWS Publication: Pittsburgh, PA, USA, 1996. [Google Scholar]
  73. Saaty, T.L. The Analytic Network Proces; Springer: Berlin, Germany, 2006. [Google Scholar]
  74. Saaty, T.; Kearns, K. Analytic Planning-The Organization of Systems, International Series in Modern Applied Mathematics and Computer Science 7; Pergamon Press: Oxford, UK, 1985. [Google Scholar]
  75. Abdi, M.R.; Labib, A.W. Performance evaluation of reconfigurable manufacturing systems via holonic architecture and the analytic network process. Int. J. Prod. Res. 2011, 49, 1319–1335. [Google Scholar] [CrossRef]
  76. Karpak, B.; Topcu, I. Small medium manufacturing enterprises in Turkey: An analytic network process framework for prioritizing factors affecting success. Int. J. Prod. Econ. 2010, 125, 60–70. [Google Scholar] [CrossRef]
  77. Martilla, J.A.; James, J.C. Importance-performance analysis. J. Market. 1977, 41, 77–79. [Google Scholar] [CrossRef]
  78. Matzler, K.; Bailom, F.; Hinterhuber, H.H.; Renzl, B.; Pichler, J. The asymmetric relationship between attribute-level performance and overall customer satisfaction: A reconsideration of the importance–performance analysis. Ind. Market. Managem. 2004, 33, 271–277. [Google Scholar] [CrossRef]
  79. Chapman, R.G. Brand performance comparatives. J. Prod. Brand Manag. 1993, 2, 42–50. [Google Scholar] [CrossRef]
  80. Chéron, E.J.; McTavish, R.; Perrien, J. Segmentation of bank commercial markets. Int. J. Bank Market. 1989, 7, 25–30. [Google Scholar] [CrossRef]
  81. Sampson, S.E.; Showalter, M.J. The performance-importance response function: Observations and implications. Serv. Ind. J. 1999, 19, 1–25. [Google Scholar] [CrossRef]
  82. O'Sullivan, E.L. Marketing for Parks, Recreation, and Leisure; Venture State College: State College, PA, USA, 1991. [Google Scholar]
  83. Dyer, J.H.; Hatch, N.W. Relation-specific capabilities and barriers to knowledge transfers: Creating advantage through network relationships. Strat. Manag. J. 2006, 27, 701–719. [Google Scholar] [CrossRef]
  84. Gulati, R.; Nohria, N.; Zaheer, A. Guest editors’s introduction to the special issue: Strategic networks. Strat. Manag. J. 2000, 21, 199–201. [Google Scholar] [CrossRef]
  85. Lee, V.H.; Ooi, K.B.; Chong, A.Y.-L.; Seow, C. Creating technological innovation via green supply chain management: An empirical analysis. Exp. Syst. Appl. 2014, 41, 6983–6994. [Google Scholar] [CrossRef]
  86. Dwyer, L.; Cvelbar, L.K.; Edwards, D.; Mihalic, T. Fashioning a destination tourism future: The case of Slovenia. Tour. Manag. 2012, 33, 305–316. [Google Scholar] [CrossRef]
Figure 1. Research process.
Sustainability 08 00259 g001
Figure 2. ANP and IPA green supply chain management mechanism.
Sustainability 08 00259 g002
Figure 3. Supplier priorities.
Sustainability 08 00259 g003
Figure 4. Supplier E‘s IPA distribution diagram.
Sustainability 08 00259 g004
Table 1. Green supplier selection categories and index scoring by experts.
CategoryEvaluation indexScoringRemarks
Operation management (Integrated into operation category)1. Finance8.62Reserved
2. Green image7.31Reserved and classified into green category
3. Quality certification7.12Reserved
4. R&D cost6.95Classified into cost category
5. Operation cost7.68Reserved
Production management (Integrated into ability category)1. Quality abnormity treatment6.91Classified into quality index
2. Capacity7.22Reserved
3. Technical capacity7.35Reserved
4. Education and training6.25Classified into technical capacity index
5. Green R&D ability6.84Classified into technical capacity index
Customer management (this category is deleted; each index under this category will be moved to each category)1. Customer service7.93Reserved and classified into operation category
2. Delivery time8.32Reserved and classified into ability category
3. Response capability7.67Reserved and classified into ability category
Green management (Integrated into green category)1.Environmental specification7.74Reserved
2. Environmental assessment6.94Classified into environmental benefit index
3. Environmental benefit7.43Reserved
4. Hazardous substance specification6.45Classified into environmental specification index
5. Recycle6.82Classified into environmental benefit index
Table 2. Green supplier selection index importance weight analysis table.
CategoryEvaluation IndexWeight under CategoryCategory RankingOverall WeightOverall Ranking
Operation (0.348)1.1 Finance0.29810.1043
1.2 Customer service0.27920.0975
1.3 Quality0.22130.0777
1.4 Cost0.20240.07010
Ability (0.317)2.1 Delivery Time0.22330.0719
2.2 Response Capability0.21240.06711
2.3 Capacity0.24420.0777
2.4 Technical Capacity0.32210.1024
Green (0.335)3.1 Environmental Specification0.35320.1182
3.2 Green Image0.26130.0876
3.3 Environmental Benefit0.38610.1301
Table 3. Summary sheet of suppliers’ performance index level.
Performance IndexPerformance Index Level
Supplier ASupplier BSupplier CSupplier DSupplier E
1.1 Finance0.0510.0500.0330.0370.059
1.2 Customer service0.0420.0450.0510.0220.023
1.3 Quality0.0370.0320.0420.0490.029
1.4 Cost0.0330.0370.0380.0560.052
2.1 Delivery Time0.1030.1170.0640.0630.119
2.2 Response Capability0.0870.0850.1020.1010.042
2.3 Capacity0.0790.0650.0880.1290.119
2.4 Technical Capacity0.0680.0720.0840.0450.057
3.1 Environmental Specification0.1960.2320.1350.2490.086
3.2 Green Image0.1630.1450.1970.0830.293
3.3 Environmental Benefit0.1400.1220.1670.1660.120
Table 4. Summary sheet of supplier E’s performance index level and performance index importance.
Performance IndexPerformance Index LevelPerformance Index Importance
1.1 Finance0.0590.104
1.2 Customer service0.0230.097
1.3 Quality0.0290.077
1.4 Cost0.0520.070
2.1 Delivery Time0.1190.071
2.2 Response Capability0.0420.067
2.3 Capacity0.1190.077
2.4 Technical Capacity0.0570.102
3.1 Environmental Specification0.0860.118
3.2 Green Image0.2930.087
3.3 Environmental Benefit0.1200.130
Threshold Value0.0910.091

