Article

Green Component Procurement Collaboration for Improving Supply Chain Management in the High Technology Industries: A Case Study from the Systems Perspective

1
Institute of International Business Administration, Chinese Culture University, Taipei 106, Taiwan
2
Science and Technology Policy Research and Information Center, National Applied Research Laboratories, Taipei 106, Taiwan
*
Author to whom correspondence should be addressed.
Sustainability 2016, 8(2), 105; https://doi.org/10.3390/su8020105
Submission received: 22 September 2015 / Revised: 19 January 2016 / Accepted: 19 January 2016 / Published: 22 January 2016
(This article belongs to the Section Economic and Business Aspects of Sustainability)

Abstract

:
The impacts of high technology industries have been growing increasingly to technological innovations and global economic developments, while the concerns in sustainability are calling for facilitating green materials and cleaner production in the industrial value chains. Today’s manufacturing companies are not striving for individual capacities but for the effective working with green supply chains. However, in addition to environmental and social objectives, cost and economic feasibility has become one of the most critical success factors for improving supply chain management with green component procurement collaboration, especially for the electronics OEM (original equipment manufacturing) companies whose procurement costs often make up a very high proportion of final product prices. This paper presents a case study from the systems perspective by using System Dynamics simulation analysis and statistical validations with empirical data. Empirical data were collected from Taiwanese manufacturing chains—among the world’s largest manufacturing clusters of high technology components and products—and their global green suppliers to examine the benefits of green component procurement collaborations in terms of shared costs and improved shipping time performance. Two different supply chain collaboration models, from multi-layer ceramic capacitor (MLCC) and universal serial bus 3.0 (USB 3.0) cable procurements, were benchmarked and statistically validated. The results suggest that the practices of collaborative planning for procurement quantity and accurate fulfillment by suppliers are significantly related to cost effectiveness and shipping time efficiency. Although the price negotiation of upstream raw materials for the collaborative suppliers has no statistically significant benefit to the shipping time efficiency, the shared cost reduction of component procurement is significantly positive for supply chain collaboration among green manufacturers. Managerial implications toward sustainable supply chain management were also discussed.

1. Introduction

The high technology industry has been one of the fastest growing industries in the world that increasingly lead to technological innovations and global economic developments, while there are concerns in sustainability of the industrial energy consumption and CO2 emissions [1]. The efficient use of resources and green materials to facilitate cleaner production thus becomes an urgent issue in the high technology industrial value chains. To satisfy higher industry and sustainability standards in the globally competitive environment, today’s manufacturing companies are not striving for individual capacities but for the efficiency of the entire green supply chain management (GSCM). Srivastava [2] proposed that GSCM involves “integrating environmental thinking into supply-chain management, including product design, material sourcing and selection, manufacturing processes, delivery of the final product to the consumers as well as end-of-life management of the product after its useful life”. Previous studies consistently proposed the significant role of GSCM in sustainable development for industrial supply chain management practices [3,4,5,6,7,8,9,10,11,12,13,14,15,16,17,18,19,20].
Bonilla, et al. [21] found the highest carbon footprints in supply chains for electronics and textile products and so there is an urgent need to apply GSCM. Jabbour, et al. [22] also argued that the high-tech sector is extensively studied in the context of GSCM, especially so in developing countries. Beside its high profit and growth potential [23], its natural characteristics with short life-cycle products and volatile demand [24], the most significant drivers which make high-tech industry more attractive are the new greening directives passed by the European Union (Waste Electrical and Electronic Equipment—WEEE, Restriction of Hazardous Substances—RoHS and Eco-design for Energy using Products—EuP) and similar regulation that has been spread throughout the world [25]. Furthermore, well-known high-tech companies such as IBM, Apple, and Hewlett-Packard have transformed their regulatory compliance approach into a green-integrated approach [26].
Even though GSCM has been recognized in many studies and business practices, the concept of sustainable supply chain management (SSCM) has been proposed to encompass rather more. Seuring and Muller [5] proposed that SSCM be viewed as “the management of material, information and capital flows as well as cooperation among companies along the supply chain while taking goals from all three dimensions of sustainable development, i.e., economic, environmental and social, into account which are derived from customer and stakeholder requirements”. Based on a comparative literature analysis, Ahi and Searcy [27] found that though some definitions of SSCM show remarkable overlap with definitions of GSCM, SSCM is essentially an extension of GSCM that comprises economic, environmental and social concerns. Under a competitive business environment, however, objectives in sustainability are often less focused in the real world practices, when unexpected disruptions in supply chain system occurred [28]. In addition, previous studies emphasized that the co-values and measurements of SSCM must be demonstrated and communicated to company stakeholders and therefore the quantitative measurements have been proposed with diverse models [29,30,31,32]. In the developing economies, both private and public sectors tend to overlook social fairness and justice at the crossroads of economic development and environmental damage. It is important to incorporate the notion of sustainable development right at the beginning of policy making and supply chain management so as to satisfy the triple objectives of sustainability [33,34]. It is, therefore, worthwhile to undertake integrated studies that include economic evaluations of collaborative business practices with green suppliers that demonstrate multiple goals based on economic, social, and environmental considerations.

2. Research Objectives

Although the challenges to sustainability are serious, economic feasibility is one of the critical success factors for improving supply chain management with green component procurement collaboration, especially for the electronics OEM (original equipment manufacturing) companies whose procurement costs often amount to 80%–90% of final product prices or even higher. From the perspective of SSCM, achieving sustainability is not about sacrificing business performance to realize environmental solutions and social justice. Indeed, this study presents a case study from the systems perspective and aims to demonstrate that improving the cost and economic feasibility with green component procurement collaboration could facilitate the developments toward SSCM that comprises environmentally friendly solutions from green component suppliers. By applying green procurement practice and pursuing voluntary eco-friendly product certification for Green Consumption policy, a group of firms fulfill their corporate social responsibility.

3. Research Design

This research is designed to empirically investigate the measurable benefits and feasibility of collaboration in the procurement of green components in the high technology industries. From operations to corporate strategy, two different supply chain collaboration models were benchmarked and statistically validated: the models were for multi-layer ceramic capacitor (MLCC) and universal serial bus 3.0 (USB 3.0) cable procurements. The first case of green procurement collaboration, deals with MLCC which is an important passive component and one of the most widely used components. MLCC is a low-price passive component suitable for a surface mounting process and typically used for lightweight, thin and small sized products. Due to MLCC’s strong market demand and wide applications, global enterprises are greatly concerned about its procurement cost and shipping time. The other case concerns the USB 3.0 cable, a key component for USB signal transmission and charging, allowing duplexing and improving transmission speed and power. USB 3.0 cable makes up a high proportion in the USB product BOM (Bill of Material), and is therefore an obvious target for effectiveness improvement through collaborative supply chain management, as can be seen from the results of the investigation described in this study.
Empirical data were collected from Taiwanese manufacturing chains—among the world’s largest manufacturing clusters of high technology components and products—and their global green suppliers. The notebooks, PCs, motherboards and liquid crystal display (LCD) monitors manufactured in Taiwan are ranked first worldwide and Taiwanese manufacturers have become famous original equipment manufacturers (OEM) or original design manufacturer (ODM) suppliers in the value-added chain of the worldwide high-tech industry [35]. In several categories, the Taiwan-based Foxconn Technology Group is the worldwide number one manufacturer for several electronic products in the high-tech industry. Recently, another Taiwan-based manufacturer, Quanta Computer, has directly supplied cloud server equipment to Google, Amazon and Facebook. Recently, leading high-tech firms in Taiwan including Acer, Foxconn, Wistron, Compal, Quanta and Asustek have adopted the EICC Code of Conduct to manage their social and environmental performance in the global supply chain [36]. Lo [37] argued that the high-tech industry in Taiwan is now under considerable external pressures to be green since its primary export targets are the US and European markets. An empirical study of Taiwan’s high-tech industry conducted by Chen, et al. [38] proves that the performance of green product innovation is positively correlated to corporate competitive advantage in commercial and environmental success. However, the performance of supply chain collaborations still require empirically based scientific investigation. Wu et al. [39] proposed that the importance of knowledge management for improving business performance and thus this paper aims to explore the industrial practices as the reference knowledge for SSCM with the case study and systems analysis.

3.1. Towards the Environmental Standards and Social Values

Dangelico and Pontrandolfo [40] concluded that the benefit of green collaboration includes improving market performance (by accessing new markets and strengthening competitive advantage), enhancing corporate image performance (in its reputation and regulatory compliance), improving manufacturing performance (by increasing its efficiency of materials and energy usage), boosting financial performance (by increasing margins or market share due to customers’ willingness to pay a premium price for products) and containing supply chain cost. While the triple objectives—social, environmental, and economic considerations—are integrated, the benchmarking procedure in this study identified environmental standards and social values as the prior objectives for the green component procurement collaboration. Therefore, this paper will explain how the green components meet the environmental and social considerations in this section, while the economic feasibility and the empirical validations will be described in the subsequent sections.
Two groups of green components with different properties were benchmarked, while the materials and components are provided in accordance with environmental standards from EU RoHS (Restriction of Hazardous Substances Directive), REACH (Registration, Evaluation, Authorization and Restriction of Chemical Hazard), and Sony Green Partner Standards. A positive example is extending a guarantee for a 10-year environment friendly use period of the green components, with other environmental standards such as Cd < 2 ppm, Hg < 2 ppm, Cr+6 < 2 ppm, PBDE < 5 ppm, PBB < 5 ppm. Therefore, the green component procurement could help to assure performance in accordance with environmental objectives. In addition, the social commitment could also be enhanced by green component procurement practice as corporate social responsibility (CSR) and the pursuit of voluntary eco-friendly product certification for Green Consumption policy, such as EPEAT verification in more than 42 countries, Taiwan Green Mark and China Environmental Labeling in the greater China area. For example, as one of the indicators for social commitment, the Green Mark certification in Taiwan has been increasingly awarded to eco-friendly products and the number of these rewards increased from 5 to 9900 green marks in 1993 to 2013 respectively [41]. Most of the representative high-technology firms also include the practices of green component procurement and green supply chain management as the essential part of their CSR report to the society. Therefore, both environmental standards and social values are being considered in the green component procurement collaboration.

3.2. Performance Indices of Economic Feasibility with Green Suppliers

From an economic perspective, previous studies suggest that supply chain collaboration has potential influences on two major management effectiveness aspects: cost effectiveness and shipping time efficiency [42,43,44,45]. By benchmarking practices of the green component procurement of international EMS (Electronic Manufacturing Services) companies, the cost and time effectiveness of electronic component procurement collaboration were investigated and compared to those without supply chain collaboration. The actual shipment records of components were collected and analyzed statistically. This study focused on examining the relationships between the management strength of procurement collaboration (including the quantity collaboration and raw material price negotiation collaboration) and the management effectiveness of procurement collaboration (including cost effectiveness and shipping time efficiency). The performance indices of the green procurement collaboration comprise the concepts of environmental, risk, and waste cost. First, green materials are environmental solutions so that green component procurement collaboration could help to achieve environmental objectives. Second, risk and waste cost are reduced due to procurement collaboration so that collaborating members share the benefits. Third, eventually the shipping time efficiency reflects shared risk and reduced fluctuations in the production process and less demanding inventory management. Finally, the average purchasing cost reflects the reduced waste cost from green suppliers.

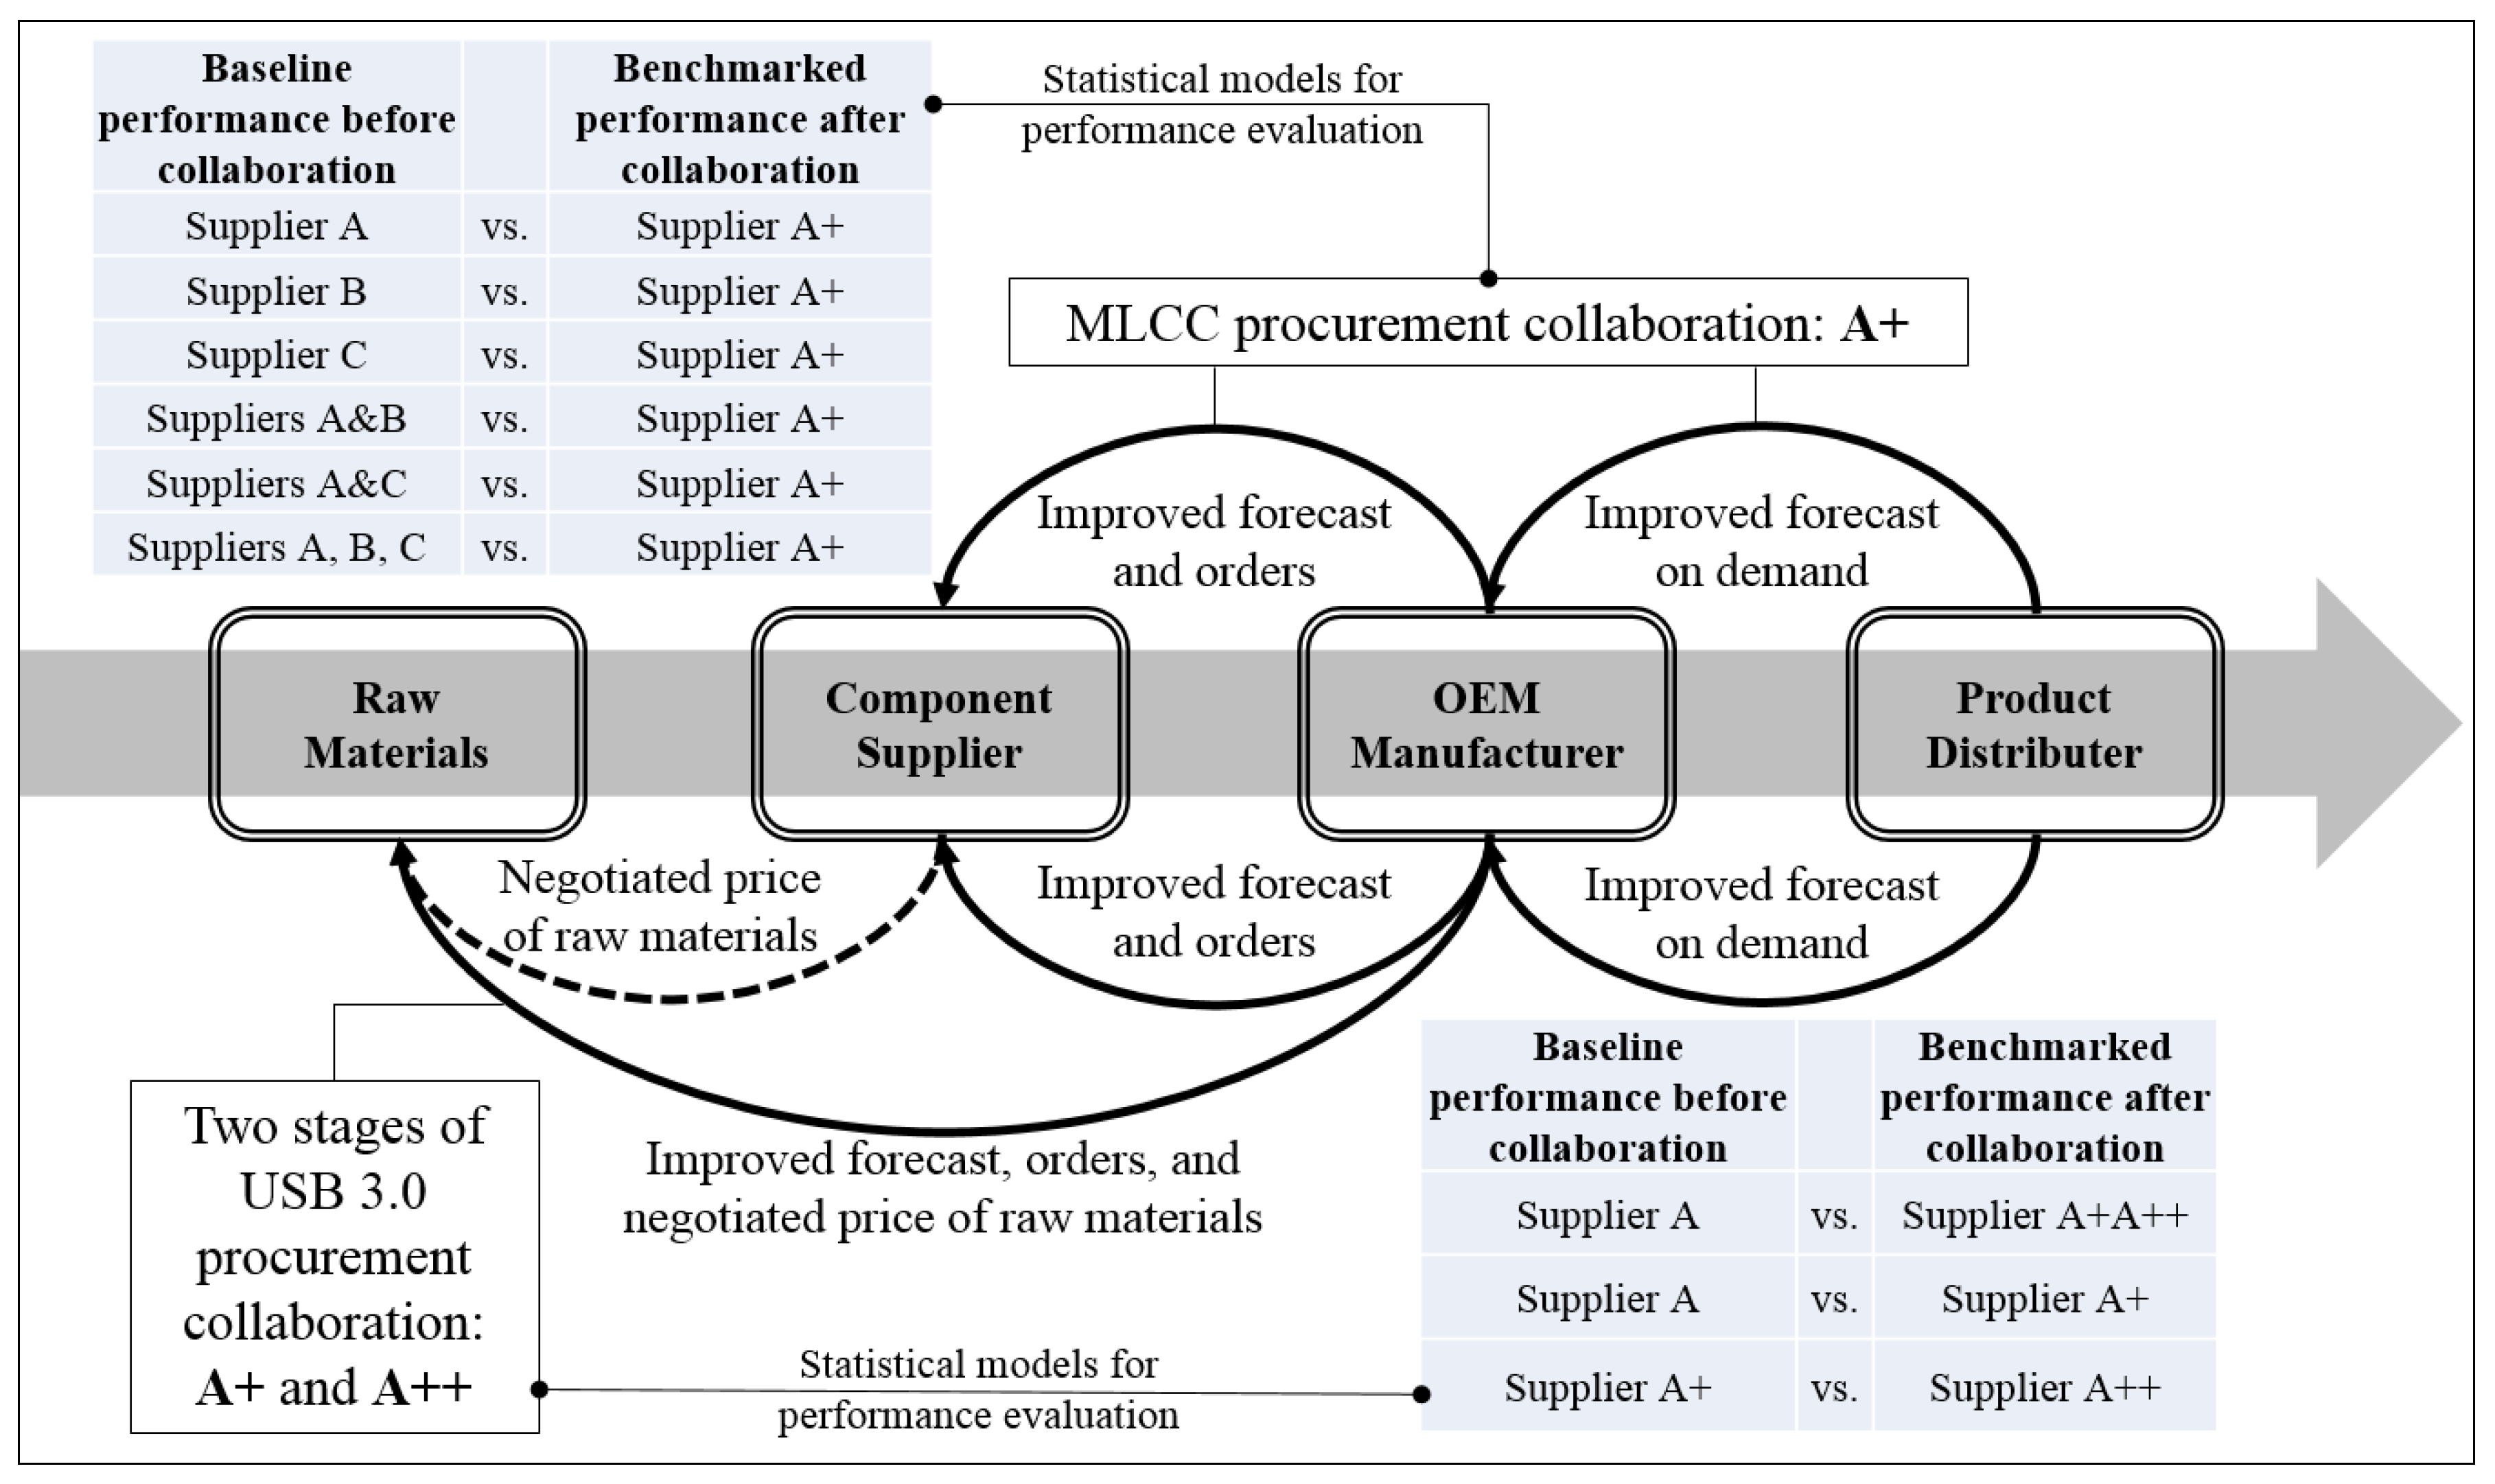
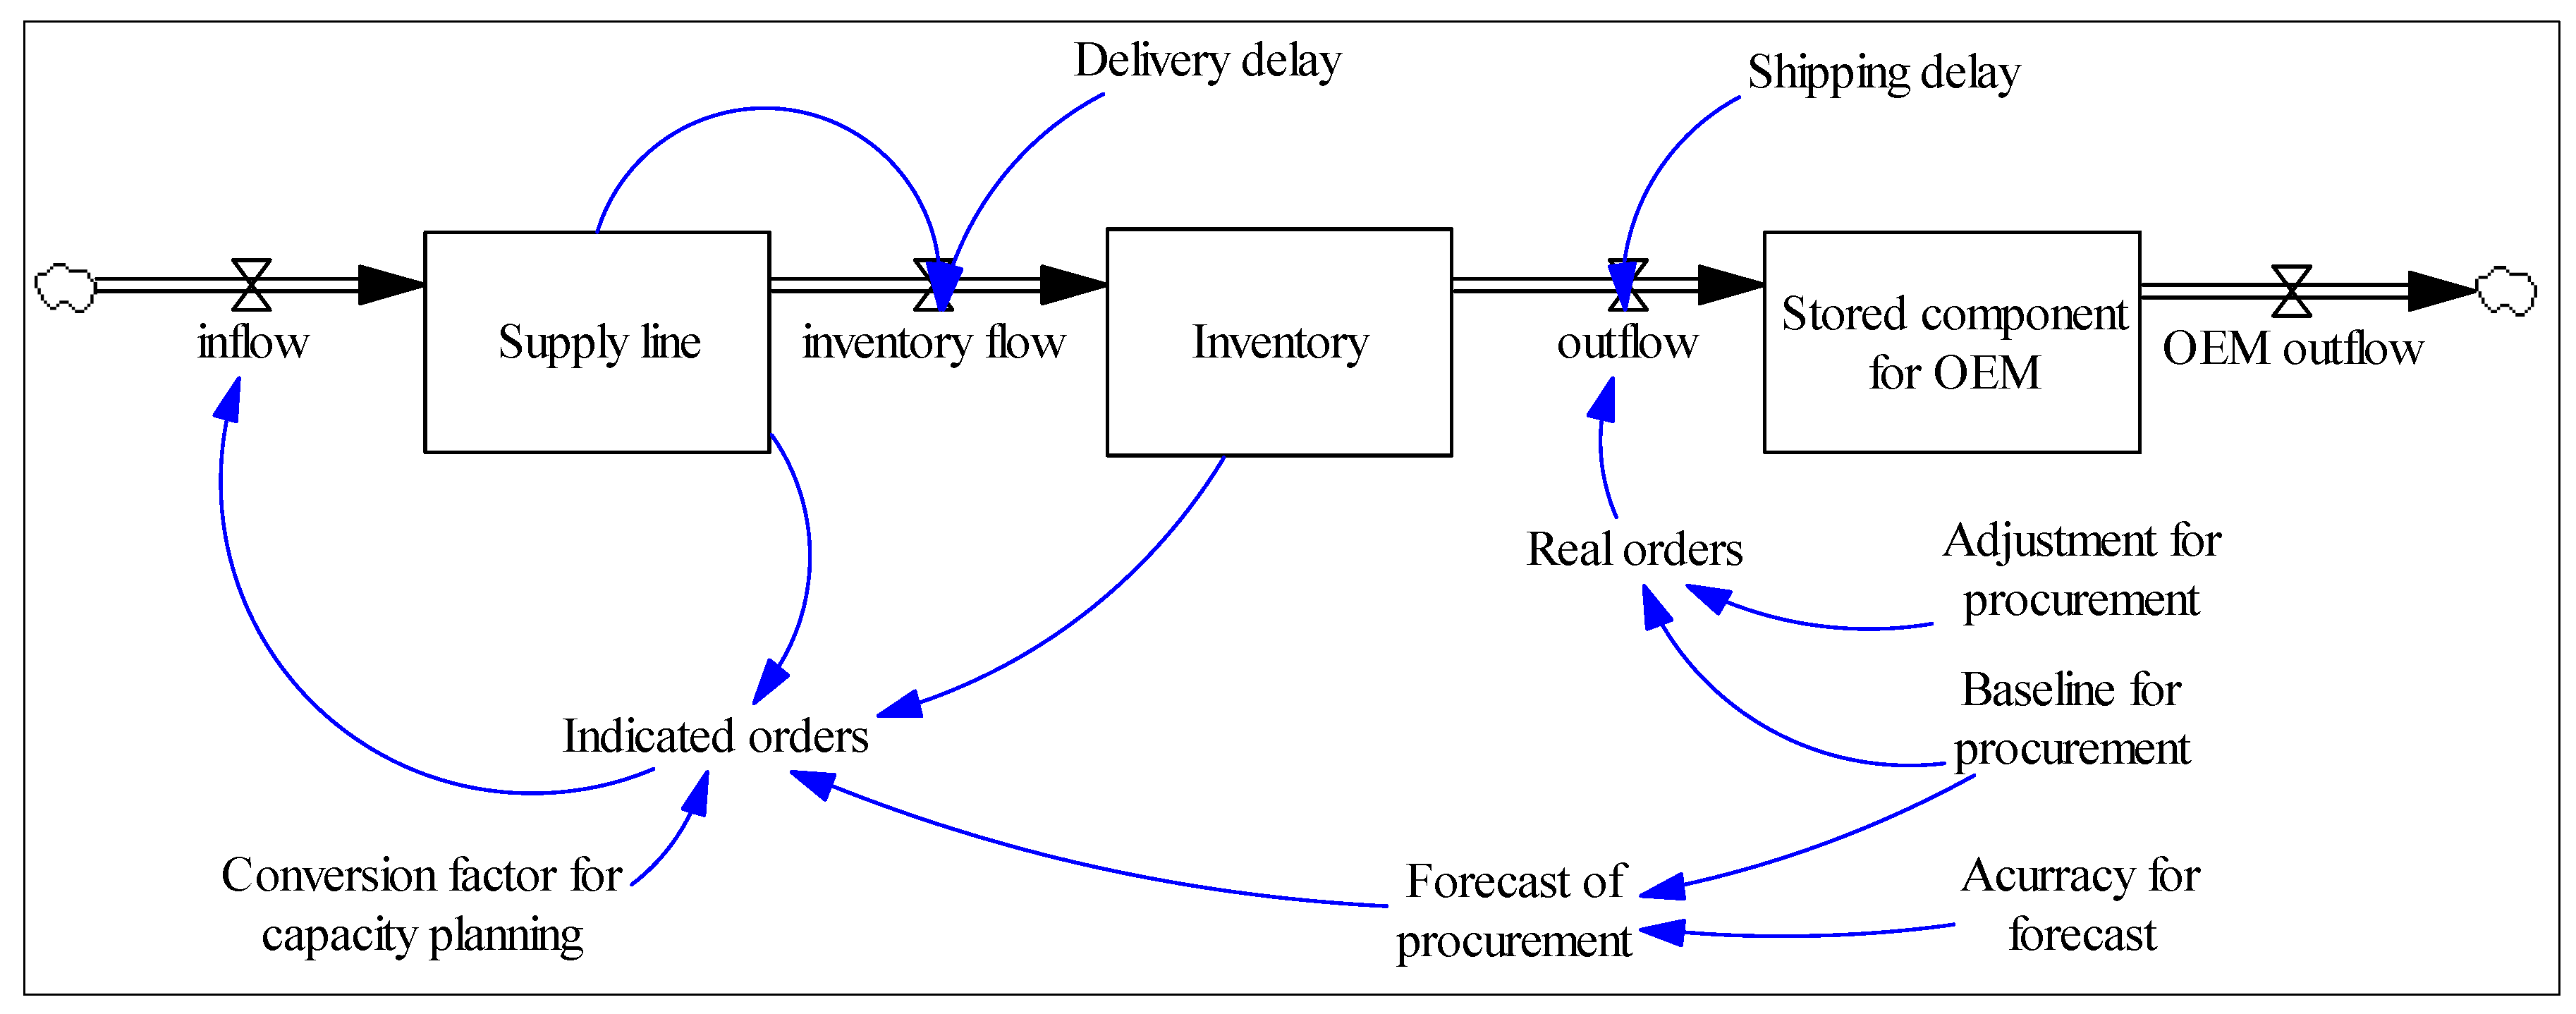
4. Framework for Evaluating the Benchmarked Cases and Systems Analysis

A framework for the evaluation of horizontal and vertical component procurement collaborations was developed to examine the shared risk for cost effectiveness and reduced variations in supply line for shipping time efficiency by different green component procurements. The collaborations for MLCC procurement are in fact relatively horizontal collaborations with different suppliers, while the company collaborated specifically with one supplier but there were three suppliers in this benchmarked case competing for supplying the quantity ordered. The collaboration focused on the impacts of improved procurement forecast and orders. In contrast, the collaborations for USB 3.0 procurement in this benchmarked case were vertical collaborations, while the company focused on the cooperation with one specific supplier and developed different stages of procurement collaborations (improved forecast, orders, and negotiated price of raw materials). Figure 1 shows the framework of supply chain collaborations of the benchmarked cases and statistical models used for performance evaluation. Since the green component procurement collaboration is an improvement of the supply chain system, this paper conducted a System Dynamics (SD) modeling and a simulation analysis to demonstrate the rationale of green component procurement collaboration and how the collaborative system could reduce the risk in the supply line and eventually improve the supply chain performance. The SD modeling is to support the analysis of the research subject from a holistic viewpoint and functions as a virtual laboratory for policy experiments [46]. Statistical validations with empirical data will be presented in the follow up section that investigates the real results of a supply chain system with green component procurement collaboration.
Figure 1. Framework for evaluation of the benchmarked supply chain collaborations.
Sustainability 08 00105 g001
Supply chains consist of cascades of firms, each receiving orders and adjusting production and production capacity to meet changes in demand. Each link in a supply chain maintains and controls inventories of materials and finished product. Previous studies have identified the instability and oscillation in manufacturing supply chains as a systems problem [47]. Accordingly, it is necessary to understand the causal structure of the supply chain system for the green component supplier’s capacity planning and procurement collaboration. By using the SD modeling technique, the causal structure shown in Figure 2 helps to demonstrate how an individual green supplier could manage its inventories and resources as it attempts to balance production with orders from the collaborative OEM Company. With the green component procurement collaboration, OEM procurement managers are able to place dependable orders with their green suppliers to replace their own outward shipments of stock to customers and control inventories at shared risk and waste cost.
Figure 2. Causal structure of the supply chain system for green component supplier’s capacity planning and procurement collaboration.
Sustainability 08 00105 g002
Based on the generic supply chain model and simulation functions proposed by MIT SD Group [47], the concepts of supply line, inventory, and collaborative procurement strategies have been considered for the development of a simulation model as shown in Figure 2. The “Inventory” represents the stock of green components to be managed. The “Supply line” represents the stock of orders for green components but not yet received, including orders in transit to the supplier, the supplier’s backlog, and those goods subject to shipping delays. There are delivery delays and shipping delays between three stages of green component supply chains, supply line, inventory, and OEM components. For the supplier’s decisions, the “Indicated orders” represents the considerations for production based on the forecast forwarded to procurement and the components in production, including the supply line and inventory. An adjustment to capacity planning is also considered as being indicated orders (since we assume that suppliers tend to adopt an excessive capacity planning strategy to assure their supply). For the procurement decisions, the benefits of component procurement collaboration could be reflected in the accuracy of forecast of procurement quantities and the actual amount of procurements.
By using a computer simulation technique, the SD model demonstrates the instability in and fluctuations of components in the supply line and the inventory in a supply chain system. Except for the external factors affecting the supply chain system, the fluctuations are affected by two major internal factors:
(1)
the dependent demand from the OEM company’s procurement strategy, including the forecast of procurement and the real procurement by the OEM company;
(2)
the supplier’s capacity planning for meeting the procurement forecast and the delivery time in production and component shipment.
Figure 3 demonstrates the shared risk of supply chain system under different collaborations, increased quantity of procurement and improved accuracy of forecast. X-axis represents weekly performance for one year. Y-axis represents the number of components in supply chain. The simulation analysis suggests that the supplier’s operations cost will be higher if the number of accumulated components in the supply line and the inventory are higher. In addition, the risk of shipping time efficiency and punishment cost are higher if there are any shortages during the inventory management stage. Therefore, since the green component procurement collaboration could increase the total amount procured and reduce the accuracy of forecast orders to the green suppliers, theoretically it will reduce the supplier’s risk and operations cost. As shown in Figure 3, the risk of inefficient production in supply line and inventory management could be reduced with the component procurement collaboration so that the reduced purchasing cost and better shipping time efficiency to the OEM Company become reasonable expectations with collaboration. In addition, once the cost of raw materials could be reduced, the total operations cost could be reduced and the shared cost benefit could be reasonably shared with the OEM company.
Figure 3. Simulation analysis for the shared risk of supply chain system under different collaborations.
Sustainability 08 00105 g003

5. Data Collection and Sampling Method for Empirical Study

The population of this study was the global shipment quantity of the targeted components under controlled conditions, while a purposive sampling method was adopted to select representative samples for in-depth investigation. To ensure the quality and consistency of sample data collected, the selected samples were carefully checked by the following three criteria for statistical analysis:
(1)
The selected samples must have the same specifications or the same enterprise characteristics to allow in-depth comparison on the same basis.
(2)
Comparable samples from the same supplier are required. Collaboration must occur in the procurement processes of samples for the evaluation of effectiveness differences before and after the collaboration was implemented.
(3)
The manufacturing processes of selected samples must remain unchanged before and after the collaboration was implemented.
This study collected the data and information from sample companies from Korea, Japan, Taiwan, etc. After the preliminary checking for incomplete and invalid data, 1054 valid samples were collected, while the first group of component MLCC gave 902 samples and the second group of component USB 3.0 cable gave 152 samples.

5.1. MLCC Component Sample Data

The MLCC component sample data comprise samples from 10 companies with similar properties but slightly different component specifications. Sample data with shipping records dated between July 2010 and March 2012 were collected. As shown in Table 1, there are three MLCC suppliers, represented by A, B, and C. The numbers of shipping data samples from Suppliers A, B, and C were 135, 197, and 228, respectively. After Supplier A introduced the supply chain collaboration in April 2011, the number of shipping orders, 342, previously obtained from the 10 sample companies were solely purchased from Supplier A.
Since improving the stability of procurement quantities is an important commitment for collaboration, in this case, we examine the effects of quantity concentration on cost performance and time efficiency. For the evaluation of shipping time efficiency, all sample data were included. Although the 10 sample companies had different component specifications, the material compositions of MLCC were the same and these 10 specifications were distributed over the procurement from all three suppliers, the shipping time of Suppliers A, B, and C were considered being evaluated on the same basis.
Table 1. MLCC Component Supplier Shipment to Sample Companies.
SupplierShipping Records before CollaborationShipping Records after CollaborationTotal Shipping RecordsTotal Ordered Quantity (Rolls)Accuracy of Forecasted Procurement Quantity
A13534247784,78242%
B197N/A19757,10029%
C228N/A22840,65020%
The total ordered quantity of MLCC from the 10 sample companies was 182,532 rolls, where each roll contains 5000 pieces of MLCC. The order to Supplier A were 84,782 rolls (46% of total order), with 17,192 rolls (9%) ordered before the collaboration, and 67,590 rolls (37%) ordered after the collaboration. The orders to Supplier B and C were 57,100 rolls (31%) and 40,650 rolls (22%), respectively. In terms of the procurement quantity forecasting accuracy, as the forecasted procurement quantity were 200,000 rolls, the accuracy of suppliers A, B, and C were 42%, 29%, and 20%, respectively.

5.2. USB 3.0 Cable Component Sample Data

The USB 3.0 cable component sample data collected in this study comprise real shipping records dated between October 2011 and December 2013, from the same supplier (represented by Supplier A). Supplier A became a qualified supplier and started shipment in October 2011. The relationship between the same supplier and the buyer has gone through different stages from an independent supplier to collaborative supplier. The collaborative management of procurement quantity was introduced to Supplier A as the first stage supply chain collaboration in November 2012, and the collaborative management of raw material negotiation was introduced as the second stage supply chain collaboration in April 2013. As for the sample data from Supplier A, there were 77 shipping records before the introduction of supply chain collaboration, 29 records during the first stage of collaboration, and 46 records during the second stage of collaboration.
The USB 3.0 cable component shipment data collection from October 2011 to December 20 was divided into 3 periods: October 2011 to October 2012 was the non-collaboration period; November 2012 to March 2013 was the first stage of collaboration; April 2013 to December 2013 was the second stage of collaboration.
After Supplier A introduced the first stage of collaboration, the procurement quantity showed sharp growth with improved forecasting accuracy. During the first-stage procurement quantity collaboration, the actual ordered quantity was 34,820,100 pcs (pieces), among which 22,070,300 pcs (63.4%) were shipped by Supplier A. In terms of procurement quantity forecasting accuracy, Supplier A’s shipping quantity exceeded 62.6%. On the other hand, the second stage collaboration mainly focused on the price negotiation with raw material suppliers, based on the procurement intensity that Supplier A was facing, in order to share the risk and the revenue generated from the cost reduction after the collaborative price negotiation.

6. Evaluation of Cost Effectiveness for Procurement Collaborations

In this section, we benchmark a collaborative component sharing approach with green suppliers as well as the component procurement and supply chain collaborations. When components are not shared among different products, surplus unused (old stock) components are facing the risk of becoming dummy components once the manufacturer ceases production of one product; on the other hand, increased orders of one product may require emergency procurement of particular components that may face higher costs or other difficulties. Component sharing leads to larger procurement quantities of a single component, resulting in a sharp decrease of procurement costs due to economies of scale. Based on the collected real sample data and evaluation indicators, the cost effectiveness of collaborative supply chain management was evaluated through the statistical analysis of suppliers’ component shipping prices.

6.1. Cost Effectiveness of MLCC Procurement Collaboration

For MLCC, the component collaborative management was focused on the procurement quantity and the forecast accuracy; therefore, the component prices of suppliers were compared with the component prices of the supplier who was introducing collaborative management.
As shown in Table 2, this study compared the component prices before and after MLCC Supplier A introduced the collaborative management. Before the introduction of collaborative management, Supplier A had 28 shipments with an average component price of US$ 8.9071. After the introduction of collaborative management, Supplier A had 70 shipments with an average component price of US$ 6.98000 (lowered by 21.6%). Statistical t-test (p < 0.01) suggested a significant decrease in average component price after the collaboration.
Table 2. Comparative cost effectiveness of MLCC procurement collaborations.
Comparison for Cooperative and Non-Cooperative SuppliersNPrice Means (US$)Mean Standard Error (US$)Cost Effectiveness (Measured by Price Reduction)Significance (One-Tailed) of t-Test for the Equality of Two Means
A vs. A+288.90710.013021.60%***
706.98000.0553
B vs. A+428.80950.476220.80%***
706.98000.0553
C vs. A+669.61360.088727.40%***
706.98000.0553
AB vs. A+708.84860.284421.10%***
706.98000.0553
AC vs. A+949.40320.070725.80%***
706.98000.0553
ABC vs. A+1369.21990.155624.30%***
706.98000.0553
***: p < 0.01; **: p < 0.05; *: p < 0.1.
For other suppliers and comparisons from a company-wide perspective, this study benchmarked the case of MLCC supplier A after collaboration and compared the component prices with five different groups of non-cooperative MLCC suppliers respectively. First, we compared the component price between MLCC Supplier B before collaboration and MLCC Supplier A after collaboration (B vs. A+). Before the introduction of collaborative management, Supplier B had 42 shipments with an average component price of US$ 8.8095, while the benchmarked case of collaboration yielded a 20.8% drop from the average price of Supplier B before collaboration. Statistical t-test (p < 0.01) suggested a significant decrease in average component price after the collaboration with Supplier A, compared with Supplier B before the collaboration.
Second, we compared the component price between MLCC Supplier C before collaboration and MLCC Supplier A after collaboration (C vs. A+). Before the introduction of collaborative management, Supplier C had 66 shipments with an average component price of US$ 9.6136, while the benchmarked case of collaboration yielded a 27.4% drop from the average price of Supplier C before collaboration and the statistical t-test (p < 0.01) suggested a significant decrease in average component price, compared with Supplier C before the collaboration.
Third, we compared the component price between MLCC Suppliers A and B before collaboration and MLCC Supplier A after collaboration (AB vs. A+). Before the introduction of collaborative management, Suppliers A and B had 70 shipments with an average component price of US$ 8.8486, while the benchmarked case of collaboration yielded a 21.1% drop from the average price of Suppliers A and B before collaboration. Statistical t-test (p < 0.01) suggested a significant decrease in average component price, compared with Suppliers A and B before the collaboration.
Fourth, we compared the component price between MLCC Suppliers A and C before collaboration and MLCC Supplier A after collaboration (AC vs. A+). Before the introduction of collaborative management, Suppliers A and C had 94 shipments with an average component price of US$ 9.40320, while the benchmarked case of collaboration yielded a 25.8% drop from the average price of Suppliers A and C before collaboration. Statistical t-test (p < 0.01) suggested a significant decrease in average component price, compared with Suppliers A and C before the collaboration.
Finally, for company-wide procurement as a whole, we compared the component price between MLCC Suppliers A, B and C before collaboration and MLCC Supplier A after collaboration (ABC vs. A+). Before the introduction of collaborative management, Suppliers A, B and C had 136 shipments with an average component price of US$ 9.2199, while the benchmarked case of collaboration yielded a 24.3% drop from the average price of Suppliers A, B and C before collaboration. Statistical t-test (p < 0.01) suggested a significant decrease in average component price, compared with Suppliers A, B and C before the collaboration.
In summary, compared with Suppliers without collaborative management, Supplier A showed significant performance in cost effectiveness after collaboration, improving the overall enterprise procurement effectiveness. The cost effectiveness of the benchmarked case is significantly higher than every individual supplier’s performance. Therefore, it is worth to promote the applications of collaborative models on component procurement. In addition, we found that the cost performance after the collaboration also surpassed the performance of every procurement combination from a group of suppliers. The results encourage the adoption of supply chain collaborations for improving green component procurement. These collaborations do not merely benefit the individual supplier but they offer company-wide benefits. Overall performance should improve when corporate strategy embraces the viewpoint.

6.2. Cost Effectiveness of USB 3.0 Cable Procurement Collaboration

This study evaluated the cost effectiveness of collaborative management of USB 3.0 cable component procurement based on the two stages of collaboration: (1) procurement quantity collaboration and (2) raw material price negotiation collaboration. As the USB 3.0 cable component was assembled from various materials from the upstream of its supply chain, its costs was partially constrained by the upstream suppliers. The cost effectiveness evaluation in this study was thus focused on one supplier in different stages to investigate the cost effectiveness of supply chain collaborations under different measures.
As shown in Table 3, USB 3.0 cable Supplier A had 77 shipments with an average component price of US$ 1.2571 before the introduction of collaborative management. After the introduction of the two-stage collaborative management (A+ and A++), Supplier A in two stages forwarded 75 shipments in total with an average component price of US$ 1.15560. The comparison shows that the average price was lowered by 8%. Statistical t-test (p < 0.01) found it to be a significant decrease in average component price after the introduction of the two-stage supply chain collaboration.
Table 3. Comparative cost effectiveness of USB 3.0 cable procurement collaborations.
Comparison for Cooperative and Non-Cooperative SuppliersNPrice Means (US$)Mean Standard Error (US$)Cost Effectiveness (Measured by Price Reduction)Significance (One-Tailed) of t-Test for the Equality of Two Means
A vs. A+A++771.25710.00178.00%***
751.15560.0053
A vs. A+771.25710.00174.20%***
291.20450.0009
A+ vs. A++291.20450.00096.60%***
461.12480.0044
***: p < 0.01; **: p < 0.05; *: p < 0.1.
After the introduction of the first stage of collaborative management (A+), Supplier A had 29 shipments with an average component price of US$ 1.2045. Compared with Supplier A’s performance before collaboration, the average price was lowered by 4.2% and statistical t-test (p < 0.01) found a significant decrease in average component price after the introduction of the first stage of supply chain collaboration.
After the introduction of the second stage of collaborative management (A++), Supplier A had 46 shipments with an average component price of US$ 1.1248. Compared with Supplier A’s performance in the first stage, the average price was further lowered by 6.6% and statistical t-test (p < 0.01) revealed another significant decrease in average component price from the first stage to the second stage of supply chain collaboration.
Table 3 summarizes the cost effectiveness evaluation of USB 3.0 cable component procurement collaboration. Both the procurement quantity collaboration and the price negotiation collaboration showed significant reduction of component price. The price negotiation with upstream raw material suppliers in the second stage of collaboration not only helped the suppliers reduce their cost, but also improved the competitiveness of their customers by reducing customers’ costs. The empirical results suggest the benefit of multi-stage vertical supply chain collaborations; these collaborations are a strong mechanism able to drive better performance.

7. Evaluation of Shipping Time Efficiency under Procurement Collaboration

In addition to contracted procurement cost, shipping time efficiency is another key performance indicator of the reduction of inventory risks/costs for component procurement collaborations. With the fast-changing specifications of electronic products and continuously dropping prices of components and products, and if upstream lacks the ability to speedily supply components it will cause old products to lose their values once new products are on the market. The longer the shipment delay, the more the derived losses for suppliers, e.g., the cost of supply delay/shortage compensation to customers.
In this study, suppliers’ component shipping delay was represented by the number of days delayed. The shipping delay was assigned as “1” with a complete matching to the designated shipping date. The delay was added by “1” with each additional day delayed after the designated shipping date.

7.1. Shipping Time Efficiency of MLCC Procurement Collaboration

In this section, the average shipping delays of MLCC components before and after the introduction of procurement quantity collaboration were compared and statistically analyzed. As shown in Table 4, before the introduction of collaboration, Supplier A had 135 shipments with average delay of 57.21 days. After the introduction of collaboration, Supplier A had 342 shipments with average delay of 11.94 days. Despite the performance degrade caused by the sudden demand increase of smartphones, a sharp reduction of shipping delay days was identified. Statistical t-test (p < 0.01) disclosed that the collaboration with Supplier A had significant improvement in shipping time efficiency.
Table 4. Comparative Shipping Time Efficiency of MLCC Procurement Collaborations.
Comparison for Cooperative and Non-Cooperative SuppliersNMean Delayed Shipment (Days)Mean Standard Error (Days)Shipping Time Efficiency (Measured by Delay Reduction)Significance (One-Tailed) of t-Test for the Equality of Two Means
A vs. A+13557.21007.761079.13%***
34211.94000.7930
B vs. A+1975.06000.4150−135.97%***
34211.94000.7930
C vs. A+2288.60001.7340−38.84%*
34211.94000.7930
AB vs. A+33226.27003.458054.55%***
34211.94000.7930
AC vs. A+36326.68003.317055.25%***
34211.94000.7930
ABC vs. A+56019.07002.198037.39%**
34211.94000.7930
***: p < 0.01; **: p < 0.05; *: p < 0.1.
As independent suppliers, Supplier B and C had much better performance in average shipping delays than Supplier A: Supplier B had 197 shipments with average delay of 5.06 days and Supplier C had 228 shipments with average delay of 8.60 days. However, the introduction of collaboration helped Supplier A to greatly improve its shipping delay and narrowed the performance gap between Suppliers A and B. In addition, statistical t-test (p > 0.05) revealed no significant performance difference between Supplier A and Supplier C. The introduction of collaboration helped Supplier A greatly reduce its shipping delay and to approach the performance of Supplier C.
From a company-wide viewpoint, this study benchmarked the case of MLCC supplier A after collaboration and compared its shipping time efficiency with that of each of three different groups of non-cooperative MLCC suppliers.
First, we compared the shipping time efficiency between MLCC Supplier A and B before collaboration and MLCC Supplier A after collaboration (AB vs. A+). Before the introduction of collaboration, Suppliers A and B had 332 shipments with average delay of 26.27 days and statistical t-test (p < 0.01) revealed that the specific collaboration with Supplier A led to significant improvement in shipping time efficiency.
Second, we compared the shipping time efficiency between MLCC Supplier A and C before collaboration and MLCC Supplier A after collaboration (AC vs. A+). Before the introduction of collaboration, Suppliers A and C had 363 shipments with average delay of 26.68 days and the statistical t-test (p < 0.01) indicated that the specific collaboration with Supplier A led to significant improvement in shipping time efficiency.
Finally, for company-wide procurement as a whole, we compared the shipping time efficiency between MLCC Suppliers A, B and C before collaboration and MLCC Supplier A after collaboration (ABC vs. A+). Before the introduction of collaboration, Suppliers A, B and C had 560 shipments with average delay of 19.07 days. The t-test gave a p < 0.05, suggesting that Supplier A after the collaboration had significant reduction in shipping time delays.
Table 4 summarizes the evaluation results of shipping time efficiency. Supplier A had significant improvement in the shipping time efficiency after the procurement collaboration. This study also revealed that for an enterprise, the collaborative management with suppliers not only can improve the performance of individual suppliers, but also helps to enhance the overall performance of the enterprise.

7.2. Shipping Time Efficiency of USB 3.0 Cable Procurement Collaboration

The average shipping delays of USB 3.0 cable components in different stages of supply chain collaboration (before collaboration, before procurement quantity collaboration, before price negotiation collaboration) were compared and statistically analyzed.
As shown in Table 5, before the introduction of collaboration, Supplier A had 77 shipments with average delay of 9.21 days. After the introduction of the two-stage collaborative management (A+ and A++), Supplier A had 75 shipments with average delay of 5.01 days. Significant improvements for shipping time efficiency were observed and statistical t-test (p < 0.05) indicated that Supplier A after the introduction of two-stage supply chain collaboration had significant reduction in shipping time delays.
Table 5. Comparative Shipping Time Efficiency of USB 3.0 Cable Procurement Collaborations.
Comparison for Cooperative and Non-Cooperative SuppliersNMean Delayed Shipment (Days)Mean Standard Error (Days)Shipping Time Efficiency (Measured by Delay Reduction)Significance (One-Tailed) of t-Test for the Equality of Two Means
A vs. A+A++779.20781.621945.55%**
755.01330.9338
A vs. A+779.20781.621956.18%**
294.03451.7345
A+ vs. A++294.03451.7345−39.56%p > 0.1 (insignificant)
465.63041.0657
***: p < 0.01; **: p < 0.05; *: p < 0.1.
For the first stage of collaborative management (A+), Supplier A had 29 shipments with average delay of 4.03 days. Compared with the performance before collaboration, clear reduction of shipping delay days was observed and statistical t-test (p < 0.1) indicated that Supplier A with procurement quantity collaboration had significant reduction in shipping time delays.
For the second stage of collaborative management (A++), Supplier A had 46 shipments with average delay of 5.63 days. Compared with Supplier A’s performance in the first stage, no significant difference (p > 0.1) of shipping delay days was attributable to the second stage of collaboration. Therefore, the change of stages of supply chain collaboration had statistically no direct relevance to the shipping time.
Table 5 summarizes comparative shipping time efficiency of USB 3.0 cable procurement collaborations. It is clear that the introduction of procurement quantity collaboration had significant relevance to improving the shipping time efficiency. On the other hand, the upstream raw material price negotiation had no significant relevance to the shipping time efficiency, suggesting that this measure was not helpful in the reduction of shipping time. However, as the analysis showed that the raw material price negotiation had made a significant contribution to cost reduction, this study may conclude that both procurement quantity collaboration and price negotiation collaboration can benefit and increase profits to enterprises along the supply chain through “sharing” and “unified” operations.

8. Conclusions

Working towards a sustainable economic development and workable business model would rely both on the awareness of consumers’ choices from demand side and the practical improvements of production from supply side. While the high technology manufacturers and global supply chains are facing a competitive market environment and cost pressure for survival, using green materials and component procurement for sustainability requires practical models, such as component procurement collaborations and SSCM that incorporate the triple objectives of social, environmental, and economic requirements, as the benchmarks for industrial applications.
In this paper, a case study from the systems perspective is conducted with empirical data collected from Taiwanese manufacturing chains and their global green suppliers to examine the effectiveness of green component procurement collaborations in terms of shared costs and improved shipping time. The results suggest that the practices of collaborative planning for procurement quantity and accuracy of delivery from suppliers are significantly related to cost effectiveness and shipping time efficiency. Although the price negotiation of upstream raw materials for the collaborative suppliers has no statistically significant benefit to the shipping time efficiency, the shared cost reduction of sustainable component procurement is significantly positive for supply chain collaboration among green manufacturers. As a response to the emerging sustainability issues in the high technology industries, this paper contributes to improving society and indicates managerial implications as follows:
(1)
It systematically investigates the possibility of green component procurement collaboration and illustrates improved performance for the triple objectives of sustainable development. Through green component procurement collaboration, supply chain performance could be enhanced not just from a single operational activity but to a sustainable corporate strategy. If high technology manufacturing companies could develop their organization-wide awareness and sustainable corporate strategy, they would have better alternatives to developing the capability toward SSCM and leading industrial competitiveness with collaborative green suppliers. The risks shared by the commitment to stable procurement collaboration with green suppliers translate into the benefit in cost savings and improved time efficiency that demonstrate the economic feasibility and competitiveness of green supply chain collaboration.
(2)
It is hoped this paper will encourage interested groups and parties to acquire information and to participate in the supply chain collaboration process of planning, decision making, and implementation. Green suppliers are able to lower their cost of market development and inventory management, while manufacturers are better equipped to achieve the triple values with defined components and reliable logistics at reasonable cost. Therefore, developing mutual trust relationship through the supply line and contractual arrangement for supply chain collaboration are critical for mutual benefits between the buyer and supplier. The mutual benefits could be further encouraged by governmental policies for industrial development, such as the relevant regulations and/or standards for green materials and manufacturing processes, public-funded incentives for supply chain collaborations, consistent promotions and establishments of consumers’ awareness for sustainability, etc.
(3)
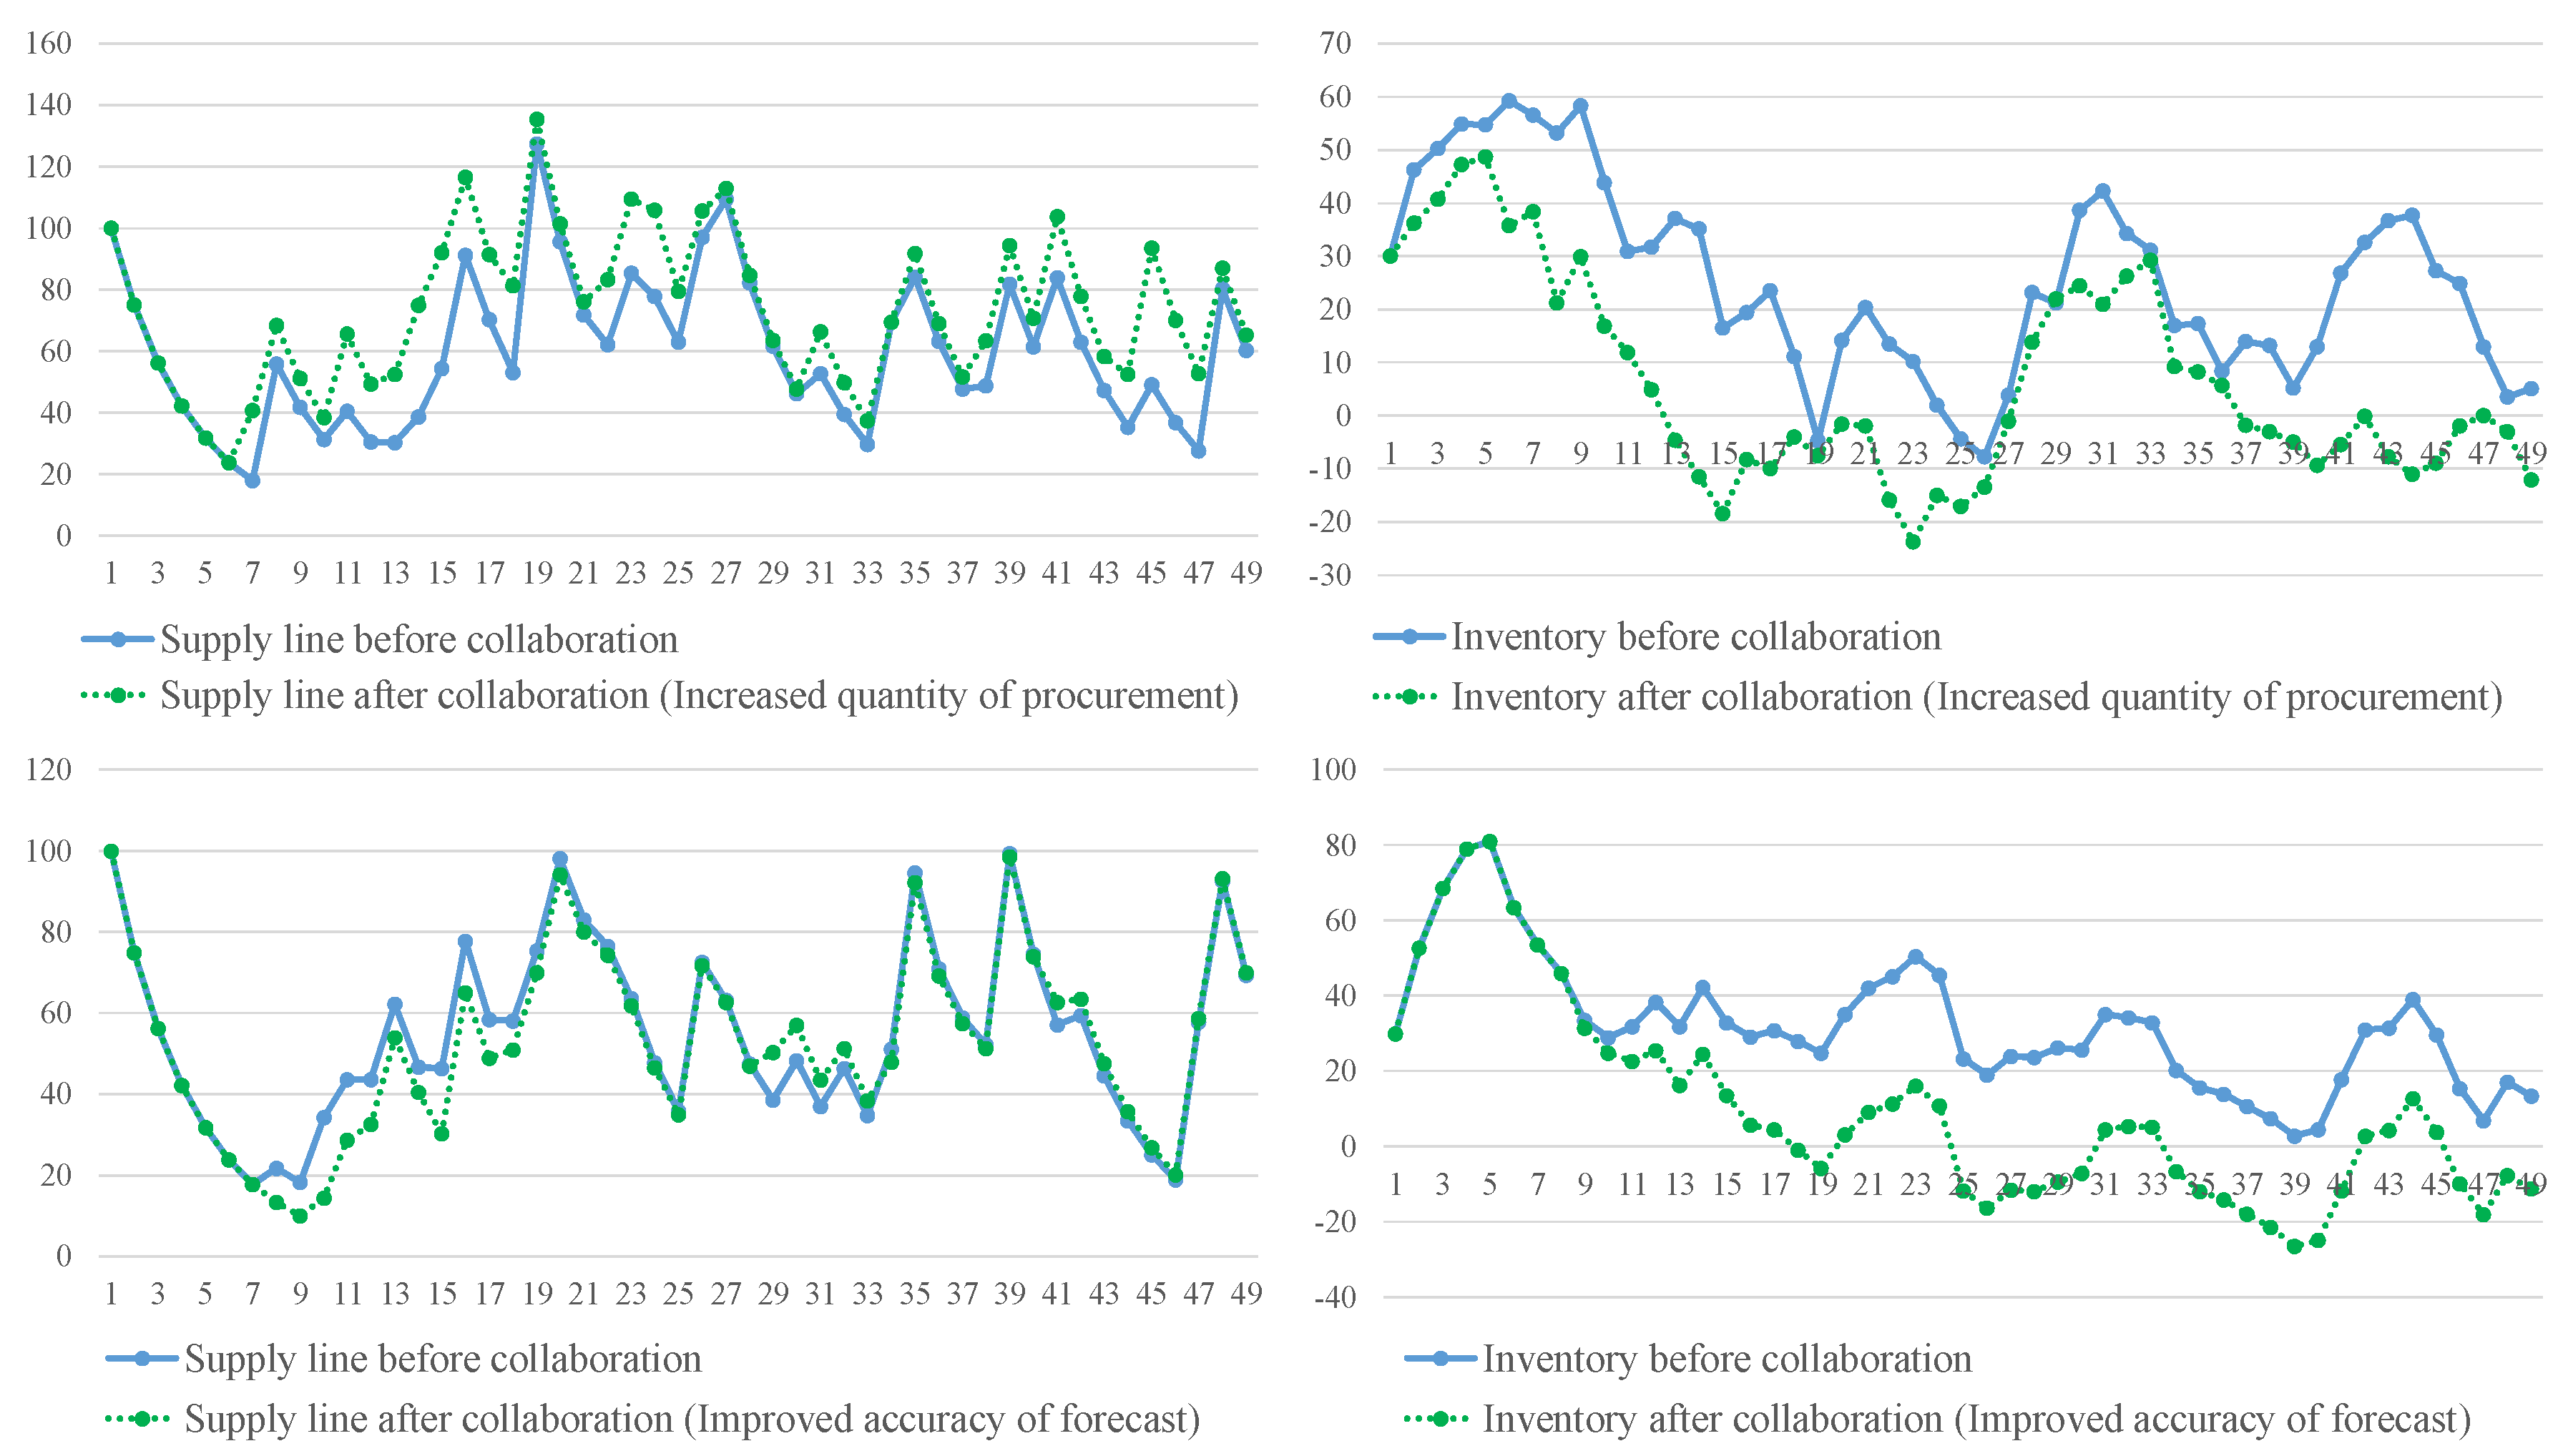
In addition to statistically testing the hypothesis with empirical data, this study have added a systems thinking model and computer simulation analysis as a complimentary model to validate the rationale of green component procurement collaboration and its mutual benefits among supply chain partners. Accordingly, it is suggested that a company’s procurement strategy should not only consider the purchasing cost but also the total benefit among the collaborative supply chain partners as a system. The systems thinking and the practices of green component procurement collaboration would help to lower the risk in production, inventory, and delivery process and eventually the purchasing cost for green components.
(4)
Compared with the traditional benchmark approach, the proposed green component procurement collaboration model comprises a balanced triple objectives and companies are suggested to consider the multiple objectives as the co-values of SSCM instead of constraints from the market environment and social pressure. With a continuous practice towards SSCM, companies will be able to improve the cost and economic feasibility and demonstrate diverse values to stakeholders and the society. Therefore, the environmental and social standards could be embedded in the multi-criteria decision making process for improving supply chain management so that the sustainable co-values could be encouraged.
Even though the limitation of this study due to the measurements defined and the empirical data available, it points the way for further research such as studying extensive collaborations among green suppliers, manufacturers, distributors, and retailers. The empirical results from different industrial practices as well as benchmarking would be valuable references for both business economics and sustainability. Knowledge management system for the benchmarked cases and rules discovered can be another direction to future studies. In addition, a broader framework of the quantitative measurements for SSCM might also be a worthy topic for future studies that inspire more comprehensive considerations for operational research and business decision making in accordance with the multiple objectives of sustainability.

Acknowledgments

Parts of this research were financially supported by the Ministry of Science and Technology in Taiwan. The authors would like to thank industry professional, Yen-Ting Chen, for helping empirical data collection and undertaking expert interviews used in the study.

Author Contributions

This paper presents a team work research result written by the co-authors, Min-Ren Yan, Kuo-Ming Chien, and Tai-Ning Yang. Yan and Yang conceived and designed the emipirical study; Yan and Chien analyzed the industry and performed the data analysis. With cross discussions of the research results, all of the co-authors have contributed substantially to the work reported.

Conflicts of Interest

The authors declare no conflict of interest.

References

  1. Yan, M.R.; Chien, K.M. Evaluating the economic performance of high-technology industry and energy efficiency: A case study of science parks in taiwan. Energies 2013, 6, 973–987. [Google Scholar] [CrossRef]
  2. Srivastava, S.K. Green supply-chain management: A state-of-the-art literature review. Int. J. Manag. Rev. 2007, 9, 53–80. [Google Scholar] [CrossRef]
  3. Hervani, A.A.; Helms, M.M.; Sarkis, J. Performance measurement for green supply chain management. Benchmarking Int. J. 2005, 12, 330–353. [Google Scholar] [CrossRef]
  4. Carter, C.R.; Rogers, D.S. A framework of sustainable supply chain management: Moving toward new theory. Int. J. Phys. Distrib. Logist. Manag. 2008, 38, 360–387. [Google Scholar] [CrossRef]
  5. Seuring, S.; Muller, M. From a literature review to a conceptual framework for sustainable supply chain management. J. Clean. Product. 2008, 16, 1699–1710. [Google Scholar] [CrossRef]
  6. Brindley, C.; Oxborrow, L. Aligning the sustainable supply chain to green marketing needs: A case study. Ind. Mark. Manag. 2014, 43, 45–55. [Google Scholar] [CrossRef]
  7. Gaussin, M.; Hu, G.; Abolghasem, S.; Basu, S.; Shankar, M.R.; Bidanda, B. Assessing the environmental footprint of manufactured products: A survey of current literature. Int. J. Prod. Econ. 2013, 146, 515–523. [Google Scholar] [CrossRef]
  8. Linton, J.D.; Klassen, R.; Jayaraman, V. Sustainable supply chains: An introduction. J. Oper. Manag. 2007, 25, 1075–1082. [Google Scholar] [CrossRef]
  9. Mosgaard, M.; Riisgaard, H.; Huulgaard, R.D. Greening non-product-related procurement—When policy meets reality. J. Clean. Product. 2013, 39, 137–145. [Google Scholar] [CrossRef]
  10. Ozkir, V.; Basligil, H. Modelling product-recovery processes in closed-loop supply-chain network design. Int. J. Prod. Res. 2012, 50, 2218–2233. [Google Scholar] [CrossRef]
  11. Abbasi, M.; Nilsson, F. Themes and challenges in making supply chains environmentally sustainable. Supply Chain Manag. 2012, 17, 517–530. [Google Scholar]
  12. Gimenez, C.; Tachizawa, E.M. Extending sustainability to suppliers: A systematic literature review. Supply Chain Manag. 2012, 17, 531–543. [Google Scholar]
  13. Hassini, E.; Surti, C.; Searcy, C. A literature review and a case study of sustainable supply chains with a focus on metrics. Int. J. Prod. Econ. 2012, 140, 69–82. [Google Scholar] [CrossRef]
  14. Wittstruck, D.; Teuteberg, F. Understanding the success factors of sustainable supply chain management: Empirical evidence from the electrics and electronics industry. Corp. Soc. Responsib. Environ. Manag. 2012, 19, 141–158. [Google Scholar] [CrossRef]
  15. Rao, P.; Holt, D. Do green supply chains lead to competitiveness and economic performance? Int. J. Oper. Prod. Manag. 2005, 25, 898–916. [Google Scholar] [CrossRef]
  16. Sarkis, J.; Zhu, Q.H.; Lai, K.H. An organizational theoretic review of green supply chain management literature. Int. J. Prod. Econ. 2011, 130, 1–15. [Google Scholar] [CrossRef]
  17. Barari, S.; Agarwal, G.; Zhang, W.J.; Mahanty, B.; Tiwari, M.K. A decision framework for the analysis of green supply chain contracts: An evolutionary game approach. Expert Syst. Appl. 2012, 39, 2965–2976. [Google Scholar] [CrossRef]
  18. Green, K.W.; Zelbst, P.J.; Meacham, J.; Bhadauria, V.S. Green supply chain management practices: Impact on performance. Supply Chain Manag. 2012, 17, 290–305. [Google Scholar] [CrossRef]
  19. Azevedo, S.G.; Carvalho, H.; Machado, V.C. The influence of green practices on supply chain performance: A case study approach. Transp. Res. E Logist. Transp. Rev. 2011, 47, 850–871. [Google Scholar] [CrossRef]
  20. Diabat, A.; Govindan, K. An analysis of the drivers affecting the implementation of green supply chain management. Resour. Conserv. Recycl. 2011, 55, 659–667. [Google Scholar] [CrossRef]
  21. Bonilla, D.; Keller, H.; Schmiele, J. Climate policy and solutions for green supply chains: Europe’s predicament. Supply Chain Manag. 2015, 20, 249–263. [Google Scholar]
  22. Jabbour, A.; Azevedo, F.D.; Arantes, A.F.; Jabbour, C.J.C. Green supply chain management in local and multinational high-tech companies located in brazil. Int. J. Adv. Manuf. Technol. 2013, 68, 807–815. [Google Scholar] [CrossRef]
  23. Yan, R.L.; Wang, K.Y. Franchisor-franchisee supply chain cooperation: Sharing of demand forecast information in high-tech industries. Ind. Mark. Manage. 2012, 41, 1164–1173. [Google Scholar] [CrossRef]
  24. Chuang, C.H.; Wang, C.X.; Zhao, Y.B. Closed-loop supply chain models for a high-tech product under alternative reverse channel and collection cost structures. Int. J. Prod. Econ. 2014, 156, 108–123. [Google Scholar] [CrossRef]
  25. Hsu, C.W.; Hu, A.H. Green supply chain management in the electronic industry. Int. J. Environ. Sci. Technol. 2008, 5, 205–216. [Google Scholar] [CrossRef]
  26. Sheu, J.B. Green supply chain collaboration for fashionable consumer electronics products under third-party power intervention-a resource dependence perspective. Sustainability 2014, 6, 2832–2875. [Google Scholar] [CrossRef]
  27. Ahi, P.; Searcy, C. A comparative literature analysis of definitions for green and sustainable supply chain management. J. Clean. Product. 2013, 52, 329–341. [Google Scholar] [CrossRef]
  28. Mari, S.I.; Lee, Y.H.; Memon, M.S. Sustainable and resilient supply chain network design under disruption risks. Sustainability 2014, 6, 6666–6686. [Google Scholar] [CrossRef]
  29. Chen, R.J.C. An integrated sustainable business and development system: Thoughts and opinions. Sustainability 2014, 6, 6862–6871. [Google Scholar] [CrossRef]
  30. Devika, K.; Jafarian, A.; Nourbakhsh, V. Designing a sustainable closed-loop supply chain network based on triple bottom line approach: A comparison of metaheuristics hybridization techniques. Eur. J. Oper. Res. 2014, 235, 594–615. [Google Scholar] [CrossRef]
  31. Tseng, M.L.; Lim, M.; Wong, W.P. Sustainable supply chain management: A closed-loop network hierachical approach. Ind. Manag. Data Syst. 2015, 115, 436–461. [Google Scholar] [CrossRef]
  32. Wu, K.J.; Liao, C.J.; Tseng, M.L.; Chiu, S.F. Exploring decisive factors in green supply chain practices under uncertainty. Int. J. Product. Econ. 2015, 159, 147–157. [Google Scholar] [CrossRef]
  33. Deutz, P.; Ioppolo, G. From theory to practice: Enhancing the potential policy impact of industrial ecology. Sustainability 2015, 7, 2259–2273. [Google Scholar] [CrossRef]
  34. Ioppolo, G.; Cucurachi, S.; Salomone, R.; Saija, G.; Ciraolo, L. Industrial ecology and environmental lean management: Lights and shadows. Sustainability 2014, 6, 6362–6376. [Google Scholar] [CrossRef]
  35. Kou, T.C.; Lee, B.C.Y. The influence of supply chain architecture on new product launch and performance in the high-tech industry. J. Bus. Ind. Mark. 2015, 30, 677–687. [Google Scholar] [CrossRef]
  36. Liu, C.C.; Yu, Y.H.; Wernick, I.K.; Chang, C.Y. Using the electronic industry code of conduct to evaluate green supply chain management: An empirical study of Taiwan’s computer industry. Sustainability 2015, 7, 2787–2803. [Google Scholar] [CrossRef]
  37. Lo, S.M. Effects of supply chain position on the motivation and practices of firms going green. Int. J. Oper. Prod. Manag. 2014, 34, 93–114. [Google Scholar] [CrossRef]
  38. Chen, Y.S.; Lai, S.B.; Wen, C.T. The influence of green innovation performance on corporate advantage in taiwan. J. Bus. Ethics 2006, 67, 331–339. [Google Scholar] [CrossRef]
  39. Wu, W.W.; Lee, Y.T.; Tseng, M.L.; Chiang, Y.H. Data mining for exploring hidden patterns between KM and its performance. Knowl.-Based Syst. 2010, 23, 397–401. [Google Scholar] [CrossRef]
  40. Dangelico, R.M.; Pontrandolfo, P. Being “green and competitive”: The impact of environmental actions and collaborations on firm performance. Bus. Strateg. Environ. 2013, 24, 413–430. [Google Scholar] [CrossRef]
  41. National Council for Sustainable Development. 2013 Sustainable Development Indicator Report; National Council for Sustainable Development Network: Taipei, Taiwan, 2014. [Google Scholar]
  42. Levi, D.S.; Kaminsky, P.; Levi, E.S. Designing and Managing the Supply Chain: Concepts, Strategies, and Case Studies; McGraw-Hill: New York, NY, USA, 2003. [Google Scholar]
  43. Ramanathan, U. Supply chain collaboration for improved forecast accuracy of promotional sales. Int. J. Oper. Prod. Manag. 2012, 32, 676–695. [Google Scholar] [CrossRef]
  44. Behzad, G.; Dragan, B.; Andrew, J. Product support improvement by considering system operating environment: A case study on spare parts procurement. Int. J. Qual. Reliab. Manag. 2012, 29, 436–450. [Google Scholar]
  45. Philip, M.K.L.; Cesar, R.-G. In search of differentiation and the creation of value: The quest of the scottish pig supply chainnull. Br. Food J. 2013, 115, 1487–1504. [Google Scholar]
  46. Yan, M.R. Project-based market competition and policy implications for sustainable developments in building and construction sectors. Sustainability 2015, 7, 15423–15448. [Google Scholar] [CrossRef]
  47. Sterman, J. Business Dynamics: Systems Thinking and Modeling for a Complex World; HAR/CDR, Ed.; McGraw-Hill Education: Columbus, OH, USA, 2000. [Google Scholar]

