1. Introduction
The increasing attention to the exploitation of natural resources is promoting a world-wide effort towards policies and technologies to enhance the environmental sustainability of production processes of goods and services. More efficient water usage is of primary concern in order to guarantee fair access to the necessary resource for the survival of human beings and the ecosystem. This goal can only be pursued via a two-step approach: the characterization of the actual water-usage scenario and the reduction of water consumption in the most impacting processes.
Over the past decades, a continuously increasing demand for water, coupled with a growing misuse, led to a worldwide scenario characterized by increased risks of pollution and severe water stress. The distribution and availability of freshwater resources is inhomogeneous and variations in
per capita water availability among countries are significant (
Figure 1) [
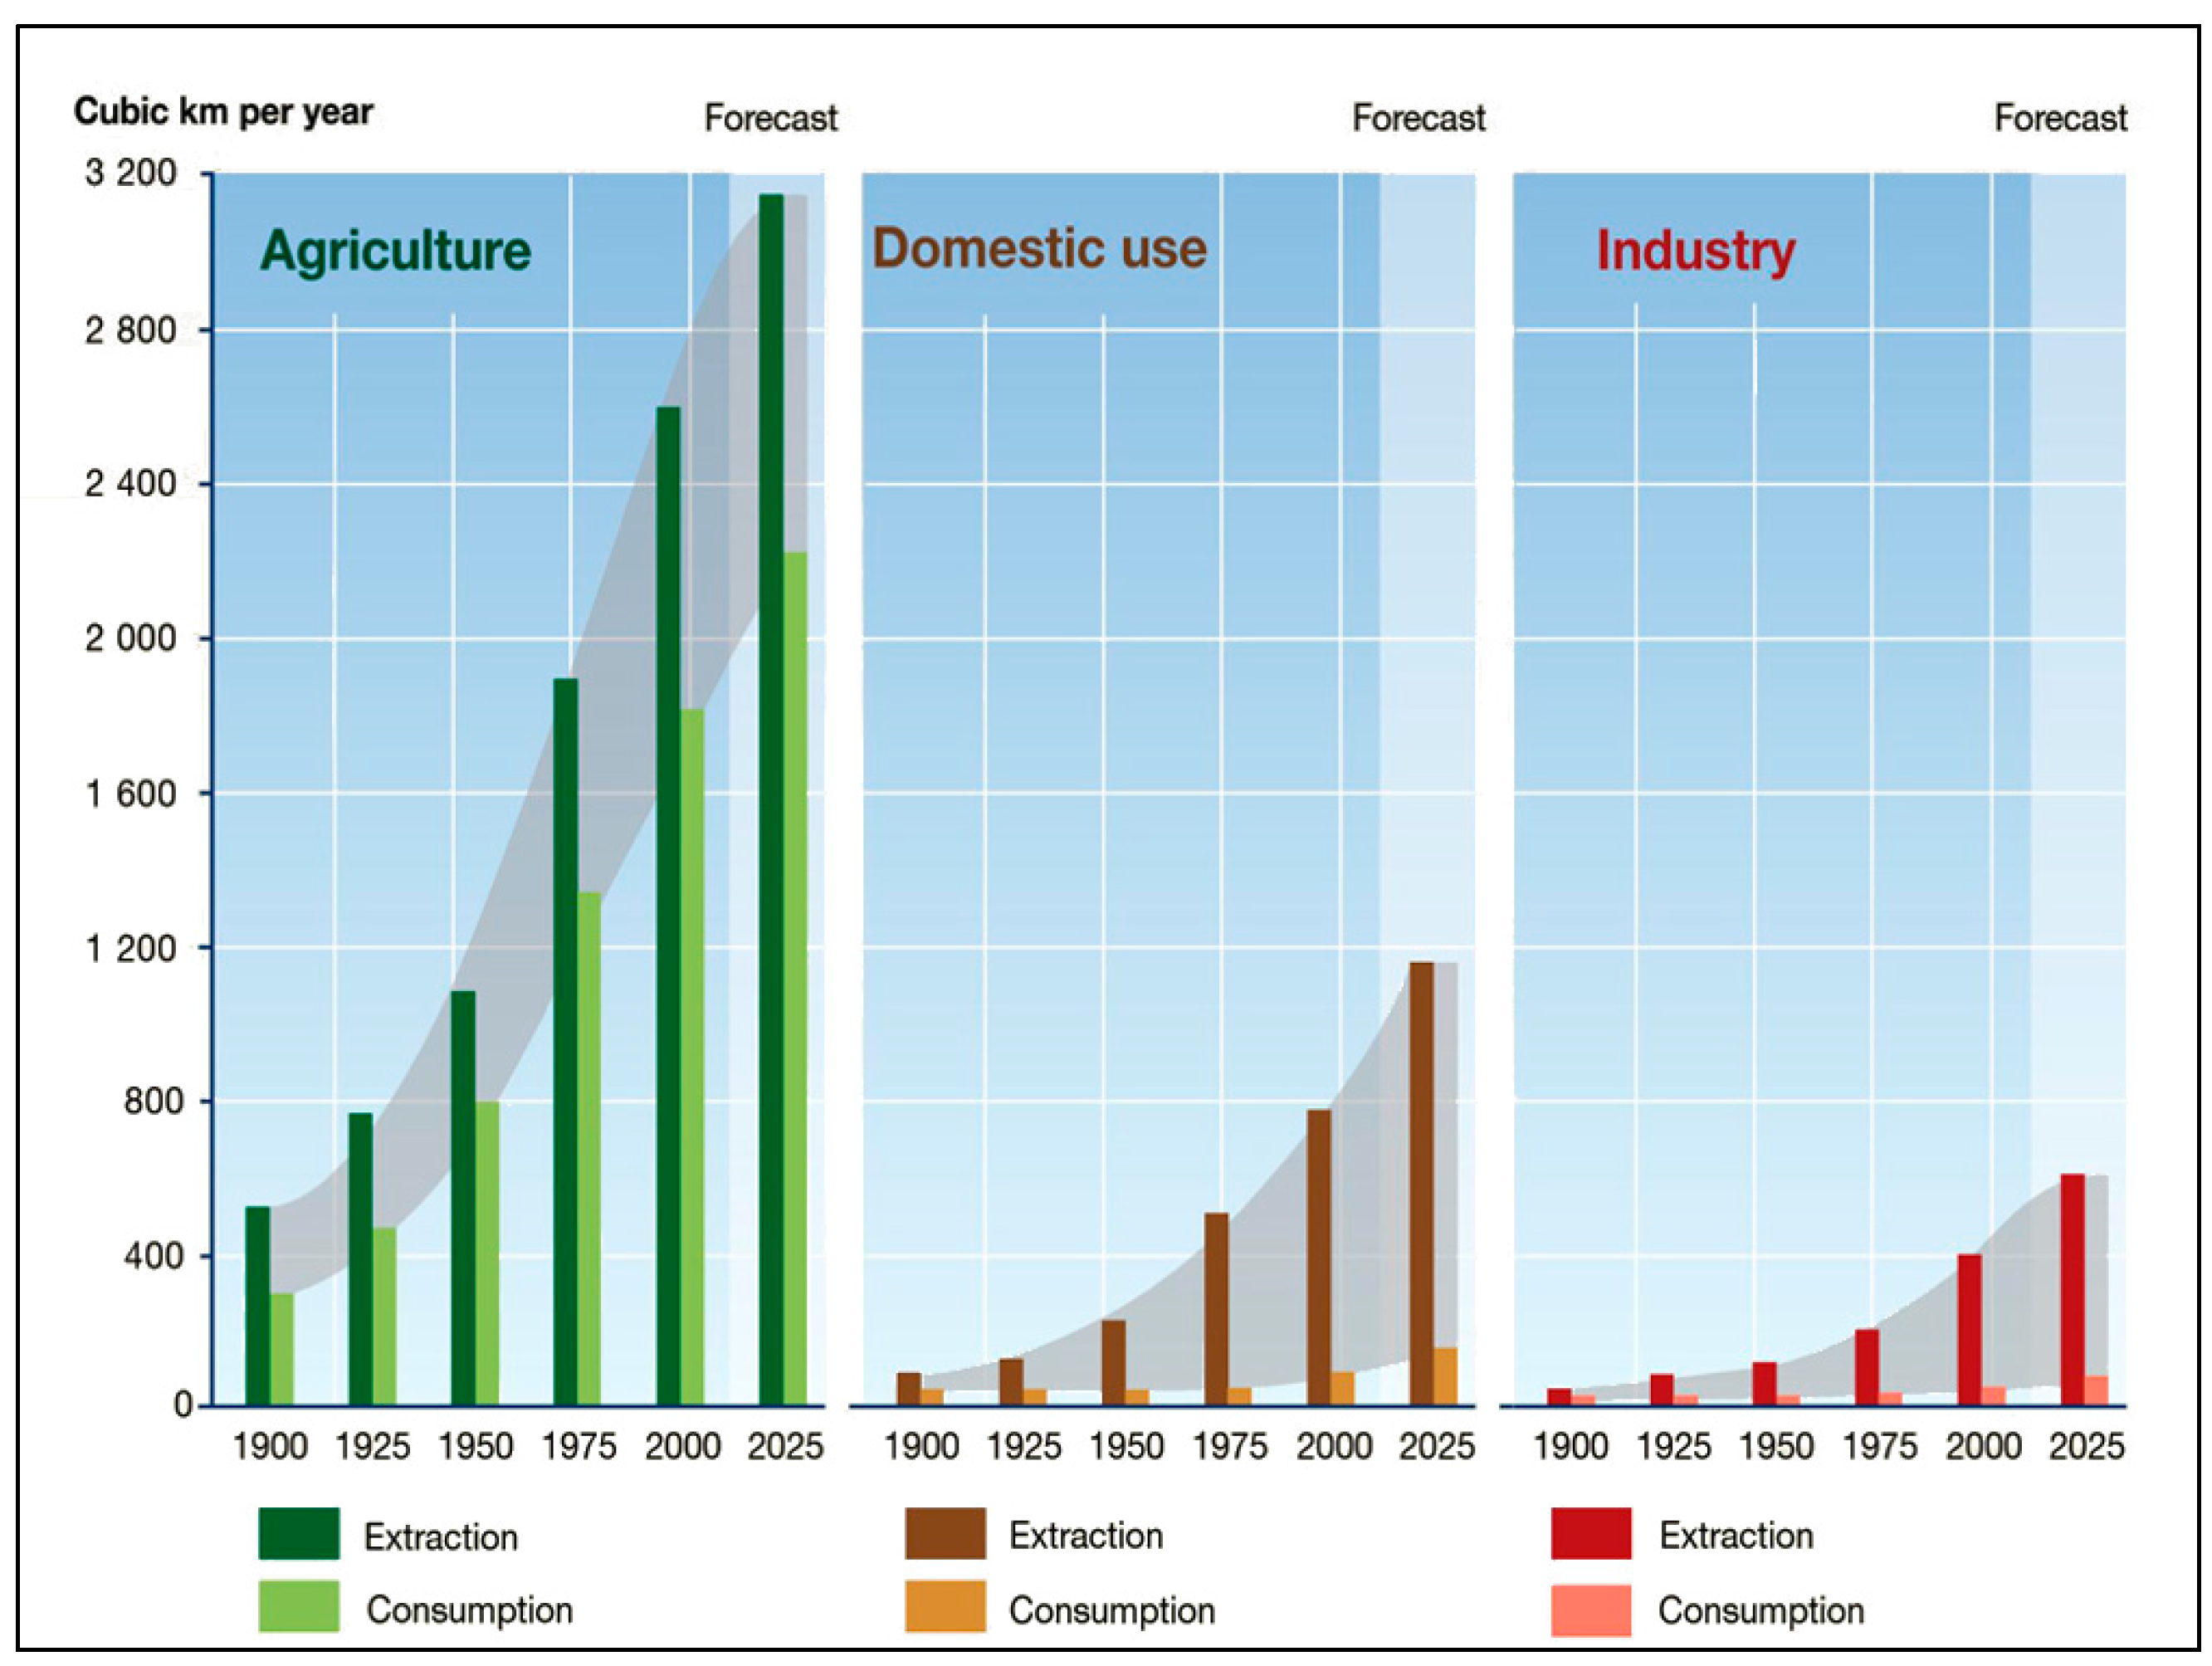
1]. Within this context, agriculture plays a key role because of the high water consumption (
Figure 2) [
2]. Current growth rates of agricultural demands on the world freshwater resources are considered unsustainable and the forecasts show a significant increase: by 2050, agriculture will need to produce 60% more food globally, and 100% more in developing countries [
3], with an unavoidable consequent higher load on the environment. Using water for crop production in an inefficient way causes aquifers depletion, river flows reduction, wildlife habitats degradation, and has also caused salinization of 20% of the global irrigated land area [
4].
Figure 1.
Total renewable water resources per capita (m3).
Figure 1.
Total renewable water resources per capita (m3).
In this scenario, freshwater scarcity is definitely an important issue on the environmental agenda, being more and more taken into account in different sectors [
5], and the Water Footprint (WF) is quickly gaining worldwide recognition. The WF purpose is to study the links between human consumption and water use and between global trade and water resource management [
6,
7,
8]. The initial boost to the sector came precisely from agriculture, with the development of scientific methods for the estimation of the water consumption and watering needs of crops [
9]. Agriculture and agri-food are also some of those sectors more investigated by the literature and characterized by the availability of several case studies. Cazcarro
et al. [
10] analyzed the provincial variation of WF and its sustainability in Spain, considering a time lapse of 50 years and referring to the agricultural sector 8. Flores-Lopez and Bautista-Capetillo [
11] estimated green and blue WFs for dry beans in the dry beans primary region of Mexico, both under irrigation and dryland conditions, using standard methodology. Ridoutt
et al. [
12] calculated the WFs of six diverse beef cattle production systems in southern Australia and compared them with the respective Carbon Footprint (CF) using endpoint indicators. Herath
et al. taking as reference New Zealand’s wines, assessed WFs of a wine bottle using different methods [
13] and also evaluated the impacts of water use through the life cycle of grape-wine production on water resources [
14]. Regarding the wine industry, moreover, Quinteiro
et al. [
15] assessed the quantitative freshwater use of a Portuguese wine using different methods under the framework of Life Cycle Assessment (LCA), while Ene
et al. [
16] carried out a water footprint assessment of a bottle of wine produced in a medium-size wine production plant in Romania.
Figure 2.
Trends in global water use by sector [
2]. Note: The grey band represents the difference between the amount of water extracted and that actually consumed.
Figure 2.
Trends in global water use by sector [
2]. Note: The grey band represents the difference between the amount of water extracted and that actually consumed.
The first formulation of a water footprint assessment was produced to provide a consumption-based indicator of the water use [
17], showing direct and indirect use of water associated with a producer or a consumer. A first version of a global standard for WF assessments [
18] contained comprehensive definitions and methods for WF accounting. WFs, calculated for individual processes and products within a geographically delineated area, were defined as a measure of freshwater appropriation in terms of water volumes consumed (evapotranspirated or incorporated into a product) and polluted per unit time. The most recent definition of the Water Footprint is contained in the international standard ISO 14046 [
19]. The specific impact categories to which the standard is dedicated are the growing water demand, the increasing water scarcity, and the degradation of water quality. The formulation of the methodology for assessing and reporting the water footprint of products, processes, and organizations was driven by an increasing demand to provide a widespread and accepted tool able to guarantee transparency, consistency, reproducibility, and credibility.
A WF assessment [
20,
21] is based on an LCA approach [
22], which is commonly used in different sectors [
23,
24,
25,
26], both for environmental and sustainability analyses [
27]. In addition to the classical LCA approach, WF evaluation has two peculiar characterizations: (i) geographic and (ii) temporal dimensions. The importance of linking environmental aspects and pressures to the geographic dimension is recognized and different attempts have been made in this regard [
28,
29]. Considering that water availability, scarcity, and degradation are strongly related both to the place and the time a water resource is processed by human activities, the inclusion of space-temporal aspects in assessing approaches is essential. These two variables make the water footprint offsetting a very complex and debated argument which the international standard intentionally does not include. All relevant data have to be included in the analysis as well as information on each elementary flow (
i.e., any water flow entering or exiting the system) for any relevant case.
An original quantification methodology was elaborated and applied to a case study: a typical red wine produced by a medium-size Umbrian winery. The selected product is a blend of Sangiovese, Merlot, and Cabernet Sauvignon grapes, matured in wooden barrels, and accounting for approx. 2% of the entire winery yearly production. All the activities (from grapes production to bottling) are performed within the company boundaries.
Section 2 shows the assessment procedure and the quantification of the water volumes.
Section 3 describes the improved methodology for the evaluation of the grey water footprint highlighting the differences with the reference approach.
Section 4 contains the description of the winery activities and the collected data.
Section 5 shows the results of the assessment and the discussion. Conclusions are reported in
Section 6.
2. The WF Assessment Methodology
The water footprint methodology was developed with the goal of quantifying the total water use associated with the entire lifecycle of a wine bottle. The underlying approach is based on an LCA analysis including all the direct and indirect water-consuming processes from the cradle (
i.e., grapes production) to the grave (
i.e., final product end-of-life). Unlike the Carbon Footprint [
30,
31], a WF study can be performed at mid-point or end-point level. The former is a problem-oriented approach, assessing the impact on environmental categories (e.g., water scarcity, eutrophication, acidification,
etc.). The latter is a damage-oriented approach concerning three different areas of protection (human health, ecosystem, and resources), which also allows for the combination of the relevant environmental impacts into synthetic indicators. The methodology that was setup for this analysis is a mid-point indicator that sums up all the water volumes that are processed during the lifecycle of the product [
32]. All the volumes of water (real or virtual) taking part in the process are considered, including water that is withdrawn and returned to the environment at a different time or place (e.g., evapotranspiration of rainwater, runoff of irrigation water,
etc.). No weight is applied to the different water resources. As a result, the outcome of the water footprint assessment can be interpreted as the water intensity of a wine bottle.
The total water footprint (WF), generally measured in liters, is made of three components:
The blue water footprint (WFblue) is the volume of surface and ground water withdrawn during the process, the green water footprint (WFgreen) is the volume of rainwater that is evapotranspirated and incorporated during the process, and the grey water footprint (WFgrey) is an estimate of the freshwater pollution (water needed to dilute the load of pollutants). The first two contributions evaluate real volumes of water that are consumed during the process: the water is effectively used by the process itself (e.g., withdrawn from an aquifer, dispersed by run-off, etc.). The grey water footprint, on the other hand, is an estimate of a virtual volume: the water needed to assimilate the pollutants is not effectively taken from a reservoir or a basin or, in any case, not in a well-defined place or at a well-defined time.
There are two contributions to the total WF of a wine bottle. The first arises from the agricultural activities (
Section 2.1), the second from the winery (
Section 2.2). All the calculations were performed using an in-house software (V.I.V.A. [
33]).
2.1. Agricultural Water Footprint
The agricultural water footprint (WFagr) is made of three components: blue, green, and grey. Since green and grey water footprint depend on meteo and soil properties, their calculation needs specific input data. Vineyards characterized by common properties were grouped in territorial units, for which the water footprint evaluation is performed separately and eventually summed together.
The
is defined as the total volume of surface and ground freshwater consumed for tillage. It includes water used for irrigation, water used to dilute and apply treatments, and water used to wash the machinery:
The
is defined as the total volume of rainwater used by the crop for evapotranspiration. The direct calculation of this contribution was performed using specific meteorological and soil data for each territorial unit. The procedure is based on the Food and Agriculture Organization of the United Nations (FAO) methodology [
9].
The
is defined as the total volume of water that is needed to dilute the pollutants’ concentration below legal or toxicological reference values. The contamination of nearby aquifers takes into account the pollutants that are dispersed via runoff, drift, or leaching. The contamination limit of surface water bodies from runoff and drift was set to the no-observed-effect-concentration (NOEC), taking into account the minimum value reported for daphnia, fish, and algae [
34]. For the leaching contamination, national legal limits were used [
35].
The contribution to the water footprint produced by the land-use change [
36,
37] is not included. As it is common in Italy, vineyards are typically dedicated to wine production continuously for generations (in this particular case, since early 1900), and, especially for protected designation of origin (PDO) wines, with traditional tillage techniques. On the other hand, the effects of employing other vegetation between rows and using particular planting schemes are included [
38].
2.2. Winery Water Footprint
The computation of the winery water footprint is more straightforward than that from agriculture. There is no contribution to green water footprint from the winery ( = 0), since no rainwater is involved in the process under examination. The blue water footprint () is given by the winery water withdrawn from the grid or from wells. The grey water footprint () is given by the water volume required to dilute the pollutants used during the vinification.
In case specific data for the product only are not available, data for the entire cellar production are used and an allocation procedure on a volume basis (product under examination vs. entire production) is performed.
Finally, according to [
18] and [
38], if an efficient depurator is used, the grey water footprint is equal to zero since the water is returned to the environment with a pollutant load below the given pollution level [
34,
35]. The water used in the depuration process is accounted as blue water.
4. System Definition and Data Collection
The methodology described in
Section 2 and
Section 3 was applied to a medium-size winery located in central Italy. The total vineyard area, in a mostly hilly location, is approx. 20 ha. Data were collected for vintage year 2012, characterized by a yearly wine production of 187,460 L. The product under examination is a PDO red wine that covers approximately 2% of the total production. The functional unit is a 0.75 L wine bottle. Grapes from one territorial unit are used to assemble the final product, that is a mix of typical Italian vines (mainly
Sangiovese, with small percentages of
Merlot and
Cabernet Sauvignon). The meteorological conditions and the soil properties, particularly favorable to wine production, do not require irrigation during the entire season and a reduced use of fertilizers is required. Water volumes are explicitly computed for the following processes/activities:
- (1)
irrigation;
- (2)
evapotranspiration;
- (3)
application of fertilizers;
- (4)
application of agrochemicals and pesticides;
- (5)
all vineyard and cellar activities requiring consumptive use of tap and well water;
- (6)
treatment of wastewater.
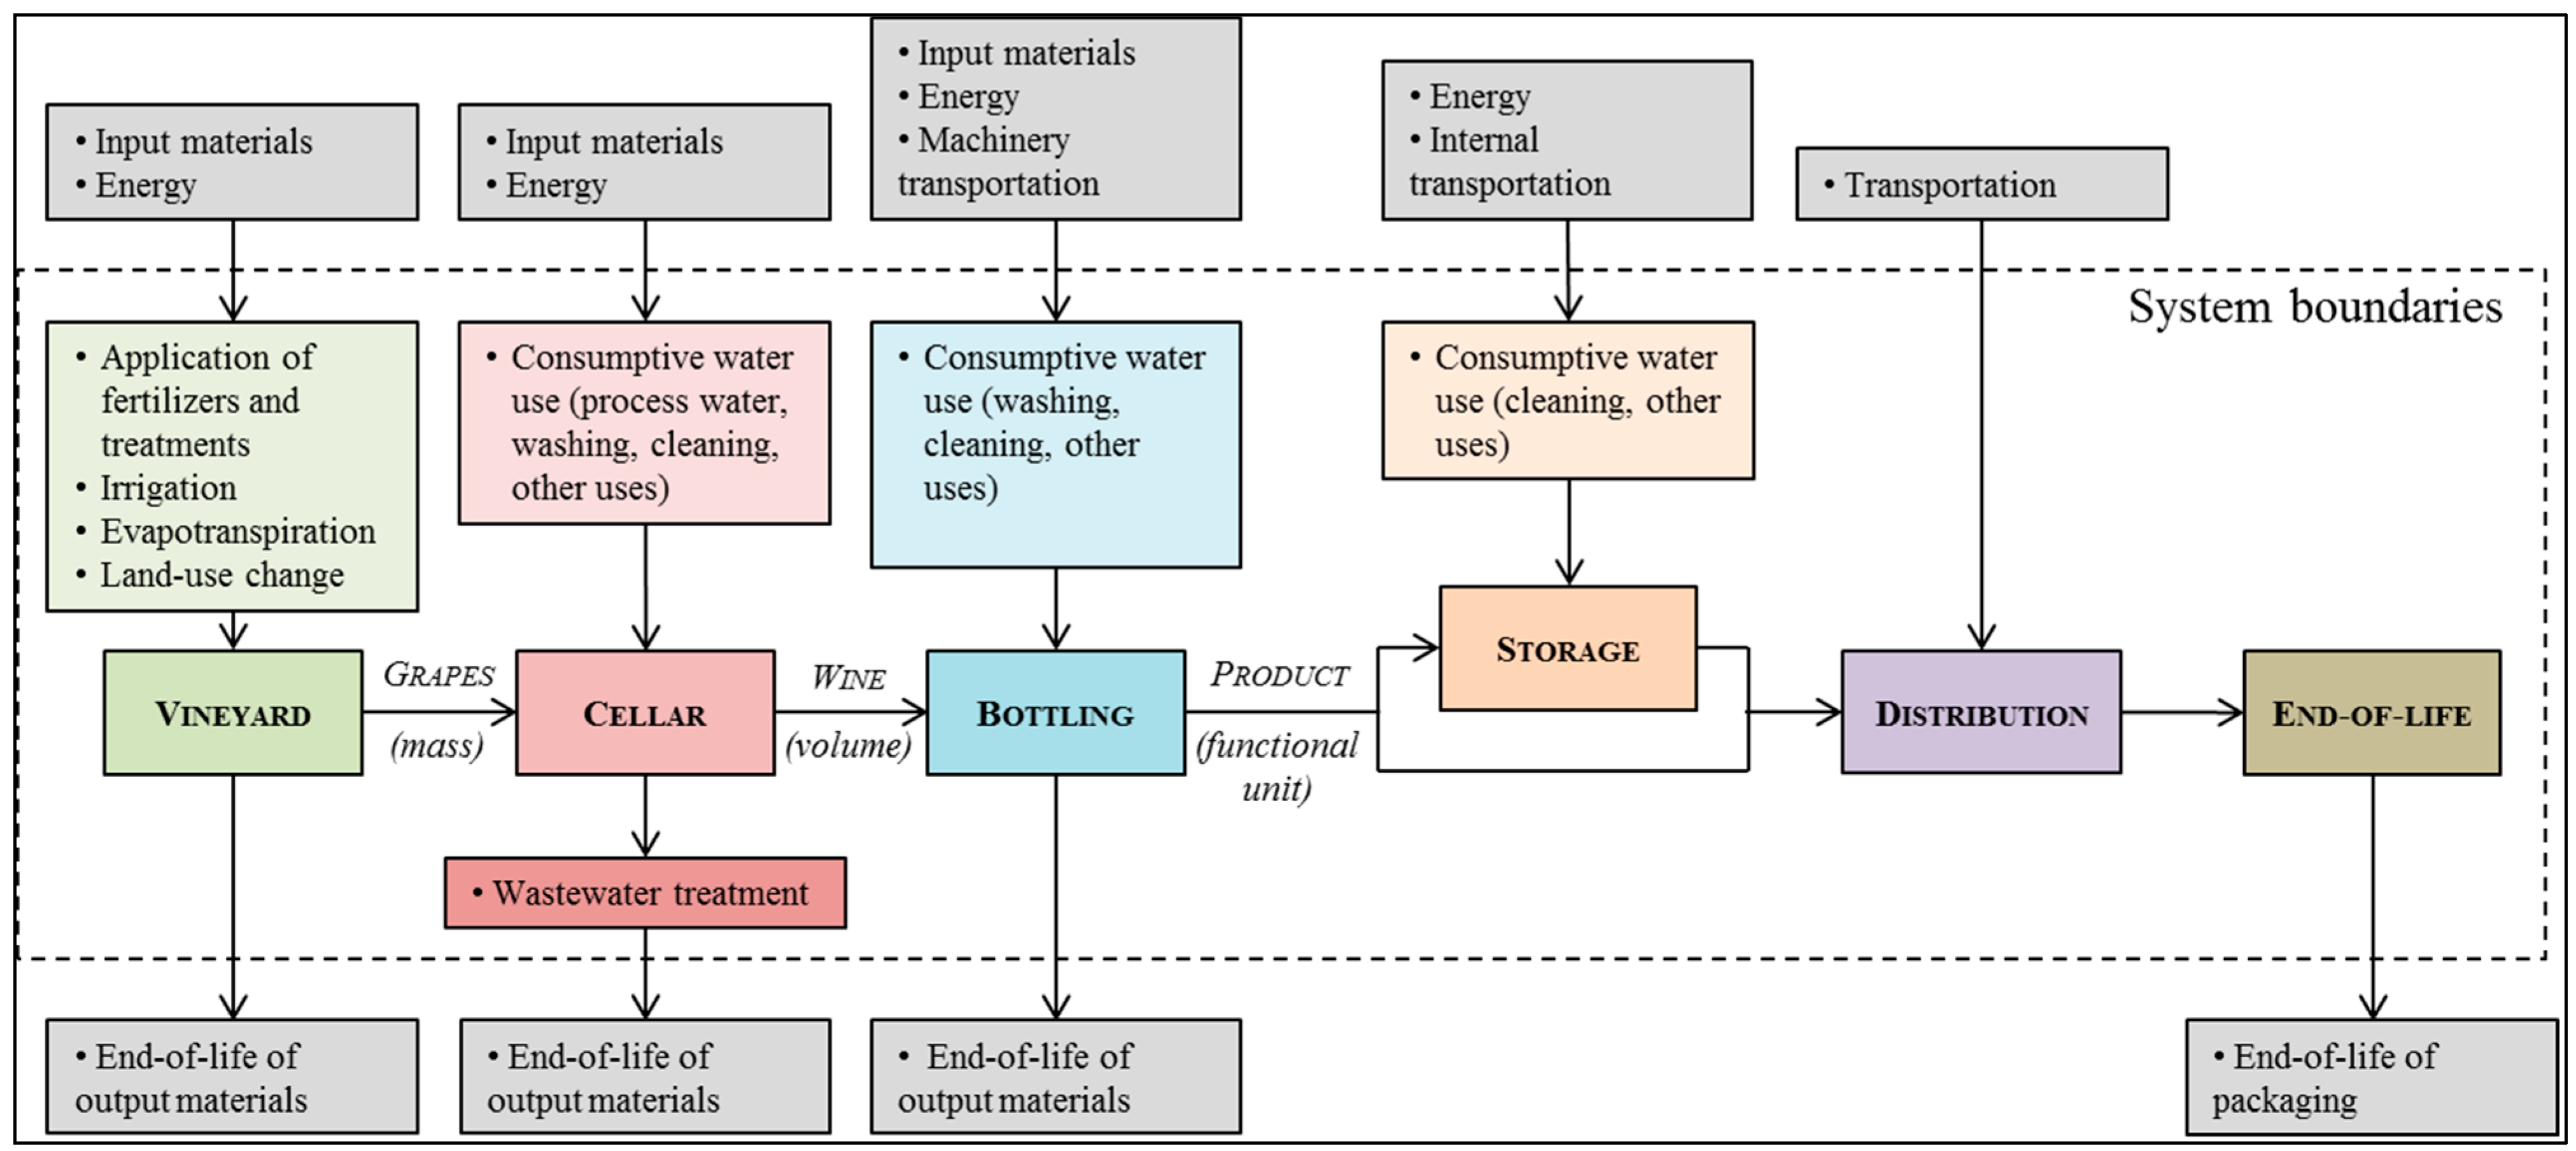
Some foreground and background processes, expected to produce a minor contribution to the overall water footprint, are currently not included in the assessment procedure. The assessment methodology is based on the direct evaluation of water volumes from primary data: the volumes associated to the production of input materials and energy, transportation, and end-of-life, which could be estimated using dedicated databases (e.g., [
40]), are not currently computed and will be considered in the future development of this work. System boundaries are shown in
Figure 3.
Figure 3.
System boundaries.
Figure 3.
System boundaries.
The water footprint evaluation (including the green, blue, and gray water volumes) was performed via an in-house software (V.I.V.A., [
33]) developed by University of Perugia within a project sponsored by the Italian Ministry for the Environment and in collaboration with the Università Cattolica del Sacro Cuore in Piacenza, Italy and the research center Agroinnova of the University of Turin, Italy [
41]. The beta version of the software is available online [
33]. The procedure is based on sequential steps, and it is optimized to provide an easy and guided data entering process. The results, split in green, blue, and grey water footprints, are available for the total production, per bottle, and per wine glass.
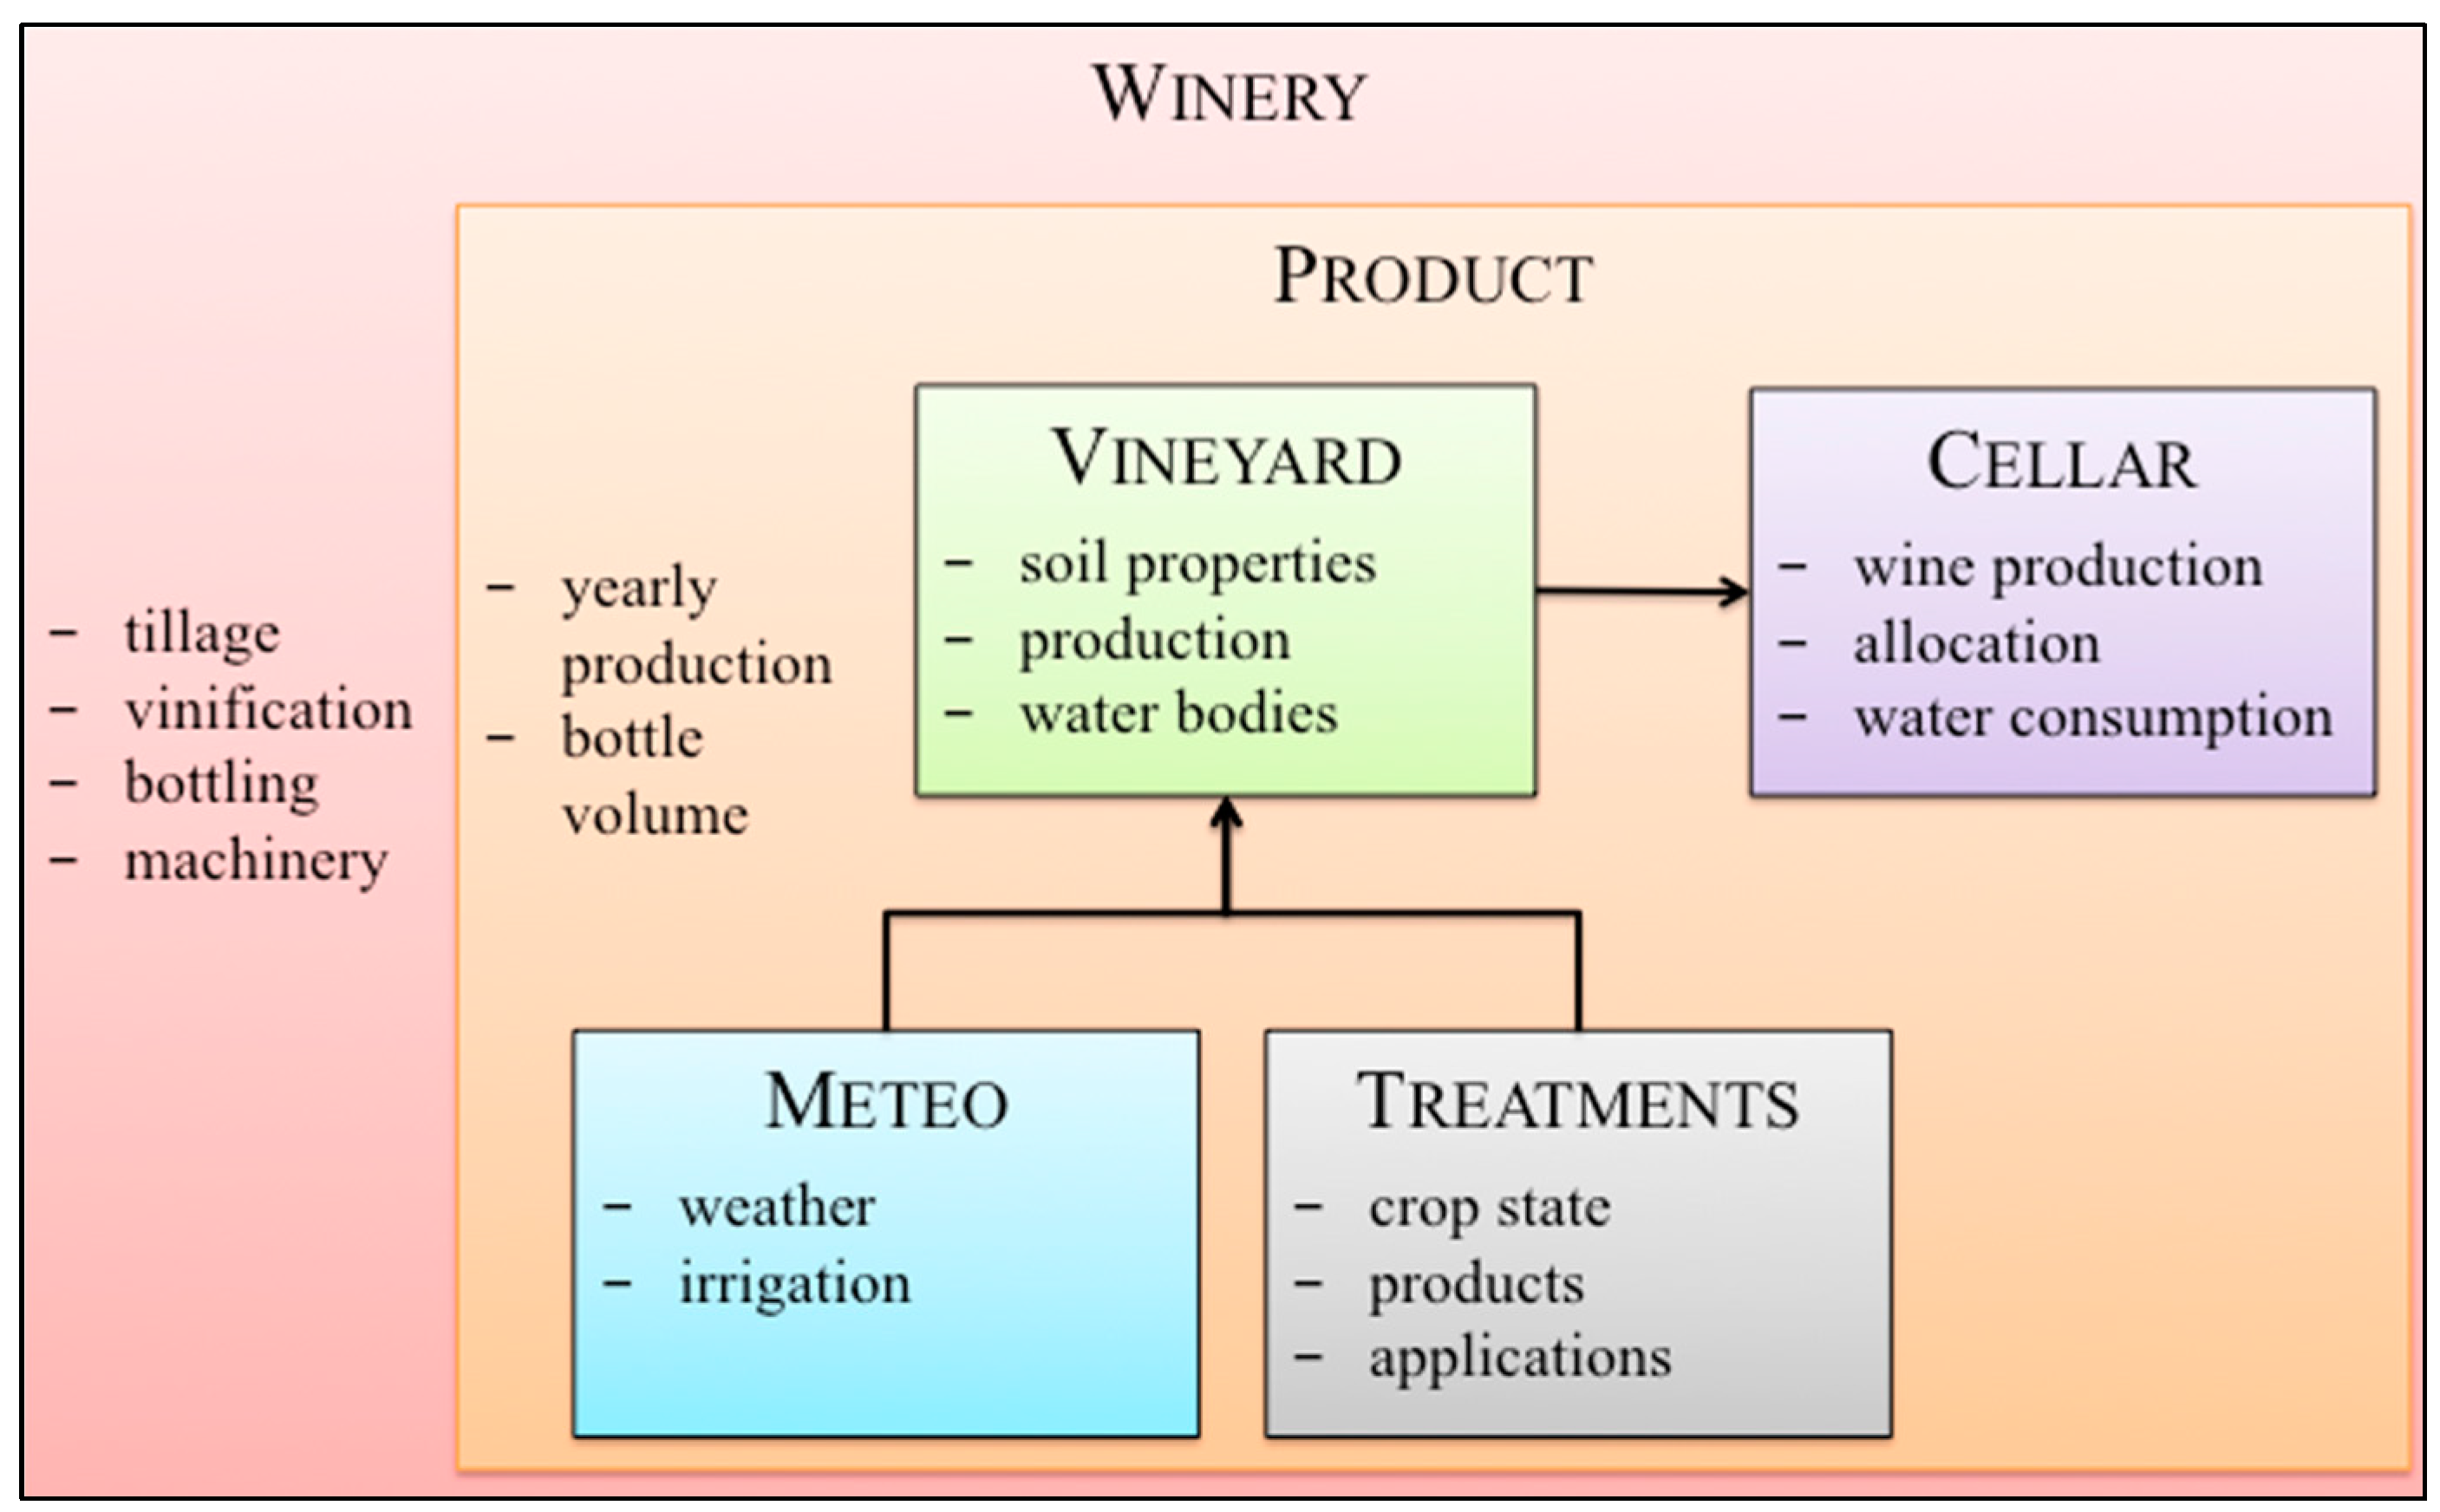
There are six steps that need to be completed to perform the calculation according to the system model (
Figure 4):
- (1)
W
inery—In this first step, general data about the winery are entered, and, in particular, the activities that are within the company boundaries: grapes production, vinification, bottling, and property of machinery and vineyards. Since the methodology was set up before the release of the Carbon Footprint of Products (CFP) and Water Footprint (WF) international standards [
19,
30], guidelines for the assessment of carbon footprint of organizations ([
42,
43,
44]) were followed. Nevertheless, the procedure was setup using a product point-of-view, for example requiring the contribution from entities other than the winery (e.g., analogue to the Scope 3 emissions for the carbon footprint of organizations) to be included as mandatory.
- (2)
Product—In this second step, general data about the product are entered. The required fields are the yearly production and the bottle volume. The former is needed for the allocation procedure, the latter to evaluate the correct water footprint per bottle.
- (3)
V
ineyard—Data entered in the third, fourth, and fifth steps are used to evaluate the
WFagr. All the vineyards that have common characteristics, in terms of meteorological conditions, soil properties, grape production, and treatments, are grouped in one territorial unit. If grapes from more than one territorial unit are used in the wine assembly, data from each one have to be entered. The quantities required are:
- −
percentage of the product obtained from the territorial unit;
- −
latitude, longitude, altitude;
- −
grape production, wine yield;
- −
surface, perimeter, slope, irrigated surface;
- −
length of side facing the water-body, distance, width, depth of the water body;
- −
aquifer depth, root depth;
- −
soil type, sand, clay, and organic content;
- −
skeleton, bulk density, field capacity, air content, porosity.
- (4)
M
eteo—Daily meteorological and irrigation data are also required to compute evapotranspiration and pollutant spread. The mandatory quantities are:
- −
precipitation;
- −
maximum and minimum air temperature;
- −
maximum and minimum relative humidity;
- −
mean and maximum wind speed at 2 m height.
Other quantities, required for the computation, might be either entered or estimated from above data:
- −
solar radiation;
- −
mean air temperature;
- −
mean humidity.
- (5)
T
reatments—Data for the application of fertilizers, pesticides, and agrochemicals are entered in a two layer procedure. An entry is created for each application, containing the following information:
- −
date, crop phenological state (BBCH);
- −
water used for dilution, water used to wash the machinery;
- −
list of territorial units treated.
For each application, data for the used product(s) is entered:
- -
dose of the product used in the treatment, nitrate content;
- −
active ingredient(s) type and quantity;
- −
runoff and drift reduction (e.g., tunnel sprayers, buffers, etc.).
- (6)
C
ellar—Data from the cellar(s) involved in the product vinification and bottling are finally entered:
- −
total wine production;
- −
percentage of the product processed in the cellar;
- −
tap and well water consumption.
A summary of the collected data for the product, the vineyards, and the cellar is reported in
Figure 4 Data-flow diagram.
Table 2 Generic data for the vineyard territorial unit are reported in
Table 3. A total of 12 applications (1 for fertilizers, and 11 for pesticides and fungicides) were made using an average dilution water volume of 0.300 m
3/ha and a washing water volume 0.1 m
3/application (
Table 4). Meteorological data were measured by a nearby (within 5 km) multifunctional station. The grapes were processed by a single cellar unit. The total tap and well water consumption associated to the vinification of 239,760 kg of grapes was 697.0 m
3.
Figure 4.
Data-flow diagram.
Figure 4.
Data-flow diagram.
Table 2.
Production overview.
Table 2.
Production overview.
| Product | Vineyard | Cellar |
|---|
| grapes | wine | surface | grape yield | wine yield | applications | irrigation | wine processed |
| (102 kg) | (102 L) | (ha) | (102 kg/ha) | (L/102 kg) | (no.) | (mm) | (102 L) |
| 67 | 40.2 | 0.67 | 100 | 60 | 12 | 0 | 1874.6 |
Table 3.
Territorial unit data.
Table 3.
Territorial unit data.
| Compartment | Quantity | Unit | Value |
| Terrain | altitude | (m) | 271 |
| slope | (%) | 5.0 |
| Water body | distance from vineyard | (m) | 1000 |
| width | (m) | 20 |
| depth | (m) | 3.0 |
| vineyard side facing water body | (m/ha) | 328.4 |
| aquifer depth | (m) | 2.5 |
| Crop | root depth | (m) | 1.5 |
| Soil | sand content | (%) | 45.0 |
| clay content | (%) | 15.0 |
| organic content | (%) | 1.5 |
| skeleton | (%) | 0.0 |
Table 4.
Application summary.
Table 4.
Application summary.
| Date | Type | Phenological State (BBCH) | Dose (kg/ha) |
|---|
| 12 March 2012 | Fertilizer | 0–8 | 2.4 |
| 02 April 2012 | Fung/Pest | 11–19 | 25.4 |
| 23 April 2012 | Fung/Pest | 11–19 | 25.0 |
| 14 May 2012 | Fung/Pest | 53–57 | 3.6 |
| 28 May 2012 | Fung/Pest | 60–69 | 3.5 |
| 18 June 2012 | Fung/Pest | 71–79 | 3.0 |
| 02 July 2012 | Fung/Pest | 71–79 | 3.5 |
| 16 July 2012 | Fung/Pest | 71–79 | 2.5 |
| 13 August 2012 | Fung/Pest | >80 | 3.5 |
| 27 August 2012 | Fung/Pest | >80 | 12.0 |
| 10 September 2012 | Fung/Pest | >80 | 1.5 |
5. Results and Discussion
The agricultural water footprint was computed allocating the water footprints (green, blue, and grey volumes) on a surface basis with respect to the total cropped surface. The winery water footprint was computed allocating each contribution on a wine volume basis with respect to the total amount processed by the cellar.
The results obtained with the reference approach ([
38,
41]) are shown per wine bottle (0.75 L) and per wine glass (0.215 L) in
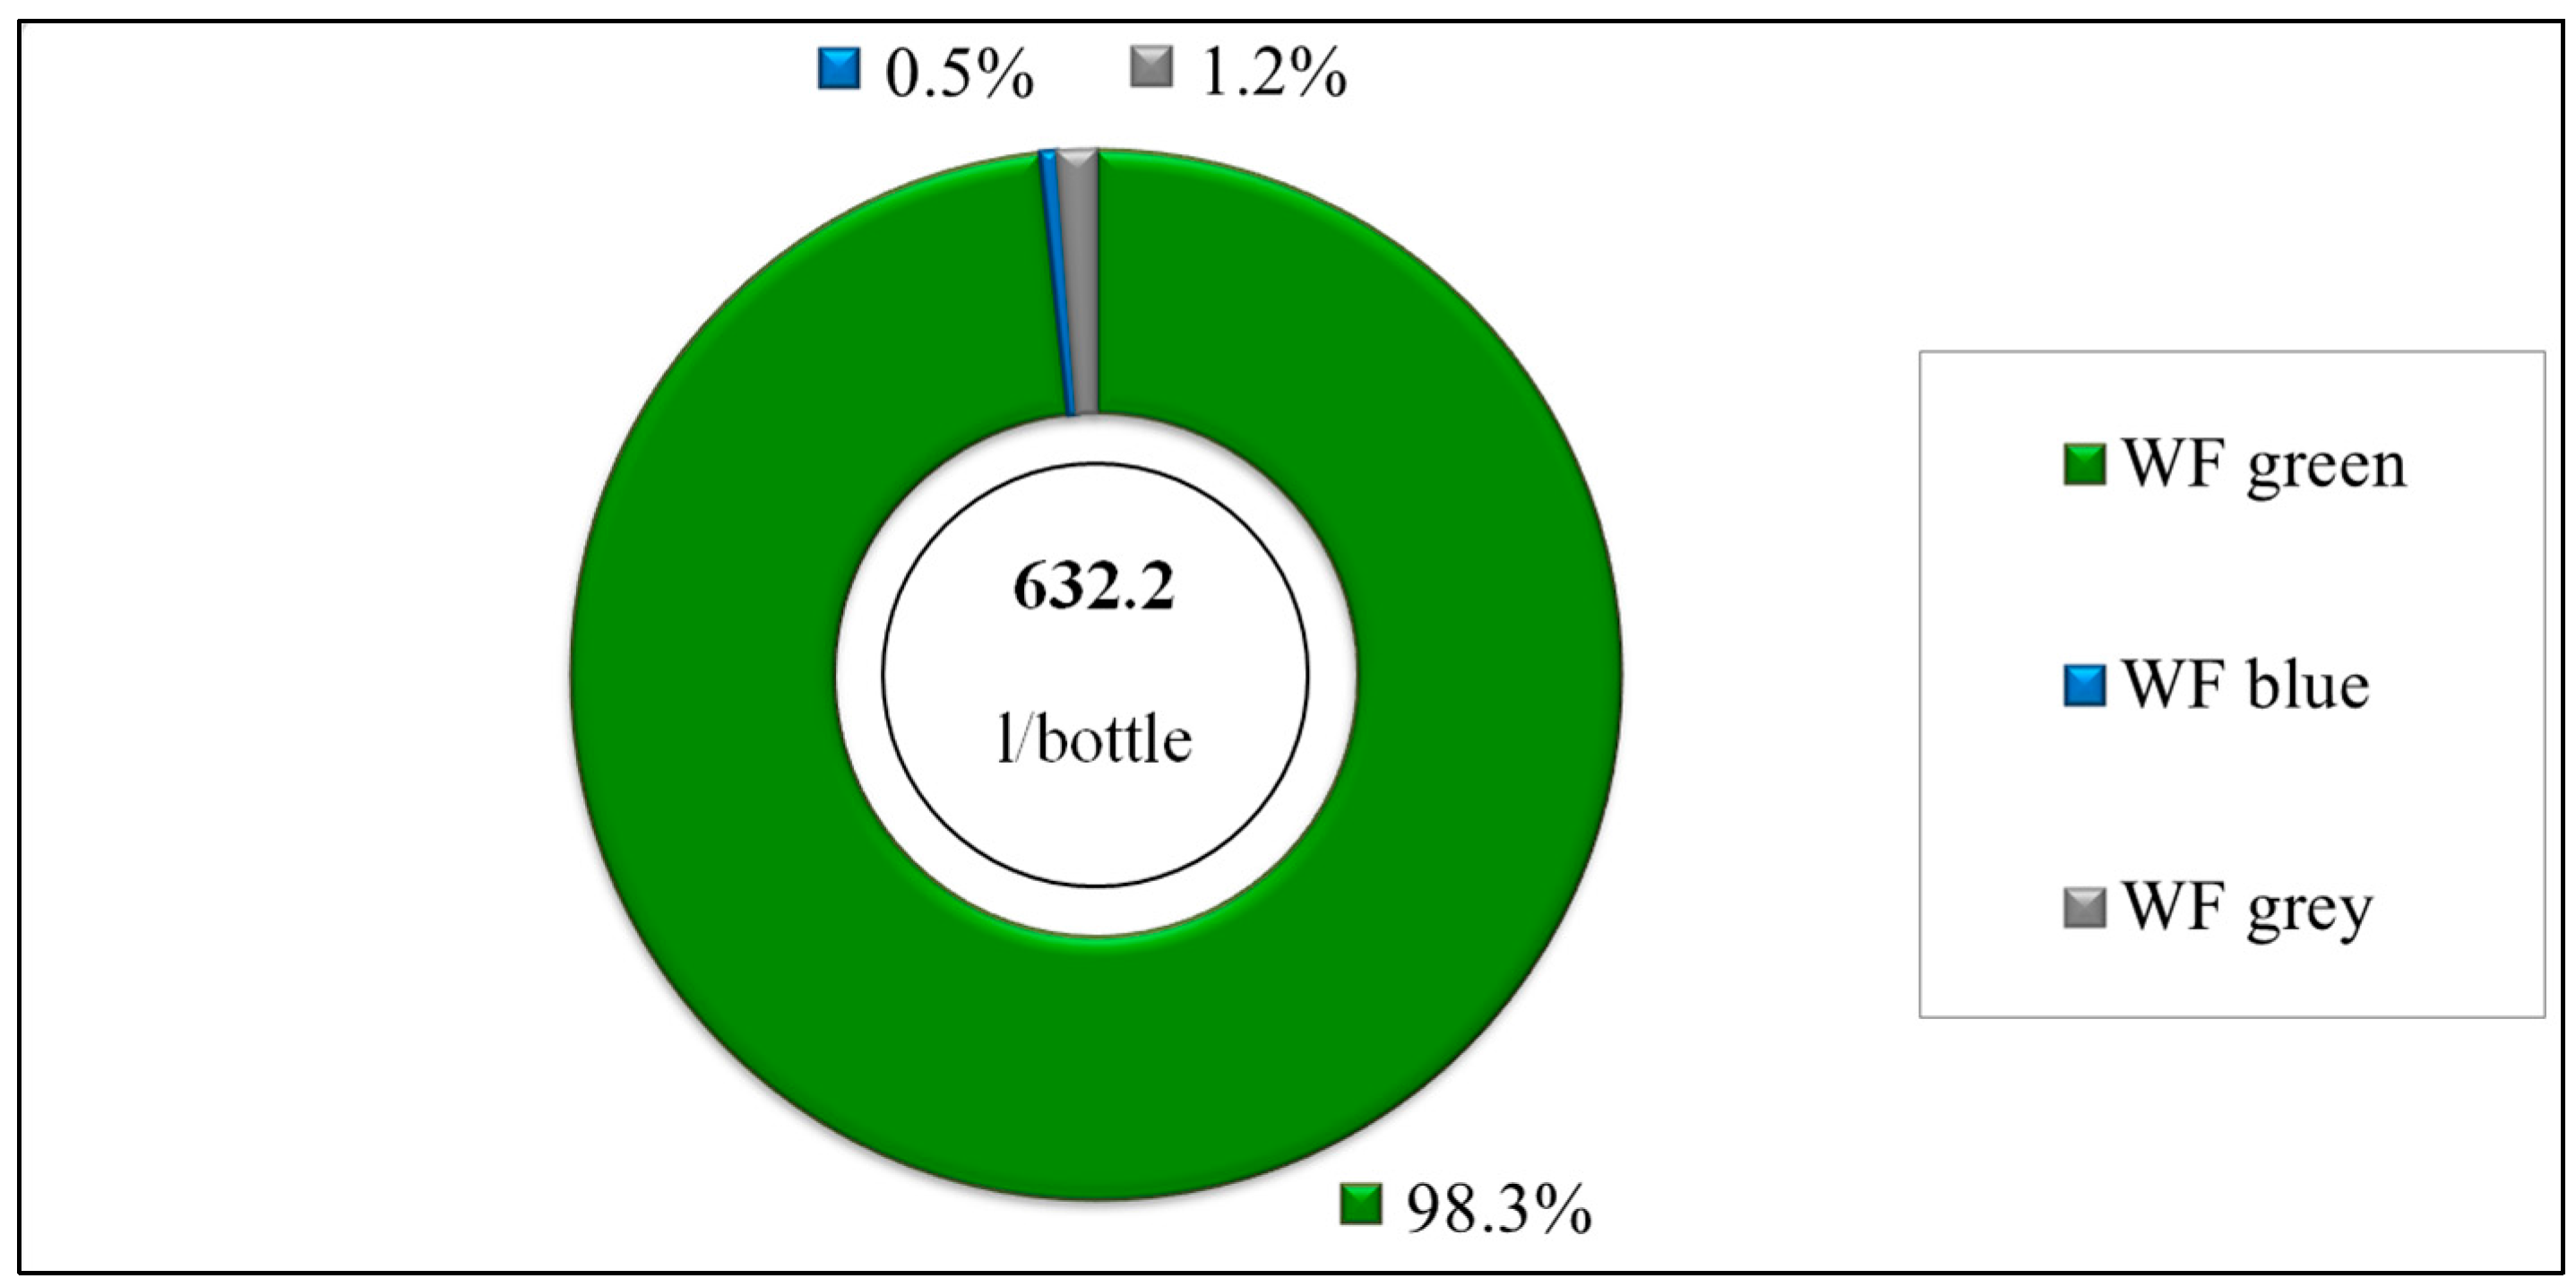
Table 5 and in
Figure 5. The total water footprint is 632.2 L/bottle, the highest impact coming from the green WF (98.3%).
Table 5.
Water footprint of a wine bottle.
Table 5.
Water footprint of a wine bottle.
| L/bottle * | L/glass ** | (%) |
|---|
| WF green | 621.4 | 178.1 | 98.3 |
| WF blue | 3.425 | 0.982 | 0.5 |
| WF grey | 7.358 | 2.109 | 1.2 |
| WF tot | 632.2 | 181.23 | 100 |
Figure 5.
Water Footprint of a wine bottle.
Figure 5.
Water Footprint of a wine bottle.
Results were compared to other Italian products analyzed with the same methodology [
38].
Figure 6 shows the water footprint of the product compared with three other red wines and seven white wines. Details about these wines can be found in the dedicated online database [
45,
46]. The water footprint of the product under examination is close to the overall average (654.2 L/bottle) and lower than the average computed for red wines only (769.1 L/bottle). This result can be interpreted as the effect of a reduced use of treatments and the absence of irrigation, due to favorable local weather conditions.
It can be also noticed that the green WF always represents the largest contribution to the total water footprint, with a share ranging approximately from 85% to 99%. The WFgreen is not dependent on the particular tillage techniques or treatments applications, but rather on the meteorological conditions, soil properties, and crop type.
The two most impacting contribution to the environmental footprint are produced by blue and grey water (
Figure 7): the former is the freshwater volume withdrawn from surface and ground reservoirs and hence directly contributing to water scarcity, the latter is the virtual water needed to dilute pollutants and hence directly responsible for water degradation. The total water footprint considering these two contributions only is 10.78 L/bottle, of which 31.8% and 68.2% due to blue and grey water, respectively. The
WFgrey is almost entirely produced by the application of copper oxychloride as fungicide.
Figure 6.
Water Footprint: Comparison with other products. Note: The black line shows the average value.
Figure 6.
Water Footprint: Comparison with other products. Note: The black line shows the average value.
Figure 7.
Water Footprint: Comparison of WFblue and WFgrey with other products.
Figure 7.
Water Footprint: Comparison of WFblue and WFgrey with other products.
Figure 8.
Water Footprint: Comparison between the product and the world average [
39].
Figure 8.
Water Footprint: Comparison between the product and the world average [
39].
The comparison between the product under examination and the world average using the Water Footprint Assessment methodology [
39,
47] is shown in
Figure 8. The product shows an overall value that is very close to the world average (651.8 L/bottle), however the shares of green, blue, and grey components are different. Most of this difference is attributable to the peculiar meteorological conditions and tillage techniques rather than to the different accounting procedure itself. The product, in fact, is subject to strict limitations in order to achieve the PDO label, including the prohibition to use irrigation and limitations in the use of fertilizers and agrochemicals. As a result, since the wine yield, 60 hl/ha, is smaller than the reference value (approx. 100 hl/ha), a higher green water per wine unit volume is required. On the other hand, because the blue and grey water footprints are considerably lower than the global average, the total water footprint of the product is approx. 3% smaller.
The Grey Water Footprint Component
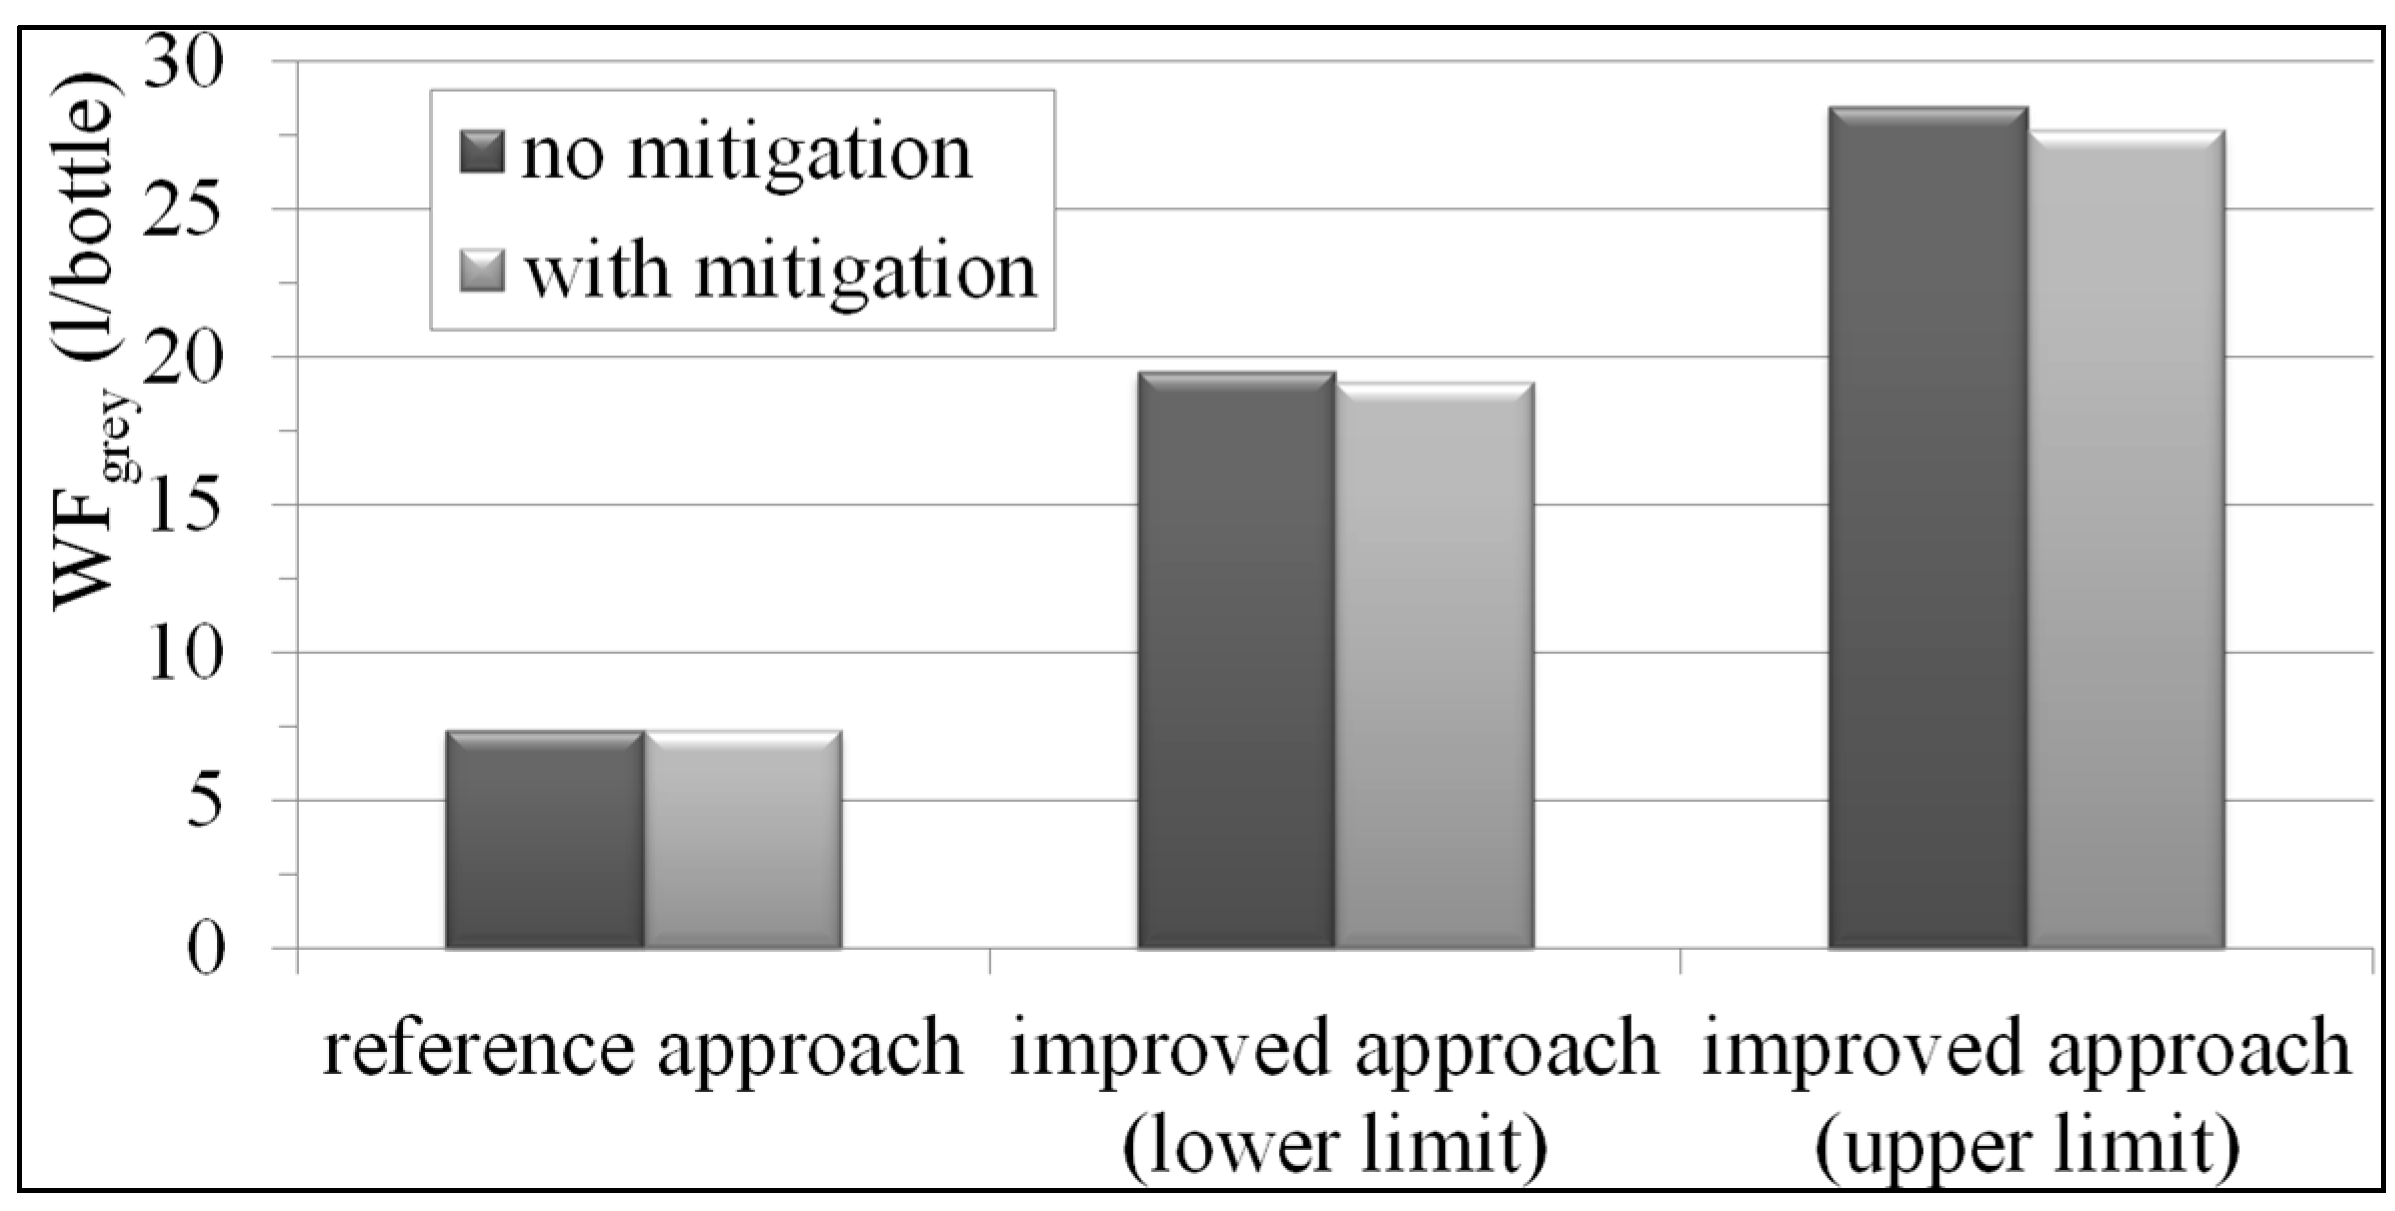
The comparison with the
WFgrey obtained with the improved methodology is shown in
Figure 9. Two values are computed for each methodology, without and with the estimation of
WFgrey reduction produced by the use of mitigation techniques (e.g., precision sprayers, presence of bushes between lines,
etc.). As a function of the particular technique(s), a mitigation factor is used for the drift (up to 90% in case of tunnel sprayers) and runoff (up to 50% in case vineyard rows are according to the level curves and perennial cover crops are present) contamination according to [
38].
Detailed results are reported in
Table 6. The improved methodology shows an increase in the total WF between +1.80% and +3.34%, caused by a sensible increase of the WF
grey component, between +160% and +287%, respectively.
Unlike the reference methodology, the improved methodology produces different results if mitigation techniques are considered or not. This is because in the reference approach the maximum volume of grey water is associated to copper-oxychloride leaching, and the leaching component is not affected by mitigation techniques. On the other hand, the improved approach takes into account the sum of the three contamination pathways, and it is sensible to the reduction of the drift and runoff component associates to mitigation.
Figure 9.
WFgrey: Comparison between reference and improved methodologies.
Figure 9.
WFgrey: Comparison between reference and improved methodologies.
Table 6.
Detailed results of reference vs improved methodologies.
Table 6.
Detailed results of reference vs improved methodologies.
| Impact | Reference Approach | Improved Approach |
|---|
| Without Mitigation | With Mitigation |
|---|
| Lower Limit | Upper Limit | Lower Limit | Upper Limit |
|---|
| WFgrey | 7.36 L/bottle | 1.16% | 19.48 L/bottle | 3.02% | 28.47 L/bottle | 4.36% | 19.15 L/bottle | 2.97% | 27.65 L/bottle | 4.24% |
| WFtot | 632.2 L/bottle | 100% | 644.3 L/bottle | 100% | 653.3 L/bottle | 100% | 644.0 L/bottle | 100% | 652.5 L/bottle | 100% |
6. Conclusions
An original methodology for the evaluation of the water footprint of a product, dedicated to the wine industry, was elaborated and applied to a study case. The newly-released international standard ISO 14046 was followed to create the analysis framework. The assessment procedure is focused on the evaluation of all the water volumes affected by the process of wine production considering a 0.75 L wine bottle as functional unit. A user-friendly in-house software (V.I.V.A.) was elaborated to perform the calculation with a guided procedure and to help the user to gather and to correctly use all the required input data. The software is structured to include all the contributions in a cradle-to-grave perspective, however, at this stage, production of input materials and end-of-life are not assessed. The impact category is a mid-point indicator: water volumes withdrawn from ground (blue water footprint), rainwater (green water footprint), and needed to dilute pollutants (grey water footprint), are evaluated and summed together in order to produce the total water footprint.
An analytic step-by-step methodology was setup in order to compute the quantity of water evapotranspirated by the crop (green water), and needed to dilute pollutants which are spread via runoff, leaching, and drift, as a function of input meteorological data, soil properties, and treatments (grey water). The green water footprint is computed following the guidelines of the FAO irrigation and drainage manual, adapted to the specific scenario. The grey water footprint is computed considering legal and no-observed-effect-concentration limits for applied pollutants. The blue water footprint is given by the direct sum of surface or ground freshwater consumed during the process. Contributions from all vineyards producing grapes used in the product assembly were considered.
The final result is obtained with an allocation procedure based on the cropped surface (considering only the grapevines used in the product assembly) and on the total amount of wine processed in the cellar. The study shows that the water footprint of a 0.75 L wine bottle is 632.2 L. The green water footprint is the dominant contribution (98.3%), while grey and blue water footprints account for 1.2% and 0.5%, respectively.
An improved methodology was also proposed for the evaluation of the grey water footprint. The improved methodology was elaborated to guarantee the completeness of water footprint results in the case of multiple processes insisting on the same catchment basin. The total water footprint is in the range 644.0 L/bottle to 653.3 L/bottle (+1.8% to +3.3% compared to the reference approach, respectively). The grey component shows an increase between +160% and +287%. The improved approach produces more conservative estimates of the water footprint associated to the process and it is considered to be more accurate, from a global point of view, than the reference scenario. It has to be stressed that the product under examination, especially because of the small amount of fertilizers and agrochemicals used, features a small share of the grey component with respect to the total WF. As a future development of this work, it will be particularly interesting to test the improved approach against other products with different characteristics, in order to monitor how the grey water footprint is affected.


