
Urban Growth and Rural Transition in China Based on DMSP/OLS Nighttime Light Data

Key Laboratory of Land Surface Pattern and Simulation, Institute of Geographic Sciences and Natural Resources Research, Chinese Academy of Sciences, 11A Datun Road, Beijing 100101, China
Sustainability 2015, 7(7), 8768-8781; https://doi.org/10.3390/su7078768
Submission received: 8 May 2015
/
Revised: 25 June 2015
/
Accepted: 30 June 2015
/
Published: 6 July 2015
Abstract
:Nighttime light (NTL) images provide uniform, consistent, and valuable data sources. Based on four reference regions, the NTL imagery of China was fully intercalibrated during the period 1992–2012. Using lit areas and the intensity of NTL imagery, this study synthetically analyzed the urbanization process and rural transition in China. The results showed that, over the whole country, the pixel numbers of urban areas increased by 173% from 1992 to 2012. During the 2000s, urban areas expanded much more quickly than during the 1990s. Urban growth varied greatly across the four regions, which could be pictured using the flying-geese paradigm. In the 1990s, East China experienced the most rapid rate of growth, while a decade later Middle China had the highest growth rate. NTL imagery can also be used to describe changes in rural human activities if the imagery is corrected using completely dark rural pixels. In China, because of the massive rural-urban migration, some marginal regions experienced a decrease in nighttime light intensity (NTLI) and rural areas went through a period of transition.
1. Introduction
The world is becoming an urbanized society; at present, around 54% of the world’s population lives in urban areas. Projections show that another 2.5 billion people will be added to urban populations by 2050, with about 90% of the increase concentrated in Asia and Africa [1]. A large proportion of the new population has migrated from rural areas [2]; the proportion approaches 40%–50%, according to a survey by the United Nations of 29 developing countries [3]. The massive rural-urban migration may cause a recession in rural human activities and rural socio-economic transitions [4,5,6].
To picture the distribution and changes in human activities, various data and methods have been adopted [7], such as using remote sensing to map urban spatial extent, and using censuses, and socio-economic or investigation data to describe the temporal-spatial differences of rural-urban migration [8,9,10]. The Defense Meteorological Satellite Program (DMSP) and Operational Linescan System (OLS) have provided uniform and valuable data sources [11], which have been widely used for investigating urban growth [12,13,14,15,16,17], economic development [12,13,14,15,18], energy consumption [19,20], population density [21], and urban transition [22]. The DMSP/OLS data covered an extended period from 1992 to the present [23]; this made possible the continuous identification of human activities in urban areas.
China has been experiencing rapid urbanization created by history’s largest flow of rural-urban migration in the world [10]. From 1990 to 2010, the urban population increased from 0.30 billion to 0.71 billion, while the rural population decreased from 0.85 billion to 0.64 billion [24]. Internal migration maintained its pattern of strongly favoring major coastal regions, and to a lesser degree, the far west [24]. In contrast, a number of inland provinces, notably Sichuan and Chongqing, recorded actual population decline in the 2000s [25]. The massive migration of population, especially migration from rural to urban areas, has been part and parcel of the tremendous economic and social transformation over the past two decades [5]. Thus, accurate knowledge of the size and spatial distribution of the urban population has been useful for understanding many social and political processes and phenomena [26]. However, in China, it is very difficult to obtain consistent and comparable population data, due to changes in statistical criteria. Recently, some authors have used DMSP/OLS data to delineate urban dynamics in China [27,28,29,30], since the data is consistent and comparable. Ma et al. (2012) quantified the long-term relationships between weighted lit areas and population, gross domestic product (GDP), built-up areas, and electric power consumption in China [29]. Ma et al. (2014) subsequently examined the regional differences in urban impervious surface growth in China from 1992 to 2009 [28].
As mentioned above, previous studies have proved that nighttime light imagery provides valuable data for picturing the extent of human settlements and city size [26]. However, most of these studies mainly use lit areas of nighttime light (NTL) imagery to estimate urban growth, and the NTLI is often ignored.
As an accompaniment to the rapid urbanization in many countries, rural areas may undergo a recession in human activities, due to massive migration to urban areas [31]. Few existing studies, however, use DMSP/OLS data to measure the changes in NILI (nighttime light intensity) in rural areas. Therefore this study focused on the process of urban growth, and the decrease in NILI in rural areas of China by synthetically using lit areas and the NTLI of imagery. The same method can be used to rapidly picture changes in urban and rural development in other developing countries that are also experiencing urbanization and a decrease in rural human activities.
2. Data and Methods
2.1. Land Use and NTL Data Sources
In this study, land-use data with a spatial resolution of 30 m in 2000, was interpreted from the Landsat Thematic Mapper (TM) remotely sensed data, which was provided by the Resources and Environment Data Center of the Chinese Academy of Science (EDC-CAS). These data were produced through visual interpretation of Landsat TM images. The random sample check showed that average interpretation accuracy for land-use/land-cover was more than 92% [32].
The NTL data from 1992 to 2012, with 30 arc second grids in the Version 4 DMSP-OLS nighttime light time series dataset, were downloaded from the NGDC [33]; the data were acquired by six DMSP satellites: F10, F12, F14, F15, F16, and F18. A number of constraints were used to select the highest quality data for entry into the composites. For instance, sunlit and moonlit data, and lighting features from the aurora were excluded. In addition, observations that included clouds were excluded.
2.2. Intercalibration
The OLS had no on-board calibration. To reduce the differences between sensors and improve comparability of the NTL data for different years, the individual composites had to be cross-calibrated carefully via an empirical procedure [23,34,35]. In the existing literature, the NTL data were often intercalibrated using the method of Elvidge et al. [35] by applying the second order regression model in Equation (1):
where DNadjusted is the adjusted DN and C0, C1 and C2 are coefficients.
The NTLI was coded in a grid format as six-bit digital number (DN) values which range from 0 to 63. Because the data from satellite year F12 in 1997 had medium digital values in China, this year was used as the reference, and the data from all other satellite years were adjusted to match the F12 1997 data range using Equation (1).
In the existing literature, there are several methods for selecting reference pixels (“no change” areas) for convenient use of the intercalibration model. Many studies use urban areas with stable nighttime lights as reference regions [34,36], because the DMSP images in these areas have signal saturation. In addition, some small cities with very low rates of urban growth were also selected as reference regions, such as Jixi city in the Heilongjiang provinces of Northeast China [27]. Lastly, because one of the aims of this study was to picture rural transition, the reference pixels needed to contain a full range of DN values, from completely dark rural pixels to fully saturated urban ones, which were lit at a constant brightness throughout the period [34].
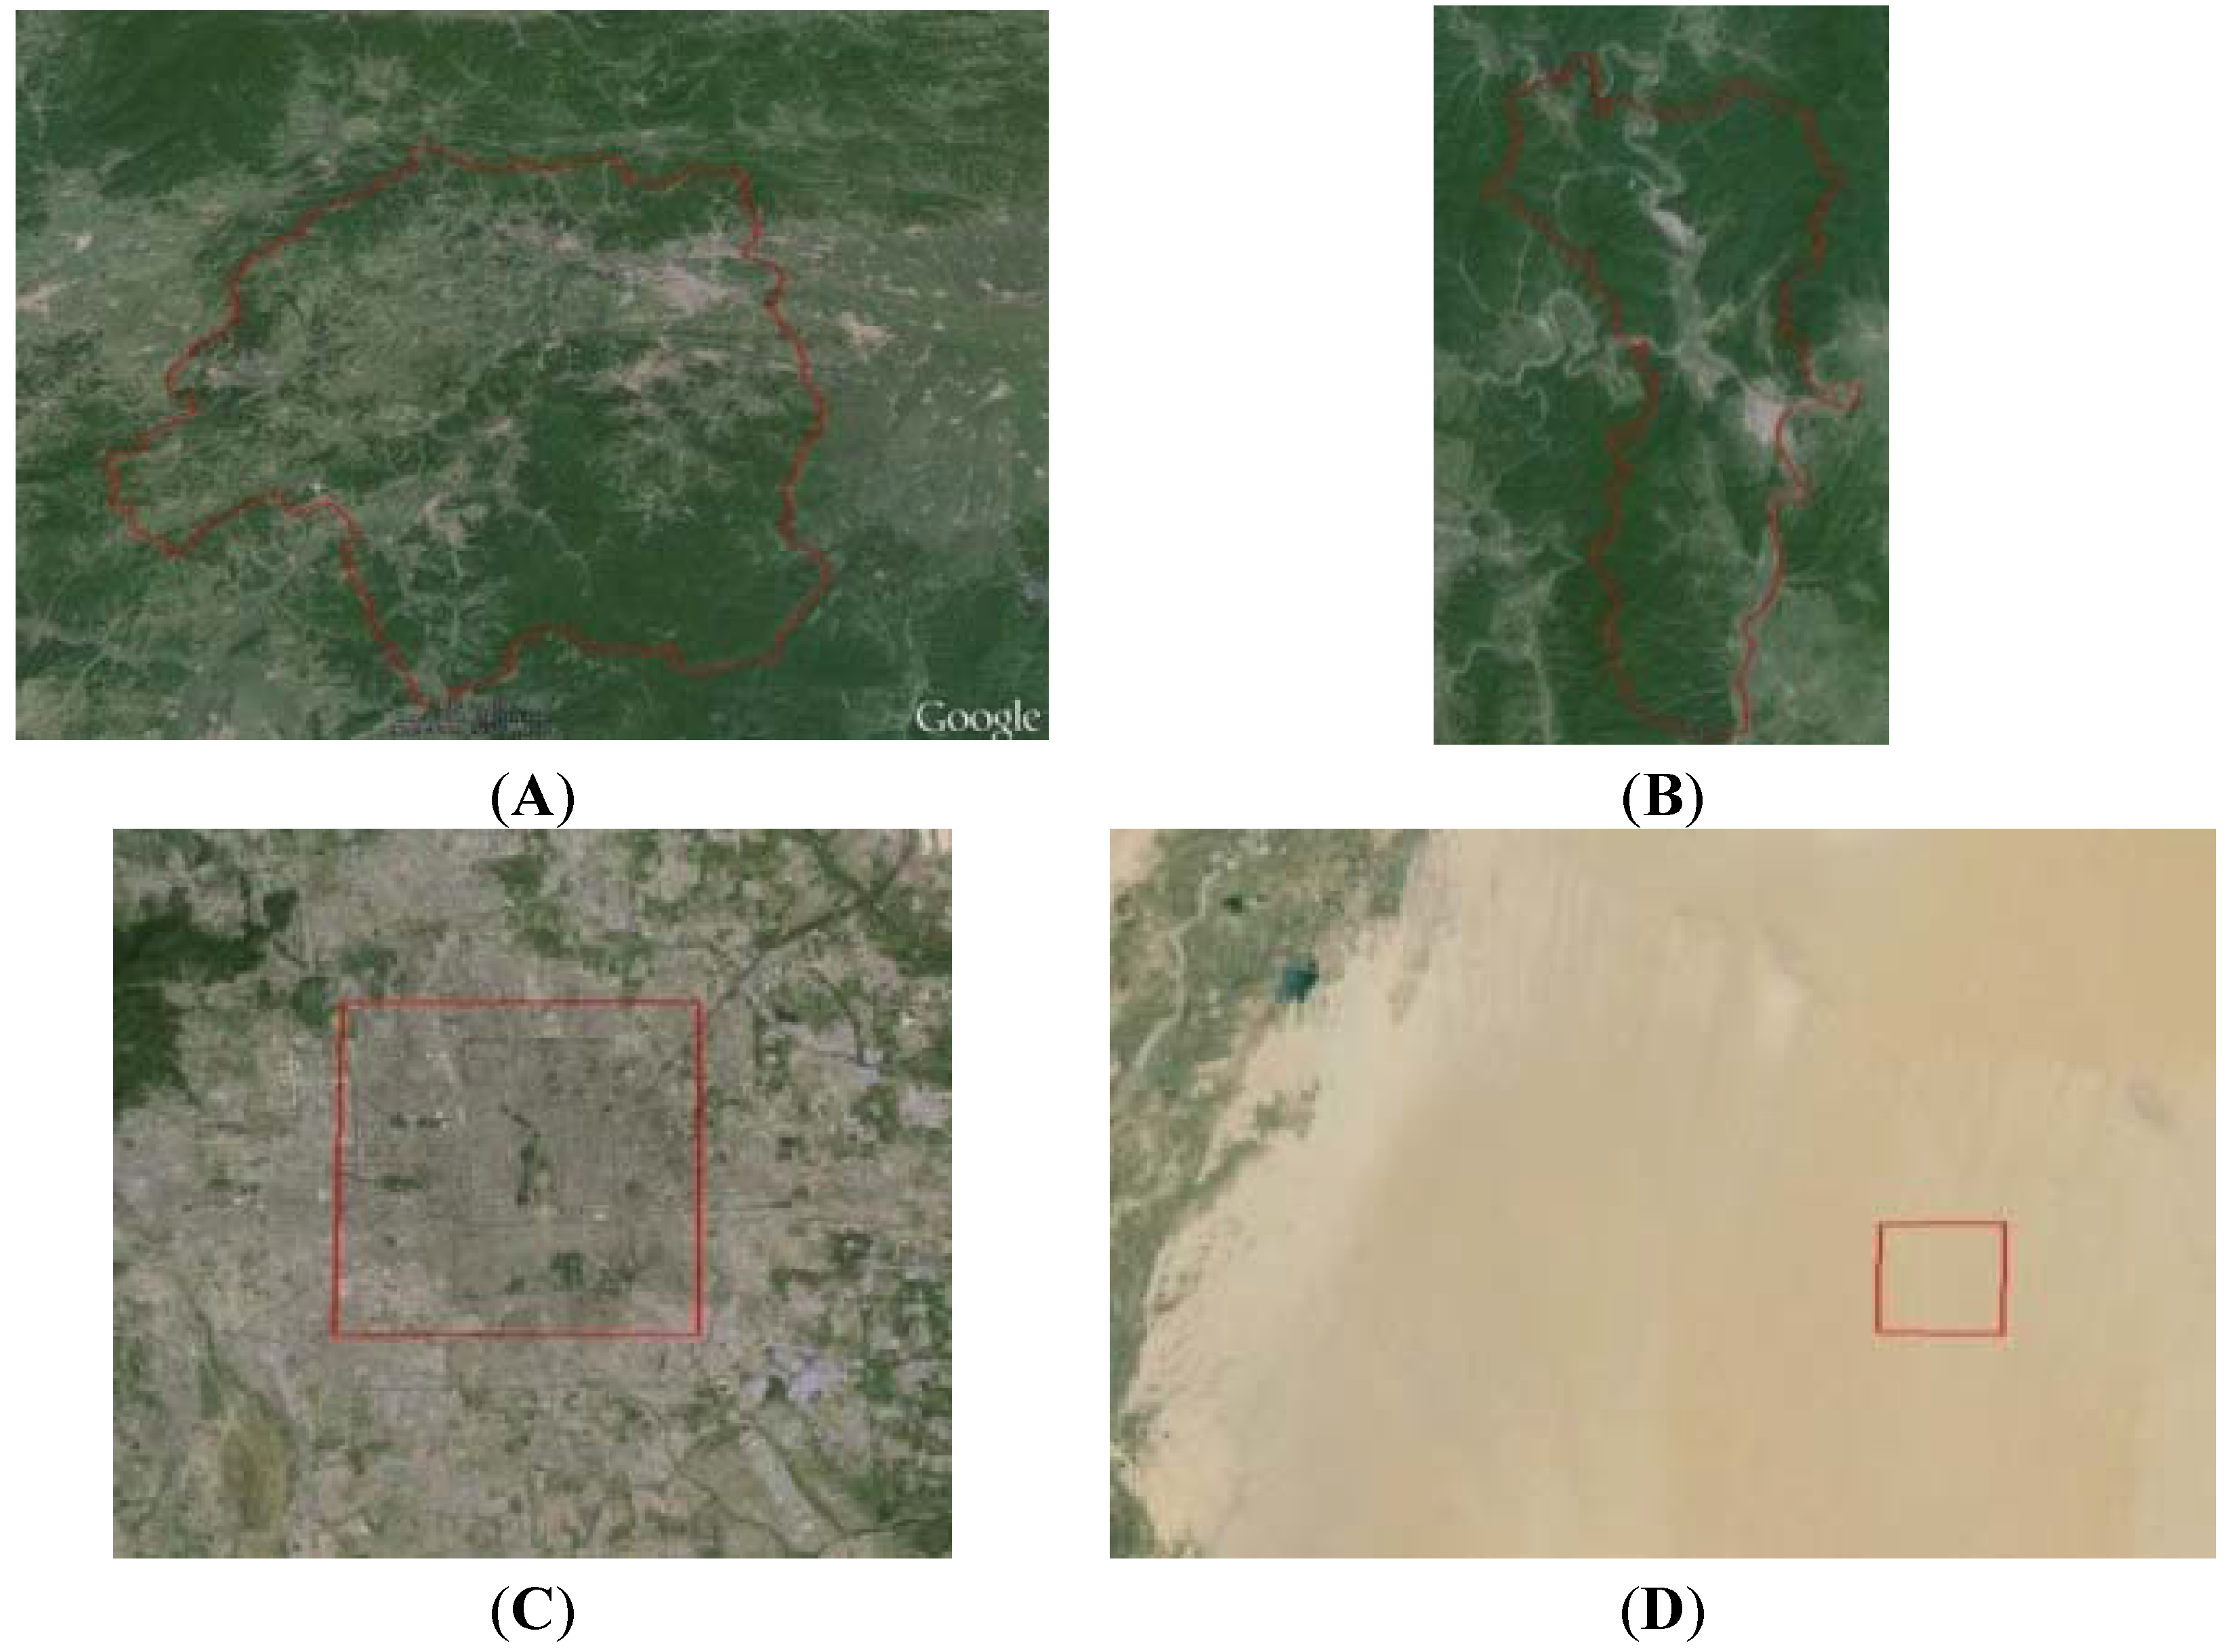
Thus, the following four reference regions were selected which represented the three kinds of reference pixels. First, the central part of Beijing represented urban areas with signal saturation. Second, Jixi and Tumen, two medium-size cities in Heilongjiang province that developed very slowly over the last two decades [27], were regarded as stable regions with a very low urban growth rate (Figure 1 and Figure 2). Third, an area in the Taklimakan desert of Xinjiang was selected as a completely dark rural region, in which there was no human activity (Figure 1 and Figure 2D). In addition, according to the regression method, the outliers (the pixels with a change rate of over 50%) were viewed as suspected changed pixels and were discarded [34,36]. Therefore, using the F12 from 1997 as a reference image, a second order regression model was developed for each satellite year to calculate C0, C1 and C2 coefficients in Equation (1) (Table 1).
Figure 1.
Regional division and administrative boundaries in China. Mainland China is commonly divided into four regions: East China, Middle China, West China, and Northeast China. In China, East China is the most developed region, and some large cities are located in this region, such as Beijing, Shanghai, Guangzhou, Shenzhen, Tianjin, Qingdao, and Nanjing.


| Satellite | Year | C0 | C1 | C2 | R2 |
|---|---|---|---|---|---|
| F10 | 1992 | −0.1468 | 1.1493 | −0.0023 | 0.9783 |
| F10 | 1993 | −0.8466 | 1.4270 | −0.0065 | 0.9877 |
| F10 | 1994 | −0.6505 | 1.3473 | −0.0053 | 0.9882 |
| F12 | 1995 | 0.3861 | 1.0602 | −0.0010 | 0.9906 |
| F12 | 1996 | 0.0963 | 1.0813 | −0.0013 | 0.9924 |
| F12 | 1997 | - | - | - | - |
| F12 | 1998 | 0.6539 | 0.8154 | 0.0027 | 0.9954 |
| F12 | 1999 | 0.6538 | 0.9853 | 0.0000 | 0.9881 |
| F14 | 2000 | 1.1476 | 1.0250 | −0.0006 | 0.9892 |
| F14 | 2001 | 0.7473 | 1.1726 | −0.0030 | 0.9828 |
| F14 | 2002 | 0.8743 | 1.2963 | −0.0051 | 0.9879 |
| F14 | 2003 | 0.8958 | 1.5372 | −0.0089 | 0.9771 |
| F14 | 2004 | 0.7628 | 1.4563 | −0.0075 | 0.9923 |
| F15 | 2005 | 0.4330 | 1.4564 | −0.0074 | 0.9838 |
| F15 | 2006 | 1.3578 | 1.3234 | −0.0056 | 0.9727 |
| F16 | 2007 | 1.8094 | 1.0031 | −0.0007 | 0.9684 |
| F16 | 2008 | 1.4156 | 0.9678 | 0.0000 | 0.9850 |
| F16 | 2009 | 2.5110 | 0.5976 | 0.0055 | 0.9756 |
| F18 | 2010 | 2.2363 | 0.3625 | 0.0090 | 0.9674 |
| F18 | 2011 | 1.8494 | 0.6240 | 0.0051 | 0.9690 |
| F18 | 2012 | 2.8175 | 0.3409 | 0.0090 | 0.9523 |
Figure 2.
Four reference regions of China for the intercalibration model. (A) Jixi city in Heilongjiang province in Northeast China; (B) Tumen city in Heilongjiang province in Northeast China; (C) Beijing city center; (D) Taklimakan desert in Xinjiang.
Figure 2.
Four reference regions of China for the intercalibration model. (A) Jixi city in Heilongjiang province in Northeast China; (B) Tumen city in Heilongjiang province in Northeast China; (C) Beijing city center; (D) Taklimakan desert in Xinjiang.

2.3. Method for Extraction of Urban Areas for Different Tier Cities
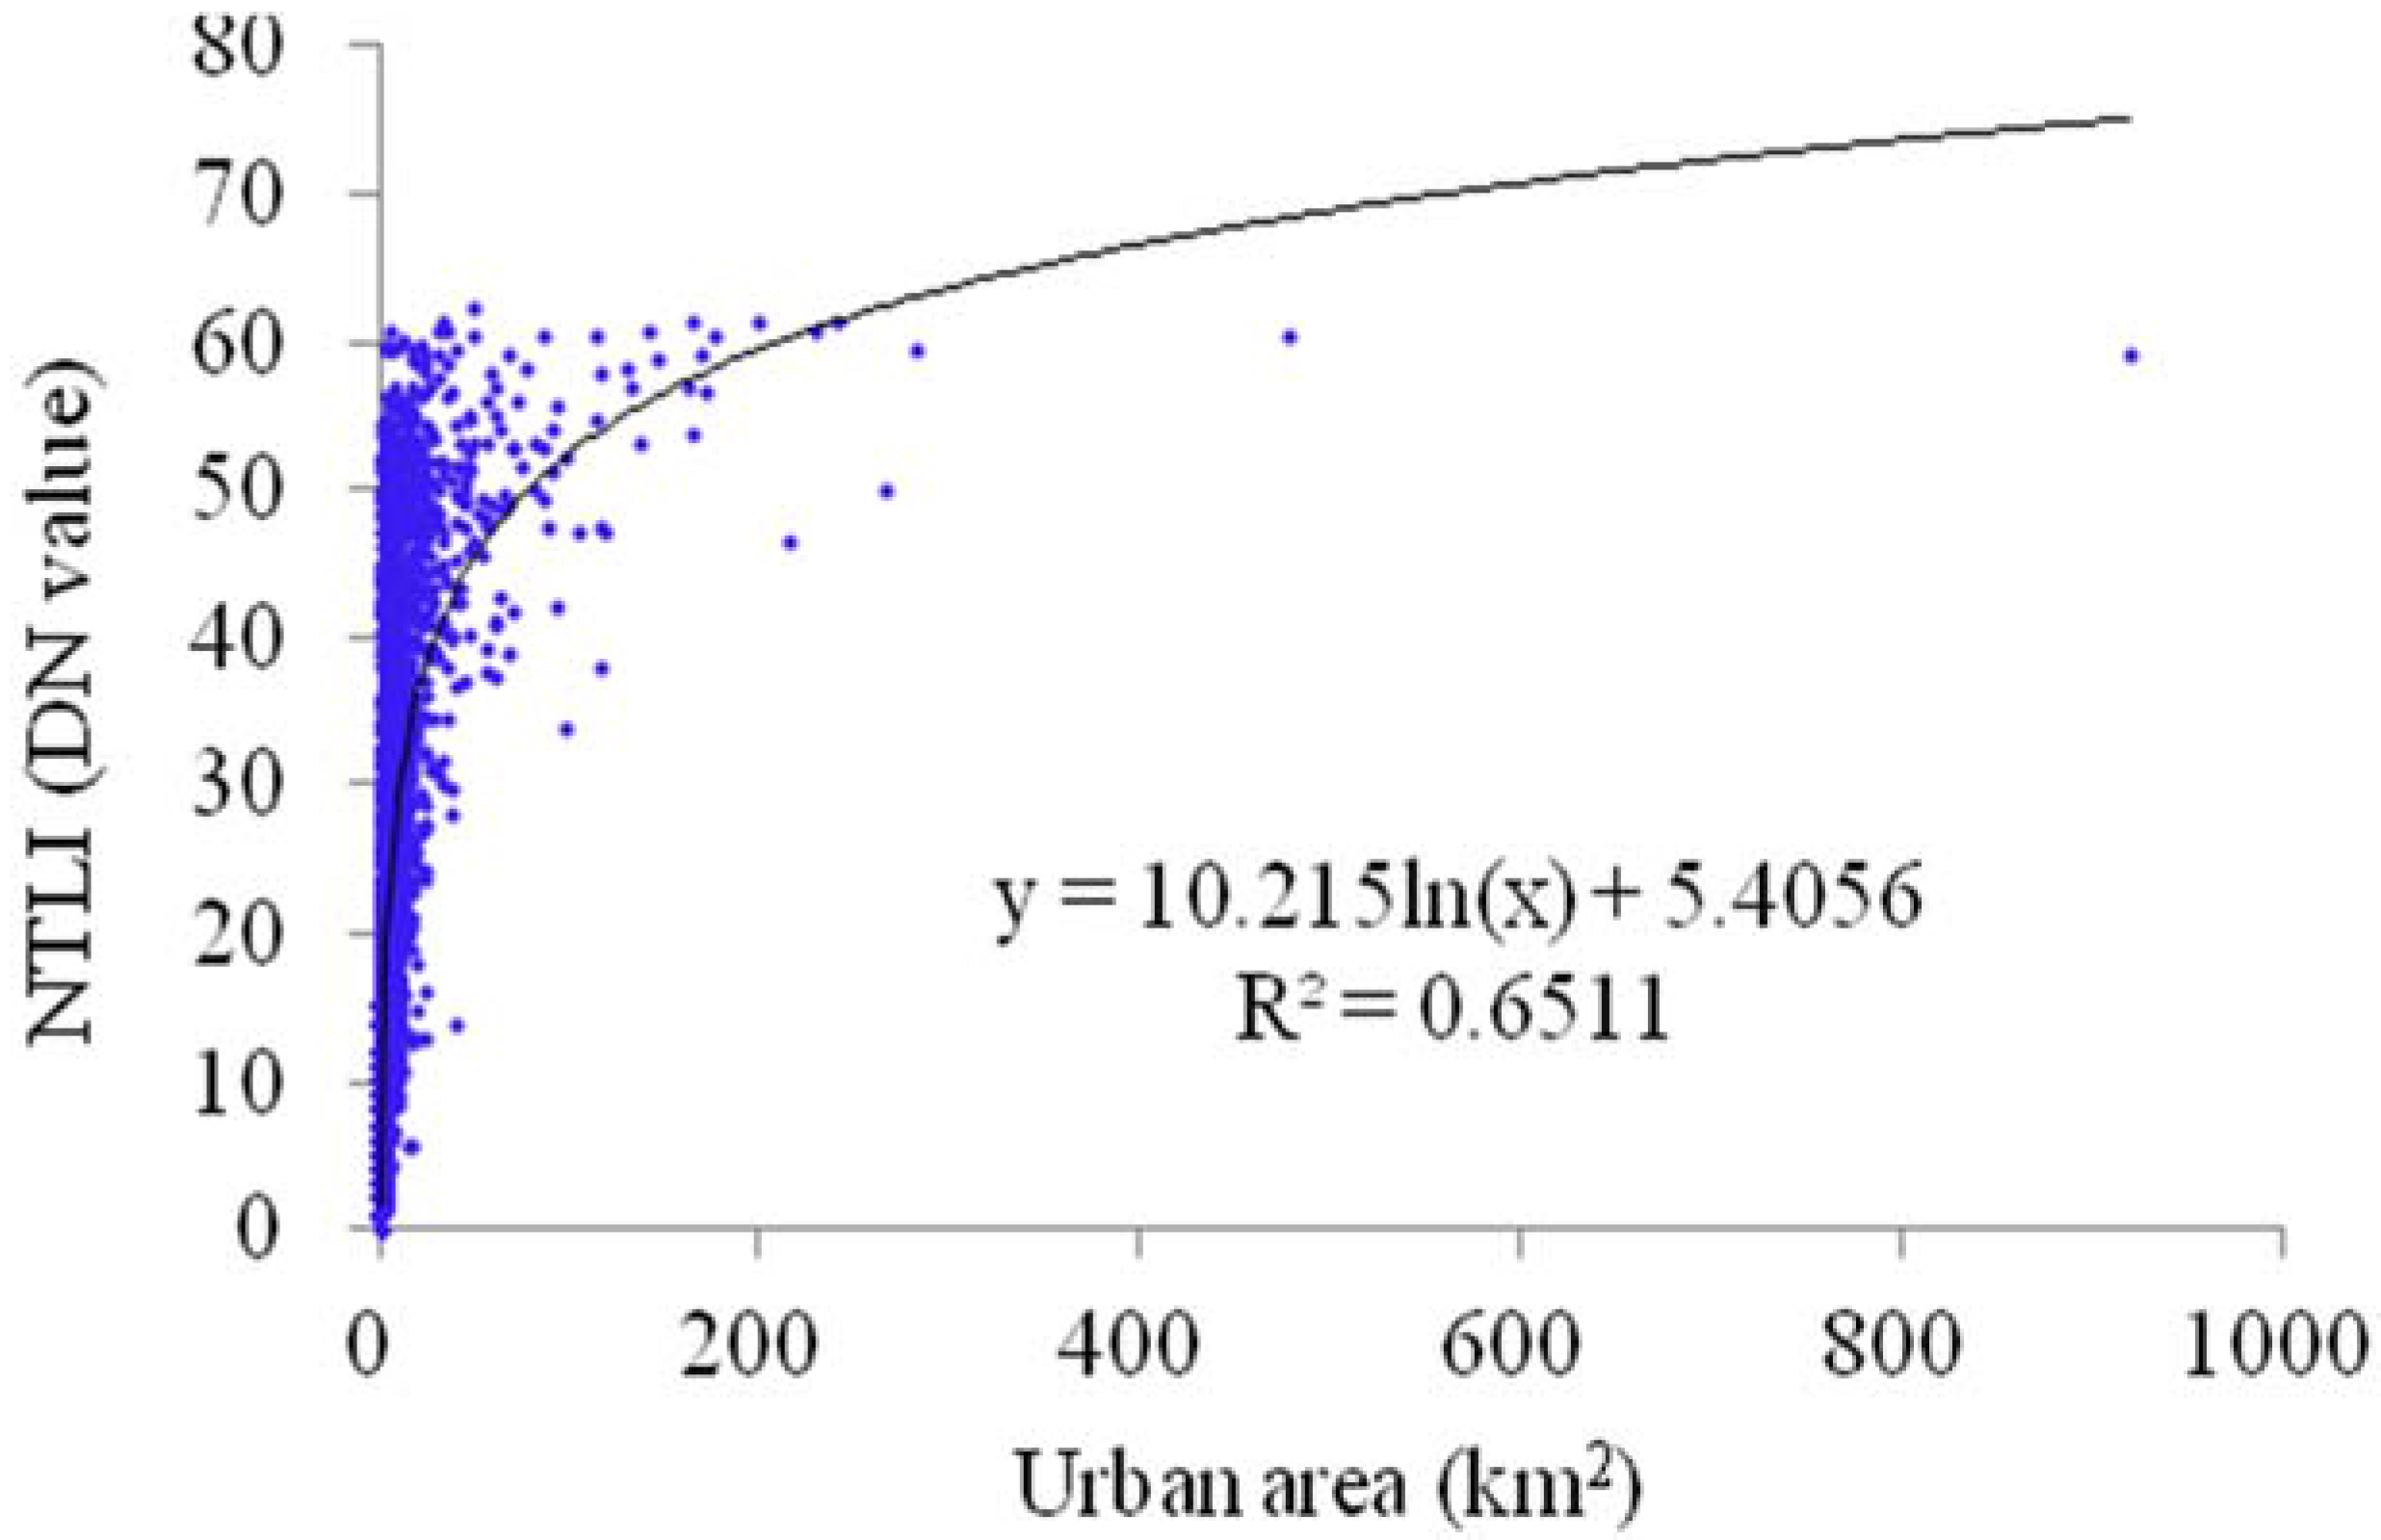
There is a close relationship between city size and NTLI [30]. To examine the relationship, this study overlaid the urban land use map and the nighttime light image of 2000. The urban land use map was interpreted from TM images. In this way, the average DN value for each city was regarded as its NTLI and obtained through ArcGIS software provided by Environmental Systems Research Institute of the United States. NTLI can be calculated using Equation (2):
Here, Intensityi is the NTLI of city i. Pixelin is the value of DN of the nth pixel of city i. Thus, by analyzing the relationship between city size and the corresponding NTLI in China, the urban area for different sized cities can be extracted from NTL imagery.
In addition, a logarithm function is used to describe the relationship between city size and the corresponding NTLI, since the relationship is nonlinear and is best described by this function [23].
3. Results and Discussion
3.1. Growth of Urban Areas with Different DN Values
Using Equation (2), NTLI of each city was calculated for the year 2000. The relationship between city size and the corresponding NTLI in China could be described by a logarithm function and R2 was about 0.65 (Figure 3). With an increasing size of urban built-up area, the NTLI value increased. On the basis of this relationship, lit areas can be divided into three classifications (Table 2): urban area, transition zone, and remote rural area. In this study, the term “remote rural areas” referred to those areas with a DN value under 4, as this threshold value will exclude most large rural settlements. In addition, this study regarded regions with a DN value of over 15 as an urban area, since the total area of these regions equaled the urban built-up area obtained from land-use data interpreted from TM data provided by EDC-CAS in 2000. This was similar to a previous study in which lit areas in China with DN values over 12 were regarded as urban areas [29]. In addition, urban built-up areas from land use maps can be divided into four classifications (Table 2), and their corresponding average DN values can be calculated (Table 2).
Figure 3.
The relationship between city size (measured as urban built-up area interpreted from TM image) and the corresponding NTLI in China in 2000.
Figure 3.
The relationship between city size (measured as urban built-up area interpreted from TM image) and the corresponding NTLI in China in 2000.

Table 2.
The division of NTLI (DN value) and changes in NTLI from the sub-period (1992–1994) to the sub-period (2010–2012).
| Land Use Types | DN Value | Urban Built Area Classification (km2) | Increase Rate (%) | ||||
|---|---|---|---|---|---|---|---|
| China as a Whole | Northeast China | Middle China | East China | West China | |||
| Remote rural area | DN < 4 | −3 | −3 | −6 | −14 | −1 | |
| Transitional zone | 4 ≤ DN < 15 | 47 | 19 | 59 | 31 | 94 | |
| Urban area | 15 ≤ DN < 30 | 2–5 | 95 | 42 | 97 | 80 | 154 |
| 30 ≤ DN < 45 | 5–20 | 188 | 103 | 211 | 208 | 184 | |
| 45 ≤ DN < 52 | 20–50 | 284 | 164 | 283 | 343 | 221 | |
| DN > 53 | ≥ 50 | 428 | 349 | 454 | 534 | 288 | |
Note: In every sub-period, NTLI is the average DN value of three years. Transitional zone refers to rural-urban transitional zones and some small towns.
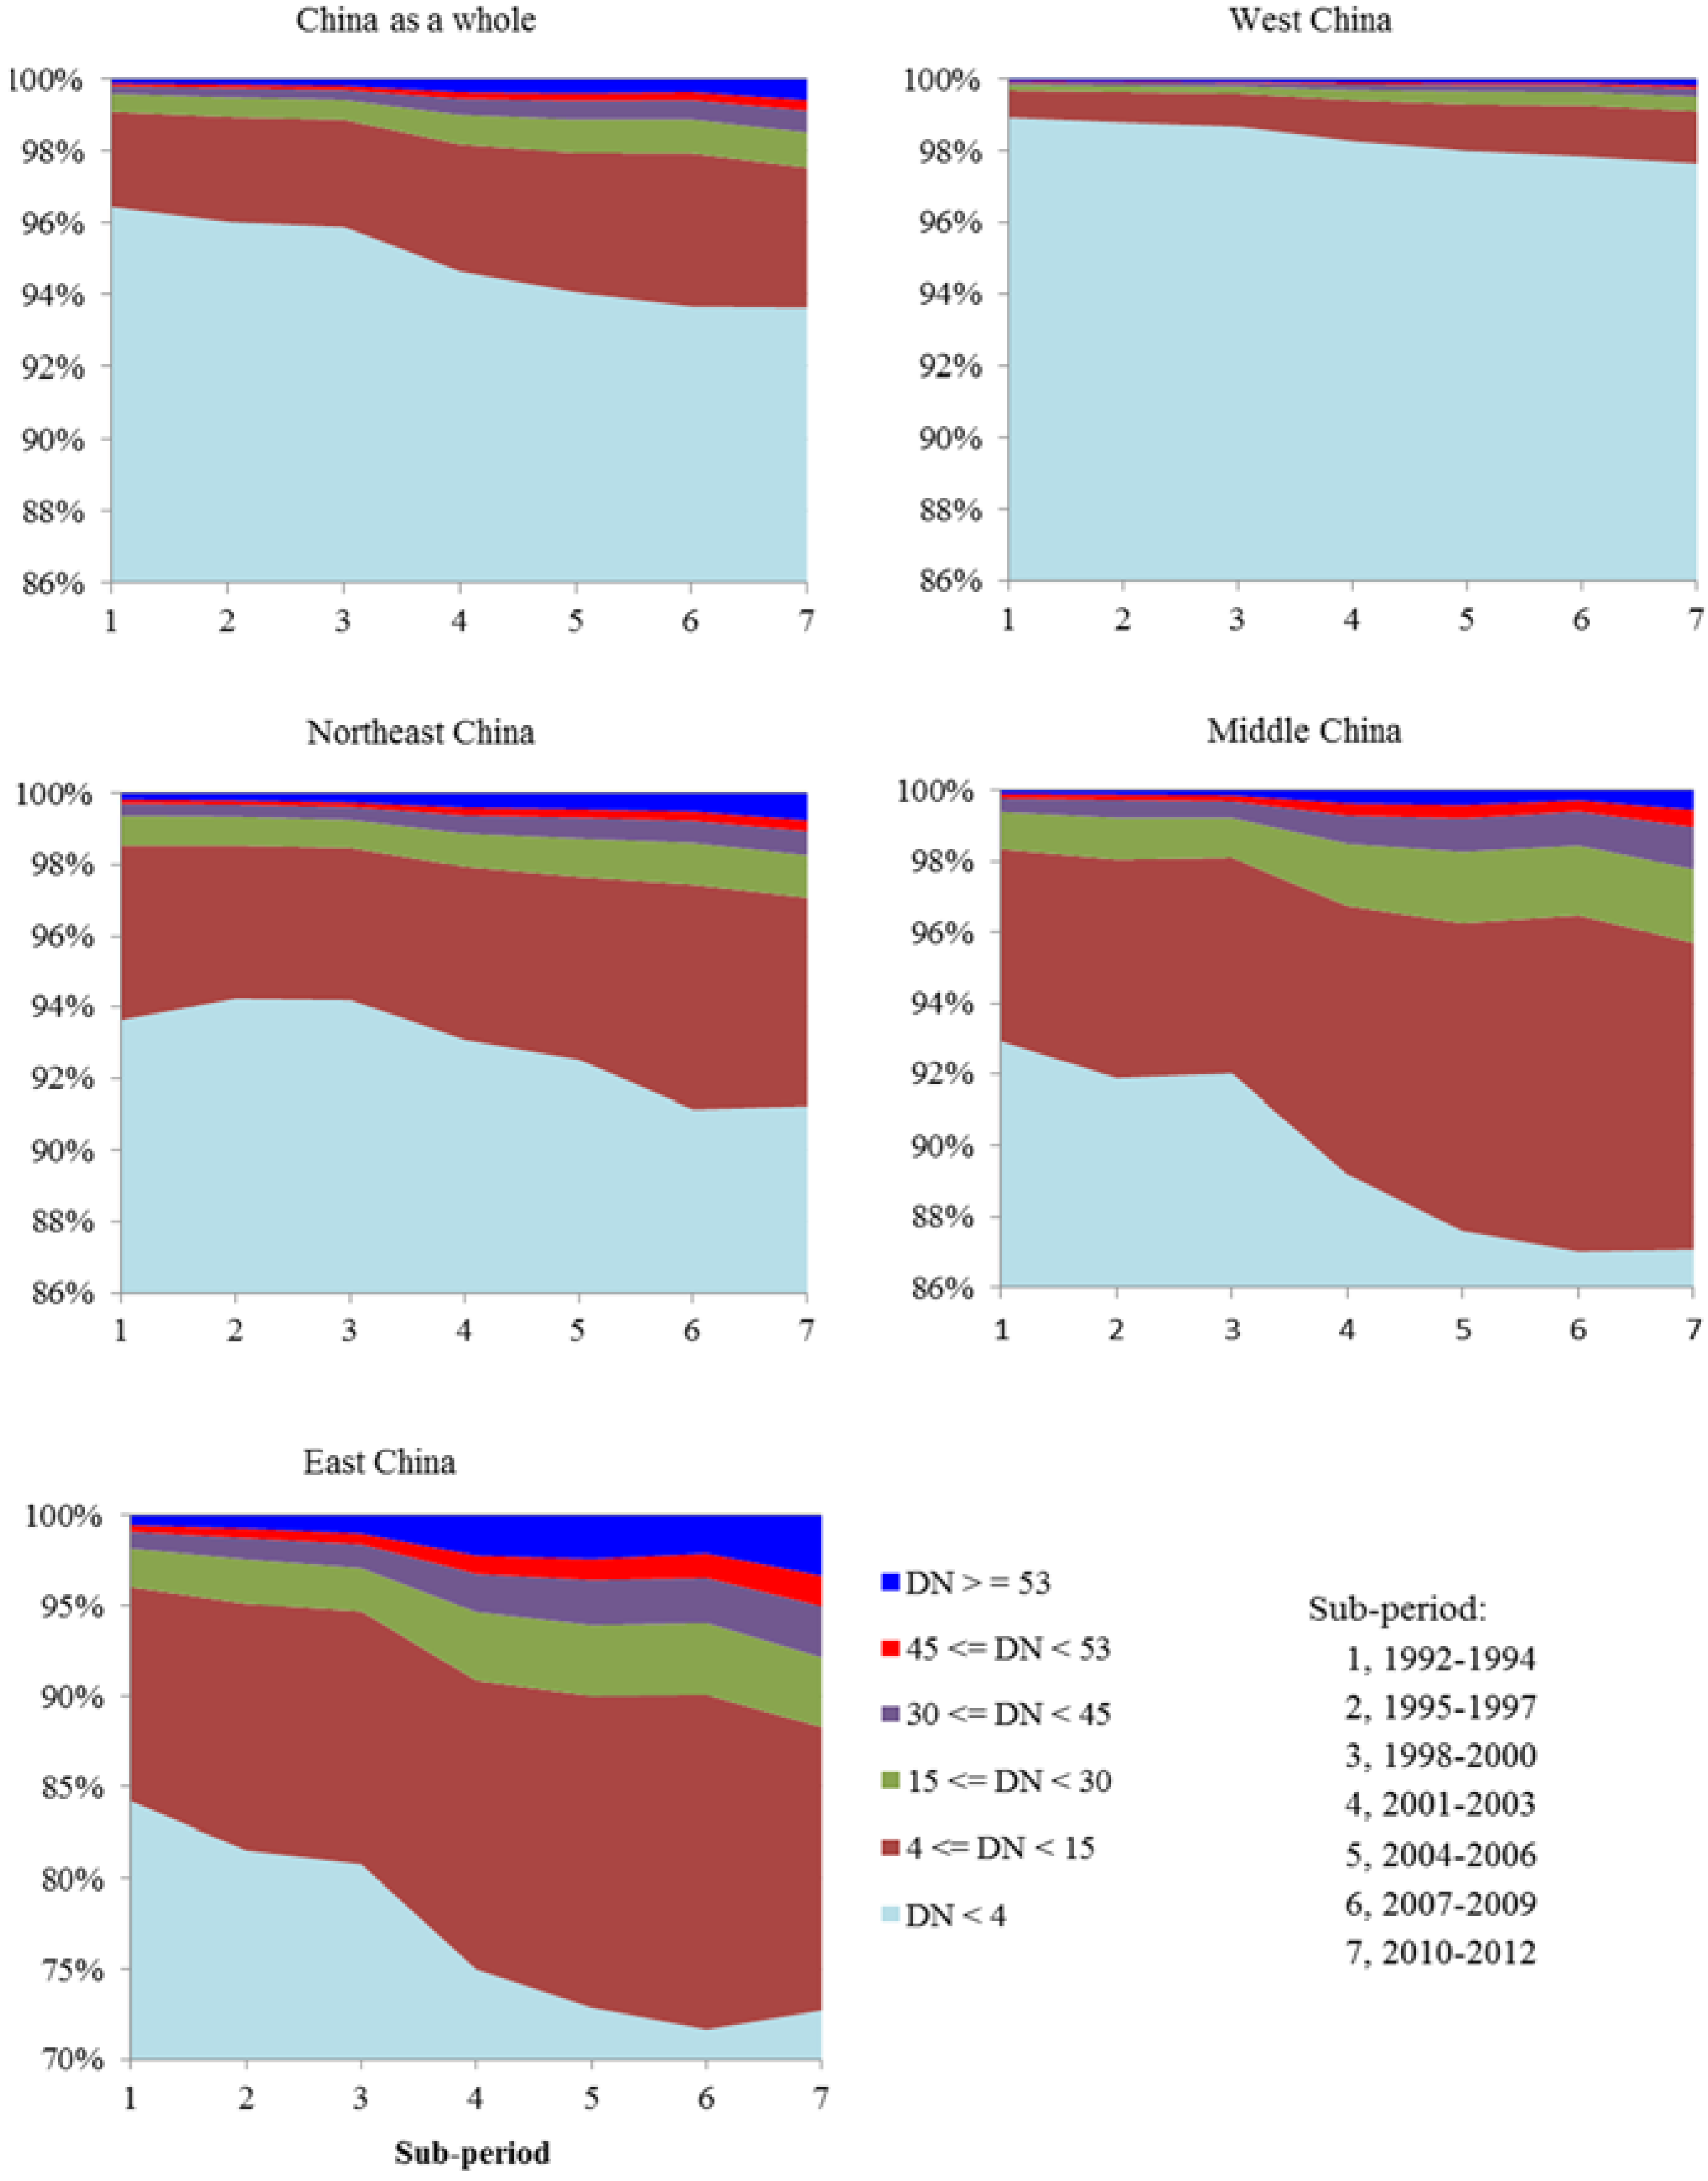
Over the whole country, urban areas increased rapidly (Figure 4) and the pixel numbers of urban areas increased by 173% during the study period (Figure 4). To examine the temporal changes in lit areas, the study period was divided into seven sub-periods of three years (Figure 4). In the 1990s, the growth rate of urban areas was slower than that of the 2000s. From the first sub-period (1992–1994) to the third sub-period (1998–2000), urban areas increased by 25%, while the corresponding rate was 119% from the third period to the seventh sub-period (2010–2012; Figure 4). This was similar to the previous results based on TM data [37], which also suggested that, in the 2000s, built-up area growth was much faster than in the 1990s.
Urban areas with a DN of more than 52 increased by 428%, which was the most rapid increase among the four classifications of urban areas (Table 2 and Figure 4). By contrast, urban areas with a DN between 15 and 30 only increased by 95%. Thus, in the larger cities, urban areas expanded more quickly (Figure 4). The faster growth of large areas was mainly a result of population growth. In China, during the period 1990–2010, the population of cities with over 5 million inhabitants increased by 764%, while the corresponding percentage for cities with populations less than 50 thousand was only 56%, according to data provided by Department of Economics and Social Affairs, United Nations [1].
3.2. Regional Differences in Urban Growth and the Flying-Geese Paradigm
Traditionally, mainland China is divided into four parts: East China, Middle China, Northeast China, and West China (Figure 1). To examine spatial differences in urban dynamics, this study examined urban growth in the four regions. First, in East China, the most developed region of the country, from the first sub-period to the third period, urban areas had the fastest growth rate (34%) among the four regions. Furthermore, urban growth was mainly concentrated in large cities with a DN value over 52 (Figure 4 and Table 2).
Second, in Middle China, urban areas increased rapidly in the 2000s. In the 1990s, Middle China had a very low rate of economic growth and urban expansion, which was lower than in East China and West China (Figure 4). Urban areas only increased by 14% from the first sub-period (1992–1994) to the third sub-period (1998–2000). However, from the third period to the seventh period (2010–2012), urban areas increased by 126%. This confirmed previous projections. Some authors projected that Middle China would experience a significant increase in residential and industrial land after 2000, since urban land expanded very slowly in the 1990s [38,39]. This growth was closely related to the Rise of the Central China Plan, a development strategy to coordinate regional growth in Middle China, which started in 2004 [40].
Figure 4.
The changes in distribution of different types of lit areas in China from the first sub-period (1992–1994) to the seventh sub-period (2010–2012). The whole period was divided into seven sub-periods. In this figure, the lowest value of the vertical axis for East China is 70%, while the value for the rest is 86%.

Third, West China had a very high growth rate throughout period studied. In the last two decades, urban areas increased by 186%, the highest, after East China, in the four regions. In 2000, the State Council of China launched the Western Development Strategy, which called for the central government to invest in infrastructure construction and natural resource exploitation, and set up market liberalization policies to create regional economic development centers [40]. This effectively solved the problems of the weak industrial base and poor transportation and was of great benefit to the economic development of these regions.
Fourth, northeast China had the lowest growth rate of the four regions. Urban areas increased by 101% over the last two decades, which was much lower than the average for the country as a whole (173%). In particular, from the first sub-period to the third sub-period, urban areas only increased by 5%. By contrast, remote rural areas increased, due to the serious recession in resource-based cities (Figure 4). In 2003, to rejuvenate industrial bases in Northeast China, the central government of China adopted a Northeast China Revitalization policy, which promoted economic development and urban growth in Northeast China.
In China, the regional differences in the growth of urban areas can be pictured by the flying-geese paradigm. This paradigm has become well known as a means of explaining rapid economic growth in East Asia [41]. The paradigm predominantly features the following processes: developed countries/regions go through industrial upgrading, and foreign direct investment flows from developed countries/regions to developing countries in an open-economy context, due to comparative advantages regarding labor cost and land rent [42]. Furthermore, China is a country with a vast territory. Foreign direct investment, economic development, and urbanization also underwent a similar process to that of the flying-geese paradigm. In the 1990s, East China was the most developed region and had the fastest growth rate. However, in the 2000s, the growth rate of urban areas was lower than in Middle China and West China, which entered a stage of accelerated urbanization.
3.3. Rural Transition
Rural transition has been studied from many angles, including rural housing transition, rural land use transition, and rural dependencies [43,44]. Because lit areas and the NTLI of imagery have close relationships with human phenomena, such as population density, GDP, and electric power consumption [26,28,29]. This study focused on two aspects: changes in the extent of remote rural areas, and changes in NTLI in remote rural areas (Figure 5). First, from the first sub-period to the fifth sub-period, the extent of remote rural areas in China with a DN value of less than four rapidly decreased due to the expansion in human activities such as urbanization, industrialization, and population growth (Figure 4). However, in the 2000s, changes in remote rural areas in China underwent a significant transition in some regions. During the last two sub-periods (2007–2012), the extent of remote rural areas stopped decreasing at the national rate. In East China, in the 2000s, the extent of remote rural areas even showed a tendency to increase. Rural transition in this region was noticeable. In Middle China and Northeast China, the extent of remote rural areas also stopped decreasing during the last two sub-periods. Second, in some remote areas, nightlight intensity became noticeably weaker, especially in the northwestern part of Xinjiang, the eastern part of Inner Mongolia, and in the rural areas of Sichuan and Guizhou (Figure 1 and Figure 5). This transition largely resulted from a decrease in the rural population. In China, due to rural-urban migration, the rural population decreased by 16.5%, from 0.81 billion in 2000 to 0.67 million in 2010, according to the data provided by the sixth national census [45]. In the remote rural areas, population density was very low because of meager natural resources and a poor basic infrastructure. Some villages in these regions therefore disappeared, because of spontaneous migration or migration determined by government policy. According to the sixth census data the rural population in these regions also decreased significantly. For instance, in Nenjiang county in Heilongjiang, the rural population decreased by 31% in the 2000s.
Figure 5.
The changes of NTLI from 2000 to 2010. Note: NTLI 2000 and 2010 refer to the average DN values of the years 1999, 2000, and 2001, and the years 2009, 2010, and 2011, respectively.
Figure 5.
The changes of NTLI from 2000 to 2010. Note: NTLI 2000 and 2010 refer to the average DN values of the years 1999, 2000, and 2001, and the years 2009, 2010, and 2011, respectively.

In remote areas, rural decline is closely related to an aging population, since most migrants are young people. In addition, the basic infrastructure and sanitary conditions are very poor, and the natural environment is harsh, and this greatly affects the livelihood of older rural residents. It is very difficult to improve the basic infrastructure, especially in the high mountain areas.
4. Conclusions
DMSP/OLS provides a valuable data source, which can effectively mirror urban growth and transition, economic development, energy consumption, and so on. However, these data must be intercalibrated carefully, since the OLS has no on-board calibration. To reduce the differences between sensors, and improve the comparability of NTL data for different years, this study selected four regions to fully intercalibrate the data. The four regions included three types of reference pixels: The city center of Beijing with signal saturation, medium cities that were developing slowly, and a region in the central part of the Taklimakan desert which was a completely dark rural area. By synthetically using the lit area and the brightness of NTL imagery, this study analyzed the urbanization process and rural transition in China.
Urban areas quickly increased in size. At the national level, urban areas with a DN value over 15 increased by 173%. The growth rate of urban areas in the 1990s, however, was slower than that of the 2010s. From the first sub-period to the third sub-period, urban areas increased by 25%, while the rate of increase was 119% from the third period to the seventh period.
Urban area growth varied across regions, in accordance with the flying-geese paradigm. Initially, East China was the most developed region of the country and showed its fastest growth rate in the 1990s. The second most developed region was Middle China where urbanization rapidly increased in the 2010s. In the 1990s, Middle China had a very low rate of economic growth and urban expansion, with an urban area increase of only 14% from the first sub-period (1992–1994) to the third sub-period (1998–2000). However, from the third sub-period to the seventh sub-period, urban areas increased by 126%, which was the highest rate in the four regions. Of the four regions, Northeast China has had the lowest growth rate of urban areas over the last two decades.
Over the whole country, urban areas with a DN value of above 52 increased by 428% in the study period, which was much faster than the other types of urban areas. These high DN areas were mainly in large cities that covered over 50 km2. The above findings were very similar to those in existing literature, and led to a similar conclusion: the big cities grew more rapidly than other cities or towns during the acceleration stage of the process of urbanization. It is suggested that greater attention should be paid to this finding by urban planners and governments in developing countries.
NTL imagery can also be used to describe rural changes if the imagery is corrected using completely dark rural pixels. In this study, a region in the central part of the Taklimakan desert in Xinjiang was selected as the dark rural pixels. During the last two sub-periods (2007–2012), remote rural areas stopped decreasing at the national rate. In East China, remote rural areas had increasing trends and experienced a transition period. It was also noticeable that nighttime light intensity became weaker in some rural areas, such as in northwest parts of Xinjiang, eastern parts of Inner Mongolia, and in the rural areas of Sichuan and Chongqing. The rural transition was closely related to rural-urban migration. Accordingly, in the above remote rural areas, the rural population rapidly decreased in the 2000s.
Acknowledgments
This work was supported by the Natural Science Foundation of China (Grant Nos. 41271119, 91325302 and 41161140352) and the National Basic Research Program of China (Grant No. 2015CB452705).
Conflicts of Interest
The author declares no conflict of interest.
References
- Department of Economic and Social Affairs, United Nations. 2014 Revision of the World Urbanization Prospects. Available online: http://www.un.org/en/development/desa/publications/2014-revision-world-urbanization-prospects.html (accessed on 15 March 2014).
- Chang, K.C.; Wen, M.; Wang, G. Social capital and work among rural-to-urban migrants in China. Asian Popul. Stud. 2011, 7, 275–292. [Google Scholar] [CrossRef]
- Mills, E.S. Handbook of Regional and Urban Economics: Urban Economics; Economic Science Press: Beijing, China, 2003. [Google Scholar]
- Tzanopoulos, J.; Kallimanis, A.S.; Bella, I.; Labrianidis, L.; Sgardelis, S.; Pantis, J.D. Agricultural decline and sustainable development on mountain areas in Greece: Sustainability assessment of future scenarios. Land Use Policy 2011, 28, 585–593. [Google Scholar] [CrossRef]
- Sun, M.; Fan, C.C. China’s Permanent and Temporary Migrants: Differentials and Changes, 1990–2000. Prof. Geogr. 2013, 63, 92–112. [Google Scholar] [CrossRef]
- Gray, C.L. Environment, land, and rural out-migration in the Southern Ecuadorian Andes. World Dev. 2009, 37, 457–468. [Google Scholar] [CrossRef]
- Liu, T.; Yang, X. Monitoring land changes in an urban area using satellite imagery, GIS and landscape metrics. Appl. Geogr. 2015, 56, 42–54. [Google Scholar] [CrossRef]
- Seeborg, M.C.; Jin, Z.; Zhu, Y. The new rural-urban labor mobility in China: Causes and implications. J. Soc. Econ. 2000, 29, 39–56. [Google Scholar] [CrossRef]
- Bjarnasona, T.; Thorlindsson, T. Should I stay or should I go? Migration expectations among youth in Icelandic fishing and farming communities. J. Rural Stud. 2006, 22, 290–300. [Google Scholar]
- Zhang, K.H.; Song, S. Rural-urban migration and urbanization in China: Evidence from time-series and cross-section analyses. China Econ. Rev. 2003, 14, 386–400. [Google Scholar] [CrossRef]
- Ma, L.; Wu, J.; Li, W.; Peng, J.; Liu, H. Evaluating saturation correction methods for DMSP/OLS nighttime light data: A case study from China’s Cities. Remote Sens. 2014, 6, 9853–9872. [Google Scholar] [CrossRef] [Green Version]
- Chen, X.; Nordhausa, W.D. Using luminosity data as a proxy for economic statistics. PNAS 2011, 108, 8589–8594. [Google Scholar] [CrossRef] [PubMed]
- Keola, S.; Andersson, M.; Hall, O. Monitoring Economic Development from Space: Using Nighttime Light and Land Cover Data to Measure Economic Growth. World Dev. 2015, 66, 322–334. [Google Scholar] [CrossRef]
- Wu, J.; Wang, Z.; Li, W.F.; Peng, J. Exploring factors affecting the relationship between light consumption and GDP based on DMSP/OLS nighttime satellite imagery. Remote Sens. Environ. 2013, 134, 111–119. [Google Scholar] [CrossRef]
- Levin, N.; Duke, Y. High spatial resolution night-time light images for demographic and socio-economic studies. Remote Sens. Environ. 2012, 119, 1–10. [Google Scholar] [CrossRef]
- Huang, Q.; Yang, X.; Gao, B.; Yang, Y.; Zhao, Y. Application of DMSP/OLS Nighttime Light images: A meta-analysis and a systematic literature review. Remote Sens. 2014, 6, 6844–6866. [Google Scholar] [CrossRef]
- Zhang, Q.; Seto, K.C. Can Night-Time Light data identify typologies of urbanization? A global assessment of successes and failures. Remote Sens. 2013, 5, 3476–3494. [Google Scholar]
- Yue, W.; Gao, J.; Yang, X. Estimation of gross domestic product using multi-sensor remote sensing data: A case study in Zhejiang province, East China. Remote Sens. 2014, 6, 7260–7275. [Google Scholar] [CrossRef]
- Zhao, N.; Ghosh, T.; Samson, E.L. Mapping spatio-temporal changes of Chinese electric power consumption using night-time imagery. Int. J. Remote Sens. 2012, 33, 6304–6320. [Google Scholar] [CrossRef]
- Amaral, S.; Câmara, G.; Miguel, A.; Monteiro, V.; Quintanilha, J.A.; Elvidge, C.D. Estimating population and energy consumption in Brazilian Amazonia using DMSP night-time satellite data. Comput. Environ. Urban Syst. 2005, 29, 179–195. [Google Scholar] [CrossRef]
- Anderson, S.J.; Tuttle, B.T.; Powell, R.L.; Sutton, P.C. Characterizing relationships between population density and nighttime imagery for Denver, Colorado: Issues of scale and representation. Comput. Environ. Urban Syst. 2010, 31, 5733–5746. [Google Scholar] [CrossRef]
- Saksena, S.; Fox, J.; Spencer, J.; Castrence, M.; DiGregorio, M.; Epprecht, M.; Sultana, N.; Finucane, M.; Nguyen, L.; Vien, T.D. Classifying and mapping the urban transition in Vietnam. Appl. Geogr. 2014, 50, 80–89. [Google Scholar] [CrossRef]
- Elvidge, C.D.; Ziskin, D.; Baugh, K.E.; Tuttle, B.T.; Ghosh, T.; Pack, D.W.; Erwin, E.H.; Zhizhin, M. A Fifteen Year Record of Global Natural Gas Flaring Derived from Satellite Data. Energies 2009, 2, 595–622. [Google Scholar] [CrossRef]
- National Bureau of Statistics of China (NBSC). China City Statistical Yearbook; China Statistic Press: Beijing, China, 2013.
- Cai, Y. China’s New Demographic Reality: Learning from the 2010 Census. Popul. Dev. Rev. 2013, 39, 371–396. [Google Scholar] [CrossRef] [PubMed]
- Sutton, P.; Roberts, D.A.; Elvidge, C.D. Census from Heaven: An estimate of the global human population using night-time satellite imagery. Int. J. Remote Sens. 2001, 22, 3061–3076. [Google Scholar]
- Liu, Z.; He, C.; Zhang, Q.; Huang, Q.; Yang, Y. Extracting the dynamics of urban expansion in China using DMSP-OLS nighttime light data from 1992 to 2008. Landsc. Urban Plan. 2012, 10, 62–72. [Google Scholar] [CrossRef]
- Ma, Q.; He, C.; Wu, J.; Liu, Z.; Zhang, Q.; Sun, Z. Quantifying spatiotemporal patterns of urban impervious surfaces in China: An improved assessment using nighttime light data. Landsc. Urban Plan. 2014, 130, 36–49. [Google Scholar] [CrossRef]
- Ma, T.; Zhou, C.; Pei, T.; Haynie, S.; Fan, J. Quantitative estimation of urbanization dynamics using time series of DMSP/OLS nighttime light data: A comparative case study from China’s cities. Remote Sens. Environ. 2012, 124, 99–107. [Google Scholar] [CrossRef]
- Lu, D.; Tian, H.; Zhou, G.; Ge, H. Regional mapping of human settlements in southeastern China with multisensor remotely sensed data. Remote Sens. Environ. 2008, 112, 3668–3679. [Google Scholar] [CrossRef]
- Long, H.; Heilig, G.K.; Li, X.; Zhang, M. Socio-economic development and land-use change: Analysis of rural housing land transition in the Transect of the Yangtse River, China. Land Use Policy 2007, 24, 141–153. [Google Scholar] [CrossRef]
- Liu, J.Y.; Liu, M.L.; Zhuang, D.F. Study on spatial pattern of land-use change in China during 1995–2000. Sci. China Ser. D 2003, 46, 373–384. [Google Scholar]
- National Geophysical Data Center. Available online: http://www.ngdc.noaa.gov/eog/dmsp/downloadV4composites.html (accessed on 15 October 2014).
- Bennie, J.; Davies, T.W.; Duffy, J.P.; Inger, R.; Gaston, K.J. Contrasting trends in light pollution across Europe based on satellite observed nighttime lights. Sci. Rep. 2014. [Google Scholar] [CrossRef] [Green Version]
- Elvidge, C.D.; Hsu, E.C.; Baugh, K.E.; Ghosh, T. National Trends in Satellite Observed Lighting: 1992–2012. In Global Urban Monitoring and Assessment Through Earth Observation; Weng, Q., Ed.; CRC Press: Boca Raton, FL, USA, 2013. [Google Scholar]
- Li, X.; Chen, X.; Zhao, Y.; Xu, J.; Chen, F.; Li, H. Automatic intercalibration of nighttime light imagery using robust regression. Remote Sens. Lett. 2013, 4, 45–54. [Google Scholar] [CrossRef]
- Liu, J.; Kuang, W.; Zhang, Z.; Xu, X.; Qin, Y.; Ning, J.; Zhou, W.; Zhang, S.; Li, R.; Yan, C. Spatiotemporal characteristics, patterns, and causes of land-use changes in China since the late 1980s. J. Geogr. Sci. 2014, 24, 195–210. [Google Scholar] [CrossRef]
- Tan, M.; Li, X.; Lu, C. Urban land expansion and arable land loss of the major cities in China in the 1990s. Sci. China (Ser. D Earth Sci.) 2005, 48, 1492–1500. [Google Scholar] [CrossRef]
- Verburg, P.; Veldkamp, T.; Fresco, L. Simulation of changes in the spatial pattern of land in China. Appl. Geogr. 1999, 19, 211–233. [Google Scholar] [CrossRef]
- Huang, N.; Ma, J.; Sullivan, K. Economic Development Policies for Central and Western China; The Magazine The US-China Business Council. Available online: http://www.chinabusinessreview.com/economic-development-policies-for-central-and-western-china/ (accessed on 1 November 2010).
- Dowlinga, M.; Cheang, C.T. Shifting comparative advantage in Asia: New tests of the “flying geese” model. J. Asian Econ. 2000, 11, 443–463. [Google Scholar] [CrossRef]
- Kojima, K. The “flying geese” model of Asian economic development: Origin, theoretical extensions, and regional policy implications. J. Asian Econ. 2000, 11, 375–401. [Google Scholar] [CrossRef]
- Long, H.; Zou, J.; Liu, Y. Differentiation of rural development driven by industrialization and urbanization in eastern coastal China. Habitat Int. 2009, 33, 454–462. [Google Scholar] [CrossRef]
- Assche, K.V.; Djanibekov, N.; Hornidge, A.K.; Shtaltovna, A.; Verschraegen, G. Rural development and the entwining of dependencies: Transition as evolving governance in Khorezm, Uzbekistan. Futures 2014, 63, 75–85. [Google Scholar] [CrossRef]
- The Office of The Sixth National Census Beijing. The Characteristics of Beijing’s Population Distribution. Available online: http://www.bjstats.gov.cn/rkpc_6/pcsj/ (accessed on 3 March 2011).
© 2015 by the authors; licensee MDPI, Basel, Switzerland. This article is an open access article distributed under the terms and conditions of the Creative Commons Attribution license (http://creativecommons.org/licenses/by/4.0/).
Share and Cite
MDPI and ACS Style
Tan, M. Urban Growth and Rural Transition in China Based on DMSP/OLS Nighttime Light Data. Sustainability 2015, 7, 8768-8781. https://doi.org/10.3390/su7078768
AMA Style
Tan M. Urban Growth and Rural Transition in China Based on DMSP/OLS Nighttime Light Data. Sustainability. 2015; 7(7):8768-8781. https://doi.org/10.3390/su7078768
Chicago/Turabian StyleTan, Minghong. 2015. "Urban Growth and Rural Transition in China Based on DMSP/OLS Nighttime Light Data" Sustainability 7, no. 7: 8768-8781. https://doi.org/10.3390/su7078768