

In-Line Monitoring of Carbon Dioxide Capture with Sodium Hydroxide in a Customized 3D-Printed Reactor without Forced Mixing

 , , , and
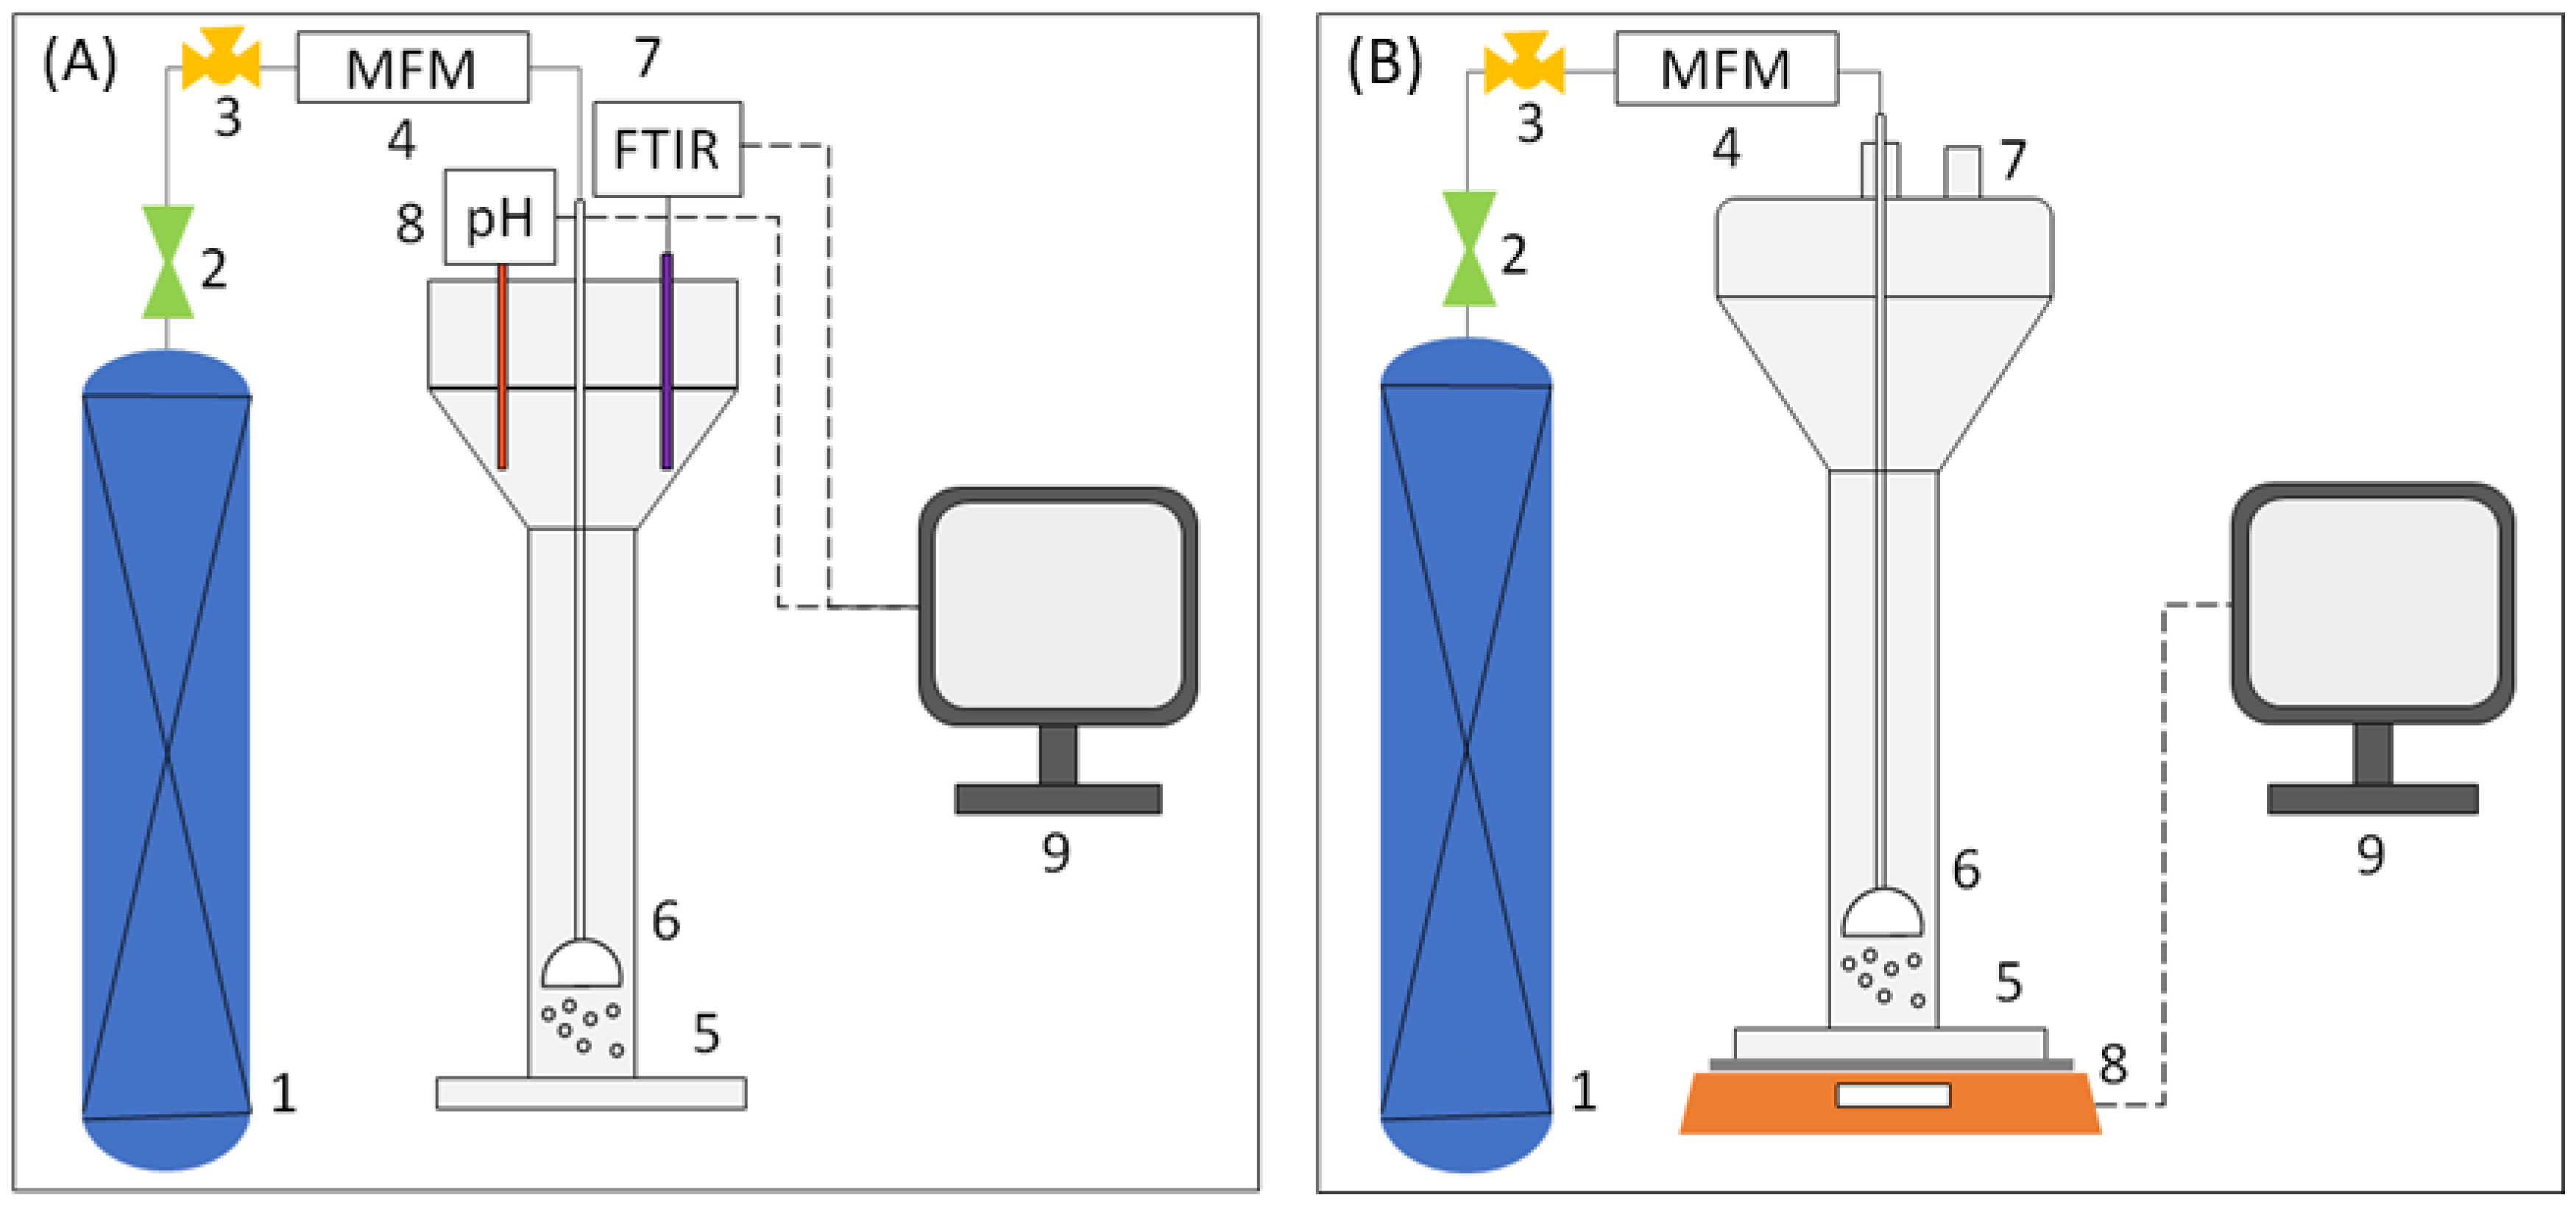
Abstract
:1. Introduction
2. Materials and Methods
2.1. Materials
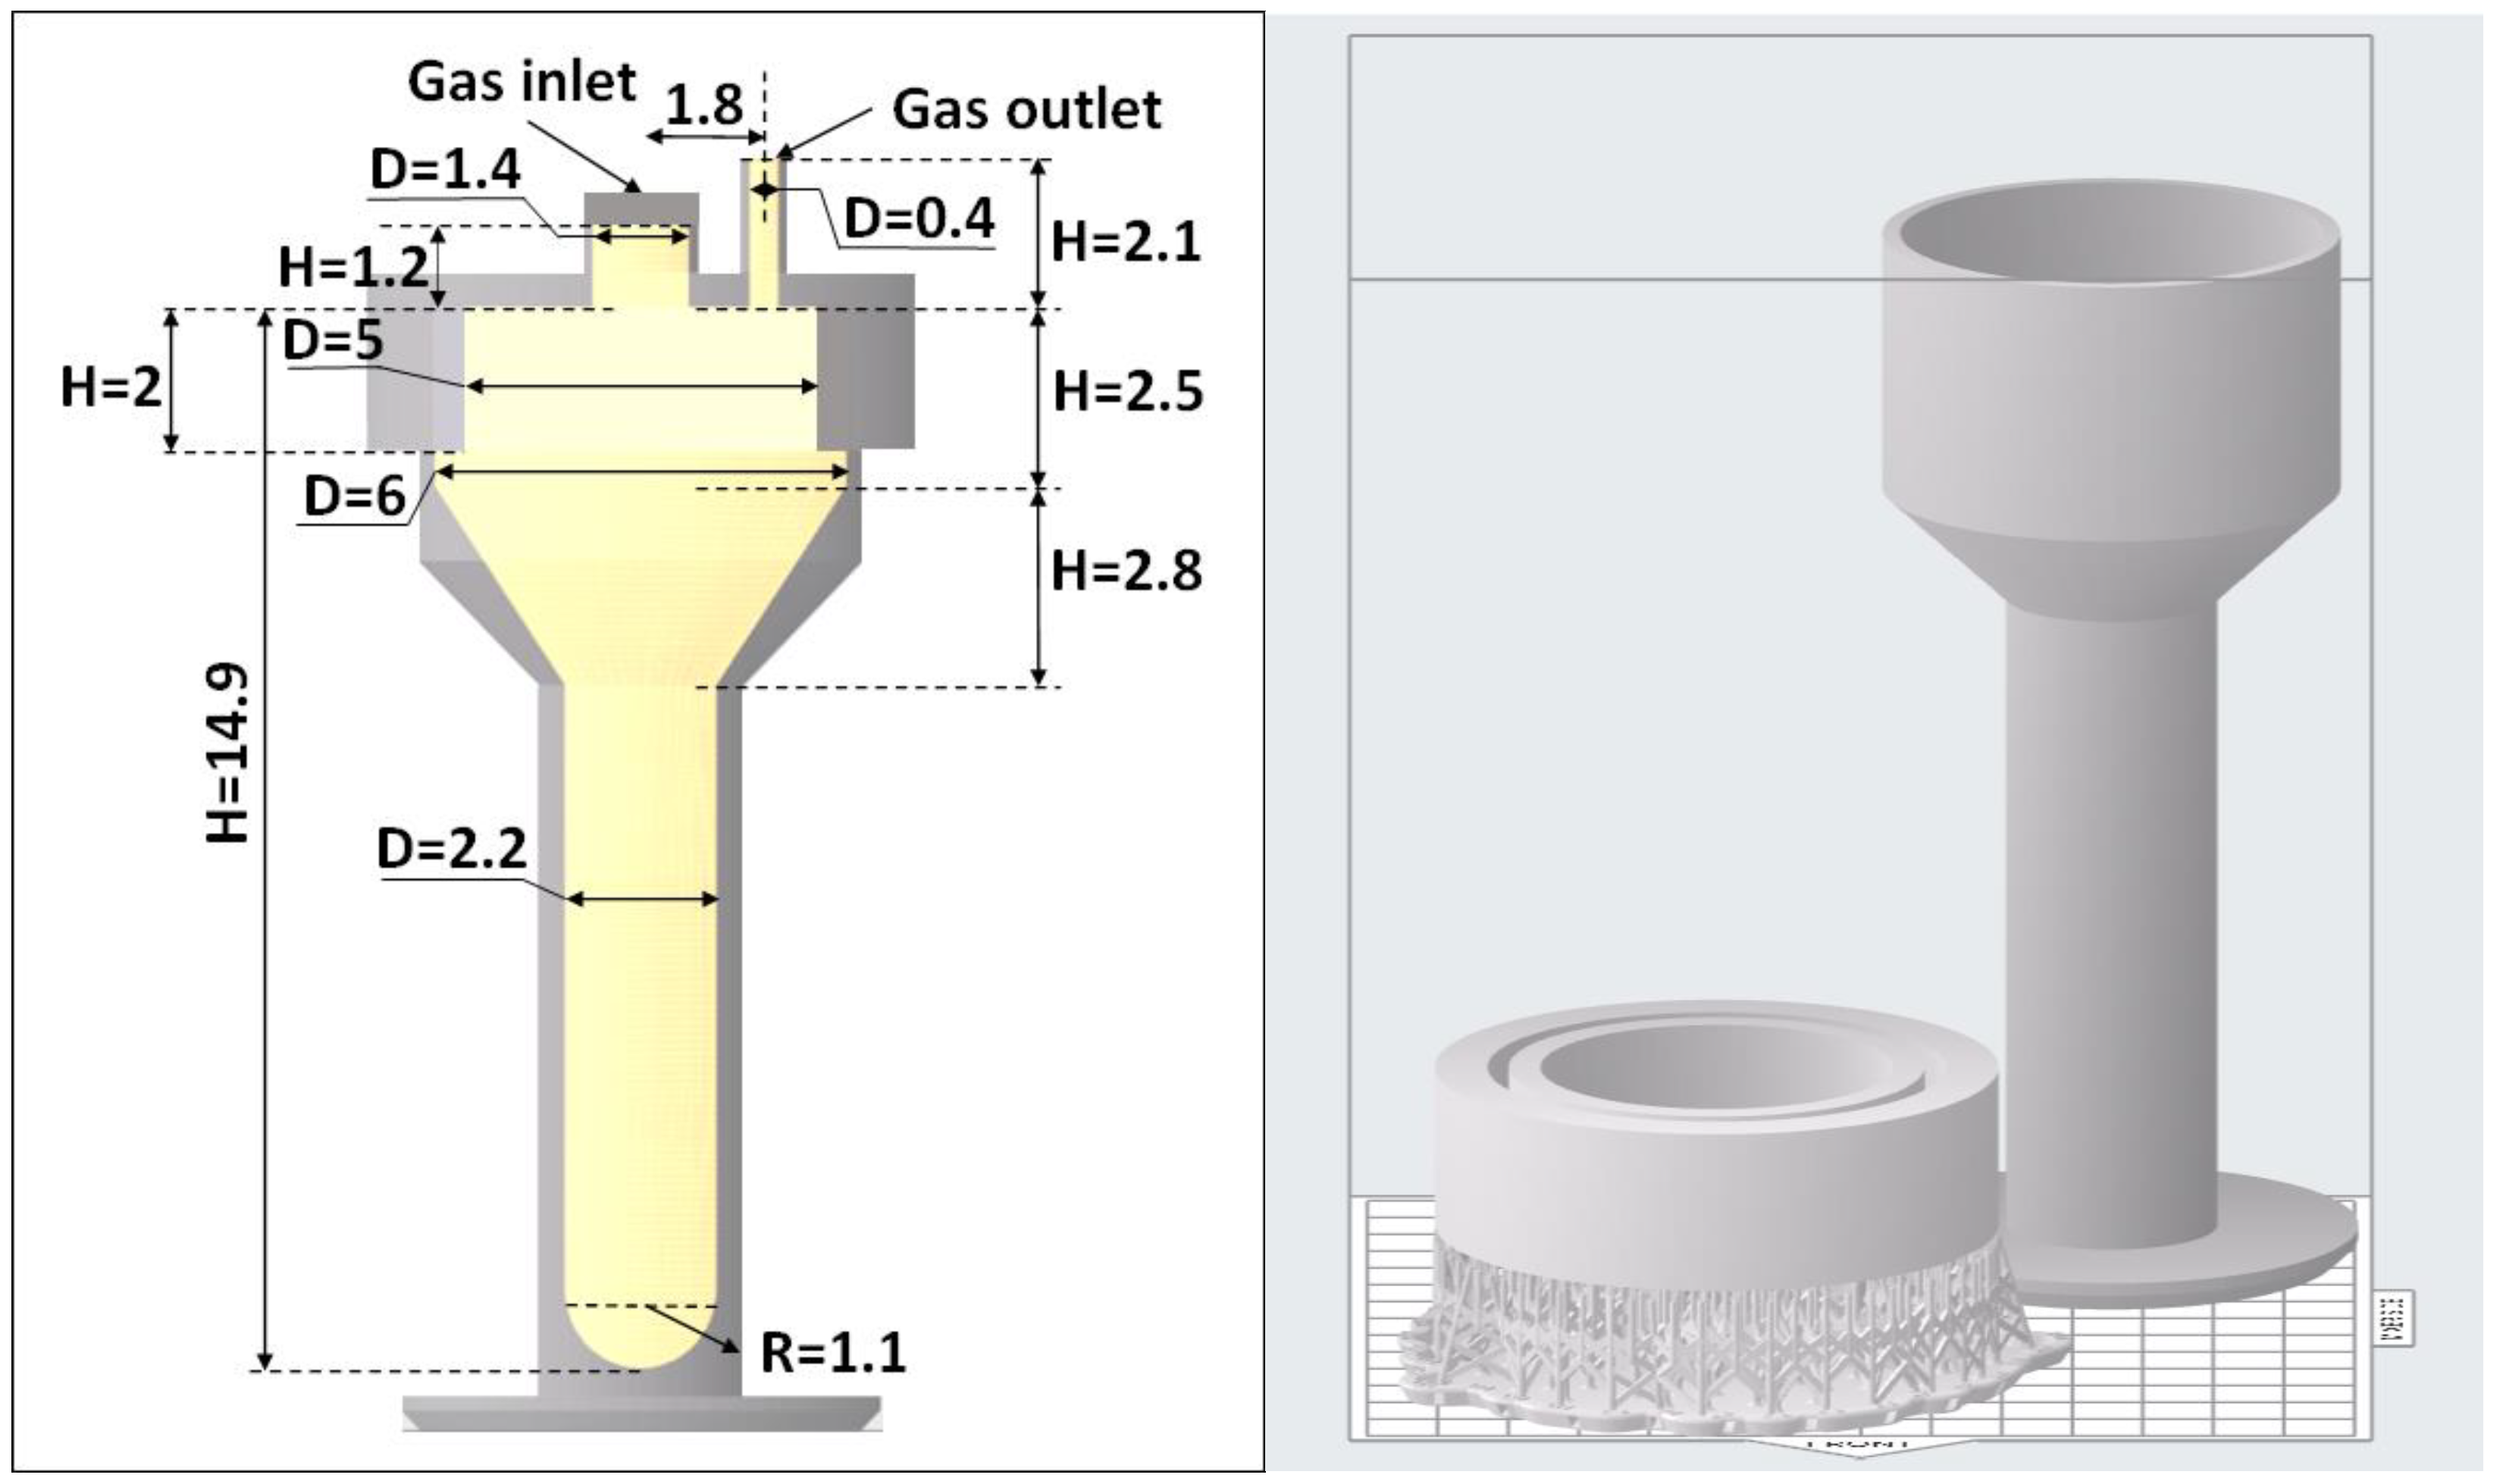
2.2. Experimental Setup, Procedures, and Reactor Design
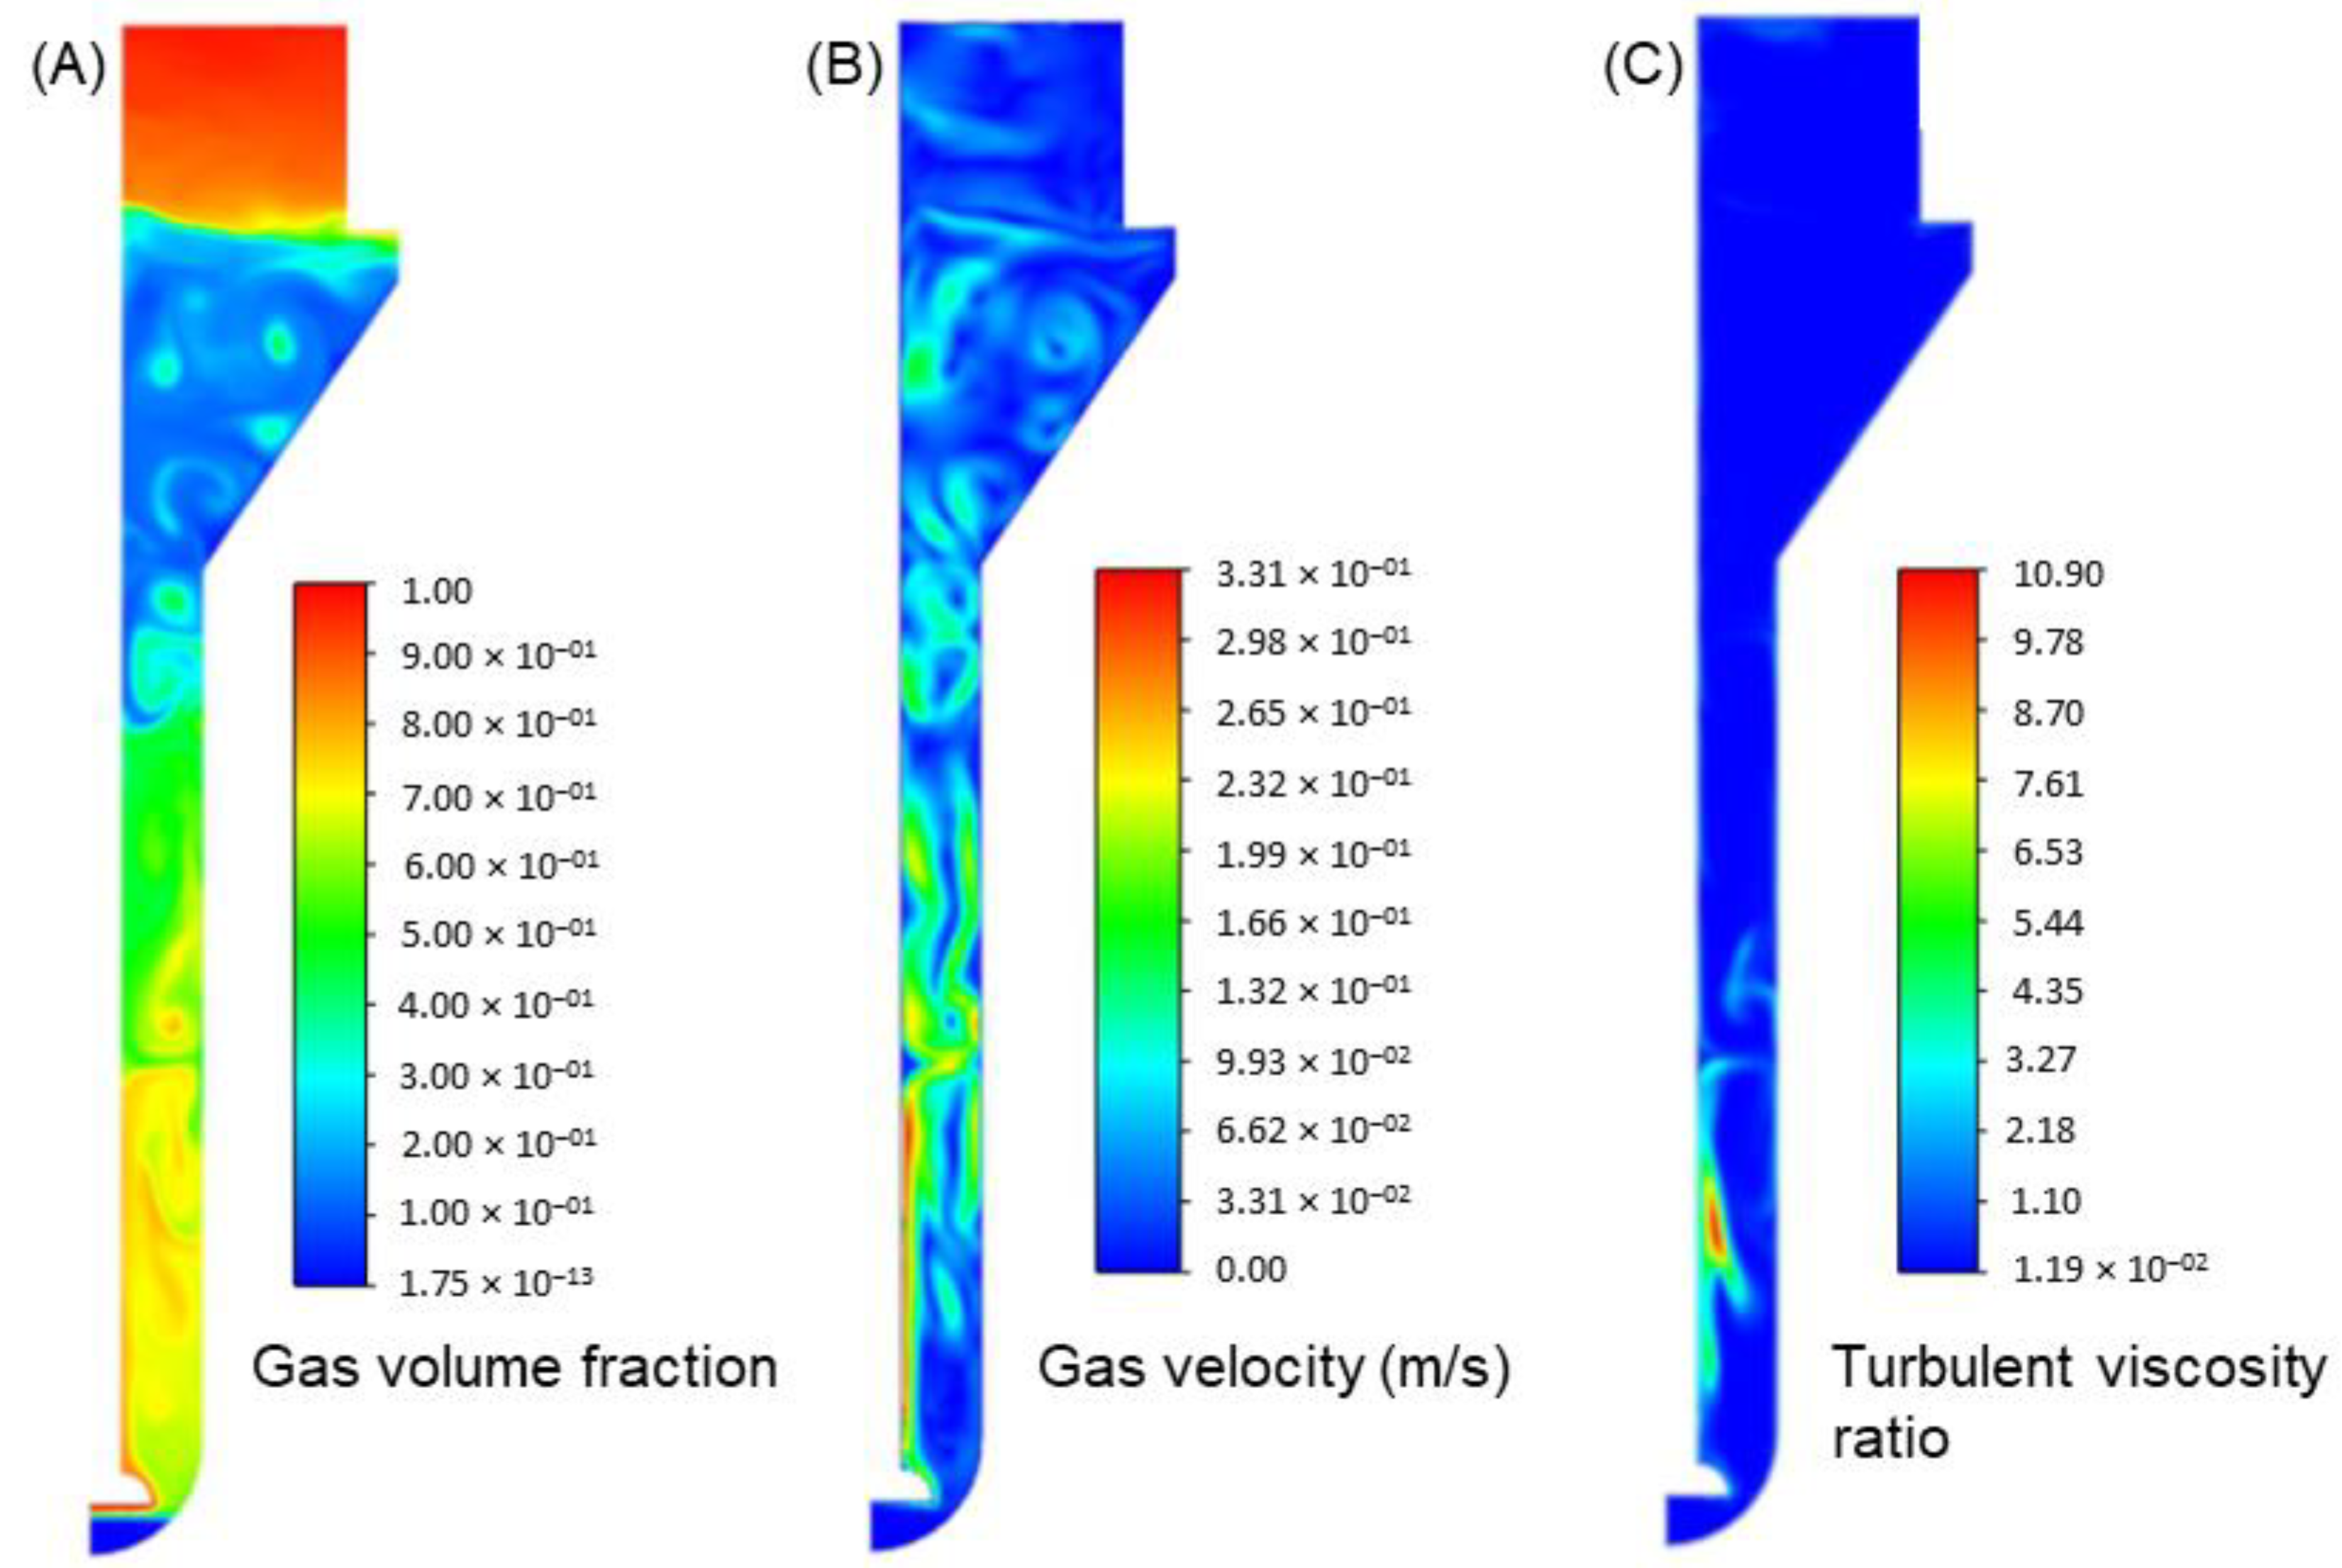
2.3. Computational Fluid Dynamics (CFD) Methodology
3. Theoretical Considerations of Carbonation Reactions of CO2 in Aqueous Bases
4. Results
4.1. Mixing in the Reactor
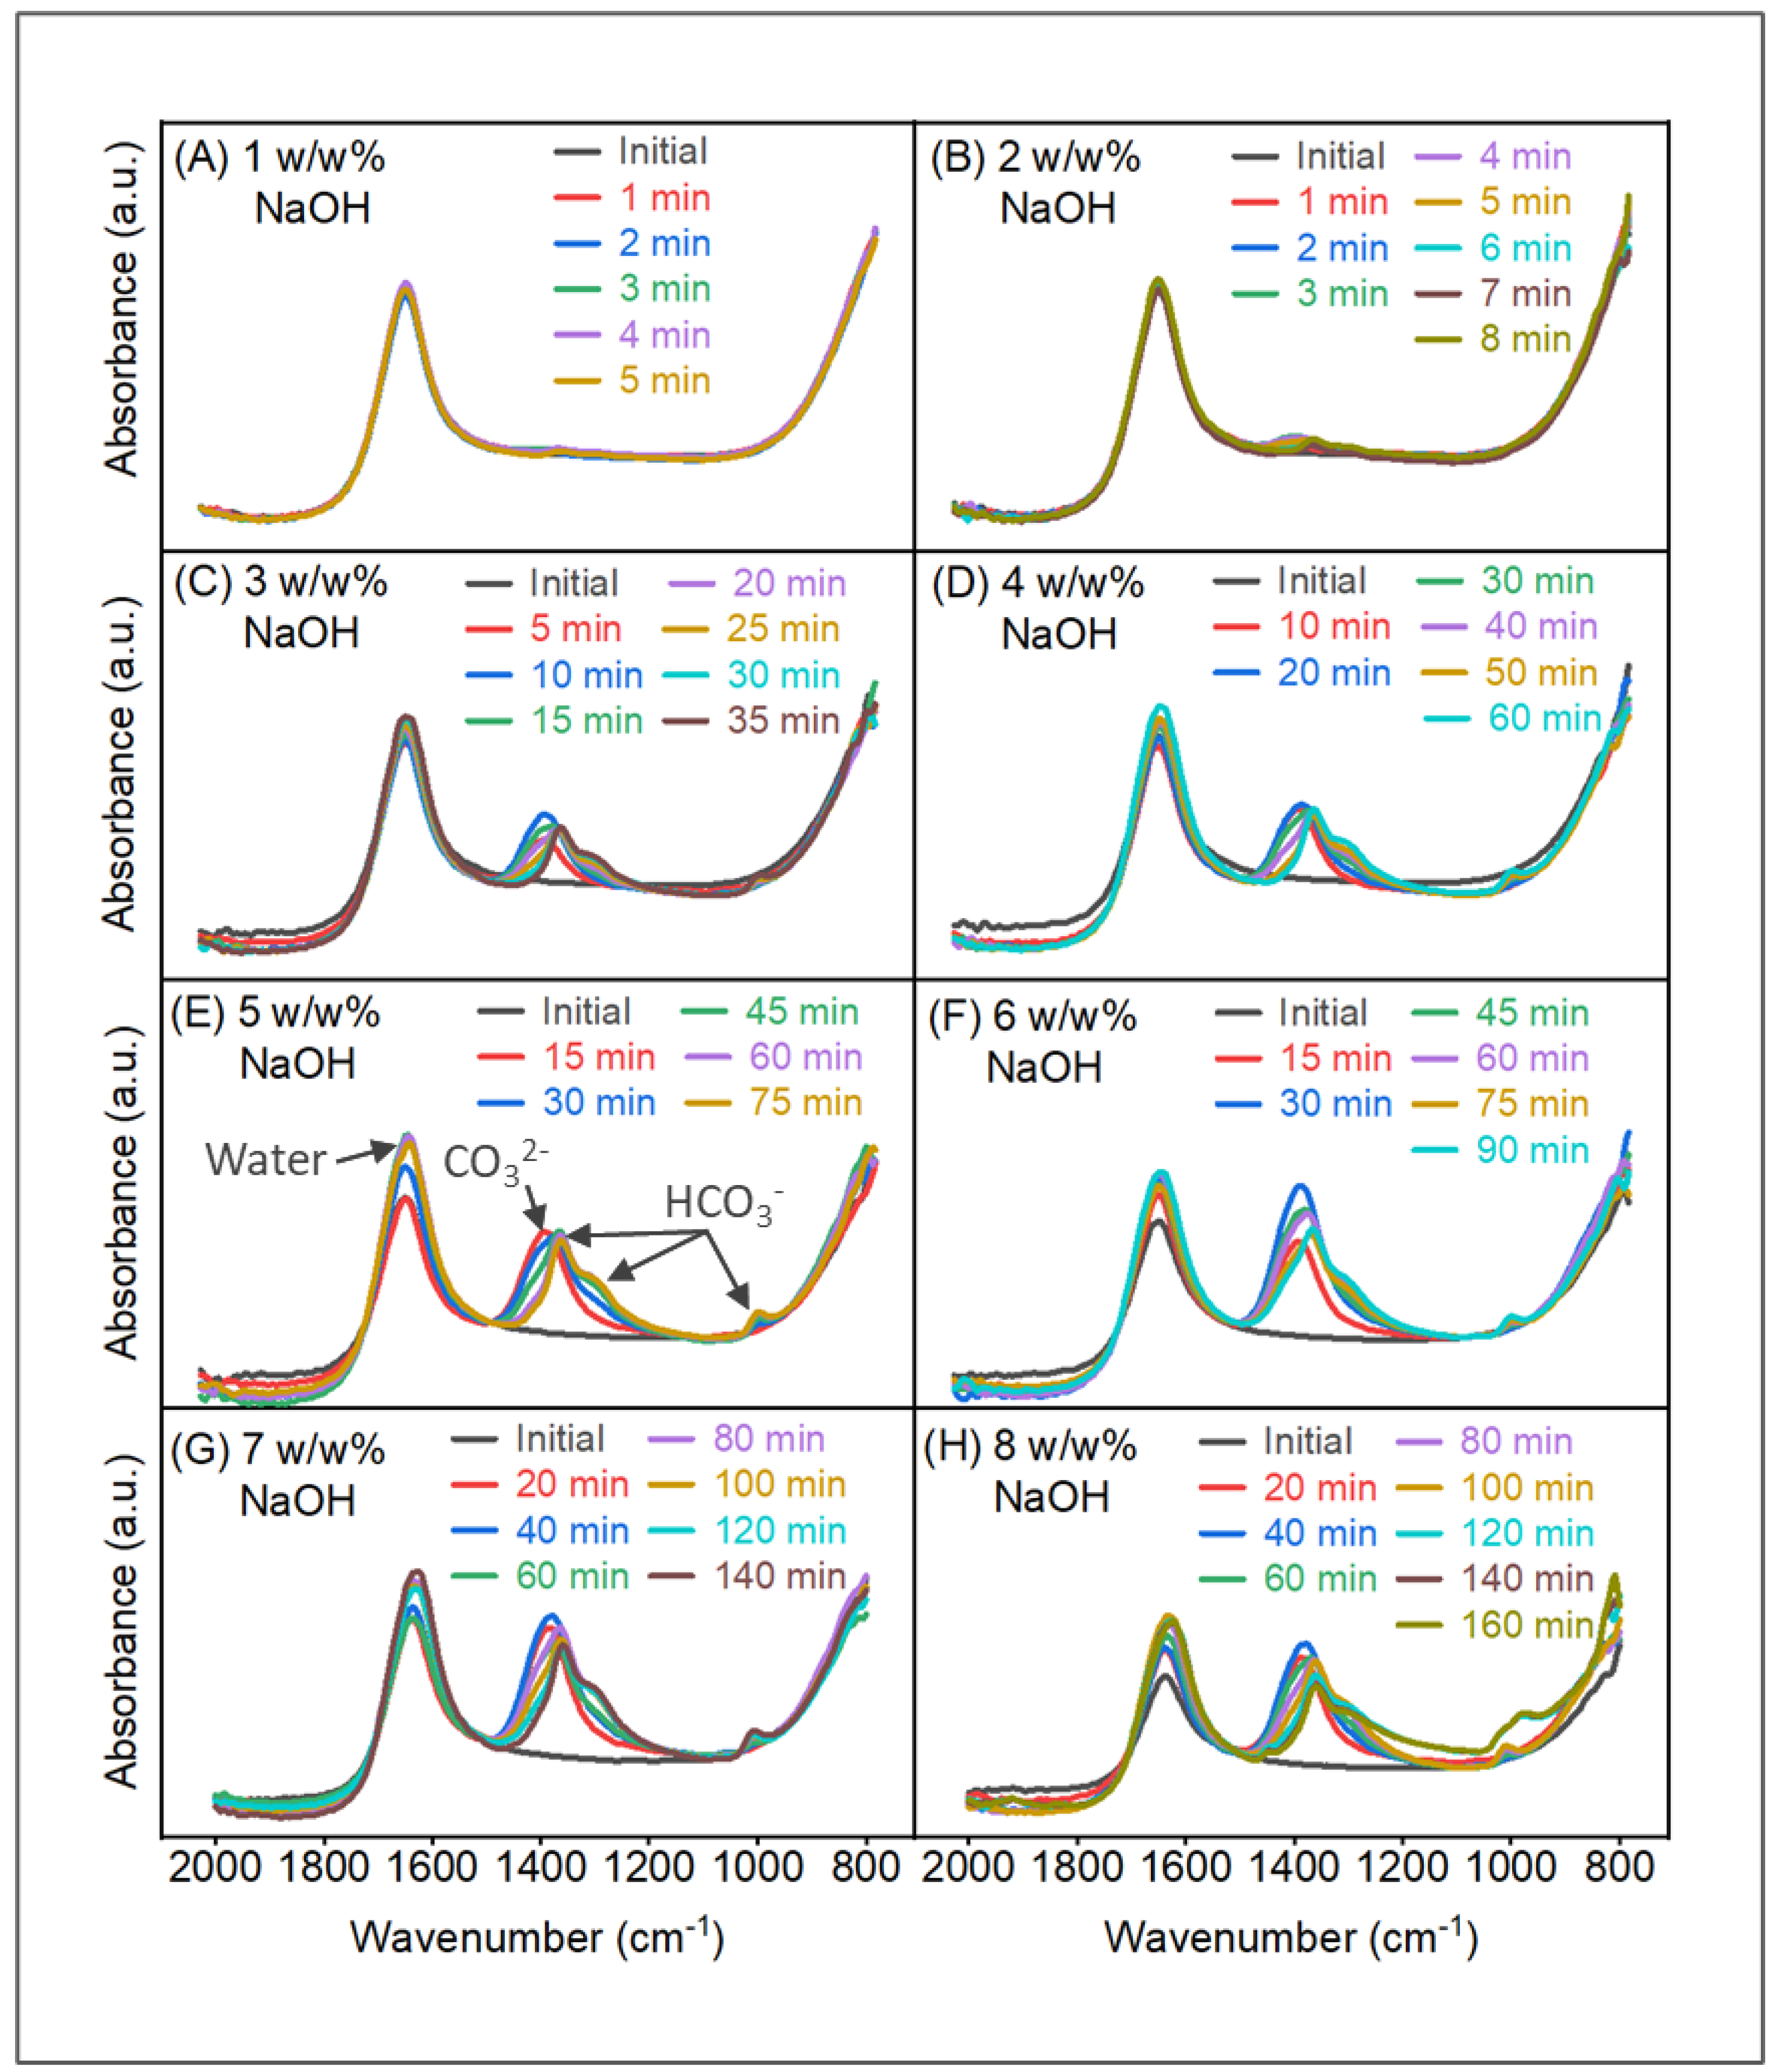
4.2. Carbonation Reactions and Reactor Performance
5. Conclusions and Future Remarks
Author Contributions
Funding
Institutional Review Board Statement
Informed Consent Statement
Data Availability Statement
Conflicts of Interest
References
- Ritchie, H.; Roser, M.; Rosado, P. CO2 and Greenhouse Gas Emissions. Available online: https://ourworldindata.org/co2-and-other-greenhouse-gas-emissions (accessed on 18 July 2022).
- Witte, K. Social Acceptance of Carbon Capture and Storage (CCS) from Industrial Applications. Sustainability 2021, 13, 12278. [Google Scholar] [CrossRef]
- Fichera, A.; Samanta, S.; Volpe, R. Exergetic Analysis of a Natural Gas Combined-Cycle Power Plant with a Molten Carbonate Fuel Cell for Carbon Capture. Sustainability 2022, 14, 533. [Google Scholar] [CrossRef]
- Kheirinik, M.; Ahmed, S.; Rahmanian, N. Comparative Techno-Economic Analysis of Carbon Capture Processes: Pre-Combustion, Post-Combustion, and Oxy-Fuel Combustion Operations. Sustainability 2021, 13, 13567. [Google Scholar] [CrossRef]
- Vega, F.; Baena-Moreno, F.M.; Gallego Fernández, L.M.; Portillo, E.; Navarrete, B.; Zhang, Z. Current Status of CO2 Chemical Absorption Research Applied to CCS: Towards Full Deployment at Industrial Scale. Appl. Energy 2020, 260, 114313. [Google Scholar] [CrossRef]
- Mohd Pauzi, M.M.; Azmi, N.; Lau, K.K. Emerging Solvent Regeneration Technologies for CO2 Capture through Offshore Natural Gas Purification Processes. Sustainability 2022, 14, 4350. [Google Scholar] [CrossRef]
- Sánchez-Bautista, A.; Palmero, E.M.; Moya, A.J.; Gómez-Díaz, D.; la Rubia, M.D. Characterization of Alkanolamine Blends for Carbon Dioxide Absorption. Corrosion and Regeneration Studies. Sustainability 2021, 13, 4011. [Google Scholar] [CrossRef]
- Ji, L.; Yu, H.; Li, K.; Yu, B.; Grigore, M.; Yang, Q.; Wang, X.; Chen, Z.; Zeng, M.; Zhao, S. Integrated Absorption-Mineralisation for Low-Energy CO2 Capture and Sequestration. Appl. Energy 2018, 225, 356–366. [Google Scholar] [CrossRef]
- Hong, S.; Sim, G.; Moon, S.; Park, Y. Low-Temperature Regeneration of Amines Integrated with Production of Structure-Controlled Calcium Carbonates for Combined CO2 Capture and Utilization. Energy Fuels 2020, 34, 3532–3539. [Google Scholar] [CrossRef]
- Arti, M.; Youn, M.H.; Park, K.T.; Kim, H.J.; Kim, Y.E.; Jeong, S.K. Single Process for CO2 Capture and Mineralization in Various Alkanolamines Using Calcium Chloride. Energy Fuels 2017, 31, 763–769. [Google Scholar] [CrossRef]
- Baena-Moreno, F.M.; Rodríguez-Galán, M.; Vega, F.; Ramirez-Reina, T.; Vilches, L.; Navarrete, B. Understanding the Influence of the Alkaline Cation K + or Na + in the Regeneration Efficiency of a Biogas Upgrading Unit. Int. J. Energy Res. 2019, 43, 1578–1585. [Google Scholar] [CrossRef]
- Luis, P. Use of Monoethanolamine (MEA) for CO2 Capture in a Global Scenario: Consequences and Alternatives. Desalination 2016, 380, 93–99. [Google Scholar] [CrossRef]
- Mahmoudkhani, M.; Keith, D.W. Low-Energy Sodium Hydroxide Recovery for CO2 Capture from Atmospheric Air—Thermodynamic Analysis. Int. J. Greenh. Gas Control. 2009, 3, 376–384. [Google Scholar] [CrossRef]
- Hikita, H.; Asai, S.; Takatsuka, T. Absorption of Carbon Dioxide into Aqueous Sodium Hydroxide and Sodium Carbonate-Bicarbonate Solutions. Chem. Eng. J. 1976, 11, 131–141. [Google Scholar] [CrossRef]
- Shim, J.-G.; Lee, D.W.; Lee, J.H.; Kwak, N.-S. Experimental Study on Capture of Carbon Dioxide and Production of Sodium Bicarbonate from Sodium Hydroxide. Environ. Eng. Res. 2016, 21, 297–303. [Google Scholar] [CrossRef]
- Lucile, F.; Cézac, P.; Contamine, F.; Serin, J.-P.; Houssin, D.; Arpentinier, P. Solubility of Carbon Dioxide in Water and Aqueous Solution Containing Sodium Hydroxide at Temperatures from (293.15 to 393.15) K and Pressure up to 5 MPa: Experimental Measurements. J. Chem. Eng. Data 2012, 57, 784–789. [Google Scholar] [CrossRef]
- Yoo, M.; Han, S.-J.; Wee, J.-H. Carbon Dioxide Capture Capacity of Sodium Hydroxide Aqueous Solution. J. Environ. Manag. 2013, 114, 512–519. [Google Scholar] [CrossRef]
- D’Adamo, I.; Gastaldi, M.; Morone, P.; Rosa, P.; Sassanelli, C.; Settembre-Blundo, D.; Shen, Y. Bioeconomy of Sustainability: Drivers, Opportunities and Policy Implications. Sustainability 2021, 14, 200. [Google Scholar] [CrossRef]
- D’Adamo, I.; Sassanelli, C. Biomethane Community: A Research Agenda towards Sustainability. Sustainability 2022, 14, 4735. [Google Scholar] [CrossRef]
- D’Adamo, I.; Gastaldi, M. Sustainable Development Goals: A Regional Overview Based on Multi-Criteria Decision Analysis. Sustainability 2022, 14, 9779. [Google Scholar] [CrossRef]
- Cardoso, M.; de Oliveira, É.D.; Passos, M.L. Chemical Composition and Physical Properties of Black Liquors and Their Effects on Liquor Recovery Operation in Brazilian Pulp Mills. Fuel 2009, 88, 756–763. [Google Scholar] [CrossRef]
- Reyes, L.; Nikitine, C.; Vilcocq, L.; Fongarland, P. Green Is the New Black—A Review of Technologies for Carboxylic Acid Recovery from Black Liquor. Green Chem. 2020, 22, 8097–8115. [Google Scholar] [CrossRef]
- Kordylewski, W.; Sawicka, D.; Falkowski, T. Laboratory Tests on the Efficiency of Carbon Dioxide Capture from Gases in Naoh Solutions. J. Ecol. Eng. 2013, 14, 54–62. [Google Scholar] [CrossRef]
- Salmón, I.; Cambier, N.; Luis, P. CO2 Capture by Alkaline Solution for Carbonate Production: A Comparison between a Packed Column and a Membrane Contactor. Appl. Sci. 2018, 8, 996. [Google Scholar] [CrossRef]
- Azizi, F.; Kaady, L.; Al-Hindi, M. Chemical Absorption of CO2 in Alkaline Solutions Using an Intensified Reactor. Can. J. Chem. Eng. 2022, 100, 2172–2190. [Google Scholar] [CrossRef]
- Chen, P.C.; Huang, C.F.; Chen, H.-W.; Yang, M.-W.; Tsao, C.-M. Capture of CO2 from Coal-Fired Power Plant with NaOH Solution in a Continuous Pilot-Scale Bubble-Column Scrubber. Energy Procedia 2014, 61, 1660–1664. [Google Scholar] [CrossRef]
- Yincheng, G.; Zhenqi, N.; Wenyi, L. Comparison of Removal Efficiencies of Carbon Dioxide between Aqueous Ammonia and NaOH Solution in a Fine Spray Column. Energy Procedia 2011, 4, 512–518. [Google Scholar] [CrossRef]
- Stolaroff, J.K.; Keith, D.W.; Lowry, G.V. Carbon Dioxide Capture from Atmospheric Air Using Sodium Hydroxide Spray. Environ. Sci. Technol. 2008, 42, 2728–2735. [Google Scholar] [CrossRef]
- Zhou, P.; Wang, H. Carbon Capture and Storage—Solidification and Storage of Carbon Dioxide Captured on Ships. Ocean. Eng. 2014, 91, 172–180. [Google Scholar] [CrossRef]
- Pfleger, D.; Becker, S. Modelling and Simulation of the Dynamic Flow Behaviour in a Bubble Column. Chem. Eng. Sci. 2001, 56, 1737–1747. [Google Scholar] [CrossRef]
- Burns, A.D.; Frank, T.; Hamill, I.; Shi, J.M. The Favre Averaged Drag Model for Turbulent Dispersion in Eulerian Multi-Phase Flows. In Proceedings of the Fifth International Conference on Multiphase Flow, Yokohama, Japan, 30 May–4 June 2004. [Google Scholar]
- Wolf-Gladrow, D.A.; Zeebe, R.E.; Klaas, C.; Körtzinger, A.; Dickson, A.G. Total Alkalinity: The Explicit Conservative Expression and Its Application to Biogeochemical Processes. Mar. Chem. 2007, 106, 287–300. [Google Scholar] [CrossRef] [Green Version]
- CRC Handbook of Chemistry and Physics; Haynes, W.M. (Ed.) CRC Press: Boca Raton, FL, USA, 2014; ISBN 9780429170195. [Google Scholar]
- Wishart, D.S.; Guo, A.; Oler, E.; Wang, F.; Anjum, A.; Peters, H.; Dizon, R.; Sayeeda, Z.; Tian, S.; Lee, B.L.; et al. HMDB 5.0: The Human Metabolome Database for 2022. Nucleic Acids Res. 2022, 50, D622–D631. [Google Scholar] [CrossRef]
- National Institute of Standards and Technology NIST Chemistry WebBook. Available online: http://webbook.nist.gov (accessed on 18 July 2022).
- Salvador Cob, S. Towards Zero Liquid Discharge in Drinking Water Production; TU Delft: Delft, The Netherlands, 2014. [Google Scholar]
- Graham, M.; Allington-Jones, L. The Air-Abrasive Technique: A Re-Evaluation of Its Use in Fossil Preparation. Palaeontol. Electron. 2018, 1–15. [Google Scholar] [CrossRef] [Green Version]


Publisher’s Note: MDPI stays neutral with regard to jurisdictional claims in published maps and institutional affiliations. |
© 2022 by the authors. Licensee MDPI, Basel, Switzerland. This article is an open access article distributed under the terms and conditions of the Creative Commons Attribution (CC BY) license (https://creativecommons.org/licenses/by/4.0/).
Share and Cite
Leventaki, E.; Baena-Moreno, F.M.; Sardina, G.; Ström, H.; Ghahramani, E.; Naserifar, S.; Ho, P.H.; Kozlowski, A.M.; Bernin, D. In-Line Monitoring of Carbon Dioxide Capture with Sodium Hydroxide in a Customized 3D-Printed Reactor without Forced Mixing. Sustainability 2022, 14, 10795. https://doi.org/10.3390/su141710795
Leventaki E, Baena-Moreno FM, Sardina G, Ström H, Ghahramani E, Naserifar S, Ho PH, Kozlowski AM, Bernin D. In-Line Monitoring of Carbon Dioxide Capture with Sodium Hydroxide in a Customized 3D-Printed Reactor without Forced Mixing. Sustainability. 2022; 14(17):10795. https://doi.org/10.3390/su141710795
Chicago/Turabian StyleLeventaki, Emmanouela, Francisco M. Baena-Moreno, Gaetano Sardina, Henrik Ström, Ebrahim Ghahramani, Shirin Naserifar, Phuoc Hoang Ho, Aleksandra M. Kozlowski, and Diana Bernin. 2022. "In-Line Monitoring of Carbon Dioxide Capture with Sodium Hydroxide in a Customized 3D-Printed Reactor without Forced Mixing" Sustainability 14, no. 17: 10795. https://doi.org/10.3390/su141710795