Article

Life-Cycle Assessment of Power-to-Liquid Kerosene Produced from Renewable Electricity and CO2 from Direct Air Capture in Germany

Department of Sustainable Engineering, Institute of Environmental Technology, Technische Universität Berlin, Straße des 17. Juni 135, 10623 Berlin, Germany
*
Authors to whom correspondence should be addressed.
Sustainability 2022, 14(17), 10658; https://doi.org/10.3390/su141710658
Submission received: 5 July 2022 / Revised: 9 August 2022 / Accepted: 22 August 2022 / Published: 26 August 2022
(This article belongs to the Topic Sustainable Transportation)

Abstract

:
Decarbonization of the aviation sector is crucial to reaching the global climate targets. We quantified the environmental impacts of Power-to-Liquid kerosene produced via Fischer-Tropsch Synthesis from electricity and carbon dioxide from air as one broadly discussed alternative liquid jet fuel. We applied a life-cycle assessment considering a well-to-wake boundary for five impact categories including climate change and two inventory indicators. Three different electricity production mixes and four different kerosene production pathways in Germany were analyzed, including two Direct Air Capture technologies, and compared to fossil jet fuel. The environmental impacts of Power-to-Liquid kerosene varied significantly across the production pathways. E.g., when electricity from wind power was used, the reduction in CO2-eq. compared to fossil jet fuel varied between 27.6–46.2% (with non-CO2 effects) and between 52.6–88.9% (without non-CO2 effects). The reduction potential regarding CO2-eq. of the layout using low-temperature electrolysis and high-temperature Direct Air Capture was lower compared to the high-temperature electrolysis and low-temperature Direct Air Capture. Overall, the layout causing the lowest environmental impacts uses high-temperature electrolysis, low-temperature Direct Air Capture and electricity from wind power. This paper showed that PtL-kerosene produced with renewable energy could play an important role in decarbonizing the aviation sector.

1. Introduction

In 2018, the aviation sector emitted 1.04 Gt of carbon dioxide (CO2), accounting for approximately 2.5% of total global anthropogenic CO2 emissions [1]. Despite the temporary drop in flight activity and related emissions due to the COVID-19 pandemic, the sector is expected to at least double by 2050 compared to 2019, leading to increasing environmental impacts [2,3,4]. These environmental impacts are caused through the combustion of aviation fuel, with fossil Jet A and Jet A-1 being the most used aviation fuels to date (based on [5,6]). As aviation counts as part of the “difficult-to-decarbonize” energy services and the emissions are expected to increase, it is crucial to decarbonize aviation to reach the goals of the Paris Agreement [7,8,9].
Aviation faces special challenges, as commercial aircraft have a lifespan of about 30 years [10] and cannot be electrified with today’s technologies [7,11]. Furthermore, efficiency gains in fuel consumption are—and will reportedly remain—smaller than fuel consumption growth due to increased passenger demand [12,13]. As such, the aviation sector cannot be decarbonized by electrification and will therefore require liquid fuels with high volumetric and gravimetric density for propulsion at least until mid-century. Drop-in-ready low-carbon fuels represent a technologically viable solution to decarbonize aviation [7]. Thus, synthetically produced fuels have received increased attention in recent years as a technologically fungible alternative to conventional jet fuels [14,15,16], due to their potential to reduce carbon dioxide (CO2) emissions in the aviation sector by over 95% [17,18,19].
Fossil aviation kerosene is produced by refining petroleum. The same refinery processes can be used to refine synthetic fuel (synfuel), i.e., a mixture of hydrocarbons which can be produced with different techniques and whose composition depends on the production pathway. One way of producing synfuel with a chemical composition almost identical to petroleum is through Fischer-Tropsch Synthesis (FTS) of synthesis gas (syngas) [20]. Syngas can be produced by combining hydrogen from water electrolysis and CO2. CO2 can be sourced through technologies directly extracting CO2 from the atmosphere (Direct Air Capture; DAC) or from CO2-rich gases emitted by point sources, e.g., from single localized emitters such as fossil fuel power plants, oil refineries, industrial process plants, and other heavy industrial sources [21]. Kerosene refined from synfuel obtained through FTS with hydrogen from water electrolysis and CO2 from DAC or a point source classified as electricity-based (due to water electrolysis) synthetic (due to its creation from disaggregated hydrogen and carbon atoms) Paraffinic Kerosene (e-SPK) (as a result of the Fischer-Tropsch process [22]). The described process can be employed to produce a wide palette of hydrocarbons, which are commonly referred to as electrofuels [23] or e-fuel [24]. If the electricity is sourced from renewable sources [18], these are referred to as renewable electrofuels, renewable Power-to-Liquids (PtL), renewable Power-to-Gas (PtG) fuels, or just electrofuels or e-fuels. It is here emphasized that the main characteristic of an e-fuel is the type of final energy carrier mainly used in their production. E-fuels are not per se renewable and especially so if the employed electricity source and carbon atoms are of fossil origin [25]. In, this paper e-SPK is called PtL-kerosene.
The production technologies for PtL-kerosene are understood and technically demonstrated in ongoing [16,26,27] and planned projects [17,19], and both the decarbonization potential and other environmental impacts of PtL-kerosene have been studied. Recurring environmental impact categories and indicators for PtL-kerosene are climate change, land use, water use, and electricity demand [28,29,30].
The publications apply different assumptions and methodologies when quantifying environmental impacts of PtL-kerosene production. As shown by Koj et al. [31] the carried out life-cycle assessment (LCA) studies [32,33,34] on PtL fuels, and on e-fuels [17,35], showing a lack of transparency regarding the system boundaries and partly regarding the definitions of metrics used. Furthermore, only a few impact categories are considered, thereby, possible trade-offs are not comprehensively identified. Additionally, environmental impacts of PtL-kerosene were so far not compared with fossil jet fuel. Another currently discussed issue identified is the possibly underestimated climate change impact of the aviation sector due to non-CO2 effects from jet fuel combustion, which are often not or only marginally considered (e.g., [36]). Thus, the contribution of aviation to global warming could be underestimated [37,38,39], which could result in an inadequate reference to compare the environmental impacts of alternative aviation fuels.
To address these gaps, the goal of this paper is to conduct an LCA to quantify the environmental impacts of PtL-kerosene produced via different production pathways and CO2 sourced via DAC and its consumption in an airplane. The influence of non-CO2 effects is also determined and discussed. Further, the impacts of the PtL-kerosene are compared to fossil jet fuel.

2. Materials and Methods

In this section, it is described how the LCA following the four phases of LCA according to ISO 14040 and ISO 14044 was conducted. The goal and scope are presented in Section 2.1. Next, the selection of impact categories and impact assessment methods are introduced in Section 2.2. Finally, the effects of sulphur and NOx on the acidification potential (AP) and the eutrophication potential (EP) resulting from PtL-kerosene combustion are presented in Section 2.3.
Within Table 1 the main methodological choices of the performed LCA are shown. Additional background information on the modeling choices and the modeling of background data is available in the Supplementary Materials Sections S1 and S2. An overview of the main assumptions and parameters is available in the Supplementary Materials Section S3.

2.1. Goal and Scope Definition

The goal of this attributional, comparative LCA is to quantify the environmental impacts of PtL-kerosene. We investigate PtL-kerosene produced via FTS of syngas from high-temperature and low-temperature water electrolysis and CO2 sourced via DAC, and its consumption in an airplane operating on a globally averaged flight path. As the lifecycle of the airplane is not part of the LCA, the type of flight path only influences the composition of combustion products and the altitude at which they are emitted.
Impacts are compared to Jet A-1, i.e., fossil jet fuel utilized to propel over 99.5% of worldwide civil aviation flights (see own analysis for Jet Fuel in the Supplementary Materials Section S2) to determine existing trade-offs.
Several layouts of the product system are analyzed, representing the technologically possible combination of Fischer-Tropsch PtL plants and carbon capture plants as of today. For the analysis, PtL-kerosene is produced via four different production pathways, and three electricity mixes are analyzed. The scope comprises production pathways that are currently in use or commercially available. The foreground system of fuel production in the PtL-kerosene production plant is shown in Figure 1. The system boundary is described in detail in the Supplementary Materials Section S1.
The production plant produces PtL-kerosene, gasoline and diesel from electricity, water, and CO2 and is composed of two main sub-systems, which are coupled with each other: the DAC plant captures CO2 from the surrounding air and delivers it to the PtL plant, where it is processed further to synfuel. The synfuel out of the Fischer-Tropsch (FT) reactor is then refined to kerosene, diesel, and gasoline. The refining processes are part of the PtL plant.
The input flows to the foreground system are freshwater, electricity, natural gas, and air. Water is purified and deionized before entering the electrolyser. In all configurations, it is produced as a side-product of the Reverse Water Gas Shift (RWGS) reactor and from the refining processes. A total of 90% is circulated through the purifier and the deionizer back to the electrolysis. The electrolyzer delivers H2 and O2, with H2 being used in the RWGS reactor, while O2 is released back into the atmosphere.
CO2 is sourced from air through DAC. Two different DAC plants are studied: a so-called low-temperature DAC process (using a solid sorbent process employing alkaline functionalized adsorbents, currently produced by Climeworks [40]) and a so-called high-temperature DAC process (using a liquid sorbent process employing potassium hydroxide, currently produced by Carbon Engineering [41]). The low-temperature DAC plant has the peculiarity of extracting water from the atmosphere during operation, as a side product. This water is recirculated to the electrolysis at 90% efficiency.
Three different electricity mixes are considered: the German production-based electricity grid mix in its composition as of 2015, an onshore wind farm operating at the average full-load hours available in Germany in 2015 and a polycrystalline, flat-plate photovoltaic (PV) array without solar tracking, operating at the average global horizontal irradiation available in Germany over the 2010s based on data by Wirth [42].
The German natural gas mix is used in the high-temperature DAC plant, where it is converted to electricity and heat in a combined cycle gas turbine power plant coupled with a heat recovery steam generator and a steam turbine. An overview of the layout options and operating conditions is summarized in Table 2.
The sub-systems and the resulting product systems are all comparable, since they fulfill the same functional unit and produce the same products. Considering the input and output flows at the system level, the differences between the different layouts are:
  • the amount of final energy required per unit product (MJ/MJ, PtL-kerosene) of each energy carrier;
  • the types of final energy required, and
  • the amount of water required per product unit (kg/MJ, PtL-kerosene).
  • In all layouts, part of the recovered heat is used within the product system, and mainly serves to preheat the CO2 entering the Reverse Water Gas Shift reactor and deliver thermal energy to the DAC plant. In the HTFT plant, the recovered heat is also used to pre-heat the water vapor entering the electrolyser. In all layouts, enough thermal energy to operate the low-temperature DAC plant is recovered from the waste heat of the PtL plant or is provided via electrical heating.
Not all presented input flows apply to each configuration, e.g., natural gas is only used if the high-temperature DAC plant is employed. The arrow representing water inflow to the DAC plant applies to the high-temperature layout only, where water is needed as process flow. If the low-temperature DAC plant is used, water is extracted from air.
The PtL-kerosene is finally transported to an airport where it is used in an aircraft and combusted, releasing emissions to the ecosphere.
Details on the modeling of the background system can be found in Section S2 of the Supplementary Materials.
The geographical and temporal scopes of the product system are Germany from 2015 to 2020. Those scopes are described by the life-cycle stage of the main processes in the Supplementary Materials Table S3. The geographical boundaries and time horizon are valid in the European region, wherever the final electricity is sourced from PV arrays or wind farms operating with the same capacity factors of PV and wind used in this work. For example, the impacts calculated for layouts where 100% of final electricity is from wind power, are valid in any European location with a capacity factor of 20.5%. This is valid, as assumptions concerning upstream contributions to the impacts are valid over a broad temporal and special horizon encompassing at least mainland Europe over a period extending from 2015–2020 (discussed in the Supplementary Materials Section S1). As for Jet A-1 production, the temporal scope is from 2015 to 2021 [43].
The different layout options allow us to analyze the production system that operates at typical energy conversion efficiencies achievable today, as well as at likely best-case efficiencies reachable in plant designs that are technically feasible today and maximize heat recovery.
The HTFT model represents the “Fuel 1” PtL demonstration plant developed by the German company Sunfire GmbH, operational since 2014, which has received increased attention as a viable HTFT design from industry [18,19]. A DAC plant is currently not employed to Fuel 1.
The LTFT plant design is adapted from a theoretical design employed in PtL-kerosene production from CO2 and hydrogen [44]. The design is used to create a plant model based on PEM, one of the most common electrolyzer types worldwide [45,46].
The two DAC plants are commercially available to date, from Carbon Engineering and Climeworks. One operational condition is modeled for each DAC plant. For the high-temperature DAC plant, the operational condition reflects one product layout available as of 2019. For the low-temperature DAC plant, the operational condition reflects the plant’s performance as of 2019. The carbon capture plants’ impacts are calculated based on literature data (see Supplementary Materials Section S2).
The cut off-criteria used in this study coincide with the cut-off criteria in the used studies for the sub-systems [31,35,47,48,49,50,51,52,53]; details are in Supplementary Materials Section S2.
Figure 1 shows that some products need to be allocated. The plant produces a mix of hydrocarbons, namely PtL-kerosene, (e-)gasoline, and (e-)diesel. Diesel and gasoline are allocated based on their energy content. This is justified and common practice in LCA since the main purpose of the system is to produce an energy carrier [35]. Additionally, all products have a similar lower heating value, varying between 44.11 MJ/kg and 44.16 MJ/kg, i.e., a difference of 0.05% [44].

2.2. Selection of Impact Categories and Assessment Methods

The literature review indicates that the production processes of PtL-kerosene are highly energy-intensive and potentially rely on fossil-intensive electricity [31,32,33,34]. Use-phase emissions are aircraft tailpipe emissions from fuel combustion. Thus, the environmental impacts can be expected to mainly arise from the consumption of hydrocarbons of fossil and non-fossil origin.
Relevant impact categories in the context of the consumption of fossil energy carriers (i.e., jet fuel, natural gas) are climate change, acidification, eutrophication, photochemical ozone creation, freshwater consumption, and land transformation (see Table 3) [31,35,50,54]. Further, the inventory indicator of non-renewable energy use is applied.
Data for the indicator Non-renewable primary energy is sourced from literature. For construction and EOL of HTFT, LTFT, and the DAC plants, the data is based on Lozanovski and Brandstetter [35]. Literature data is also used for the entire lifecycle of natural gas [53,55], electricity from PV [47], wind power [56], and electricity from German grid mix [57]. For the production Jet A-1, the indicator is based on [57]. For additional details, see Supplementary Materials Section S2.

2.3. Adjusting AP and EP for the Levels of Sulphur and NOx in PtL-Kerosene

PtL-kerosene obtained via FTS does not contain sulphur [5]. Its combustion produces neither sulphur dioxide (SO2) nor sulphuric acid (H2SO4). Thus, PtL-kerosene reduces the emissions of particulate matter from aircraft engines, and further results in lower NOx emissions compared to its fossil counterpart [5,58]. The absence of sulphur and reduction of NOx emissions reduces both the AP as well as the EP from fuel combustion.
The AP resulting from jet fuel tailpipe emissions is caused by the combustion products SO2 and NOx. In the case of FT PtL-kerosene, the reduction of SO2 by 100% and of NOx by 10% compared to fossil jet A1 causes an overall reduction in AP from fuel combustion of 18.9%. The 10% reduction in NOx reduces the EP from PtL-kerosene compared to Jet A-1 by approximately 8% (based on findings of [59,60]).
Table 3. Overview of applied impact categories, characterization factors and methods.
Impact CategoryCharacterization Factor/Inventory IndicatorUnitMethod
Climate changeGlobal Warming Potential, 100-year horizon (GWP-100)kg CO2 equivalentsCML 2001, 2015 update [61,62]
AcidificationAcidification Potential (AP)kg SO2 equivalentsCML 2001, 2015 update [61,62]
EutrophicationEutrophication Potential (EP)kg PO4 equivalentsCML 2001, 2015 update [61,62]
Photochemical Ozone CreationPhotochemical Ozone Creation Potential (POCP)kg C2H4 equivalentsCML 2001, 2015 update [61,62]
Non-renewable energy sourcesNon-renewable primary energyMJGaBi definition [63]
Freshwater consumptionFreshwater consumptionkgGaBi definition [64]
Land transformationLand transformationm2GaBi definition using the LANCA method [65,66,67,68]

3. Results

3.1. Comparison of Different Production Layouts for PtL-Kerosene

In this section, the different production layouts of PtL-kerosene are compared. The impact category of climate change is used only, as the trends are transferable to all impact categories. Further, the comparison is considering wind power only, because PV leads to similar environmental impacts. The results of the other impact categories considering wind power as well as PV are displayed in Supplementary Materials Section S4.
The results for the different production layouts for PtL-kerosene are shown in Figure 2 for the product systems HTFT using SOEC and LTFT using PEM, both combined with low- and high-temperature DAC and using wind power as their electricity source.
Overall, the layout producing PtL-kerosene with the lowest life-cycle impacts is the HTFT plant combined with the low-temperature DAC plant and electricity from wind power. This is due to two factors: First, the high efficiency of the PtL plant translates into a low demand for final electricity (1.304 MJ/MJ; PtL-kerosene—95.8% of which is consumed by the PtL plant). Additionally, the waste heat of the PtL plant is used to provide the heat demand of the DAC plant (0.405 MJ/MJ, PtL-kerosene). When the same PtL plant is combined with the high-temperature DAC plant, impacts are higher. This is mainly due to the use of natural gas as a source of final energy in the high-temperature DAC plant. Further, for the given PtL plants and source of final electricity: all impacts are lower when the low-temperature DAC plant is used, and higher when the high-temperature DAC plant is used.
The reduction in climate change is 33% higher if the HTFT plant is combined with the low-temperature DAC compared to the HTFT pant using the high-temperature DAC plant and 5% higher compared to the LTFT plant combined also with the low-temperature DAC plant.
Moreover, the final electricity mix has a strong influence on the environmental impacts of PtL-kerosene, independently of the product system layout as shown in Figure 3. The impacts are low for both production layouts when 100% of final electricity is provided from wind power. The impacts increase with the increase of electricity from PV and the impacts are highest, if a grid mix is used due to the high share of fossil sources in the German electricity mix.

3.2. Relative Contribution of Life-Cycle Stages and Hotspots of PtL-Kerosene

In this section, the relative contribution of the life-cycle stages and the hotspots of PtL-kerosene are shown. As the same trends could be observed both for wind power and PV as electricity sources, only the results for wind power are reported, while the results for PV are shown in Supplementary Materials Section S4.
Overall, the combustion of PtL-kerosene and the consumption of natural gas dominate each impact category (see Figure 2 and Figure 4). One notable exception is the captured CO2 for the impact category of climate change, which contributes to −51% to −86% to CO2 eq. for wind or PV as an electricity source. If the low-temperature DAC plant is used in combination with any PtL plant and the energy mix, its operation causes a small impact in all categories (<2%).
Freshwater consumption is also an exception, because the low-temperature DAC plant generates 0.075 L of freshwater per MJ of PtL-kerosene by extraction from air. When this DAC plant is used, the total water consumption amounts to 0.006 l/MJ when using the HTFT plant, and 0.113 l/MJ when using the LTFT plant. It is noted that when electricity from PV is used, the maximum freshwater consumption decreases to −0.019 l/MJ if the HTFT plant is used (implying a net positive production of freshwater) and 0.07 l/MJ if the LTFT plant is used. If the high-temperature DAC plant is used, the DAC plant contributes significantly to each impact.
Notably, for each category other than freshwater consumption and land transformation, the impact shares of the construction and EOL phases of the PtL and DAC plants amount to ca. 1–8% if the final electricity mix is 100% renewable and the low-temperature DAC plant is used. If the high-temperature DAC plant is used, the contribution of the construction and EOL phases are <5% for each impact and production pathway, except for AP when wind power is used (6.7%) and non-renewable primary energy (up to 8.1%).
The processes and life-cycle stages contributing predominantly to the considered impact categories are described in the following more in detail when applying wind power and PV:
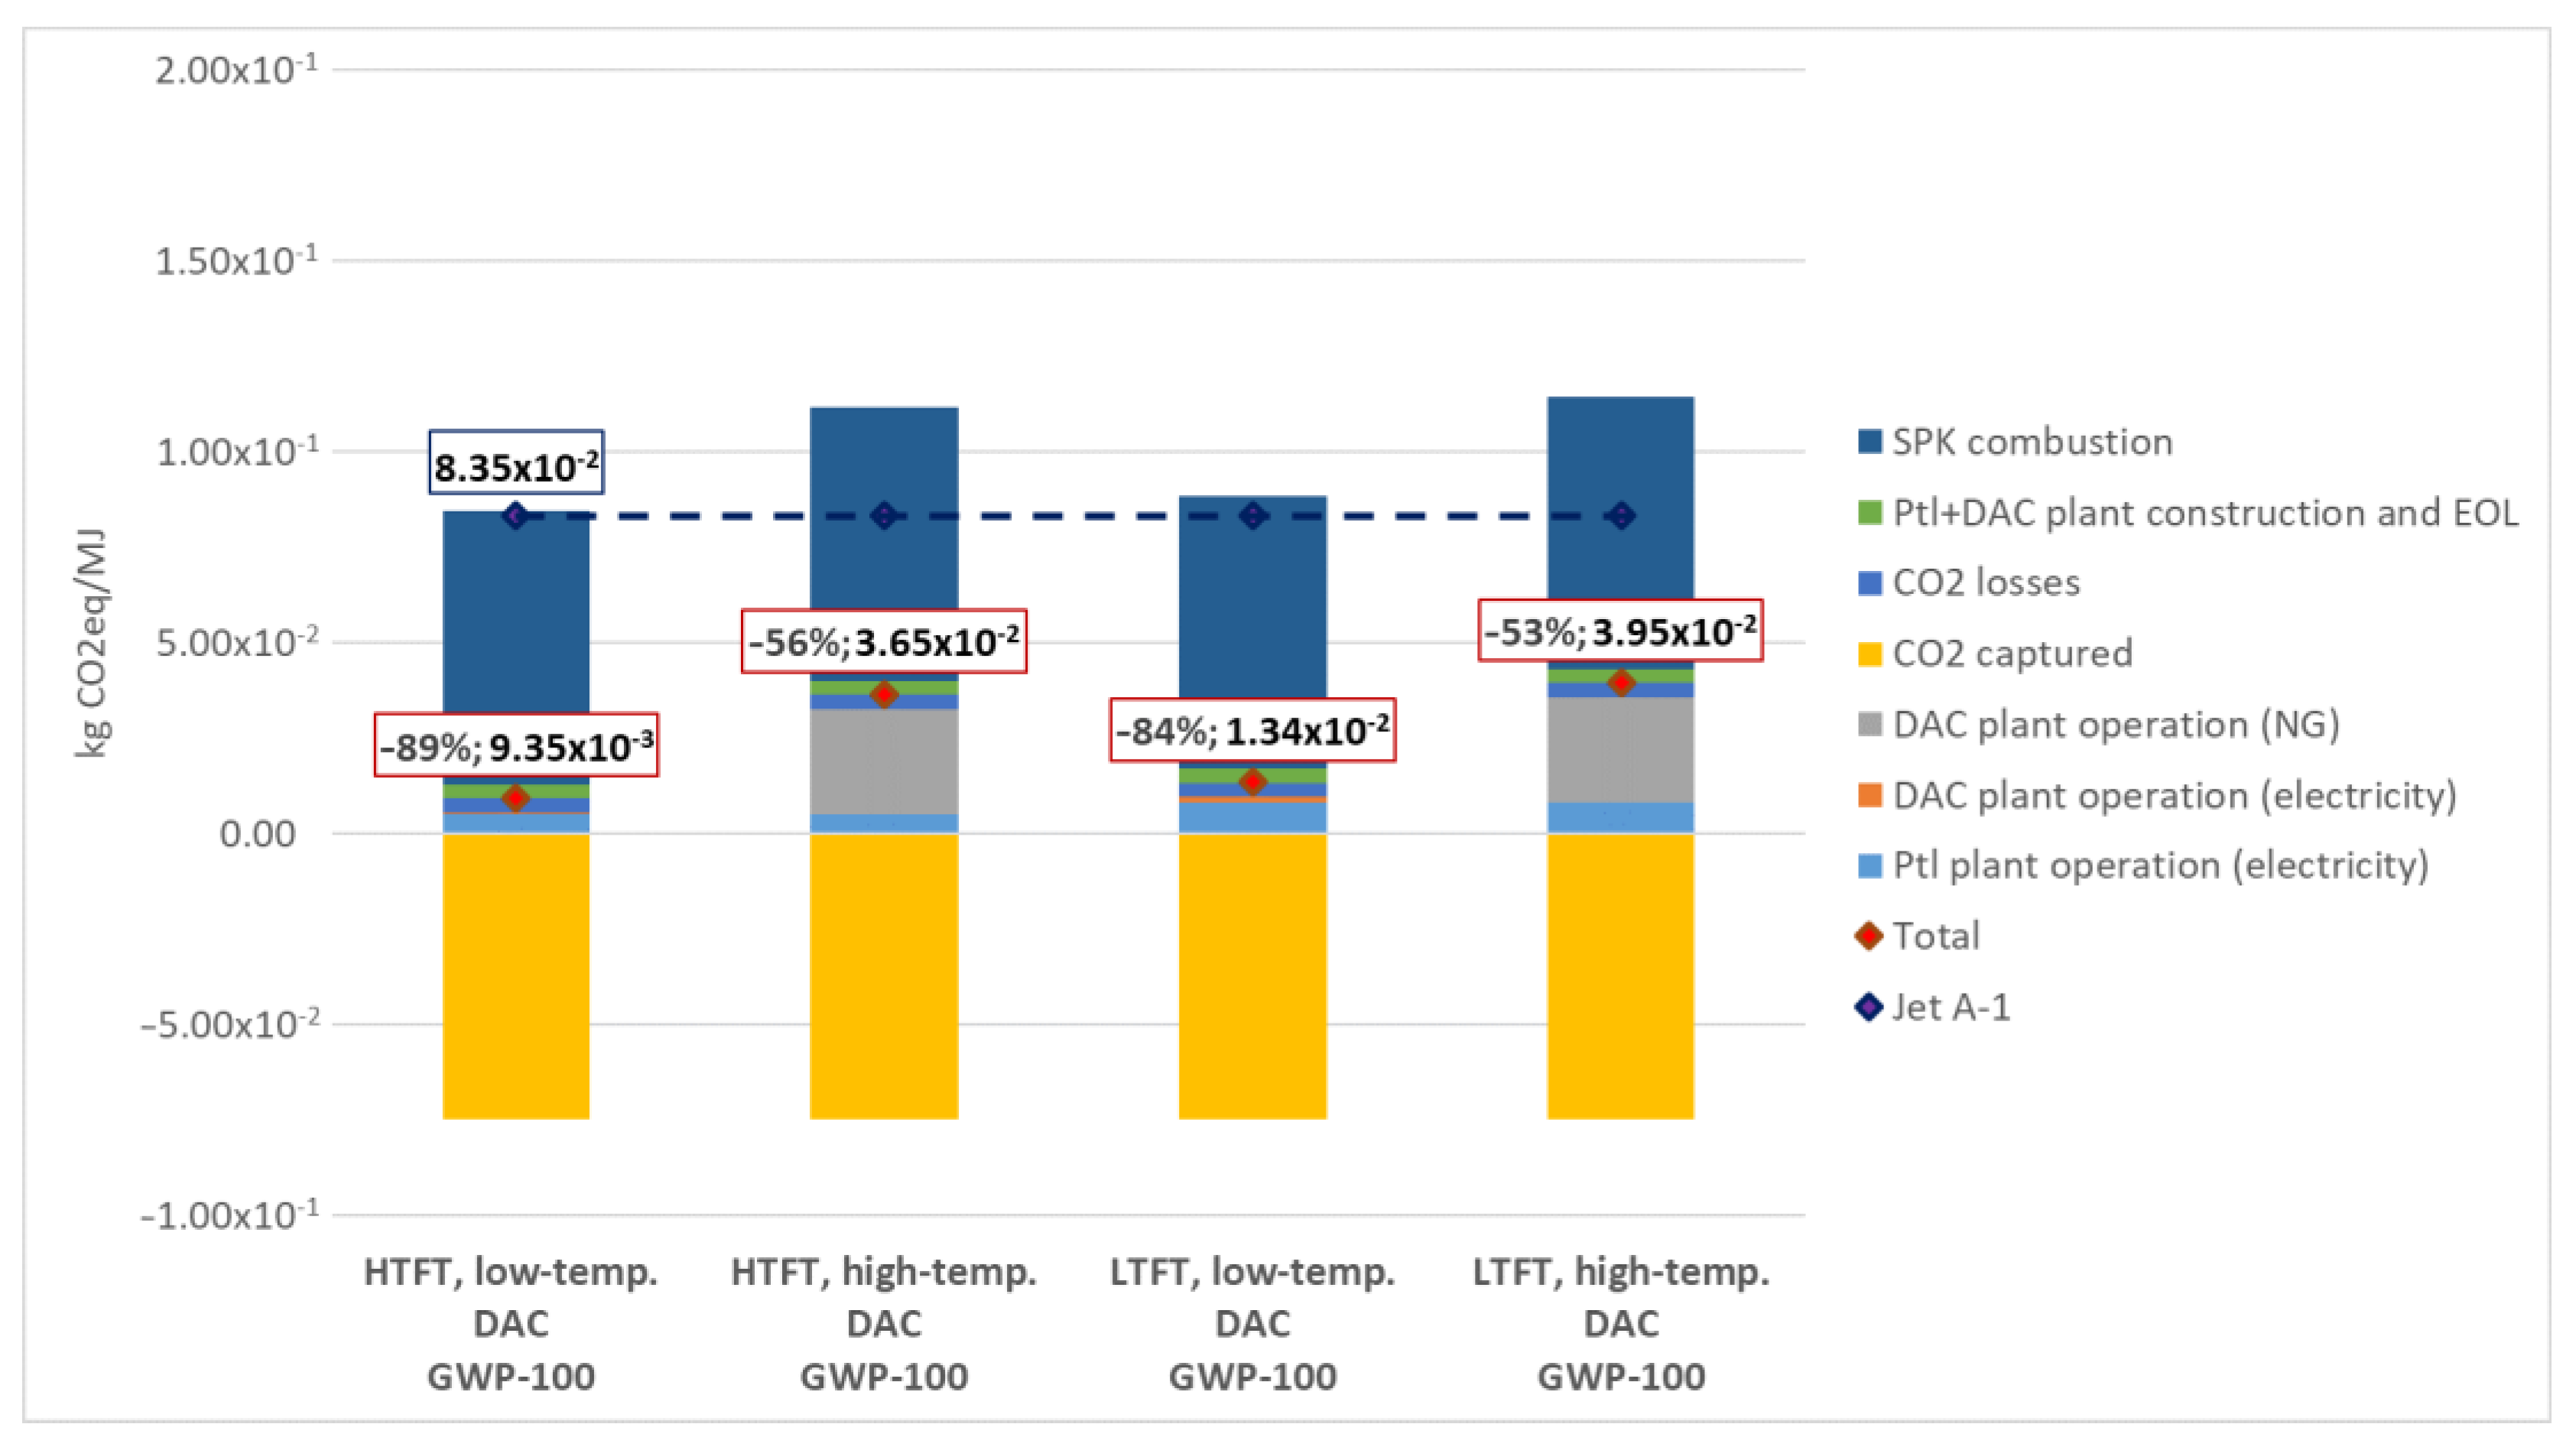
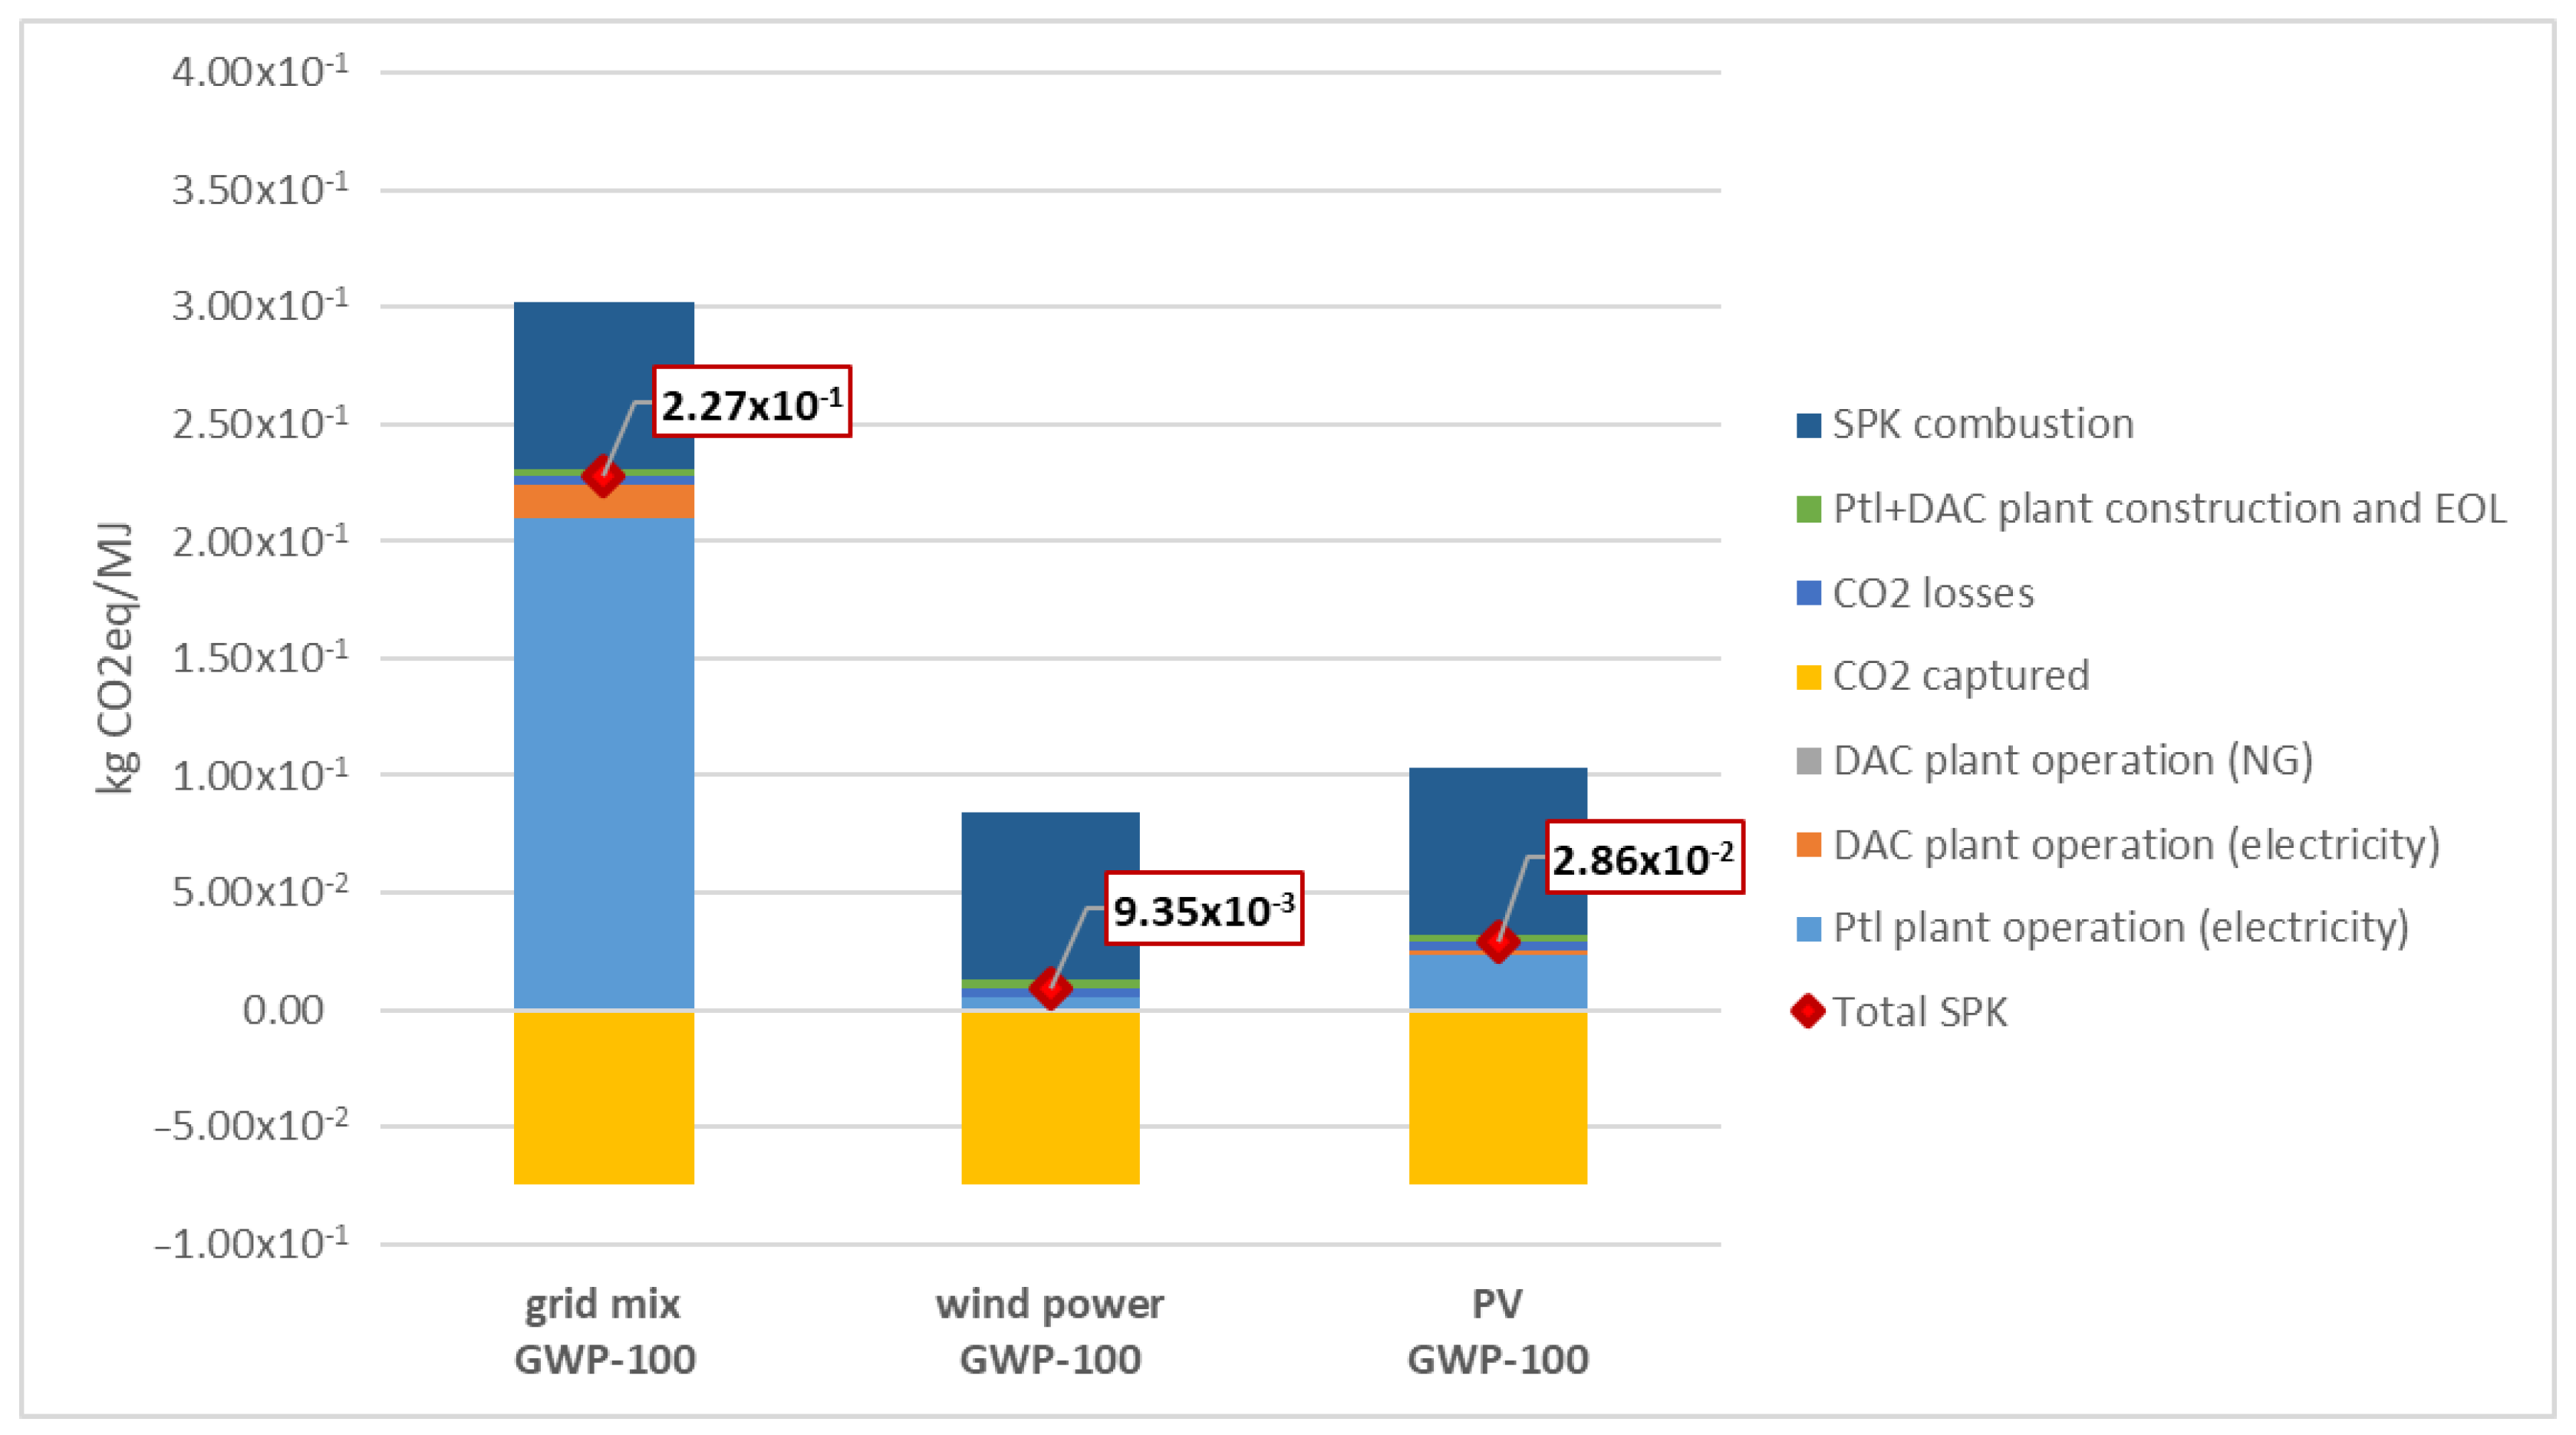
  • Climate change: Hotspots are combustion during the use phase (127% to 171%), CO2 capture during PtL-kerosene production (−64% up to −86%) and PtL plant operation (6% up to 9%), due to electricity-intensive production processes. Additionally, if the high-temperature DAC plant is used, DAC plant operation contributes up to 24% to total CO2 eq. due to the combustion of natural gas.
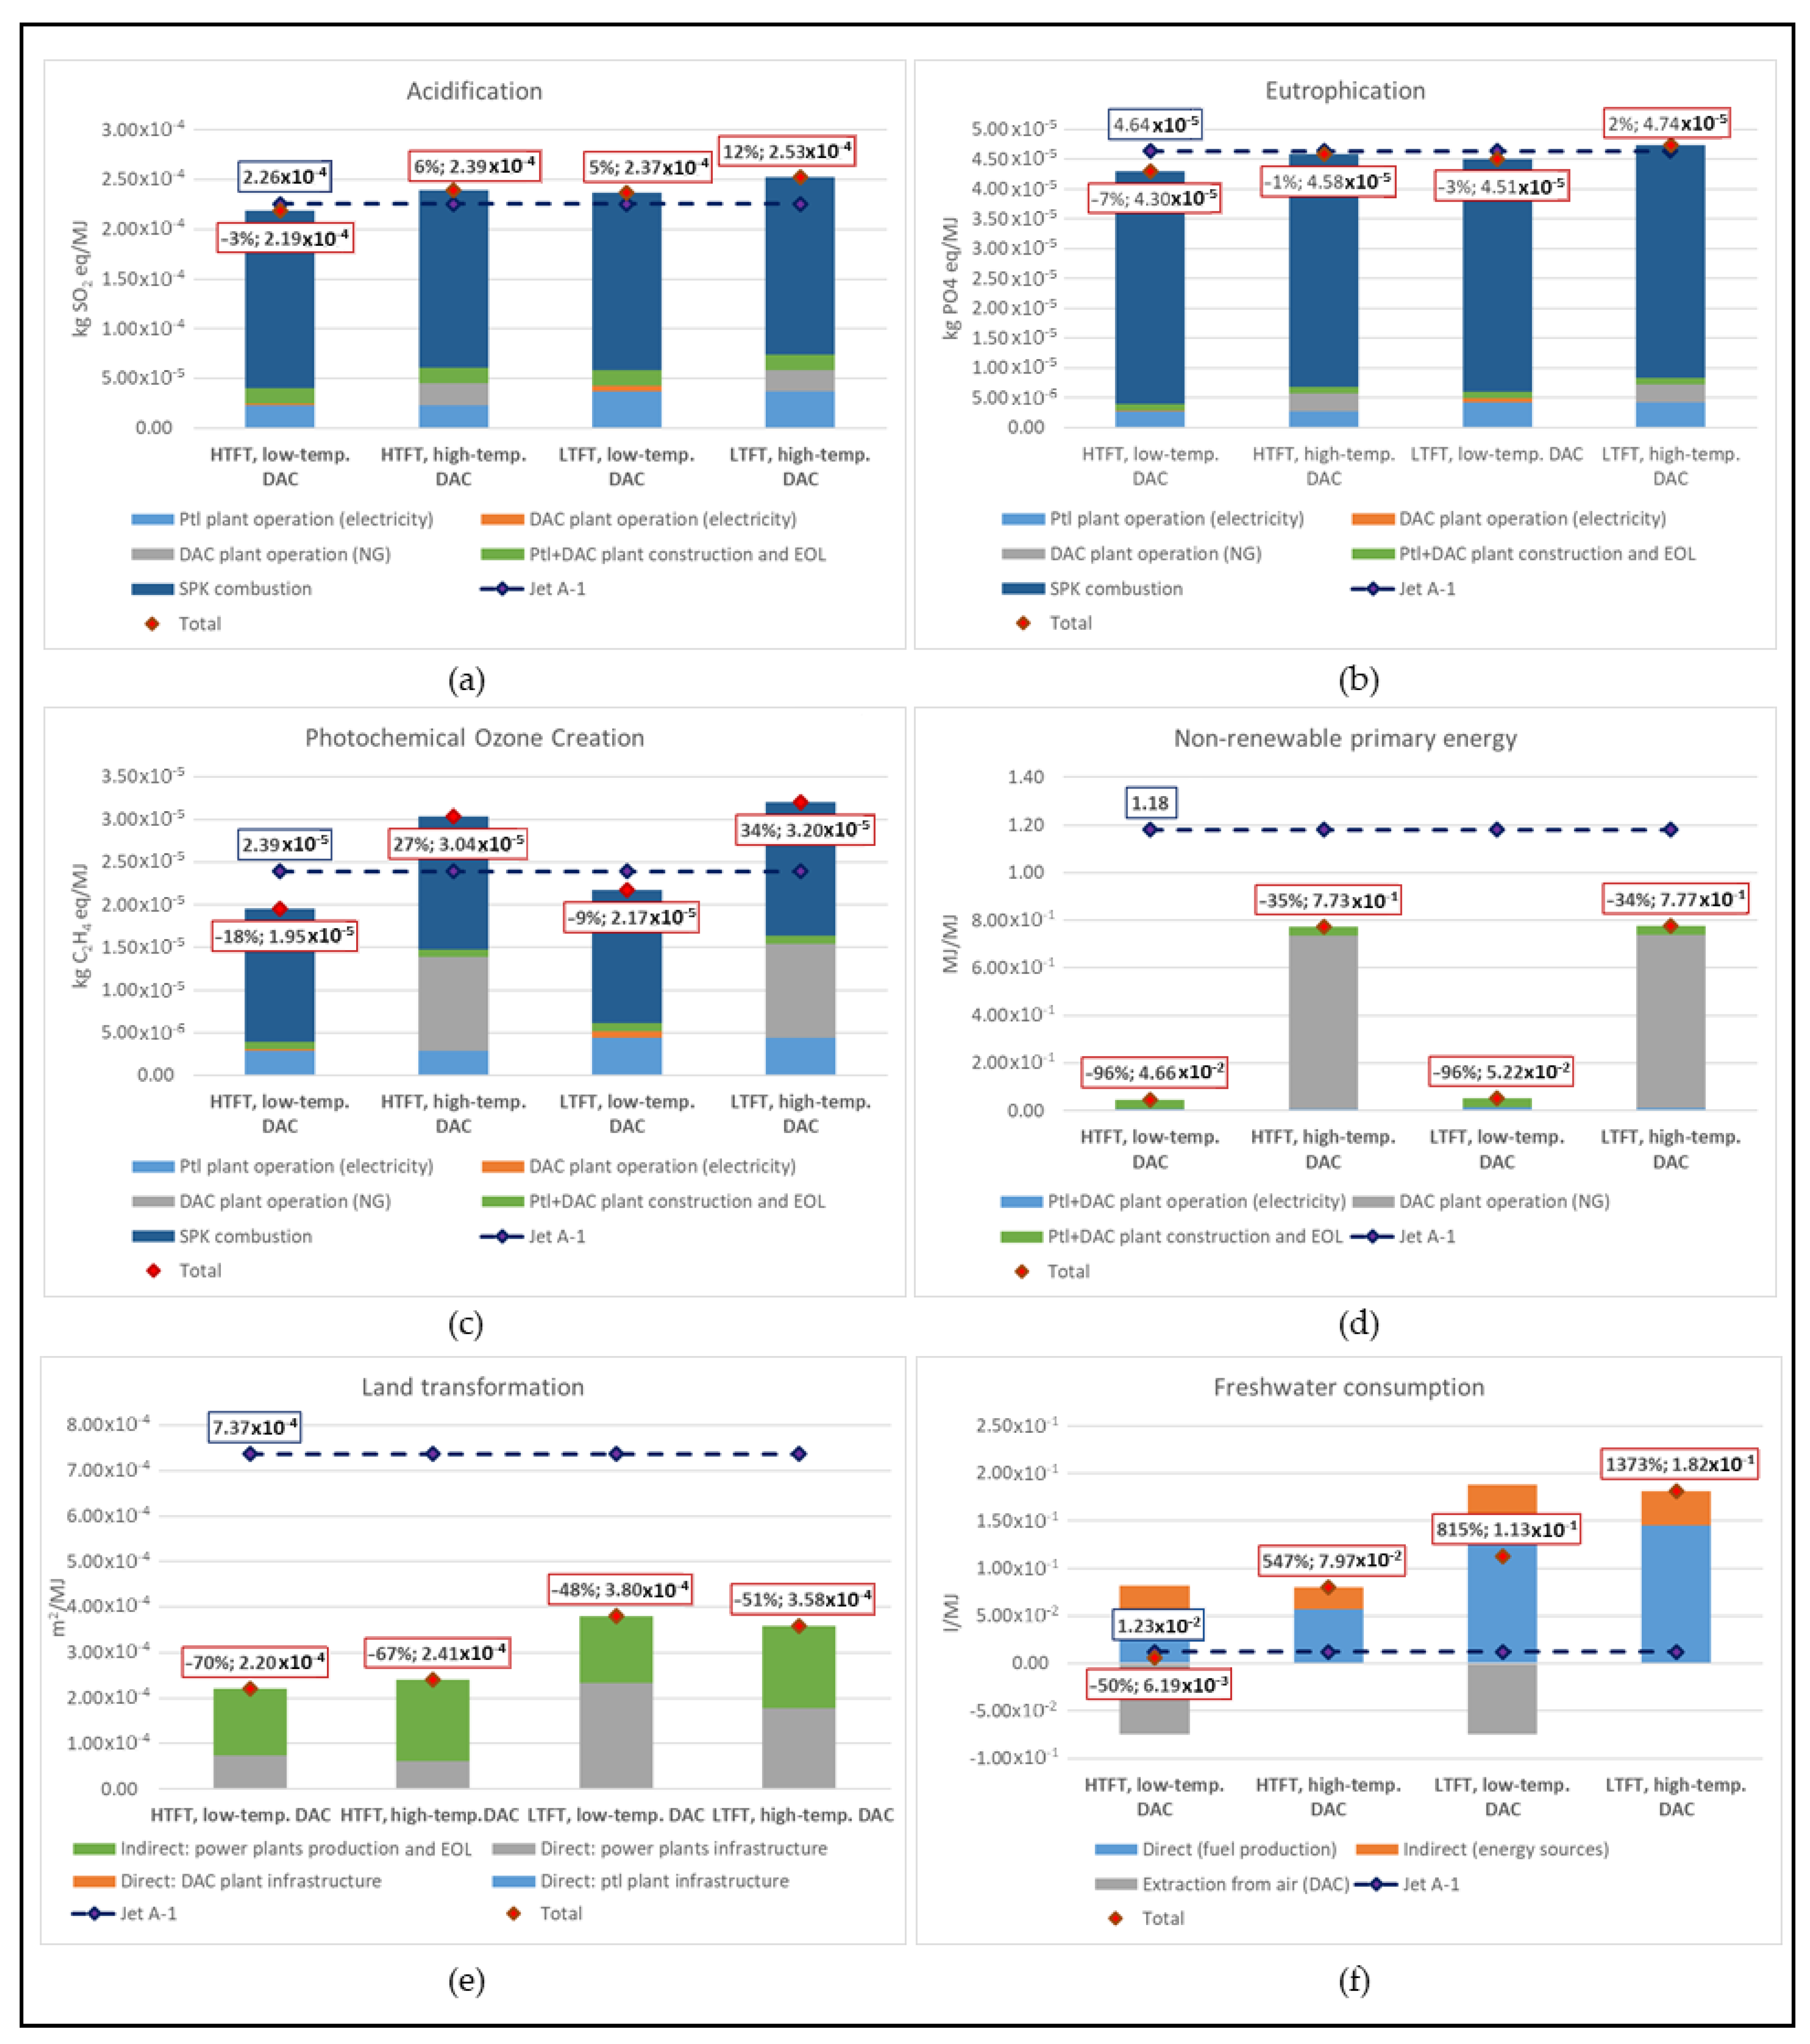
  • AP, EP and POCP: The combustion phase causes up to 44–65% when electricity from PV is used and up to 80–91% when electricity from wind power is used. The PtL plant operation causes up to approximately 90% of the remaining impacts due to the production and transportation processes of the PV modules, the wind turbines and the used electricity in the PtL plant.
  • Non-renewable primary energy: When the high-temperature DAC plant is employed, over 90% is attributable to natural gas; while when the low-temperature DAC plant is used, up to 84% is caused by construction and EOL of the PtL and DAC plants.
  • Land transformation: land transformation from power plant infrastructure, construction and EOL sums up to >99.5% of total land transformation. Indirect land transformation (from the power plants’ production and EOL) comprises 39.8% to 79.6% of the latter, while direct land transformation (from the power plants’ infrastructure themselves) makes up 19.9% to 59.7% of it.
  • Freshwater consumption: The hotspots vary depending on the DAC plant type and the final energy mix. With the low-temperature DAC plant combined with electricity from wind power, the contribution of extraction from air ranges from −226% to 0%, the direct consumption in fuel production up to 197%, and indirect consumption (from the energy sources) up to 129%. For electricity from PV, indirect freshwater consumption is negligible. For the high-temperature DAC plant, extraction from air does not occur and the hotspots are direct consumption in the DAC plant (between 66% and 86%) and in fuel production (i.e., from water electrolysis) (comprising 100% of the remaining share if electricity from PV is used and 70–80% of the remaining share if electricity from wind power is used). Therefore, the main drivers of freshwater consumption are either electrolysis or DAC, when the high-temperature DAC plant is used.
It was shown that the type of DAC plant has a strong influence on Climate Change, POCP, non-renewable primary energy, land transformation and freshwater consumption and less on AP and EP. The reason is that in the high-temperature DAC plant, 100% of the final energy is provided by natural gas.

3.3. Comparative Results of PtL-Kerosene and Fossil Jet A-1

In this section, the comparison to fossil Jet A-1 of different layouts applying wind power is shown (see Figure 2 and Figure 4). For PV, this comparison can be seen in Supplementary Materials Section S4.
As mentioned in Section 3.1, depending on the production pathway and final electricity mix, the impacts of PtL-kerosene vary significantly. PtL-kerosene can have significantly higher impacts than Jet A-1 when grid electricity is used.
For PtL-kerosene produced via any pathway and using PV as an electricity source AP (+78% up to +132%), EP (+30% up to +62%), POCP (+23% up to +95%) and land transformation (+329% up to +680%) are higher compared to Jet A-1. Freshwater consumption is lower (−251%) compared to Jet A-1, when the HTFT and low-temperature DAC plant is used, but higher (+358%) with the HTFT and high-temperature DAC plant. When electricity from wind power is used as the electricity source, compared to fossil Jet A-1, AP, EP, POCP, and freshwater consumption can be either higher (AP: +12%, EP: +2%, POCP: +34%, freshwater consumption: +1373%) for the LTFT combined with high-temperature DAC or lower for the HTFT combined with low-temperature DAC (AP: −3%, EP: −7%, POCP: −18%, freshwater consumption: −50%). When German grid electricity (reference year 2015) is used, all impacts are significantly higher than in Jet A-1. CO2 eq., for example, are increased by +173% (GWP) compared to Jet A-1. It emerges that overall, the impacts of PtL-kerosene for a given final electricity mix vary significantly depending on the production pathway.
When electricity from wind power is used as electricity, the reduction in CO2 eq. of PtL-kerosene compared to Jet A-1 varies between 52.6% and 88.9% (GWP), depending on the layout. The lowest CO2 eq. of PtL-kerosene (HTFT combined with low-temperature DAC) amounts to 9.3 g CO2 eq./MJ compared to 83.5 g CO2 eq./MJ of Jet A-1, i.e., a maximum reduction of 88.9% GWP (see also Section 3.1, Figure 2). If non-CO2 effects are considered, the reduction potential of PtL-kerosene is lower. This is discussed in Section 4.2.
More information regarding the break-even points considering the impact category climate change regarding the GWP of electricity production can be found in the Supplementary Materials Section S4.

4. Discussion

The performed LCA has some uncertainties and challenges, which have to be considered when interpreting the results. These are described in detail regarding limitations due to data availability and limitations due to the scope of the work (see Section 4.1). Considering non-CO2 effects for fuel combustion is discussed in Section 4.2. Further, challenges in accounting for land use transformation are discussed (see Section 4.3). Finally, a sensitivity analysis is presented (see Section 4.4).

4.1. General Challenges

Due to missing data, some impacts of some life-cycle stages of certain processes could not be quantified and were instead estimated (see Supplementary Materials Section S2). We here highlight the processes mostly affected by lack of data.
As of currently no studies quantify the environmental impacts associated with the construction and EOL of the DAC plants. These are here estimated by analogy with other systems, which yields uncertainty.
FT-PtL-kerosene contains no aromatic molecules, which are essential in jet fuels, because they have a softening and swelling effect on rubber sealings in aircraft tanks preventing leakages. Consequently, the aromatic content of PtL-kerosene must be increased to allow for it to be fully comparable to Jet A-1. The effects of increasing the aromatic content of PtL-kerosene on its environmental impacts have not been analyzed in literature to date, which contributes to uncertainty in the results.
Finally, additional data can be gathered to increase the validity of the results, especially life-cycle inventory data for the DAC plants, the LTFT plant, and for carbon conversion efficiency.
The scope of this paper could be modified in order to build a broader body of data valid for different technological, geographical and temporal boundaries. The following aspects might be of interest for future studies:
  • A precise quantification of the impact of EOL practices, and of the lack thereof (in this work, it is assumed that these practices are carried out on each component).
  • The effects of electrical infrastructure needed for the off-grid operation of the product system, such as power lines, converters, and in particular the effects of energy storage devices on the product system.
  • The effects of transport practices on the environmental impacts of PtL-kerosene.
  • The environmental impacts of water purification and deionization. A characterization of the rate of water extraction from air based on atmospheric data and/or the geographical location of the product system.
It is assumed that the impacts from the construction and EOL phases of the high-temperature DAC plant are comparable to the ones of the low-temperature DAC plant. This assumption can be challenged. The comparative impacts can vary significantly depending on the location of production of Jet A-1. Therefore, performing the same analysis in a different geographical location would be of interest.
Next the climate impact of aviation fuels in existing studies (e.g., [17,49,50,69,70]), is compared to the GWP of PtL-kerosene in this study. The lowest CO2 eq. of PtL-kerosene adds up to 9.23 g CO2 eq./MJ (see Section 3.1, Figure 2). For reference, the CO2 eq. emissions of aviation fuels produced from biomass (feedstocks: switchgrass, Soybean oil, palm oil, rapeseed oil, jatropha oil, and algae oil), measured as GWP-100 and without including land use change ranges from 18 g CO2 eq./MJ to 55 g CO2 eq./MJ [17]. The same study found that the GWP-100 of PtL-kerosene produced via HTFT or LTFT combined with DAC and with final electricity from PV or wind power ranges from 1 g CO2 eq./MJ to 28 g CO2 eq./MJ [17]. The lowest possible GWP of PtL-kerosene is more than nine times higher in the present study. This discrepancy cannot be further commented upon, because the cited study does not reveal enough details on its methodology and system boundaries.
The low-temperature DAC plant extracts water from air at a rate of 1 t/tCO2 captured [71], while the high-temperature DAC plant uses water at a rate of 4.7 t/tCO2 captured, but does not consume any, as the water is first kept in the production loop and later discharged. As shown in Section 3.2 for the HTFT layout with PV as an electricity source, the use of the low-temperature DAC plant can lead to a net positive amount of water produced over the plant’s life cycle (0.019 l/MJ). This result can be challenged in future research. The source used to quantify the impacts of electricity from PV indicates that no water is consumed over its life-cycle, but only used. For comparison, one review article on water-related LCA metrics of electricity generation, found that freshwater consumption from PV ranges from 3.6 l/KW h to 7.50 l/kW h [72].
As shown before, the impact shares for the impact categories GWP, AP, EP, POCP, and non-renewable primary energy of construction and EOL phases of the PtL and DAC plants amount to approximately 1–8%. Therefore, environmental impacts of the construction and EOL phases of the PtL and DAC plants might be considered not negligible, contrary to Lozanovski and Brandstetter [35].
As mentioned in Section 2.1, two DAC plants that are commercially available today are chosen for this study—the one from Climeworks employing a low-temperature DAC technology and the one from Carbon Engineering employing a high-temperature DAC technology. An assessment on whether these represent the market average high-temperature and low-temperature DAC plants was not performed. It is however pointed out that the two companies providing the two analyzed plants are two of the three DAC technology providers to offer their technology on the market as of 2021, the third one being Global Thermostat. A review of available DAC technology producers revealed that three offer commercial solutions to date [73,74,75], while five indicate to be at different product development stages [76,77,78,79,80]. Viebahn et al. [71] listed the same three DAC technologies found to be commercially available in this work.
The presented results therefore do not allow general statements for low- and high-temperature DAC plants, but for the studied plants. This means that further studies should also consider other types of low- and high-temperature DAC plants, e.g., further development of the high-temperature DAC plant which uses renewable energy instead of 100% natural gas. This could have a strong influence on the comparison of different PtL-kerosene production plant layouts using low- or high-temperature DAC plants.
This work focuses on the environmental impacts of PtL kerosene. For completeness, it is noted that the cost-effectiveness of PtL-kerosene is challenging. Compared to the weighted average price of jet A-1 from 2015 to 2020, the production cost of PtL-kerosene is expected to be between up to five times higher in 2030 and close to 1.2 times higher in 2050, declining significantly between today and 2050. According to several recent studies, PtL-kerosene production costs are expected to range from 1880 €/t to 2600 €/t in 2030, 940 €/t to 2080 €/t in 2040, and 610 €/t to 1740 €/t in 2050 [81,82,83,84]. The relatively large cost ranges are mainly due to differing assumptions on production sites, CO2 sources and electricity prices. The market price of jet A-1 by comparison has ranged between 260 €/t and 675 €/t with a weighted average of 488 €/t from January 2015 to January 2020 [85]. It is further noted that different projected costs of CO2 emissions are not included in these values, which can influence the price of Jet A-1 and the production costs of PtL-kerosene significantly.

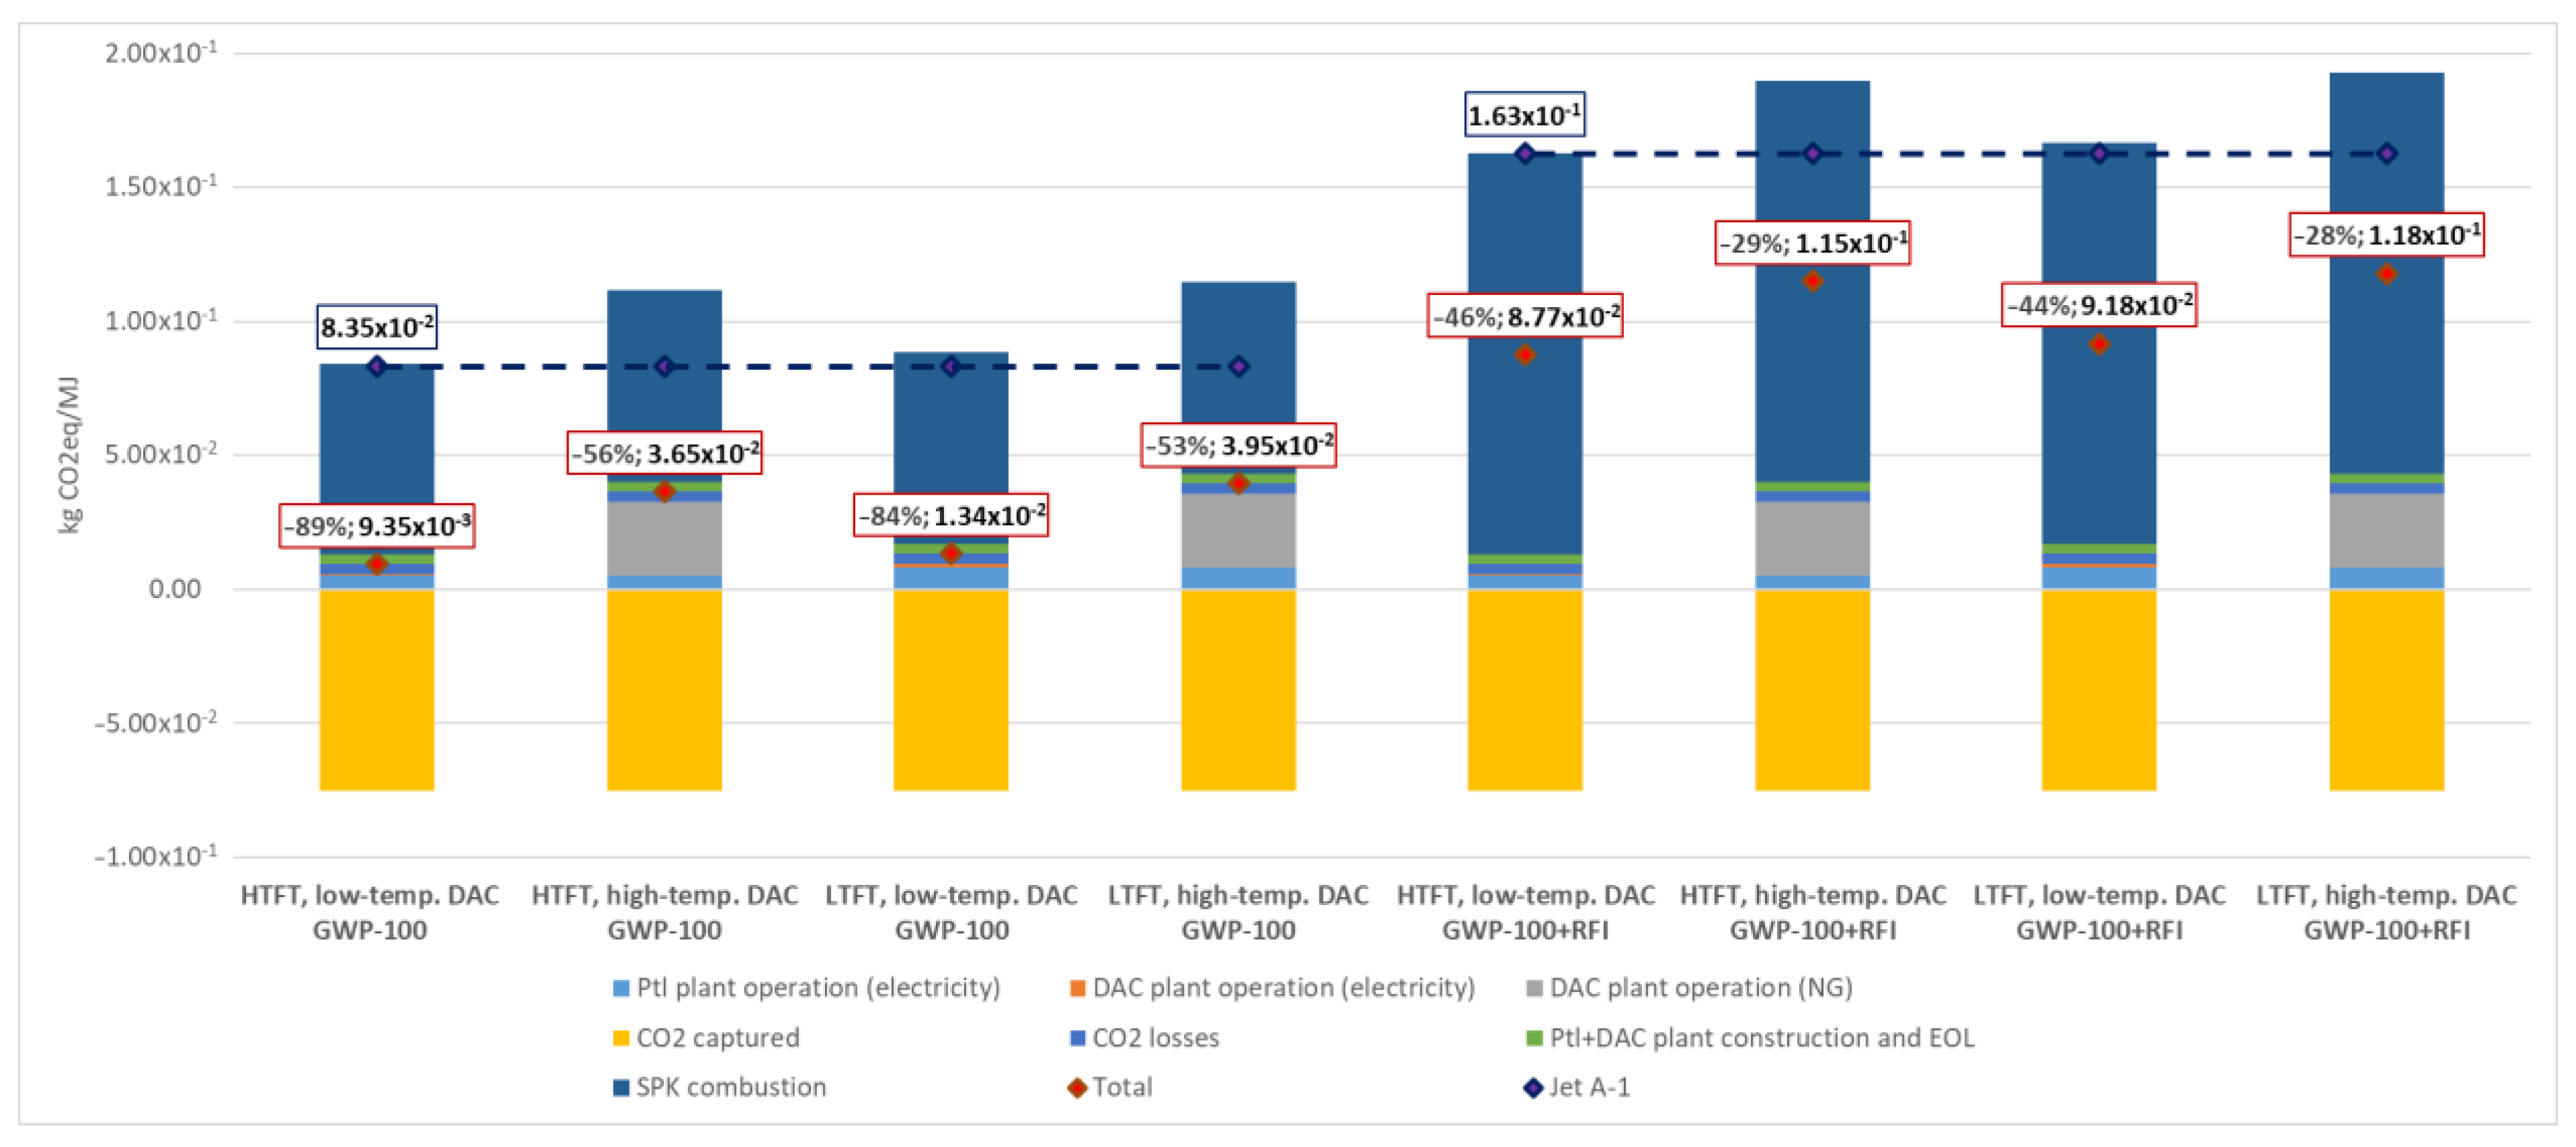
4.2. Considering Non-CO2 Effects from Aviation Fuel Combustion

In literature, the global warming effect associated with the use of aviation fuels is mainly quantified by using the GWP or CO2 emissions [36,38]. However, it is discussed that these metrics ignore the warming effect of non-GHGs and therefore do not quantify the whole global warming effect of aviation fuels [86,87,88,89]. These effects are called non-CO2 effects and result from the release of tailpipe emissions in the stratosphere. They can cause a significant amount of radiative forcing, and thus a higher CO2 eq. value compared to the CO2 eq. value calculated with just GWP [86,87]. In this section, the impact of these non-CO2 effects on the life-cycle impact assessment results is presented and discussed.
There is a significant statistical uncertainty on the radiative forcing caused by non-CO2 effects of global aviation [90]. However, despite these uncertainties, several scholars propose to use a Radiative Forcing Index (RFI) as means of quantifying all warming effects of aviation [88,91].
The RFI translates the CO2 emissions from fuel combustion to a CO2 eq. value. The equation proposed by Jungbluth and Meili [91] is used in this section (see Equation (1)), because it is based on an extensive, recent review of RFI-related methods. The “Characterization Factor” (CF), which, multiplied by the CO2 emissions of the fuel, quantifies the warming effect of fuel combustion for a given flight path in terms of CO2 eq. on a 100-year horizon.
CF = RFI   all ( 1 CO 2   share ,   stratosphere ) CO 2   share ,   stratosphere
The RFI for the total tailpipe CO2 emissions of aircraft (RFI all) must be chosen according to the literature. In this paper, it is chosen as 2, following Jungbluth and Meili [91].
The share of stratospheric tailpipe CO2 emissions is the share of jet fuel consumption during the “cruise phase” of a flight. The share of jet fuel consumed during the cruise phase (relative to total jet fuel consumption during all aircraft operation phases) is set to 91.1% (share of stratospheric CO2) based on data from Argonne National Laboratory and is a representative average of worldwide civil aviation flight paths [49] (see also Supplementary Materials Section S2). For a specific flight path, the CF and therefore the GWP + RFI of PtL-kerosene can be significantly higher or lower (see e.g., [89]).
Thus, the CF amounts to 2.1, see Equation (2):
CF = 2 ( 1 0.911 ) 0.911 = 2.1   [ g   CO 2 eq g   CO 2 ] .
The RFI is calculated as shown in Equation (3):
RFI = CF TtWa   CO 2   emissions   [ CO 2   eq MJ ] .
The GWP of the Well-to-Tank phase of PtL-kerosene is added to the RFI from the combustion phase, resulting in the GWP + RFI of PtL-kerosene and Jet A-1.
Over the life-cycle of PtL-kerosene, radiative forcing is caused both by greenhouse gases, measured as GWP-100, as well as other non-CO2 effects, accounted for through the RFI. Since both indicators are measured in CO2-equivalents (CO2 eq.), their specific values are summed up in one single indicator, referred to as the GWP + RFI indicator. The GWP + RFI indicator is measured as mass of CO2 eq. per functional unit (g CO2 eq./MJ).
As Figure 5 shows, the Capacity Factor of the RFI has a strong influence on the CO2 eq. of the combustion phase. However, the identified trends of Section 3.1 regarding the comparison of the production layouts of PtL-kerosene stay the same, if non-CO2 effects are considered, as the CF is assumed to be a constant factor for all PtL-kerosene fuels as well as for Jet A-1. Thus, the HTFT plant combined with the low-temperature DAC plant and electricity from wind power remains the layout with the lowest impacts regarding Climate Change.
When it comes to the reduction potential of PtL-kerosene compared to Jet A-1, the relative reduction in CO2 eq. depends on the value of the RFI. When electricity from wind power is used as electricity, the reduction in CO2 eq. of PtL-kerosene compared to Jet A-1 decreases depending on the layout from a reduction of 52.6–88.9% (without considering non-CO2 effects, see Section 3.3) to a reduction of 27.6–46.2% (considering non-CO2 effects).
That means that for the lowest CO2 eq. of PtL-kerosene (HTFT combined with low-temperature DAC), considering non-CO2 effects increases to 87.6 g CO2 eq./MJ compared to 162.8 g CO2 eq./MJ of Jet A-1, leading to a reduction of 46.2% GWP + RFI. A similar value (48%) is found by Cames et al. [92]. Without considering non-CO2 effects, the absolute values amount to 9.3 g CO2 eq./MJ for PtL-kerosene (HTFT combined with low-temperature DAC) and 83.5 g CO2 eq./MJ for Jet A-1, see Section 3.3.
This work highlights the importance of an accurate quantification of the RFI. It can be therefore interesting to analyze whether using Jet A-1 and modifying the flight path in order to decrease the RFI can yield the same reduction in warming potential as substituting Jet A-1 with PtL-kerosene while maintaining the same flight path.
However, a precise quantification of a confidence interval for the RFI is a task pertinent to atmospheric physics, and goes beyond the scope of this work. Further studies should provide a more a precise quantification of a confidence interval for the RFI. Stratton et al. [88] conclude that including non-CO2 effects in the form of RFI leads to broad challenges for the assessment of new energy technology options. These challenges should be addressed in further studies.

4.3. Challenges in Accounting for Land Use Transformation

An effort is made to consider both the land transformed directly by the infrastructure of the sub-systems of the product system and land transformed indirectly by upstream and downstream processes linked to all foreground and background processes. For some subsystems or flows, however, no data is available.
Nonetheless, both direct and indirect land transformation are quantified for all energy carriers. Table 4 provides an overview of the scope of land transformation by subsystem or flow.
Among the available data, land transformation is caused almost entirely (>99%) by energy carriers. It is unclear how the missing data influence the cumulative amount of land transformation. As data for direct land transformation is available, the result can be considered as reliable. However, unknown contributions might come from water and water provision systems in Germany.
In the results, Section 3.2, land transformation is aggregated in two categories: “direct land transformation caused by the PtL-kerosene production plant” and “indirect land transformation caused by the energy carriers”. The results are presented in such aggregation to highlight that the PtL-kerosene production plant itself contributes negligibly to total land transformation (<0.3%), and that total land transformation is mainly caused directly and indirectly by the wind and PV power plants.
As land transformation linked to the installation of renewable power has proven to be a polarizing topic in the political discourse [93,94], it is pointed out that considering different geographical locations could have a strong influence on land transformation. In this paper, it is assumed that all occupied land classifies as transformed land when no additional data is available.

4.4. Sensitivity Analysis

Moreover, a sensitivity analysis is carried out on PtL-kerosene produced for the layout resulting in the lowest impacts (HTFT combined with low-temperature DAC, see Figure 6).
The sensitivity analysis indicates that for PtL-kerosene produced with this layout, impacts vary by less than +/−2.5% for a variation of the wind capacity factor of +/−20%, while for a variation of the global horizontal irradiation (GHI) of +/−20%, the impacts vary by less than +/−7.9% exception made for a peak of +11.9% for AP. It can thus be concluded that the environmental impacts of PtL-kerosene are more disposed to variations in the yield of solar PV compared to the capacity factor of wind power. The variations are lower for the impacts of PtL-kerosene produced via the layout resulting in the highest impacts and are consistent with the conclusion above. The lower variations are mainly ascribable to the higher relative impacts caused by natural gas in the latter layout, which in turn result in lower relative variations of each impact.
Finally, considering the results from the sensitivity analysis, it follows those variations of the global horizontal irradiation and the capacity factor of wind power can have a significant influence on AP, EP, POCP and non-renewable primary energy. For reference, the average capacity factor of wind power in Germany in 2019 was 27.1% [95] (31% higher than in this study) and the global horizontal irradiation in 2019 ranged from 1000 kW h/(m2 a) to 1350 kW h/(m2 a) depending on the region [96] (up to 28% higher than in this study). It follows that the accuracy of said impacts can be increased significantly if the exact geographical location (and thus global horizontal irradiation and capacity factor) of the wind farm and/or PV plant are known.

5. Conclusions

The presented LCA of PtL-kerosene quantifies the life-cycle environmental impacts of PtL-kerosene and the reduction potential for the analyzed impact categories resulting from substituting fossil jet fuel with PtL-kerosene. The results show that PtL-kerosene produced with renewable energy has a huge potential in contributing to the decarbonization of the aviation sector and thus, could play an important role in achieving the global climate targets until the year 2050. The cost-effectiveness of PtL kerosene remains a challenge.
From all investigated layouts, the HTFT-based plant in combination with a low-temperature DAC using wind power as electricity source reduces the environmental impacts in all analyzed impact categories. Compared to fossil Jet A-1 a reduction of −88.9% for GWP and −52.6% for GWP + RFI could be identified. Even if the reduction potential of PtL kerosene produced with CO2 from air and renewable energy is significant, it also indicates that still a huge amount of lifecycle GHG emissions remain compared to fossil Jet A-1 (11.1% for GWP alone, 47.4% for GWP + RFI) and need to be compensated in order to reach net-zero GHG emissions for the aviation sector.
Further, when wind power is used, no trade-offs with other impact categories are identified. This is different for PV, as AP, EP, POCP and land transformation are higher compared to fossil Jet A-1, while other categories, including GWP, are lower. This highlights that electricity from wind power comes with significant co-benefits compared to electricity from PV, in this context.
A comparison to other studies on biofuels for the aviation sector shows that PtL-kerosene produced with renewable energy might have higher potential in reducing the environmental impacts.

Supplementary Materials

The following supporting information can be downloaded at: https://www.mdpi.com/article/10.3390/su141710658/s1. The Supplementary Materials provides additional information on the methodological choices (Section S1), the modeling of background data (Section S2), an overview of the main assumptions and parameters (Section S3) and the break-even points of CO2 eq. emissions of PtL-kerosene (Section S4). An MS Excel file with all LCIA results is also available online.

Author Contributions

Conceptualization, M.M., D.M. and V.B.; methodology, M.M.; investigation, M.M.; data curation, M.M. and D.M.; writing—original draft preparation, M.M. and D.M.; writing—review and editing, V.B. and M.F.; supervision, M.F.; project administration, V.B. All authors have read and agreed to the published version of the manuscript.

Funding

This work was partly funded by the Deutsche Forschungsgesellschaft (DFG) under Grant number: FI 1622/6-1 (project RessMob: Assessment of abiotic and biotic resources within the mobility sector—development of assessment criteria, methods, and concepts). We acknowledge the support of the Open Access Publication Fund of the TU Berlin.

Institutional Review Board Statement

Not applicable.

Informed Consent Statement

Not applicable.

Data Availability Statement

The data presented in this study are available in the article and Supplementary Material.

Acknowledgments

We would like to thank Lena Jarosch from TU Berlin for her support with streamlining the citations and the Supplementary Material.

Conflicts of Interest

The authors declare no conflict of interest.

References

  1. Abergel, T.; Dean, B.; Dulac, J. UN Environment—Global Status Report 2017; UN Environment and International Energy Agency: Nairobi, Kenya, 2017; ISBN 9789280736861. [Google Scholar]
  2. Hader, M. COVID-19—How We Will Need to Rethink the Aerospace Industry: Plunge in Air Traffic Will Deeply Impact Demand for New Aircraft. Available online: https://www.rolandberger.com/en/Insights/Publications/COVID-19-How-we-will-need-to-rethink-the-aerospace-industry.html (accessed on 7 March 2022).
  3. EUROCONTROL COVID-19 Impact on the European Air Traffic Network. Available online: https://www.eurocontrol.int/covid19 (accessed on 7 March 2022).
  4. NLR and SEO Amsterdam Economics. Destination 2050—A Route to Net Zero European Aviation Preface; SEO Amsterdam Economics: Amsterdam, The Netherlands, 2021. [Google Scholar]
  5. Masiol, M.; Harrison, R.M. Aircraft Engine Exhaust Emissions and Other Airport-Related Contributions to Ambient Air Pollution: A Review. Atmos. Environ. 2014, 95, 409–455. [Google Scholar] [CrossRef] [PubMed]
  6. International Energy Agency Oil Final Consumption by Product—Retired Database. Available online: https://www.iea.org/classicstats/statisticssearch/report/?country=WORLD&product=oil&year=2015 (accessed on 12 September 2019).
  7. Davis, S.J.; Lewis, N.S.; Shaner, M.; Aggarwal, S.; Arent, D.; Azevedo, I.L.; Benson, S.M.; Bradley, T.; Brouwer, J.; Chiang, Y.M.; et al. Net-Zero Emissions Energy Systems. Science 2018, 360, eaas9793. [Google Scholar] [CrossRef]
  8. IPCC Global Warming of 1.5 °C. Available online: https://www.ipcc.ch/sr15/ (accessed on 22 May 2019).
  9. UNFCCC. Adoption of the Paris Agreement (FCCC/CP/2015/L.9/Rev.1). Available online: http://unfccc.int/resource/docs/2015/cop21/eng/l09r01.pdf (accessed on 3 December 2021).
  10. Jiang, H. Key Findings on Airplane Economic Life—Boeing Commercial Airplanes; Boeing: Seattle, WA, USA, 2013. [Google Scholar]
  11. Bjarnholt, P. Electric Propulsion in Passenger Jet Airplanes; KTH: Stockholm, Sweden, 2016. [Google Scholar]
  12. ATAG. The Right Flightpath to Reduce Aviation Emissions. In Proceedings of the UNFCCC Climate Talks, Durban, South Africa, November 2011. [Google Scholar]
  13. IATA. IATA Forecast Predicts 8.2 Billion Air Travelers in 2037. Available online: https://www.iata.org/en/pressroom/pr/2018-10-24-02/ (accessed on 2 July 2019).
  14. KLM. KLM, SkyNRG and SHV Energy Announce First European Sustainable Aviation Fuel Plant. Available online: https://news.klm.com/klm-skynrg-and-shv-energy-announce-project-first-european-plant-for-sustainable-aviation-fuel/ (accessed on 29 May 2019).
  15. Raffinerie Heide GmbH. Flying with Green Fuel—Environmentally Friendly, Synthetic Kerosene as the Energy Source of the Future: Raffinerie Heide GmbH and Deutsche Lufthansa AG Sign a Memorandum of Understanding. Available online: https://www.heiderefinery.com/en/press/press-detail/flying-with-green-fuel-environmentally-friendly-synthetic-kerosene-as-the-energy-source-of-the-fu/ (accessed on 28 May 2019).
  16. Sunfire GmbH. Out of the Laboratory, into the World—A Timeline of Sunfire’s HTFT Plant Development; Sunfire GmbH: Dresden, Germany, 2019. [Google Scholar]
  17. Schmidt, P.; Weindorf, W. Power-to-Liquids: Potentials and Perspectives for the Future Supply of Renewable Aviation Fuel; Umweltbundesamt (UBA): Dessau-Roßlau, Germany, 2016.
  18. Searle, S.; Christensen, A. Decarbonization Potential of Electrofules in the European Union, an ICCT White Paper; The International Council on Clean Transportation (ICCT): Washington, DC, USA, 2018. [Google Scholar]
  19. Deutsche Energie-Agentur GmbH (dena). Powerfuels: Missing Link to a Successful Global Energy Transition Current State of Technologies, Markets, and Politics—And Start of a Global Dialogue; German Energy Agency (dena): Berlin, Germany, 2019. [Google Scholar]
  20. Schulz, H. Short History and Present Trends of Fischer-Tropsch Synthesis. Appl. Catal. A Gen. 1999, 186, 3–12. [Google Scholar] [CrossRef]
  21. Zero Emission Resource Organization. Stationary Point Sources of CO2. Available online: http://www.zeroco2.no/capture/sources-of-co2 (accessed on 8 October 2019).
  22. Meurer, A.; Kern, J. Fischer–Tropsch Synthesis as the Key for Decentralized Sustainable Kerosene Production. Energies 2021, 14, 1836. [Google Scholar] [CrossRef]
  23. Malins, C. What Role Is There for Electrofuel Technologies in European Transport’s Low Carbon Future? Cerulogy: London, UK, 2017. [Google Scholar]
  24. Siegemund, S.; Trommler, M.; Schmidt, P.; Weindorf, W.; Zittel, W.; Raksha, T.; Zerhusen, J. The Potential of Electricity-Based Fuels for Low-Emission Transport in the EU—An Expertise by LBST and Dena; German Energy Agency (dena): Berlin, Germany, 2017; pp. 1–176. [Google Scholar]
  25. Crone, K.; Altgelt, F.; Friese, J.; Micheli, M.; Salomon, H. Global Alliance Powerfuels, Carbon Sources for Powerfuels Production; German Energy Agency (dena): Berlin, Germany, 2020. [Google Scholar]
  26. Synkero. Synkero Builds Facility in the Port of Amsterdam, Producing Sustainable Aviation Fuel from CO2. Available online: https://synkero.com/synkero-builds-facility-in-the-port-of-amsterdam-producing-sustainable-aviation-fuel-from-co2/ (accessed on 7 March 2022).
  27. SAF+ Consortium. SAF+ Consortium—First Producer of e-Fuel. Available online: https://safplusconsortium.com/ (accessed on 7 March 2022).
  28. Wei, Y.; Yildirim, P.; den Bulte, C.; Dellarocas, C.; Henley, W.E.; Vyas, S.D.; Tan, A.; Darby, S.; Loong, K.; Skan, J.; et al. Study on Hydrogen from Renewable Resources in the EU-Final Report-FCH; Fuel Cells and Hydrogen Joint Undertaking (FCH): Munich, Germany; Brussels, Belgium, 2015. [Google Scholar]
  29. Agora Verkehrswende, Agora Energiewende and Frontier Economics. The Future Cost of Electricity-Based Synthetic Fuels; Agora Verkehrswende and Agora Energiewend: Berlin, Germany, 2018. [Google Scholar]
  30. Kramer, U. Defossilizing the Transportation Sector. In Zukünftige Kraftstoffe; Springer: Berlin/Heidelberg, Germany, 2019; pp. 565–663. [Google Scholar] [CrossRef]
  31. Koj, J.C.; Wulf, C.; Zapp, P. Environmental Impacts of Power-to-X Systems—A Review of Technological and Methodological Choices in Life Cycle Assessments. Renew. Sustain. Energy Rev. 2019, 112, 865–879. [Google Scholar] [CrossRef]
  32. Sternberg, A.; Bardow, A. Power-to-What?-Environmental Assessment of Energy Storage Systems. Energy Environ. Sci. 2015, 8, 389–400. [Google Scholar] [CrossRef]
  33. Hoppe, W.; Bringezu, S. Vergleichende Ökobilanz Der CO2-Basierten Und Konventionellen Methan- Und Methanolproduktion. UWF 2016, 24, 43–47. [Google Scholar] [CrossRef]
  34. Biernacki, P.; Röther, T.; Paul, W.; Werner, P.; Steinigeweg, S. Environmental Impact of the Excess Electricity Conversion into Methanol. J. Clean. Prod. 2018, 191, 87–98. [Google Scholar] [CrossRef]
  35. Lozanovski, A.; Brandstetter, C.P. Verbundprojekt Sunfire: Herstellung von Kraftstoffen Aus CO2 Und H2O Unter Nutzung Regenerativer Energie; Bundesministerium für Bildung und Forschung (BMBF): Stuttgart, Germany, 2015. [Google Scholar]
  36. European Commission. Reducing Emissions from Aviation. In Climate Action; European Comission: Brussels, Belgium, 2016; pp. 2–4. [Google Scholar]
  37. Atmosfair gGmbH. Atmosfair Flight Emissions Calculator; Atmosfair gGmbH: Berlin, Germany, 2016. [Google Scholar]
  38. Kärcher, B. Formation and Radiative Forcing of Contrail Cirrus. Nat. Commun. 2018, 9, 1824. [Google Scholar] [CrossRef] [Green Version]
  39. Lee, D.S. International Aviation and the Paris Agreement Temperature Goals; Manchester Metropolitan University, Deparment for Transport: Manchester, UK, 2018. [Google Scholar]
  40. Gutknecht, V.; Snæbjörnsdóttir, S.Ó.; Sigfússon, B.; Aradóttir, E.S.; Charles, L. Creating a Carbon Dioxide Removal Solution by Combining Rapid Mineralization of CO2 with Direct Air Capture. Energy Procedia 2018, 146, 129–134. [Google Scholar] [CrossRef]
  41. Keith, D.W.; Holmes, G.; St. Angelo, D.; Heidel, K. A Process for Capturing CO2 from the Atmosphere. Joule 2018, 2, 1573–1594. [Google Scholar] [CrossRef]
  42. Wirth, H. Recent Facts about Photovoltaics in Germany; Fraunhofer ISE: Freiburg, Germany, 2017; Volume 1. [Google Scholar]
  43. Sphera Process Data Set: Kerosene/Jet A1 at Refinery; from Crude Oil; Production Mix, at Refinery; 400 Ppm Sulphur (En). Available online: http://gabi-documentation-2019.gabi-software.com/xml-data/processes/6c664f4e-833b-4468-acc5-2ba81a1c6c4a.xml (accessed on 7 February 2020).
  44. König, D.H.; Baucks, N.; Dietrich, R.U.; Wörner, A. Simulation and Evaluation of a Process Concept for the Generation of Synthetic Fuel from CO2 and H2. Energy 2015, 91, 833–841. [Google Scholar] [CrossRef]
  45. Future Market Insights Hydrogen Electrolyzer Market—Global Industry Analysis, Size and Forecast, 2018 to 2028. Available online: https://www.persistencemarketresearch.com/market-research/hydrogen-electrolyzer-market.asp (accessed on 7 February 2020).
  46. Navigant. Electrolyzers—Water Electrolysis Units for Industry, Transportation, and Energy Storage; Navigant Research: Boulder, CO, USA, 2019. [Google Scholar]
  47. Fu, Y.; Liu, X.; Yuan, Z. Life-Cycle Assessment of Multi-Crystalline Photovoltaic Systems in China. J. Clean. Prod. 2014, 86, 180–190. [Google Scholar] [CrossRef]
  48. Koj, J.C.; Wulf, C.; Schreiber, A.; Zapp, P. Site-Dependent Environmental Impacts of Industrial Hydrogen Production by Alkalinewater Electrolysis. Energies 2017, 10, 860. [Google Scholar] [CrossRef]
  49. Elgowainy, A.; Han, J.; Wang, M.; Carter, N.; Stratton, R.; Hileman, J.; Malwitz, A.; Balasubramanian, S. Life-Cycle Analysis of Alternative Aviation Fuels in GREET; Argonne National Laboratory: Oak Ridge, TN, USA, 2012. [Google Scholar]
  50. Koroneos, C.; Dompros, A.; Roumbas, G.; Moussiopoulos, N. Life Cycle Assessment of Kerosene Used in Aviation. Int. J. Life Cycle Assess. 2005, 10, 417–424. [Google Scholar] [CrossRef]
  51. Mehmeti, A.; Angelis-Dimakis, A.; Arampatzis, G.; McPhail, S.; Ulgiati, S. Life Cycle Assessment and Water Footprint of Hydrogen Production Methods: From Conventional to Emerging Technologies. Environments 2018, 5, 24. [Google Scholar] [CrossRef]
  52. Gerbinet, S.; Belboom, S.; Léonard, A. Life Cycle Analysis (LCA) of Photovoltaic Panels: A Review. Renew. Sustain. Energy Rev. 2014, 38, 747–753. [Google Scholar] [CrossRef]
  53. Bauknecht, D.; Preuschoff, S. Ökobilanzen Für Den Sektor Strom Und Gas; Forschungszentrum Jülich (FZJ): Jülich, Germany, 2006. [Google Scholar]
  54. Portha, J.F.; Louret, S.; Pons, M.N.; Jaubert, J.N. Estimation of the Environmental Impact of a Petrochemical Process Using Coupled LCA and Exergy Analysis. Resour. Conserv. Recycl. 2010, 54, 291–298. [Google Scholar] [CrossRef]
  55. Schüwer, D.; Hanke, T.; Luhmann, H.-J. Konsistenz Und Aussagefähigkeit der Primärenergie-Faktoren Für Endenergieträger Im Rahmen der EnEV; Wuppertal Institute: Wuppertal, Germany, 2015. [Google Scholar]
  56. Razdan, P.; Garrett, P. Life Cycle Assessment of Electricity Production from an Onshore V100-2.0 MW Wind Plant; Vestas Wind Systems A/S: Aarhus, Denmark, 2015. [Google Scholar]
  57. Sphera Life Cycle Assessment Software (GaBi Ts). Available online: https://sphera.com/life-cycle-assessment-software-download/ (accessed on 19 April 2022).
  58. Timko, M.T.; Yu, Z.; Onasch, T.B.; Wong, H.W.; Miake-Lye, R.C.; Beyersdorf, A.J.; Anderson, B.E.; Thornhill, K.L.; Winstead, E.L.; Corporan, E.; et al. Particulate Emissions of Gas Turbine Engine Combustion of a Fischer-Tropsch Synthetic Fuel. Energy Fuels 2010, 24, 5883–5896. [Google Scholar] [CrossRef]
  59. Mazlan, N.M.; Savill, M.; Kipouros, T. Evaluating NOx and CO Emissions of Bio-SPK Fuel Using a Simplified Engine Combustion Model: A Preliminary Study towards Sustainable Environment. Proc. Inst. Mech. Eng. Part G J. Aerosp. Eng. 2017, 231, 859–865. [Google Scholar] [CrossRef]
  60. CML-Department of Industrial Ecology CML-IA Characterisation Factors. Available online: https://www.universiteitleiden.nl/en/research/research-output/science/cml-ia-characterisation-factors#downloads (accessed on 16 December 2019).
  61. CML—Department of Industrial Ecology. CML-IA Characterisation Factors; Institute of the Faculty of Science of Leiden University: Leiden, The Netherlands, 2021. [Google Scholar]
  62. Guinée, J.B.; Gorrée, M.; Heijungs, R.; Huppes, G.; Kleijn, R.; de Koning, A.; van Oers, L.; Wegener Sleeswijk, A.; Suh, S.; Udo de Haes, H.A.; et al. Handbook on Life Cycle Assessment. Operational Guide to the ISO Standards. I: LCA in Perspective. IIa: Guide. IIb: Operational Annex. III: Scientific Background; Leiden University: Leiden, The Netherlands, 2002. [Google Scholar]
  63. Sphera GaBi Software. Available online: https://gabi.sphera.com/deutsch/software/gabi-software/ (accessed on 19 April 2022).
  64. Koehler, A.; Thylmann, D. Introduction to Water Assessment in the GaBi Software|Version 1.2.; Sphera GaBi: Leinfelden-Echterdingen, Germany, 2012. [Google Scholar]
  65. Bos, U. Documentation of Land Use Inventory in GaBi; Sphera GaBi: Leinfelden-Echterdingen, Germany, 2018. [Google Scholar]
  66. Beck, T.; Bos, U.; Wittstock, B.; Baitz, M.; Fischer, M.; Sedlbauer, K. LANCA® Land Use Indicator Value Calculation in Life Cycle Assessment—Method Report; Fraunhofer Verlag: Stuttgart, Germany, 2010. [Google Scholar]
  67. Bos, U.; Horn, R.; Back, T.; Lindner, J.P.; Fischer, M. LANCA Characterization Factors for Life Cycle Assessment—Version 2.0; Fraunhofer Verlag: Stuttgart, Germany, 2016. [Google Scholar]
  68. Bos, U.; Maier, S.D.; Horn, R.; Leistner, P.; Finkbeiner, M. A GIS Based Method to Calculate Regionalized Land Use Characterization Factors for Life Cycle Impact Assessment Using LANCA®. Int. J. Life Cycle Assess. 2020, 25, 1259–1277. [Google Scholar] [CrossRef]
  69. IATA. Fact Sheet Climate and CORSIA; International Air Transport Association (IATA): Montreal, Canada, 2018; pp. 1–2. [Google Scholar]
  70. ICAO. Environmental Trends in Aviation to 2050. 2019 Environ. Rep. 2019, 24, 17–23. [Google Scholar]
  71. Viebahn, P.; Scholz, A.; Zelt, O. The Potential Role of Direct Air Capture in the German Energy Research Program—Results of a Multi-Dimensional Analysis. Energies 2019, 12, 3443. [Google Scholar] [CrossRef]
  72. Meldrum, J.; Nettles-Anderson, S.; Heath, G.; Macknick, J. Life Cycle Water Use for Electricity Generation: A Review and Harmonization of Literature Estimates. Environ. Res. Lett. 2013, 8, 015031. [Google Scholar] [CrossRef]
  73. Carbon Engineering—Carbon Dioxide Removal. Available online: https://carbonengineering.com/carbon-removal/ (accessed on 4 March 2022).
  74. Climeworks’ Unique Carbon Dioxide Removal Technology Solution for Your Sustainability Strategy. Available online: https://climeworks.com/net-zero-solutions-for-businesses (accessed on 4 March 2022).
  75. The GT Solution—Global Thermostat. Available online: https://globalthermostat.com/the-gt-solution/ (accessed on 19 April 2022).
  76. Prometheus—Home. Available online: https://prometheusfuels.com/ (accessed on 4 March 2022).
  77. Carbfix—We Turn CO2 into Stone. Available online: https://www.carbfix.com/ (accessed on 4 March 2022).
  78. TerraFixing—Fixing Global Warming. Available online: https://www.terrafixing.com/ (accessed on 4 March 2022).
  79. Carbyon—Direct Air Capture of CO2 to Clean Up Our Atmosphere. Available online: https://carbyon.com/ (accessed on 4 March 2022).
  80. Infinitree LCC—Technology. Available online: http://www.infinitreellc.com/technology (accessed on 4 March 2022).
  81. World Economic Forum and McKinsey & Company. Clean Skies for Tomorrow—Sustainable Aviation Fuels as a Pathway to Net-Zero Aviation; World Economic Forum: Geneva, Switzerland, 2020. [Google Scholar]
  82. Ueckerdt, F.; Bauer, C.; Dirnaichner, A.; Everall, J.; Sacchi, R.; Luderer, G. Potential and Risks of Hydrogen-Based e-Fuels in Climate Change Mitigation. Nat. Clim. Chang. 2021, 11, 384–393. [Google Scholar] [CrossRef]
  83. Cames, M.; Chaudry, S.; Göckeler, K.; Kasten, P.; Kurth, S. E-Fuels versus—Total Costs of Electro-Fuels and Direct Air Capture and Carbon Storage While Taking into Account Direct and Upstream Emissions and Environmental Risks; Öko-Institut e.V.: Berlin, Germany, 2021. [Google Scholar]
  84. Batteiger, V.; Ebner, K.; Habersetzer, A.; Moser, L.; Schmidt, P.; Weindorf, W.; Rakscha, T. Power-to-Liquids—A Scalable and Sustainable Fuel Supply Perspective for Aviation; Umweltbundesamt (UBA): Dessau-Roßlau, Germany, 2022.
  85. International Air Transport Association IATA—Fuel Price Monitor. Available online: https://www.iata.org/en/publications/economics/fuel-monitor/ (accessed on 22 August 2009).
  86. Lee, D.S.; Fahey, D.W.; Forster, P.M.; Newton, P.J.; Wit, R.C.N.; Lim, L.L.; Owen, B.; Sausen, R. Aviation and Global Climate Change in the 21st Century. Atmos. Environ. 2009, 43, 3520–3537. [Google Scholar] [CrossRef]
  87. Lee, D.S.; Pitari, G.; Grewe, V.; Gierens, K.; Penner, J.E.; Petzold, A.; Prather, M.J.; Schumann, U.; Bais, A.; Berntsen, T.; et al. Transport Impacts on Atmosphere and Climate: Aviation. Atmos. Environ. 2010, 44, 4678–4734. [Google Scholar] [CrossRef]
  88. Stratton, R.W.; Wolfe, P.J.; Hileman, J.I. Impact of Aviation Non-CO2 Combustion Effects on the Environmental Feasibility of Alternative Jet Fuels. Environ. Sci. Technol. 2011, 45, 10736–10743. [Google Scholar] [CrossRef]
  89. Scheelhaase, J.D.; Dahlmann, K.; Jung, M.; Keimel, H.; Nieße, H.; Sausen, R.; Schaefer, M.; Wolters, F. How to Best Address Aviation’s Full Climate Impact from an Economic Policy Point of View?—Main Results from AviClim Research Project. Transp. Res. Part D Transp. Environ. 2016, 45, 112–125. [Google Scholar] [CrossRef]
  90. Lee, D.S.; Fahey, D.W.; Skowron, A.; Allen, M.R.; Burkhardt, U.; Chen, Q.; Doherty, S.J.; Freeman, S.; Forster, P.M.; Fuglestvedt, J.; et al. The Contribution of Global Aviation to Anthropogenic Climate Forcing for 2000 to 2018. Atmos. Environ. 2021, 244, 117834. [Google Scholar] [CrossRef]
  91. Jungbluth, N.; Meili, C. Recommendations for Calculation of the Global Warming Potential of Aviation Including the Radiative Forcing Index. Int. J. Life Cycle Assess. 2019, 24, 404–411. [Google Scholar] [CrossRef]
  92. Cames, M.; Graichen, J.; Siemons, A.; Cook, V. Greenhouse Gas Emission Reduction Targets for International Aviation and Shipping; European Parliamentary Research Service (EPRS): Brussels, Belgium, 2015. [Google Scholar]
  93. Bons, M.; Döring, M.; Klessmann, C.; Knapp, J.; Tiedemann, S.; Pape, C.; Horst, D.; Reder, K.; Stappel, M. Analyse der Kurz-Und Mittelfristigen Verfügbarkeit von Flächen Für Die Windenergienutzung an Land—Kurztitel: Flächenanalyse Windenergie an Land Abschlussbericht; Umweltbundesamt (UBA): Dessau-Roßlau, Germany, 2019. [Google Scholar]
  94. Wirth, H. Aktuelle Fakten Zur Photovoltaik in Deutschland; Fraunhofer ISE: Freiburg, Germany, 2022. [Google Scholar]
  95. Frauenhofer Institute Frauenhofer Energy Charts. Available online: https://www.energy-charts.de/ (accessed on 9 February 2019).
  96. Solar GIS Solar Radiation Data for Regular PV Performance Assessment/Solar Performance Maps. Available online: https://solargis.com/products/monitor/solar-performance-maps (accessed on 9 May 2020).
Figure 1. Product system and system boundaries, displaying main foreground processes and relative operational material and energy flows.
Sustainability 14 10658 g001
Figure 2. Impact category Climate Change (GWP-100)—Layout variation for wind power.
Sustainability 14 10658 g002
Figure 3. Impact Category Climate Change (GWP)—Electricity mix variation for the layout HTFT & low-temperature DAC.
Sustainability 14 10658 g003
Figure 4. Layout variation for wind power—results for the impact categories Acidification (a), Eutrophication (b), Photochemical Ozone Creation (c), Non-renewable primary energy (d), Land transformation (e), and Freshwater consumption (f).
Sustainability 14 10658 g004
Figure 5. Impact category Climate Change (GWP-100, GWP-100 + RFI)—Layout variation for wind power considering non-CO2 effects for the fuel combustion.
Sustainability 14 10658 g005
Figure 6. Sensitivity analysis: relative deviation from baseline layout HTFT with low-temperature DAC.
Sustainability 14 10658 g006
Table 1. Overview of methodological choices of the LCA.
Methodological ChoiceMethodological Choice Applied in This Study
LCA typeAttributional, comparative
System boundaryExtended Well-to-Wake:
All activities from raw material extraction to the release of waste to the environment. Manufacturing and end-of-life (EOL) of the vehicle (aircraft), as well as maintenance of the foreground system and related flows are not included in the system boundary
Functional unit1 MJ of liquid fuel (lower heating value)
Reference flowAll materials and production resources needed to produce 1 MJ of liquid fuel (lower heating value)
Time horizon2015–2020
Geographical scopeGermany, up to mainland Europe
AllocationAllocation of input and output flows is performed on the output fuels of the product system by their energy content
Impact categories/inventory indicatorsClimate change
Eutrophication
Acidification
Photochemical Ozone Creation
Non-renewable primary energy
Freshwater consumption
Land transformation
Table 2. PtL-kerosene production plant layout options and operating conditions.
SUB-SYSTEMLayout OptionsOperating Conditions
PtL plant
(type of electrolyser)
high-temperature Fischer-Tropsch (HTFT) based on solid oxide electrolyser (SOEC)80%
(energy conversion efficiency)
low-temperature Fischer-Tropsch (LTFT) based on proton exchange membrane (PEM)50.8%
(energy conversion efficiency)
Carbon capture plantlow-temperature DAC (Climeworks)87% thermal energy + 13% electricity (at 0.637 MJ/MJ, PtL-kerosene)
(final energy composition
and consumption)
high-temperature DAC
(Carbon Engineering)
100% natural gas (at 0.678 MJ/MJ, PtL-kerosene)
(final energy composition
and consumption)
Table 4. Overview of the scope of land transformation by subsystem or flow.
GroupingSubsystem or FlowLand Transformation
DirectIndirect
PtL plantHTFT plantNA
LTFT plantNA
Carbon capture plantDAC plantsNA
Final energy sourceGerman electricity mixNEG
Wind farm
PV array
Natural gas
WaterWater
VehicleAircraftScopeScope
Fuel productionPtL-kerosene(✓)(✓)
Jet A-1NA
NA = no data available; NEG = Negligible; Scope = Is outside of the scope; (✓) = is a function of the other subsystems or flows.
Publisher’s Note: MDPI stays neutral with regard to jurisdictional claims in published maps and institutional affiliations.

