
Research on the Removal of Sodium from Vanadium Tailings by Calcification Roasting and NaOH Leaching
by
 , ,
, ,
Yufeng Guo
1, 
Chao Wang
1,
Shuai Wang
1,*,
Feng Chen
1,*,
Xueyuan Wang
2,
Zhiwei An
2 and
Lingzhi Yang
1 1
School of Minerals Processing and Bioengineering, Central South University, Changsha 410083, China
2
Chengde Jianlong Special Steel Co., Ltd., Chengde 067399, China
*
Authors to whom correspondence should be addressed.
Sustainability 2022, 14(15), 9051; https://doi.org/10.3390/su14159051
Submission received: 27 May 2022
/
Revised: 19 July 2022
/
Accepted: 20 July 2022
/
Published: 23 July 2022
Abstract
:Vanadium tailings are a common solid waste in the vanadium industry. As they are rich in Fe, vanadium tailings could be a potential raw material for the blast furnace. However, the presence of approximately 4% Na2O in vanadium tailings is a major impediment to its return to the blast furnace. A novel method for removing sodium from vanadium tailings by calcification roasting and subsequent NaOH leaching was proposed in this work. The method demonstrated that calcification roasting of vanadium tailings can not only volatilize a part of sodium but also facilitate the dissolution of sodium during the subsequent NaOH leaching process. The thermodynamic analysis and behaviors of vanadium tailings during calcification roasting were systematically investigated. The transformation of sodium-containing phases in vanadium tailings during calcification roasting was studied. Further, the promoting effect of calcification roasting on sodium leaching by NaOH was clarified. The total removal efficiency of sodium was 80.37% under optimal conditions, and the residue obtained after sodium removal can be used as a raw material in the blast furnace process for in-plant recycling.
1. Introduction
Vanadium pentoxide plays an important role in steel materials as an alloy additive, catalyst and various vanadium products [1,2]. Vanadium-containing compounds are widely used in medicine [3,4]. However, the pollution of vanadium production to the environment has been given increasing attention [5]. Most vanadium pentoxide is extracted from V-bearing titanomagnetite, which is abundant in Hebei and Sichuan provinces, China [6]. Vanadium and iron in ore are first separated with titanium by a blast furnace ironmaking process or electric furnace smelting. Second, vanadium is separated in the LD converter process, in which vanadium remains in the slag (called vanadium-bearing slag) and molted iron is purified [7]. For extracting vanadium from vanadium slag, the widely used and commercial method is sodium roasting–water leaching, which makes over 90% of the vanadium in slag leached into the leachate [8,9]. Vanadium tailings are by-products of the leaching process. Because of the presence of Cr, vanadium tailings are considered hazardous solid waste. However, they are also potential resources for blast furnace processing as they contain approximately 30% of Fe, 1% of V and 10% of Ti, which are close to those of V-bearing titanomagnetite [10,11]. Approximately 1.2 million tons of vanadium tailings are produced annually in China [1]. Realizing the commercial value and reducing the environmental risk of vanadium tailings is the primary goal of environmental protection due to mineral resource depletion and upgraded environmental regulations.
Some researchers focus on the preparation of black porcelain and far-infrared radiation coatings using vanadium tailings, as they have remarkable photothermal conversion ability and are substitutes for cobalt black pigments and other metal oxides in far-infrared radiation coatings [12,13]. However, the quantity demand of the two areas absorbs only a small amount of vanadium tailings each year, and this supply and demand market leads to few commercial benefits for vanadium-production companies. Extracting vanadium from vanadium tailings can be achieved by sodium roasting-leaching [14] and acid leaching [15,16]. However, there are no feasible projects for vanadium recycling in the industry because of high costs, complicated processes and serious equipment corrosion. Some researchers extracted iron from vanadium tailings since iron is the most abundant metal element in tailings [10]. Direct reduction and magnetic separation are efficient ways to extract iron and vanadium from vanadium tailings, but the reduction requires high temperatures for iron particle gathering. From the perspective of enterprises, internal circulation of vanadium tailings as a blast furnace burden may require less investment and thus is the more interesting recycling method, in order to recycle Fe, Ti, Cr and other valuable metals with low investment. However, the alkali content is high in vanadium tailings, which not only erodes the blast furnace lining but also makes the operation difficult during reduction [17,18,19]. Most blast furnace processes in China cap the alkali load at under 5 kg/t [20].
To avoid the potential risk of blast furnace processing after vanadium tailings are fed in, some researchers have been devoted to removing alkali metals in vanadium tailings by alkaline leaching. NaOH is the most welcome leaching agent in alkaline leaching because it is cheap, easy to obtain and causes less corrosion of equipment. However, there is no efficient way to remove Na from vanadium tailings by NaOH leaching under normal temperatures and pressures. However, high temperatures and pressures lead to high costs and inefficient processes [21].
In this paper, the authors proved a novel method to remove Na in vanadium tailings by calcium roasting followed by atmospheric pressure NaOH leaching. Calcification roasting with calcium carbonate as the calcifying agent is a low-cost, environmentally friendly process that has no adverse effect on the subsequent ironmaking process. However, the effect of calcification roasting on the leaching of alkali metal elements by NaOH in vanadium extraction tailings has not been studied in detail. Additionally, the phase transformation and microstructure evolution behaviors during roasting are unknown. This research is committed to solving the above problems, and provides a feasible treatment method for vanadium tailings, which clears the obstacles for returning to the blast furnace for recycling.
2. Experimental
2.1. Materials
The vanadium tailings used in this study are from Chengde Jianlong Special Steel Co., Ltd. in Heibei province in Chengde, China. The chemical compositions of the vanadium tailings in this study were mainly determined by an X-Ray Fluorescence Spectrometer (PANalytical, Axios mAX, Almelo, The Netherlands), while Na2O and K2O were determined by atomic absorption spectrometry (FAAS, ThermoFisher SCIENTIFIC, iCE-3500, Waltham, MA, USA). The minerals of the vanadium tailings were investigated by X-ray powder diffraction (XRD) with a Cu-Kα radiation (λ = 0.15406 nm, 50 kV, 100 mA, Bruker, Advance D8, Fällanden Switzerland), and the scanning rate is 1 °/min from 10° to 80°.
Calcium carbonate and sodium hydroxide are analytical reagents provided by Aladdin reagent, Shanghai, China. The water mentioned in this article is ultrapure water.
2.2. Thermodynamic Calculation
2.3. Experimental Procedure
2.3.1. Calcification Roasting
A vanadium tailing sample was mixed with CaCO3 powder at a designed mass ratio (mass ratio of CaCO3 to the tailings, the denominator is 1 and omitted, hereinafter the same), and the mixture was pressed to form cylindrical pellets with both a diameter and height of approximately 10 mm. Approximately 10 pellets were placed in an alumina boat and roasted in a horizontal tube furnace with silicon carbide heating elements. The isothermal section in the middle was within ±2 °C. The pellets before and after roasting were weighed.
2.3.2. NaOH Leaching
To further remove the residual sodium in the roasted product, NaOH solution (5 wt.%) was chosen as the leaching system for alkali leaching. The roasted pellets were crashed and grinded to pass through a 0.074 mm sieve and the leaching was carried out in a 200 mL PTEF breaker in a water bath at constant temperature. A certain mass of calcified roasted samples and NaOH solution were sealed with plastic film in the PTEF breaker and the agitator started stirring when the required experimental temperature of the water bath was reached. After the required leaching duration ended, the leachate was separated from the residue by vacuum filtration. The residue for analysis was dried in a drying oven.
2.4. Definition of Parameters
The volatilization efficiency of Na during the calcification roasting could be obtained as in Equation (1).
V—the volatilization efficiency of Na, %;
m1—the mass of pellets before calcification roasting, g;
m2—the mass of pellets after calcification roasting, g;
a—the Na2O content of pellets before calcification roasting, %;
b—the Na2O content of pellets after calcification roasting, %.
The leaching efficiency of Na during the NaOH leaching can be obtained as in Equation (2)
L—the leaching efficiency of Na, %;
m3—the mass of samples before NaOH leaching, g;
m4—the mass of samples after NaOH leaching, g;
c—the Na2O content of samples before NaOH leaching, the value is equal to the value of b, %;
d—the Na2O content of samples after NaOH leaching, %.
The total removal efficiency of Na during the calcification roasting and NaOH leaching could be obtained as in Equation (3)
T—the total removal efficiency of Na, %;
V—the volatilization efficiency of Na, %;
L—the leaching efficiency of Na, %.
2.5. Analysis and Characterization
Some of the roasted pellets were subjected to dry-grinding and were subsequently dry-sieved to yield a particle size distribution finer than 0.074 mm prior to phase analysis, determination of Na contents.
The minerals and compositions of the roasted and leached products were investigated by X-ray powder diffraction (XRD) with a Cu-Kα radiation (λ = 0.15406 nm, 50 kV, 100 mA, Bruker, Advance D8), and the scanning rate is 5°/min from 20° to 80°. The Na2O content in the samples was determined by flame atomic absorption spectroscopy (FAAS, ThermoFisher SCIENTIFIC, iCE-3500). The microstructures and the distribution of elements in the samples which were polished after being set with epoxy resin and triethanolamine were analyzed by scanning electron microscope (SEM) with an energy-dispersive spectrometer (EDS) (TESCAN, MIRA 3 LMU, Brno, Czech Republic).
3. Results and Discussion
3.1. Vanadium Tailings
The vanadium tailings are a kind of artificial mineral produced in the process of vanadium extraction. The chemical compositions, phase compositions and microstructures need to be studied. The chemical compositions of the vanadium tailings are showed in Table 1.
Table 1 indicates that the Na2O and K2O contents are 4.83% and 0.02%, respectively, which means that Na is mainly alkali metal in vanadium tailings. The high Na content comes from additives in sodium roasting, so removing Na is the key to realizing the comprehensive utilization of vanadium tailings by blast furnace.
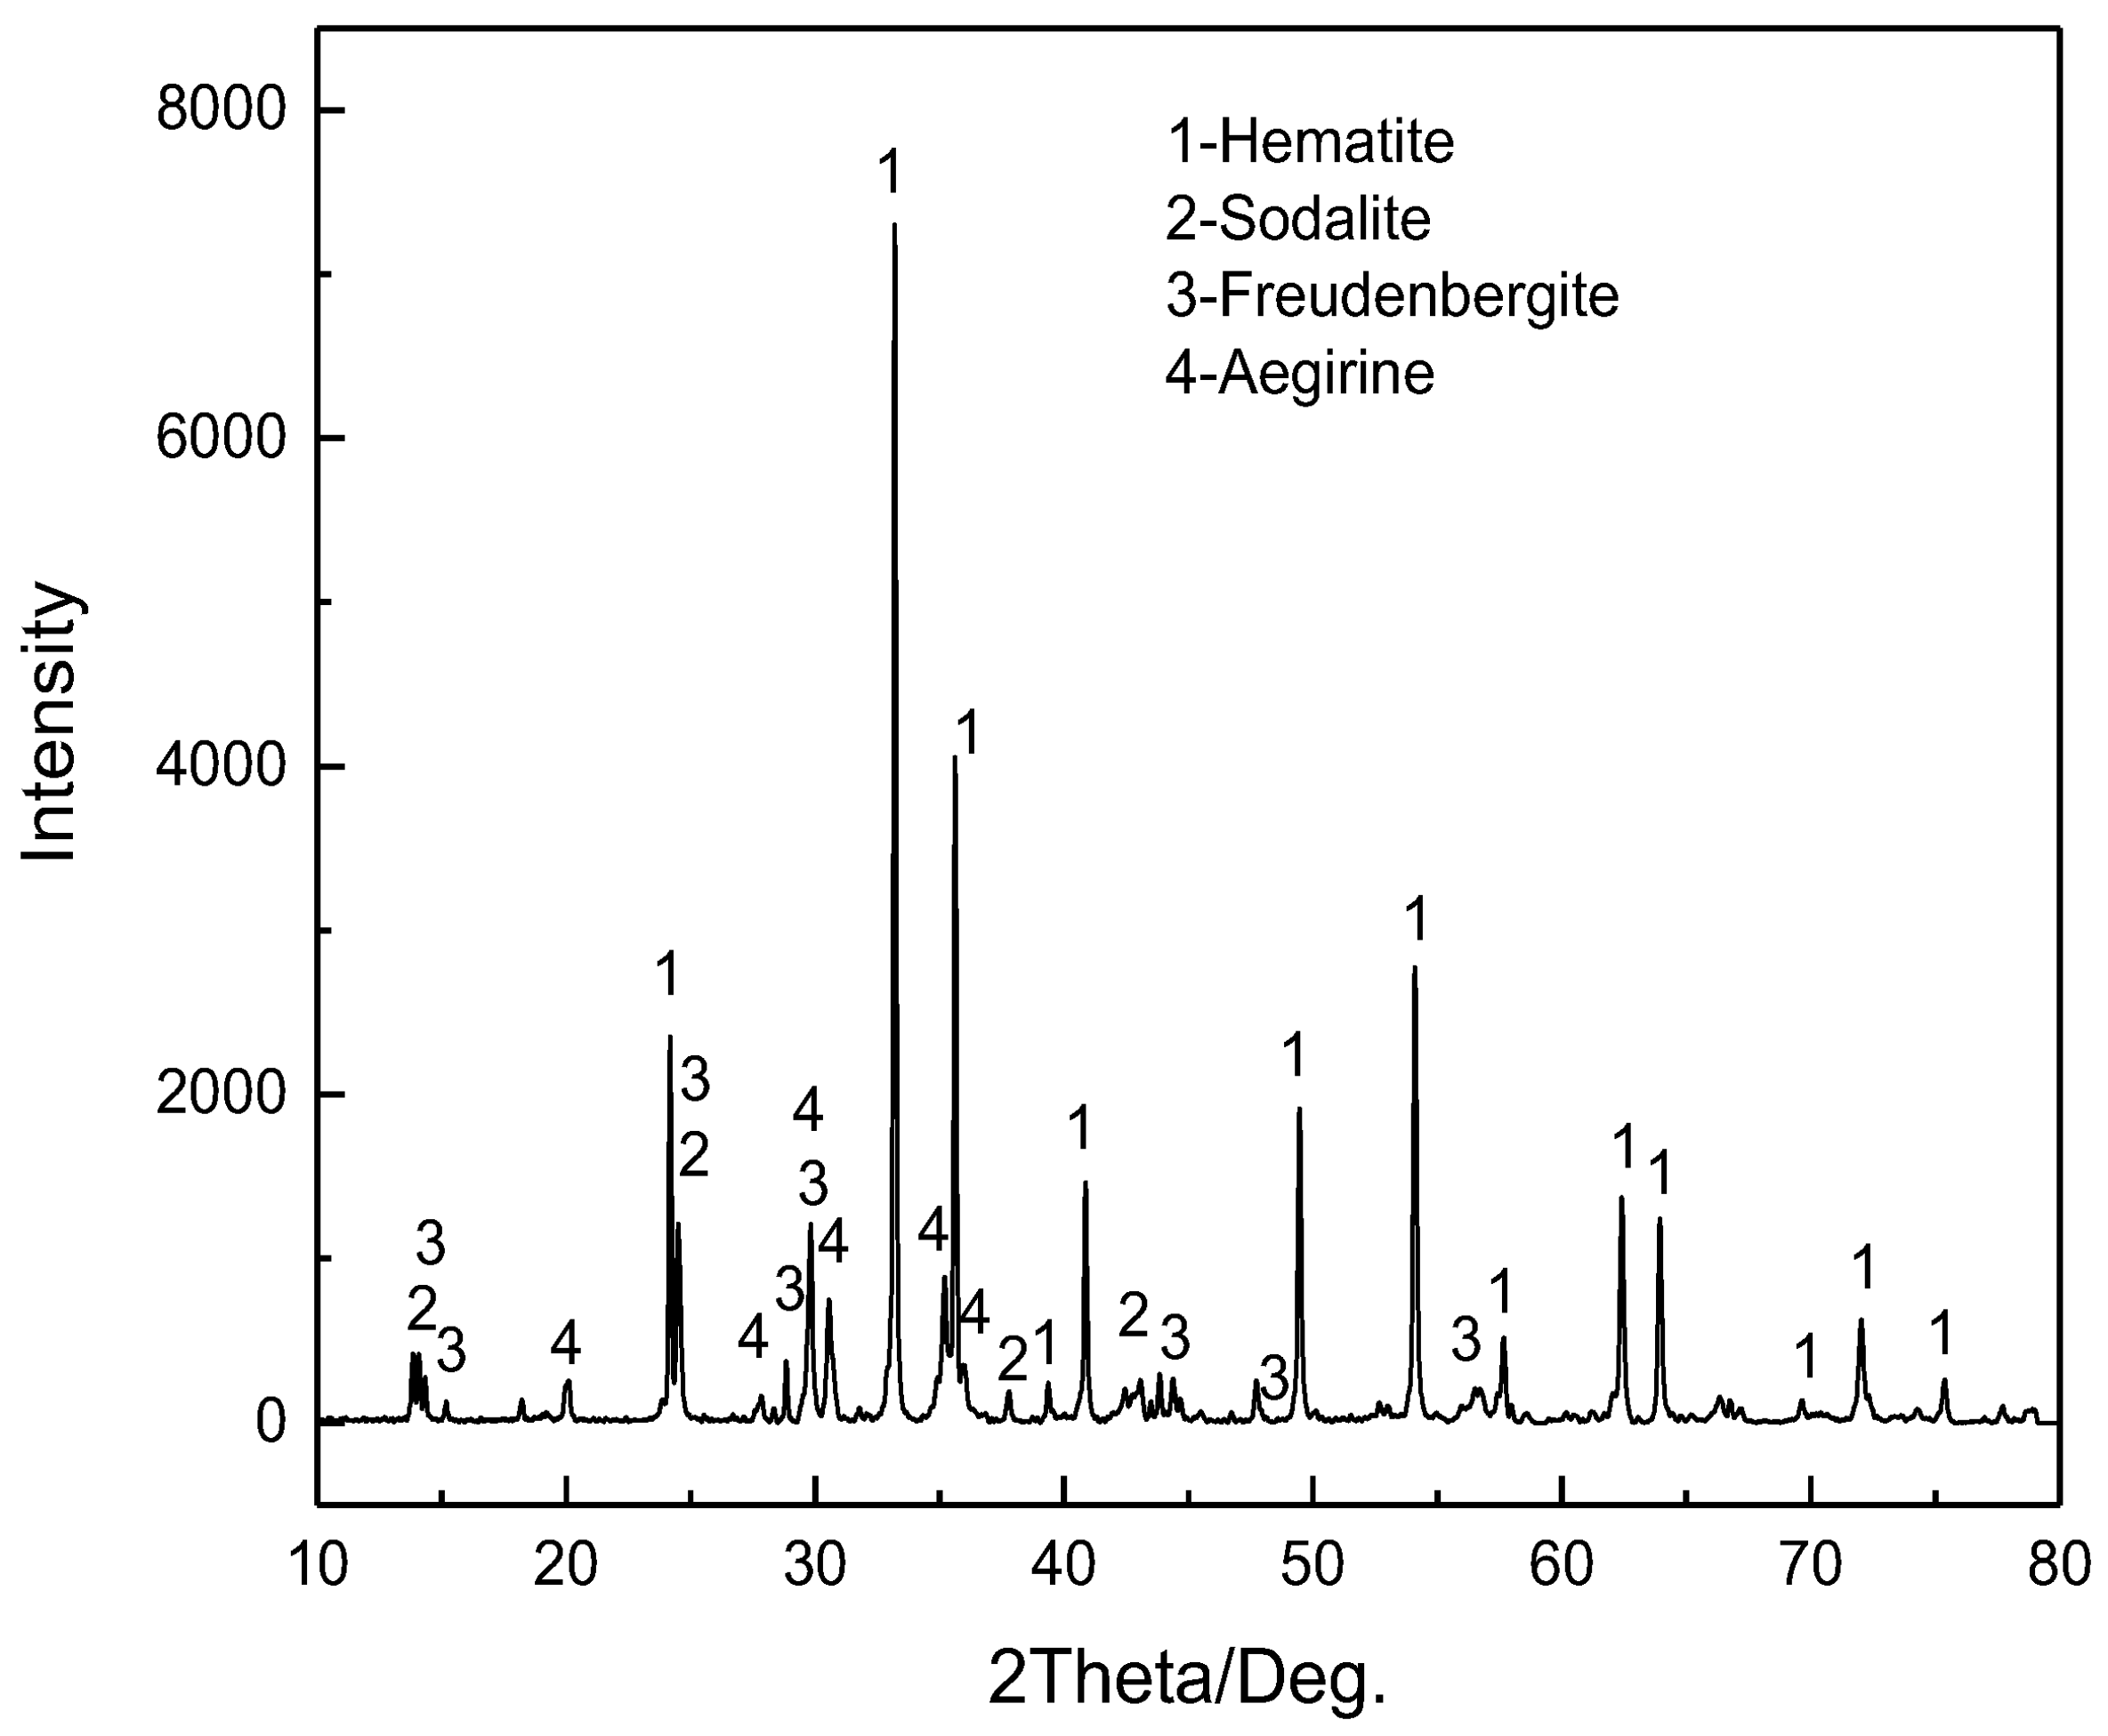
Figure 1 shows the XRD pattern of the material and indicates that hematite is the main phase in the tailings and sodium mainly combines with iron, titanium, silicon and oxygen to form complex minerals that are widely distributed in various phases. This is because the complex reaction between sodium salt agents and converter vanadium slag occurs during the sodium roasting process. Except for hematite, the structures of the other phases are more stable, which makes it hard to remove Na by leaching.
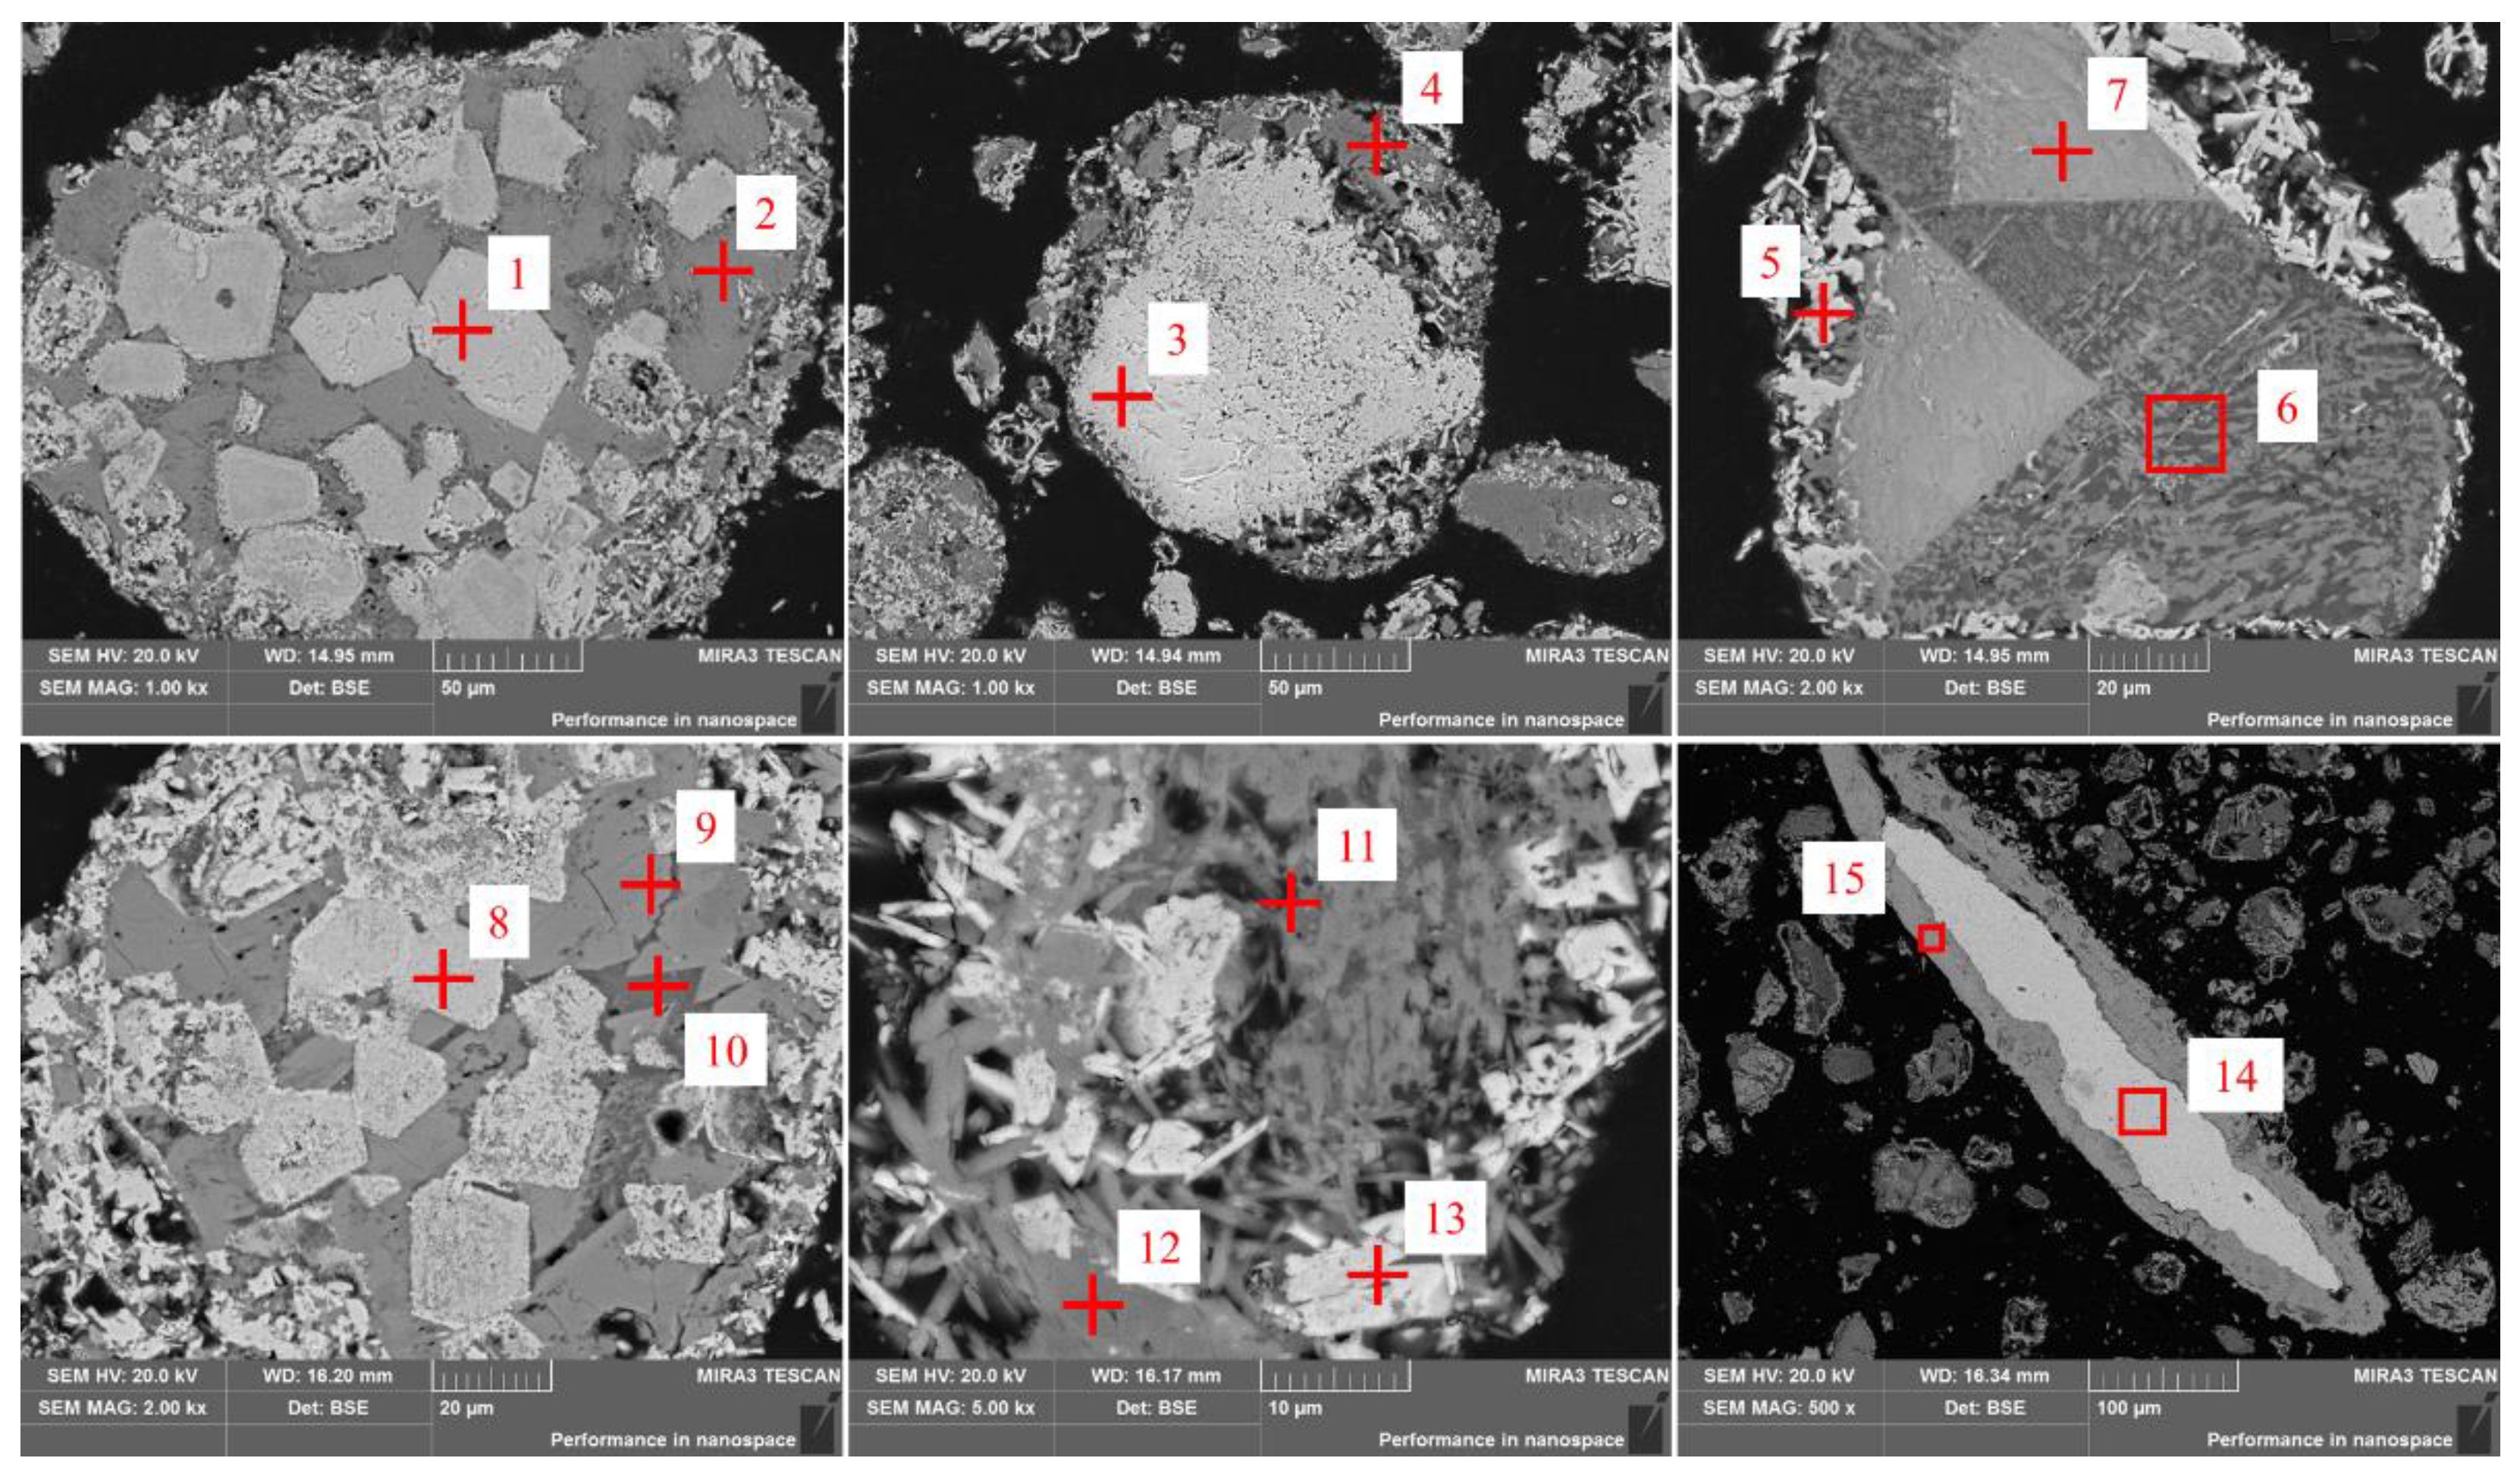
The internal morphology of the raw material particles was observed using SEM-EDS, and the images and elemental analysis results are shown in Figure 2 and Table 2, respectively. For better physical phase induction, the atomic molar percentages of the major elements in the regions are shown in the EDS analysis, and elements present at less than 1% were ignored.
The results in Figure 2 and Table 2 indicate that the vanadium tailings have a complex elemental distribution and phase embedding relationships within the particles. As the main phase, part of the hematite is wrapped by aegirine and augite in the form of large particles, and the other part is enriched on the surface of other particles in the form of needles or irregularities. The hematite may mainly originate from the oxidation of metallic iron enriched in the vanadium slag during the sodic roasting process. Metallic iron is caused by the incomplete separation of slag and iron in the converter process of vanadium-titanium magnetite. A part of iron is combined with titanium as a freudenbergite phase, which is distributed inside the particle as a block and wrapped by other phases. Sodium is mainly enriched in aegirine, augite and sodalite, which are usually high in silica and mixed with many other elements. Although these phases are categorized as silicates, the proton number differences lead to differences in their grayscale SEM images in BSD model. From the above results, it is clear that the sodium-containing phases are not only complex in elemental composition, but also inter-embedded and wrapped with other phases. This leads to the fact that the conventional leaching process is ineffective in removing sodium elements. SEM-EDS can find metallic iron covered by hematite in the raw material, but XRD cannot. This is because the amount of metallic iron is low and it is tightly packed with hematite.
3.2. Thermodynamic Calculation
3.2.1. Mass ratio of CaCO3 to Tailings
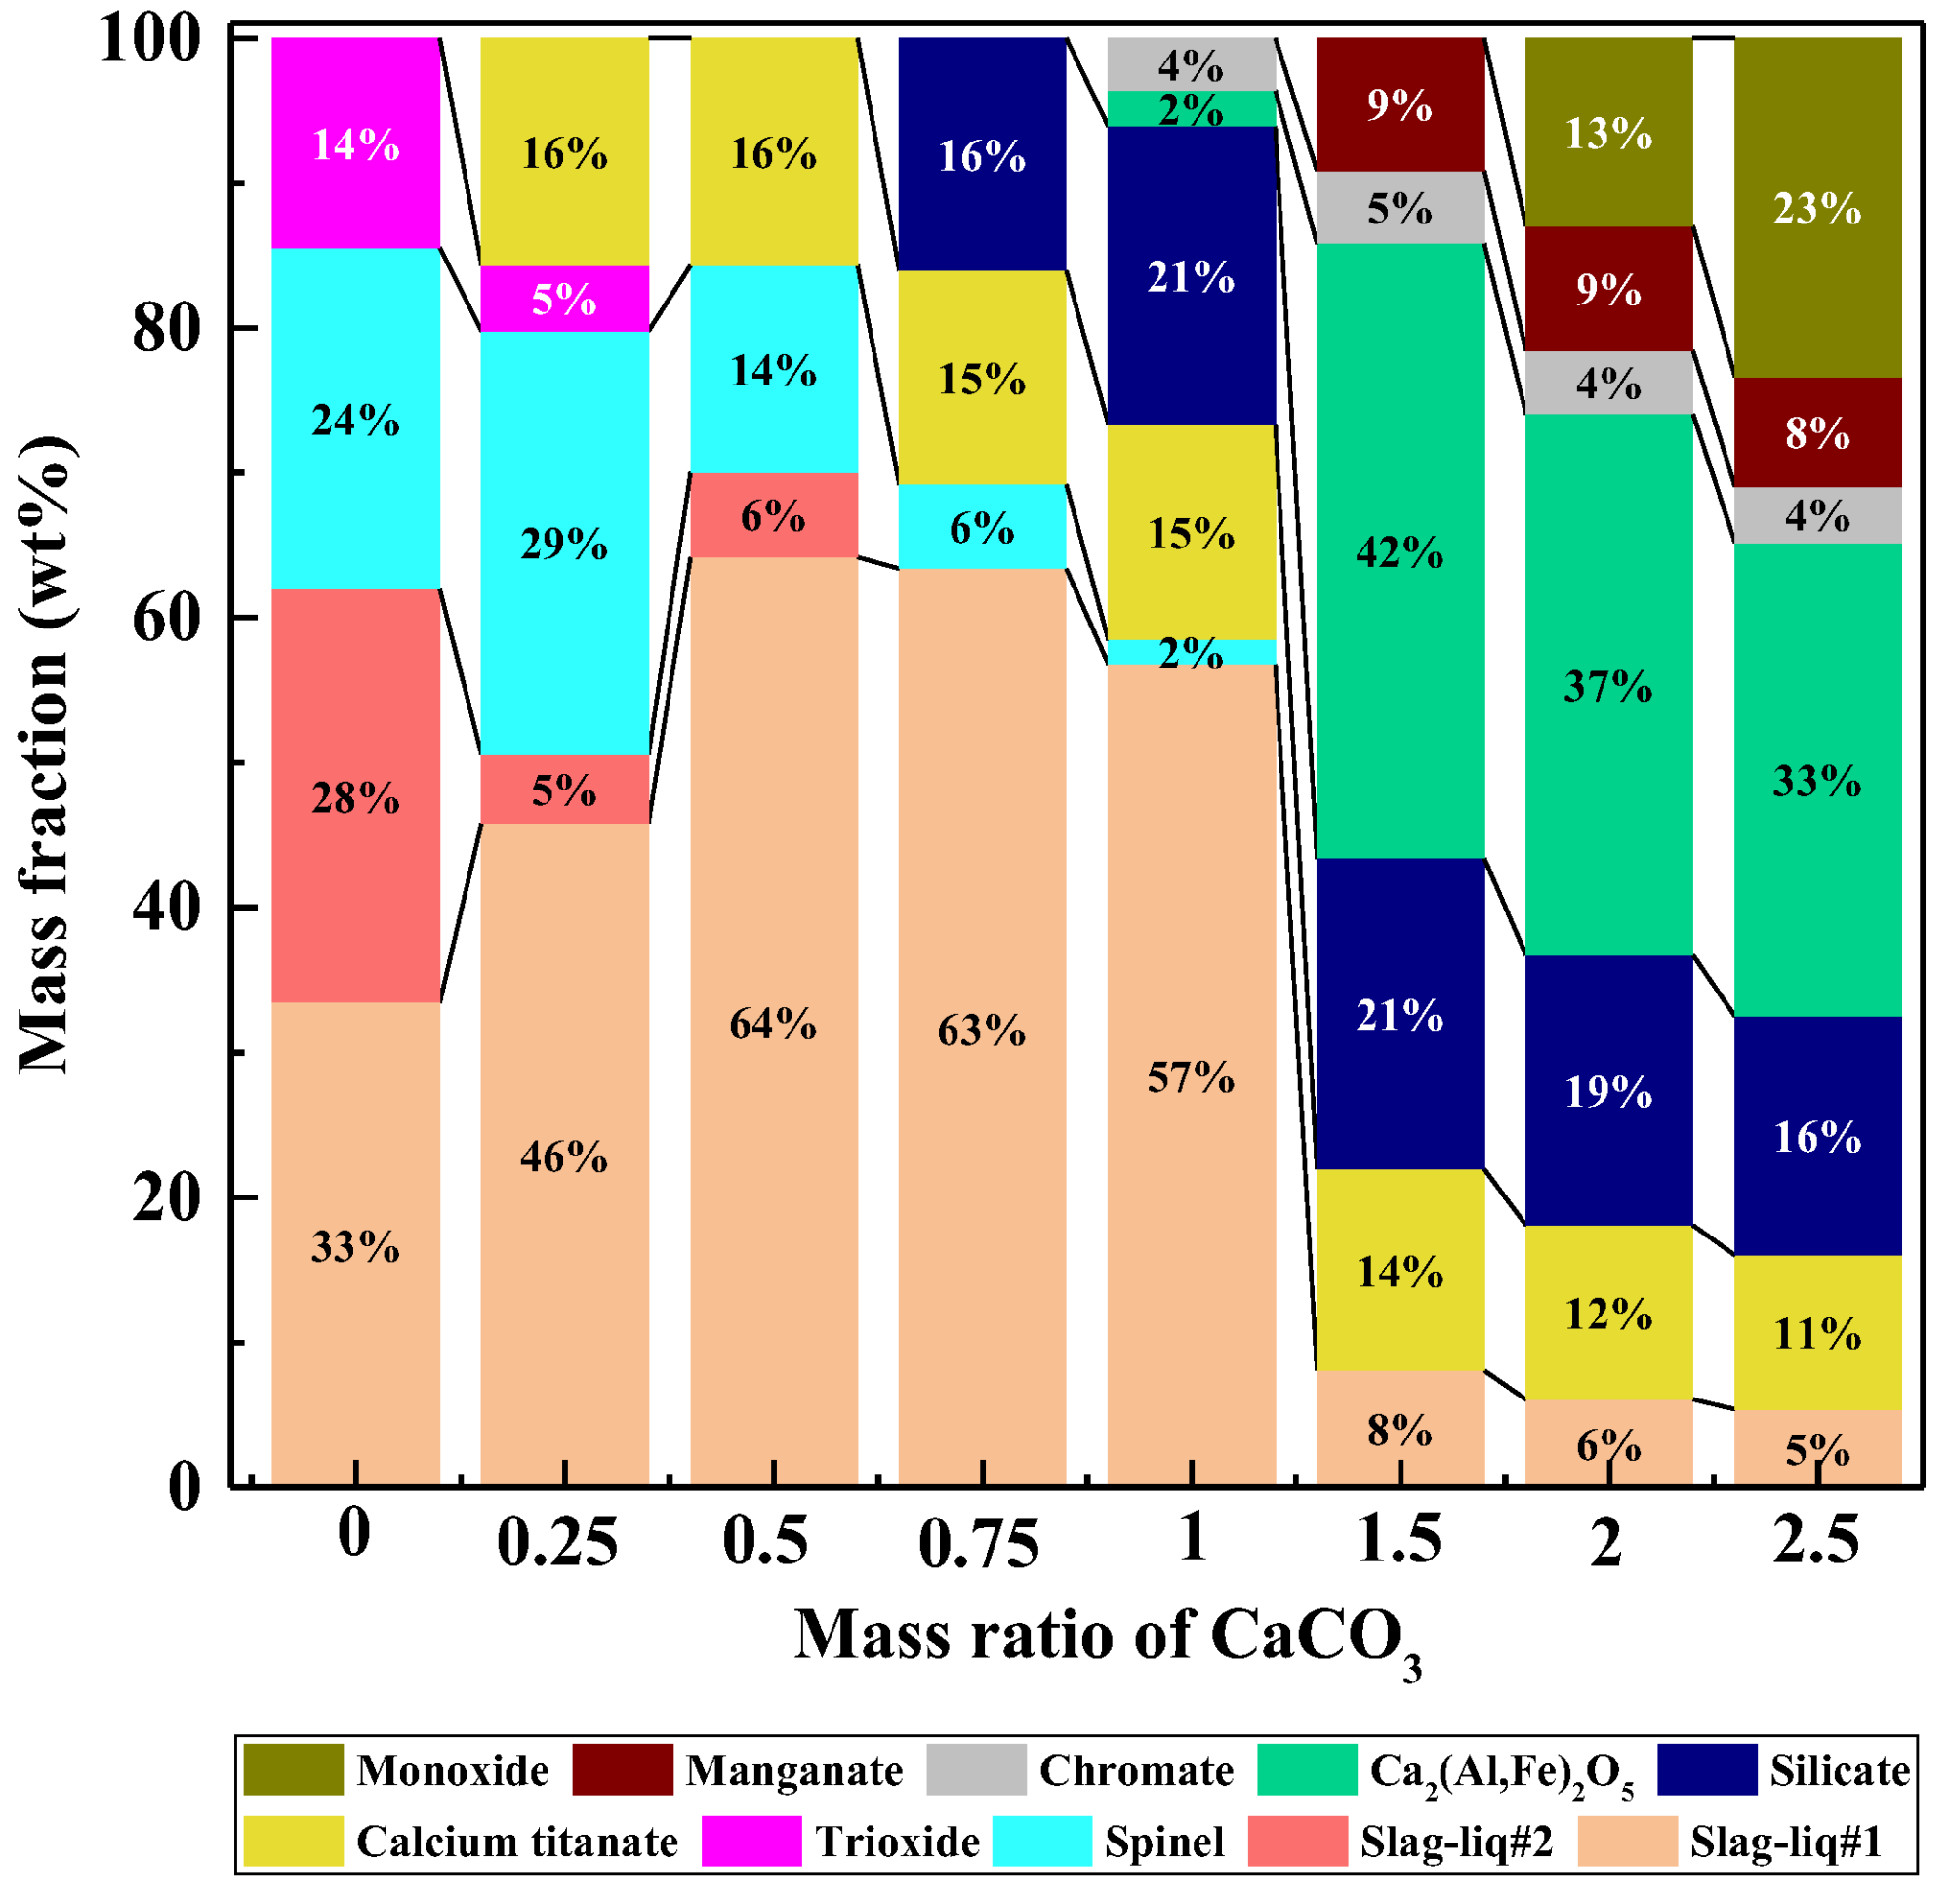
Figure 3 shows the thermodynamic equilibrium phase compositions of a mixture of vanadium tailings with varying mass ratios of CaCO3 (the denominator is 1 and omitted, hereinafter the same) at 1250 °C and was performed with FactSage 8.1 (Thermfact/CRCT& GTT-Technologies, Canada and Germany). Products without CO2 are shown in the calculation results and based on the calculation results, the product phases are categorized.
The equilibrium products have ten phases at different mass ratios of CaCO3 to vanadium tailings. The mass fraction of slag-liq#1 in the products increased and then decreased as the calcium carbonate ratio increased. When the mass ratio of CaCO3 is 0.5, the mass fraction of slag-liq#1 reached a maximum of 64%. Slug-liq#2 exists only when the mass ratios of CaCO3 are 0, 0.25 and 0.5, and the mass fractions are 28%, 5%, and 6%, respectively. When the CaCO3 ratio was increased from 0 to 0.25, the mass ratio of spinel increased slightly from 24% to 29%, but as the mass ratio of CaCO3 increased further, the mass ratio of spinel gradually decreased. When the CaCO3 ratio reached 1.5, no such phase was present in the product. The mass fractions of trioxide were 14% and 5% when the mass ratios of CaCO3 were 0 and 0.25, respectively. The mass fraction of calcium titanate was kept constant at around 15% in the range of 0.25 to 2. When the ratio of CaCO3 was increased from 0.75 to 1, the mass fraction of silicate was increased from 16% to 21%, and when the CaCO3 ratio was greater than 1.5, the mass fraction of silicate began to decrease slightly. Despite the fact that the mass fraction was only 2%, Ca2(Al,Fe)2O5 first appeared in the product at a CaCO3 ratio of 1. However, when the CaCO3 ratio was increased to 1.5, its mass fraction increased significantly to 42%, and then slightly decreased to 33% when the CaCO3 content was increased further. Chromate is only present when the mass ratio of CaCO3 is greater than or equal to 1, and its mass fraction is stabilized at approximately 4%. The mass fraction of manganate is 9% as the CaCO3 ratio is 1.5 and 2. When the CaCO3 ratio went from 2 to 2.5, the mass fraction of monoxide went from 13% to 23%, which is a big change.
3.2.2. Reaction Temperature
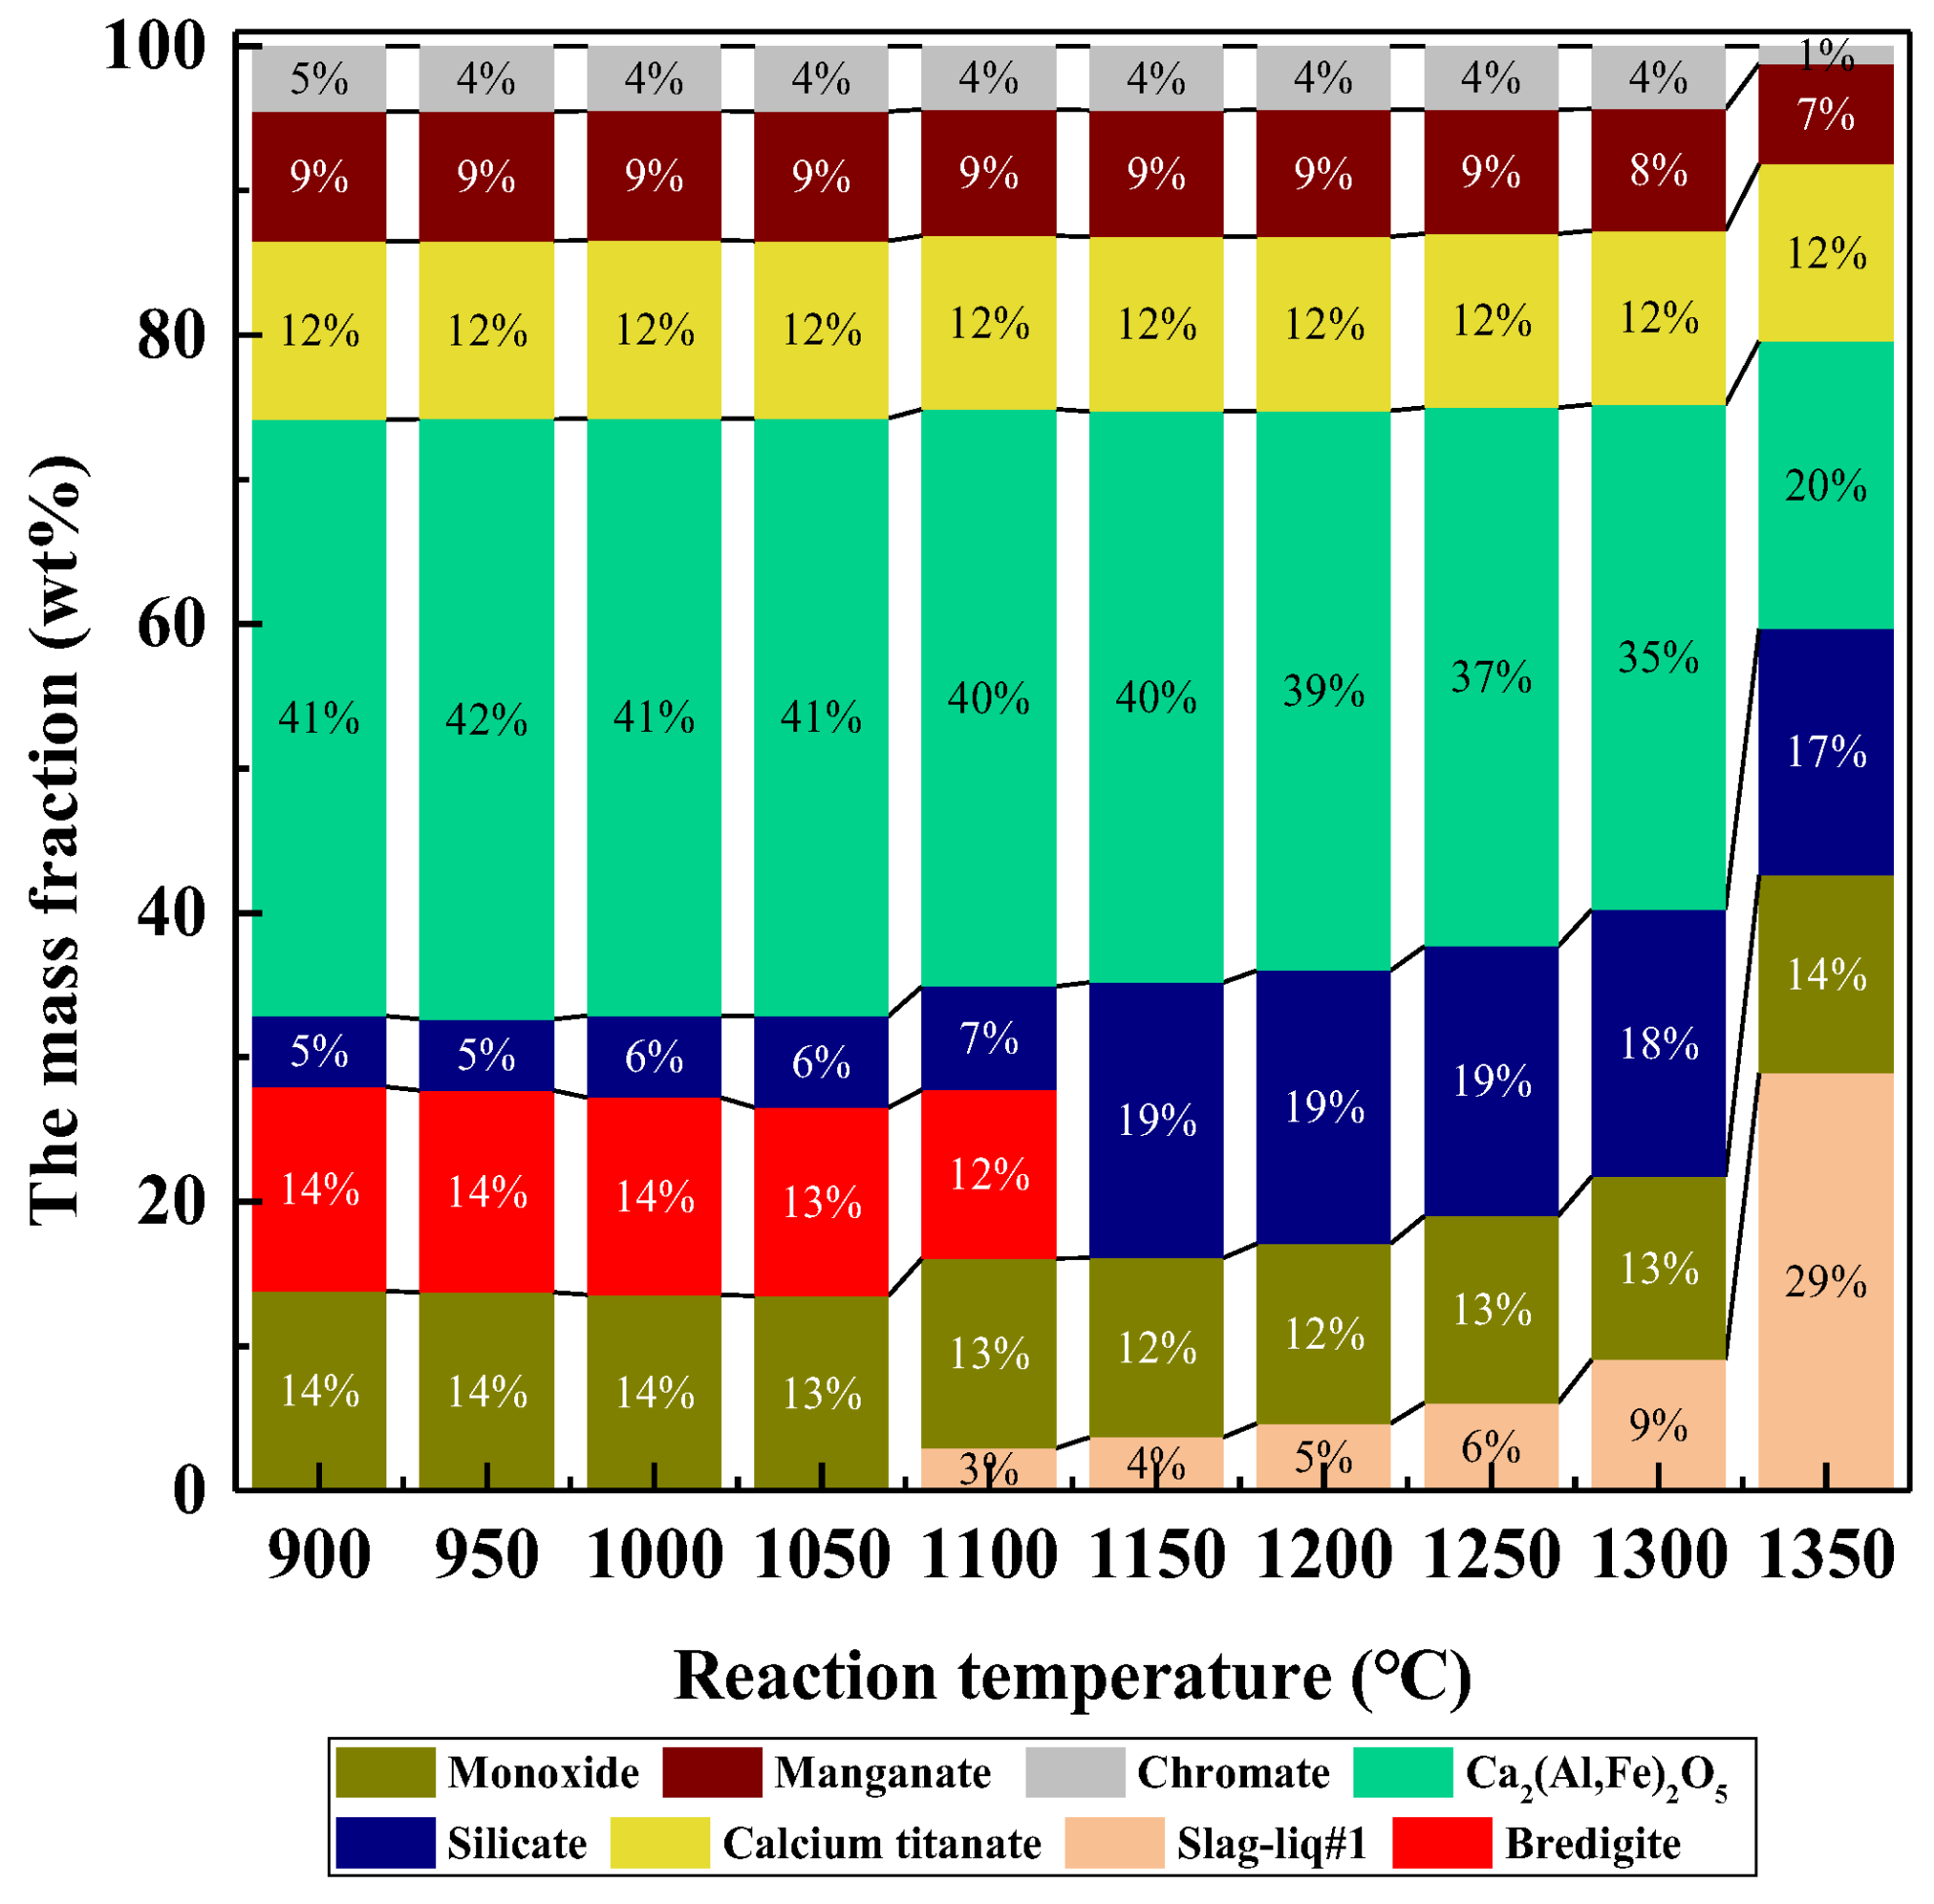
FactSage 8.1 software was used to investigate the variation of the equilibrium product mass fraction at different reaction temperatures when the CaCO3 ratio was 2. The classified products are depicted in Figure 4.
As shown in Figure 4, the mass fractions of chromate, manganate, calcium titanate, and monoxide in the product did not vary significantly over the temperature range of 900 to 1300 °C, being approximately 4%, 9%, 12%, and 13%, respectively. The mass fraction of Ca2(Al,Fe)2O5 decreases with increasing temperature, from 41% at 900 °C to 20% at 1350 °C. The mass fraction of silicate stabilizes at approximately 6% between 900 and 1100 °C. When the temperature was increased from 1100 to 1150 °C, the mass fraction of silicate increased significantly from 7% to 19% and remained constant with further temperature increases. At 900–1100 °C, the mass percentage of bredigite does not change significantly; however, when the temperature exceeds 1100 °C, the phase is no longer present in the product. Slag-liq#1 first appeared in the product at 1100 °C, and its mass fraction increased with temperature, rising from 3% at 1100 °C to 29% at 1350 °C. Combined with the above analysis, it can be seen that when the CaCO3 ratio is 2, the types of phases in the products at different temperatures do not differ much, and the mass proportion of each phase changes with temperature.
3.3. Calcification Roasting of Vanadium Tailings
3.3.1. Effect of Calcification Roasting on the NaOH Leaching of Sodium in Vanadium Tailings
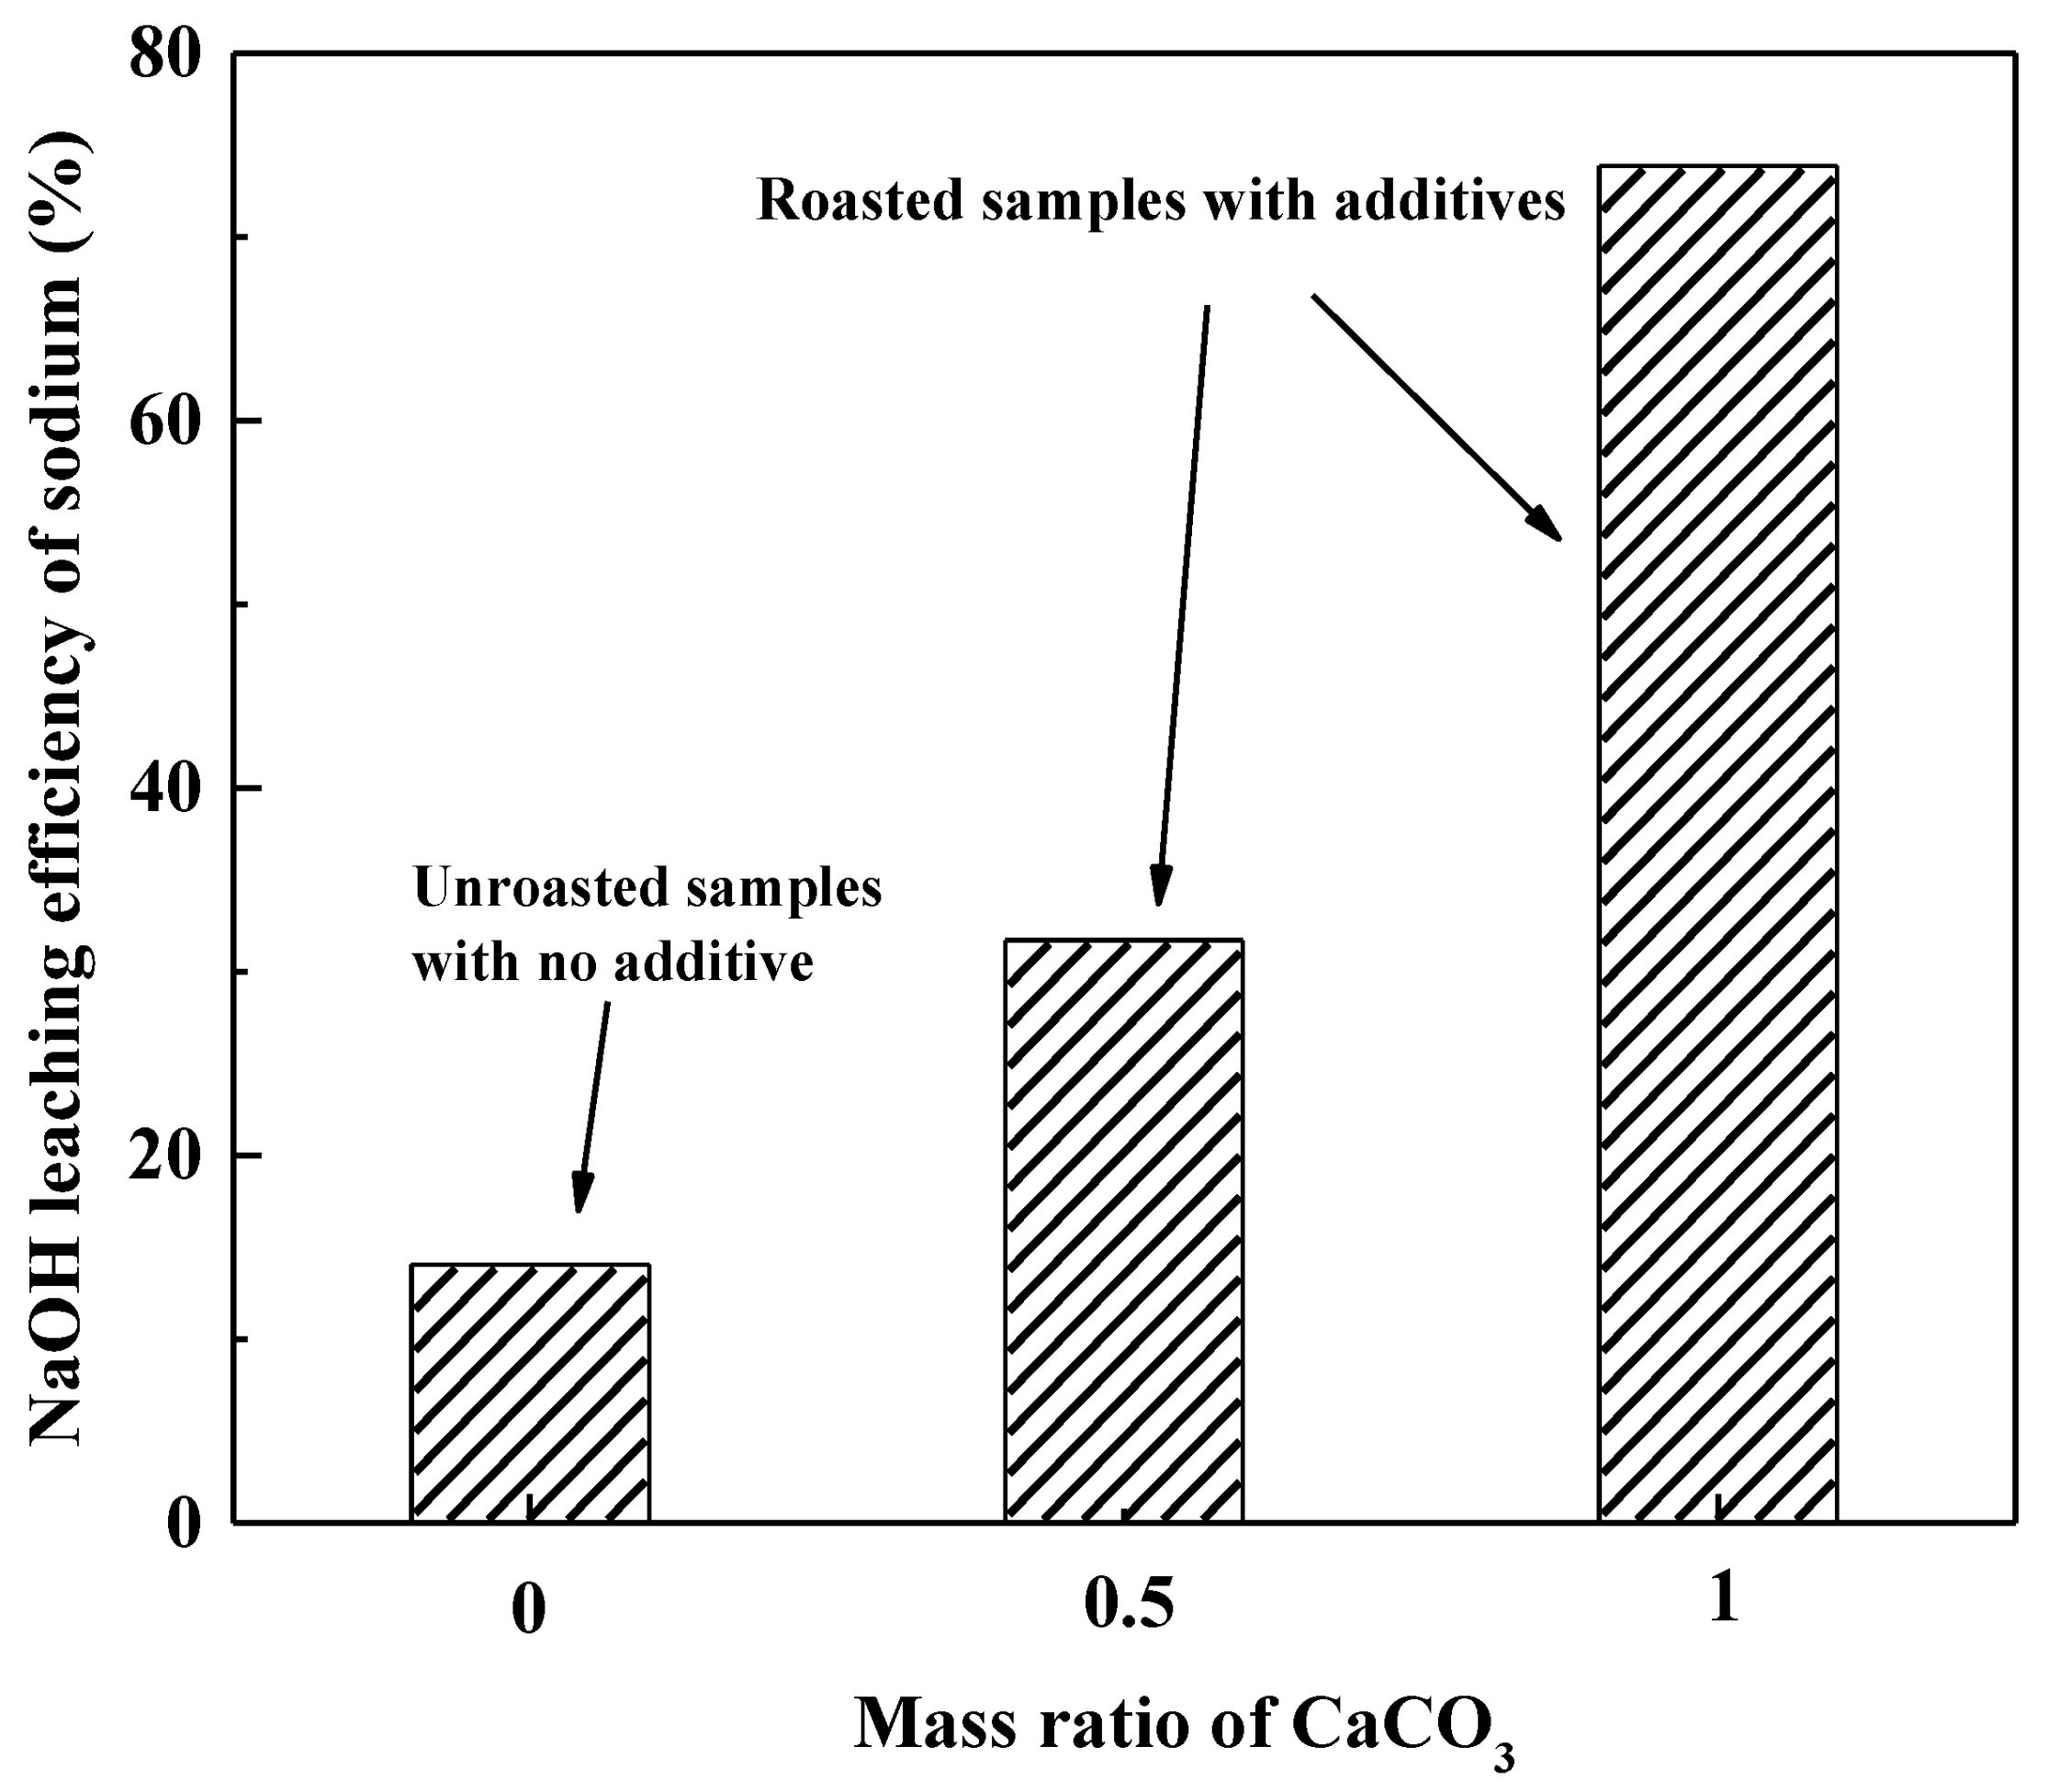
This part studies the promoting effect of calcification roasting on the removal of sodium from tailings during NaOH leaching. The roasting temperature was fixed at 1250 °C for 120 min in the roasted group with additives and the NaOH leaching were performed with L/S ratio of 10:1 after leaching for 120 min at 95 °C. The results were shown in Figure 5.
As shown in Figure 5, the leaching efficiency of unroasted vanadium tailings with no additives was only 14.05%, which means the sodium in vanadium tailings showed a stable phase state and was stable in the NaOH leaching system. When the tailings were roasted with CaCO3 additives at a mass ratio of 0.5, the leaching efficiency was 31.71%. When the mass ratio was increased from 0.5 to 1, the leaching efficiency increased to 73.87%. As shown in the above results, calcification roasting can significantly promote the phase transformation of sodium phases in tailings and realize the efficient dissolution of sodium under atmospheric pressure and in an alkaline environment.
3.3.2. Volatilization Behavior of Sodium during Calcification Roasting
During the experiment, we noticed the volatilization of sodium in the roasting process, and studied the volatilization behavior of sodium under the different calcified roasting conditions: mass ratio of CaCO3, roasting temperature and roasting time.
Mass Ratio of CaCO3
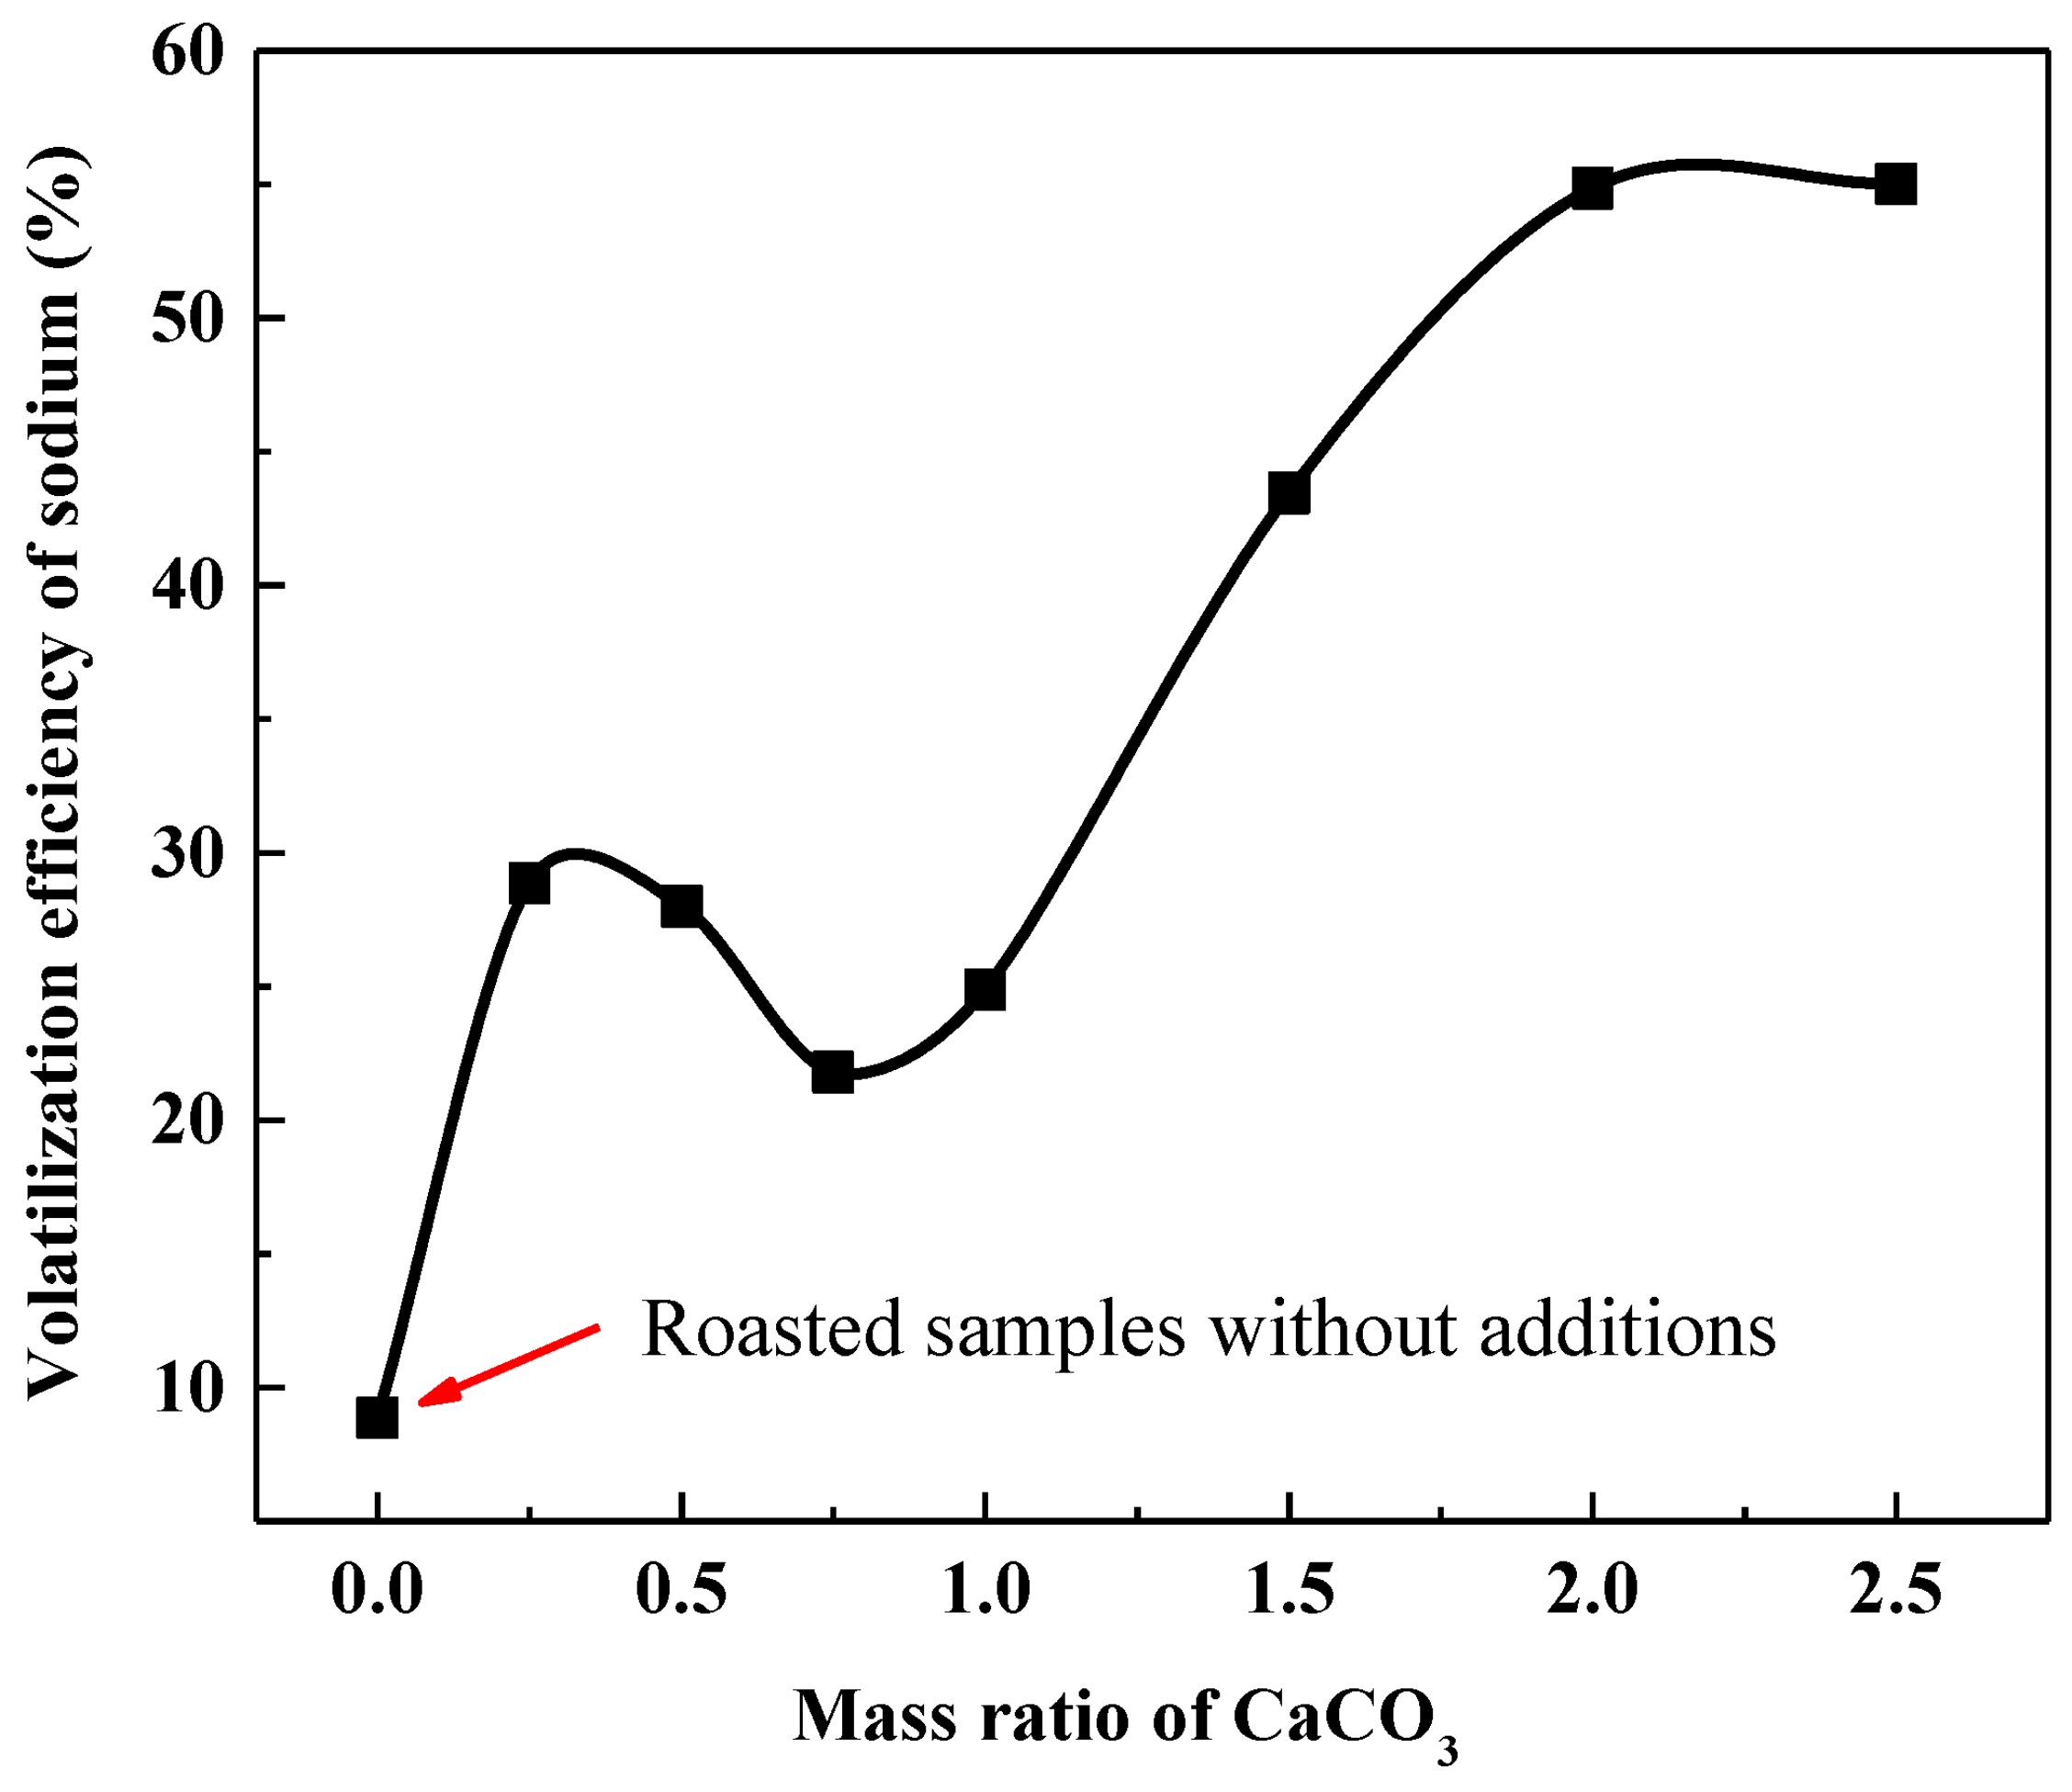
Various mass ratios of CaCO3 were studied while keeping other calcification roasting parameters as follows: roasting temperature of 1250 °C and roasting time of 120 min. The results are shown in Figure 6.
As illustrated in Figure 6, the volatilization efficiency of sodium increased significantly from 8.87% to 28.86% as the mass ratio of CaCO3 increased from 0 to 0.25. The mass ratio of CaCO3 increased from 0.25 to 0.75, the volatilization efficiency of sodium decreased slightly from 28.86% to 21.79%. Combined with the above thermodynamic equilibrium calculation results, it can be seen that the compositions and mass fractions of the material phases in the equilibrium product vary widely in the interval from 0.25 to 0.75 of the mass ratio of CaCO3. The difference in the fixation effect of sodium in different phases leads to the difference in sodium volatilization rate. The volatilization efficiency of sodium increased significantly as the mass ratio of CaCO3 increased from 0.75 to 2. Increasing the CaCO3 dosage causes more sodium to be converted to the volatile phase. When the mass ratio of CaCO3 increased from 2 to 2.5, the volatilization efficiency of sodium volatilization did not change significantly, indicating that the CaCO3 dosage was no longer the limiting condition for sodium volatilization improvement once the mass ratio of CaCO3 exceeded 2. The sodium volatilization efficiency reached 54.85% when the mass ratio of CaCO3 was 2.
Roasting Temperature
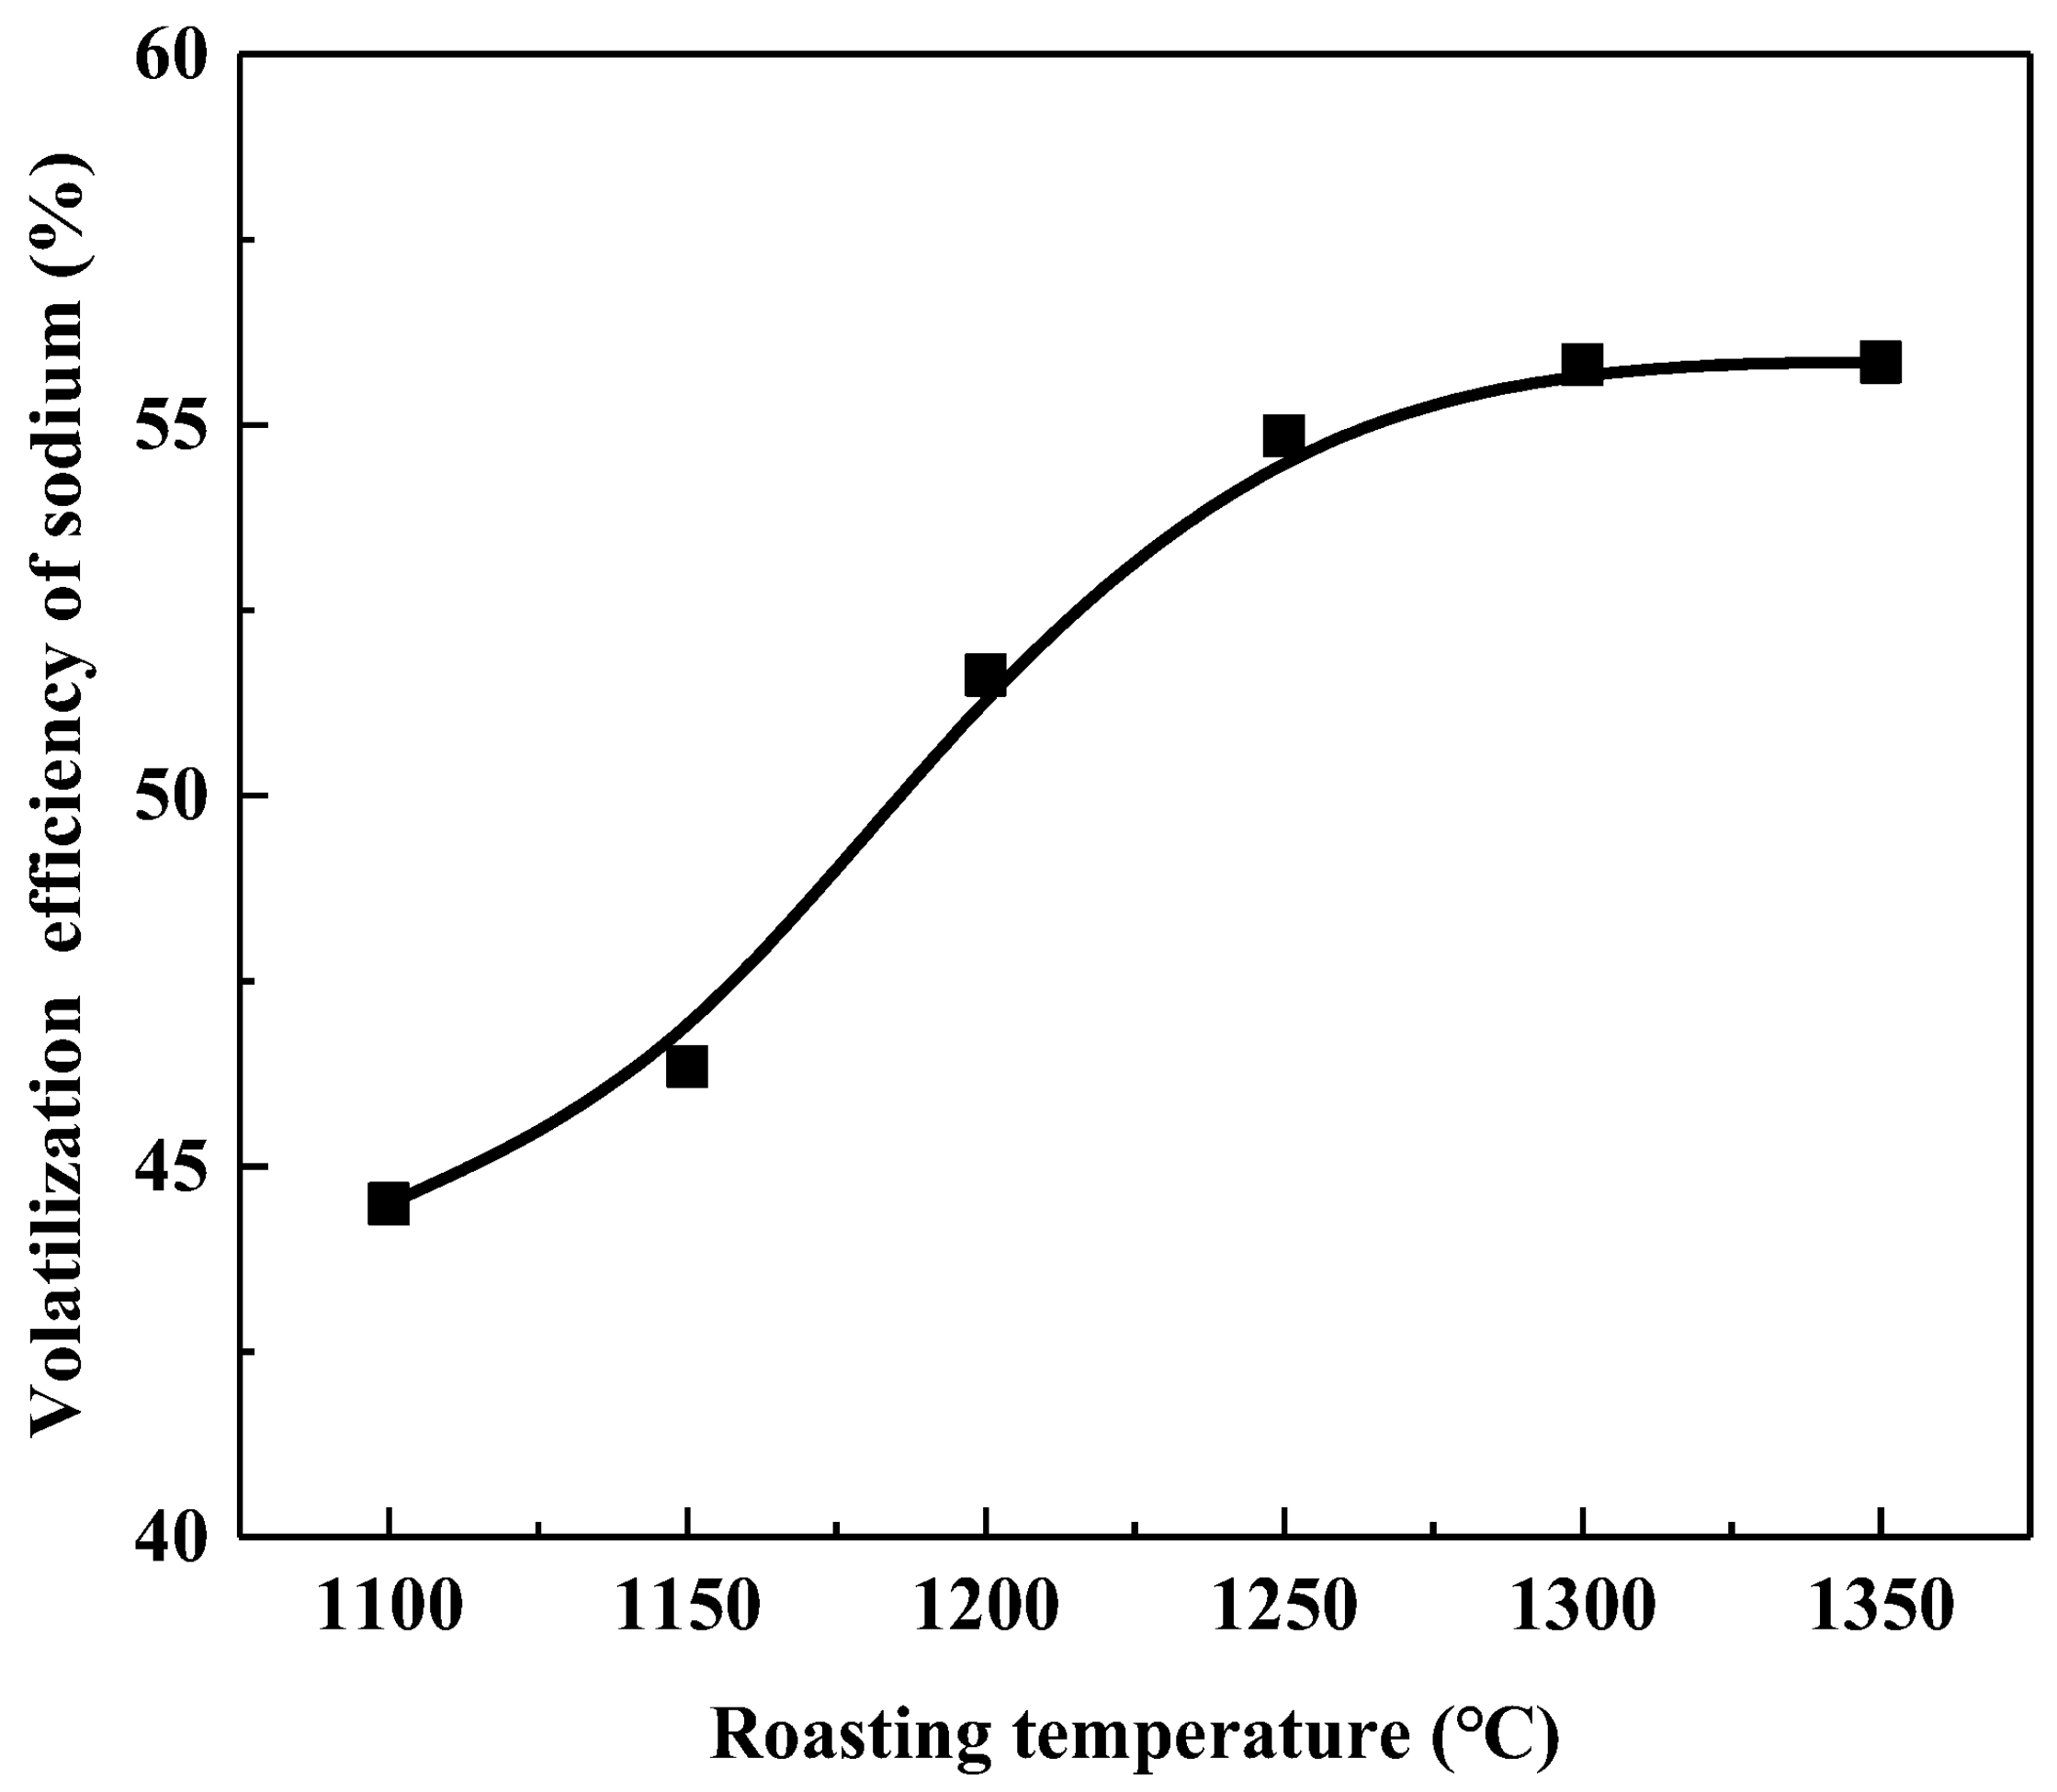
Pellets consisting of vanadium tailings with double the mass of CaCO3 were roasted for 120 min under various roasting temperatures. The effect of roasting temperature on sodium volatilization is shown in Figure 7.
As shown in Figure 7, the volatilization efficiency of sodium increases as the temperature rises. When the roasting temperature was raised from 1100 to 1250 °C, the volatilization efficiency of sodium increased from 44.49% to 54.85%. The volatilization efficiency of sodium increased to 55.84% when the roasting temperature was raised to 1350 °C. This means that sodium volatilization did not increase further once the roasting temperature reached 1250 °C.
Roasting Time
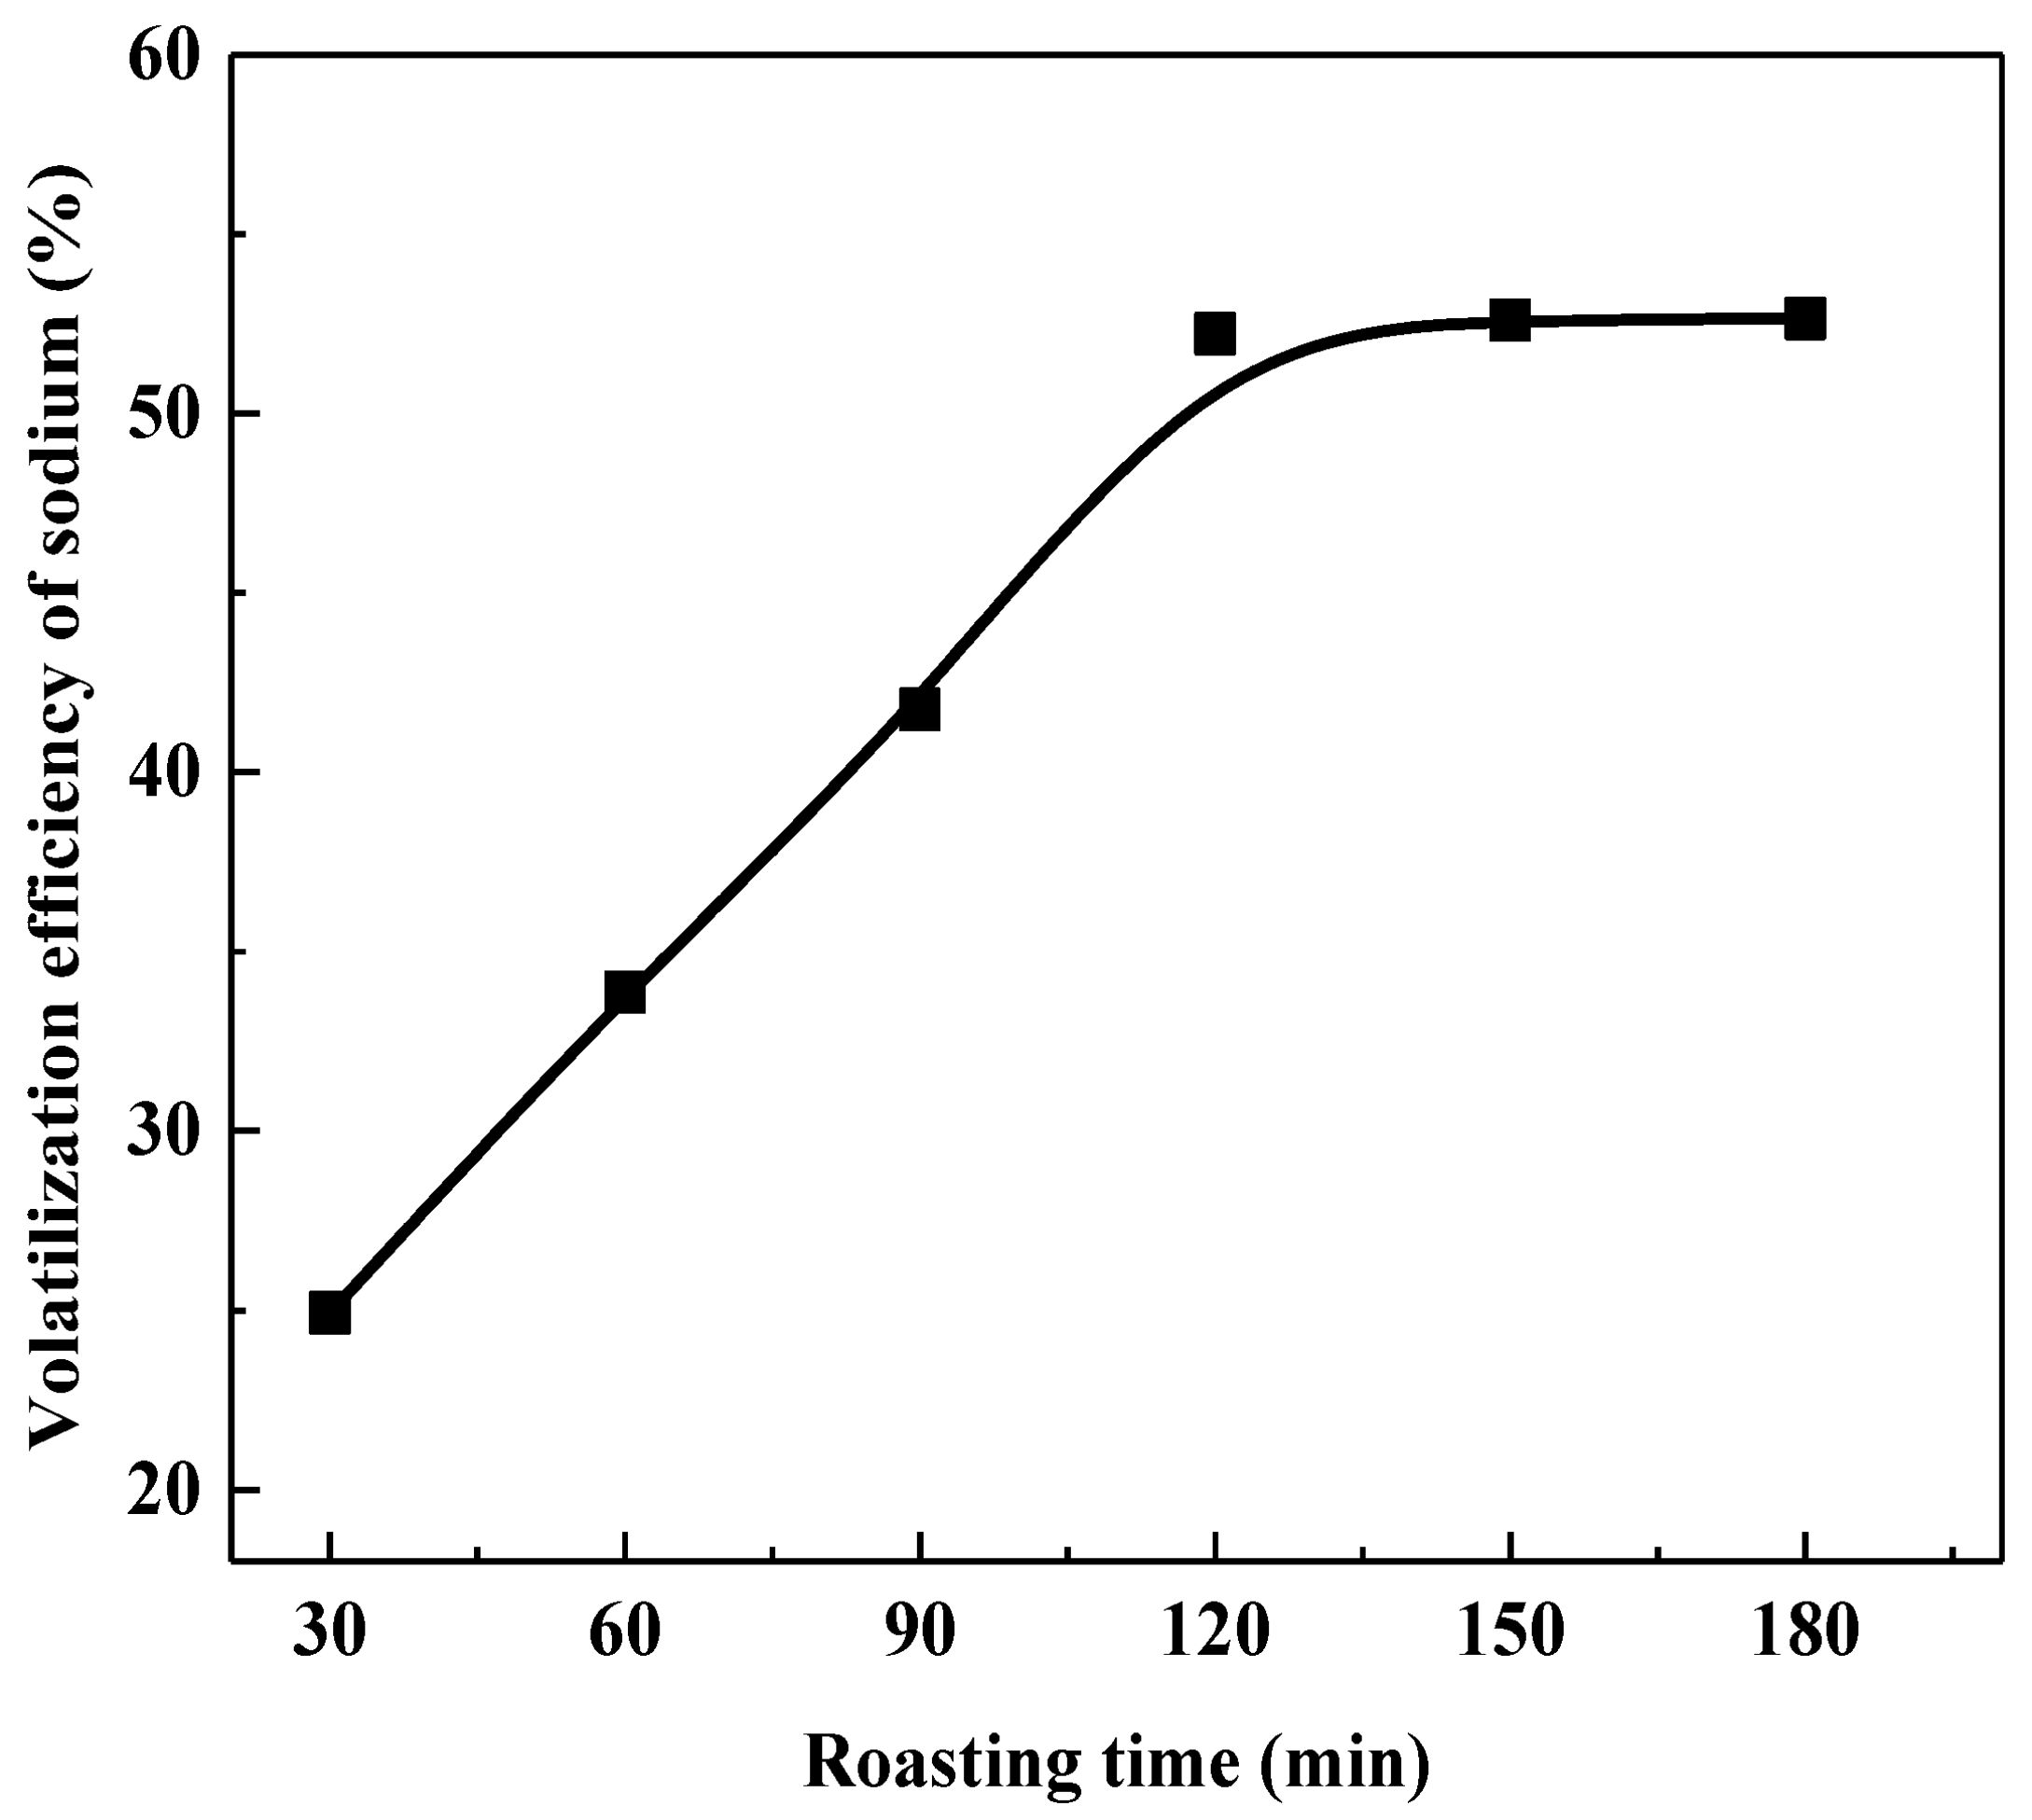
Pellets consisting of the vanadium tailings with double the mass of CaCO3 were roasted at different times at 1250 °C to determine the effect of roasting time on sodium volatilization. The results are depicted in Figure 8.
As shown in Figure 8, as the roasting time increased from 30 to 120 min, the volatilization efficiency of sodium increased from 24.93% to 52.22%. In this roasting time range, the relationship between the sodium volatilization efficiency and roasting time is linear. The efficiency of sodium volatilization did not change significantly as the roasting time increased to 120 min.
3.3.3. Mineral Phase Transformation of Sodium during Calcification Roasting
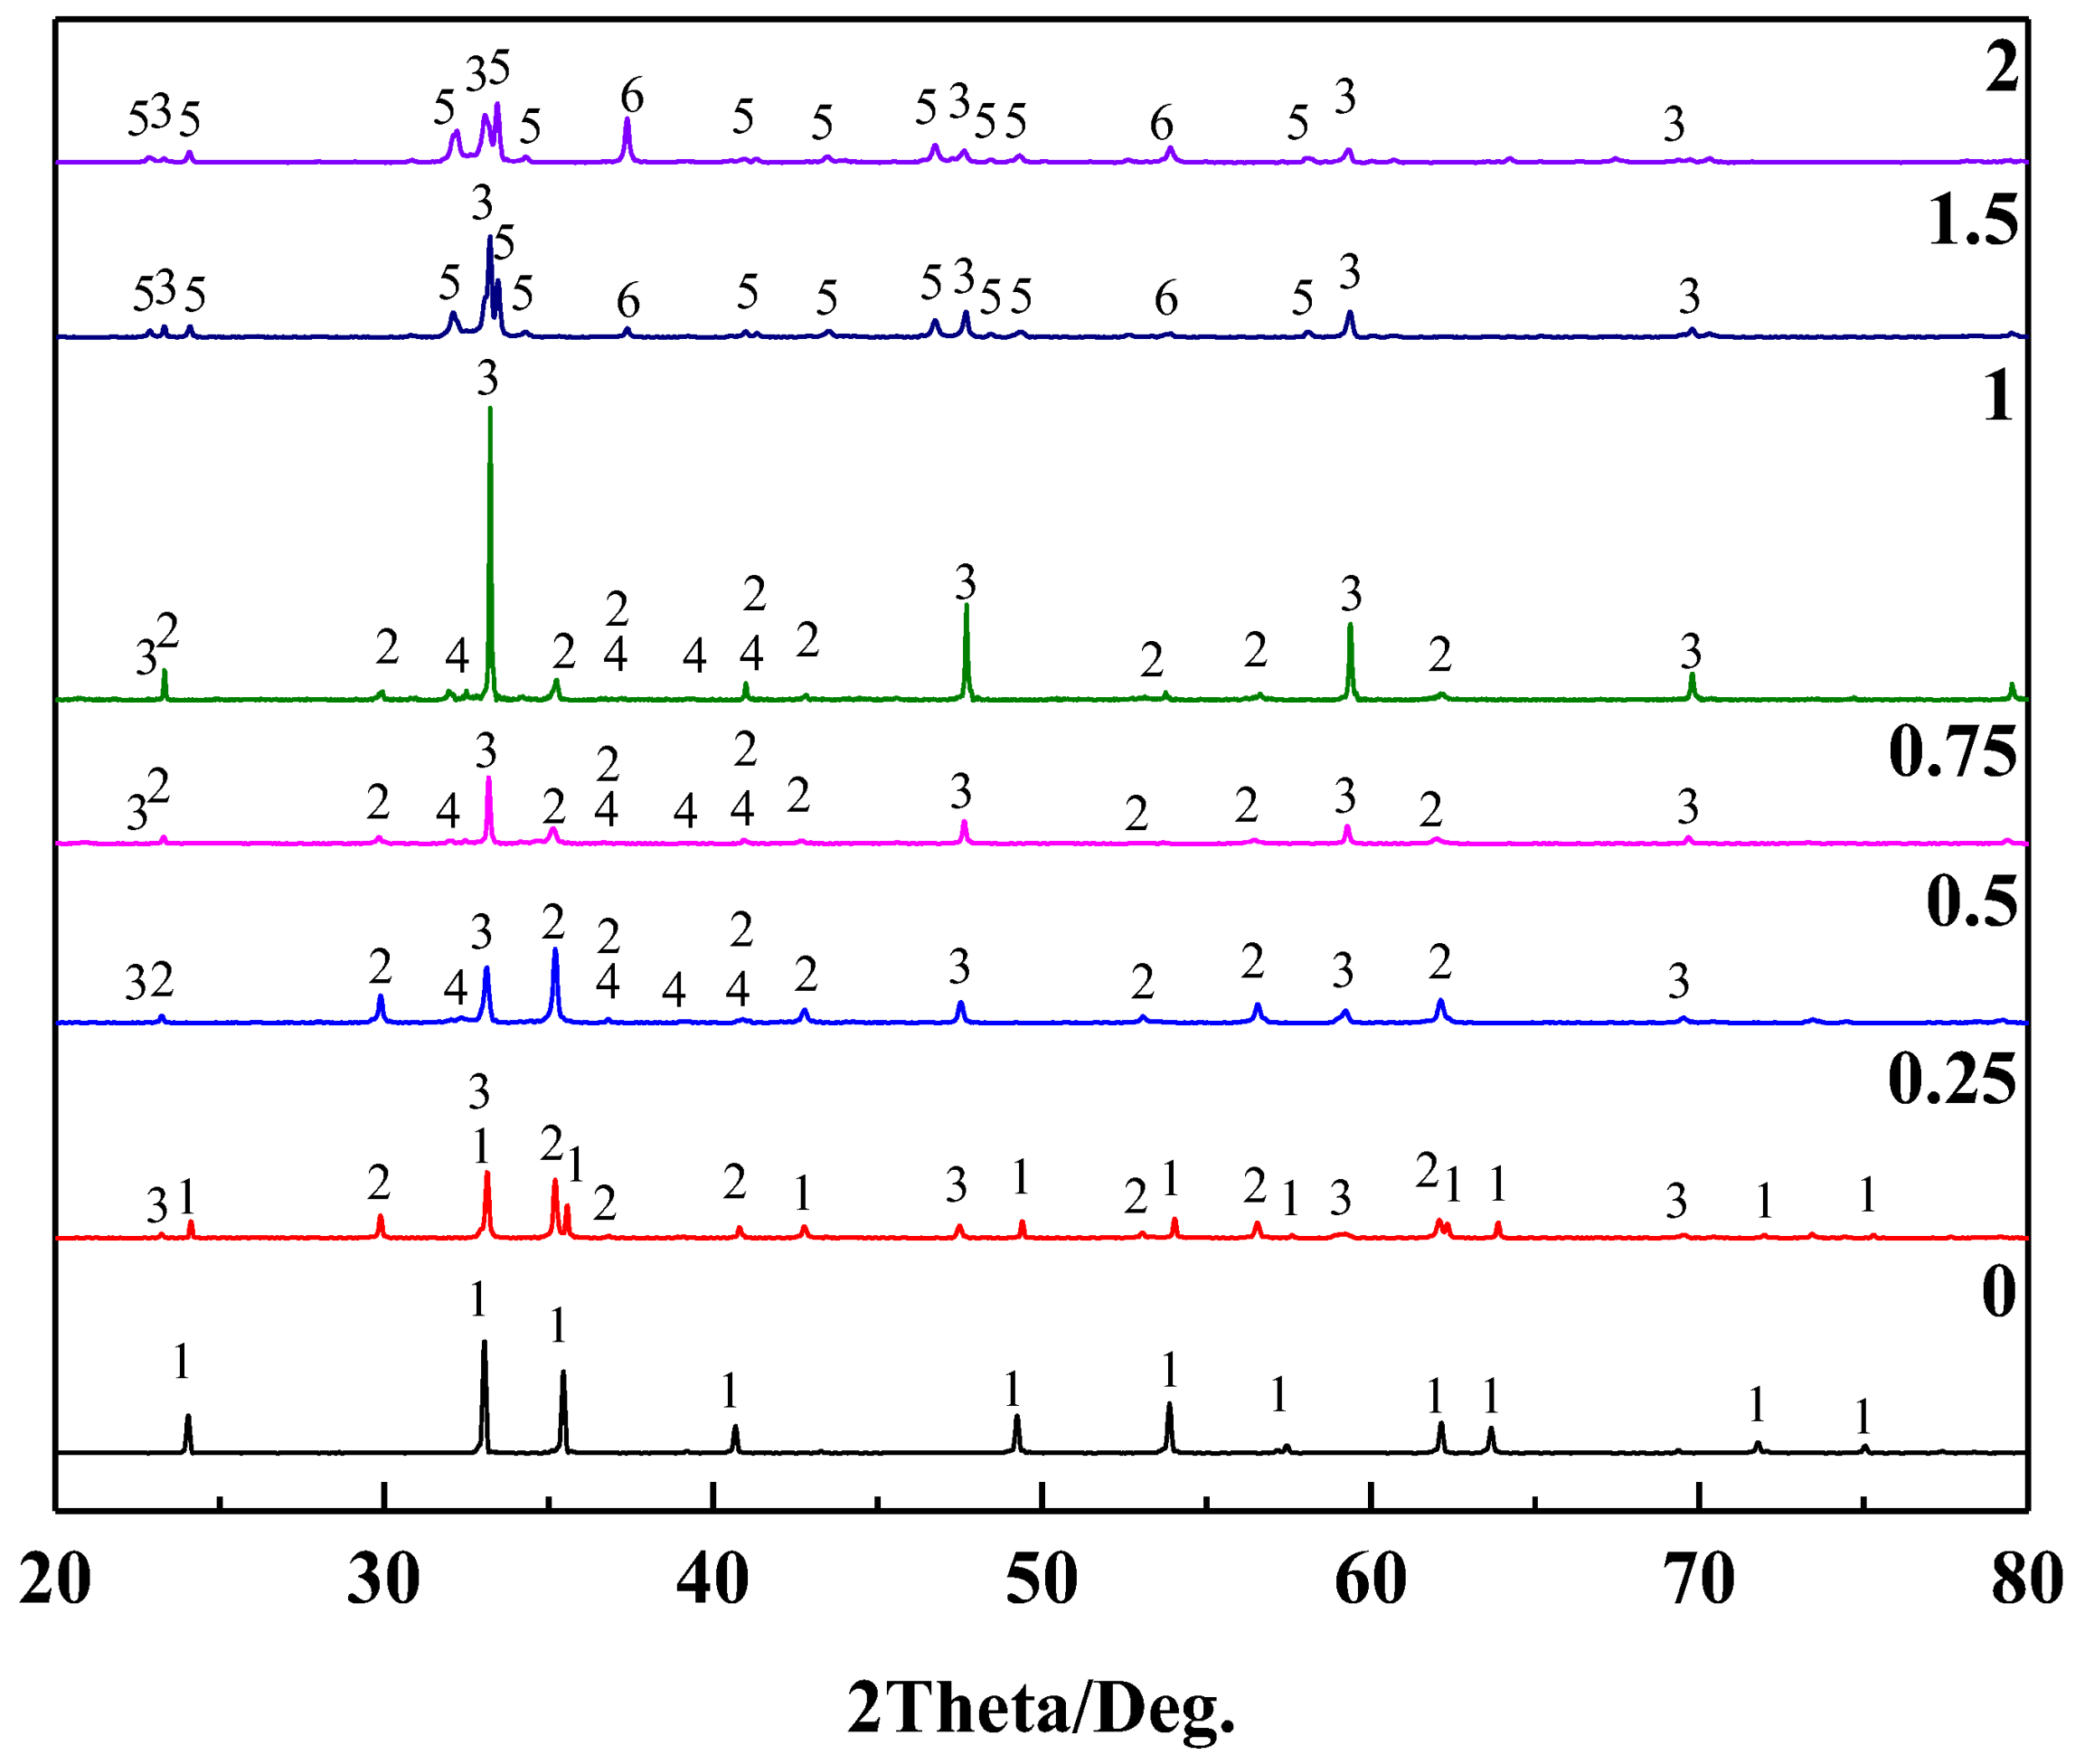
The XRD patterns and the major minerals presented in the samples roasted at 1250 °C for 120 min in air with different mass ratios of CaCO3 are presented in Figure 9.
As shown in Figure 9, six different phases can be analyzed by XRD patterns at different CaCO3 ratios. The results indicate that Fe2O3 occurs at ratios of 0 and 0.25. By comparing equilibrium calculation results, it is clear that the phase corresponding to trioxide in the product could be Fe2O3. The CaTiO3 phase has diffraction peaks in the range of 0.25 to 2 of CaCO3 ratio. Similarly, in the equilibrium results, the CaTiO3 phase may correspond to the calcium titanate phase. Ca2SiO4 and Ca2Fe1.2Mg0.4Si0.4O5 can roughly correspond to the silicate phase in equilibrium calculation results using the same analogy. CaO may correspond to the monoxide phase. However, the CaO diffraction peak appears at a CaCO3 mass ratio of 1.5, whereas monoxide only appears in the equilibrium calculation results at a CaCO3 mass ratio of 2. It should also be noted that not all of the theoretically calculated phases correspond to the diffraction peaks in the XRD patterns, which could be due to the difference between the theoretical calculations and the actual systems. Additionally, some of the peaks in the diffraction patterns do not correspond perfectly to the standard cards due to the complex solid solution and lattice substitution phenomenology. To address the above problems, we need to further investigate the elemental enrichment behavior in the microstructure using SEM-EDS.
3.3.4. Microstructural Change of Sodium during Calcification Roasting
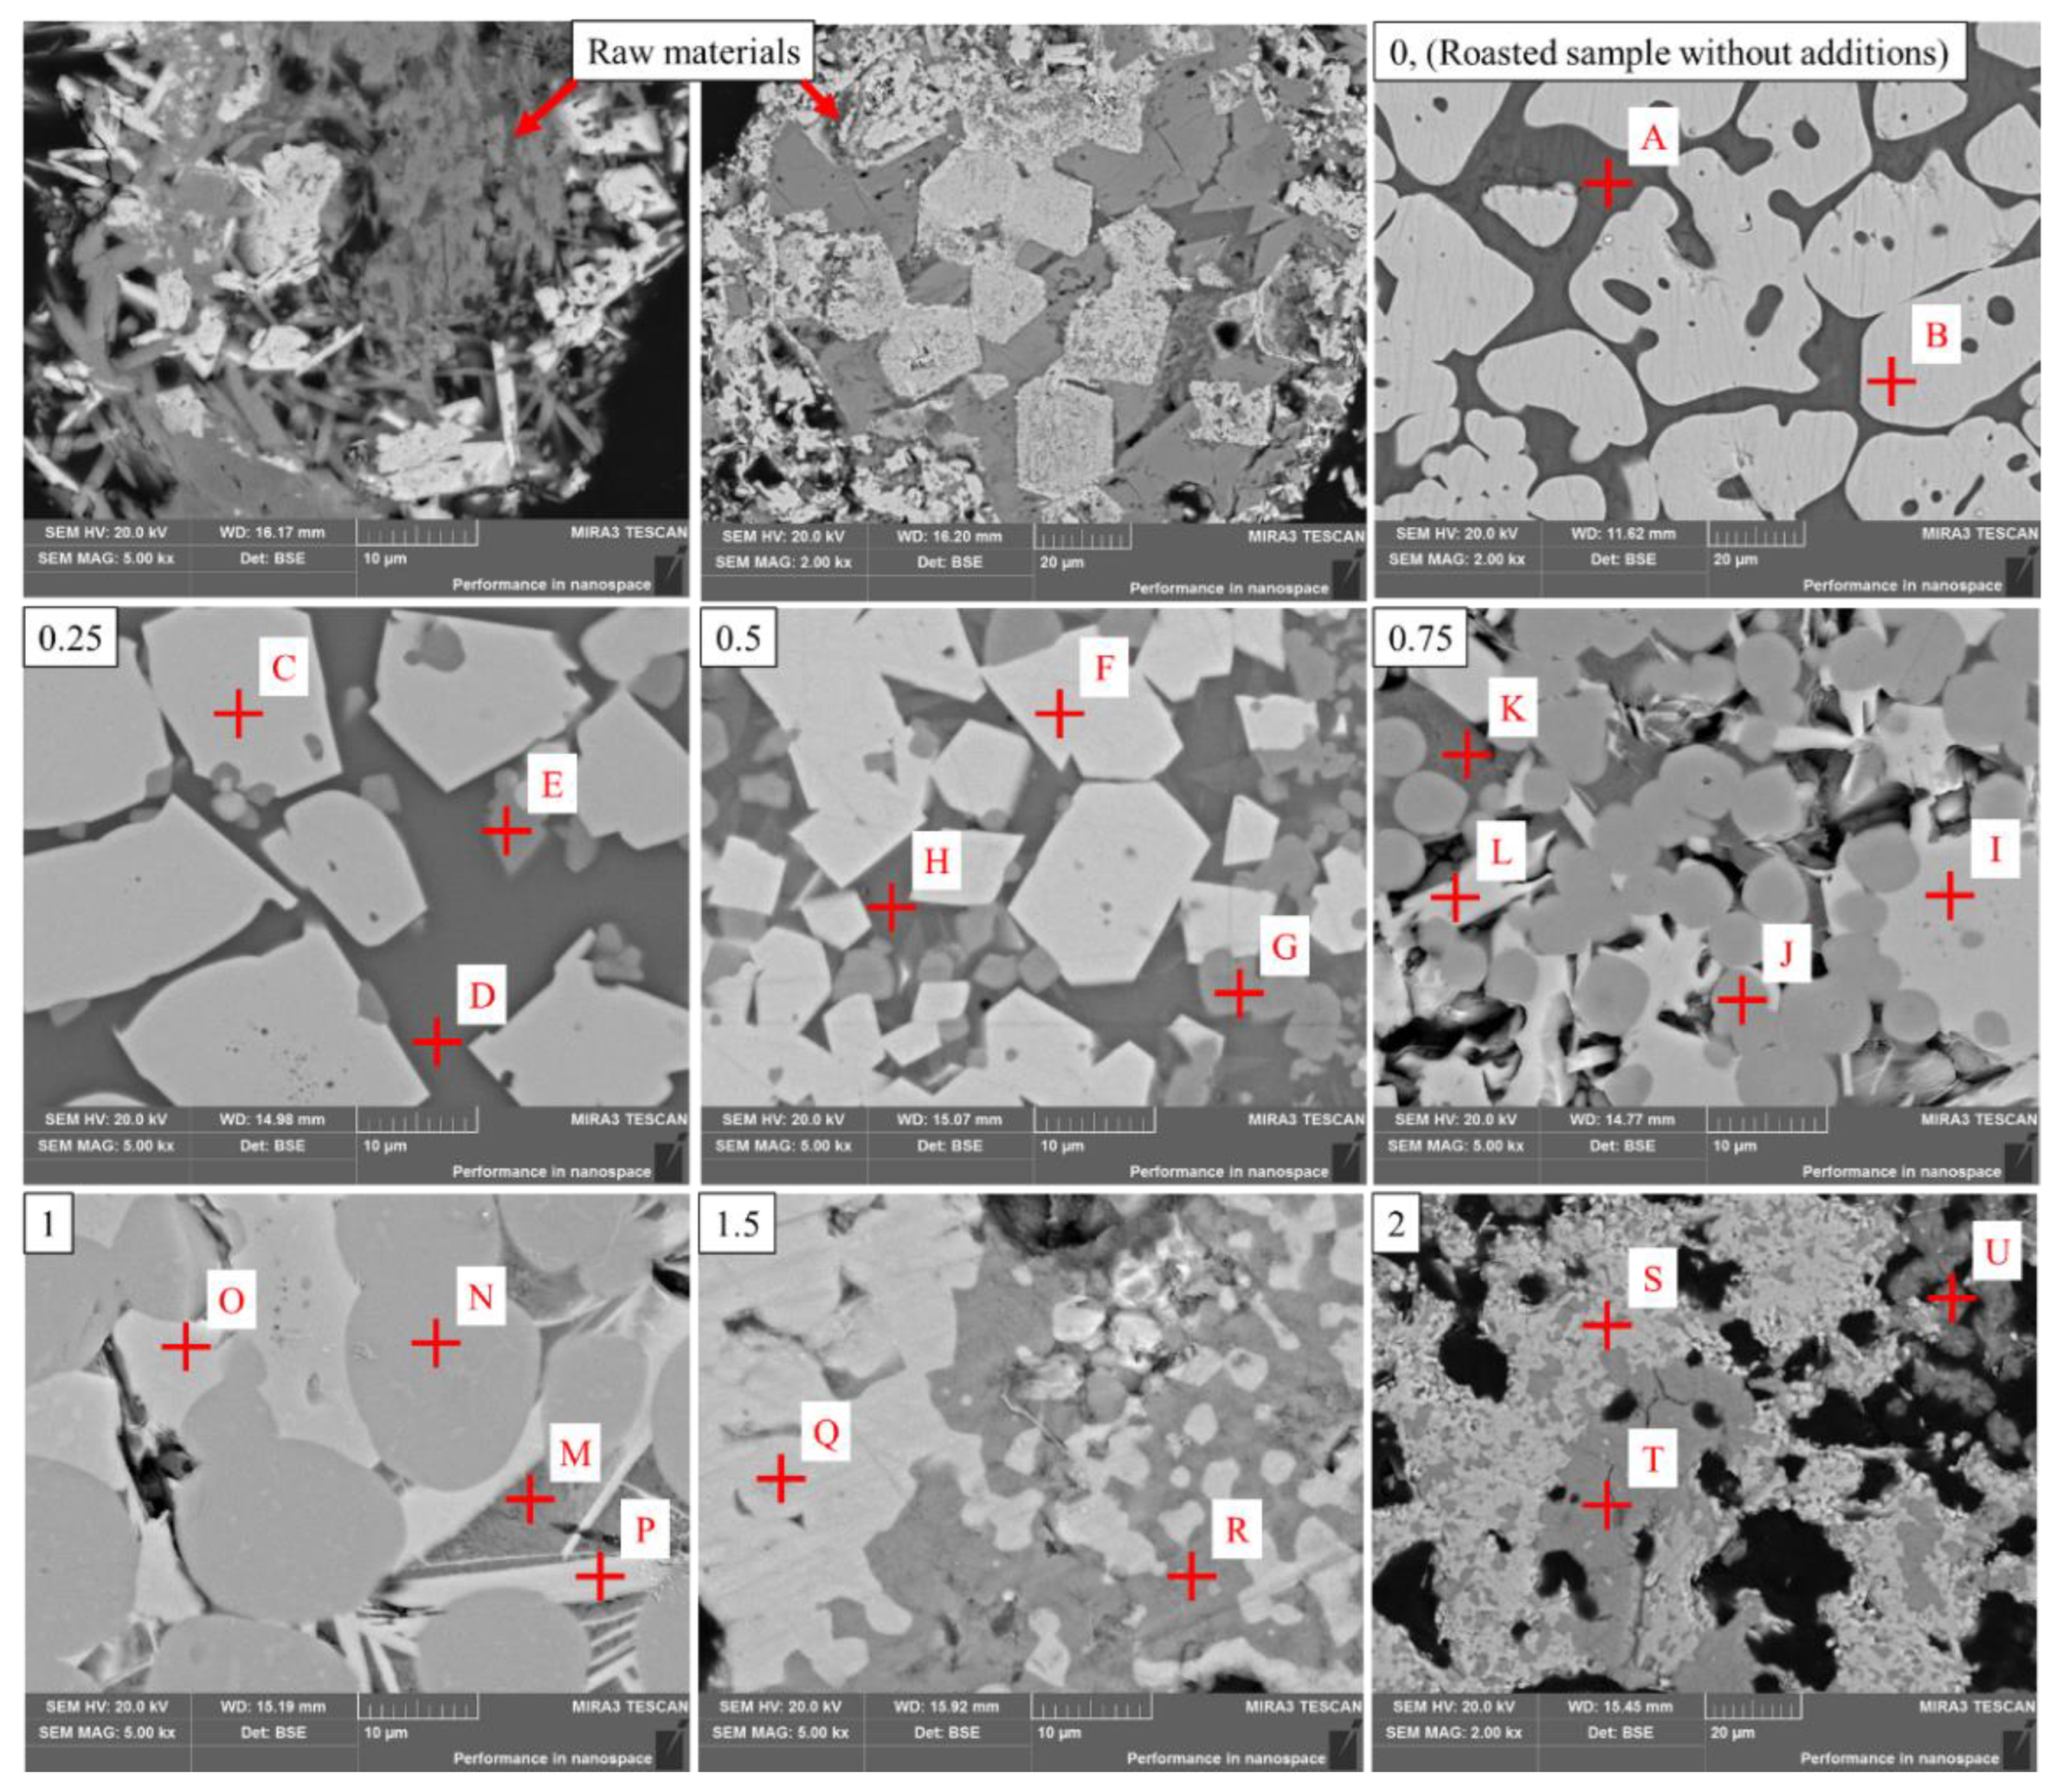
Figure 10 and Table 3 show the microstructure and energy spectra of roasted products with different mass ratio of CaCO3 in cross sections.
The XRD patterns in Figure 9 show that only the Fe2O3 phase is detected in the roasted samples. However, the SEM-EDS results in Figure 10 and Table 3 show two phases with varying gray levels. The EDS results show that silicate is the main phase component in point A (dark area), which is slightly mixed with Ca, Al, Ti, and other elements. The main phase of point B (bright area) is hematite, which is slightly mixed with Ti, Cr, and Mn. In conjunction with the preceding analysis, it is possible to confirm that roasted products contain two phases: silicate and hematite. The silicate cannot be detected by XRD because it has an amorphous structure. Sodium is mainly concentrated in the silicate phase.
There are three different areas with different gray levels and shapes when the CaCO3 mass ratio is 0.25 and 0.5. When the EDS results are combined, point C and point F (bright areas) primarily contained O, Fe, Mn, and Cr, corresponding to the Mn0.43Fe2.57O4 phase, which is a type of manganese iron oxide. Points D and H have similar contents and gray levels and can be classified as a type of calcium-bearing silicate phase primarily doped with Na, Fe, and Al. Due to the complex solid solution behavior, this type of calcium-bearing silicate phase in roasted samples lacks known diffraction peak data, and may be closer to Mn0.43Fe2.57O4 peaks in XRD patterns. The Ca content of the calcium-bearing silicate phase in the 0.5 CaCO3 product (point H) is higher than that in the 0.25 CaCO3 product (point D). This phenomenon demonstrates that increasing the CaCO3 dosage can increase the Ca content in the calcium-bearing silicate phase. Points E and G have comparable atomic ratios and gray levels. The calcium titanate phase is the main phase at points E and G, according to the EDS results. The calcium-bearing silicate phases are primarily enriched in sodium in roasted products.
As seen from the SEM-EDS results, increasing the mass ratio of CaCO3 to 0.75 and 1 results in a significant difference in microscopic structure and elemental compositions compared to the roasted products at a mass ratio of 0.5, although the XRD results are similar. First, it is difficult to detect the typical calcium titanate phase in roasted products. Second, more Fe, Si, and Mn entered the calcium titanate phases, forming a new complex polycompound (points J and N). This complex polymer exhibits balling behavior in the microscopic structure, indicating that the enrichment of Fe, Si, and Mn in this phase can result in a low melt viscosity [23]. The gray levels of points P, L, O and I are roughly comparable, although the areas of points P and L show a needle-like structure, and points O and I show irregular shapes. Comparing the elemental composition, it can be seen that the calcium content in points P and L is higher than that in points O and I. This may be the main reason for the morphological difference between them. Comparing the elemental compositions of points P and L, O and I, respectively, we can see that the Fe content in point P is higher than that in point L, while the Fe content in point O is lower than that in point I. We classified the points O and I as ferromanganese ores, while points P and L were grouped as complex calcium ferrite (SFCA). Luo et al. [24] showed that when the alkali concentration of sinter was low, the SFCA existed in fine acicular and columnar grains that interlaced with ferrous minerals. Their study also indicated that alkali metal elements can intrude into the structure of SFCA, and small amounts of sodium were also found in the EDS results of point P and point L. According to the composition of elements, points K and M are aegirine-arfvedsonite syenite phases; however, these points have a similar gray level and shape with point H but have a significantly different element composition. The phases at points K and M contain more iron and sodium atoms than the phases at point H. However, as the mass ratio of CaCO3 increases from 0.5 to 0.75 and 1, sodium volatilization decreases significantly. This indicates that the sodium in the aegirine-arfvedsonite syenite phase is more stable during high temperature roasting. When the mass ratio of CaCO3 increases from 0.25 to 1, the leaching rate of sodium also increases, which indicates that the large enrichment of sodium in aegirine-arfvedsonite syenite phase is conducive to its dissolution during NaOH leaching.
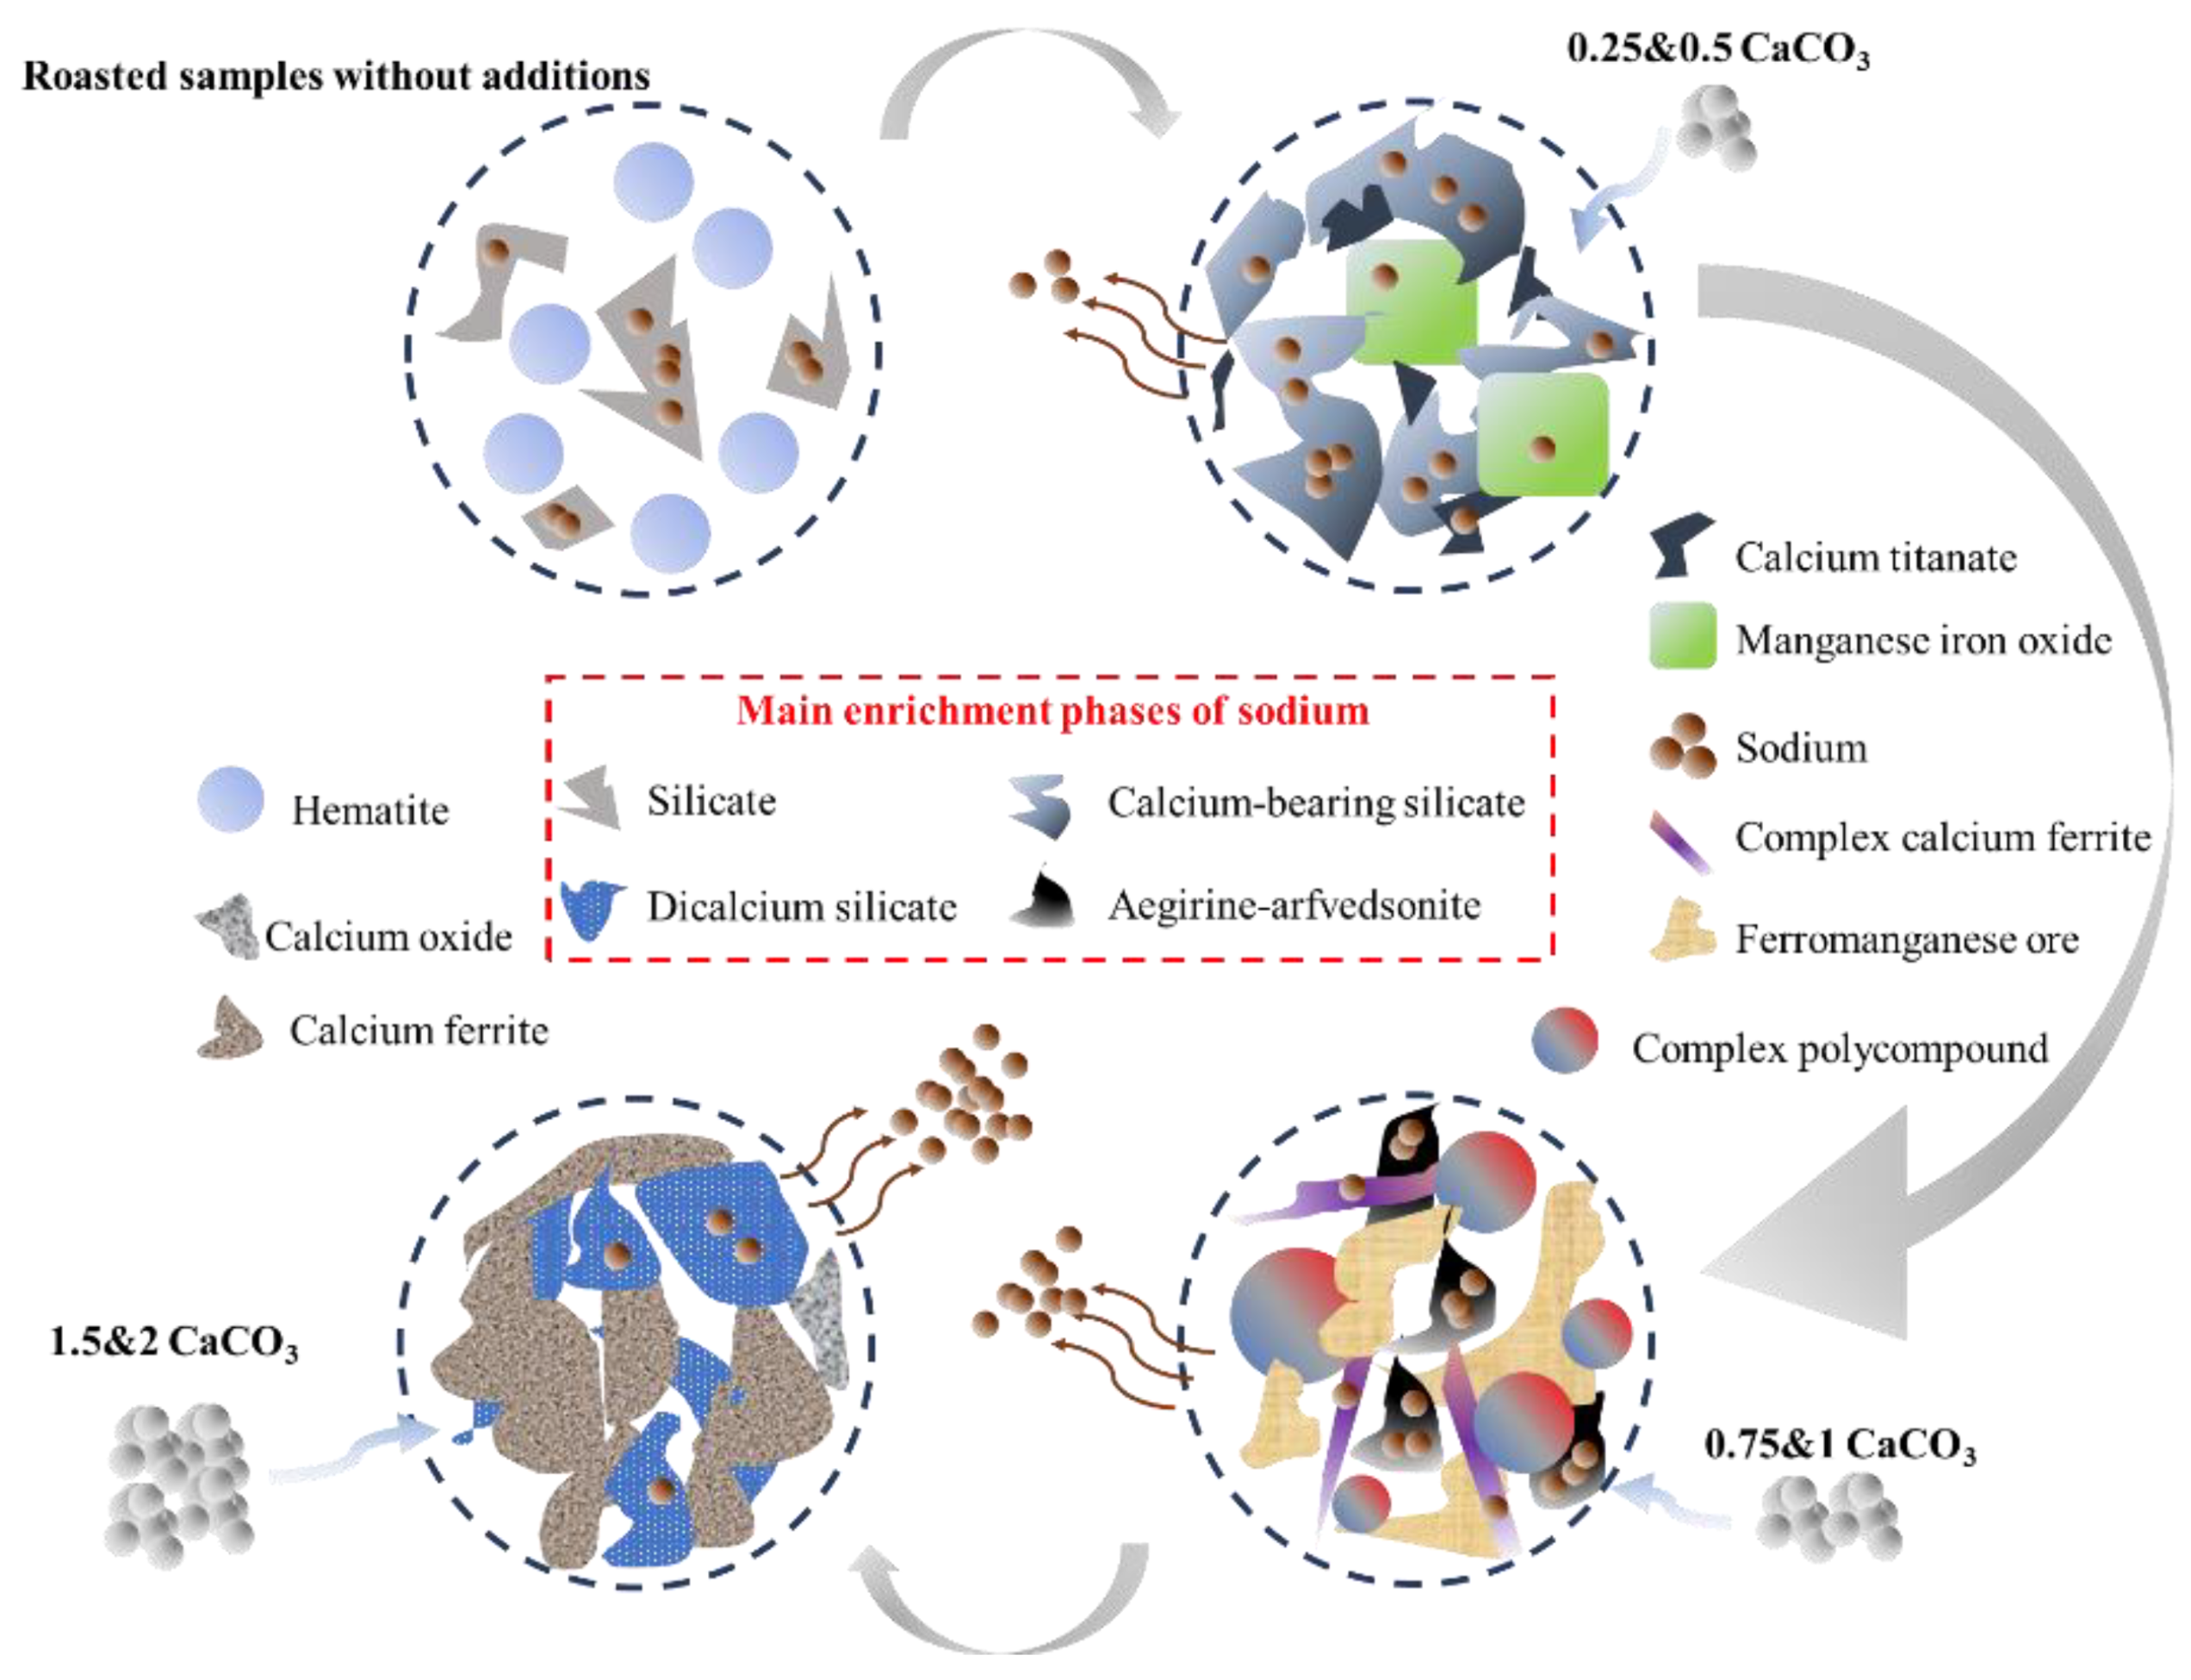
When the CaCO3 mass ratio is increased to 1.5, the SEM images reveal that the roasted products have two phases. The EDS results also show that the light area (point Q) is mostly a calcium ferrite phase with a lot of Ti, Mn, and Si atoms mixed in. The phase in dark aera (point R) can be classified as a dicalcium silicate phase because EDS results show that the atomic proportion of Ca, Si, and O in the phase is 96.30%, with calcium atoms accounting for roughly twice as much as silicon atoms. The SEM image also shows that the two phases are intertwined. However, as in the previous case, the XRD analysis results of roasted products do not match the SEM-EDS results. XRD patterns reveal three phases in the calcined products: CaTiO3, Ca2Fe1.2Mg0.4Si0.4O5, and CaO. The phase in point Q may overlap with the CaTiO3 diffraction peaks due to the phenomenon of lattice substitution. Because the EDS results at this point show that the sum of the atomic ratios of Ti, Fe, Mn, and Si is roughly equal to that of Ca, which can be attributed to the above elements replacing part of the Ti atoms in the CaTiO3 lattices. The majority of the sodium element in the product is concentrated in the dicalcium silicate phase region. When the CaCO3 mass ratio is increased to 2, the XRD pattern of roasted products shows three types of phase diffraction peaks, and the SEM-EDS results show three different gray and element composition regions in the roasted products. Points S and Q have similar gray levels and element compositions, but point S has a higher Fe content. By analogy with the composition of point R, the phase of point T can be determined to be dicalcium silicate. The phase region (point U) corresponding to the residual calcium oxide can be determined using the SEM-EDS results. Combined with the previous results of sodium removal rate during NaOH leaching as the mass ratio of CaCO3 is more than 1.5, the dicalcium silicate phase containing a large amount of sodium has poor solubility in the NaOH system. Figure 11 shows the reaction mechanism diagram.
3.4. Optimalization of Total Removal of Sodium in the Whole Process
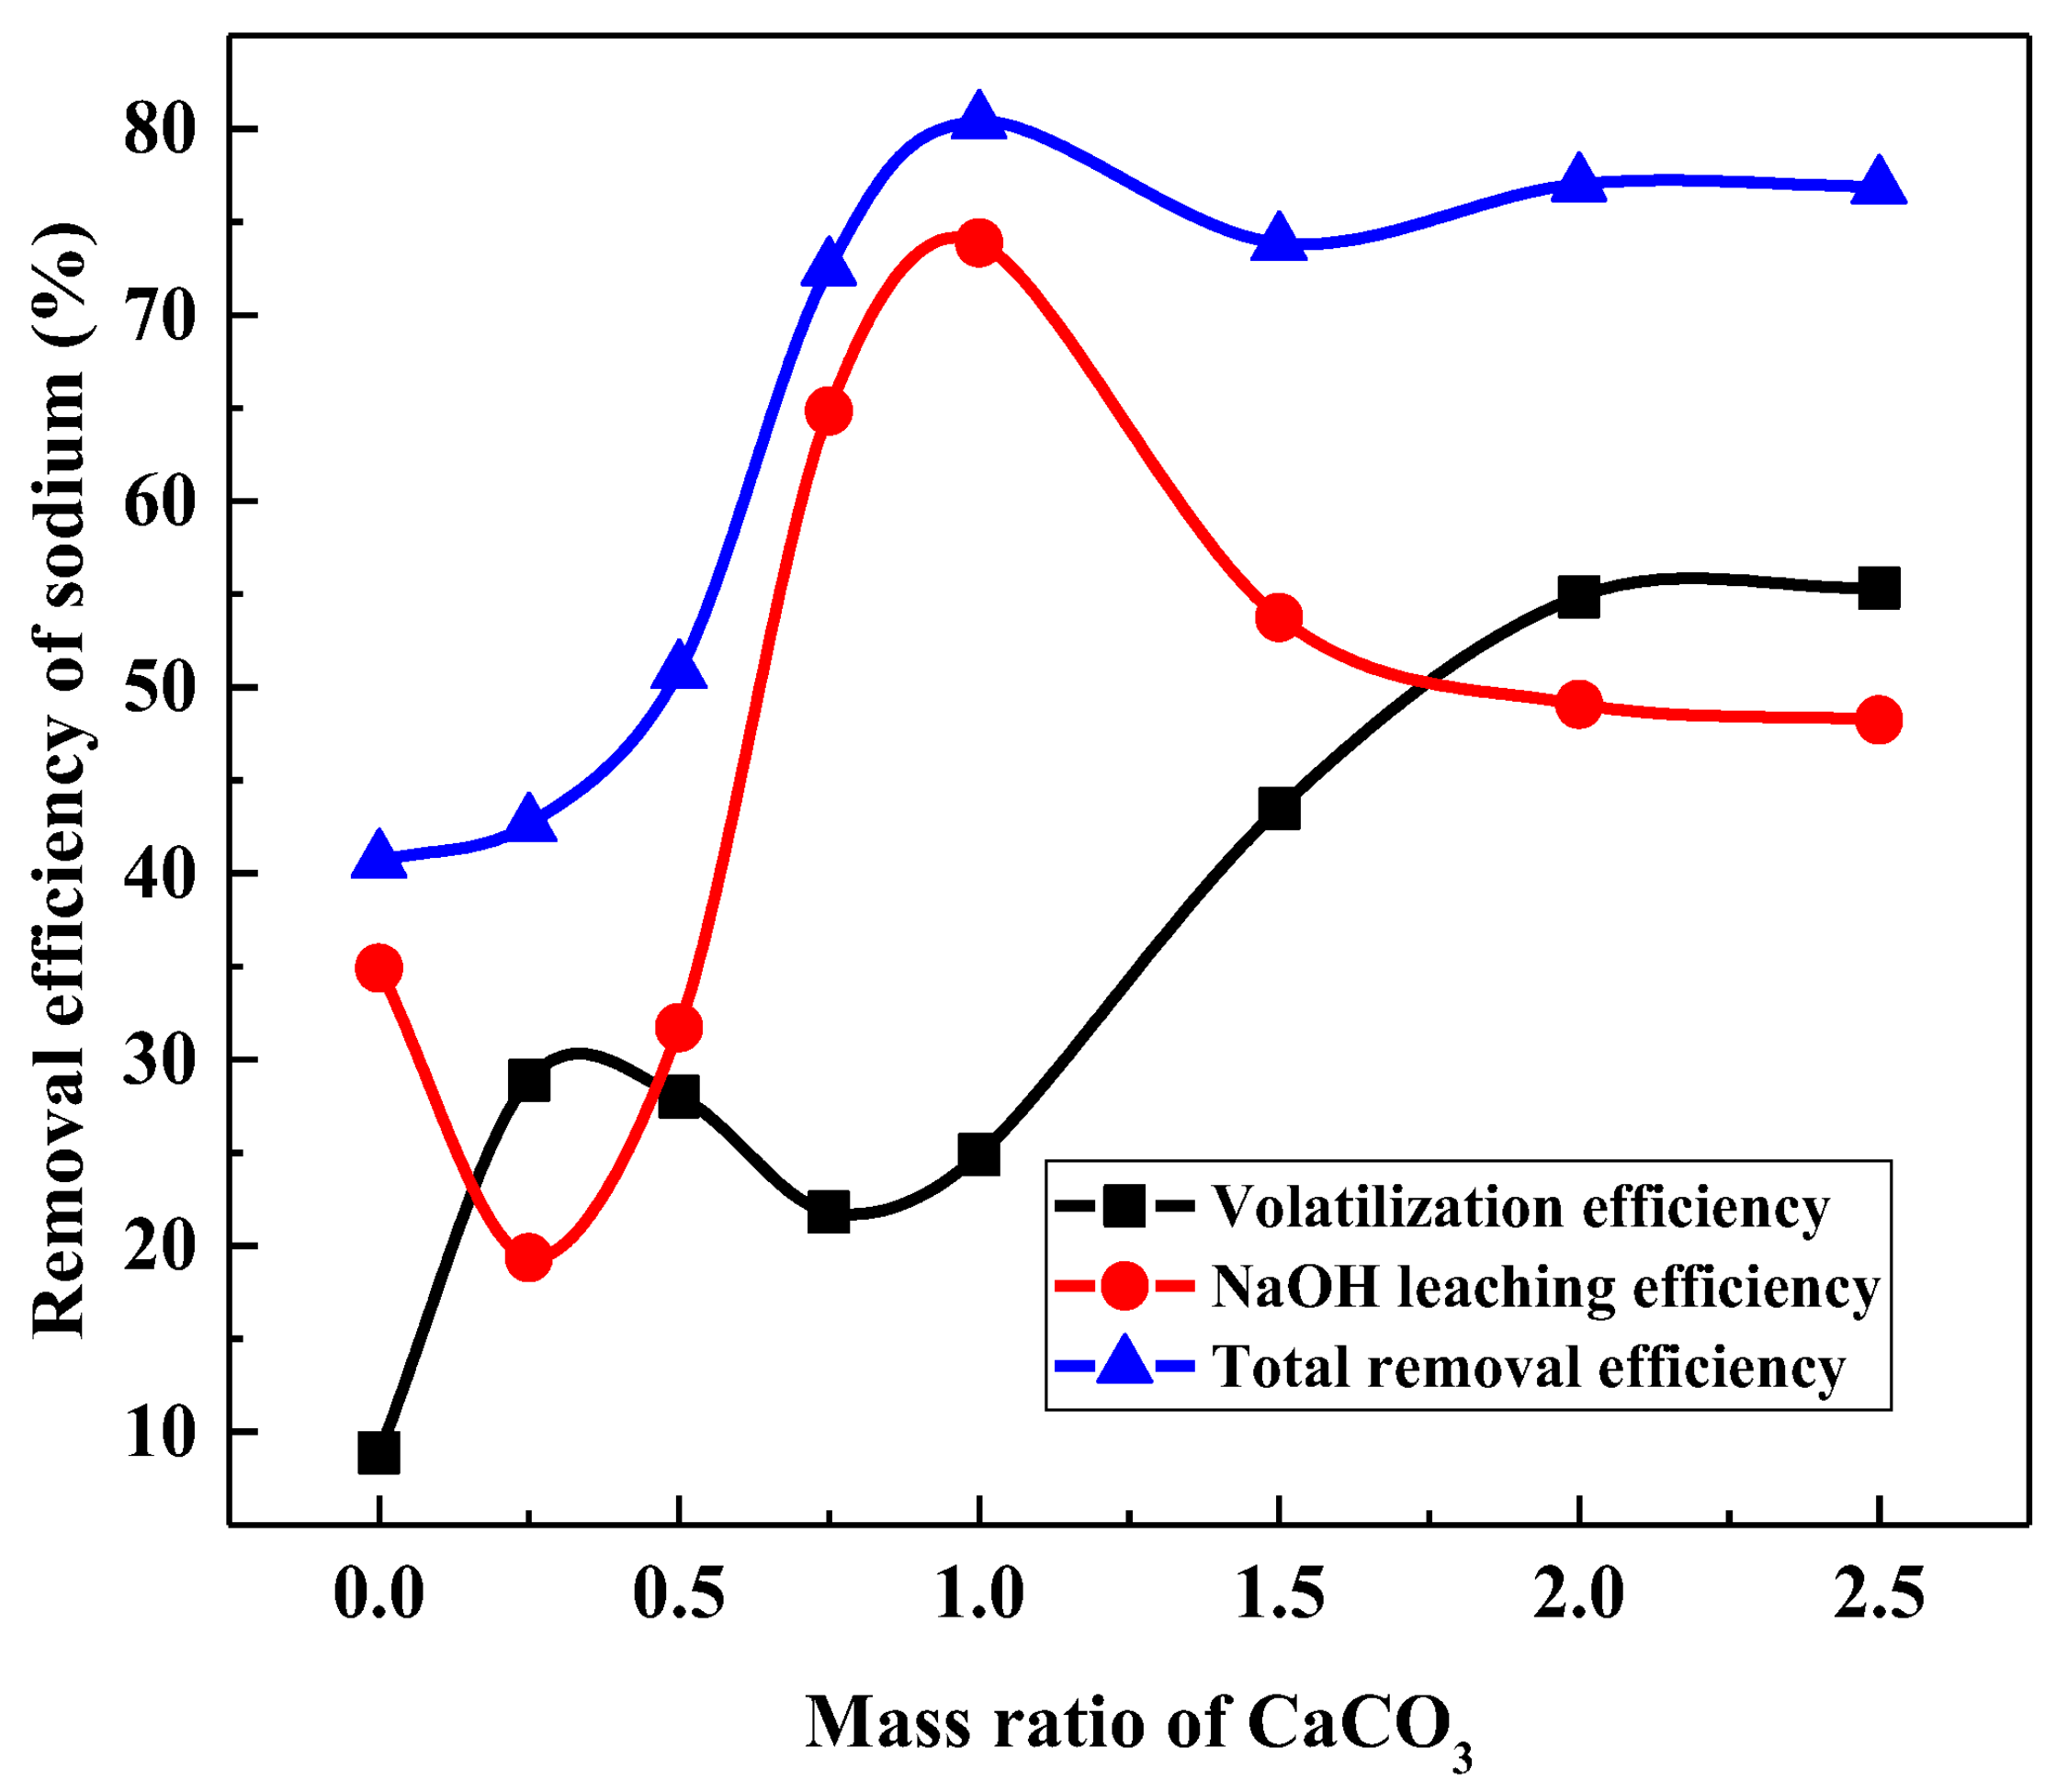
Figure 12 shows the effect of NaOH (5 wt.%) leaching on further removal of sodium in calcification roasted products at different mass ratios of CaCO3. The roasting temperature was 1250 °C for 120 min. The leaching experiment fixed the temperature at 95 °C for 120 min and a 300 r/min stirring speed and the liquid–solid ratio was 10:1. For comparison, the volatilization efficiency, leaching efficiency and total removal efficiency are shown together in the following graph.
When the CaCO3 mass ratio was 0, the leaching rate and total removal rate were 34.90% and 40.67%, respectively. When the CaCO3 ratio was increased to 0.25, the leaching rate decreased to 19.36%, but the total removal rate increased slightly to 42.63%, because the increase in volatility compensated for the decrease in the leaching rate. It can be concluded that the sodium-containing phase in roasted products with a mass ratio of 0.25 has better dissolution behavior in a 5% NaOH solution than the roasted products without additives. When the mass ratio was increased from 0.25 to 1, the leaching rate increased to 73.87% and the total removal rate increased to 80.37%. In conjunction with the previous phase analysis of roasted products under different CaCO3 mass ratios, increasing the dosage of calcification agent from 0.25 to 1 can improve sodium enrichment in the aegirine-arfvedsonite syenite phase. We can conclude that this phase is easily soluble in NaOH solution and difficult to decompose at high temperatures. This is why the trends of the volatilization rate and leaching rate in this range are inverse. When the mass ratio of CaCO3 was increased to 2.5, the leaching rate decreased from 73.87% to 48.23%, while the total removal rate did not decrease significantly, only from 80.37% to 76.87%, due to the increase in volatilization rate. According to the results of the above analysis, the maximum total removal rate is 80.37% when the CaCO3 mass ratio is 1.
3.5. Final Products
Elemental composition analyses were performed on the products after alkali leaching with different mass ratios of CaCO3 in the roasting process (1 and 2), and the results are shown in Table 4.
The elemental compositions of the final products with different mass ratios of CaCO3 in Table 4 reveals that it contains less than 0.60% sodium and a high proportion of iron and calcium, indicating that it can be used as an ideal pre-iron raw material to enter the sintering process.
4. Conclusions
The sodium removal behavior from vanadium tailings was investigated in calcification roasting and NaOH leaching, and the mechanism by which calcification roasting promotes sodium dissolution during NaOH leaching was explained. With the increasing dosage of the calcifying agent, the main sodium enrichment phases in roasting products were the silicate, calcium-bearing silicate, dicalcium silicate and aegirine-arfvedsonite, respectively. The total sodium removal efficiency was 80.73% when the mass ratio of CaCO3 was 1, the roasting temperature was set to 1250 °C for 120 min, the NaOH leaching temperature was set to 95 °C for 120 min with a stirring speed of 300 r/min, and the liquid–solid ratio was 10:1. The treated vanadium tailings can be recycled into the ironmaking process, converting solid wastes into ‘treasures’, thereby minimizing environmental risk and easing enterprise burden. The technical route described in this paper is depicted in Figure 13. Step 1: mix the vanadium tailings and calcium carbonate and press them into pellets. Step 2: calcine the pellets at high temperatures. Step 3: crushed roasted pellets are leached in NaOH solution, and the leached products (treated tailings) enter the blast furnace via the pellet or sintering process.
Author Contributions
Funding acquisition, X.W. and Z.A.; Writing—original draft, C.W.; Writing—review & editing, Y.G., S.W., F.C. and L.Y. All authors have read and agreed to the published version of the manuscript.
Funding
This study was funded by Chengde Jianlong Special Steel Co., Ltd.
Conflicts of Interest
The authors declare no conflict of interest.
References
- Liu, S.; He, X.; Wang, Y.; Wang, L. Cleaner and effective extraction and separation of iron from vanadium slag by carbothermic reduction-chlorination-molten salt electrolysis. J. Clean. Prod. 2020, 284, 124674. [Google Scholar] [CrossRef]
- Zheng, F.Q.; Liu, X.; Guo, Y.F.; Wang, S.; Chen, F.; Yang, L.Z.; Jiang, T.; Qiu, G.Z. Transformation and separation of metallic iron in reduced ilmenite during corrosion process. J. Iron Steel Res. Int. 2020, 27, 1372–1381. [Google Scholar] [CrossRef]
- Manuel, A.; Nadiia, I.G.; Giuseppe, S.; Eugenio, G.; Craig, C.M.; Annette, R.; Debbie, C.C. Polyoxidovanadates’ interactions with proteins: An overview. Coord. Chem. Rev. 2022, 45, 214344. [Google Scholar]
- Manuel, A.; Nadiia, I.G.; Giuseppe, S.; Eugenio, G.; Annette, R.; Debbie, C.C. Polyoxovanadates with emerging biomedical activities. Coord. Chem. Rev. 2021, 447, 214143. [Google Scholar]
- Agnieszka, Ś.; Ewa, W.; Dorota, G. Wild animals in studies on vanadium bioaccumulation—Potential animal models of environmental vanadium contamination: A comprehensive overview with a Polish accent. Sci. Total Environ. 2021, 785, 147205. [Google Scholar]
- Yang, J.; Tang, Y.; Yang, K.; Rouff, A.A.; Elzinga, E.J.; Huang, J. Leaching characteristics of vanadium in mine tailings and soils near a vanadium titanomagnetite mining site. J. Hazard. Mater. 2014, 264, 498–504. [Google Scholar] [CrossRef]
- Qu, S.; Guo, Y.; Ma, Z.; Chen, W.; Liu, J.; Liu, G.; Wang, Y.; Xu, M. Implications of China’s foreign waste ban on the global circular economy. Resour. Conserv. Recycl. 2019, 144, 252–255. [Google Scholar] [CrossRef]
- Deng, R.; Xiao, H.; Xie, Z.; Liu, Z.; Yu, Q.; Chen, G.; Tao, C. A novel method for extracting vanadium by low temperature sodium roasting from converter vanadium slag. Chin. J. Chem. Eng. 2020, 28, 2208–2213. [Google Scholar] [CrossRef]
- Wu, G.; Pan, P.; Fan, H.; Wang, R.; Xu, Z. A review on the research status and development trend of vanadium extraction from vanadium slag. Jiangxi Metal. 2020, 40, 19–27. [Google Scholar]
- Xiang, J.Y.; Huang, Q.Y.; Lv, W.; Pei, G.S.; Lv, X.W.; Bai, C.G. Recovery of tailings from the vanadium extraction process by carbothermic reduction method: Thermodynamic, experimental and hazardous potential assessment. J. Hazard. Mater. 2018, 357, 128–137. [Google Scholar] [CrossRef]
- Yang, H.F.; Jing, L.L.; Zhang, B.G. Recovery of iron from vanadium tailings with coal-based direct reduction followed by magnetic separation. J. Hazard. Mater. 2021, 185, 1405–1411. [Google Scholar] [CrossRef] [PubMed]
- Xiu, D.P.; Wang, Q.C.; Yang, Y.G.; Gu, S.L.; Sun, Q.Z. Techniques of making vanadium and titanium black porcelain and its application in modern industry. Chin. Ceram. 2008, 44, 41–43. [Google Scholar]
- Yang, S.L.; Ma, L.; Liu, J.F.; Lei, Z.J. Titanium, T. Prospect of Researching and Developing Vanadium Functional Materials Using Vanadium Resources in Panxi Area. Iron Steel Vanadium Titan. 2016, 37, 84–91. [Google Scholar]
- Li, L.J.; Chen, D.H.; Bai, R.G.; Zheng, S.L.; Zhang, Y. Leaching of vanadium from vanadium-containing residue by NaOH sub-molten salt. Chin. J. Process Eng. 2011, 11, 747–754. [Google Scholar]
- Fan, G.; Wei, C.; Ge, W.H.; Li, M.T.; Deng, Z.G.; Li, C.X. Vanadium Recovery from Extracted Vanadium Residue by Atmospheric Pressure Acid Leaching. Nonferrous Met. 2010, 62, 65–68. [Google Scholar]
- Wang, Q.; Jiang, M.F.; Wang, M.; Zhang, J. Leaching and extraction of vanadium and chromium from vanadium tailings. Nonferrous Met. 2016, 9, 13–16. [Google Scholar]
- Mazurek, K. Recovery of vanadium, potassium and iron from a spent vanadium catalyst by oxalic acid solution leaching, precipitation and ion exchange processes. Hydrometallurgy 2013, 134, 26–31. [Google Scholar] [CrossRef]
- Tian, L.; Xu, Z.; Chen, L.; Liu, Y.; Zhang, T. Effect of microwave heating on the pressure leaching of vanadium from converter slag. Hydrometallurgy 2019, 184, 45–54. [Google Scholar] [CrossRef]
- Zhang, G.; Zhang, T.; Lü, G.; Zhang, Y.; Liu, Y.; Xie, G. Extraction of vanadium from LD converter slag by pressure leaching process with titanium white waste acid. Rare Met. Mater. Eng. 2015, 44, 1894–1898. [Google Scholar]
- Du, W.; Chen, H. Resource utilization of vanadium tailings back into the steel process. North V-Ti-Bear. 2011, 1, 22–24. [Google Scholar]
- Wang, X.; Xiang, J.W.; Ling, J.W.; Huang, Q.Y.; Lv, X.W. Comprehensive utilization of vanadium extraction tailings: A brief review. Miner. Met. Mater. Soc. 2020, 327–334. [Google Scholar]
- Bale, C.W.; Bélisle, E.; Chartrand, P.; Decterov, S.A.; Eriksson, G.; Hack, K.; Jung, I.H.; Kang, Y.B.; Melançon, J.; Pelton, A.D.; et al. FactSage thermochemical software and databases—Recent developments. Calphad 2009, 33, 295–311. [Google Scholar] [CrossRef]
- Xu, Z.; Guan, Q.; Zhao, Y.; Jiang, Q.; He, Z. Spheroidization of eutectic crystals in wear-resistant manganese steel. ACTA Metall. Sci. 1995, 31, 518–522. [Google Scholar]
- Luo, G.; Wu, S.; Zhang, G.; Wang, Y. Effects of Compound Silicate Gangue on Formation of Complex Calcium Ferrite During Sintering Process. J. Iron Steel Res. 2013, 3, 21–26. [Google Scholar] [CrossRef]
Figure 1.
XRD pattern of vanadium tailings.

Figure 2.
SEM images of the cross sections through vanadium tailings (crosses with numbers).

Figure 3.
Calculated phase distributions at various mass ratios of CaCO3.

Figure 4.
Calculated phase distributions at various reaction temperatures.

Figure 5.
Effect of calcification roasting on NaOH leaching of sodium.

Figure 6.
Effect of mass ratio of CaCO3 on sodium volatilization.

Figure 7.
Effect of roasting temperature on sodium volatilization.

Figure 8.
Effect of roasting time on sodium volatilization.

Figure 9.
XRD patterns of the samples roasted at 1250 °C for 120 min with different mass ratio of CaCO3. (1—Fe2O3, 2—Mn0.43Fe2.57O4, 3—CaTiO3, 4—Ca2SiO4, 5—Ca2Fe1.2Mg0.4Si0.4O5, and 6—CaO).
Figure 9.
XRD patterns of the samples roasted at 1250 °C for 120 min with different mass ratio of CaCO3. (1—Fe2O3, 2—Mn0.43Fe2.57O4, 3—CaTiO3, 4—Ca2SiO4, 5—Ca2Fe1.2Mg0.4Si0.4O5, and 6—CaO).

Figure 10.
SEM images of the cross sections through roasted products with different ratios of CaCO3 (crosses with letters).
Figure 10.
SEM images of the cross sections through roasted products with different ratios of CaCO3 (crosses with letters).

Figure 11.
Calcification roasting reaction mechanism diagram.

Figure 12.
Removal behavior of sodium with different mass ratios of CaCO3.

Figure 13.
The technical route of removing alkali from vanadium tailings.


Table 1.
Chemical composition of the vanadium tailings.
| Component | Na2O | K2O | Total Fe | SiO2 | TiO2 | MnO | Cr2O3 | Al2O3 | CaO | MgO | V2O5 | Cl |
|---|---|---|---|---|---|---|---|---|---|---|---|---|
| wt.% | 4.45 | 0.02 | 32.32 | 13.64 | 11.92 | 6.33 | 4.18 | 2.78 | 1.88 | 1.69 | 1.34 | 0.47 |
Table 2.
Chemical elemental analysis of the raw materials (by EDS).
| Point/ Area | Atom/mol% | ||||||||
|---|---|---|---|---|---|---|---|---|---|
| O | Ti | Ca | Cr | Mn | Fe | Al | Si | Na | |
| 1 | 46.71 | 8.33 | - | 7.9 | 2.84 | 16.6 | - | - | - |
| 2 | 56.31 | - | 2.53 | - | 3.1 | 9.92 | 2.71 | 21.84 | - |
| 3 | 50.96 | - | - | - | 1.57 | 47.07 | - | - | - |
| 4 | 53.21 | 1.63 | 2.29 | - | - | 6.25 | 3.37 | 20.07 | 9.45 |
| 5 | 53.53 | 2.72 | - | 5.73 | - | 33.68 | 1.25 | - | - |
| 6 | 57.91 | 1.14 | 4.42 | - | - | 4.90 | 5.24 | 23.17 | 2.14 |
| 7 | 55.96 | - | - | - | 3.08 | 19.31 | - | 17.83 | - |
| 8 | 61.28 | 9.98 | - | 4.85 | - | 16.19 | - | 1.00 | 1.77 |
| 9 | 63.28 | - | - | - | 2.95 | 7.29 | - | 18.86 | - |
| 10 | 65.20 | - | - | - | - | 3.07 | 5.20 | 19.17 | 4.59 |
| 11 | 63.17 | 1.19 | 1.27 | - | - | 2.67 | 4.81 | 12.58 | 10.30 |
| 12 | 61.70 | 1.16 | 4.88 | - | - | 4.37 | - | 18.69 | 3.76 |
| 13 | 65.59 | 2.89 | - | 2.15 | 2.86 | 25.10 | - | - | - |
| 14 | - | - | - | - | - | 100 | - | - | - |
| 15 | 59.51 | - | - | - | - | 38.50 | - | - | - |
Table 3.
Chemical elemental analysis of the roasted products (by EDS).
| Point/ Area | Atoms (mol%) | Main Phase | ||||||||
|---|---|---|---|---|---|---|---|---|---|---|
| O | Ti | Ca | Cr | Mn | Fe | Al | Si | Na | ||
| A | 53.74 | 3.30 | 2.45 | - | 1.12 | 5.61 | 2.45 | 22.15 | 6.95 | Silicate |
| B | 56.98 | 4.26 | - | 2.93 | 2.18 | 32.59 | - | - | - | Hematite |
| C | 58.47 | 0.46 | 0.62 | 4.08 | 6.95 | 24.47 | 0.66 | - | - | Manganese iron oxide |
| D | 56.59 | 1.45 | 9.80 | - | 0.60 | 4.74 | 1.98 | 16.06 | 7.43 | Calcium-bearing silicate |
| E | 62.80 | 17.81 | 16.70 | - | 0.39 | 1.02 | - | 0.45 | 0.83 | Calcium titanate |
| F | 57.26 | - | 1.24 | 4.06 | 5.49 | 26.51 | 0.68 | - | 0.98 | Manganese iron oxide |
| G | 62.83 | 17.24 | 16.60 | - | 0.23 | 1.12 | - | 0.52 | 1.46 | Calcium titanate |
| H | 58.64 | 0.58 | 13.70 | - | - | 4.34 | 2.21 | 13.05 | 6.45 | Calcium-bearing silicate |
| I | 54.20 | - | 2.01 | 3.31 | 5.68 | 27.25 | 1.21 | - | - | Ferromanganese ore |
| J | 58.33 | 7.49 | 20.12 | 0.78 | 1.44 | 8.27 | - | 3.57 | - | Complex polycompound |
| K | 58.33 | 0.48 | 4.59 | - | - | 9.75 | 5.84 | 9.32 | 11.69 | Aegirine-arfvedsonite syenite |
| L | 63.10 | 1.34 | 8.98 | 0.62 | 1.79 | 19.75 | 1.13 | 1.51 | 1.07 | Complex calcium ferrite |
| M | 54.14 | 0.23 | 4.71 | 0.70 | - | 14.18 | 5.31 | 5.54 | 15.19 | Aegirine-arfvedsonite |
| N | 57.02 | 4.43 | 20.99 | 0.40 | 2.20 | 10.47 | 0.54 | 3.95 | - | Complex polycompound |
| O | 54.96 | 0.22 | 1.92 | 1.77 | 3.93 | 24.57 | 1.46 | - | - | Ferromanganese ore |
| P | 54.86 | - | 10.76 | 0.40 | 1.63 | 29.70 | 1.17 | - | 1.48 | Complex calcium ferrite |
| Q | 61.59 | 4.98 | 19.06 | - | 2.26 | 9.24 | 0.41 | 2.46 | - | Calcium ferrite |
| R | 57.53 | - | 25.87 | - | - | - | - | 12.90 | 3.23 | Dicalcium silicate |
| S | 60.27 | 1.31 | 19.04 | 0.29 | 0.85 | 15.49 | 0.36 | 0.75 | 1.21 | Calcium ferrite |
| T | 59.68 | 0.54 | 22.94 | 0.28 | - | - | - | 11.56 | 2.31 | Dicalcium silicate |
| U | 69.34 | - | 27.22 | 0.87 | 0.41 | - | - | 1.10 | 0.60 | Calcium oxide |
Table 4.
Chemical composition of the final products (wt.%).
| CaCO3 Ratio | Na2O | Fe2O3 | SiO2 | TiO2 | MnO | Cr2O3 | Al2O3 | CaO | MgO | V2O5 |
|---|---|---|---|---|---|---|---|---|---|---|
| 1 | 0.60 | 32.78 | 9.15 | 7.47 | 4.13 | 1.36 | 1.31 | 35.28 | 1.35 | 0.81 |
| 2 | 0.52 | 22.18 | 6.87 | 4.94 | 2.72 | 1.09 | 2.04 | 44.25 | 0.88 | 0.97 |
Publisher’s Note: MDPI stays neutral with regard to jurisdictional claims in published maps and institutional affiliations. |
© 2022 by the authors. Licensee MDPI, Basel, Switzerland. This article is an open access article distributed under the terms and conditions of the Creative Commons Attribution (CC BY) license (https://creativecommons.org/licenses/by/4.0/).
Share and Cite
MDPI and ACS Style
Guo, Y.; Wang, C.; Wang, S.; Chen, F.; Wang, X.; An, Z.; Yang, L. Research on the Removal of Sodium from Vanadium Tailings by Calcification Roasting and NaOH Leaching. Sustainability 2022, 14, 9051. https://doi.org/10.3390/su14159051
AMA Style
Guo Y, Wang C, Wang S, Chen F, Wang X, An Z, Yang L. Research on the Removal of Sodium from Vanadium Tailings by Calcification Roasting and NaOH Leaching. Sustainability. 2022; 14(15):9051. https://doi.org/10.3390/su14159051
Chicago/Turabian StyleGuo, Yufeng, Chao Wang, Shuai Wang, Feng Chen, Xueyuan Wang, Zhiwei An, and Lingzhi Yang. 2022. "Research on the Removal of Sodium from Vanadium Tailings by Calcification Roasting and NaOH Leaching" Sustainability 14, no. 15: 9051. https://doi.org/10.3390/su14159051
Note that from the first issue of 2016, this journal uses article numbers instead of page numbers. See further details here.