
Managing Consumers and Employees through Digital Services

1
Department for Project Management, Institute for Artificial Intelligence Research and Development of Serbia, Fruškogorska 1, 21000 Novi Sad, Serbia
2
Department for Finance, Banking and Insurance, Faculty of Economics Subotica, Segedinski put 9-11, 24000 Subotica, Serbia
*
Author to whom correspondence should be addressed.
Sustainability 2022, 14(14), 8824; https://doi.org/10.3390/su14148824
Submission received: 30 May 2022
/
Revised: 13 July 2022
/
Accepted: 15 July 2022
/
Published: 19 July 2022
(This article belongs to the Special Issue Advances in Sustainable Psychology and Behavior: Managing and Developing People within the External and Organizational Environment)
Abstract
:Creating sustainable and effective management strategies is one of the main goals for companies in today’s digitalized world. To achieve that, companies need to understand the social capital for which the strategies will be generated, especially regarding work output, which will in this case refer to digital services. Consequently, the goal of this paper was to point out the connection between social capital and digital services. Satisfaction, self-assessment, and self-esteem of online consumers and employees in digital sales were investigated, with regard to digital services. The survey involved 113 employees in digital sales and 275 online consumers. Results obtained through factor and regression analysis indicated the importance of managing consumers and employees (i.e., social capital) while they formed relationships with digital services. Online consumer satisfaction and self-esteem need to be taken into account when formulating strategies. For employees, self-esteem is the key component. Self-assessment from both sides proved to have no connection with digital services.
1. Introduction
The internet’s rapid evolution has altered how consumers find and buy products, as well as their preferences for various products and services [1]. It is influencing consumers’ and companies’ daily lives, and it is becoming a focal point for shopping, advertising, and business management activity. The concept of online shopping has revolutionized how consumers shop [2], so it is necessary to understand how online consumers behave [3]. This revolution brought about changes that resulted in the development of new consumer habits and behaviors in a digital environment [4], which are viewed as opportunities that online businesses must seize. This fact has significant implications for businesses, as there is a shift in power away from companies to consumers [5]. Companies have increasingly sought to understand the factors that influence online consumer decision-making while researching online consumer behavior. The influences of other internet users, reviews or opinions, personal experiences of close friends, and a variety of other factors and interactions that can occur in digital environments can all be used to determine the factors [6]. However, the most difficult challenge for online shopping is providing and maintaining positive customer attitudes toward the company. A digital-services-focused strategy is a critical success factor for surviving in a fiercely competitive online environment [7]. A company must provide superior service experiences to its customers in order for them to repurchase and remain loyal to the company. Many companies are entering the online market and attempting to capture market share and consumers, and every company intends to figure out the purchasing motivation of online consumers, particularly in terms of satisfaction, self-esteem, and self-assessment. The analysis of such content enables businesses to gain a better understanding of consumer communities that focus on the companies’ products and services. Following this line of research, businesses can identify consumer communities and, within these, find opinion leaders who can become influencers (and thus help businesses promote their products and services) [8], resulting in efficient management strategies that incorporate online consumer satisfaction, self-esteem, and self-assessment.
Consumer satisfaction is defined as the degree to which a consumer is satisfied with a product, service, or experience [9]. However, when observing and managing consumer behavior, many researchers place an emphasis on self-esteem and self-assessment. The concept of self-esteem was developed in 1965 and can be defined as a person’s positive evaluation of themself. People form their subsequent behavior by contrasting their self-worth and self-esteem. Although there are numerous definitions in the literature, an overall crossing of all can be emphasized: self-esteem is an individual’s positive and/or negative evaluation and feelings about themself [10]. Self-evaluation is described as the process of looking inward to assess elements of one’s identity. It is one of the motivations for self-evaluation, along with self-verification and self-enhancement. The self-assessment motive, according to researchers, drives people to seek information to confirm their uncertain self-concept rather than their certain self-concept, and self-assessment is used to boost the certainty of one’s own self-knowledge [11].
Digital transformation is currently a top priority in 87% of businesses, and 67% believe that their company must become significantly more digitalized to remain competitive [12]. Nevertheless, 70% of such initiatives fail [13]. These trends also apply to sales organizations [14]. The recent acceleration in digital technology use suggests that its slow pre-pandemic adoption was caused by individual-level resistance rather than technological impediments [14]. Our understanding of digital sales employees’ reactions to digital technology initiatives is still severely limited, and the literature demonstrates significant limitations. Although there is a large body of literature on technologies in sales, most studies focus on a single technology or application and use a technology adoption perspective. As a result, this body of literature fails to capture the essence of digitalization, particularly in the service sector, as a crucial change management process and the tremendous lack of certainty that salespeople must face during the transition. When compared to the adoption of a single technology, digital transformation is more comprehensive, involving deeper individual psychological reactions [15] and necessitating a diverse set of managerial actions to address these reactions. However, most studies to date have not investigated such psychological reactions and their impact on work outputs, specifically digital services.
Having in mind that the previous research has dealt with this topic to a limited extent, or not at all, this paper will focus on the observation and management of social capital in digital sales.
This involves observing the satisfaction, self-esteem, and self-assessment of both the consumer and the service provider (i.e., employees in digital stores). Therefore, the intention of this paper is to investigate social capital in digital sales, with the aim of considering the aspects of consumers and employees.
2. Literature Overview
The theoretical aspect of this research implies an extensive consideration of social capital regarding the perception of consumers and employees in digital sales. Because of the massive increase in internet connectivity, the digital diaspora has resulted in improved consumer interaction with the market via digital stores. Social capital is defined as the network of relationships that exist between people who live and work in a specific society, allowing that society to function effectively [16]. It entails interpersonal relationships, a shared sense of identity, a shared understanding, shared norms, shared values, trust, cooperation, and reciprocity [17]. Individual characteristics’ specificity and uniqueness can be incorporated into the concept of social capital. Knowledge of product and service perceptions, as well as consumer and employee satisfaction, self-esteem, and self-assessment, can be useful in the context of digital stores. As a result, it is necessary to determine whether perceptions and attitudes drive digital store transactions and can aid in the development of management strategies.
Employee and consumer satisfaction through online shopping has been one of the most researched areas in the fields of marketing and organizational behavior. Consumer satisfaction is a key concept in contemporary marketing theory and practice. The marketing concept focuses on providing satisfaction to consumers while generating profit. As a direct consequence, the quality of life should improve. As a matter of fact, consumer satisfaction is critical for meeting the diverse needs of consumers, businesses, and society. Recognizing this significance has resulted in an explosion of consumer satisfaction research over the last two decades, particularly among digital consumers. According to the researchers, consumer satisfaction is a powerful tool for businesses because it can be influenced by digital services. Consumer satisfaction is influenced by digital service factors such as customization, quality, interaction, problem-solving, and information quality [18,19,20]. According to the results of one study, the relationship between digital services and satisfaction is statistically important, positive, and strong [21]. A second study discovered that social presence via digital services affects consumer satisfaction, thereby creating a new relationship [22]. Online consumer satisfaction is strongly correlated with the quality of digital services, and some authors argue that digital services have a stronger link with satisfaction than the online purchase of products [18]. Despite a large body of literature on factors influencing consumer satisfaction, researchers have only recently begun to investigate the impact consumer satisfaction has on company products and services. According to research in that field, consumer satisfaction has an impact on business profitability and final output (products and services) [23]. It is premised on the idea that various factors shape and influence consumer satisfaction, which adversely impacts company output. From the standpoint of the company and its management, it is critical that the business can (directly or indirectly) impact (at least some) consumer satisfaction factors. Another study found that consumer satisfaction influences actual online service utilization [24]. The more the consumer is satisfied, the better the chance that they will use the online services again. In return, such usage has an impact on services being delivered, regarding quality, speed, etc. In the online banking industry, a study has depicted that both consumer satisfaction and dissatisfaction influence the number of banking products and services being offered [25]. To further investigate this type of relationship, we propose the following hypothesis:
Hypothesis 1 (H1).
Online consumer satisfaction impacts digital services.
For the past 20 years, marketing research has been guided by the “information-processing theory,” which regards the consumer as a decision-maker who searches for, participates in, recognizes, and analyzes data to make a brand choice [26]. Afterward, evidence emerged indicating that decisions can be influenced by affective-emotional factors. This presupposes that, particularly for certain types of products and services, decisions are made based on desire, fantasy, and reactions to an emotional climax rather than searching for and finding information. The climax is triggered by multisensory cues as well as emotional data. Emotion is thought to play a significant role in e-commerce. Because of that, researchers began incorporating consumer self-assessment in their studies to better understand factors influencing the decision-making process and the way it affects services and products being bought. The Self-Assessment Manikin (SAM) was one of the most frequently used self-assessment tools when measuring consumer emotions. The SAM consists of graphic characters arrayed on a continuous nine-point scale, and it has been used in numerous marketing and psychological studies since its development (e.g., [27,28]. Since then, consumer self-assessment has been widely adopted and researched in the field of medicine and pharmaceuticals to explore the impact it has on certain products and services (e.g., [29,30,31,32]). Self-assessment has also been used in tourism, digital supply chain, and consumer–product skill matching [33,34,35]. To further examine the relationship between self-assessment and services, we propose the following hypothesis:
Hypothesis 2 (H2).
Online consumer self-assessment impacts digital services.
Self-esteem has been widely studied to understand the way humans behave. While there have been many definitions given for self-esteem, we follow past work that views self-esteem as a global personality construct that measures the extent to which a person has a positive attitude about themself [36]. More precisely, we contextualize self-esteem as the extent to which one prizes, values, approves of, or likes oneself [37]. Due to peoples’ intrinsic desire to maintain a positive self-concept, a large amount of psychological research indicates that self-esteem is a fundamental psychological need [38].
Researchers discovered a link between self-esteem (particularly self-image) and purchasing behavior. According to their findings, purchasing and using services boosts self-confidence as well as self-esteem. According to the researchers, consumers tend to interrelate their identity and the prestige of brands to boost their self-esteem. Others stated that purchasing is a social activity that assists people in developing and managing their identities. Because of their high level of self-esteem, consumers may believe they are making the best choice among alternatives. Consumers may exhibit more leadership characteristics in this case [39,40,41]. The higher the self-esteem of consumers, the better the digital service employees provide. Some authors predict that when given the choice between an inferior and superior service, consumers with pessimistic self-views (i.e., those with low self-esteem) will prefer the inferior service because it confirms their self-views [42]. Consumers with high self-esteem, however, perceive their surroundings with optimism and believe they will be successful in life. Because having positive self-perceptions is pleasurable [43], and consumers with high self-esteem are confident that they can live up to those positive self-perceptions [44], self-enhancement has few costs but many benefits for these people. High-self-esteem consumers may be more inclined to choose superior over inferior services and products to satisfy the motive of seeing oneself in a desirable light (compared to low-self-esteem consumers). To further develop these findings and see the relationship self-esteem forms with digital services, we propose the following hypothesis:
Hypothesis 3 (H3).
Online consumer self-esteem impacts digital services.
Observing employees in digital stores leads to the conclusion that previous research was primarily focused on job satisfaction and engagement [45,46,47]. The extent to which employees are satisfied with their jobs, feel respected, and experience collaboration and trust are referred to as job satisfaction and engagement. Employees who are engaged will stay with the company longer and find better, more effective methods to add value to the organization [48]. Job satisfaction has always been a key variable of interest to all global managers. Today, almost all managers believe that job satisfaction should be given special attention because an employee’s satisfaction with their job motivates them to develop an attitude that is linked to organizational outcomes [49]. They believe that job performance and work outcomes are affected by employee satisfaction [50]. Employee satisfaction has been shown to have a positive and direct impact on intrapreneurship [51]. Intrapreneurship has an impact on work performance and engagement, as well as the work output in terms of products and services delivered to customers. Another study stated that job satisfaction has a significant impact on employee performance in private sector organizations [52]. According to this author, employees are willing to put more effort into their jobs, which will result in better services and products for customers and clients. According to other researchers, three aspects of job satisfaction influence job performance and final output [53]. Work, rewards, and supervision are thus the primary influential factors that can impact employees’ performance, productivity, and work engagement. Previous research has found that understanding the factors that affect the job satisfaction and work outcomes of virtual workers will become increasingly important as virtual work becomes a major organizational trend [54]. They also suggested that researchers broaden the number of variables that could be linked to virtual workers’ success. Several of their ideas included measuring family–life conflicts, investigating virtual work in various industry sectors, and examining how job types and the virtual worker’s role within the organization could influence work outcomes. A review of academic literature has shown that most research on virtual (online) work has been conducted at the organizational, technical, or social levels. The most important aspect of online work, the individual worker, has received little attention and must be considered when researching satisfaction, performance, work output, and so on [55]. For this matter, we propose the following hypothesis:
Hypothesis 4 (H4).
Employee satisfaction impacts digital services.
Self-assessment allows individuals to grow through personalized feedback via critical thinking. Self-observation, self-judgment, and self-reaction are the three steps in the self-assessment process [56]. These three self-assessment stages produce data that an individual can use to determine their competency. This is critical in determining areas of strength and weakness. When someone evaluates their work, they may feel more motivated and achieve more [57]. It has been demonstrated that the ability to observe one’s own performance improves self-assessment accuracy [58]. A simulation-style approach, for example, has been used in surgical skills training, where medical students tend to be poor self-assessors [59]. A simulation study with trainees concluded that the approach allowed students to self-improve more effectively through self-assessment of their skills [59]. Employee self-evaluation is critical in academic and practical frameworks. In the academic setting, self-assessment is mostly used to refer to teachers (e.g., [60,61,62,63]). Self-monitoring is a requirement for professional development in the practical environment. However, most workplaces only provide limited support for self-monitoring activities. Opportunities for self-assessment and self-reflection may be limited because defining individualized competency standards that match the workplace reality is difficult [64]. Since self-assessment of the employee is not very common in the workplace and literature, especially in the Republic of Serbia, we aim to bridge that gap and investigate the role self-assessment plays in digital services. Based on everything stated, we propose the following hypothesis:
Hypothesis 5 (H5).
Employee self-assessment impacts digital services.
Few previous studies (e.g., [65,66,67,68,69]) investigated the prospective effects of employee self-esteem on work-related outputs. Several researchers [69] tracked a large group of individuals from adolescence to adulthood and discovered that low self-esteem in adolescence predicted work-related problems more than ten years later. Correspondingly, researchers [68] discovered that a person’s self-esteem during their college years predicted job satisfaction, employment status, and salary 10 years later. Another study [67] found that self-esteem predicted job satisfaction, occupational status, and salary across multiple waves of data, whilst work-related outputs did not. According to research, self-esteem is a predictor of employee attitude and its relationship with work engagement [70,71]. In a recent study on the relationship between self-esteem and work engagement, researchers discovered that self-esteem had a positive impact on work engagement [72]. Job characteristics such as compensation, reward, and recognition raise social status, leading to greater self-esteem and, as a result, higher work engagement [73,74]. Researchers also noted that self-esteem helps to develop work engagement [75]. Further research is needed to examine the prospective link between self-esteem and work outputs such as digital services, as self-esteem impacts work engagement and should therefore impact work outputs. Based on everything stated above, we propose the following hypothesis:
Hypothesis 6 (H6).
Employee self-esteem impacts digital services.
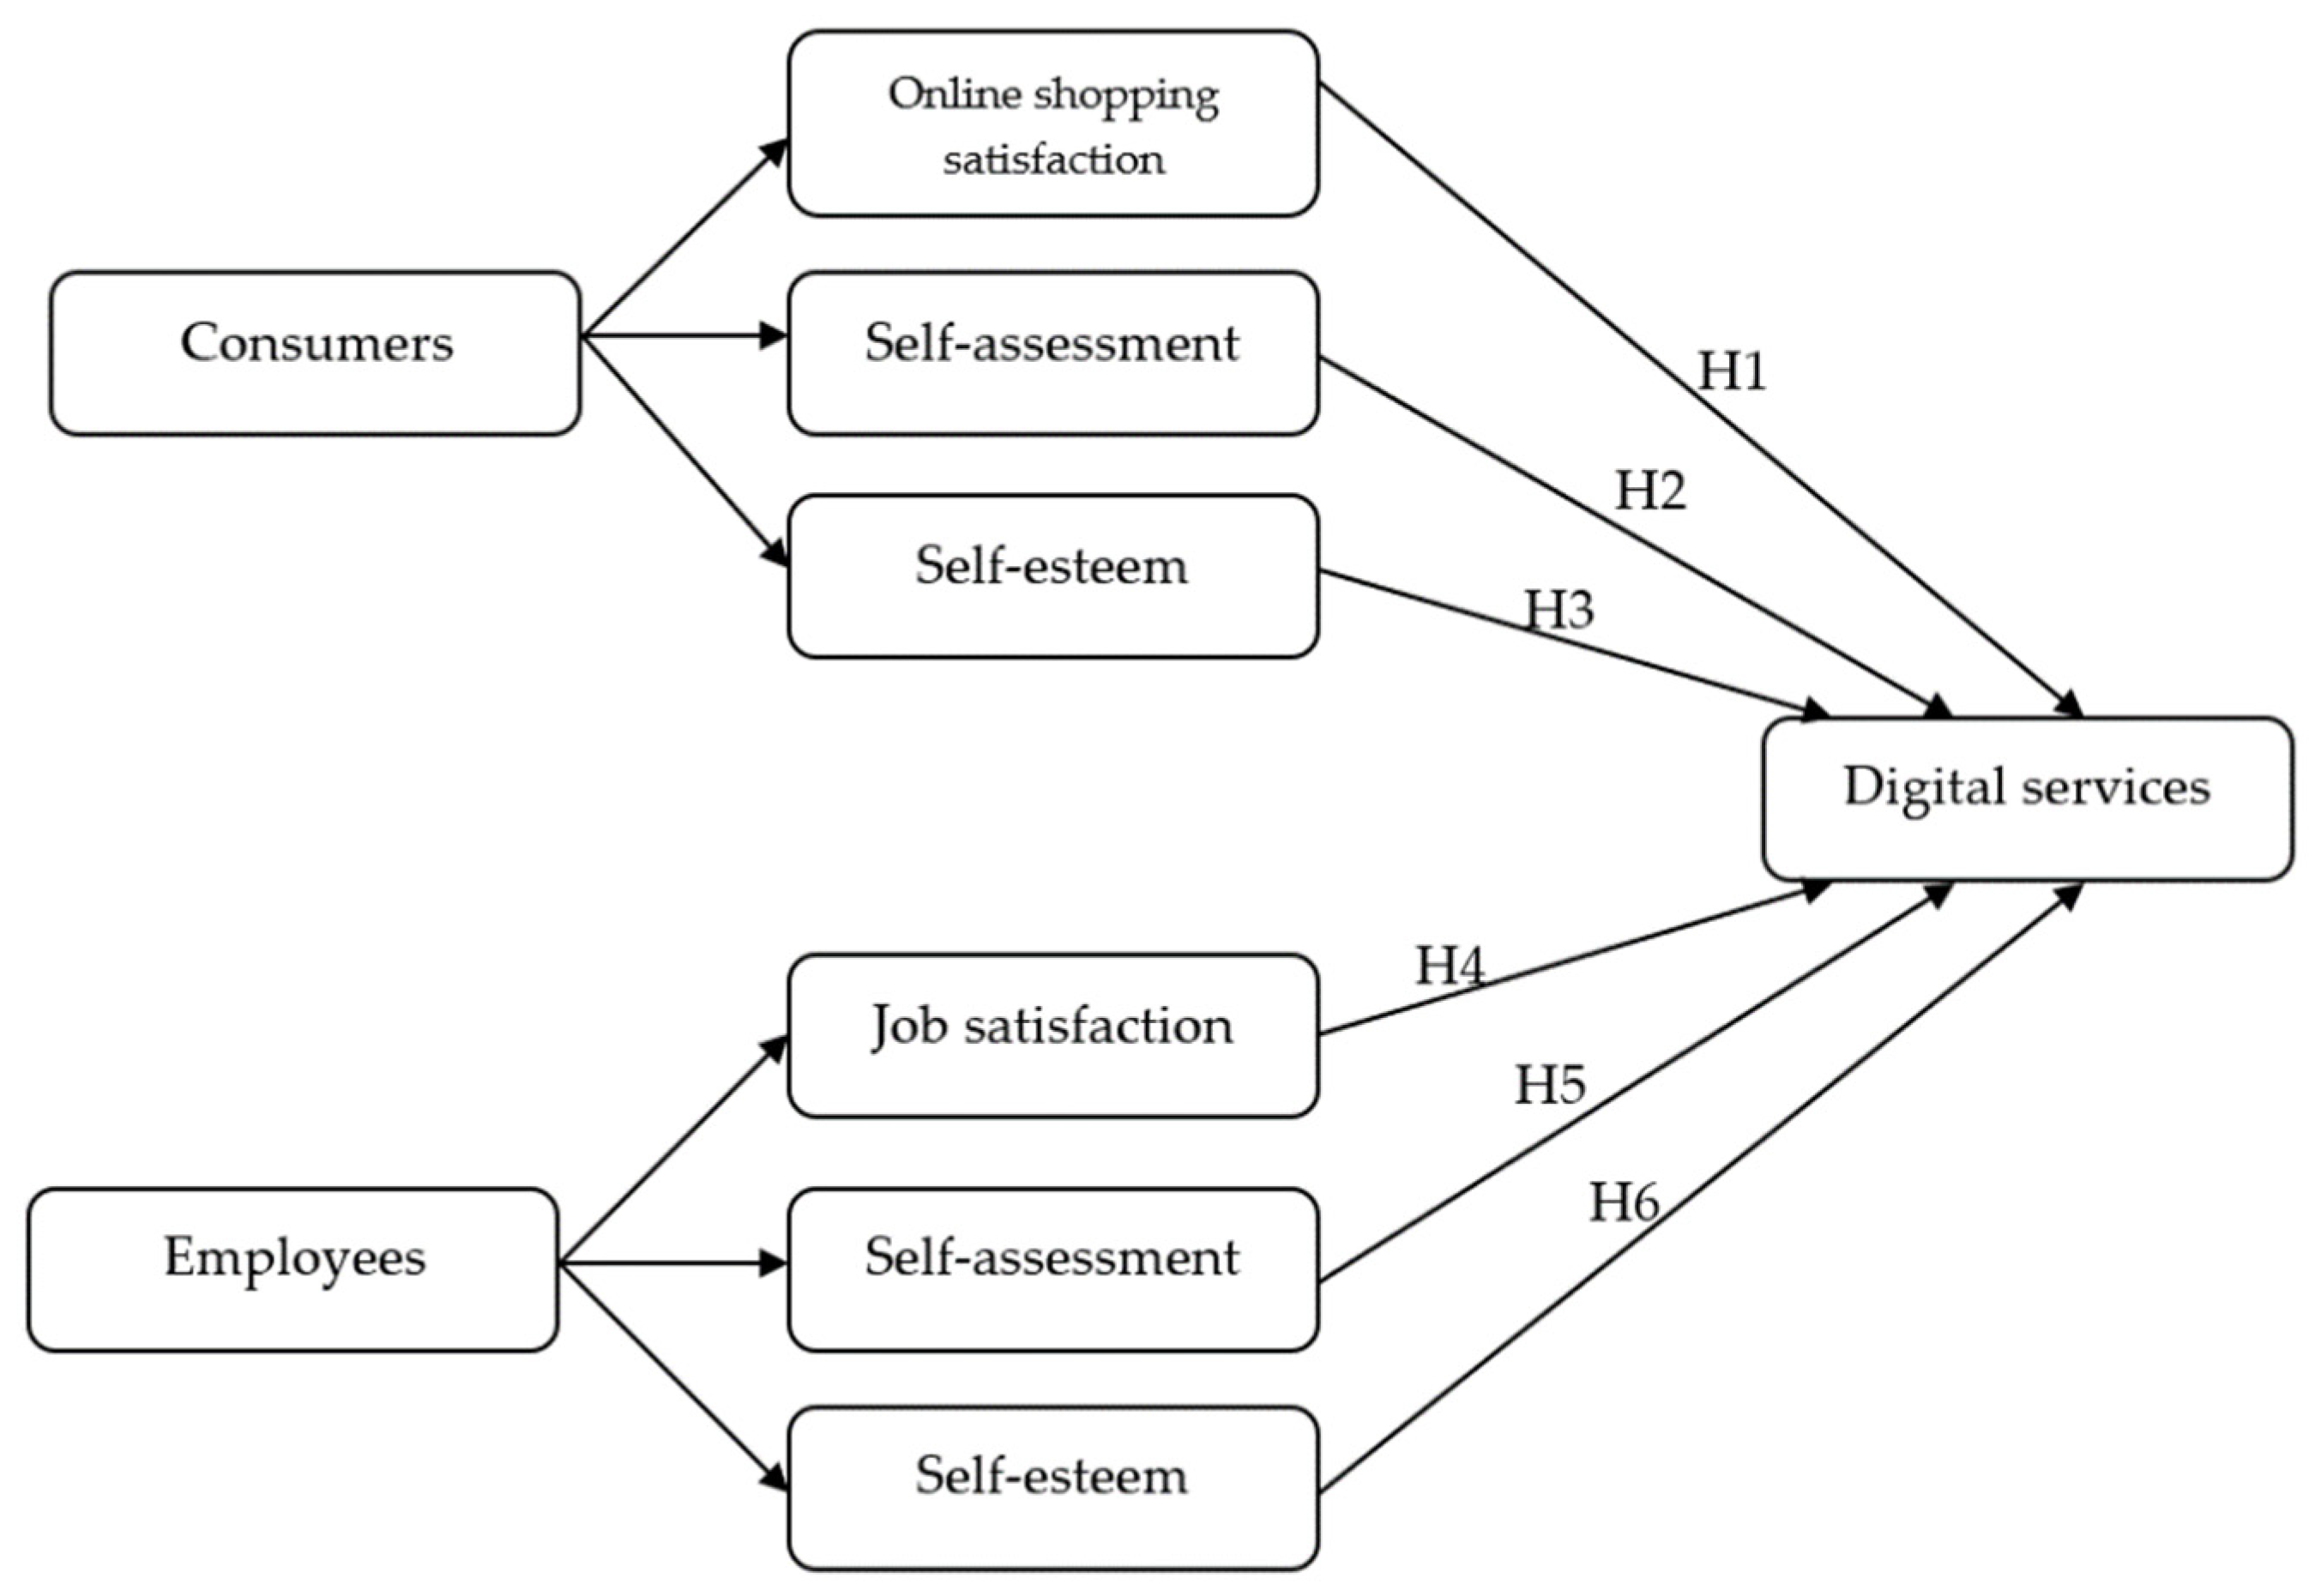
According to the proposed hypotheses of the above theoretical research, the following theoretical model diagram of Figure 1 was attained.
3. Materials and Methods
This paper is based on data processed in the research, which lasted three months, in the period from December 2021 to the end of February 2022, in the territory of the Republic of Serbia. The research was conducted through survey questionnaires, which were distributed to the respondents within the Google Forms program via a link. Survey questionnaires were sent to a total of 3245 e-mail addresses, firstly addressing companies and their employees based on publicly available contact information, and then passing the surveys to their online consumers. The online consumers were selected because they previously stated they would be willing to participate in online surveys when creating their online profiles on the websites of these companies. Within Google Forms, all questions from the questionnaire were marked as mandatory, and it was not possible to receive a questionnaire that was not fully completed by the respondents. The total number of completed questionnaires was 388. 113 of them were employee respondents, and 275 were online consumer respondents. The questionnaire had 3 measurement scales, through which satisfaction [76,77], self-esteem [78], and self-assessment [79] were measured. The measurement scale regarding satisfaction had a total of 17 questions for online consumers and 22 for employees, while measurement scales about self-esteem and self-assessment had 10 and 12 questions, respectively, for both groups of respondents. When analyzing consumer demographics, a slight difference was found between respondents’ sexes when it came to using digital services and buying products online (female was 50.5% versus male, which was 49.5%). Based on the percentages, it can be said that the sex variable does not play an important role in profiling online consumers in the Republic of Serbia. Regarding the age structure, the largest number of consumer respondents belonged to the group up to 25 years of age (35.3%), and in second place were consumer respondents from 36 to 45 years of age (31.6%). By education, the humanistic orientation makes up the convincing majority of online consumer respondents (47.6%), while by profession they are primarily managers (40%) and then administrative workers (36%). As many as 69.8% of online consumer respondents in the Republic of Serbia use digital sales services. Respondents were also asked to state whether they believe that digital services are of great importance, through a 5-point Likert scale (1-strongly disagree, and 5-strongly agree) [80,81,82,83]. This was one of the most important questions, as the answers were going to be used as a variable while performing further analysis to prove the proposed hypotheses regarding online consumers. As many as 71.3% of consumer respondents strongly agreed with the statement that digital services are of great importance, while 22.5% of them agreed. With a mean of 4.64, it can be concluded that consumer respondents see digital services as an important element. An overview of online consumer respondent responses regarding digital services can be found in Table 1.
Many consumer respondents who believe that the services provided are important can indirectly show satisfaction with the service provided. On average, 49.5% of online consumer respondents in Serbia earn from RSD 35,000 to RSD 55,000, which is directly correlated with the answer that as many as 55.3% of consumer respondents can spend only up to RSD 5000 per month on digital sales, while 33.5% can spend up to RSD 10,000. Consumption has not changed significantly since previous years, because the economic power of consumers is still at a relatively low level. When it comes to employee respondents in digital sales in the Republic of Serbia, women dominate (54%). Most employee respondents were in the age range of 36 to 45 (38.1%), with social education orientation (48.7%), while the work performed is mostly managerial (39.8%) and then administrative (30.1%). The employee respondents were also asked to rate the significance of digital services using a 5-point Likert scale. Their answers showed that 54.9% of them strongly agree that digital services are important, while 30.1% agree. With a mean of 4.36, it can be concluded that employee respondents see digital services as an important element, although the percentage of employee respondents that agree is lower than consumer respondents’ percentage (85% versus 93.8%). These answers will also be used as a variable to prove the proposed hypotheses regarding employees. An overview of employee respondent responses regarding digital services can be found in Table 2.
The research started with descriptive statistics, through which satisfaction, self-assessment, and self-esteem were analyzed. The satisfaction of online consumer respondents was the first element to be analyzed through descriptive statistics, and it is presented in Table 3.
By analyzing descriptive statistics by reviewing all the responses of the surveyed consumers, it can be clearly concluded that the respondents mostly agree with the statement that they like to have a lot of information about the product before they decide to buy. Respondents also believe that the internet is a convenient way to shop, and that online shopping is perceived as a convenience. Most respondents do not agree with the statements that researching new stores is a waste of time along with buying things they did not plan. Companies can see that online consumers in the Republic of Serbia are positively oriented towards digital sales, that they like to be well-informed before buying a product, and that they often compare prices and plan their purchases.
After the analysis of online consumer respondents’ satisfaction, Table 4 presents the descriptive statistics analysis of online consumer respondents’ self-assessment.
The analysis of descriptive online consumer respondents’ self-assessment statistics indicates that consumer respondents feel capable of dealing with most of their problems. They think that they are successfully completing their tasks and they are satisfied with themselves. They do not agree with the claims that they are filled with doubts about their abilities or that they feel depressed. From the aspect of locus of control, it can be concluded that online consumer respondents in the Republic of Serbia have an internal locus of control when it comes to assessing their own capabilities. They are leaders rather than followers, they learn and progress quickly, and they believe in themselves and their abilities. They believe that they themselves influence the events occurring in their life.
Table 5 shows the last element when it comes to online consumer respondents, and it refers to self-esteem.
The statement that the respondent feels that they are a valuable person took a high first place, followed by statements that they can do things like most other people, that they feel that they have good qualities, and that they are completely satisfied with themself. This is in line with the fact that they do not push statements that refer to the feeling of failure and uselessness. When the given results were interpreted through the locus of control, it was concluded once again that online consumer respondents in the Republic of Serbia have an internal locus of control, given that they respect themselves and their values.
We will now analyze the employee respondents’ responses through descriptive statistics, starting with satisfaction, which is presented in Table 6.
Based on the analysis of descriptive statistics of employee respondents in digital stores, it can be concluded that they are satisfied with their work, have no desire to change it, are satisfied with colleagues they work with, and consider their superiors competent enough to do their job. Additionally, the surveyed employees do not agree with the statement that their work is not appreciated and that they are not satisfied with the benefits they receive at work.
The next element of employee respondents that will be analyzed is self-assessment, and it is presented in Table 7.
There are similarities between the self-assessment of online achievements of consumer respondents and employee respondents in digital sales. Employee respondents are also satisfied with themselves, successfully completing tasks and dealing with their problems. In addition, they do not feel gloomy and worthless and feel that they have control over their career success. Based on a review of the answers, it can be concluded that employee respondents also have an internal locus of control, i.e., that they consider themselves responsible for everything that happens to them in life. They are harder to influence, more likely to change jobs if they are not satisfied with working conditions, and advance faster on the career ladder.
As a last part of the descriptive statistics, we will investigate the responses regarding the self-esteem of employee respondents. The statistic is presented in Table 8.
Employee respondents in digital sales had a high degree of agreement with several statements; therefore, they believe that hardworking people are at least on an equal footing with others, have good qualities, can do things like most other people, and take a positive attitude towards themselves. They disagree with the statements that they see themselves as a failed person and that they think they are not good at all. Once again, descriptive statistics through the mean showed that employee respondents in the Republic of Serbia have an internal locus of control. They have a high level of self-esteem and faith in their values.
Before we went further with data analysis, we used a t-test to validate the non-response bias. To rule out the possibility that non-response bias is a major concern for this study, a non-response bias test is performed, with late respondents serving as proxies for non-respondents. t-test was used during the analysis for all key variables in this study. Table 9 shows the t-test results, which show that there are no statistically significant differences at the 0.05 level for any of the characteristics between the two groups, early respondents, and late respondents. As a result, we believe that non-response bias is not a major concern for this study, and it is safe to assume that the responses can be expected to be representative of the resident population.
4. Results
The results will refer to factor analysis and regression analysis. These two analyses will thus be applied to the satisfaction, self-assessment, and self-esteem of online consumer respondents and employee respondents, while considering the importance of digital services assessed by all the respondents, to test the proposed hypotheses. Factor analysis was performed using a principal component analysis. The minimum factor loading criteria were set to 0.5. The communality of the scale, which indicates the amount of variance in each dimension, was also assessed to ensure acceptable levels of explanation. Factor analysis will first be applied to statements regarding the satisfaction of online consumer respondents.
The first step is the Kaiser-Meyer-Olkin measure of sampling adequacy. The KMO was above 0.7, which proved the appropriateness of the factor analyses, while Bartlett’s test was significant (0.000) and showed that the 17 statements about consumer respondents’ satisfaction are correlated with each other.
While performing factor analysis, the statement I buy things I didn’t plan to buy was the first to be excluded from further calculations, as its communality level was below 0.5 (0.431). In the second iteration, the statement I am careful when trying new products was excluded, as it did not load with any factor. In the third iteration, the statement I enjoy exploring alternative stores was excluded because it cross-loaded with two factors: Convenience and Exploring (0.505 and 0.653, respectively). After the deletion of these three statements, the rest of the calculations are as follows. Table 10 presents factor loadings and communalities for statements regarding the satisfaction of the online consumer respondents, while Table 11 shows the eigenvalues.
Statements with values less than 0.5 have been excluded from the matrix, and we can see in Table 10 that the first four statements are loading with component regarding convenience while shopping online. Statements from 5 to 7 are loading with the information component, statements from 9 to 10 are loading with the component regarding experience, 11 and 12 are loading with exploring brands and stores, and the last two statements are loading with the buying component. These five distinct factors were extracted as a result of a factor analysis on a fourteen-item measurement scale. The factor loadings indicate that factors are made up of several items. Factors Exploring and Buying consist of only two items, and even though these factors exist, we will not include them in further analysis, interpretation, and results, as they are not supported by enough items. As a result, the factor analysis provides evidence that the fourteen-item satisfaction measurement scale is measuring the three factors separately: convenience, experience, and information.
Factors having eigenvalues over one were selected for further study. In this case, as presented in Table 11, we had five components with a value greater than one, and the cumulative percentage was 76.83%, so we could conclude that these five components should be retained in the model.
The factor analysis results regarding consumer respondents’ satisfaction show that the first five statements are the most important ones and should be used by companies to develop efficient consumer management strategies. To test H1, we used regression analysis to see the relationship between obtained factors and digital services. The hypothesis tests if online consumer satisfaction (OCS) carries an impact on digital services (DS). The variable OCS was regressed on variable DS to test hypothesis H1. OCS predicted DS F (3, 271) = 22.059, p < 0.001, which indicates that OCS can play a significant role in shaping DS. Moreover, the R2 = 0.196 depicts that the model explains 19.6% of the variance in digital services.
For self-assessment of consumer respondents, KMO is above 0.8, which proves the appropriateness of the factor analyses, while Bartlett’s test is significant (0.000) and shows that the 12 statements about consumer respondents’ self-assessment are correlated with each other. Table 12 shows the factor loadings and communalities for statements regarding online consumer respondents’ self-assessment and Table 13 shows their eigenvalues.
The rotated component matrix in Table 12 shows that statements from 1 to 9 are loading with component about the ability to complete tasks and deal with problems, statements 10 and 11 are loading with component regarding control, and the last statement is loading with component about life success. These three distinct factors were extracted as a result of a factor analysis on a twelve-item measurement scale. The factor loadings indicate that the first factor is made up of several items while the last factor consists of one item. Control and Success did not consist of enough items, and even though these factors exist, we did not include them in further analysis, interpretation, and results. As a result, the factor analysis gives evidence suggesting that the twelve-item self-assessment measurement scale is measuring one factor: ability. In this case, all above-mentioned statements in extraction have values greater than 0.5, which means that not one statement should be cut off from further analysis.
In the case of consumer respondents’ self-assessment, the first three statements have values greater than one and the cumulative percentage is 71%, so we concluded that these three statements needed to be kept in the model.
The factor analysis results regarding consumer respondents’ self-assessment show that the first three statements are the most important ones and should be used by companies to develop efficient consumer management strategies.
To test H2, we will use regression analysis to see the relationship between obtained factors and digital services. The hypothesis tests if online consumer self-assessment (OCSA) carries an impact on digital services (DS). The variable OCSA was regressed on variable DS to test hypothesis H2. OCSA predicted DS F (1, 273) = 1.009, p = 0.316, which indicates that OCSA does not play a significant role in shaping DS. The R2 = 0.004 depicts that the model explains 0.4% of the variance in digital services.
Analyzing the results for consumer respondents’ self-esteem, KMO was again above 0.8, which proved the appropriateness of the factor analyses, while Bartlett’s test was significant (<0.001) and showed that the 10 statements about consumer respondents’ self-esteem were correlated with each other. Table 14 includes factor loadings and communalities for self-esteem statements, while Table 15 refers to eigenvalues.
The rotated component matrix shows that statements 1 through 6 are loading with component satisfaction and statements 7 through 10 are loading with component failure.
The factor analysis results regarding consumer respondents’ self-esteem show that the first 2 statements are the most important ones and should be used by companies to develop efficient consumer strategies. Two factors were extracted as a result of a factor analysis on a ten-item measurement scale. The factor loadings indicate that both factors are made up of multiple items. As a result, the factor analysis provides evidence to indicate that the ten-item self-esteem measurement scale is measuring satisfaction and failure separately. Again, all above-mentioned statements in extraction have values greater than 0.5, which means that not one statement should be cut off from further analysis.
In the case of consumer respondents’ self-esteem, the first two statements had values greater than one and the cumulative percentage was 64%, so we concluded that these two statements needed to be retained in the model.
To test H3, we used regression analysis to see the relationship between obtained factors and digital services. The hypothesis tests if online consumer self-esteem (OCSE) carries an impact on digital services (DS). The variable OCSE was regressed on variable DS to test hypothesis H3. OCSE predicted DS F (2, 272) = 12.807, p < 0.001, which indicates that OCSE can play a significant role in shaping DS. The R2 = 0.086 depicts that the model explains 8.6% of the variance in digital services.
After analyzing consumer respondents’ answers, we moved on to the second part of the study, which involves employee respondents. The first scale measured through factor analysis was the satisfaction of employee respondents.
KMO was above 0.8, which proved the appropriateness of the factor analyses, while Bartlett’s test was significant (<0.001) and showed that the 22 statements about employee respondents’ satisfaction were correlated with each other. Table 16 shows the factor loadings and communalities for the statements regarding satisfaction of employee respondents, while Table 17 represents the eigenvalues.
The rotated component matrix shows that statements 1 through 5 are loading with component satisfaction, statements 6 through 8 are loading with component regarding superiors, statements 9 through 13 are loading with component about work resources, 14 through 16 are loading with component benefit, statements 17 through 19 are loading with component job quitting, 20 and 21 are loading with component about colleagues, and the last statement is loading with component obligation. Seven distinct factors were extracted as a result of a factor analysis on a twenty-two-item measurement scale. The factor loadings show that each factor has several items, while the last factor has only one item. Since factors Colleagues and Obligation did not consist of enough items, though these factors exist, we will did include them in further analysis, interpretation, or results. As a result, the factor analysis provides evidence to suggest that the twenty-two-item satisfaction measurement scale is, in fact, measuring the five factors separately: satisfaction, superior, resources, benefit, and quitting. All statements regarding employee respondents’ satisfaction in extraction have values greater than 0.5, which means that none of the statements should be removed from further analysis.
For employee respondents’ satisfaction, the first seven statements had values greater than one, while the cumulative percentage was 75.7%. We concluded that the seven statements needed to be retained in the model.
The factor analysis results regarding employee respondents’ satisfaction show that the first seven statements are the most important ones and should be used by companies to develop efficient human management resource strategies.
To test H4, we again used regression analysis to see the relationship between obtained factors and digital services (DS). The variable ES was regressed on variable DS to test hypothesis H4. ES predicted DS F (5, 107) = 1.603, p = 0.165, which indicates that ES does not play a significant role in shaping DS. The R2 = 0.070 depicts that the model explains 7% of the variance in digital services.
Once again, KMO was above 0.8, which proved the appropriateness of the factor analyses, while Bartlett’s test was significant (<0.001) and showed that the 12 statements about employee respondents’ self-assessment are correlated with each other.
When conducting the factor analysis, two statements were excluded from further research- Sometimes I feel depressed, and I don’t feel in control of my career success. In the first iteration, these two statements were cross-loading with factors of Worth and Ability. Both were loading positively with Worth and negatively with Ability. Since their cross-loadings were above 0.5, they were extracted from further calculations. The rest of the calculation are as follows. In Table 18, factor loadings and communalities for the statements regarding self-assessment of employee respondents are presented, while Table 19 shows the eigenvalues.
The rotated component matrix shows that statements 1 through 4 are loading with components about self-worth, statements 5 through 8 are loading with components regarding ability, and statements 9 and 10 are loading with component success. Three distinct factors were extracted as a result of a factor analysis on a ten-item measurement scale. The factor loadings show that two factors have multiple items, whereas the last one has only two. Since factor Success did not consist of enough items, though the factor exists, we did not include it in further analysis, interpretation, or results. As a result, the factor analysis provides evidence to indicate that the ten-item self-assessment measurement scale is measuring Self-worth and Ability separately.
When it comes to employee respondents’ self-assessment, from 10 statements, only the first 3 had values greater than 1, while the cumulative percentage was 63.83%. We concluded that these three statements needed to be retained in the model, and for future creation of HR strategies by companies.
The factor analysis results regarding employee respondents’ self-assessment shows that the first three statements are the most important ones and should be used by companies to develop efficient human management resource strategies.
To test H5, we used regression analysis to see the relationship between obtained factors and digital services. The hypothesis tests if employee self-assessment (ESA) carries an impact on digital services (DS). The variable ESA was regressed on variable DS to test the hypothesis H5. ESA predicted DS F (2, 110) = 0.396, p = 0.674, which indicates that ESA does not play a significant role in shaping DS. The R2 = 0.007 depicts that the model explains only 0.7% of the variance in digital services.
For the last time in this analysis, KMO was above 0.8, which proved the appropriateness of the factor analyses, while Bartlett’s test was significant (<0.001) and showed that the 10 statements about employee respondents’ self-esteem were correlated with each other.
When conducting the factor analysis, two statements were excluded from further research: I wish I could respect myself more, and All in all, I tend to feel like I’ve failed as a person. In the first iteration, these two statements had communalities with values lower than 0.5. The statement I wish I could respect myself more was the first one to be excluded, as it had a lower communality level than the second one (0.398 vs. 0.454, respectively). In the second iteration, the statement All in all, I tend to feel like I’ve failed as a person still had a value lower than 0.5 (0.464). For this purpose, it was also extracted from further calculations. The rest of the analysis are as follows, in Table 20 and Table 21, showing the factor loadings and communalities, and eigenvalues, respectively.
The rotated component matrix for employee respondents’ self-esteem shows that statements 1 through 5 are loading with component failure, while statements 6 through 8 are loading with component regarding self-value. Two distinct factors were extracted as a result of a factor analysis on an eight-item measurement scale. The factor loadings imply that both factors are made up of multiple items. As a result, the factor analysis demonstrates that the eight-item self-esteem measurement scale is measuring both failure and value separately.
For employee respondents’ self-esteem, from eight statements, only the first two had values greater than 1, while the cumulative percentage was 66%. We concluded that these two statements needed to be retained in the model, and for future creation of HR strategies by companies.
The factor analysis results regarding employee respondents’ self-esteem show that the first two statements are the most important ones and should be used by companies to develop efficient human management resource strategies.
To test H6, we used regression analysis to see the relationship between obtained factors and digital services. The hypothesis tests if employee self-esteem (ESE) carries an impact on digital services (DS). The variable ESE was regressed on variable DS to test hypothesis H6. ESE predicted DS F (2, 110) = 5.213, p = 0.007, which indicates that ESE plays a role in shaping DS. The R2 = 0.087 depicts that the model explains 8.7% of the variance in digital services. Table 22 shows the summary of the findings.
5. Discussion and Conclusions
The main goal of this paper was to analyze the relationship between social capital and digital services, which was determined through empirical research. The results showed that social capital plays an important role in defining behavior in digital shopping and digital sales through digital services and can be used when creating managing strategies by businesses. Through descriptive statistics, factor analysis, and regression analysis, valuable conclusions were reached regarding social capital management. Research has shown that a significant number of variables have an impact on online consumers, especially when looking at their relationship with digital service and shopping. The variables refer to satisfaction with online shopping and self-esteem, while a self-assessment of one’s achievements proved to have no impact on digital services. Of all the above, satisfaction has the strongest relationship.
Three factors about consumer respondents’ satisfaction through factor analysis were obtained- convenience, experience, and information. These factors were then used to test whether they impact digital services. The overall regression was statistically significant (R2 = 0.196, F (3, 271) = 22.059, p < 0.001). Of all these factors, convenience and experience significantly impact digital services (p < 0.05), while the remaining third factor does not significantly impact digital services. For consumer respondents’ self-assessment, only one factor was obtained. The overall regression was not statistically significant (R2 = 0.004, F (1, 273) = 1.009, p = 0.316), as this factor does not significantly impact digital services. Finally, regarding consumer respondents’ self-esteem, two factors were obtained through factor analysis: satisfaction and failure. Regression showed an overall statistical significance (R2 = 0.086, F (2, 272) = 12.208, p < 0.001), while both factors significantly impact digital services (p < 0.05).
The other side of social capital was viewed through employees in digital sales. Unlike online consumer respondents, results gained through employee respondents’ answers tell us that only self-esteem has an impact on digital services. There are five obtained factors regarding job satisfaction: satisfaction, superior, resources, benefits, and quitting. The overall regression was not statistically significant (R2 = 0.070, F (5, 107) = 1.603, p = 0.155). All mentioned factors do not impact digital services. Regarding employee self-esteem, the obtained factors were failure and value. The overall regression for self-esteem was statistically significant (R2= 0.087, F (2, 110) = 5.213, p = 0.007), while the factor value impacts digital services (p < 0.05). For self-assessment, the factors were worth and ability. The regression for self-assessment is not statistically significant (R2= 0.007, F (2, 110) = 0.396, p = 0.674). Both factors do not impact digital services.
5.1. Theoretical Implications
Few studies have examined the connection between online consumers and digital services, which can also refer to the relationship formed between employees and digital services. We focused on an integrated perspective, as we were looking at social capital, thus including both online consumers and employees. Previous studies pointed out that the online shopping experience can impact products and services [18,19,20,21,22] as well as job satisfaction [50,55]. Some theories suggests that online shopping satisfaction can even impact the number of services being offered [25], while job satisfaction impacts work engagement and work output [45,46,47]. However, self-assessment has been understudied in terms of employee assessment, while consumer assessment is broadly used in several research fields [29,30,31,32,33,34,35]. Self-esteem was from the employees’ point of view, mostly connected to work engagement [72,73,74,75]. Consumer behavior and self-esteem were researched through the prism of the type of products, services, and brands being bought [39,40,41,42,43,44]. The findings of the present study showed that these variables should be researched when it comes to social capital and its connection to digital services. Therefore, our analytical results help to expand the literature on managing social capital through digital services, bearing in mind the findings. Self-esteem and online shopping satisfaction should be the dominant variables when conducting studies about social capital, and digital services proved to be a viable-dependent variable, instead of products and services altogether or work outputs. Although the concept of managing social capital developed rapidly and steadily in the literature, the management of social capital that is practiced in the Western Balkans needs to evolve. The findings of this study should help managers who are designing their own managing styles to establish a dialogue between both sides of social capital and thus create sustainable and creative strategies.
5.2. Practical Implications
In this paper, we present evidence that online shopping satisfaction and self-esteem are the most important variables when observing social capital. Additionally, these variables can be placed in relationship with digital services to generate more comprehensive conclusions, particularly when creating management strategies. For managers, the traits of learning about social capital variables are key indicators for creating and selecting the most suitable strategies. Online consumer strategies need to focus on the whole online experience. Interacting, giving feedback and information, and producing services quickly is one of the main goals for managers, to maximize consumer satisfaction. This also applies to consumer self-esteem, since it is proven that it in fact forms a relationship with digital services. Regular consumer surveys from the marketing department can help improve managerial strategies. This will be profoundly helpful when developing marketing campaigns, engaging in online communication, and customizing product offerings. For employees, managerial strategies should consist of creating training to positively impact self-esteem in the workplace. This will help with work engagement, job satisfaction, and the creation of the final work output (i.e., products and services). Such improved and enhanced self-esteem can strengthen employees’ learning and vitality traits, thereby improving employees’ performance. It is also beneficial to continually survey employees regarding their self-esteem and work on organizational-based self-esteem. For some managers, it could be beneficial to not only look at separate employees, but rather at teams, and research the teams’ self-esteem. Team leaders should be the ones with higher self-esteem, as they can develop superb digital services and reinforce team members to do the same.
5.3. Research Limitations
The current study advances the field’s understanding of social capital as a window of opportunity for exploring many factors that affect digital services. However, some restrictions should be considered when analyzing the recent empirical results. At the same time, these limits provide important areas for further study.
There are a few restrictions to be aware of. We relied on self-reports rather than real behavior measurements, which ultimately limited the dependability of the captured behavior due to potential response biases. Due to memory biases, reliability may be limited. Additionally, some intended response biases, particularly regarding the participants’ intent to respond to our questions in a socially desirable way, may have harmed the data quality.
We also encountered non-response bias, as a large number of people who were contacted did not complete the survey. Non-response bias happens when people are reluctant or are unable to give a response to a questionnaire since they are considerably different from those that do respond. As a result of these limitations, which are typically related to self-reported measures, future research should investigate the current research questions further using more robust empirical measures, such as conducting in-depth interviews, observing online consumers while using digital services, and observing employees while working.
5.4. Future Research
Future research should consider these research limitations to gather reliable data by reducing or ideally eliminating respondents’ biases and intentions. Also, further research should include comparison with developed countries. It would be interesting to create a comparison between online consumers and employees in digital stores in Croatia. Although Croatia is in Western Balkans the same as Serbia, Croatia entered the European Union several years ago. Economical changes in Croatia have been applied, and it would be useful to see how consumers and employees are compared presently. Lastly, future research should include further development and investigation of self-esteem for both online consumers and employees.
Author Contributions
Conceptualization, J.Z.; methodology, J.Z. and V.Z.; software, J.Z.; validation, J.Z.; formal analysis, J.Z.; investigation, J.Z.; resources, J.Z. and V.Z.; data curation, J.Z.; writing—original draft preparation, J.Z.; writing—review and editing, V.Z.; visualization, J.Z.; supervision, V.Z.; project administration, V.Z. All authors have read and agreed to the published version of the manuscript.
Funding
This research received no external funding.
Institutional Review Board Statement
Not applicable.
Informed Consent Statement
Informed consent was obtained from all subjects involved in the study.
Data Availability Statement
Not applicable.
Acknowledgments
This research was a part of the PhD thesis by Jelena Zelenović, entitled “Human capital management in digital sales”.
Conflicts of Interest
The authors declare no conflict of interest.
References
- Maan, S.; Kumar, S. Exploring Demographic Differences in Online Purchase Frequency. Mukt Shabd J. 2020, 9, 4845–4855. [Google Scholar]
- Rudansky-Kloppers, S. Key factors influencing the online buying decision when purchasing products in specific product categories. Afr. J. Sci. Technol. Innov. Dev. 2016, 9, 43–45. [Google Scholar] [CrossRef]
- Fayad, R.; Peper, D. The technology acceptance model e-commerce extension: A conceptual framework. Procedia Econ. Financ. 2015, 26, 1000–10006. [Google Scholar] [CrossRef] [Green Version]
- Reyes-Menendez, A.; Saura, J.R.; Filipe, F. The importance of behavioral data to identify online fake reviews for tourism businesses: A systematic review. PeerJ Comput. Sci. 2019, 5, e219. [Google Scholar] [CrossRef] [Green Version]
- Reyes-Menendez, A.; Saura, J.R.; Palos-Sanchez, P.R.; Alvarez-Garcia, J. Understanding User Behavioral Intention to Adopt a Search Engine that Promotes Sustainable Water Management. Symmetry 2018, 10, 584. [Google Scholar] [CrossRef] [Green Version]
- Gursoy, D. A critical review of determinants of information search behavior and utilization of online reviews in deci-sion-making process. Int. J. Hosp. Manag. 2019, 76, 53–60. [Google Scholar] [CrossRef]
- Rita, R.; Oliveira, T.; Farisa, A. The impact of e-service quality and customer satisfaction on customer behavior in online shopping. Heliyon 2019, 5, E02690. [Google Scholar] [CrossRef] [Green Version]
- Reyes-Menendez, A.; García Giménez, C.; Agapito, D.; Debasa, F.; Kumar, J.; Saura, J.R.; Balasubramanian, K.; Polanco-Diges, L.; Correia, M.B.; de Matos, N.; et al. Consumer behavior in the Digital age. J. Spat. Organ. Dyn. 2020, 8, 190–262. [Google Scholar]
- Gupta, C. Customer Satisfaction: Definition, Importance & Examples. Available online: https://www.zendesk.com/blog/3-steps-achieving-customer-satisfaction-loyalty/ (accessed on 4 April 2022).
- Baltaci, A. Concept of Self-Esteem in Consumer Behavior: A Literature Review. Bucak İşletme Fakültesi Derg. 2020, 3, 257–269. [Google Scholar] [CrossRef]
- Audia, P.G.; Brion, S.; Greve, H.R. Self-Assessment, Self-Enhancement, and the Choice of Comparison Organizations for Evaluating Organizational Performance. Adv. Strateg. Manag. 2015, 32, 89–118. [Google Scholar] [CrossRef] [Green Version]
- Connealy Weber, K.; Hanrahan, M. Defining Digitalization; Gartner: Stamford, CT, USA, 2017. [Google Scholar]
- Hatami, H.C.; Plotkin, L.; McLellan, K.; Schulze, P. The 90 Percent Success Recipe: How Digital and Analytics Can Help Commercial Transformations Beat the Odds and the Market. Available online: https://www.mckinsey.com/business-functions/growth-marketing-and-sales/our-insights/the-90-percent-success-recipe (accessed on 27 June 2022).
- Guenzia, P.; Nijssen, E.J. The impact of digital transformation on salespeople: An empirical investigation using the JD-R model. J. Pers. Sell. Sales Manag. 2021, 41, 130–149. [Google Scholar] [CrossRef]
- Schwarzmüller, T.; Brosi, P.; Duman, D.; Welpe, M.I. How Does the Digital Transformation Affect Organizations? Key Themes of Change in Work Design and Leadership. Manag. Rev. 2018, 29, 114–138. [Google Scholar] [CrossRef]
- Social Capital. Definition of Social Capital by Oxford Dictionary on Lexico.com also Meaning of Social Capital. Lexico Dic-tionaries English. Available online: https://www.lexico.com/en/definition/social_capital (accessed on 1 April 2022).
- Hitt, M.A.; Bierman, L.; Shimizu, K.; Kochhar, R. Direct and moderating effects of human capital on strategy and performance in professional service firms: A resource-based perspective. Acad. Manag. J. 2001, 44, 13–28. [Google Scholar]
- Busseri, M.A.; Lefcourt, H.M.; Kerton, R.R. Locus of control for consumer outcomes: Predicting consumer behavior. J. Appl. Soc. Psychol. 1998, 28, 1067–1087. [Google Scholar] [CrossRef]
- Kim, S.; Byramjee, F. Effects of risks on online consumers’ purchasing behavior: Are they risk-averse or risk-taking? J. Appl. Bus. Res. 2014, 30, 161–171. [Google Scholar] [CrossRef]
- Forsythe, S.M.; Shi, B. Consumer Patronage and risk perceptions in internet shopping. J. Bus. Res. 2003, 56, 867–875. [Google Scholar] [CrossRef]
- Lixandroiu, R.; Cazan, A.M.; Maican, C.I. An Analysis of the Impact of Personality Traits towards Augmented Reality in Online Shopping. Symmetry 2021, 13, 416. [Google Scholar] [CrossRef]
- Chun-Chun, L.; Hsueh-Ying, W.; Yong-Fu, C. The critical factors impact on online customer satisfaction. Procedia Comput. Sci. 2011, 3, 276–281. [Google Scholar]
- Suchánek, P.; Králová, M. Effect of Customer Satisfaction on Company Performance. Acta Univ. Agric. Silvic. Mendel. Brun. 2015, 63, 1013–1021. [Google Scholar] [CrossRef] [Green Version]
- Varzaru, A.A.; Bocean, C.G.; Rotea, C.C.; Budică-Iacob, A.-F. Assessing Antecedents of Behavioral Intention to Use Mobile Technologies in E-Commerce. Electronics 2021, 10, 2231. [Google Scholar] [CrossRef]
- Kombo, F. Customer satisfaction in the Kenyan banking industry. J. Int. Stud. 2015, 8, 174–186. [Google Scholar] [CrossRef]
- Holbrock, M.B.; O’Shaughnessy, J. The role of emotion and advertising. Psychol. Mark. 1984, 1, 45–64. [Google Scholar] [CrossRef]
- Morris, J.D. Observations: SAM: The Self-Assessment Manikin: An Efficient Cross-Cultural Measurement of Emotional Response. Available online: https://adsam.com/wp-content/uploads/2020/02/Observations.pdf (accessed on 25 June 2022).
- Dormann, C. Seducing Consumers, Evaluating Emotions. 2001. Available online: https://www.researchgate.net/publication/228594937_Seducing_consumers_evaluating_emotions (accessed on 25 June 2022).
- Ivarsson, B.; Malm, U. Self-reported consumer satisfaction in mental health services: Validation of a self-rating version of the UKU-Consumer Satisfaction Rating Scale. Nord. J. Psychiatry 2007, 61, 194–200. [Google Scholar] [CrossRef] [PubMed]
- Brass, E.P.; Vassil, T.; Replogle, A.; Hwang, P.; Rusche, S.; Shiffman, S.; Levine, J.G. Can Consumers Self-Select for Appropriate Use of an Over-the-Counter Statin? The Self Evaluation of Lovastatin to Enhance Cholesterol Treatment Study. Am. J. Cardiol. 2008, 101, 1448–1455. [Google Scholar] [CrossRef] [PubMed]
- Paez, K.A.; Mallery, C.J.; Noel, H.; Pugliese, C.; McSorley, V.E.; Lucado, J.L.; Ganachari, D. Development of the Health In-surance Literacy Measure (HILM): Conceptualizing and Measuring Consumer Ability to Choose and Use Private Health In-surance. J. Health Commun. 2014, 19, 225–239. [Google Scholar] [CrossRef] [Green Version]
- Meyer, J.; Hein, A. Live long and prosper: Potentials of low-cost consumer devices for the prevention of cardiovascular diseases. Medicine 2.0 2013, 2, e7. [Google Scholar] [CrossRef]
- Burson, K.A. Consumer-Product Skill Matching: The Effects of Difficulty on Relative Self-Assessment and Choice. J. Consum. Res. 2007, 34, 104–110. [Google Scholar] [CrossRef] [Green Version]
- Ponte, J.; Couto, G.; Sousa, A.; Pimentel, P.; Oliveira, A. Idealizing adventure tourism experiences: Tourists’ self-assessment and expectations. J. Outdoor Recreat. Tour. 2021, 35, 100379. [Google Scholar] [CrossRef]
- Gavkalova, N.; Lola, Y.; Dzenis, V.; Dzenis, O. Measuring The Consumers Information Skills In A Digital Supply Chain. Appl. Econ. 2020, 38, 1–15. [Google Scholar] [CrossRef]
- Clark, R.A.; Goldsmith, R.E. Market mavens: Psychological influences. Psychol. Mark. 2005, 22, 289–312. [Google Scholar] [CrossRef] [Green Version]
- Blascovich, J.; Tomaka, J. Measures of self-esteem. In Measures of Personality and Social Psychological Attitudes; Robinson, J.P., Shaver, P.R., Wrightsman, L.S., Eds.; Academic Press: San Diego, CA, USA, 1991; pp. 115–160. [Google Scholar]
- Brown, J.D.; Collins, R.L.; Schmidt, G.W. Self-esteem and direct versus indirect forms of self-enhancement. Personal. Soc. Psychol. 1988, 55, 445–453. [Google Scholar] [CrossRef]
- Dittmar, H.; Drury, J. Self-image—Is it in the bag? A qualitative comparison between “ordinary” and “excessive” consumers. J. Econ. Psychol. 2000, 21, 109–142. [Google Scholar] [CrossRef]
- Bizman, A.; Yinon, Y. Engaging in distancing tactics among sport fans: Effects on self-esteem and emotional responses. J. Soc. Psychol. 2002, 142, 381–392. [Google Scholar] [CrossRef] [PubMed]
- Adkins, N.R.; Ozanne, J. The Low Literate Consumer. J. Consum. Res. 2005, 32, 93–105. [Google Scholar] [CrossRef]
- Stuppy, A.; Mead, N.L.; Van Osselaer, S.M.J. I Am, Therefore I Buy: Low Self-Esteem and the Pursuit of Self-Verifying Con-sumption. J. Consum. Res. 2020, 46, 956–973. [Google Scholar] [CrossRef]
- Robins, R.W.; Beer, J. Positive Illusions about the Self: Short-Term Benefits and Long-Term Costs. J. Personal. Soc. Psychol. 2001, 80, 340–352. [Google Scholar] [CrossRef]
- Taylor, S.E.; Brown, J.D. Illusion and well-being: A social psychological perspective on mental health. Psychol. Bull. 1988, 103, 193–210. [Google Scholar] [CrossRef]
- Lindawati, M. The Impact of Transformational Leadership and Motivation on Employee Performance with Job Satisfaction as Intervening Variable in Indonesian Banking Industry During Digital Transformation. J. Ind. Eng. Manag. Res. 2021, 2, 51–66. [Google Scholar]
- Moro, S.; Ramos, R.F.; Rita, P. What drives job satisfaction in IT companies? Int. J. Product. Perform. Manag. 2021, 70, 391–407. [Google Scholar] [CrossRef] [Green Version]
- Imran, B.; Mariam, S.; Aryani, F.; Ramli, A.H. Job Stress, Job Satisfaction and Turnover Intention. Adv. Econ. Bus. Manag. Res. 2020, 151, 290–292. [Google Scholar]
- Catteeuw, F.; Flynn, E.; Vonderhorst, J. Employee engagement: Boosting productivity in turbulent times. Organ. Dev. Ment J. 2007, 25, 151–157. [Google Scholar]
- Saari, L.M.; Judge, T.A. Employee attitudes and job satisfaction. Hum. Resour. Manag. 2004, 43, 395–407. [Google Scholar] [CrossRef] [Green Version]
- Shore, L.M.; Martin, H.J. Job Satisfaction and Organizational Commitment in Relation to Work Performance and Turnover Intentions. Hum. Relat. 1989, 42, 625–638. [Google Scholar] [CrossRef]
- Zadran, S.; Tariq, M.; Quetta, P.; Ahmed Syed, N. Job satisfaction and work performance. Eur. Acad. Res. 2014, 1, 5030–5044. [Google Scholar]
- Pushpakumari, M.D. The Impact of Job Satisfaction on Job Performance: An Empirical Analysis. 2008. Available online: https://www.semanticscholar.org/paper/THE-IMPACT-OF-JOB-SATISFACTION-ON-JOB-PERFORMANCE%3a-pushpakumari/7e2b6e2d1b932c9dab6a0ab668e8a42c121d1202 (accessed on 27 June 2022).
- Bakan, I.; Buyukbese, T.; Ersahan, B.; Sezer, B. Effects of Job Satisfaction on Job Performance and Occupational Commitment. Int. J. Manag. Inf. Technol. 2014, 9, 1472–1480. [Google Scholar] [CrossRef]
- Bentley, T.A.; Teo, S.T.T.; McLeod, L.; Tan, F.; Bosua, R.; Gloet, M. The role of organisational support in teleworker wellbeing: A socio-technical systems approach. Appl. Ergon. 2016, 52, 207–215. [Google Scholar] [CrossRef]
- Wang, Y.; Haggerty, N. Individual virtual competence and its influence on work outcomes. J. Manag. Inf. Syst. 2011, 27, 299–334. [Google Scholar] [CrossRef]
- University of Waterloo. Ready for Co-op? A Guide for Developing A Student Self-Assessment Screening Tool. 2008. Available online: https://uwaterloo.ca/work-learn-institute/sites/ca.work-learn-institute/files/uploads/files/development-co-op-student-self-assessment-screening-tool-final-report_revised_june_2021.pdf (accessed on 1 July 2022).
- Ross, J.A. The reliability, validity, and utility of self-assessment. Pract. Assess. Res. Eval. 2006, 11, 10. [Google Scholar]
- Sundstrom, A. Self-Assessment of Knowledge and Abilities. Umea Universitet. 2005. Available online: https://trid.trb.org/view/772205 (accessed on 1 July 2022).
- MacDonald, J.; Williams, R.G.; Rogers, D.A. Self-assessment in simulation-based surgical skills training. Am. J. Surg. 2003, 185, 319–322. [Google Scholar] [CrossRef]
- Hašková, A.; Lukáčová, D.; Noga, H. Teacher’s self-assessment as a part of quality management. Sci. Educ. Today 2019, 9, 156–169. [Google Scholar] [CrossRef]
- Ross, J.A.; Bruce, C.D. Teacher self-assessment: A mechanism for facilitating professional growth. Teach. Teach. Educ. 2007, 23, 146–159. [Google Scholar] [CrossRef]
- Dowpiset, S.; Eamoraphan, S. A Comparative Study of Teacher Self-Assessment on Teacher Quality Among Demographic Factors in Saint Gabriel Foundation’s Schools. 2018. Available online: https://www.semanticscholar.org/paper/A-COMPARATIVE-STUDY-OF-TEACHER-SELF-ASSESSMENT-ON-Dowpiset-Eamoraphan/16cc8f6741f8166c2a0a9f50cf8a0f64aa8b765b (accessed on 1 July 2022).
- Paredes Quijanes, P. Teachers’ Conception of Learner Self-assessment: A Qualitative Interview Study with seven Teachers of English in a Swedish Upper-secondary School. In Ämneslärarprogrammet; University of Gothenburg: Gothenburg, Sweden, 2018. [Google Scholar]
- Van Loon, M. Self-Assessment and Self-Reflection to Measure and Improve Self-Regulated Learning in the Workplace. In Handbook of Vocational Education and Training: Developments in the Changing World of Work; Springer: Berlin/Heidelberg, Germany, 2008; pp. 1–28. [Google Scholar]
- Judge, T.A.; Hurst, C.; Simon, L.S. Does It Pay to Be Smart, Attractive, or Confident (or All Three)? Relationships among General Mental Ability, Physical Attractiveness, Core Self-Evaluations, and Income. J. Appl. Psychol. 2009, 94, 742–755. [Google Scholar] [CrossRef] [Green Version]
- Kammeyer-Mueller, J.D.; Judge, T.A.; Piccolo, R.F. Self-Esteem and Extrinsic Career Success: Test of a Dynamic Model. J. Appl. Psychol. 2008, 57, 204–224. [Google Scholar] [CrossRef]
- Orth, U.; Robins, R.W.; Widaman, K.F. Life-span development of self-esteem and its effects on important life outcomes. J. Pers Soc. Psychol. 2012, 102, 1271–1288. [Google Scholar] [CrossRef] [Green Version]
- Salmela-Aro, K.; Nurmi, J. Self-esteem during university studies predicts career characteristics 10 years later. J. Voca-Tional Behav. 2007, 70, 463–477. [Google Scholar] [CrossRef]
- Trzesniewski, K.H.; Donnellan, M.B.; Moffitt, T.E.; Robins, R.W.; Poulton, R.; Caspi, A. Low self-esteem during adolescence predicts poor health, criminal behavior, and limited economic prospects during adulthood. Dev. Psychol. 2006, 42, 381–390. [Google Scholar] [CrossRef] [PubMed] [Green Version]
- Maslach, C.; Schaufeli, W.; Leiter, M. Job Burnout. Annu. Rev. Psychol. 2001, 52, 397–422. [Google Scholar] [CrossRef] [Green Version]
- Pathardikar, A.; Sahu, S.; Srivastava, A. Self-esteem and Work Engagement influencing Job Satisfaction. Indian J. Commer. 2019, 72, 56–68. [Google Scholar]
- Kim, W.; Hyun, Y.S. The impact of personal resources on turnover intention: The mediating effects of work engagement. Eur. J. Train. Dev. 2017, 41, 705–721. [Google Scholar] [CrossRef]
- Saks, A.M. Antecedents, and consequences of employee engagement. J. Manag. Psychol. 2006, 21, 600–619. [Google Scholar] [CrossRef] [Green Version]
- Fairlie, P. Meaningful Work, Employee Engagement, and Other Key Employee Outcomes: Implications for Human Resource Development. Adv. Dev. Hum. Resour. 2011, 13, 504–521. [Google Scholar] [CrossRef]
- Crawford, E.R.; Rich, B.L.; Buckman, B.; Bergeron, J. The antecedents and drivers of employee engagement. In Employee Engagement in Theory and Practice, 1st ed; Truss, C., Alfes, K., Delbridge, R., Shantz, A., Soane, E., Eds.; Routledge: London, UK, 2013; Volume 1, pp. 57–81. [Google Scholar]
- Rohm, A.J.; Swaminathan, V. A Typology of Online Shoppers Based on shopping Motivations. J. Bus. Res. 2004, 57, 748–757. [Google Scholar] [CrossRef]
- Cammann, C.; Fichman, M.; Jenkins, G.D.; Klesh, J. Michigan Organizational Assessment Questionnaire. In Assessing Organizational Change: A Guide to Methods, Measures, and Practices; Seashore, S.E., Lawler, E.E., Mirvis, P.H., Cammann, C., Eds.; Wiley-Interscience: New York, NY, USA, 1983; pp. 71–138. [Google Scholar]
- Rosenberg, M. Society and the Adolescent Self-Image; Revised ed.; Wesleyan University Press: Middletown, CT, USA, 1989. [Google Scholar]
- Judge, T.A.; Erez, A.; Bono, J.E.; Thoresen, C.J. The Core Self-Evaluations Scale: Development of a measure. Pers. Psychol. 2003, 56, 303–331. [Google Scholar] [CrossRef]
- Safarov, N. Personal experiences of digital public services access and use: Older migrants’ digital choices. Technol. Soc. 2021, 66, 101627. [Google Scholar] [CrossRef]
- Lusoli, W.; Miltgen, C. An Exploratory Survey on Motivations, Perceptions and Acceptance of Risks. Eur. Comm. JRC 2009, 1–84. Available online: https://data.europa.eu/doi/10.2791/68925 (accessed on 30 May 2022).
- Leimeister, J.M.; Österle, H.; Alter, S. Digital services for consumers. Electron Mark. 2014, 24, 255–258. [Google Scholar] [CrossRef] [Green Version]
- Sonhemann, N. New Developments in Digital Services. Policy Dep. Econ. Sci. Qual. Life Policies 2020, 1–39. Available online: https://data.europa.eu/doi/10.2861/853318 (accessed on 30 May 2022).
Figure 1.
Theoretical Model.


Table 1.
The importance of digital services to consumer respondents.
| Score | Frequency | % |
|---|---|---|
| 1 | 2 | 0.7 |
| 3 | 15 | 5.5 |
| 4 | 62 | 22.5 |
| 5 | 196 | 71.3 |
| Total | 275 | 100.0 |
Table 2.
The importance of digital services to employee respondents.
| Score | Frequency | % |
|---|---|---|
| 3 | 17 | 15 |
| 4 | 34 | 30.1 |
| 5 | 62 | 54.9 |
| Total | 113 | 100.0 |
Table 3.
Satisfaction of online consumer respondents through descriptive statistics.
| Statements | N | Mean | Std. Deviation |
|---|---|---|---|
| I see ordering online as a convenience. | 275 | 4.39 | 0.818 |
| The internet is a convenient way to shop. | 275 | 4.32 | 0.841 |
| The internet is often frustrating. | 275 | 2.79 | 0.950 |
| I save a lot of time shopping online | 275 | 3.66 | 0.892 |
| Shopping online is a pleasant experience. | 275 | 3.88 | 0.971 |
| I’d rather buy at the store than wait for delivery. | 275 | 3.35 | 1.050 |
| I like to shop where people know me. | 275 | 3.57 | 0.946 |
| While shopping online, I miss the experience of interacting with people. | 275 | 3.32 | 1.050 |
| I like to have a lot of information before I buy. | 275 | 4.57 | 0.763 |
| I always compare prices. | 275 | 3.93 | 1.068 |
| I plan my purchase carefully. | 275 | 3.60 | 1.100 |
| I buy things I didn’t plan to buy. | 275 | 2.32 | 1.080 |
| I am careful when trying new products. | 275 | 3.73 | 0.911 |
| I enjoy exploring alternative stores. | 275 | 2.90 | 0.848 |
| Exploring new stores is a waste of time. | 275 | 2.14 | 0.919 |
| I like to try new products and brands. | 275 | 3.63 | 0.924 |
| I like to buy the same brand always. | 275 | 3.12 | 0.810 |
Table 4.
Self-assessment of online consumer respondents through descriptive statistics.
| Statements | N | Mean | Std. Deviation |
|---|---|---|---|
| I am convinced that I will achieve the deserved success in life. | 275 | 4.11 | 0.873 |
| Sometimes I feel depressed. | 275 | 1.91 | 1.001 |
| When I try, I usually succeed. | 275 | 4.33 | 0.691 |
| Sometimes when I fail, I feel worthless. | 275 | 1.90 | 0.913 |
| I am successfully completing tasks. | 275 | 4.50 | 0.636 |
| Sometimes I don’t feel in control of my work. | 275 | 2.26 | 1.116 |
| All in all, I’m happy with myself. | 275 | 4.44 | 0.661 |
| I am filled with doubts about my ability. | 275 | 1.68 | 0.940 |
| I determine for myself what will happen in my life. | 275 | 4.04 | 0.958 |
| I don’t feel in control of my career success. | 275 | 2.04 | 1.012 |
| I can deal with most of my problems. | 275 | 4.55 | 0.668 |
| There are times when things seem bleak and hopeless to me. | 275 | 2.69 | 1.292 |
Table 5.
Self-esteem of online consumer respondents through descriptive statistics.
| Statements | N | Mean | Std. Deviation |
|---|---|---|---|
| I feel like a valuable person, at least on an equal footing with others. | 275 | 4.60 | 0.566 |
| I feel I have a number of good qualities. | 275 | 4.49 | 0.630 |
| All in all, I tend to feel like I’ve failed as a person. | 275 | 1.13 | 0.524 |
| I am capable of doing things like most other people. | 275 | 4.55 | 0.561 |
| I feel like I have nothing to be proud of. | 275 | 1.15 | 0.471 |
| I take a positive attitude towards myself. | 275 | 4.18 | 0.798 |
| I am completely satisfied with myself. | 275 | 4.39 | 0.758 |
| I wish I could respect myself more. | 275 | 2.50 | 1.473 |
| Sometimes I feel useless. | 275 | 1.49 | 0.761 |
| From time to time I think I’m not good at all. | 275 | 1.40 | 0.750 |
Table 6.
Satisfaction of employee respondents through descriptive statistics.
| Statements | N | Mean | Std. Deviation |
|---|---|---|---|
| All in all, I am satisfied with my job. | 113 | 4.23 | 0.886 |
| I don’t like my job. | 113 | 1.49 | 0.857 |
| I love doing my job. | 113 | 4.38 | 0.919 |
| I like the people I work with. | 113 | 4.19 | 0.882 |
| I think I must work harder at my job because of the incompetence of the people I work with. | 113 | 2.70 | 1.329 |
| I like to do the tasks I get as work assignments. | 113 | 4.02 | 0.876 |
| I have too many obligations and responsibilities. | 113 | 3.83 | 1.149 |
| I can participate in trainings, webinars, meetings, and field activities. | 113 | 3.84 | 1.293 |
| I get the information, tools, and resources I need to do my job efficiently. | 113 | 4.00 | 1.026 |
| I know what is expected of me at work. | 113 | 4.48 | 0.803 |
| I am allowed/encouraged to make troubleshooting decisions for my customers. | 113 | 4.20 | 0.937 |
| I wouldn’t think about quitting my job. | 113 | 4.04 | 1.220 |
| I would consider leaving my job if I find others with a better salary. | 113 | 2.66 | 1.480 |
| I would consider leaving my job if I find others with greater opportunities for advancement. | 113 | 2.92 | 1.471 |
| I feel that my work has value for the community. | 113 | 4.19 | 0.915 |
| There are other work skills I would like to learn. | 113 | 4.37 | 0.847 |
| My superior is competent in doing his job. | 113 | 4.12 | 1.127 |
| My superior shows interest in my feelings. | 113 | 3.78 | 1.273 |
| I can rely on my superior. | 113 | 4.00 | 1.195 |
| I feel that I am paid fairly for the work I do. | 113 | 3.72 | 1.243 |
| I am not happy with the benefits I receive. | 113 | 2.44 | 1.274 |
| I do not feel that my work is appreciated. | 113 | 2.27 | 1.262 |
Table 7.
Self-assessment of employee respondents through descriptive statistics.
| Statements | N | Mean | Std. Deviation |
|---|---|---|---|
| I am convinced that I will achieve the deserved success in life. | 113 | 3.93 | 1.015 |
| Sometimes I feel depressed. | 113 | 2.26 | 1.273 |
| When I try, I usually succeed. | 113 | 4.24 | 0.711 |
| Sometimes when I fail, I feel worthless. | 113 | 2.06 | 1.136 |
| I am successfully completing tasks. | 113 | 4.47 | 0.584 |
| Sometimes I don’t feel in control of my work. | 113 | 2.56 | 1.274 |
| All in all, I’m happy with myself. | 113 | 4.27 | 0.756 |
| I am filled with doubts about my ability. | 113 | 1.78 | 1.058 |
| I determine for myself what will happen in my life. | 113 | 3.90 | 1.026 |
| I don’t feel in control of my career success. | 113 | 2.32 | 1.255 |
| I can deal with most of my problems. | 113 | 4.30 | 0.755 |
| There are times when things seem bleak and hopeless to me. | 113 | 2.69 | 1.350 |
Table 8.
Self-esteem of employee respondents through descriptive statistics.
| Statements | N | Mean | Std. Deviation |
|---|---|---|---|
| I feel like a valuable person, at least on an equal footing with others. | 113 | 4.59 | 0.663 |
| I feel I have a number of good qualities. | 113 | 4.63 | 0.570 |
| All in all, I tend to feel like I’ve failed as a person. | 113 | 1.32 | 0.782 |
| I am capable of doing things like most other people. | 113 | 4.59 | 0.636 |
| I feel like I have nothing to be proud of. | 113 | 1.27 | 0.655 |
| I take a positive attitude towards myself. | 113 | 4.50 | 0.721 |
| I am completely satisfied with myself. | 113 | 4.44 | 0.719 |
| I wish I could respect myself more. | 113 | 2.56 | 1.375 |
| Sometimes I feel useless. | 113 | 1.68 | 1.011 |
| From time to time I think I’m not good at all. | 113 | 1.57 | 0.925 |
Table 9.
Non-response bias test.
| Variable | Early Respondents Mean/Standard Deviation | Late Respondents Mean/Standard Deviation | t-Value | p-Value |
|---|---|---|---|---|
| Online consumer satisfaction | 2.8615/1.2184 | 2.8308/0.55877 | 0.258 | 0.797 |
| Online consumer self-assessment | 4.5385/0.57268 | 4.6308/0.50021 | −1.297 | 0.197 |
| Online consumer self-esteem | 4.6107/0.75010 | 4.6260/0.48573 | −0.192 | 0.848 |
| Employee satisfaction | 3.6923/1.14693 | 3.5308/0.50098 | 1.418 | 0.159 |
| Employee self-assessment | 2.3538/1.29914 | 1.9692/0.71461 | 2.853 | 0.063 |
| Employee self-esteem | 4.6107/0.72930 | 4.5115/0.50179 | 1.184 | 0.239 |
Table 10.
Rotated component matrix and communalities for the satisfaction of consumer respondents.
| Statements | Component | Communalities | ||||
|---|---|---|---|---|---|---|
| Convenience | Information | Experience | Exploring | Buying | Extraction | |
| The internet is a convenient way to shop. | 0.918 | 0.855 | ||||
| I see ordering online as a convenience. | 0.914 | 0.839 | ||||
| I save a lot of time shopping online. | 0.775 | 0.676 | ||||
| Shopping online is a pleasant experience. | 0.758 | 0.740 | ||||
| I like to have a lot of information before I buy. | 0.883 | 0.789 | ||||
| I always compare prices. | 0.778 | 0.764 | ||||
| I plan my purchase carefully. | 0.735 | 0.815 | ||||
| While shopping online, I miss the experience of interacting with people. | 0.829 | 0.732 | ||||
| I like to shop where people know me. | 0.801 | 0.783 | ||||
| I’d rather buy at the store than wait for delivery. | 0.787 | 0.737 | ||||
| I like to try new products and brands. | −0.857 | 0.789 | ||||
| Exploring new stores is a waste of time. | 0.745 | 0.675 | ||||
| I like to buy the same brand always. | 0.838 | 0.839 | ||||
| The internet is often frustrating. | 0.659 | 0.724 | ||||
Table 11.
Total variance for the satisfaction of consumer respondents.
| Total Variance Explained | |||||||||
|---|---|---|---|---|---|---|---|---|---|
| Component | Initial Eigenvalues | Extraction Sums of Squared Loadings | Rotation Sums of Squared Loadings | ||||||
| Total | % of Variance | Cumulative % | Total | % of Variance | Cumulative % | Total | % of Variance | Cumulative % | |
| 1 | 4.371 | 31.220 | 31.220 | 4.371 | 31.220 | 31.220 | 3.380 | 24.140 | 24.140 |
| 2 | 2.716 | 19.400 | 50.619 | 2.716 | 19.400 | 50.619 | 2.222 | 15.870 | 40.009 |
| 3 | 1.431 | 10.220 | 60.840 | 1.431 | 10.220 | 60.840 | 2.213 | 15.807 | 55.817 |
| 4 | 1.210 | 8.641 | 69.480 | 1.210 | 8.641 | 69.480 | 1.663 | 11.876 | 67.692 |
| 5 | 1.029 | 7.349 | 76.829 | 1.029 | 7.349 | 76.829 | 1.279 | 9.137 | 76.829 |
| 6 | 0.683 | 4.875 | 81.705 | ||||||
| 7 | 0.573 | 4.094 | 85.799 | ||||||
| 8 | 0.457 | 3.264 | 89.063 | ||||||
| 9 | 0.413 | 2.950 | 92.013 | ||||||
| 10 | 0.328 | 2.344 | 94.357 | ||||||
| 11 | 0.302 | 2.154 | 96.511 | ||||||
| 12 | 0.211 | 1.507 | 98.018 | ||||||
| 13 | 0.183 | 1.309 | 99.327 | ||||||
| 14 | 0.094 | 0.673 | 100.000 | ||||||
Table 12.
Rotated component matrix and communalities for self-assessment of consumer respondents.
| Statements | Component | Communalities | ||
|---|---|---|---|---|
| Ability | Control | Success | Extraction | |
| I am successfully completing tasks. | 0.859 | 0.816 | ||
| When I try, I usually succeed. | 0.825 | 0.714 | ||
| I can deal with most of my problems. | 0.812 | 0.756 | ||
| All in all, I’m happy with myself. | 0.793 | 0.699 | ||
| I am filled with doubts about my ability. | −0.764 | 0.646 | ||
| I determine for myself what will happen in my life. | 0.757 | 0.597 | ||
| Sometimes I feel depressed. | −0.702 | 0.715 | ||
| Sometimes I don’t feel in control of my work. | −0.672 | 0.635 | ||
| Sometimes when I fail, I feel worthless. | −0.602 | 0.627 | ||
| There are times when things seem bleak and hopeless to me. | 0.822 | 0.733 | ||
| I don’t feel in control of my career success. | 0.798 | 0.781 | ||
| I am convinced that I will achieve the deserved success in life. | 0.899 | 0.815 | ||
Table 13.
Total variance for self-assessment of consumer respondents.
| Total Variance Explained | |||||||||
|---|---|---|---|---|---|---|---|---|---|
| Component | Initial Eigenvalues | Extraction Sums of Squared Loadings | Rotation Sums of Squared Loadings | ||||||
| Total | % of Variance | Cumulative % | Total | % of Variance | Cumulative % | Total | % of Variance | Cumulative % | |
| 1 | 5.745 | 47.872 | 47.872 | 5.745 | 47.872 | 47.872 | 5.197 | 43.311 | 43.311 |
| 2 | 1.560 | 13.000 | 60.872 | 1.560 | 13.000 | 60.872 | 2.001 | 16.679 | 59.990 |
| 3 | 1.229 | 10.245 | 71.117 | 1.229 | 10.245 | 71.117 | 1.335 | 11.127 | 71.117 |
| 4 | 0.643 | 5.355 | 76.472 | ||||||
| 5 | 0.556 | 4.630 | 81.101 | ||||||
| 6 | 0.478 | 3.980 | 85.081 | ||||||
| 7 | 0.417 | 3.472 | 88.553 | ||||||
| 8 | 0.388 | 3.234 | 91.787 | ||||||
| 9 | 0.320 | 2.671 | 94.458 | ||||||
| 10 | 0.261 | 2.173 | 96.631 | ||||||
| 11 | 0.221 | 1.839 | 98.470 | ||||||
| 12 | 0.184 | 1.530 | 100.000 | ||||||
Table 14.
Rotated component matrix and communalities for the self-esteem of consumer respondents.
| Statements | Component | Communalities | |
|---|---|---|---|
| Satisfaction | Failure | Extraction | |
| I feel I have several good qualities. | 0.877 | 0.776 | |
| I am completely satisfied with myself. | 0.847 | 0.772 | |
| I can do things like most other people. | 0.816 | 0.669 | |
| I take a positive attitude towards myself. | 0.796 | 0.665 | |
| I feel like a valuable person, at least on an equal footing with others. | 0.785 | 0.677 | |
| I wish I could respect myself more. | 0.624 | 0.605 | |
| Sometimes I feel useless. | 0.761 | 0.647 | |
| All in all, I tend to feel like I’ve failed as a person. | 0.714 | 0.515 | |
| I feel like I have nothing to be proud of. | 0.686 | 0.581 | |
| From time to time I think I’m not good at all. | 0.635 | 0.506 | |
Table 15.
Total variance for the self-esteem of consumer respondents.
| Total Variance Explained | |||||||||
|---|---|---|---|---|---|---|---|---|---|
| Component | Initial Eigenvalues | Extraction Sums of Squared Loadings | Rotation Sums of Squared Loadings | ||||||
| Total | % of Variance | Cumulative % | Total | % of Variance | Cumulative % | Total | % of Variance | Cumulative % | |
| 1 | 4.216 | 42.160 | 42.160 | 4.216 | 42.160 | 42.160 | 4.077 | 40.770 | 40.770 |
| 2 | 2.198 | 21.979 | 64.139 | 2.198 | 21.979 | 64.139 | 2.337 | 23.369 | 64.139 |
| 3 | 0.717 | 7.168 | 71.307 | ||||||
| 4 | 0.620 | 6.197 | 77.505 | ||||||
| 5 | 0.557 | 5.575 | 83.079 | ||||||
| 6 | 0.450 | 4.495 | 87.575 | ||||||
| 7 | 0.432 | 4.316 | 91.890 | ||||||
| 8 | 0.364 | 3.639 | 95.530 | ||||||
| 9 | 0.267 | 2.674 | 98.204 | ||||||
| 10 | 0.180 | 1.796 | 100.000 | ||||||
Table 16.
Rotated component matrix and communalities for the satisfaction of employee respondents.
| Statements | Component | Communalities | ||||||
|---|---|---|---|---|---|---|---|---|
| Satisfaction | Superior | Resources | Benefit | Quitting | Colleagues | Obligation | Extraction | |
| I love doing my job. | 0.842 | 0.759 | ||||||
| I don’t like my job. | −0.761 | 0.729 | ||||||
| All in all, I am satisfied with my job. | 0.737 | 0.782 | ||||||
| I like to do the tasks I get as work assignments. | 0.685 | 0.591 | ||||||
| I wouldn’t think about quitting my job. | 0.528 | 0.778 | ||||||
| My superior is competent in doing his job. | 0.893 | 0.873 | ||||||
| I can rely on my superior. | 0.886 | 0.885 | ||||||
| My superior shows interest in my feelings. | 0.882 | 0.884 | ||||||
| I get the information, tools and resources I need to do my job efficiently. | 0.729 | 0.682 | ||||||
| I can participate in trainings, webinars, meetings and field activities. | 0.728 | 0.606 | ||||||
| I know what is expected of me at work. | 0.647 | 0.655 | ||||||
| I feel that my work has value for the community. | 0.568 | 0.695 | ||||||
| I am allowed/encouraged to make troubleshooting decisions for my customers. | 0.533 | 0.682 | ||||||
| I am not happy with the benefits I receive. | 0.878 | 0.829 | ||||||
| I feel that I am paid fairly for the work I do. | −0.671 | 0.811 | ||||||
| I do not feel that my work is appreciated. | 0.665 | 0.807 | ||||||
| I would consider leaving my job if I find others with greater opportunities for advancement. | 0.812 | 0.795 | ||||||
| I would consider leaving my job if I find others with a better salary. | 0.704 | 0.788 | ||||||
| There are other work skills I would like to learn. | 0.655 | 0.689 | ||||||
| I think I have to work harder at my job because of the incompetence of the people I work with. | −0.797 | 0.768. | ||||||
| I like the people I work with. | 0.755 | 0.769 | ||||||
| I have too many obligations and responsibilities. | 0.857 | 0.803 | ||||||
Table 17.
Total variance for satisfaction of employee respondents.
| Total Variance Explained | |||||||||
|---|---|---|---|---|---|---|---|---|---|
| Component | Initial Eigenvalues | Extraction Sums of Squared Loadings | Rotation Sums of Squared Loadings | ||||||
| Total | % of Variance | Cumulative % | Total | % of Variance | Cumulative % | Total | % of Variance | Cumulative % | |
| 1 | 7.919 | 35.996 | 35.996 | 7.919 | 35.996 | 35.996 | 3.594 | 16.337 | 16.337 |
| 2 | 2.032 | 9.234 | 45.230 | 2.032 | 9.234 | 45.230 | 3.106 | 14.120 | 30.457 |
| 3 | 1.800 | 8.183 | 53.413 | 1.800 | 8.183 | 53.413 | 2.641 | 12.006 | 42.463 |
| 4 | 1.502 | 6.825 | 60.239 | 1.502 | 6.825 | 60.239 | 2.350 | 10.682 | 53.145 |
| 5 | 1.263 | 5.739 | 65.978 | 1.263 | 5.739 | 65.978 | 2.053 | 9.333 | 62.477 |
| 6 | 1.126 | 5.119 | 71.097 | 1.126 | 5.119 | 71.097 | 1.744 | 7.930 | 70.407 |
| 7 | 1.020 | 4.635 | 75.732 | 1.020 | 4.635 | 75.732 | 1.172 | 5.326 | 75.732 |
| 8 | 0.806 | 3.665 | 79.397 | ||||||
| 9 | 0.635 | 2.888 | 82.285 | ||||||
| 10 | 0.631 | 2.867 | 85.152 | ||||||
| 11 | 0.561 | 2.551 | 87.703 | ||||||
| 12 | 0.445 | 2.021 | 89.724 | ||||||
| 13 | 0.375 | 1.702 | 91.427 | ||||||
| 14 | 0.358 | 1.627 | 93.054 | ||||||
| 15 | 0.287 | 1.307 | 94.361 | ||||||
| 16 | 0.261 | 1.185 | 95.545 | ||||||
| 17 | 0.226 | 1.028 | 96.573 | ||||||
| 18 | 0.211 | 0.958 | 97.531 | ||||||
| 19 | 0.191 | 0.867 | 98.398 | ||||||
| 20 | 0.133 | 0.604 | 99.002 | ||||||
| 21 | 0.131 | 0.594 | 99.596 | ||||||
| 22 | 0.089 | 0.404 | 100.000 | ||||||
Table 18.
Rotated component matrix and communalities for self-assessment of employee respondents.
| Statements | Component | Communalities | ||
|---|---|---|---|---|
| Worth | Ability | Success | Extraction | |
| I can deal with most of my problems. | 0.792 | 0.671 | ||
| All in all, I’m happy with myself. | 0.736 | 0.680 | ||
| I am convinced that I will achieve the deserved success in life. | 0.686 | 0.595 | ||
| I determine for myself what will happen in my life. | 0.678 | 0.510 | ||
| Sometimes when I fail, I feel worthless. | 0.822 | 0.686 | ||
| There are times when things seem bleak and hopeless to me. | 0.731 | 0.651 | ||
| Sometimes I don’t feel in control of my work. | 0.682 | 0.508 | ||
| I am filled with doubts about my ability. | 0.641 | 0.627 | ||
| I am successfully completing tasks. | 0.851 | 0.758 | ||
| When I try, I usually succeed. | 0.769 | 0.699 | ||
Table 19.
Total variance for self-assessment of employee respondents.
| Total Variance Explained | |||||||||
|---|---|---|---|---|---|---|---|---|---|
| Component | Initial Eigenvalues | Extraction Sums of Squared Loadings | Rotation Sums of Squared Loadings | ||||||
| Total | % of Variance | Cumulative % | Total | % of Variance | Cumulative % | Total | % of Variance | Cumulative % | |
| 1 | 3.905 | 39.050 | 39.050 | 3.905 | 39.050 | 39.050 | 2.349 | 23.485 | 23.485 |
| 2 | 1.427 | 14.265 | 53.315 | 1.427 | 14.265 | 53.315 | 2.210 | 22.095 | 45.581 |
| 3 | 1.052 | 10.523 | 63.838 | 1.052 | 10.523 | 63.838 | 1.826 | 18.258 | 63.838 |
| 4 | 0.828 | 8.285 | 72.123 | ||||||
| 5 | 0.691 | 6.906 | 79.029 | ||||||
| 6 | 0.524 | 5.238 | 84.267 | ||||||
| 7 | 0.514 | 5.142 | 89.409 | ||||||
| 8 | 0.429 | 4.287 | 93.696 | ||||||
| 9 | 0.345 | 3.453 | 97.149 | ||||||
| 10 | 0.285 | 2.851 | 100.000 | ||||||
Table 20.
Rotated component matrix and communalities for the self-esteem of employee respondents.
| Statements | Component | Communalities | |
|---|---|---|---|
| Failure | Value | Extraction | |
| From time to time, I think I’m not good at all. | 0.819 | 0.673 | |
| Sometimes I feel useless. | 0.807 | 0.652 | |
| I take a positive attitude towards myself. | −0.778 | 0.757 | |
| I am completely satisfied with myself. | −0.730 | 0.675 | |
| I feel like I have nothing to be proud of. | 0.726 | 0.596 | |
| I feel I have several good qualities. | 0.856 | 0.737 | |
| I can do things like most other people. | 0.750 | 0.589 | |
| I feel like a valuable person, at least on an equal footing with others. | 0.732 | 0.632 | |
Table 21.
Total variance for the self-esteem of employee respondents.
| Total Variance Explained | |||||||||
|---|---|---|---|---|---|---|---|---|---|
| Component | Initial Eigenvalues | Extraction Sums of Squared Loadings | Rotation Sums of Squared Loadings | ||||||
| Total | % of Variance | Cumulative % | Total | % of Variance | Cumulative % | Total | % of Variance | Cumulative % | |
| 1 | 3.970 | 49.628 | 49.628 | 3.970 | 49.628 | 49.628 | 3.112 | 38.903 | 38.903 |
| 2 | 1.341 | 16.758 | 66.386 | 1.341 | 16.758 | 66.386 | 2.199 | 27.484 | 66.386 |
| 3 | 0.663 | 8.286 | 74.672 | ||||||
| 4 | 0.574 | 7.177 | 81.850 | ||||||
| 5 | 0.523 | 6.534 | 88.384 | ||||||
| 6 | 0.405 | 5.068 | 93.452 | ||||||
| 7 | 0.338 | 4.225 | 97.677 | ||||||
| 8 | 0.186 | 2.323 | 100.000 | ||||||
Table 22.
Summary of regression analysis.
| Hypothesis | Regression Weights | Beta Coefficient | R2 | F | t-Value | p-Value | Supported |
|---|---|---|---|---|---|---|---|
| H1 | OCS->DS | 0.196 | 22.059 | <0.001 | Yes | ||
| Convenience->DS | 0.334 | 5.446 | <0.001 | ||||
| Experience->DS | −0.294 | −4.903 | <0.001 | ||||
| Information->DS | −0.094 | −1.411 | 0.159 | ||||
| H2 | OCSA->DS | 0.004 | 1.009 | 0.316 | No | ||
| Ability->DS | 0.061 | 1.005 | 0.316 | ||||
| H3 | OCSE->DS | 0.086 | 12.208 | <0.001 | Yes | ||
| Failure->DS | −0.197 | −2.345 | 0.020 | ||||
| Satisfaction->DS | 0.262 | 4.254 | <0.001 | ||||
| H4 | ES->DS | 0.070 | 1.603 | 0.165 | No | ||
| Satisfaction->DS | 0.178 | 1.377 | 0.171 | ||||
| Superior->DS | −0.069 | −0.647 | 0.519 | ||||
| Resources->DS | 0.169 | 1.397 | 0.165 | ||||
| Benefit->DS | −0.031 | −.300 | 0.765 | ||||
| Quitting->DS | 0.107 | 0.965 | 0.337 | ||||
| H5 | ESA->DS | 0.007 | 0.396 | 0.674 | No | ||
| Worth->DS | 0.090 | 0.861 | 0.391 | ||||
| Ability->DS | 0.060 | 0.571 | 0.569 | ||||
| H6 | ESE->DS | 0.087 | 5.213 | 0.007 | Yes | ||
| Failure->DS | −0.117 | −1.280 | 0.203 | ||||
| Value->DS | 0.264 | 2.893 | 0.005 |
Publisher’s Note: MDPI stays neutral with regard to jurisdictional claims in published maps and institutional affiliations. |
© 2022 by the authors. Licensee MDPI, Basel, Switzerland. This article is an open access article distributed under the terms and conditions of the Creative Commons Attribution (CC BY) license (https://creativecommons.org/licenses/by/4.0/).
Share and Cite
MDPI and ACS Style
Zelenović, J.; Zelenović, V. Managing Consumers and Employees through Digital Services. Sustainability 2022, 14, 8824. https://doi.org/10.3390/su14148824
AMA Style
Zelenović J, Zelenović V. Managing Consumers and Employees through Digital Services. Sustainability. 2022; 14(14):8824. https://doi.org/10.3390/su14148824
Chicago/Turabian StyleZelenović, Jelena, and Vera Zelenović. 2022. "Managing Consumers and Employees through Digital Services" Sustainability 14, no. 14: 8824. https://doi.org/10.3390/su14148824
Note that from the first issue of 2016, this journal uses article numbers instead of page numbers. See further details here.