
Using Regression Model to Develop Green Building Energy Simulation by BIM Tools
by
 , ,
, ,
Faham Tahmasebinia
1,*, 
Ruifeng Jiang
1,
Samad Sepasgozar
2 ,
,
Jinlin Wei
1,
Yilin Ding
1 and
Hongyi Ma
2 1
School of Civil Engineering, The University of Sydney, Sydney, NSW 2006, Australia
2
School of Built Environment, University of New South Wales, Sydney, NSW 2052, Australia
*
Author to whom correspondence should be addressed.
Sustainability 2022, 14(10), 6262; https://doi.org/10.3390/su14106262
Submission received: 29 March 2022
/
Revised: 10 May 2022
/
Accepted: 14 May 2022
/
Published: 20 May 2022
(This article belongs to the Special Issue New Evidences of Indoor Thermal Comfort in Residential and Tertiary Buildings: Design and Evaluation Methods)
Abstract
:Energy consumption in the building sector poses a huge burden in terms of global energy and pollution. Recent advancements in building information modelling and simulating building energy performance (BEP) have provided opportunities for energy optimization. The use of building information modelling (BIM) also has increased significantly in the last decade based on the requirement to accommodate and manage data in buildings. By using the data, some building information modelling tools have developed the function of energy analysis. This paper aims to identify design parameters critical to BEP to assist architects in the initial stages of building design and to investigate their relationship. The outcomes of the prototype model’s energy simulations were then used to construct multilinear regression models. For the rest of the independent building design variables, linear regression models are used to analyse the relationship between it and energy consumption. It was concluded that, in the same building conditions, diamond-shaped buildings have the highest energy consumption, while triangle-shaped buildings showed the most efficient energy performance through energy simulations for seven fundamental prototype building models based on Autodesk Kits, Green Building Studio (GBS) with a Doe-2 engine. In addition, the developed regression models are validated to within 10% error via a case study of the ABS building. At the end of this paper, recommendations are provided on energy optimisation for the initial stages of building design. The parametric analysis of design variables in this study contributed to the total energy consumption at the early phases of design and recommendations on energy optimization.
1. Introduction
1.1. Background
Currently, the building sector is responsible for around 30% of the world’s total energy consumption, imposing a significant burden on energy consumption and environmental pollution [1]. In addition, global warming is also aggravated by the building sector because it produces a large amount of greenhouse gas emissions. According to [2], the building sector produces around 39% of global carbon emissions, and most (28%) of these come from the operation phase. It is important because countries are committed to sustainable development goals (SDG), and there is a strong connection between the building sector and some key SDGs including SDG 7 (Affordable and Clean Energy), SDG 9 (Industry, Innovation and Infrastructure), SDG 11 (Sustainable Cities and Communities) and SDG 13 (Climate Action). Hence, appropriate strategies to improve building sustainability should be considered. For decades, research has been conducted on the sustainability of building performance to successfully optimize building energy consumption. However, correctly estimating energy use throughout the design phase remains a complicated issue. Since building energy consumption is highly dependent on a variety of design parameters and objective factors and necessitates extensive simulations, engineers must invest significant effort in upfront data analysis [3]. Thus, seven fundamental building shapes are modelled in this paper to evaluate and validate the effect of design variables on energy consumption.
The simulation of energy consumption is often linked to building information modelling (BIM). Through BIM energy simulation, the performance of the building is optimized. On the one hand, BIM’s inclusion of a large set of building data and its modelling of energy consumption will play a crucial role in the development of energy sustainability. On the other hand, statistical regression models will provide analysis and prediction of energy data. The combination of BIM and regression modelling is, therefore, about finding factors that will optimize the energy consumption of buildings and make recommendations.
The main purpose of this study is to identify design variables that are critical to building energy performance and the regression relationships between them. To be more specific, Building Energy Performance Simulation (BEPS) tools based on BIM, for example, Autodesk software, was used to build prototypes and simulate energy usage. Additionally, computer mathematical techniques such as the Monte Carlo simulation were utilized to assist in simulating energy usage for various building layouts [4]. Additionally, a variety of statistical tools, including the programming language R, were employed to build a set of linear regression equations for parametric and sensitivity analyses. Finally, 13 categories of critical design parameters were investigated in detail, including window-to-wall ratio (WWR), wall construction, roof construction, infiltration, lighting efficiency, plug load efficiency, heating, ventilation and air-conditioning (HVAC) type, operating schedule, internal loads, envelope, building form, daylighting, and occupancy and building orientation.
1.2. Problem Definition
As of 2007, static energy analysis was still widely used, although some dynamic energy simulation software had been developed by researchers [5]. Today, several BIM tools are available for energy analysis of buildings, which allows for better information transfer between BIM tools and energy simulation software and reduces information leakage. The use of BIM to analyze building energy consumption is a new trend that remains to be explored. To engage building practitioners in energy optimization, this paper combines BIM with statistical knowledge to provide further analysis of the factors that influence building energy consumption.
1.3. Objectives
The main objective of this paper is to gain energy information and settings from BIM tools. For influential variables, the paper will use statistical methods to perform regression analysis and further discuss the accuracy of these variables. Revit will be used as the main modelling tool during the experiment, and the modelling results from Revit will be poured into Insight and Green Building Studio (GBS) for analysis. The design variables will be determined during modelling procedures. Finally, the impact of building variables on building energy consumption will be analyzed based on known energy data.
In a word, the main objectives of this thesis are as follows:
- To investigate and proficiently apply the modelling or data analysis tools required for the thesis, such as “Autodesk Kits” and R-Programming;
- To conduct energy simulations for seven fundamental prototype building models in addition to the case building;
- To develop standardized regression coefficients and conduct an analysis of the sensitivity of design parameters to energy optimization in buildings;
- To use a specific case study to validate the regression models;
- To outline energy optimization recommendations that can be provided to engineers throughout the initial stages of building design.
2. Literature Review
2.1. Introduction
To improve the energy performance that is used for building service, the sustainable decision-making of building design can be supported by using BIM software and regression models. Actual project experience has also demonstrated that the BIM-based method allows for the use of spatial simulations of the entire building rather than the zone-based models that are traditionally used [5]. Therefore, it is important to analyze building energy performance parametrically and statistically.
2.2. Future Directions of BIM
Although building construction based on BIM has increased in past decades, green-building researchers and operators still need to improve their awareness regarding the application of BIM to a certain extent. The building construction industry realizes that there should be an urgent connection built between green-building and BIM. Namely, project phases, green attributes, and BIM attributes are three basic dimensions of the “Green BIM Triangle”; they are reflected in green building lifecycle contribution and application, distinct functions of environmental sustainability analysis, and the integration of green building assessments (GBA), respectively [6].
Regarding the past research on BIM building simulations, the results of critical reviews and future perspectives on using BIM in green buildings are as follows: (1) BIM is a necessary modelling tool for the whole building lifecycle, especially for the cost, construction, facility, and operation management. Therefore, it increases various industries and stakeholders’ connection, communication, and cooperation when managing a green building; (2) The energy systems can be easier to analyse; (3) BIM applications supported the GBA in potentially in managing the documentation and assessments procedures.
2.3. Needs to Address Multiple Linear Regression
Based on the study of [7], experimental studies based on a regression model have shown the relationship between external climate conditions and building energy consumption, and this model has also proved it to be useful for monitoring and estimating the energy consumption of existing buildings. To further discuss the accuracy of multiple regression, multiple linear regression (MLR) should also illustrate the residuals from its best-fit regression equation, which helps to determine whether the linear model satisfies the relevant assumptions [1]. For the regression model of buildings, more attention should be paid to those variables that have a greater impact on building energy consumption, and these variables should be extracted for further research [8].
2.4. Application in Building Energy Simulation
Regression-prediction and DOE-simulation were used in HVAC systems to predict annual building energy usage with a difference within 10% [7]. In this research, to assess the dynamic energy interactions between external climate, building envelope, and HVAC systems, the computerized energy simulation was used as a technique. At the same time, this computerized simulator provided mathematical and statistical validation for the performance-based design and analysis of buildings, ensuring that the analysis and research work were on the right track.
From a probabilistic energy model that used an inverse analysis of parameter estimation, MLR is also used to deduce the distribution of parameters if the linear regression equation was established [8].
In 2014, the researchers tended to use the software of DOE-2 simulation (eQUEST) with Monte Carlo simulation and regression equations to estimate building energy performance [1]. It demonstrated a simple model to quantitatively analyze the energy consumption in a commercial building. This study investigated how the shapes of the building affect its energy consumption. MLR models were able to predict annual energy consumption through a parametric analysis. In its regression simulation, the impacts of 17 design variables were fit into seven different building shapes to predict the annual energy consumption. The first step of establishing the regression equation is to generate a large database through the study of several parameters, and then process the obtained data and establish the most appropriate regression equation with the mathematical model. In MLR simulation, the combined effects of interaction representation factors on dependent variables need to be considered [1]. This is called correlation coefficient analysis.
2.5. Design Variables
In 2003, Pessenlehner and Mahdavi [9] found that the shape and orientation of the building have a critical impact on thermal performance and energy consumption. Moreover, geometric factors are also closely related to the heating-cooling energy demand of a building. Building shape coefficient and passive volume ratio were proposed in 2005 by [10] to be used as an index for studying energy optimization. In 2009, [11] identified relative compactness, WWR, and glazing type as three key factors affecting building energy consumption. As regards building orientation, its impact on energy consumption depends on the geographical location of the construction and the solar trajectory [12]. During the simulation, the orientation parameters allow the building to be rotated to cover all orientations, and the extent of energy optimization can be analysed based on a random sample of orientation parameters [3].
The building envelope, as a barrier separating the interior of the building from the exterior, is a key factor in determining and controlling the quality of indoor conditions. The most significant components of the building envelope, such as walls, fenestration, roof, and thermal insulation, play a critical role in building energy optimization. Since the 1990s, many studies based on building energy simulations have been conducted to analyze the impact of the building envelope on energy consumption [13]. In determining the design variables related to the building envelope, the detailed model of the building envelope developed by [13] can be used as a reference. The variables most relevant to heat absorption and solar absorption should be selected according to preference. Furthermore, there have been significant advances in recent years in research on advanced and sustainable materials for the building envelope, so the range of design variables will be even wider [14].
2.6. Recent Research on the Relationship between Building Parameters and Building Energy Performance
Table 1 summarizes the research on BIM and energy simulation in recent years. These articles provide inspiration for the methodology and simulation process of this study.
With the rapid development of urbanization, the issue of building energy and pollution has become a topic of research interest. There are a number of strategies that could be implemented to address this issue; and the green building is one of the potentially available methods. Generally, a green building is an environmentally friendly building that can not only decrease its passive influence but also provide positive effects on the environment during its life cycle [25]. It is a critical step to choose the suitable building parameters, such as materials, envelope or inside structures, and the ratio of window to wall etc., for achieving a green building because those building parameters have a significant impact on the building's energy consumption. However, it is not easy to evaluate the energy impact of every single parameter of a building, since a building contains a large amount of information that needs to be considered.
BIM technology is considered a novel tool to promote the building analysis process. According to [26], BIM is a visual, reusable, interactive building information technology based on business processes associated with construction projects.
Many researchers and scholars have used BIM as an energy analysis tool to identify the crucial building parameters which may affect building energy performance. Alothman and Ashour [15] found that BIM could make an effective contribution to helping designers choose proper materials and components with better energy performance in the early design stages. In the research of [15], Autodesk Revit 2018 and GBS were utilized as building modeling and energy consumption measuring tools for analyzing the energy performance effect of various building components. They found that wall and HVAC systems contribute the highest impact on energy performance (0.21% and 0.19%, respectively), while a low contribution (0.07% and 0.11%) comes from the orientation and the roof. Amani and Reza Soroush [20] examined the utilization of BIM for evaluating the impact of the building components on building energy consumption in a mild climate zone. They then found that applying BIM to adjust the design parameters, which can affect building energy consumption, is an effective way to decrease energy cost, and the HVAC system usually contributes the most impact on building energy consumption. Khahro, Kumar [16] also conducted an investigation to evaluate the positive effect of BIM on sustainable decision-making of the green building project. The questionnaire was designed to collect data on the benefits of BIM integration from construction sector practitioners; then SPSS version 24 was applied to analyze the data. In the last stage, they made a case study for energy analysis based on BIM and GBS to prove the data collected. They found that BIM and GBS can effectively provide optimized results by alternative trials in the early design stage for a green building. Unlike the studies above, Yakut and Esen [17] evaluated how building design parameters affect the energy consumption in hot-humid climate zones, and Autodesk Revit and GBS are used for building modeling and energy performance analysis. After the analysis, they pointed out that the HVAC system is the main source of effect for energy consumption and the process of energy performance analysis can be significantly accelerated by the application of BIM in the design process because design alternatives can be easily established. Changsaar and Abidin [23] investigated the probability of utilizing BIM to optimize building energy performance and identify the main types of equipment that could affect the energy consumption of an eco-home. They also applied Autodesk Revit 2018 and GBS for 3D modeling and optimized energy analysis, respectively. In the summary of their research, they pointed out that the overall energy performance measurements can be effectively improved by energy performance analysis by the integration of BIM and GBS. Furthermore, the highest percentage of energy consumption was from the air conditioner (about 40%) in the case building, while the equipment with the lowest energy needs was the smart ceiling fans.
Compared to other researchers, Singh and Sadhu [19] considered more factors, including weather and climate condition, the building network, and internal and external parameters of buildings, etc., which may influence building energy efficiency. The result of their shows that the building lifecycle budget can be affected by the external or internal configuration changes of the structure; the location of the building relative to the sun’s path determines the building’s ability to get heat from solar energy; Changing the window to wall ratio (WWR) plays an important role in optimizing building energy performance. The research of [21] developed a framework to improve the building energy consumption management in different climatic conditions based on BIM integration. They then noted that building energy consumption can be significantly influenced by the type of building design and the climate data, and the WWR has more influence on building energy consumption than using super-high insulation building components. In order to improve the decision-making of energy optimization for existing buildings, [22] developed an innovative framework based on the integration of mathematical optimization, BIM, and LCA. After energy simulation by GBS, they found that using the developed framework can reduce service life costs and energy consumption for the studied case building by 24–58%. Wang and Guo [24] evaluated the availability of using BIM big data in Building Digital Twins for building energy efficiency. They developed a simulating experiment and used some approaches including DL, DFA and BPNN, etc. to achieve the comprehensive utilization of BIM and Digital Twins. The final result of the research showed that 92.38% of residents are satisfied with the environmental impact of the case building.
Suitable energy analysis software can not only provide accurate analysis results, but it can also improve the efficiency of the analysis. In order to find suitable software for the energy performance of a building, Al Ka’bi [18] evaluated the performance of the most common simulating and modeling applications for green building energy consumption. They compared and ranked the building energy analysis performance of 10 of the most common energy in the unifying criteria, and the final ranked result in descending order was as follows: (1) TRNSYS, (2) Ecotect, (3) Autodesk-GBS, (4) EnergyPlus, (5) IES-VE, (6) IDAICE, (7) VIP-Energy, (8) DesignBuilder, (9) eQUEST, and (10) RIUSKA.
From the previous research presented above, it seems that building parameters can significantly affect building energy performance, and wall and HVAC systems contribute the highest impact on energy performance [15,17,20,23]. Moreover, WWR is another crucial factor in building energy consumption [19,21]. In addition, some researchers also stated that BIM could effectively assist the designers and stakeholders in identifying the key parameters which could affect building energy consumption and make sustainable design in the early phase of construction design for green buildings [15,16,20]. Motalebi and Rashidi [22] and Wang and Guo [24] even made some improvements to BIM with other technologies for building energy performance. They integrated LCA theory and Digital twins technology into BIM, respectively, to improve the ability to assess the environmental impact and the interaction capacity of BIM, and the results showed that BIM performed well in both pieces of research. In light of this, it is obvious that identifying key building parameters which may influence the building energy performance are necessary for green building design, and BIM plays a positive role in the effective modeling and energy analysis of buildings.
2.7. Contributions Compared to Relation Research
The researchers first needed to establish a basic understanding of the simulated data. Although this study has similarities to past research methods, the software, variables, and methods used are different and the results of this study are different from those of past studies. The researchers have improved on past experimental methods in the course of researching this topic in order to make the simulations more realistic. This makes the results of this study unique.
The researchers conducted tests between the results of the BIM-based energy modeling simulations and the actual energy consumption of the case study. During the energy simulations, the researcher made various attempts to get the right data for the study. This was done until the energy simulation data met expectations. A total of 100,000 simulations were carried out in this study. The study provided complete simulation results for each shape studied. Finally, the results of the simulations were applied to the actual building, and recommendations were made for the energy optimization of the building. The investigation revealed many interoperability issues regarding BIM data input and data interpretation of the energy simulation results.
3. Method
3.1. Introduction
The primary energy features of seven various-shaped proto models are determined by exporting the simulation results from Autodesk GBS according to its energy default settings. The DOE-2 engine specifically considers the influence of each independent variable in the building information model. By changing the independent variables, the Energy Use Intensity (EUI) (MJ/m2/Year) is defined as the dependent variable in the regression equation.
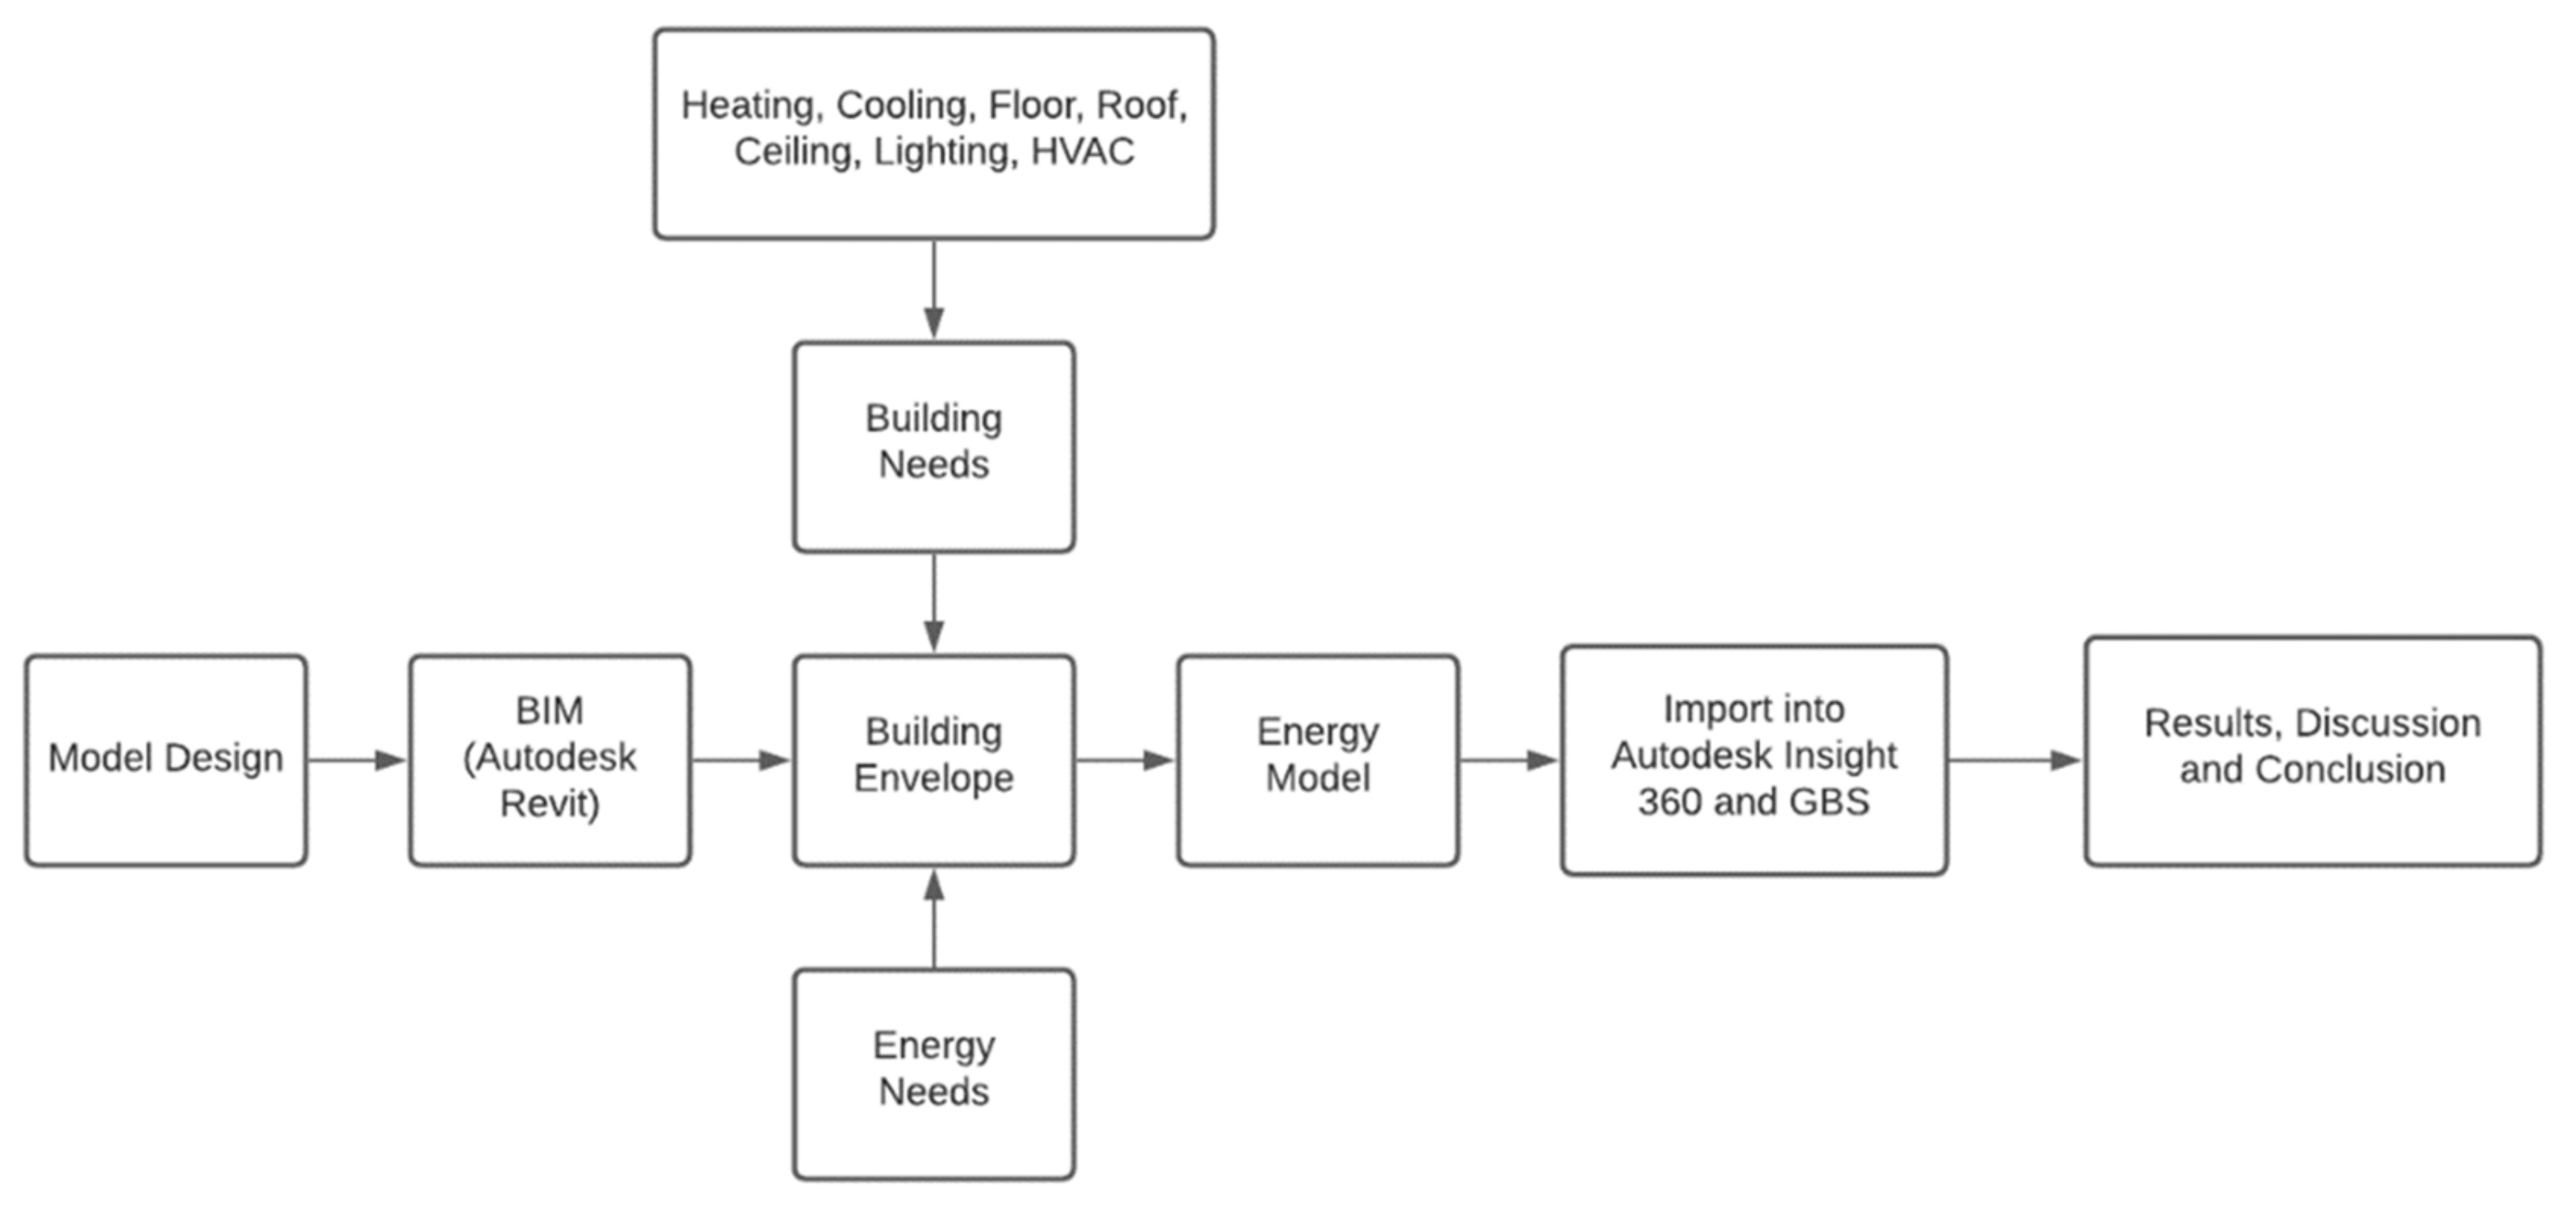
Appropriate data pre-processing is necessary for a large amount of data. Bad data cleaning is also implemented before statistical analysis to examine the link between the variables and the amount of energy used by the building. Data pre-processing cleans and transforms the dataset by eliminating outliers and ensuring that each piece of data is reasonable as it proceeds. Besides, data normalization is also performed to ensure statistical significance. The accuracy of the statistical analysis is based on regression theories, t-tests, and sensitivity analysis. The framework for this study is shown in Figure 1.
3.2. Geometric Modelling in Revit
Revit® software is a BIM tool that automatically generates energy models from building models, as well as strategies to reduce processing time. Any updated design in Revit can be automatically updated in the energy model, making the building information more coordinated and reliable.
The space energy model and surface energy model are considered in the energy simulation of Revit. In the energy model, the space energy model is the discrete air volume (mass) that experiences heat loss or gain; the surface energy model is the heat transfer path into or out of each space. They include the surface between the internal space and the external environment.
It was conceivable that the building shapes related to the shape of a building affect lighting, structure, and aesthetics [1]. Therefore, in the case of controlling the building shape as a variable, this study attempts to explore the relationship between building energy consumption and the internal variables of various buildings. Figure 2 explains the workflow of Revit energy modelling.
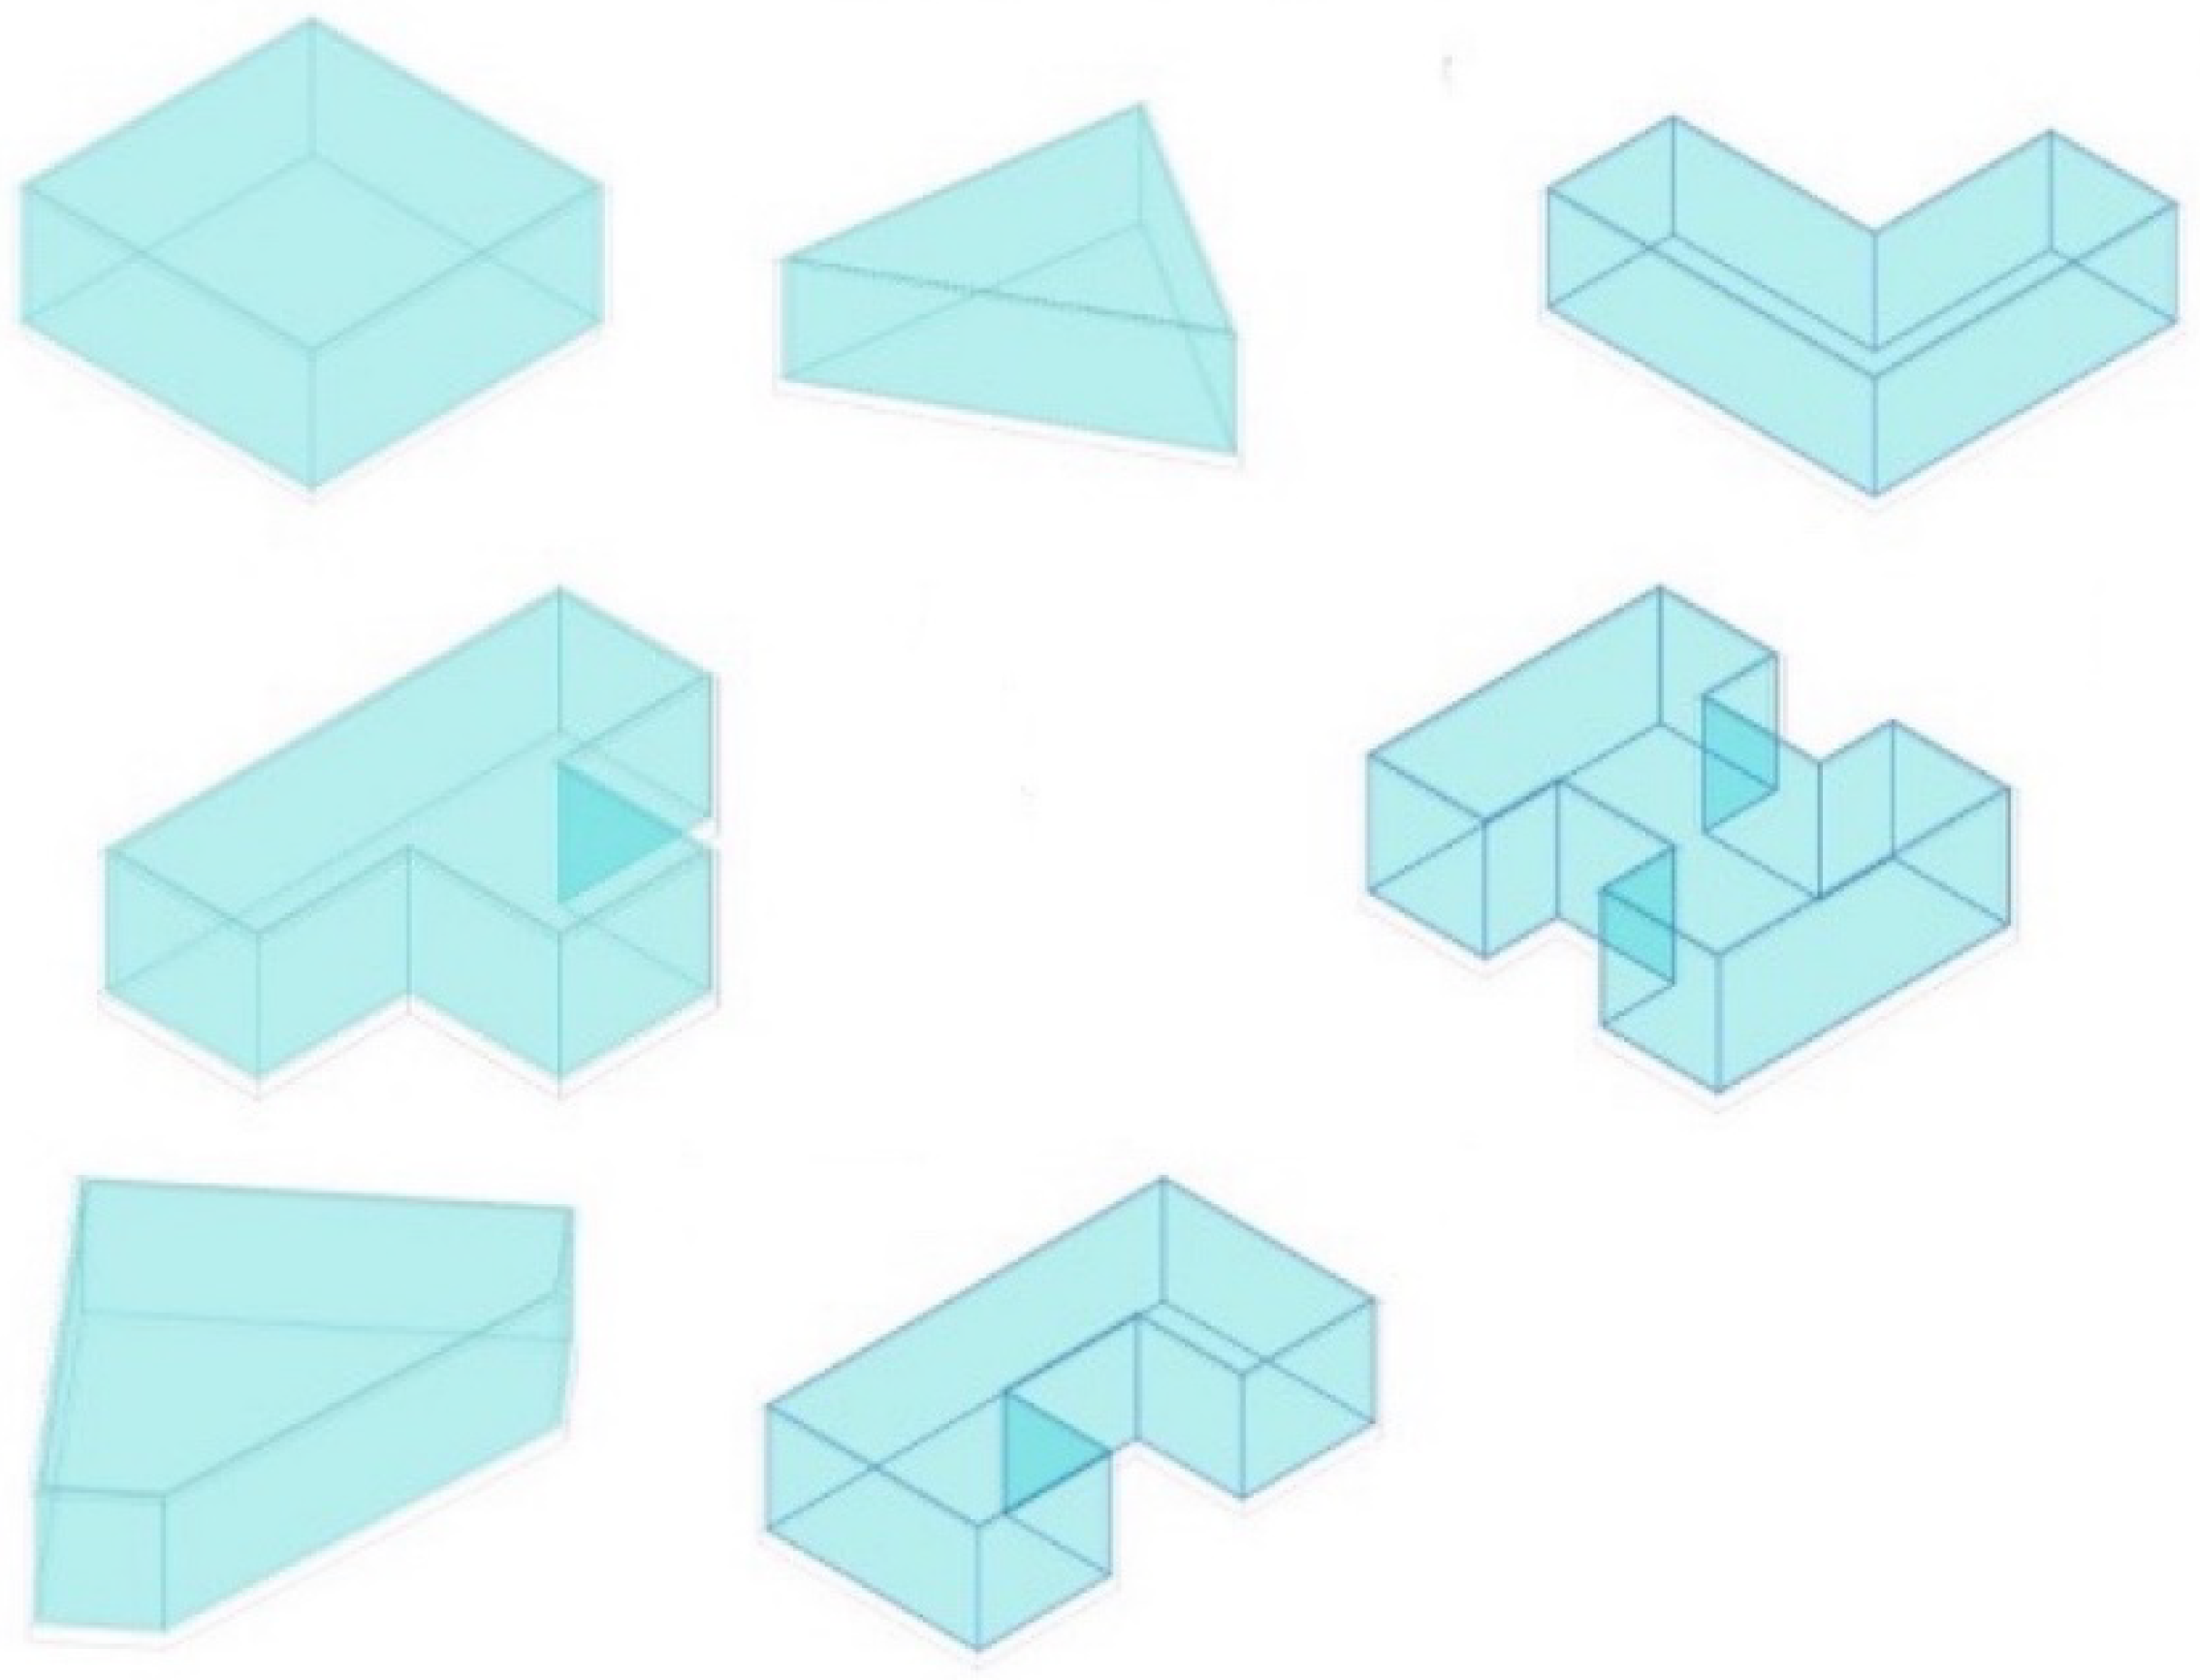
This research intended to analyze seven shapes of building spaces, as shown in Figure 3 below. In Autodesk Revit, seven shapes of ideal room models were built to contain all building information. This research examined seven distinct building geometries: rectangle, H-shape, L-shaped, Diamond shape (rectangle minus corner), triangle, T-shape, and U-shape.
3.3. ABS Case Study
The 3D-model of a thesis case study focusses on the Abercrombie Building (ABS) of The University of Sydney, New South Wales, Australia. The Abercrombie Building (ABS) was chosen as our case study because it is one of the University of Sydney’s buildings and it would allow the researchers to observe its interior. Similarly, room models of suitable shapes in the ABS building will be simulated according to the current situation. The energy simulation data was compared with the origin shapes, and error analysis is also implemented. Figure 4 highlights the rooms of ABS that are used for energy simulation. All shapes are highlighted in red. In ABS’s floor plan, the L-shape (left top), U-shape (left bottom), H-shape (middle), diamond shape (right top) and rectangular shape (right bottom) are modelled and simulated (see Figure 4).
3.4. Design Variables
In this section, Rstudio and Microsoft Excel are used to process data and implement the statistical analysis. In R studio, the bad data is cleaned and normalized at the beginning. Microsoft Excel is used to verify all data processing steps and tests.
Design variables are critical to optimal design studies and specify the range of changes in the model’s properties and shape. In this study, variables were determined automatically by the building performance simulation system in GBS. The system provided twelve variables for each model, including WWR, wall construction, roof construction, infiltration, lighting efficiency, plug load efficiency, HVAC, interior loads, envelope, building form, daylight, occupancy, and building orientation. All of these variables studied as basic building design factors are required to be fully considered in all phases of building design, and the selection of reasonable building materials is strictly in accordance with ASHRAE 90.1. In terms of statistics, the design variables in this study are classified as independent and dependent variables. In this case, some building envelope variables, building shape, and orientation are categorized as independent variables and controlled by the engineers. A total of 12 building shapes contain 12 sets of data collections. The regression models and other tests will filter each set of data and interpret the potential relationships between building design variables.
The design variables are found in the GBS-exported comma-separated values (CSV) files. For each of the design variables, Table 2 below explains the procedures and reasons for the statistical analysis methods. Dropping analysis is implemented if the parameter is not appropriate for linear or multilinear regression.
3.5. Regression Theory
The main purpose of a Monte Carlo Simulation is to perform statistical analysis for the model developed by means of repeated random sampling. Specifically, during the simulation, uniform probability distributions were used to contribute to the interpretation of the effects of uncertainty in the prediction and forecasting models. In this study, Monte Carlo Simulation predicted energy consumption based on various levels of 13 variables for each of the five ABS buildings modeled. In brief, the total number of simulations was 100,000, and a complete simulation of the EUI results was provided for each design scenario.
In this study, the statistical technique of regression analysis is utilized to predict the relationship between 13 variables and EUI. This method incorporates both univariate and multivariate regression and minimizes the process of calculating heating and cooling loads. Univariate regression focuses on analyzing the relationship between the individual dependent variables and their independent variables, while multilinear regression fits a model of variation between a dependent variable and multiple independent variables. Since the variables identified in this study are qualitative, a dummy code approach is used in r for variables with literal horizontal conditions such as glass location and type to include qualitative variables in the regression model.
For the seven prototype modellings as well as the five ABS building modellings, for a total of 13 building shapes, a total of 120,000 linear simulations are accomplished to analyze the impact of the parameters on the annual EUI. Of these runs, approximately 40% were used to test the developed ABS building models. The form of the regression equation used is shown below.
For multilinear regression
y = α + β1·x1 + β2·x2 + β3·x3 +⋯+ βn·xn,
y: is the predicting EUI
β: is the regression coefficient of the design variable
x: represents the design variables mentioned in Table 2
α: is the intercept of linear regression
For every run of energy simulation, GBS provides the energy estimation of fuel, electrical, and energy used. EUI is essential for interpreting the building energy consumption conclusively. Therefore, the regression equation will be defined by using the dependent variable of EUI.
3.6. t-Test
The t-test is used in statistics to determine the difference between two sets of data means. When the difference is significant, it is possible to deduce the essential features of a collection of data [27]. The t-test is a technique for examining parameters. The first step in performing a t-test is to establish the probability distribution of the set of variables and deduce its influential parameter. The t-test in this research is used to examine the mean distribution of EUI for various shapes.
The data collected from GBS demonstrates that the outcomes of the energy consumption simulations satisfied the normality, equal variance, and independent requirements. As a result, an independence test was conducted on the individual variable and its linear regression, but a paired t-test was conducted on the WWR owing to the reliance of numerous components. The degree of variation in EUI caused by numerous factors for the shape building model, such as glass type or orientation, can be stated precisely in the regression analysis of WWR.
Additionally, a two-way t-test was used to statistically normalise variations in the mean EUI across the different building shapes. In summary, the t-test adds to the study’s parametric statistics during the pre-processing data phase and validates the statistical hypotheses.
3.7. Monte Carlo Analysis
The Monte Carlo Simulation is mostly used to do statistical analysis on the model developed by repeated random sampling. To evaluate the uncertainty effects in the model’s predictions, uniform probability distributions are considered throughout the simulation. A Monte Carlo Simulation was used to forecast energy usage for each model in the ABS building analysed in this study based on various value of the 13 variables that mentioned in Table 2. In summary, 10,000 simulations were carried out, and thorough simulations of the EUI results were produced for each design scenario under consideration.
3.8. Suitability of Regression Equation
The discriminants in the regression model are Mean Squared Error (MSE), Root Variant (RMSE), Mean Absolute Error (MAE), Percentage Variant (MAPE), and R Squared. Except for R-squared, the values of the other discriminants may range from 0 to positive infinity. As a result, their individual values are not indicative of the regression’s success in terms of the real distribution of components. R-squared is regarded as a criterion for evaluating regression analysis in every scientific subject [28]. R-squared will be our criterion for assessing regression models in this research to simplify the experimental process. The indicator R square will be defined as follows:
: the y value of observation i
: the predicted value of y for observation i
: the mean of y value
3.9. Sensitivity Test
The analysis and statistics of the effect of different level values of independent variables on building energy consumption are one of the main objectives of this study. Therefore, the variance-based sensitivity analysis method is adopted to clarify the uncertainty of the dependent variable on the variation of the independent variables in all models. The sensitivity analysis investigates the assessment of the uncertainty in the output of the model with respect to the changes in the input factors. Also, since the variance-based analysis is based on sampling, this method is suitable for Monte Carlo simulations in the study. Specifically, the regression coefficients in the study are used as quantitative measures to determine variable sensitivity. Based on the regression models for the five variables developed in the seven-prototype modeling, the extent to which different input factors contribute to energy demand can be accurately evaluated.
4. Results
This chapter presents a parametric analysis of the data collected during the simulation experiments that were conducted in R and Excel. The regression models for the design variables identified as having a significant impact on energy consumption during the statistical study are described in detail. Furthermore, the correlation coefficients between the design variables and EUI and their degree of fit are further assessed. In addition, the regression validation results of the design parameters of the prototype models are also addressed in this section. Based on the Monte Carlo simulation method, the energy consumption simulations of five real structures in the ABS Building are compared with the results of the developed regression simulations. Furthermore, the limitations and variations associated with the studied simulation results are specifically discussed.
This study will firstly focus on the multilinear regression of the design variable of WWR. WWR satisfied the requirements of multilinear regression. For the rest of the independent variables, it was decided to apply linear regression models to analyse the relationship between it and energy consumption EUI.
4.1. Correlation Analysis for Multi-Linear Regression—WWR
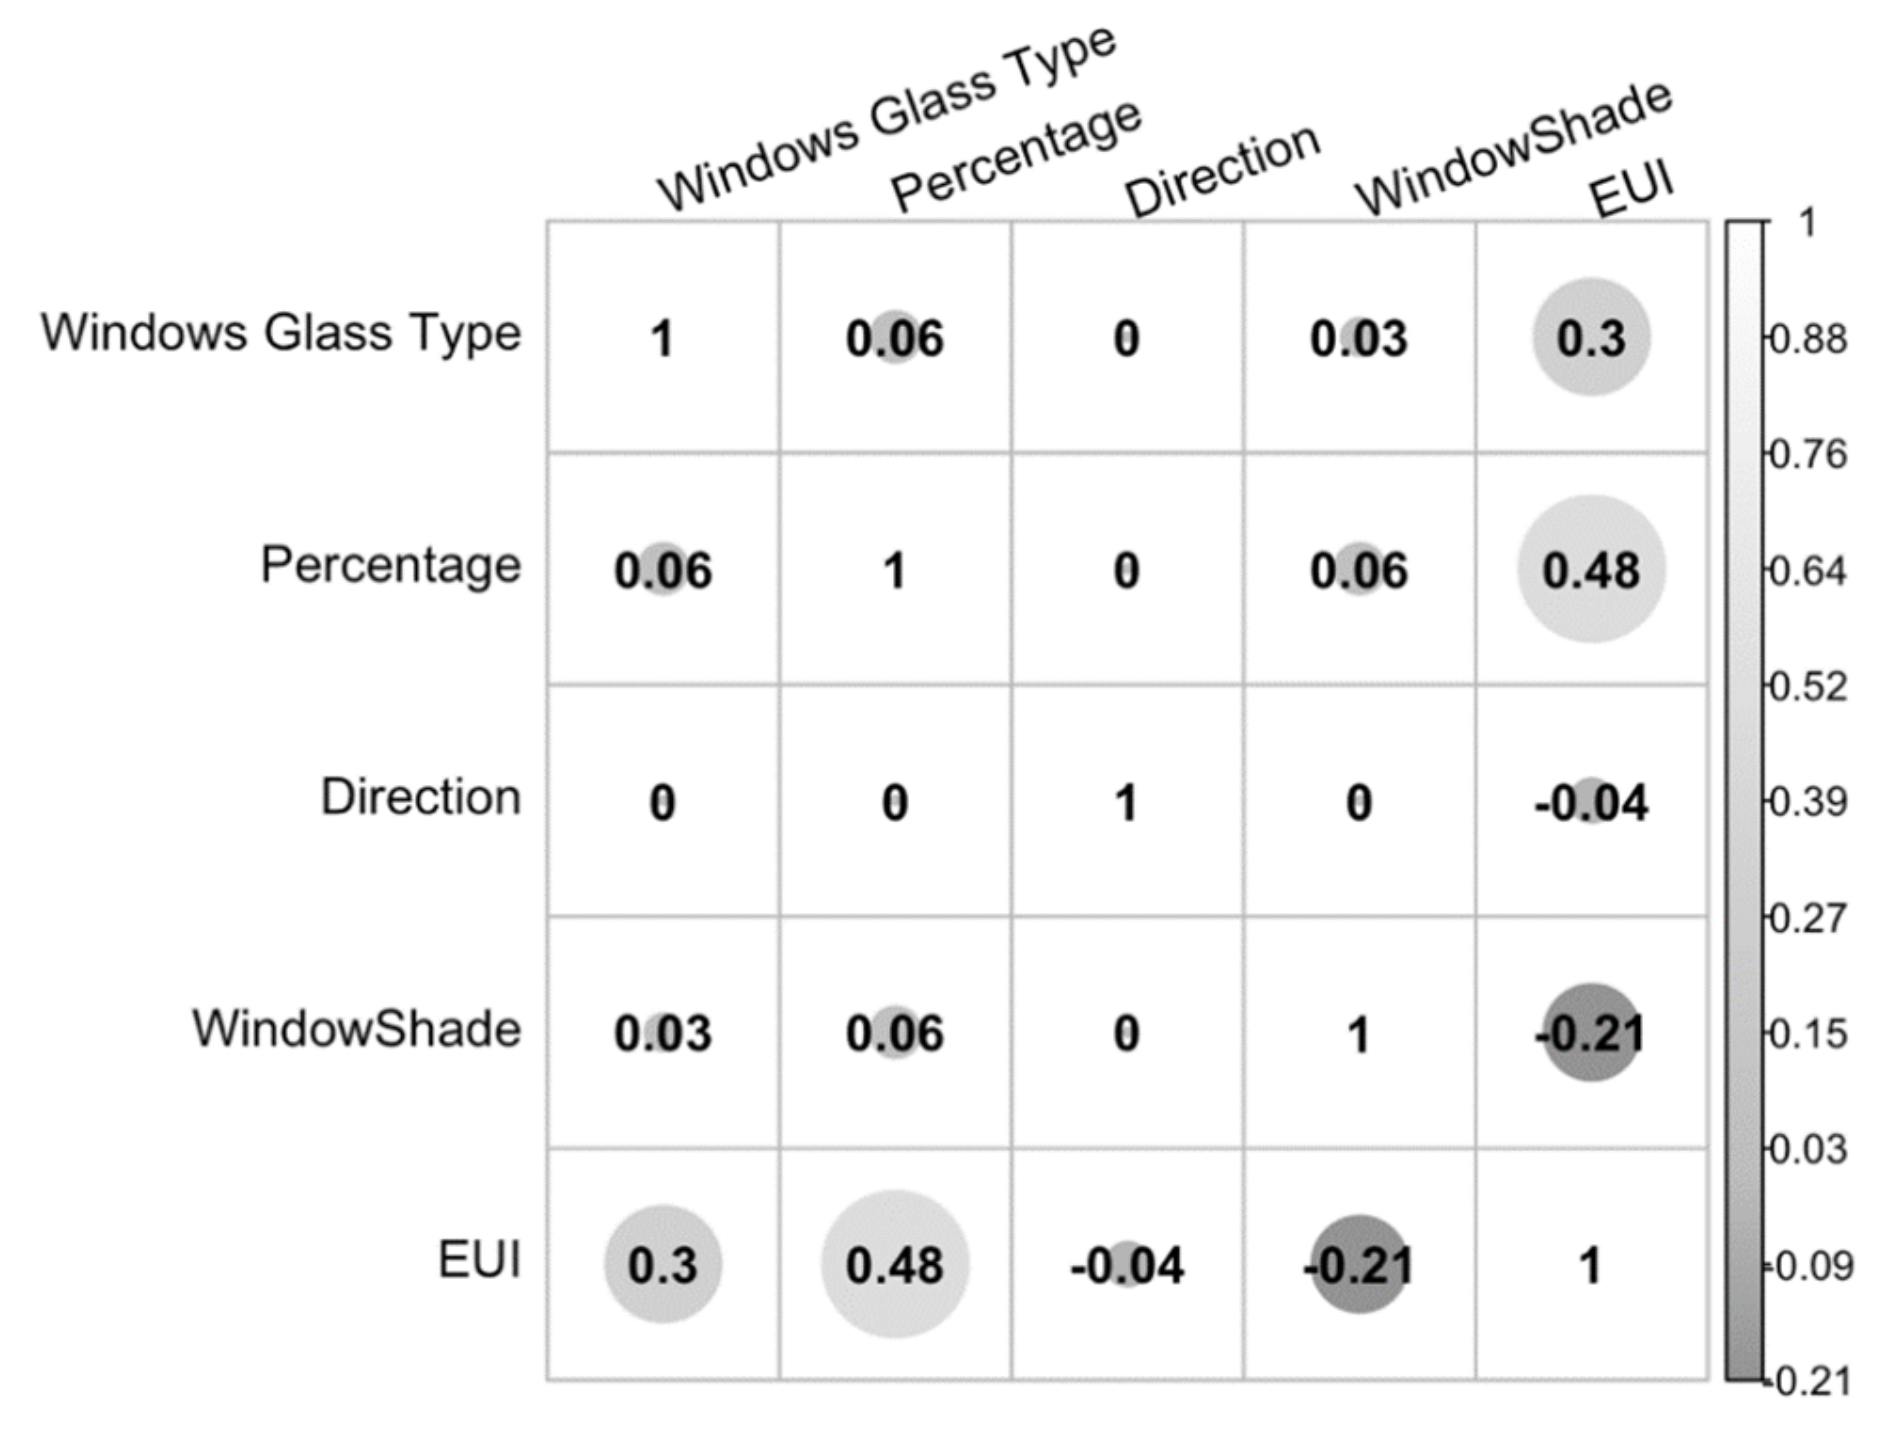
In this study, correlations were evaluated by using the Pearson method. As a result, the closer the absolute value of the correlation in the matrix is to one, the more accurately it portrays a perfect linear relationship between the variables. In contrast, if the correlation coefficient is close to zero, there is no limit on the correlation between the variables. The correlation matrix demonstrates that the WWR percentage has a reasonably high connection with EUI, while the remaining variables, including window glass type, direction, and the window shade, exhibit relatively weak linear relationships with energy consumption. This also indicates that these design variables are highly independent of each other in terms of energy impact and simplifies the process of multivariate data analysis.
In the simulated setups, it can be shown that the WWR has several determining parameters, while the other design variables each have a single parameter. Table 3 contains an overview of the WWR internal variables and their properties. In the multilinear simulation in Rstudio, Percentage, Window Glass Type, and Window Shade are transferred as numeric factors of percentage, window’s glass U-value, and shade ratio, respectively.
Figure 5 shows the correlations among WWR internal variables. The numbers in this matrix are the p-values of correlations. With the normal distribution, the p-values should range from −1 to 1. Since the data sets of WWR are not normally distributed, the p-values are presented from 1 to −0.21. In this case, the positive p-value stands for a positive correlation, and the negative stands for a negative correlation.
The correlation is not significant among Window Glass Type, Percentage, Direction, and Window Shade, which is less than or equal to 0.06. It is also noticed that the correlation for “Direction” is significantly small, which indicates that the statistical significance of “Direction” is low. Thus, “Direction” is dropped in the multilinear regression equation. Additionally, the multiple R square increased by 1% after “Direction” was dropped. Apart from “Direction”, four internal variables illustrate the significant correlations of EUI. Therefore, EUI is investigated as the dependent variable in multilinear regression.
These explanatory factors and coefficients are shown in Table 4, and MLR was used to forecast the result of a response variable EUI (MJ/m2/Year). This table also shows the adjusted R square to present the variations in models. For example, in a rectangular shape, R-squared shows that about 36% variation in WWR can be explained in our model. That is, they can be explained by window glass type, percentage, direction, and window shade. F-statistic tests model the null hypothesis when all model coefficients equal 0.
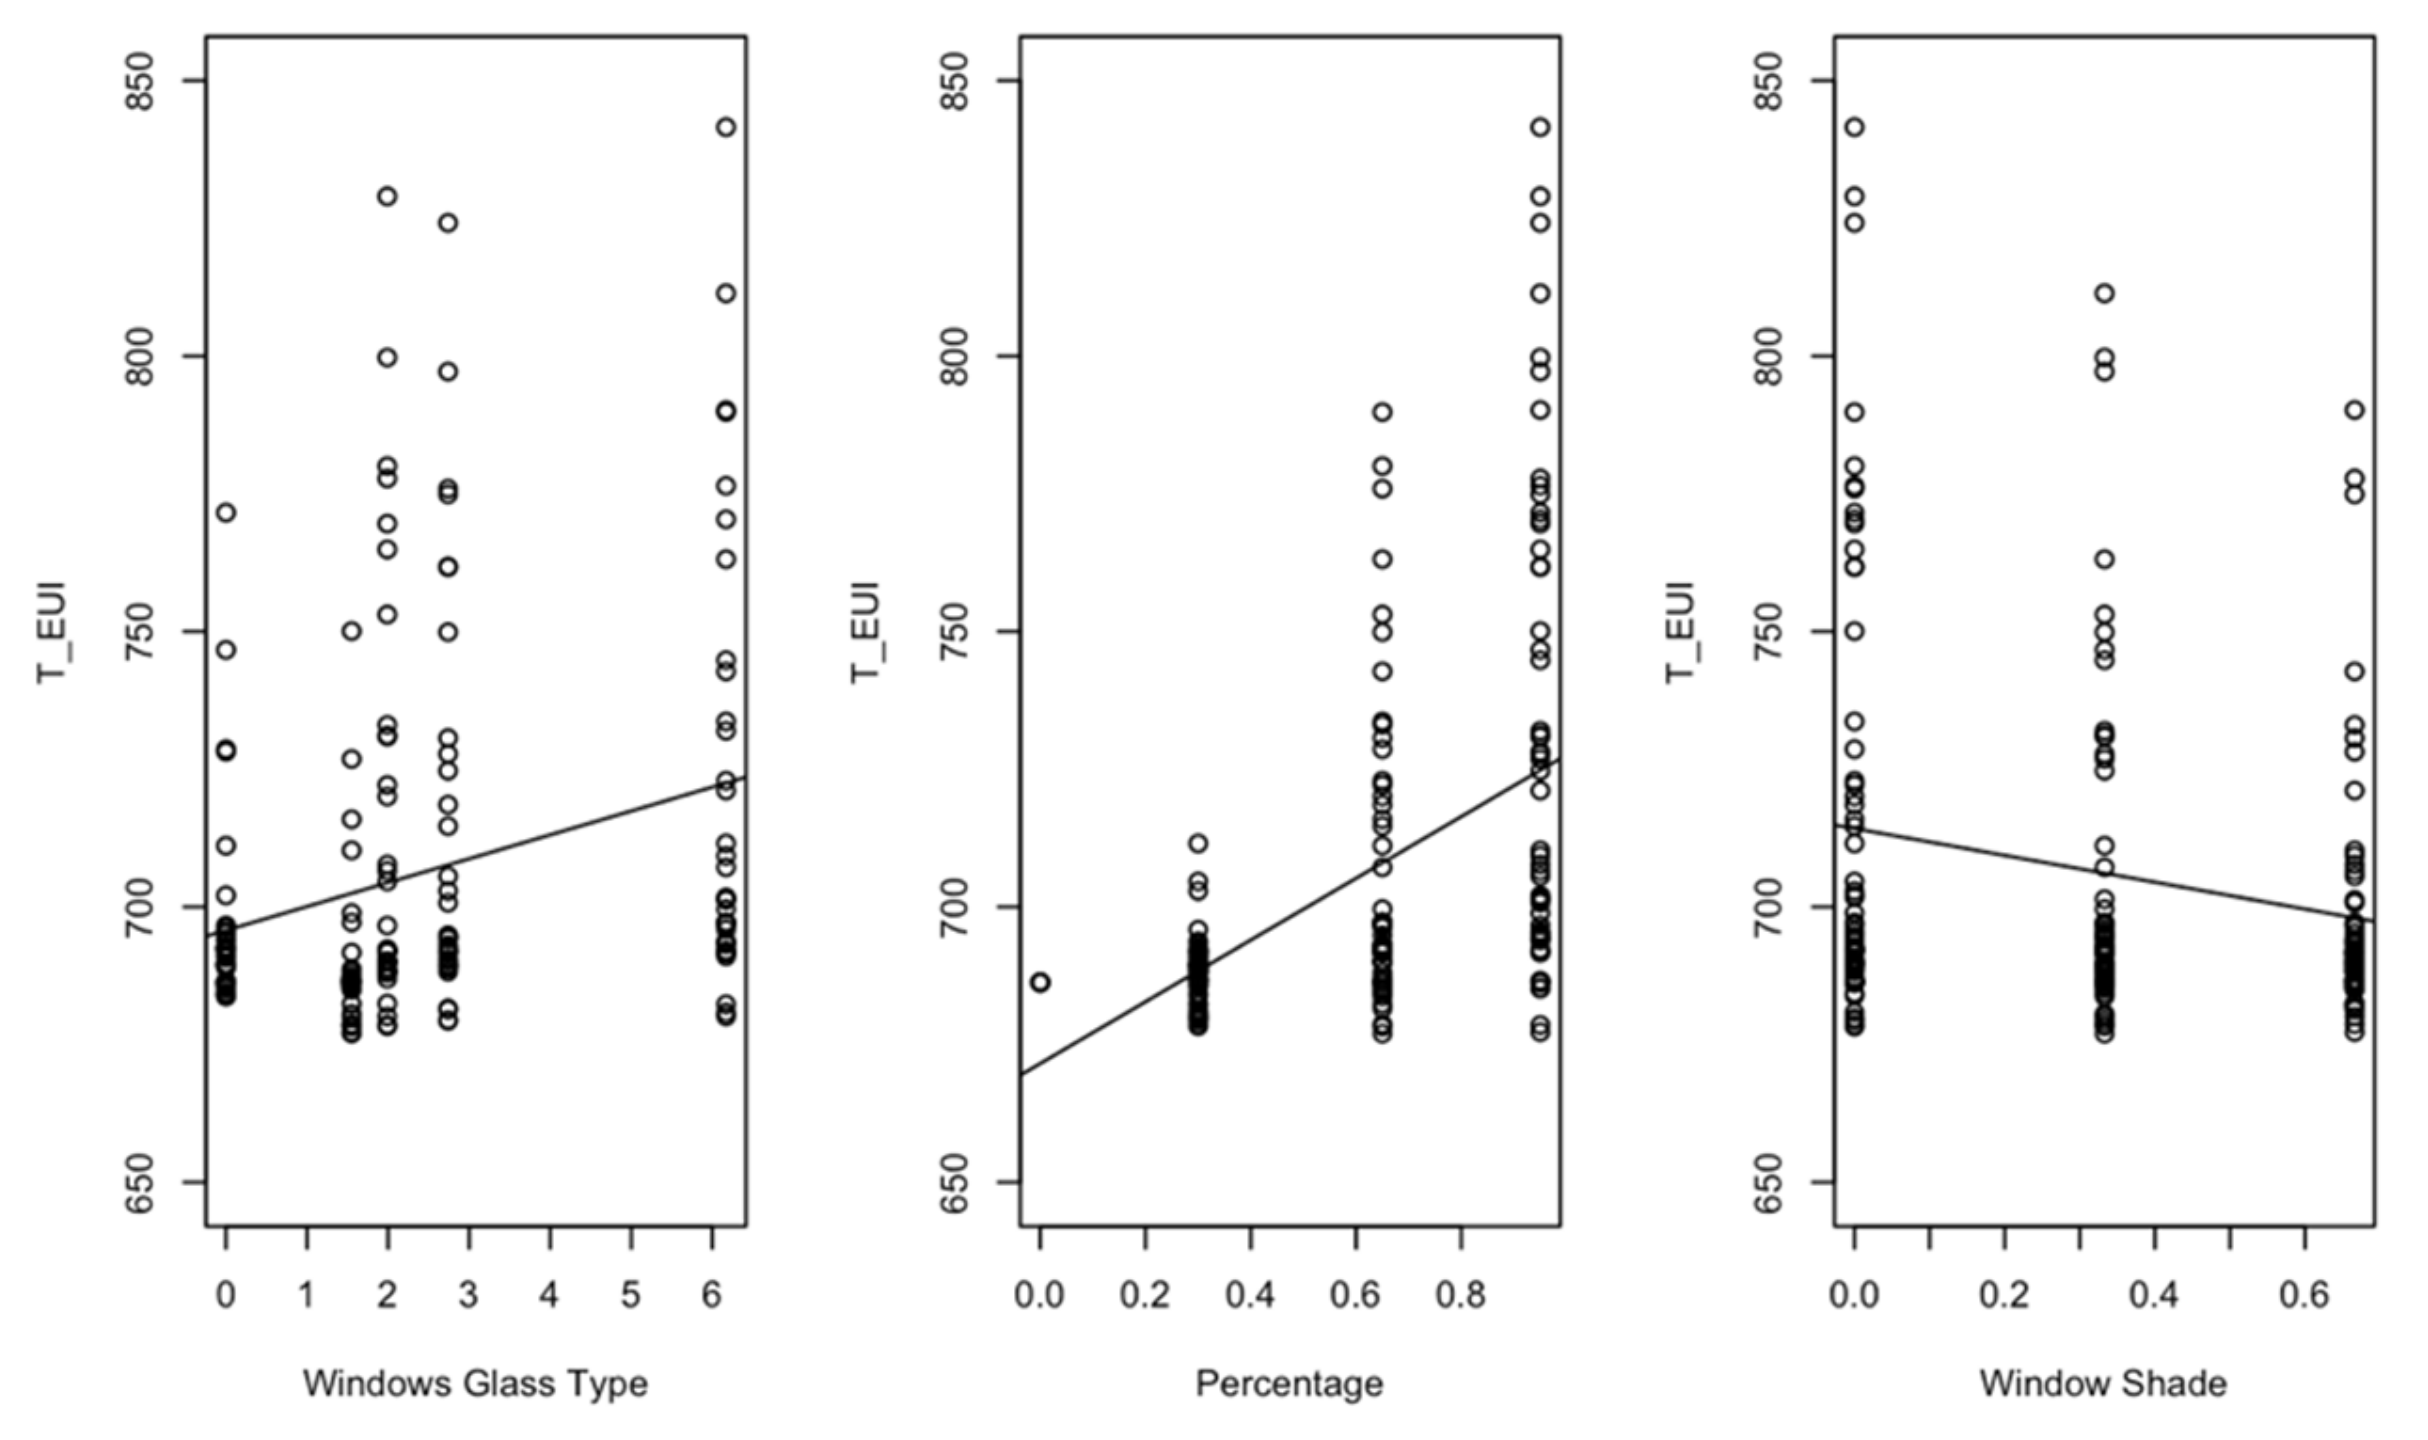
Since R square is found to be significant in the regression model [28], the line of best fit has been investigated. It was found that the values for each independent variable are extremely limited. However, the values contain a wide range of EUI. Therefore, the adjusted R square is low, at around 0.3. All the lines of best fit have a similar trend for window glass type, percentage, and window shade, though the intercept varies for each shape, as shown in Figure 6, Figure 7, Figure 8, Figure 9, Figure 10, Figure 11 and Figure 12.
4.2. Parametric Analysis
The regression coefficients contribute quantitatively to the specification of the most effective energy-saving variable in each model. However, the shape of the building also has a significant impact on energy use. Therefore, the parametric analysis in this study aims to assess the impact of single-variable regression coefficients on changes in design variables for seven shapes.
Figure 13 compares the constants in the linear regression models of the seven prototype buildings. It can be clearly observed that there is variability in the constants of individual design parameters for different shapes. Specifically, the regression model constant values for lighting efficiency and plug load efficiency are around 500 (MJ/m2/Year) for all shapes, while the coefficients for the remaining variables are over 600 (MJ/m2/Year).
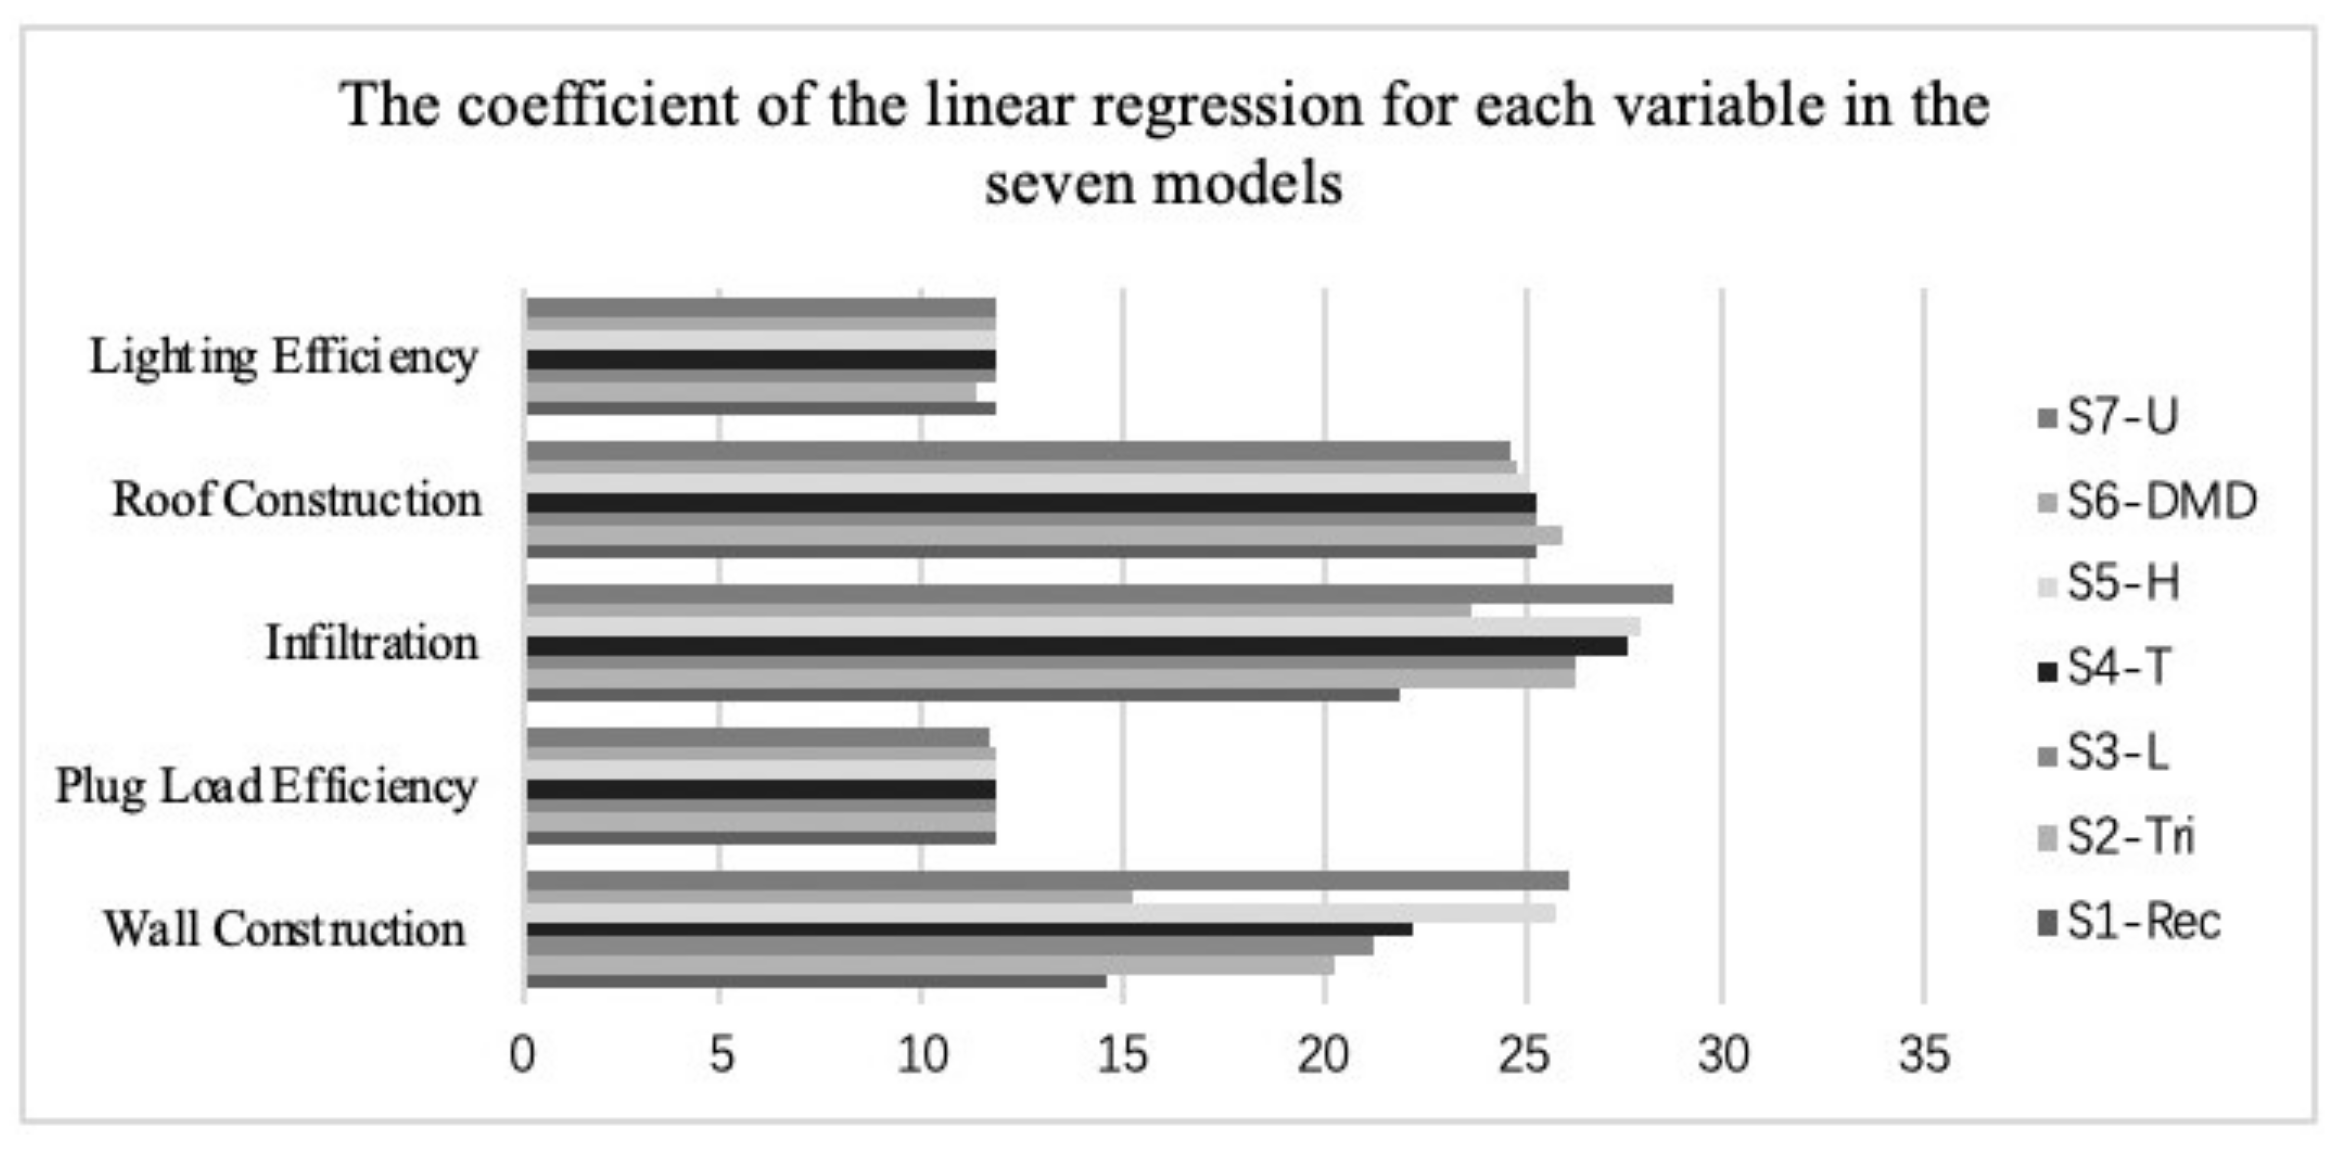
Figure 14 compares the values of the coefficients of the variables in the linear regression models for the different shapes. As shown in Figure 14, the values of the coefficients of the independent variables for lighting efficiency and plug-in load efficiency are low, while the values of the coefficients for wall construction, roof construction, and infiltration are higher. It is worth noting that the values of wall construction and infiltration change significantly with geometry.
As far as the specific geometry is considered as a parameter, the value of the constant has a clear correlation with its magnitude. The triangle always has the maximum value, while the diamond shape exhibits the minimum value except for the case of wall construction. For the independent variable coefficients, it shows no significant correlation with the geometry. In the case of wall construction and infiltration, the U-Shape shows an impressive maximum value, while the rectangle presents a minimum value.
5. Discussion
The primary objective of this thesis is to develop regression models for design parameters that have a significant impact on building energy consumption. Due to the complexity of the parameters, both linear regression models as well as MLR models were utilised concurrently. After performing a two-way ANOVA data analysis on the 13 design variables, eight variables with a significant optimal impact on energy efficiency were identified. Given that WWR was jointly determined by four reference variables, a two-way correlation analysis was employed to visually illustrate the key linear correlations between these factors.
Due to the intricacy and diversity of the variables, it was necessary to first clarify the effects of their interactions. The energy simulation results of the identified design variables were then subjected to the covariance and regression tests in both Excel and R. The obtained significances f and R2 values for the eight design variables provided data support for the termination test. The high correlation between roof construction, wall construction, lighting efficiency, plug-in load efficiency, and infiltration with EUI was employed to model the linear regressions. Additionally, a MLR model was created for WWR.
Also, Appendix A provides thermal properties for some significant building components.
5.1. Multilinear Regression Models
The multilinear regression model of WWR shows that there is no strong correlation between its four reference coefficients and energy consumption. According to the regression model coefficients, it was found that the values of R2 for all four reference coefficients were low, ranging from 0.2 to 0.4. Therefore, the goodness of fit of the regression model for this parameter is relatively low, and inaccuracies exist.
The drawbacks and inaccuracies of using multiple regression models arise mainly from the data obtained. The R square in the MLR for WWR, the design variable, was only around 34%. This low R square value points to the weak fit of the modified multiple linear relationships. In order to find the reason for its weak fit relationship, the internal variables will be sequentially dropped. It is found that its fit decreases during the dropping analysis. Thus, the higher dispersion of data points in WWR will directly affect the degree of fit of the multivariate linear regression. In addition to this, the best fit line for the internal variable of WWR was plotted out one by one (as seen in Figure 6, Figure 7, Figure 8, Figure 9, Figure 10, Figure 11 and Figure 12 above). It was found that the data points were arranged in a straight line in the vertical direction due to the limitations of the independent variables. This would be the reason for the low accuracy of MLR. Therefore, the analysis of multilinear regression in this paper can only provide a prediction of the overall trend in energy consumption, and its accuracy needs further research.
5.2. Limitations and Future Improvement
Although the validation of the study is acceptable, there are still shortcomings regarding the modelling and data processing approaches.
First, in the modelling stage, the number of runs of the energy simulation is limited. There are only 250 energy runs performed for each shape in the GBS, which may affect the accuracy of the final data analysis results, hence increasing the error rate. Furthermore, the study ignored the in-depth study of the building structure thermal values. Thus, future studies are required to investigate the effect of this parameter on the building’s energy consumption by altering the thermal performance of the construction materials. Additionally, only five building shapes could be identified for the purpose of validating the study results. This may lead to bias or flaws in the findings. Therefore, there is still room for improvement in the experimental simulation methodology of this study.
Next, during the initial stages of statistical analysis, the error in the regression model was exacerbated by the kinds of variables of the design parameters. Among the 13 design parameters, the variable types of WWR, daylighting and occupancy control, HVAC types, internal loads, and envelope were all qualitative. As a result, when performing data analysis with Excel and R, the qualitative variables must be converted to ordinal numbers for numerical analysis.
Finally, the energy settings and building configurations provided by the Autodesk Kits are limited. Therefore, the variety of parameters for the design variables is hindered. Moreover, the best-fit lines for the design variables indicate that the values of the independent variables in the experiment are homogeneous. The goodness of fit plot of the rectangle WWR with the energy consumption is shown in Figure 15. As can be seen, the variables composing the design coefficients are vertically scattered around certain values, thus indicating a lack of data diversity.
5.3. Conclusions of Results
This paper attempts to simulate energy consumption for different room shapes to investigate the relationship between their WWR factors and EUI. Multilinear regression analysis allows a direct link between these factors and the building’s energy consumption in the form of a multilinear mathematical equation. However, this result is incomplete because the original data set contains unique design variables with various rows and columns. Therefore, the MLR method can only be applied to a WWR whose internal variables contain the same rows and columns.
The simplified multilinear model provides a simulation of the EUI of the internal design elements of WWR in different shapes of space. Despite the huge amount of data analyses in this paper, the accuracy of the findings remains to be seen. The other factors controlling building energy consumption and the interaction between the building and its environment make the results of the multilinear regression less accurate.
Other linear regression models of parameters are lighting efficiency, wall construction, infiltration, plug load efficiency, and roof construction. In this study, linear regression was developed based on data automatically generated by the detailed energy simulation tool GBS. These variables were designed for linear regression since data do not satisfy the requirements of multilinear regression in WWR. This means that the five factors (lighting efficiency, wall construction, infiltration, plug load efficiency, and roof construction) do not have the same columns of data as WWR.
In the future, regressions using different energy tools are also feasible. The variability of the same design parameters between shapes can also provide energy-saving options for the design of buildings. Building construction should be constrained by the Building Code of Australia and the National Construction Codes. In this research, a regression analysis is made to simulate energy consumption by investigating the design parameters in construction aspects. The results in this paper can provide some hints for the construction industries regarding building energy optimization.
6. Recommendations
It is first recommended that researchers further investigate the building design variables and regression model, by manually entering each specific value for each design variable. To continue this research and energy regression analysis, a tool that allows for the exploration of potential design factors and their impact on energy consumption should be investigated. Furthermore, many variables were eliminated in the dropping analysis since no suitable independent variables could be found. Therefore, the analysis of the excluded variables still needs to be improved.
Besides, in a WWR multilinear regression analysis, the correlation matrix indicates that the direction is irrelevant to other internal variables. In the following stage, the building direction of WWR could be investigated using limited directions simulation corresponding to building orientation.
The adoption of passive design is critical to the development of an energy-efficient educational building. In conjunction with the study results, the following recommendations for energy optimization by changing key design variables were made:
- Using the building envelope such as shading devices and window glazing appropriately;
- Considering the impacts of enhancing the thermal transmittance of exterior buildings to control the amount of sunlight and reduce energy demand;
- The appropriate use of natural energy sources to reduce HVAC and lighting system demand;
- Advance simulation of the building occupancy schedule to automate the intensity adjustment of ventilation and HVAC systems;
- Adopting compact and simple geometric designs, such as avoiding diamond shapes to reduce the energy demand.
- In addition, improvements suggested for such energy simulation studies include:
- Increasing the variety of building design parameters by considering the complexity of real-world building design;
- Increasing the number of runs of energy simulations to keep the experimental error within 5%;
- Considering more research regarding the simulation of energy alternatives;
- Conducting a more in-depth study of lifecycle energy performance.
There are still some potential research directions that could improve building energy optimization and should be explored further. One of the possible methods is the integration between BIM and Building Energy Model (BEM), which can not only automatically provide the building energy performance but also promote the accuracy of the building energy simulation. Bastos Porsani and Del Valle de Lersundi [29] made an attempt to investigate the interoperability between BIM and BEM. They applied Revit to establish a residential building and a warehouse model, and the building data was transferred into energy simulation software compatible with the EnergyPlus engine through two types of files, green building extensible markup language (gbXML) and industry foundation classes (IFC). In the conclusion phase, they pointed out that the workflow between BIM and BEM may present huge problems for the energy model in big and complex buildings, and the compatibility of exchange formats needs to be improved for achieving the interoperability of BIM and BEM. González, Soares [30] also tried to integrate BIM and BEM methodologies into the Autodesk environment and utilize REVIT, Insight and Green Building Studio to establish the building physical model and energy model respectively for building energy optimization in experimental design methodology. They claimed that the BIM can be compatible with BEM in one environment via applying Autodesk Revit, Autodesk Insight and Green Building Studio, but the accuracy of the materials’ thermal properties and the climatic conditions are needed to be verified and improved in future research. Watfa, Hawash [31] used the gbXML file as the data transfer medium between the BIM tool (Autodesk Revit) and BEM software (AECOsim Energy Simulator) for evaluating the energy performance of a residential house, and they validated that the combination of BIM and BEM can improve building energy consumption efficiency for case building. Yang and Pan [32] developed a workflow to promote the efficiency and accuracy of the gbXML format for geometry documentation transfer between BIM and BEM. They used center lines BIM enclosing elements to recreate the floor plan and serialize the geometry to gbXML via geometric calculations using float precision algorithms in a 2D plane. The results showed that the proposed workflow can improve the original model integrity and the energy simulation stability. Carvalho and Almeida [33] combined BIM and the Building Sustainability Assessment method (BSA) to improve the efficiency of building sustainability and used this approach to achieve the evaluation of the SBToolPT-H energy efficiency category. Pereira and Santos [34] made a systematic literature review to assess the current level of BIM adoption for building energy optimization. They found that BIM has only been developed to less than half of its maximum capacity for building energy optimization and recommend that the challenge of data transfer from design software to energy analysis tool needs to be overcome to address issues of interoperability between BIM and BEM.
In addition to the possible measure of BIM-BEM combination discussed above, there are also other considerable future directions for the improvement of building energy performance. Firstly, BIM has great potential capacity for buildings sustainability assessments, and the current research is limited for this area. The combination of BIM and Green Building Certification Systems (GBCS) credits may provide a valid strategy to address this issue for building sustainability assessment. A perticular attention was devoted by [35,36,37,38,39,40,41,42] implemented the comprehensive methodology of gap spotting and a systematic literature review (SLR) for 84 papers to assess the current level of BIM adoption in the GBCS field and obtained some crucial findings. They first point out that the environmental dimension is highly concentrated by most researchers in building sustainability, while some aspects such as the society and economy, biodiversity, water, land use, ecology, socioeconomic and acoustics are usually ignored for applying BIM-GBCS. Moreover, they emphasized that the integration between BIM and GBCS is the key to accomplish the automation of building sustainability assessment. Other studies undertaken by [37,38,39,40,41,42,43,44] used BIM to evaluate and optimize green buildings and combine the comprehensive assessment system for built environment efficiency (CASBEE) with BIM to assess a case green building in China. However, this research only considered limited building factors including the building envelope, HVAC, and lighting and equipment, and some other factors should also be of focus for green building evaluation in future research. Zero-net energy houses (ZEHs) also play an important role in reducing carbon emissions and should garner more attention in future research. Some reserchers [37] investigated the application of BIM technology in designing and addressing zero-net energy houses (ZEHs) and indicated that the combination of the BIM and building performance simulation (BPS) tools will be a vital role to design and achieve ZEHs.
7. Summary
The results obtained from the study meet the expected outcomes and detail the entire process from the modelling procedure to the validation of the regression model using real-world data.
To determine prospective building energy effect factors, the elements of the building, as well as the WWR [38,39,40,41,42,43,44], were thoroughly investigated. In this research, the inputs included a total of 13 critical design parameters and seven basic geometric models. However, we only considered the design variable of WWR for multilinear analysed in this paper.
The modelling and energy simulations tools include Autodesk Kits and GBS with a Doe-2 engine. Employed were all based on BIM and BEP [45,46,47,48,49,50,51,52,53,54,55,56,57,58]. The finalized design parameters, which included roof construction, wall construction, infiltration, light efficiency, and plug load efficiency, should be analyzed parametrically to develop linear regression models.
It is noted that WWR as an independent parameter is jointly influenced by four reference factors, including percentage, glass type, direction, and window shades. The correlation studies of WWR showed that its percentage had the highest correlation with energy consumption. The shape of the building also has a direct impact on its energy performance. It was found that diamond-shaped buildings have the highest energy consumption given the same building conditions. Conversely, triangle-shaped buildings showed the most efficient energy performance. As the geometry of a building is determinative of its perimeter length as well as its zone, tight geometry buildings should be given priority in design.
During the validation phase of the study, real-world energy performance data from the ABS Building was used to validate the developed regression models. Five ABS geometries were discovered, including the H, Rectangle, L, U, And Diamond shapes, and a Monte Carlo Simulation Method for the input data was constructed. The validation results indicate that the constructed regression models, except for the diamond shape, have an error of less than 10% from the real world cases. This result is due to the fact that the ABS building is coated in a large amount of glass on the facade, hence increasing the WWR. And in the majority of cases, the simulated energy expenditure is less than the real life values. As a result, when utilising the model created to forecast real life cases, the resulting numbers should be adjusted by a range of 5% to 20% to account for the building’s unique characteristics.
Additionally, this paper provides recommendations on energy optimisation for the initial stages of building design, depending on building energy design codes such as the BCA. Furthermore, the limits of the analysed simulation studies are summarised, along with suggestions for future relevant experiments. In future studies, more in-depth research on building design parameter diversity, energy alternatives, and lifecycle energy performance should be conducted.
Author Contributions
Conceptualization, F.T., R.J., J.W. and Y.D.; methodology, F.T., R.J., J.W., Y.D. and S.S.; software, F.T., R.J., J.W. and Y.D.; validation, F.T., R.J., J.W., Y.D. and S.S.; writing—original draft preparation, F.T., R.J., J.W., Y.D. and S.S.; writing—review and editing, F.T., S.S. and H.M.; visualization, F.T., R.J., J.W., Y.D., S.S. and H.M.; supervision, F.T. and S.S.; project administration, F.T. All authors have read and agreed to the published version of the manuscript.
Funding
This research received no external funding.
Institutional Review Board Statement
Not applicable.
Informed Consent Statement
Not applicable.
Data Availability Statement
Not applicable.
Conflicts of Interest
The authors declare no conflict of interest.
Abbreviations
| BEP | Building energy performance |
| BIM | Building Information Modelling |
| GBS | Green Building Studio |
| SDG | Sustainable development goals |
| BEPS | Building Energy Performance Simulation |
| WWR | Window-To-Wall Ratio |
| HVAC | Heating, Ventilation and Air-Conditioning |
| GBA | Green building assessments |
| MLR | Multiple linear regression |
| IBE | Inter-building effect |
| CSV | Comma-separated values |
| ACH | Air Change per Hour |
| EUI | Energy Use Intensity |
| EER | Energy Efficiency Ratio |
| MSE | Mean Squared Error |
| RMSE | Root Variant |
| MAE | Mean Absolute Error |
| MAPE | Percentage Variant |
| LCA | Life Cycle Assessment |
| DL | Deep Learning |
| WSNs | Wireless Sensor Networks |
| DFA | Data Fusion Algorithm |
| BPNN | Backpropagation Neural Network |
Appendix A
The thermal properties for some significant building components are included in Table A1.

Table A1.
Material Thermal Properties.
| Material Thermal Properties | |
|---|---|
| Roofs | 4 in lightweight concrete, U = 1.2750 W/(m2·K) |
| Exterior Walls | 8 in lightweight concrete block, U = 0.8108 W/(m2·K) |
| Interior Walls | Frame partition with ¾ in gypsum board, U = 1.4733 W/(m2·K) |
| Ceilings | 8 in lightweight concrete ceiling, U = 1.3610 W/(m2·K) |
| Floors | Passive floor, no insulation, tile or vinyl, U = 2.9582 W/(m2·K) |
| Slabs | Un-insulated solid, U = 0.7059 W/(m2·K) |
| Doors | Metal, U = 3.7021 W/(m2·K) |
| Exterior Windows | Large, double-glazed windows (reflective coating)—industry, U = 2.9214 W/(m2·K), SHGC = 0.13 |
| Interior Windows | Large single-glazed windows, U = 3.6898 W/(m2·K), SHGC = 0.86 |
| Skylights | Large, double-glazed windows (reflective coating)—industry, U = 2.9214 W/(m2·K), SHGC = 0.13 |
References
- Asadi, S.; Amiri, S.S.; Mottahedi, M. On the development of multi-linear regression analysis to assess energy consumption in the early stages of building design. Energy Build. 2014, 85, 246–255. [Google Scholar] [CrossRef]
- World Green Building Council (WGBC). New Report: The Building and Construction Sector Can Reach Net Zero Carbon Emissions by 2050; World Green Building Council: Toronto, ON, Canada, 2019. [Google Scholar]
- Hygh, J.S.; DeCarolis, J.; Hill, D.B.; Ranjithan, S.R. Multivariate regression as an energy assessment tool in early building design. Build. Environ. 2012, 57, 165–175. [Google Scholar] [CrossRef]
- Tahmasebinia, F.; Jiang, R.; Sepasgozar, S.; Wei, J.; Ding, Y.; Ma, H. Implementation of BIM energy analysis and monte carlo simulation for estimating building energy performance based on regression approach: A case study. Buildings 2022, 12, 449. [Google Scholar] [CrossRef]
- Coakley, D.; Raftery, P.; Keane, M. A review of methods to match building energy simulation models to measured data. Renew. Sustain. Energy Rev. 2014, 37, 123–141. [Google Scholar] [CrossRef] [Green Version]
- Laine, T.; Karola, A.; Oy, O.G. Benefits of Building Information Models in Energy Analysis. In Proceedings of the Clima 2007 WellBeing Indoors, Helsinki, Finland, 10–14 June 2007. [Google Scholar]
- Lu, Y.; Wu, Z.; Chang, R.; Li, Y. Building Information Modeling (BIM) for green buildings: A critical review and future directions. Autom. Constr. 2017, 83, 134–148. [Google Scholar] [CrossRef]
- Lam, J.C.; Wan, K.K.; Liu, D.; Tsang, C. Multiple regression models for energy use in air-conditioned office buildings in different climates. Energy Convers. Manag. 2010, 51, 2692–2697. [Google Scholar] [CrossRef]
- Tian, W.; Choudhary, R. A probabilistic energy model for non-domestic building sectors applied to analysis of school buildings in greater London. Energy Build. 2012, 54, 1–11. [Google Scholar] [CrossRef] [Green Version]
- Pessenlehner, W.; Mahdavi, A. Building morphology, transparency, and energy performance. In Proceedings of the Eighth International IBPSA Conference, Eindhoven, The Netherlands, 11–14 August 2003. [Google Scholar]
- Ratti, C. The lineage of the line: Space syntax parameters from the analysis of urban DEMs. Environ. Plan. B Plan. Des. 2005, 32, 547–566. [Google Scholar] [CrossRef]
- AlAnzi, A.; Seo, D.; Krarti, M. Impact of building shape on thermal performance of office buildings in Kuwait. Energy Convers. Manag. 2009, 50, 822–828. [Google Scholar] [CrossRef]
- Lapisa, R.; Bozonnet, E.; Salagnac, P.; Abadie, M.O. Optimized design of low-rise commercial buildings under various climates—Energy performance and passive cooling strategies. Build. Environ. 2018, 132, 83–95. [Google Scholar] [CrossRef]
- Price, B.A.; Smith, T.F. Thermal response of composite building envelopes accounting for thermal radiation. Energy Convers. Manag. 1995, 36, 23–33. [Google Scholar] [CrossRef]
- Sadineni, S.B.; Madala, S.; Boehm, R.F. Passive building energy savings: A review of building envelope components. Renew. Sustain. Energy Rev. 2011, 15, 3617–3631. [Google Scholar] [CrossRef]
- Alothman, A.; Ashour, S.; Krishnaraj, L. Energy Performance Analysis of Building for Sustainable Design Using Bim: A Case Study on Institute Building. Int. J. Renew. Energy Res. 2021, 11, 556–565. [Google Scholar]
- Khahro, S.H.; Kumar, D.; Siddiqui, F.; Ali, T.; Raza, M.; Khoso, A. Optimizing Energy Use, Cost and Carbon Emission through Building Information Modelling and a Sustainability Approach: A Case-Study of a Hospital Building. Sustainability 2021, 13, 3675. [Google Scholar] [CrossRef]
- Yakut, M.Z.; Esen, S. Impact of energy efficient design parameters on energy consumption in hot-humid climate zones. Res. Eng. Struct. Mater. 2020, 6, 197–206. [Google Scholar] [CrossRef]
- Al Ka’bi, A.H. Comparison of energy simulation applications used in green building. Ann. Telecommun. 2020, 75, 271–290. [Google Scholar] [CrossRef]
- Singh, P.; Sadhu, A. Multicomponent energy assessment of buildings using building information modeling. Sustain. Cities Soc. 2019, 49, 101603. [Google Scholar] [CrossRef]
- Amani, N.; Soroush, A.A.R. Building energy management using building information modeling: Evaluation of building components and construction materials. J. Renew. Energy Environ. 2021, 18, 31–38. [Google Scholar]
- Najjar, M.K.; Tam, V.W.Y.; Di Gregorio, L.T.; Evangelista, A.C.J.; Hammad, A.W.A.; Haddad, A. Integrating Parametric Analysis with Building Information Modeling to Improve Energy Performance of Construction Projects. Energies 2019, 12, 1515. [Google Scholar] [CrossRef] [Green Version]
- Motalebi, M.; Rashidi, A.; Nasiri, M.M. Optimization and BIM-based lifecycle assessment integration for energy efficiency retrofit of buildings. J. Build. Eng. 2022, 49, 104022. [Google Scholar] [CrossRef]
- Changsaar, C.; Abidin, N.I.; Khoso, A.R.; Luenhui, L.; Yaoli, X.; Hunchuen, G. Optimising energy performance of an Eco-Home using Building Information Modelling (BIM). Innov. Infrastruct. Solut. 2022, 7, 140. [Google Scholar] [CrossRef]
- Wang, W.; Guo, H.; Li, X.; Tang, S.; Xia, J.; Lv, Z. Deep learning for assessment of environmental satisfaction using BIM big data in energy efficient building digital twins. Sustain. Energy Technol. Assess. 2022, 50, 101897. [Google Scholar] [CrossRef]
- Ge, L. Green building design based on the concept of energy saving and environmental protection—Comment on “key technology of green building design and operation”. Concr. Cem Prod. 2020, 8, 97. [Google Scholar]
- Chen, Y.; Cai, X.; Li, J.; Zhang, W.; Liu, Z. The values and barriers of Building Information Modeling (BIM) implementation combination evaluation in smart building energy and efficiency. Energy Rep. 2022, 8, 96–111. [Google Scholar] [CrossRef]
- Kim, T.K. T test as a parametric statistic. Korean J. Anesthesiol. 2015, 68, 540–546. [Google Scholar] [CrossRef] [Green Version]
- Chicco, D.; Warrens, M.J.; Jurman, G. The coefficient of determination R-squared is more informative than SMAPE, MAE, MAPE, MSE and RMSE in regression analysis evaluation. PeerJ Comput. Sci. 2021, 7, e623. [Google Scholar] [CrossRef]
- Porsani, G.B.; Del Valle de Lersundi, K.; Gutiérrez, A.S.-O.; Bandera, C.F. Interoperability between Building Information Modelling (BIM) and Building Energy Model (BEM). Appl. Sci. 2021, 11, 2167. [Google Scholar]
- González, J.; Soares, C.A.P.; Najjar, M.; Haddad, A.N. BIM and BEM Methodologies Integration in Energy-Efficient Buildings Using Experimental Design. Buildings 2021, 11, 491. [Google Scholar] [CrossRef]
- Watfa, M.K.; Hawash, A.E.; Jaafar, K. Using Building Information & Energy Modelling for Energy Efficient Designs. J. Inf. Technol. Constr. 2021, 26, 427–440. [Google Scholar]
- Yang, Y.; Pan, Y.; Zeng, F.; Lin, Z.; Li, C. A gbXML Reconstruction Workflow and Tool Development to Improve the Geometric Interoperability between BIM and BEM. Buildings 2022, 12, 221. [Google Scholar] [CrossRef]
- Carvalho, J.P.; Almeida, M.; Bragança, L.; Mateus, R. BIM-Based Energy Analysis and Sustainability Assessment—Application to Portuguese Buildings. Buildings 2021, 11, 246. [Google Scholar] [CrossRef]
- Pereira, V.; Santos, J.; Leite, F.; Escórcio, P. Using BIM to improve building energy efficiency—A scientometric and systematic review. Energy Build. 2021, 250, 111292. [Google Scholar] [CrossRef]
- Olanrewaju, O.I.; Enegbuma, W.I.; Donn, M.; Chileshe, N. Building information modelling and green building certification systems: A systematic literature review and gap spotting. Sustain. Cities Soc. 2022, 81, 103865. [Google Scholar] [CrossRef]
- Guo, K.; Li, Q.; Zhang, L.; Wu, X. BIM-based green building evaluation and optimization: A case study. J. Clean. Prod. 2021, 320, 128824. [Google Scholar] [CrossRef]
- Habibi, S. Role of BIM and energy simulation tools in designing zero-net energy homes. Constr. Innov. 2022, 22, 101–119. [Google Scholar] [CrossRef]
- Amiri, S.S.; Mottahedi, M.; Asadi, S. Using multiple regression analysis to develop energy consumption indicators for commercial buildings in the U.S. Energy Build. 2015, 109, 209–216. [Google Scholar] [CrossRef]
- Bellos, E.; Tzivanidis, C.; Touris, I. Effect of thermal mass in the cooling and heating loads of buildings. In Proceedings of the 6th IC-SCCE Conference, Athens, Greece, 6–9 July 2014. [Google Scholar]
- Bryde, D.; Broquetas, M.; Volm, J.M. The project benefits of Building Information Modelling (BIM). Int. J. Proj. Manag. 2013, 31, 971–980. [Google Scholar] [CrossRef] [Green Version]
- Crawley, D.B.; Lawrie, L.K.; Winkelmann, F.C.; Buhl, W.; Huang, Y.; Pedersen, C.O.; Strand, R.K.; Liesen, R.J.; Fisher, D.E.; Witte, M.J.; et al. EnergyPlus: Creating a new-generation building energy simulation program. Energy Build. 2001, 33, 319–331. [Google Scholar] [CrossRef]
- Enshassi, M.A.; al Hallaq, K.A.; Tayeh, B.A. Limitation factors of building information modeling (BIM) Implementation. Open Constr. Build. Technol. J. 2019, 13, 189–196. [Google Scholar] [CrossRef]
- Fumo, N.; Mago, P.; Luck, R. Methodology to estimate building energy consumption using EnergyPlus Benchmark Models. Energy Build. 2010, 42, 2331–2337. [Google Scholar] [CrossRef]
- Gao, H.; Koch, C.; Wu, Y. Building information modelling based building energy modelling: A review. Appl. Energy 2019, 238, 320–343. [Google Scholar] [CrossRef]
- Kneifel, J. Life-cycle carbon and cost analysis of energy efficiency measures in new commercial buildings. Energy Build. 2010, 42, 333–340. [Google Scholar] [CrossRef]
- Korolija, I.; Zhang, Y.; Halburd, L.M.; Hanby, V.I. Regression models for predicting UK office building energy consumption from heating and cooling demands. Energy Build. 2013, 59, 214–227. [Google Scholar] [CrossRef]
- Maile, T.; Fischer, M.; Bazjanac, V. Building Energy Performance Simulation Tools—A Life-Cycle and Interoperable Perspective; CIFE Working Paper #WP107; Center for Integrated Facility Engineering (CIFE): Stanford, CA, USA, 2007. [Google Scholar]
- Monetti, V.; Davin, E.; Fabrizio, E.; André, P.; Filippi, M. Calibration of Building Energy Simulation Models Based on Optimization: A Case Study. Energy Procedia 2015, 78, 2971–2976. [Google Scholar] [CrossRef] [Green Version]
- Nguyen, A.-T.; Reiter, S.; Rigo, P. A review on simulation-based optimization methods applied to building performance analysis. Appl. Energy 2014, 113, 1043–1058. [Google Scholar] [CrossRef]
- Oduyemi, O.; Okoroh, M. Building performance modelling for sustainable building design. Int. J. Sustain. Built Environ. 2016, 5, 461–469. [Google Scholar] [CrossRef] [Green Version]
- Raof, B. The correlation between building shape and building energy performance. Int. J. Adv. Res. 2017, 5, 552–561. [Google Scholar] [CrossRef]
- Shi, X.; Tian, Z.; Chen, W.; Si, B.; Jin, X. A review on building energy efficient design optimization rom the perspective of architects. Renew. Sustain. Energy Rev. 2016, 65, 872–884. [Google Scholar] [CrossRef]
- Tian, W. A review of sensitivity analysis methods in building energy analysis. Renew. Sustain. Energy Rev. 2013, 20, 411–419. [Google Scholar] [CrossRef]
- Tian, Z.; Zhang, X.; Jin, X.; Zhou, X.; Si, B.; Shi, X. Towards adoption of building energy simulation and optimization for passive building design: A survey and a review. Energy Build. 2018, 158, 1306–1316. [Google Scholar] [CrossRef]
- Zhang, Y.; Wang, W.; Wang, Z.; Gao, M.; Zhu, L.; Song, J. Green building design based on solar energy utilization: Take a kindergarten competition design as an example. Energy Rep. 2021, 7, 1297–1307. [Google Scholar] [CrossRef]
- Zhou, Z.; Zhang, S.; Wang, C.; Zuo, J.; He, Q.; Rameezdeen, R. Achieving energy efficient buildings via retrofitting of existing buildings: A case study. J. Clean. Prod. 2016, 112, 3605–3615. [Google Scholar] [CrossRef]
- Zotkin, S.P.; Ignatova, E.V.; Zotkina, I.A. The Organization of Autodesk Revit Software Interaction with Applications for Structural Analysis. Procedia Eng. 2016, 153, 915–919. [Google Scholar] [CrossRef] [Green Version]
Figure 1.
The Framework of The Study.

Figure 2.
Revit Energy Model Workflow.

Figure 3.
Analytical Energy Model.

Figure 4.
ABS Simulated Rooms.

Figure 5.
Correlation Matrix for WWR Internal Variables (Circle indicates the degree of relevance).

Figure 6.
Line of Best Fit in Three Internal Variables of WWR Rectangular Shape’s EUI.

Figure 7.
Line of Best Fit in Three Internal Variables of WWR Triangle Shape’s EUI.

Figure 8.
Line of Best Fit in Three Internal Variables of WWR L-Shape’s EUI.

Figure 9.
Line of Best Fit in Three Internal Variables of WWR T-Shape’s EUI.

Figure 10.
Line of Best Fit in Three Internal Variables of WWR H-Shape’s EUI.

Figure 11.
Line of Best Fit in Three Internal Variables of WWR DIM-Shape’s EUI.

Figure 12.
Line of Best Fit in Three Internal Variables of WWR U-Shape’s EUI.

Figure 13.
Comparison of Constant Values for Linear Regression Models.

Figure 14.
Comparison of Variable Coefficients for Linear Regression Models.

Figure 15.
The goodness of fit plot of the rectangle WWR’s EUI.

Table 1.
Summary of selected relevant articles.
| Aim | Method | Findings and Limitations |
|---|---|---|
| Apply BIM to make an energy performance analysis of an institute building for evaluating the energy performance impact of whole building components and the energy need for each component. [15]. | Building simulation based on Revit Architecture 2018, the energy consumption measuring via GBSbased on DOE 2.2 dynamic thermal whole building energy simulation engine. | (1) Autodesk Revit 2018 and GBS can be utilized to effectively evaluate the energy performance impact of various parameters; (2) the highest impact of energy performance (0.21% and 0.19%) comes from the wall and HVAC systems, respectively, while a low contribution (0.07% and 0.11%) comes from the orientation and the roof. |
| Evaluating the positive effect of BIM for identifying different parameters and components of building to make sustainable decisions of the green building project [16]. | Developing the model by Autodesk Revit, questionnaire Data analysis by SPSS version 24, Energy analysis on GBS. | BIM and GBS can effectively provide optimized results, by alternative trials, in the early design stage for green building. Only energy consumption of the operational phase was focused on by this research, the energy use of the construction phase was not covered. |
| Evaluating the energy consumption effects of building design parameters in hot-humid climate zones [17]. | Building modeling by BIM software Autodesk Revit, energy performance analysis and design alternatives evaluation based on GBS. | (1) The HVAC system is the main source of effect for energy consumption; (2) The process of energy performance analysis can be significantly accelerated by the application of BIM in the design process because design alternatives can be easily established. |
| Assessing the performance of the most common simulating and modeling applications for green building energy consumption [18]. | Result completion and ranking for the energy performance analysis via DesignBuilder, IDA-ICE, IES-VE, EnergyPlus, TRNSYS, eQUEST, AutodeskGBS Ecotect, RIUSKA, and VIP-Energy software. | The performance of ten energy modeling applications can be ranked in descending order through the comparison results: (1) TRNSYS, (2) Ecotect, (3) Autodesk-GBS, (4) EnergyPlus, (5) IES-VE, (6) IDAICE, (7) VIP-Energy, (8) DesignBuilder, (9) eQUEST, and (10) RIUSKA. |
| To develop a new method to identify critical parameters which will influence the energy efficiency considering with various external and internal factors [19]. | Building energy simulation by GBS building components modeling based on Revit Architecture software, inter-building effect (IBE) analysis. | The building lifecycle budget can be affected by the external or internal configuration changes of the structure; the location of the building relative to the sun’s path decide the building’s ability to get heat from solar energy; Changing the WWR plays an important role in optimizing building energy performance. |
| Using BIM to evaluate the impact of the building components and materials for building energy consumption in a mild climate zone [20]. | Building modeling based on Autodesk Revit software, Energy modeling and analysis by Autodesk GBS software. | Using BIM to adjust the design parameters, which can affect building energy consumption, is an effective way to decrease energy costs. The HVAC system contributes the most impact on building energy consumption. |
| Investigating a framework to improve the building energy consumption management in different climatic conditions [21]. | The utilization of Autodesk Revit software for the building components and climate data defining, building modeling; Linear regression analysis via Minitab software; energy consumption estimation through the Autodesk GBS software. | Building energy consumption can be significantly influenced by the type of building design and the climate data. The WWR has more influence on building energy consumption than using super-high insulation building components. Limitation: this research did not consider the impact of building classification on energy consumption, and the range of selected building materials is not sufficient. |
| Develop an innovative framework to improve the decision-making of energy optimization for existing buildings [22]. | Mathematical optimization; 3D model design, energy modeling and simulation by Autodesk REVIT software and GBS; environmental impact analysis through Life Cycle Assessment (LCA) based on Tally REVIT software. | The service life costs and energy consumption of buildings can be significantly reduced by the framework based on the integration of mathematical optimization, BIM, and LCA (24–58% energy saving for the studied case building). Energy performance is mainly influenced by building evaporative of coolers and envelopes. |
| Investigate the probability of utilizing BIM to optimize building energy performance and identify the main types of equipment that could affect the energy consumption of Eco-Home [23]. | 3d modeling by Autodesk Revit 2018 software; base and optimized energy analysis based on GBS software. | The overall energy performance measurements can be effectively improved by energy performance analysis by integration of BIM and GBS. The highest percentage of energy consumption from air conditioner (about 40%) in the case building, and the second is lighting equipment. The equipment with lowest energy needs is the smart ceiling fans. |
| Evaluate the availability of using BIM big data in Building Digital Twins for building energy efficiency [24]. | Deep Learning (DL) approach, building modeling and simulation by BIM, Data collection by Deep Learning by Wireless Sensor Networks (WSNs), improvement of data fusion quality based on Data Fusion Algorithm (DFA) and Backpropagation Neural Network (BPNN), validate effectiveness through the survey of environmental satisfaction of residents. | The result shows that the comprehensive utilization of BIM and Digital Twins applications can provide a positive effect on intelligent buildings in modern times (92.38% of residents satisfied in 525 results). |
Table 2.
Summary of design variables.
| Design Variables | Analysis Methods | |
|---|---|---|
| 1 | WWR |
|
| 2 | Building Orientation (Degrees) |
|
| 3 | Wall Construction (U-Value) |
|
| 4 | Roof Construction (U-Value) |
|
| 5 | Infiltration (ACH) |
|
| 6 | Lighting efficiency |
|
| 7 | Daylighting and Occupancy Control |
|
| 8 | Plug Load Efficiency |
|
| 9 | HVAC Types |
|
| 10 | Operating Schedule |
|
| 11 | Min/Max Internal Loads |
|
| 12 | Min/Max Envelope | |
| 13 | Min/Max Form |
Table 3.
WWR Internal Variables Summary.
| WWR Dependent Variables Summary | |
|---|---|
| Percent | 0%; 30%; 65%; 95% |
| Direction | Northern; Southern; Western; Eastern |
| Window Glass Type | No change; Single Clr; Double Clr; Double LoE; Triple LoE |
| Window Shade | No change; 1/3 Window; 2/3 Window |
Table 4.
Summary of WWR multilinear regression equations.
| S1-Rec | S2-Tri | S3-L | S4-T | S5-H | S6-DMD | S7-U | |
|---|---|---|---|---|---|---|---|
| 668.573 | 683.754 | 668.168 | 671.181 | 670.254 | 661.151 | 667.568 | |
| 2.977 | 4.016 | 4.052 | 4.011 | 4.536 | 3.284 | 4.486 | |
| 37.234 | 62.092 | 53.434 | 55.981 | 62.845 | 43.035 | 61.058 | |
| −19.509 | −29.779 | −25.484 | −28.666 | −29.585 | −20.460 | −30.389 | |
| R2 | 0.360 | 0.244 | 0.382 | 0.330 | 0.376 | 0.313 | 0.379 |
Publisher’s Note: MDPI stays neutral with regard to jurisdictional claims in published maps and institutional affiliations. |
© 2022 by the authors. Licensee MDPI, Basel, Switzerland. This article is an open access article distributed under the terms and conditions of the Creative Commons Attribution (CC BY) license (https://creativecommons.org/licenses/by/4.0/).
Share and Cite
MDPI and ACS Style
Tahmasebinia, F.; Jiang, R.; Sepasgozar, S.; Wei, J.; Ding, Y.; Ma, H. Using Regression Model to Develop Green Building Energy Simulation by BIM Tools. Sustainability 2022, 14, 6262. https://doi.org/10.3390/su14106262
AMA Style
Tahmasebinia F, Jiang R, Sepasgozar S, Wei J, Ding Y, Ma H. Using Regression Model to Develop Green Building Energy Simulation by BIM Tools. Sustainability. 2022; 14(10):6262. https://doi.org/10.3390/su14106262
Chicago/Turabian StyleTahmasebinia, Faham, Ruifeng Jiang, Samad Sepasgozar, Jinlin Wei, Yilin Ding, and Hongyi Ma. 2022. "Using Regression Model to Develop Green Building Energy Simulation by BIM Tools" Sustainability 14, no. 10: 6262. https://doi.org/10.3390/su14106262
Note that from the first issue of 2016, this journal uses article numbers instead of page numbers. See further details here.