Article

Agriculture and Pollinating Insects, No Longer a Choice but a Need: EU Agriculture’s Dependence on Pollinators in the 2007–2019 Period

1
LEAF—Department of Land, Environment, Agriculture and Forestry, University of Padua, Viale dell’Università 16, 35020 Legnaro, Italy
2
DISTAL—Department of Agricultural and Food Sciences, University of Bologna, Viale Giuseppe Fanin, 42, 40127 Bologna, Italy
3
Cirve—Interdepartmental Research Center for Oenology and Viticulture, University of Padua, Via XXVIII Aprile 14, 31015 - Conegliano, Italy [email protected]
*
Author to whom correspondence should be addressed.
Sustainability 2022, 14(6), 3644; https://doi.org/10.3390/su14063644
Submission received: 14 February 2022 / Revised: 4 March 2022 / Accepted: 17 March 2022 / Published: 20 March 2022
(This article belongs to the Topic Insects in Sustainable Agroecosystems)

Abstract

:
One of the new objectives laid out by the European Union’s Common Agriculture Policy is increasing environmental sustainability. In this paper we compare the degree of average dependence index for each member state (ADIMS) in EU28 from 2007 to 2019 in order to verify the following: (1) whether there was a difference in this index when comparing two CAP periods—(a) from 2007 to 2013 and (b) from 2014 to 2019—and (2) which crops had a larger effect on the ADIMS. The study showed no significant variation in the average ADIMS at EU level between the first (2007–2013) and second (2014–2019) CAP periods. The AIDMS index highlighted three types of EU agriculture: (1) agriculture in Eastern Europe, including Bulgaria, Hungary, Romania and Slovakia, characterized by a high level of ADIMS (10.7–22) due to the widespread cultivation of oil crops as rapeseed and sunflower; (2) Mediterranean agriculture including Portugal, Spain, Italy, Croatia, Greece, Malta, Cyprus and France with lower AIDMS levels (5.3–10.3) given their heterogeneous crop portfolios with different degrees of dependence on animal pollination (almond, soy, rapeseed, sunflower and tomatoes) and (3) continental agriculture including Germany, Austria, Slovenia, Poland, the Czech Republic, Baltic countries, Benelux, Finland, Sweden and Ireland, which are characterized by the lowest ADIMS level (0.7–10.6) due to the widespread cultivation of cereals (anemophily and self-pollination) which increase the denominator of the index. The study suggests that a sustainable management of the agroecosystem will be possible in the future only if CAP considers pollinators’ requirements by quantifying the timing and spatial food availability from cultivated and uncultivated areas.

1. Introduction

Approximately 70% of 1330 tropical crops [1] and 85% of 264 crops cultivated in Europe [2] benefit from animal pollination. Furthermore, pollinators can increase the production of ≈75% of the 115 most important crops worldwide, as measured by food production [3,4] and economic value [5]. In temperate regions, pollinators are generally insects, mainly hymenopterans (especially bees) but also dipterans (especially hoverflies) [6]. With 20,000 species all over the world, bees represent the most significant pollinators in terms of abundance and importance both for wild plants and crop species in most ecosystems, with honeybees and bumblebees playing an important role in Europe and North America [4,7]. According to Potts et al. [8], bees visit more than 90% of cultivated plants, while 30 percent of crops may be visited by flies. Bees are considered excellent pollinators because they are the only group that rely almost completely on floral resources both as adults and larvae, while syrphids only visit flowers in their adult stage [9,10]. The floral resources on which they forage are nectar and pollen, which represent their source of sugar and proteins, respectively. Moreover, pollen is an essential resource for offspring development and its nutritive value can vary between plant species; for this reason, it is fundamental for bees to have different pollen sources [7]. Food preferences vary between bee species, and this specialization is called lecty; oligolectic species forage on few plants, while polylectic species, such as honeybees and bumblebees, have a broader diet. In light of this, it becomes of primary importance to have a diversified landscape both inside and around cultivated fields, since many studies have highlighted the positive correlation between enhanced floral resources and a higher density and/or diversity of pollinators [11,12,13]. Managed pollinators, namely the western honeybee (Apis mellifera) and bumblebees (Bombus spp.), contribute to crop pollination but some studies have underlined the importance of wild bees for an improved seed set and fruit quality [14,15,16], especially for species that require cross pollination such as apples. There is clear evidence that both honeybees and wild bees are threatened by climate change and intensive agriculture, mainly based on monocultural plantings and the use of pesticides that impact both the landscape and pollinator communities, thus reducing the ecosystem services provided by this class of organisms. Some studies have underlined the relation between agricultural intensification, especially soybean, corn and wheat monoculture, and decrease in functional diversity, wild bee abundance and species richness [17,18] with special concern for ground nesting species and oligolectic species. Pesticides affect bees in different ways by shortening their life span but also through alterations of their immune system and development [19], thus contributing to the overall decline of bee populations. Moreover, honeybee colonies are facing a phenomenon called Colony Collapse Disorder (hereafter CCD), which has been occurring since 2006/2007 in North America and Europe and consists of a sudden decline in the number of worker bees that leads to depopulation of the entire colony. The CCD is attributable to different factors which include pesticides (especially neonicotinoids), microorganisms and mites such as Varroa destructor but also degradation of natural habitats due to anthropic activities [19]. The CCD phenomenon has highlighted that the reliance on a single pollinating species, Apis mellifera, puts our food supply at risk [4,8]. Therefore, it is necessary to restore and preserve an adequate environment for bees through new approaches to agricultural and landscape management. Less intensive farming, such as organic farming, but also the use of IPM have shown a positive effect on pollinator diversity and abundance, though with lower effects at the local scale. The use of more expensive and lower-impact pesticides is another solution proposed by Bolzonella et al. [20]. In fact, several studies [13,21,22,23] have demonstrated that landscape composition has a pivotal role in the support of bee populations, whereby a higher landscape heterogeneity provides more floral resources alongside nesting habitats, since around 70% of bees nest in the ground. The growing concern for the decline of pollinators has led to a legal protection represented by different strategies adopted by the European Union, such as the EU Pollinators Initiative adopted in June 2018 which outlines three main objectives: (1) improving the knowledge of pollinator decline, (2) tackling the causes of pollinator decline and (3) raising public awareness on pollinators. In addition, the new European Green Deal aims to significantly reduce the use of pesticides by 2030 (“From Farm to Fork”) and to support the pollination process by inverting pollinator decline (“Biodiversity”) [19]. Regarding pesticide exposure, Regulation (EC) No. 1107/2009 [24] which regulates the market placement of Plant Protection Products foresees that new products must not be harmful to bees and such claims must be supported by an adequate risk assessment. Other initiatives, such as the EU project Life4Pollinators, are implemented with the aim of sensitizing the public and policy makers to conservation actions for bees, such as urban gardens and landscape management. The EU28 utilized agricultural area (UAA) covers 38.16% (161,548,000 ha) of the total surface (423,326,200 ha) [25]. Populations of pollinating insects are strongly affected by the type of agriculture (intensive degree) and by the type of crops. Certain agricultural practices are among the leading causes of the alarming decline of pollinators in Europe [26]. In the present paper, we analyze the dynamic of the crop surface in the European Member States (MS) during the 2007–2019 period with the aim of quantifying the dynamics of the average dependence index per member state (ADIMS) over time in the European agricultural sector. The paper is structured as follows. First, we describe the data used in the analysis and the methodology is introduced. The data used for the ADIMS calculation are 2007–2019 crops’ harvested areas collected by the FAO database and the pollination dependency index (PDI) for each crop obtained from bibliographic sources [4]. Second, the major findings from data analysis are presented in Section 3. Different types of agriculture are classified according to the ADIMS degree and the crops per MS with a larger effect on the ADIMS. Finally, the concluding discussion of the study is reported in Section 4 (Figure 1).

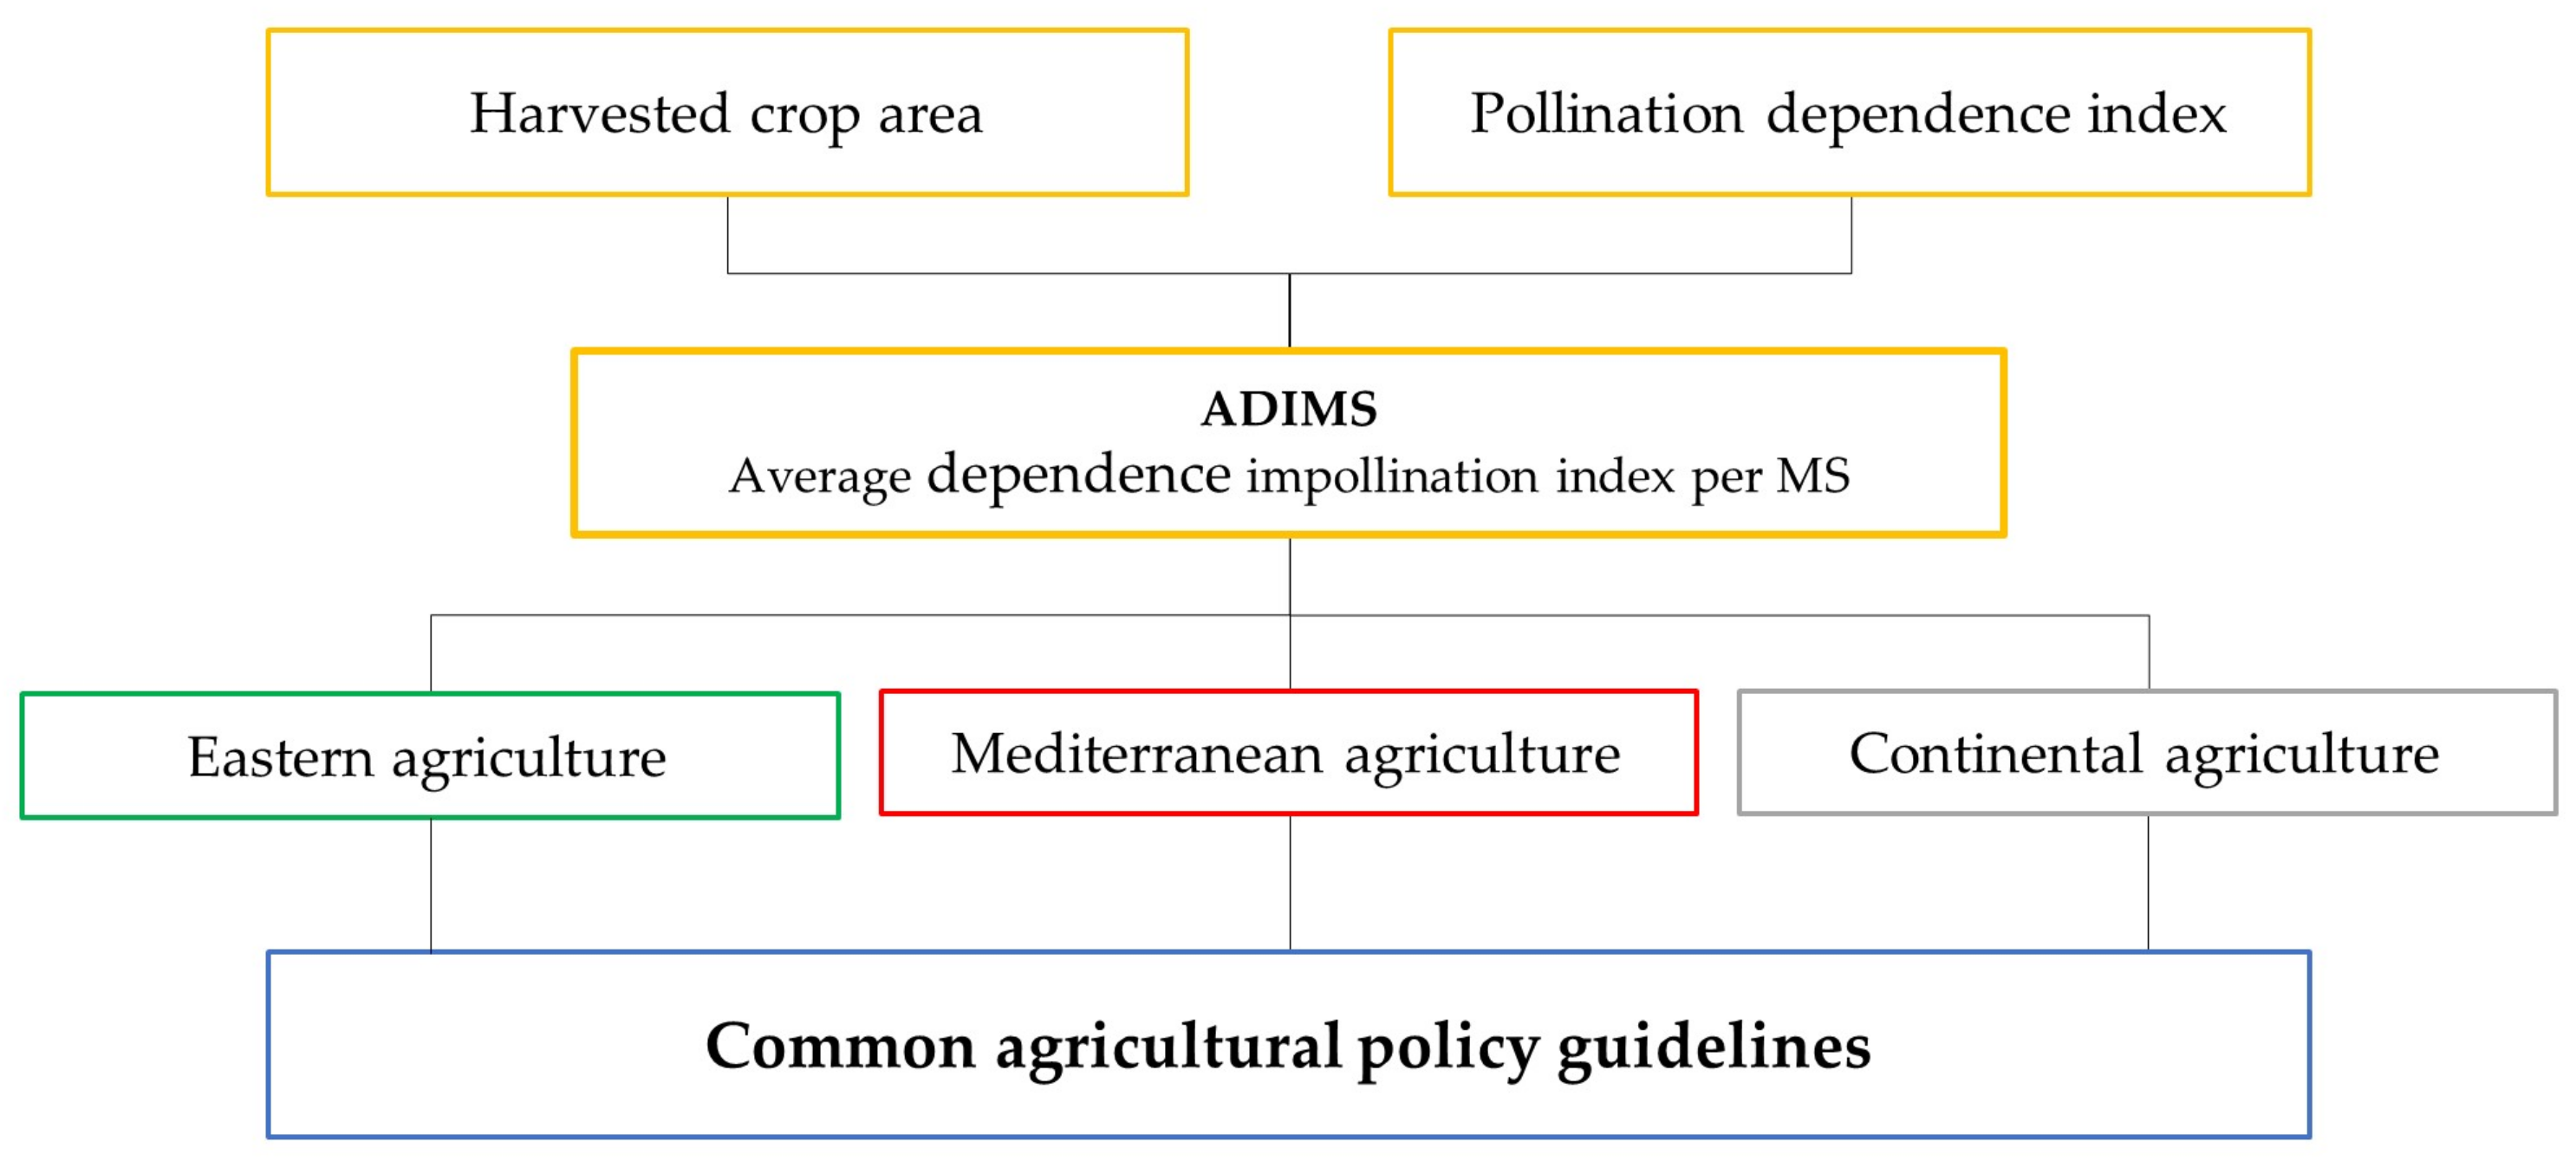
2. Materials and Methods

2.1. Data Collection

The analysis quantifies the evolution of the Average Dependence Index per MS (ADIMS) per hectare of crops in the EU. For this purpose, we considered the individual harvested crop area as reported in FAO dataset [27] from 2007 to 2019 for each EU28 Member State (MS). The Primary Crops Area harvested refers to the area from which a crop is gathered. Primary Crops are those which come directly from the land and without having undergone any real processing, apart from cleaning. They maintain all the biological qualities they had when they were still on the plants [27]. Primary Crops include fiber crops, cereals, coarse grain, fruits, jute and jute-like fibers, oilcakes and their equivalents, oil crops, pulses, roots and tubers, tree nuts and vegetables. The FAO dataset recorded 173 primary crops in the world and 119 in EU28. The usable agricultural area (UAA) describes the area used for farming. The term does not include unused agricultural land, woodland and land occupied by buildings, farmyards, tracks, ponds, etc. The UAA of each country for the period 2009–2019 was evaluated summing the harvested surface area of each crop per year. During this period, two programming periods of the Community Agricultural Policy (CAP) took place. These plans influenced the range of crops practiced in the EU through crop diversification obligations, establishment of ecological areas of interest (EFA), maintenance of permanent meadows and pastures and implementation of agri-environment-climate measures (AECM). The Common Agricultural Policy (CAP), in addition to pursuing the fundamental objectives for which it was established (Article 39 Treaty of Rome, 1957) [28], such as increasing agricultural productivity, ensuring a fair standard of living for the agricultural population, stabilizing markets, guaranteeing security of supply and ensuring reasonable prices for consumers, tries to respond to the growing demand for environmental sustainability by the EU population. The CAP guides farmers’ choices and its role in the future will be decisive [29]. However, the needs of pollinators have rarely been explicitly considered in the CAP design and planning, so rural development programs of EU MS have not used the full range of possible CAP measures to support pollinator conservation [26]. In particular, it has been limited to advice on how to preserve biodiversity in general and in relation to honeybees, but without mention of wild pollinators, and it does not consider the abundance, diversity and continuity of floral resources at the landscape level [26]. In order to assess the degree of agriculture’s dependence on pollinators, we considered only the cultivated areas of primary crops as reported in the FAO dataset. As can be seen from the crop pollination dependency index (PDI) [4], some crops only offer integration in the feeding of pollinators, as their blooming period is concentrated in specific time and area. The index of dependence on the pollination service (PDI) for each known crop was developed by the FAO [30]. It provides a measure of the decrease in the total volume of production that a crop undergoes in the event of a lack of pollination by pollinators. Following Klein et al. [4], we classified crops on the basis of their level of pollinator dependence, defined as the percentage of yield reduction resulting from an absence of pollinators. The dependence categories were: none (0% yield reduction), little (<10% yield reduction), modest (10 to 40% yield reduction), great (40 to 90% yield reduction) and essential (≥90% yield reduction). The levels of pollinator dependence contained between 5 (“essential”) and 56 (“none”) crops, representing respectively 253,815.23 ha and 71.2 million ha each year in EU.
Table 1 shows in column 5 the harvested crops’ average areas (2007–2019) in EU28 and the incidence (column 6) on the total average cultivated area (UAA). The average annual area of the 119 crops in the FAO database is equal to 89,029,995 ha, where grass and pasture are not considered.
The average annual area of the 119 crops in the FAO database is equal to 89,029,995 ha, where grass and pasture are not considered. Pollinated crops have limited impact in terms of surface area at EU level. The most cultivated is rapeseed, with more than 6.5 million hectares equal to 7.34% of the EU cultivated area, thus being the fourth largest crop after wheat (29.34%), barley (14.25%) and corn (10.05%) in terms of surface. It is followed by sunflower with 4 million hectares (4.59%). Other crops have an incidence lower than 1% as almonds (0.78%), soybeans (0.68%), apples (0.60%), tomatoes (0.31%), peaches (0.26%) and plums (0.19%).
In order to quantify the average dependence index for each member state (ADIMS) on entomophilic pollination, the crop areas were multiplied by their respective dependency indices (PDI). The indicator thus obtained for each crop was added up for each state in each year and then divided by the total crop area of the MS (UAA). The index was multiplied by 100 in order to obtain a whole number (1).
ADIMS = crop   area     pollination   dependency   index   UAA · 100
Our study does not consider semi-natural and natural areas for which data relating to the phytosociological composition at country level are not available (grassland, meadows, etc.) nor the surface of the marginal areas of these elements within or near the cultivated areas.

2.2. Statistical Analysis

First, based on the average ADIMS calculated in the period 2007–2019, a one-way ANOVA was carried out to determine whether there are any significant differences in ADIMS when comparing three main types of agriculture in the EU (Eastern European, Mediterranean and continental). Second, a principal component analysis (PCA) was carried out to identify which crops dependent on entomophilic pollination affect the indices of the various MS. The PCA is a statistical procedure that allows an inspection of data structure by transforming a set of possibly correlated measures into a series of uncorrelated linear combinations of the variables, the principal components which represent most of the variance. The first component contains the greatest variance, whereas each subsequent component explains the remaining part of the variance.

3. Results

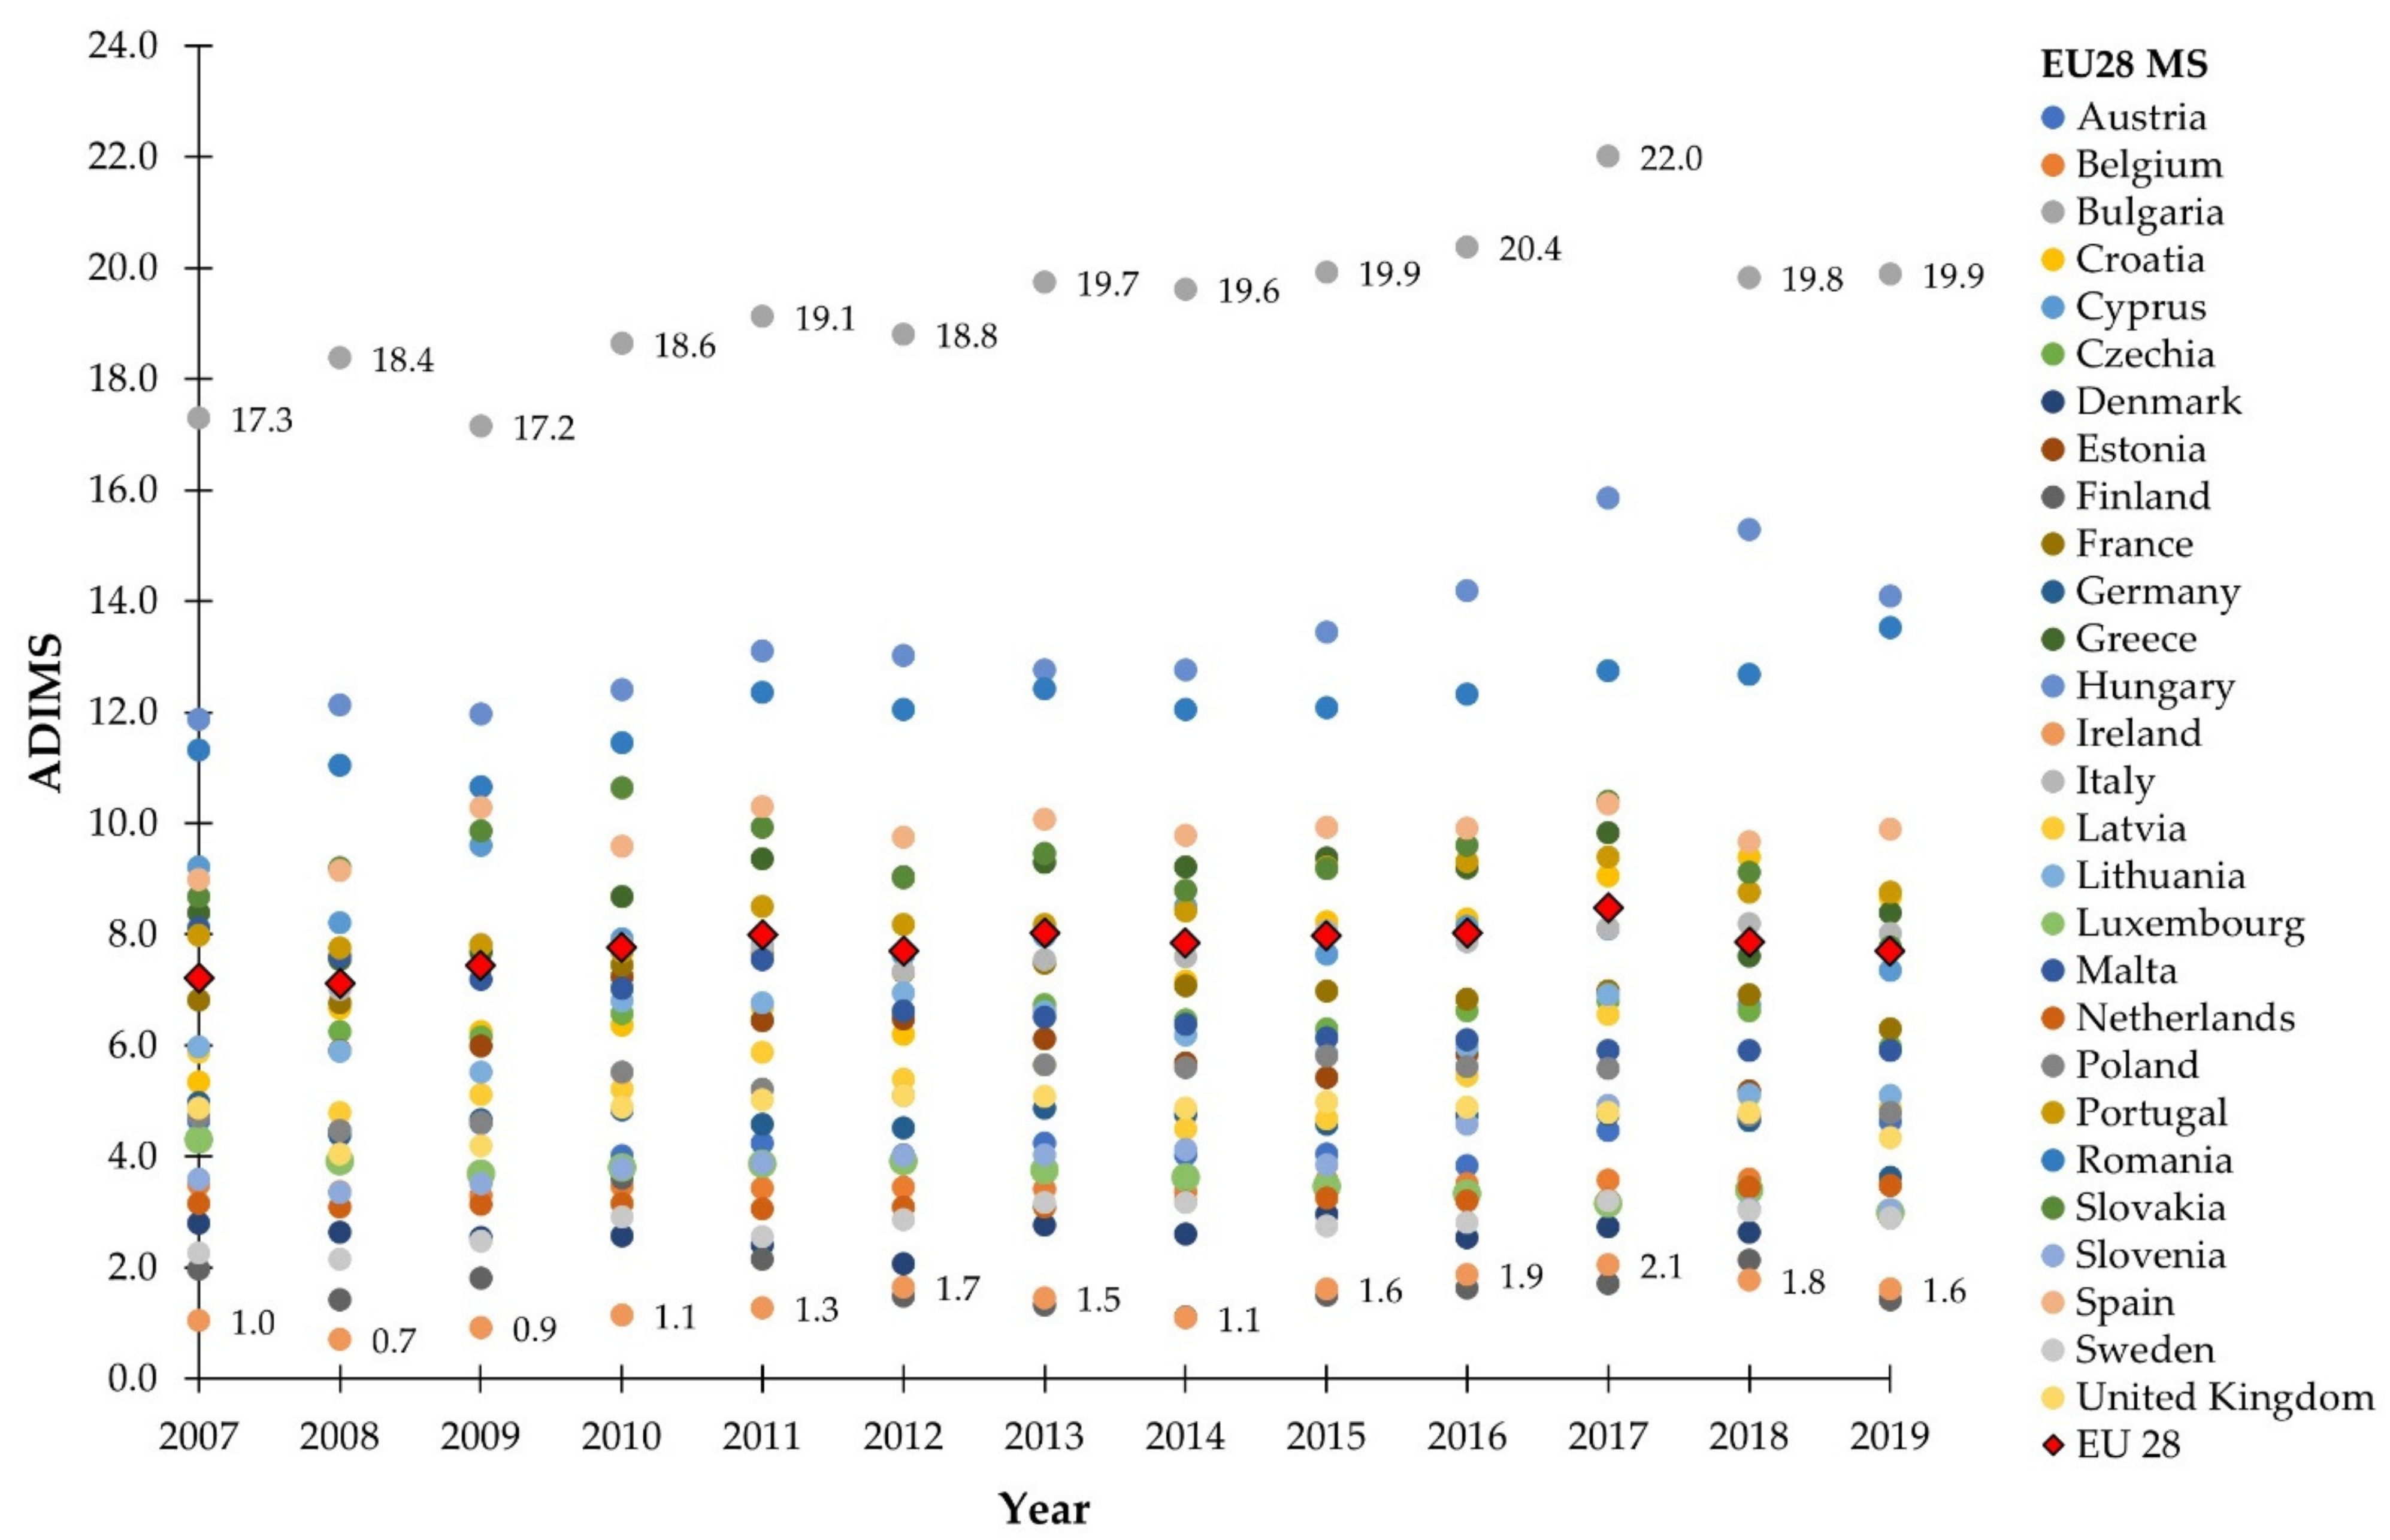
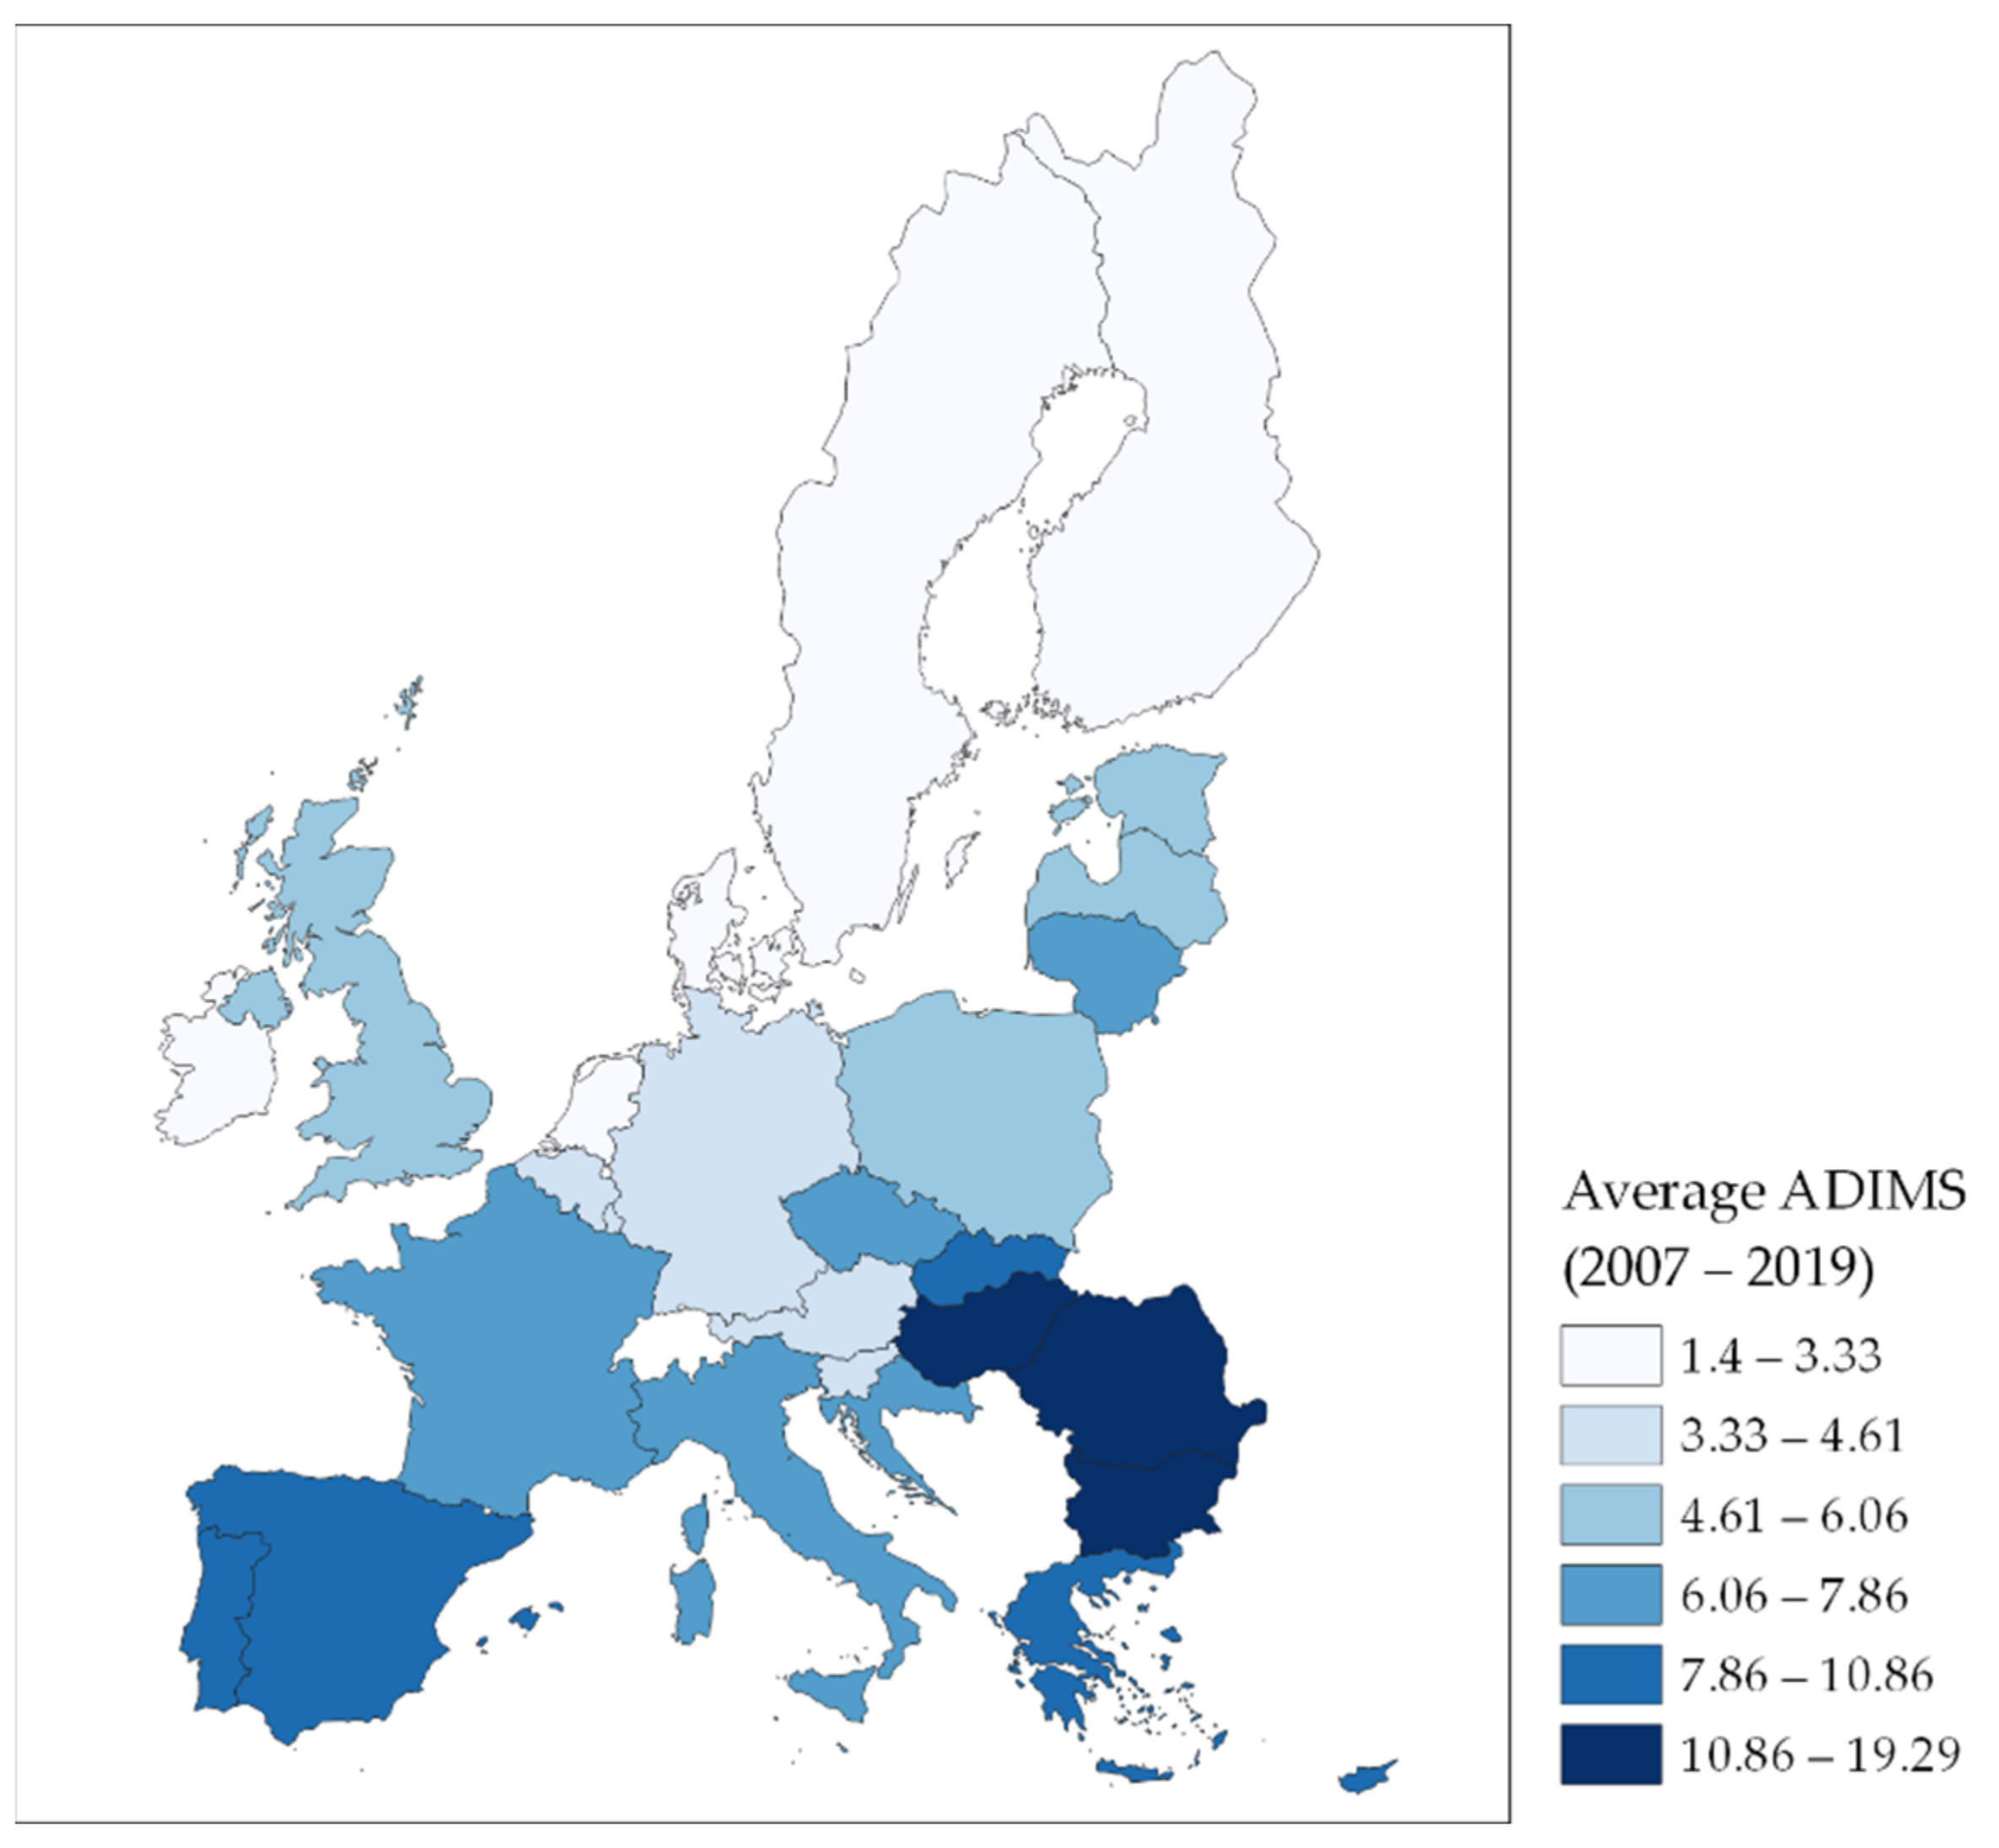
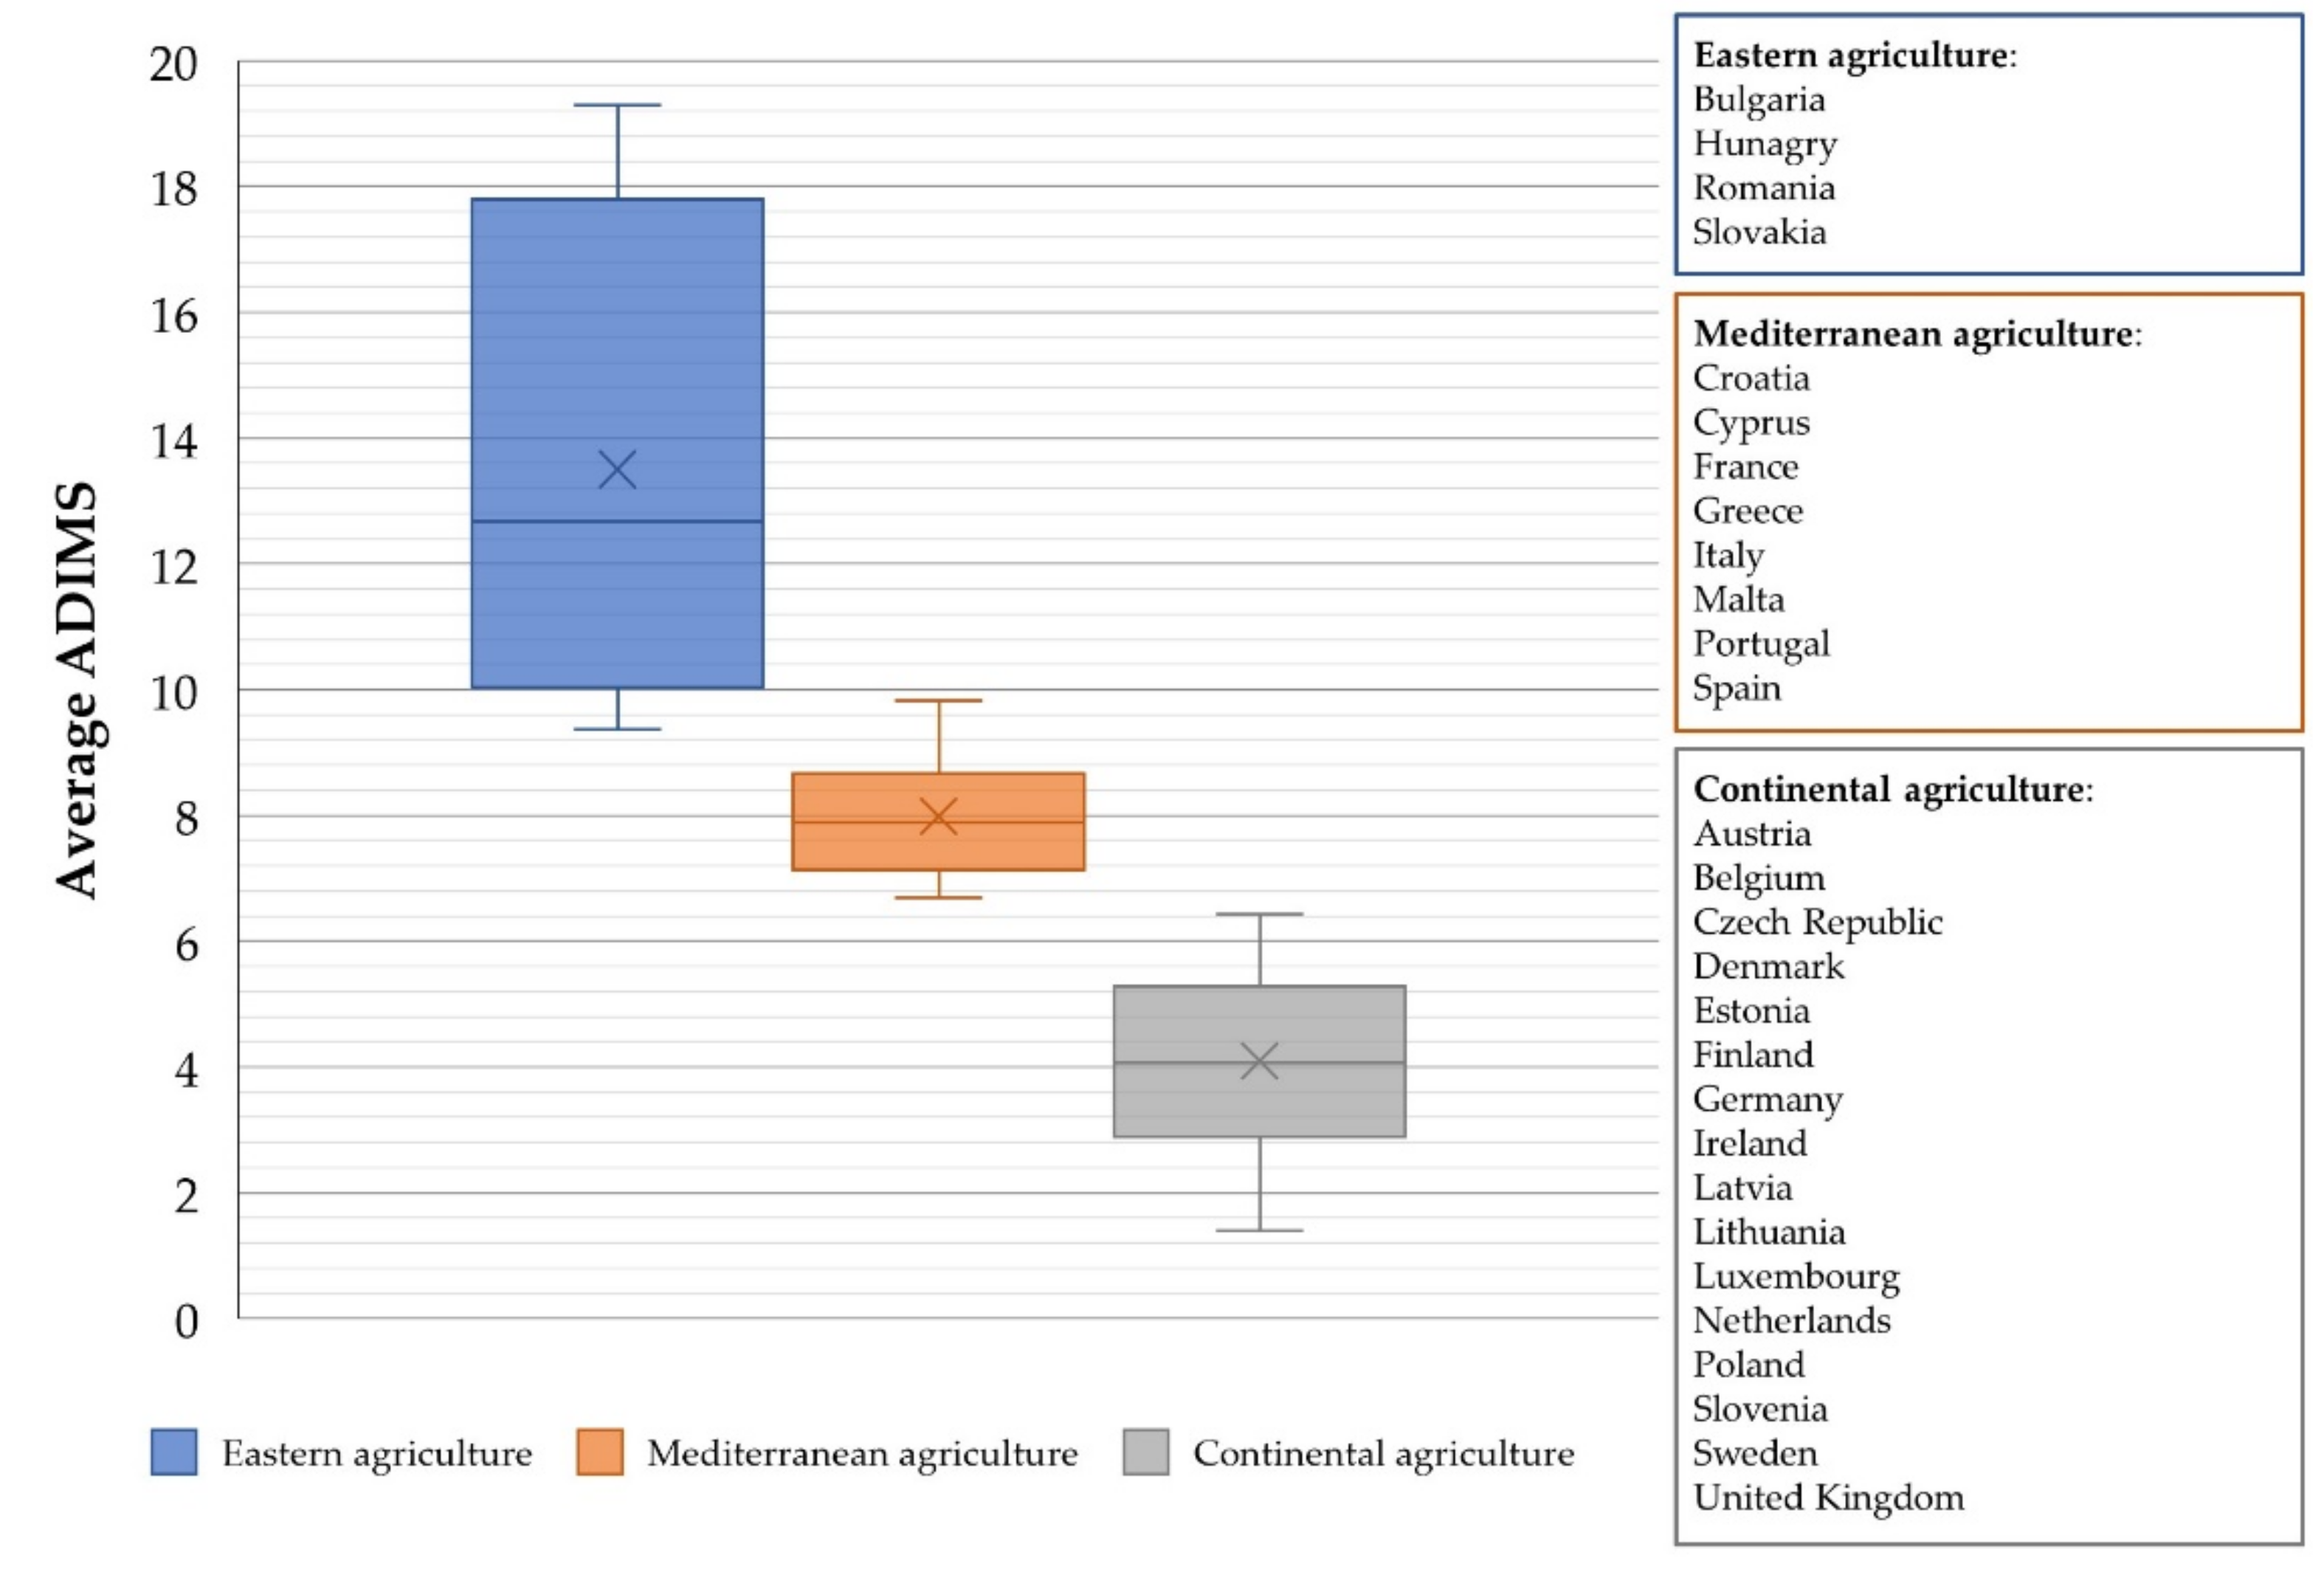
3.1. Trend of ADIMS for EU28 MS

At the EU level, the dependence indicator ADIMS increased by 1.97% from 7.86 (average index 2012–2014) to 8.01 (average index 2017–2019) but it was not statistically significant. The range varied from 1.1 in Finland 2014 to 22.00 in Bulgaria 2017 (Figure 2). We considered for the first period and second period the middle triennial 2012–2014 and 2017–2019 where the CAP was completely in place.
The dependency of agriculture on animal pollination varies among MS according to different climate conditions and crops cultivated. Figure 3 shows the average ADIMS, with darker colors representing higher ADIMS levels.
Figure 4 classified MS by average ADIMS level obtained by ANOVA one-way analysis with the Tukey test (p < 0.005).
The first group is composed of Eastern European countries: Bulgaria, Hungary, Romania and Slovakia. These states had the highest indices, ranging from 9.36 in Slovakia to 19.29 in Bulgaria. All these states grow rapeseed, which is an important contribution to their ADIMS values. In Group 2, there are Mediterranean countries including Spain, Portugal, Greece, Italy, Cyprus, Malta, Croatia and France. The ADIMS ranged from 6.69 in Malta to 9.82 in Spain, and the crop portfolio of these countries is more heterogeneous. Group 3 contains continental countries characterized by lower ADIMS, ranging from 1.4 in Ireland to 6.42 in Czech Republic. In this category, the main crops dependent on pollination are soy, as in the case of Slovenia, pears and apples in the case of Benelux and broad beans and horse beans in Northern European countries such as Ireland, Finland, Sweden and Denmark.

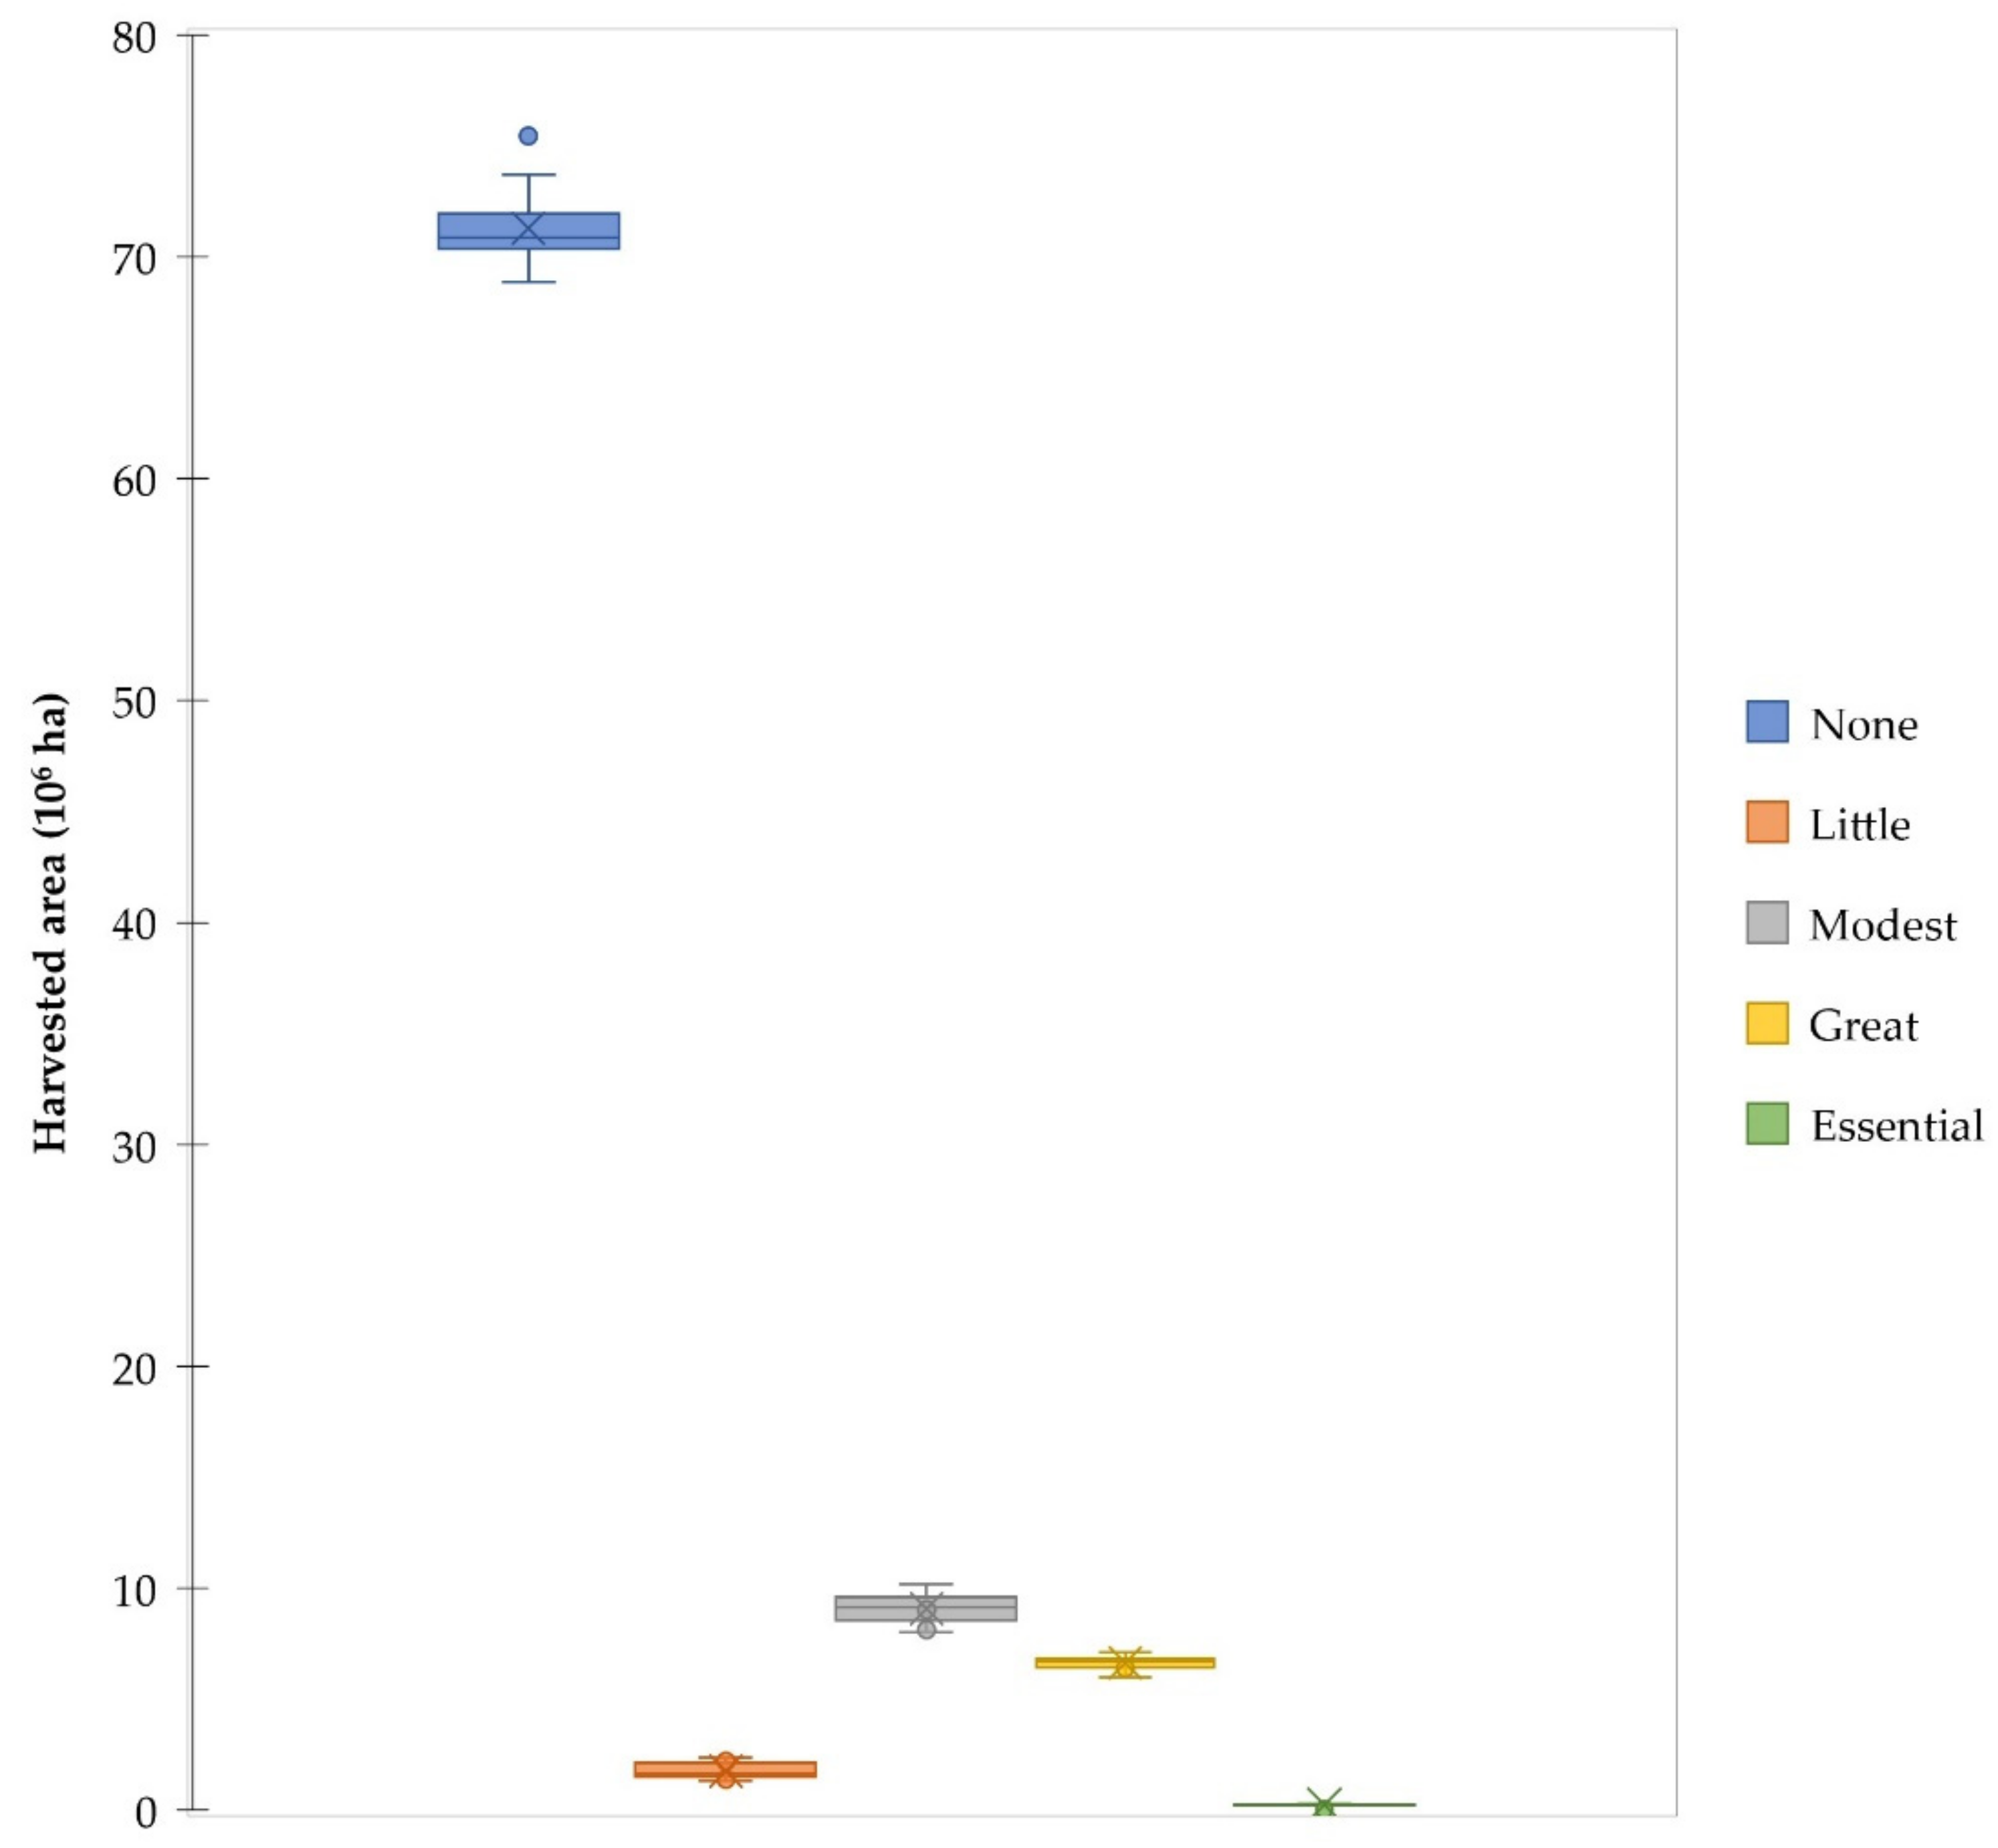
3.2. Crop Surface by Pollination Dependence Index (PDI)

Table 2 drives crop surface into categories by pollinator dependence index level (PDI) per year. It appears that there was a reduction in crops that are not dependent on animal pollination (category “none”). In particular, barley had an average variation of −1,459,967 ha, mixed grains an average variation of −542,465 ha and potatoes an average variation of −492,523 ha. Increases in surface area were seen in crops classified as either great (sunflower seeds with + 1,039,784 ha, almonds with shell with + 100,528 ha and raspberry + 9146 ha) or little (peas, dry + 234,929 ha, flax fiber and tow + 34,468 ha and green peas + 27,643 ha).
Figure 5 shows the surface area of cultivated crops classified by their dependence index levels (PDIs) in EU28.
European agriculture is characterized by crops that are not dependent on animal pollination such as wheat, corn, barley, grapes, olives, sugar beet, potatoes, rye, etc. Crops classified as none decreased by 3% during the period analyzed (−2,025,134 hectares). Other crops that depend to various degrees on animal pollination are classified into little, modest, great and essential. These crops cover in total a surface of 20% equal to 17,741,369 hectares at the EU28 level.

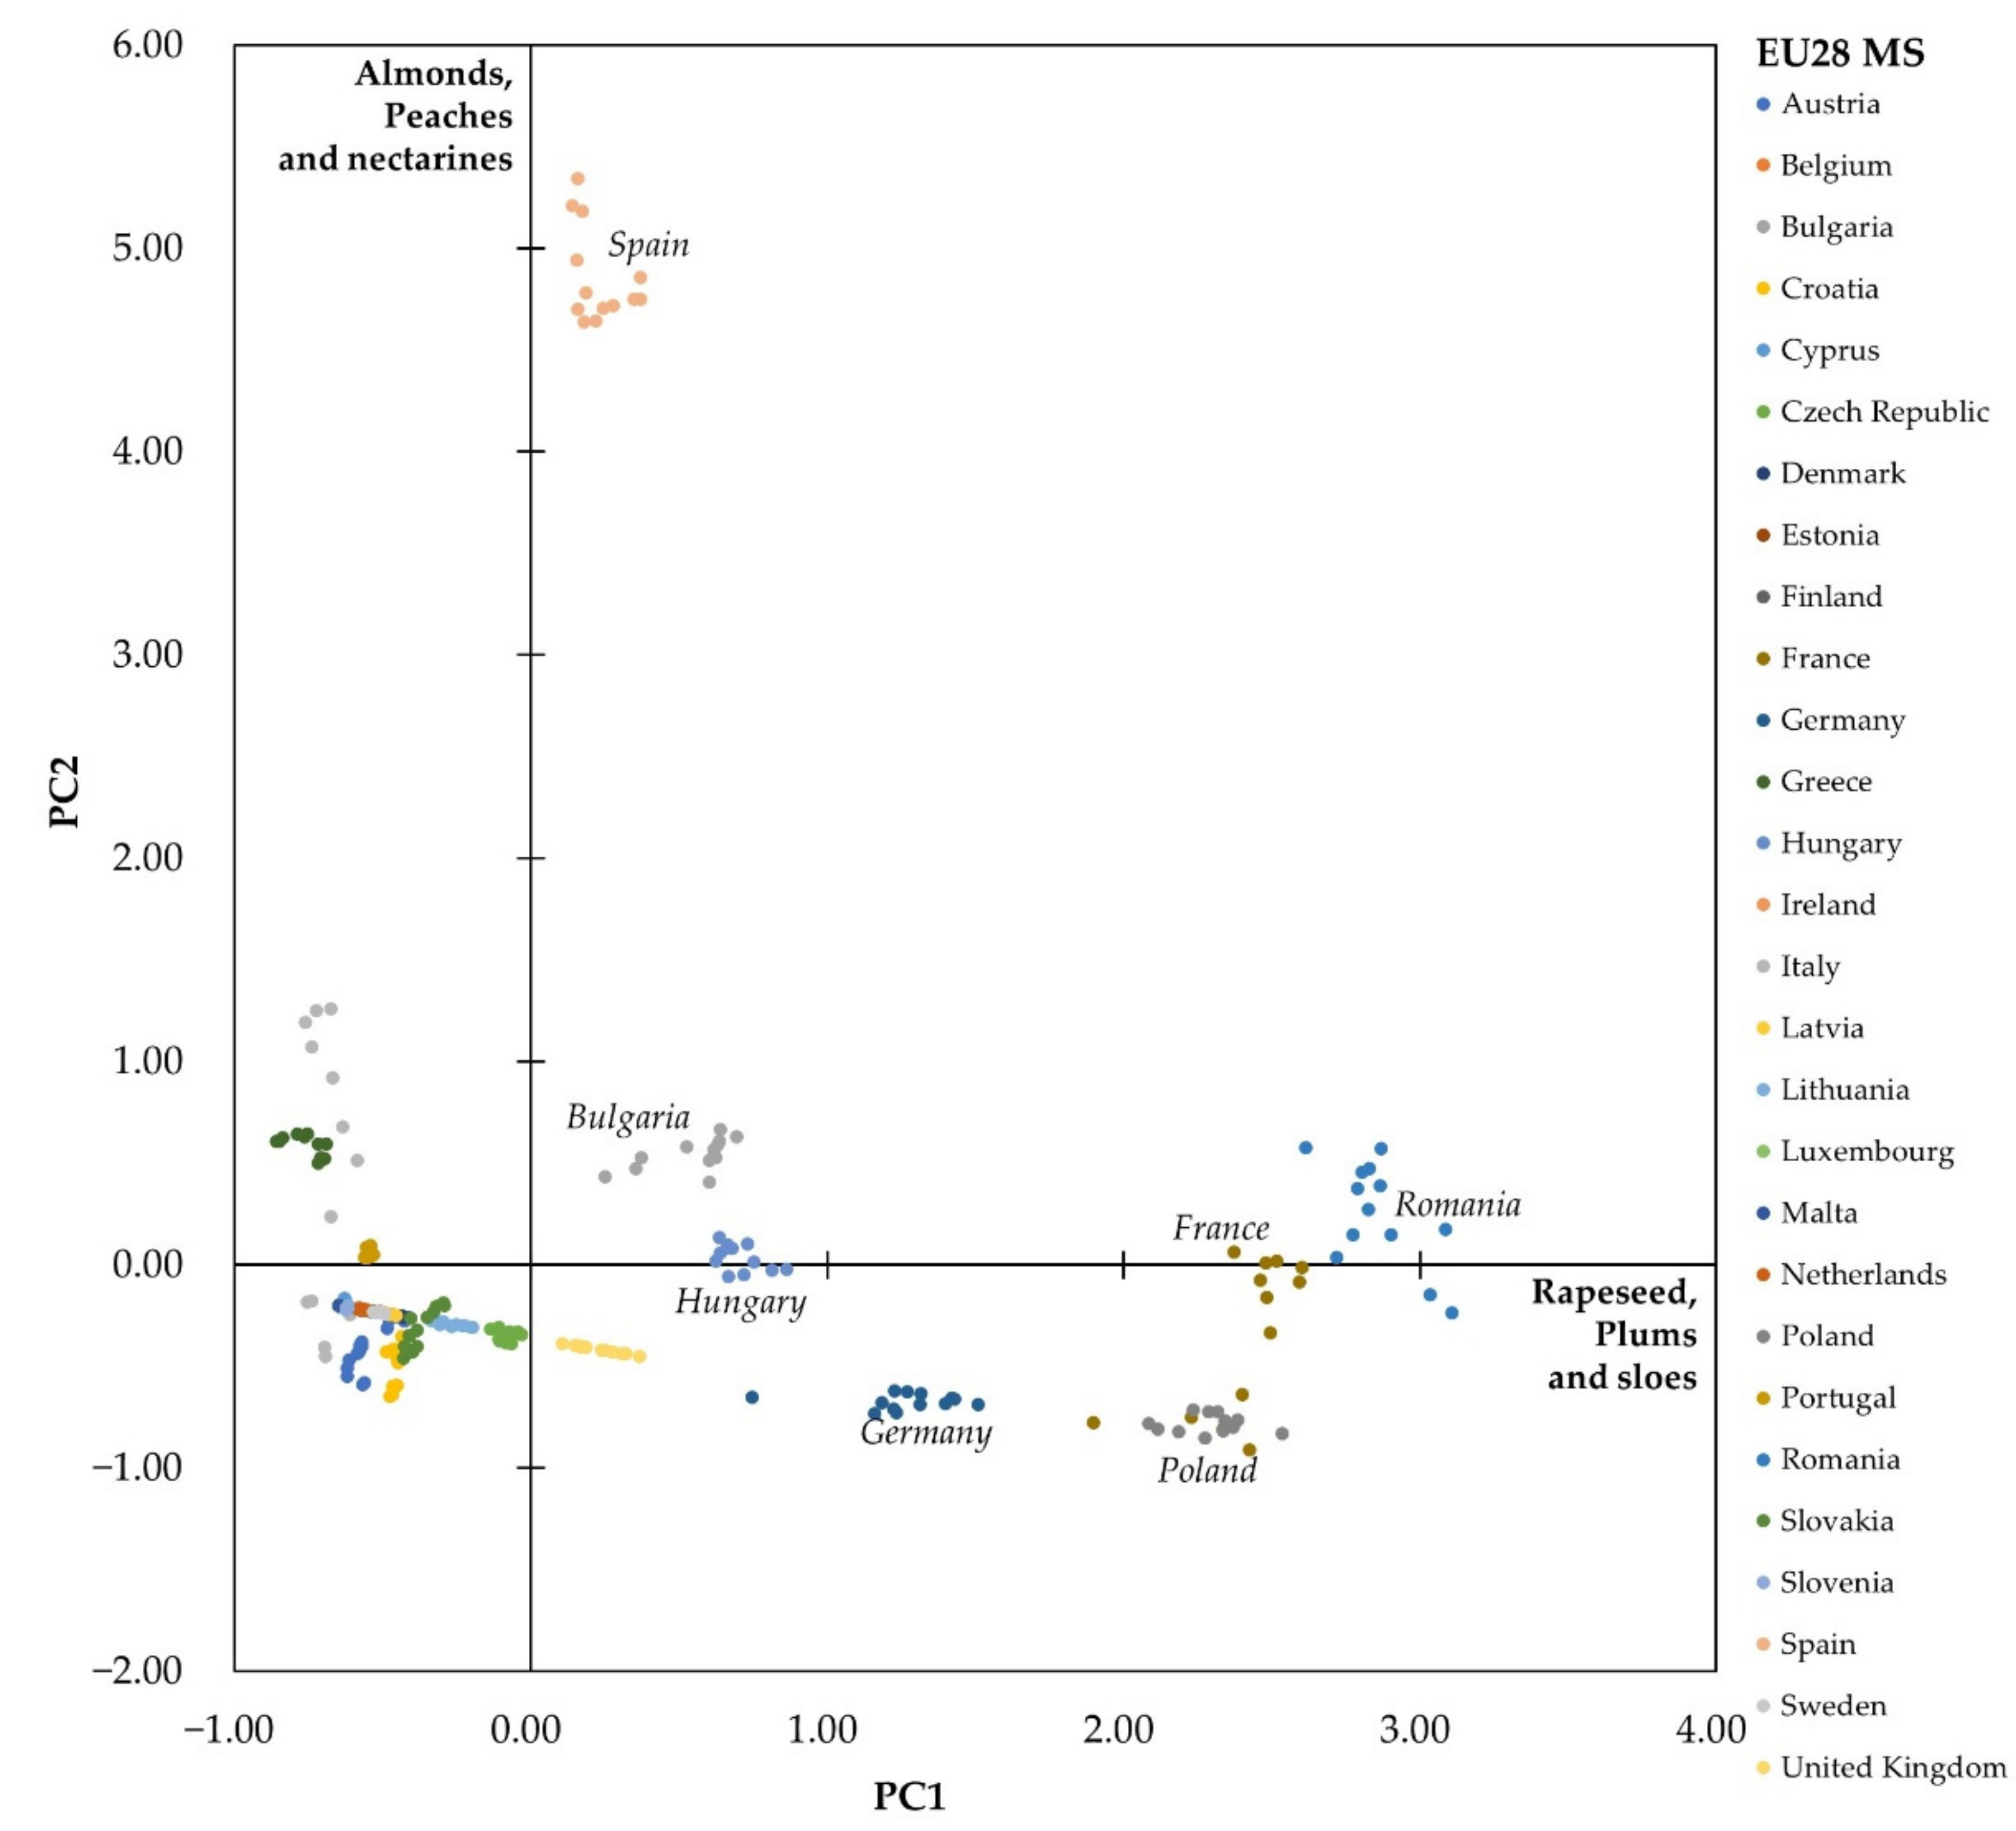
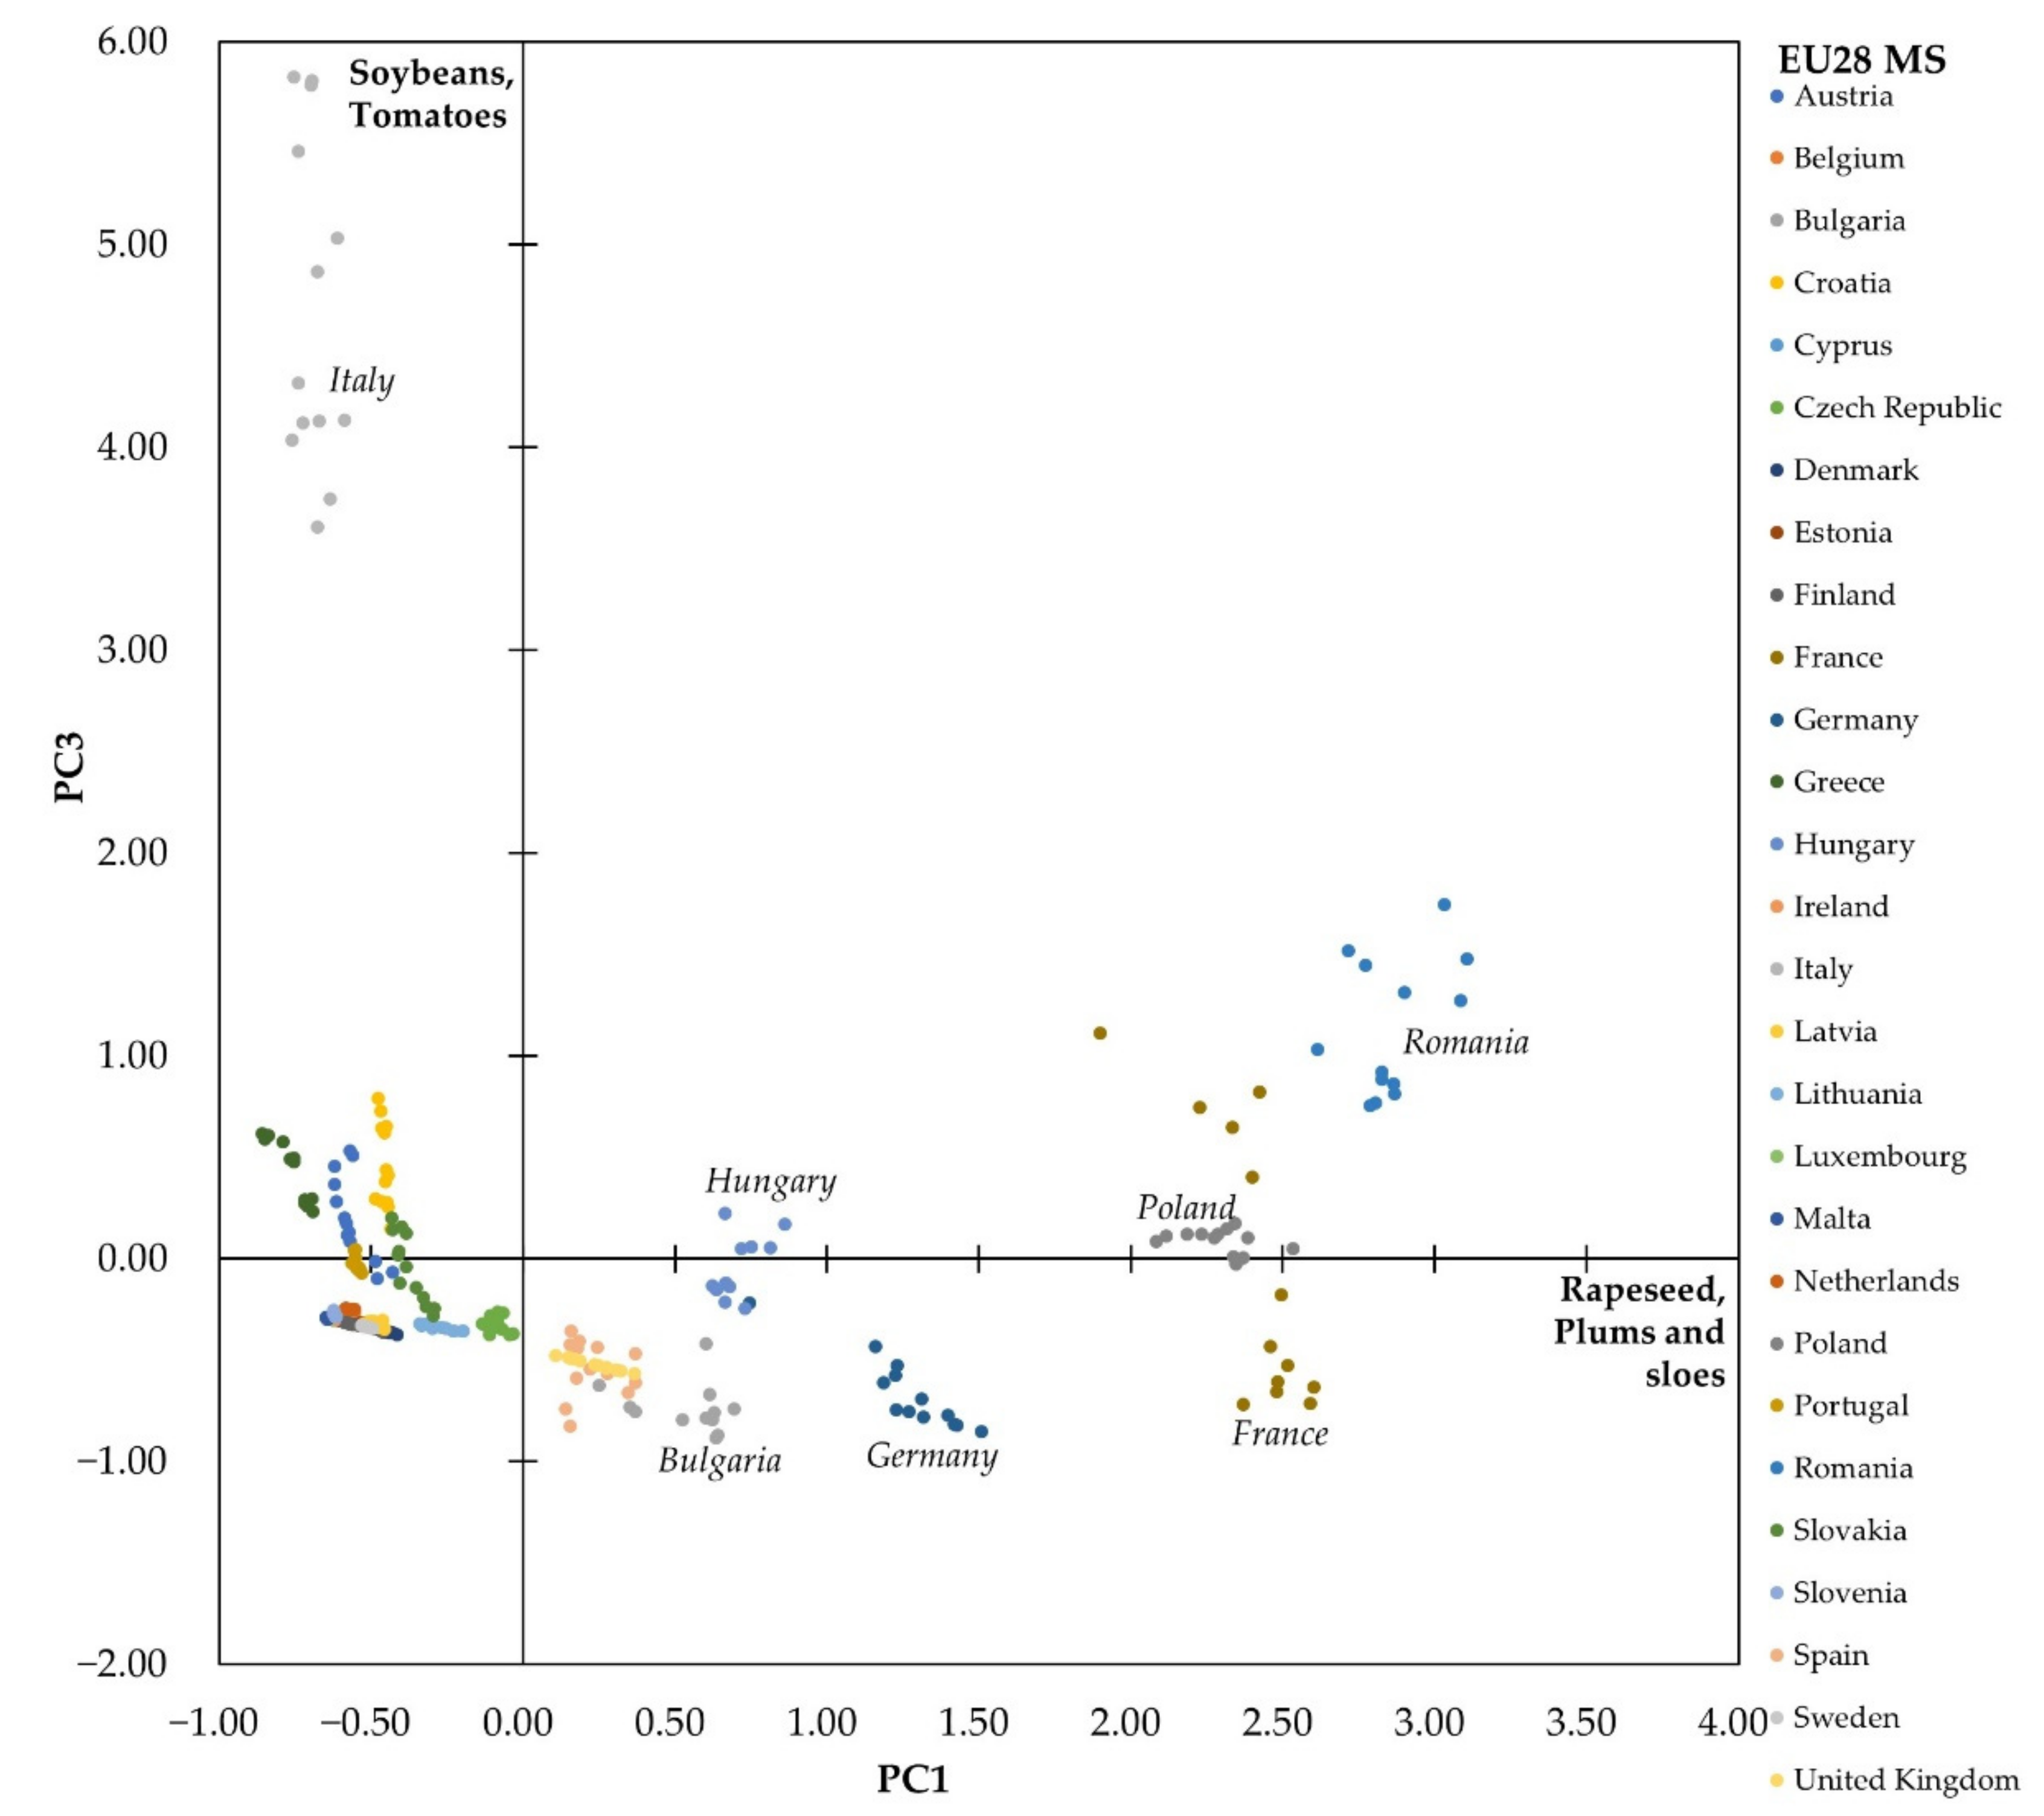
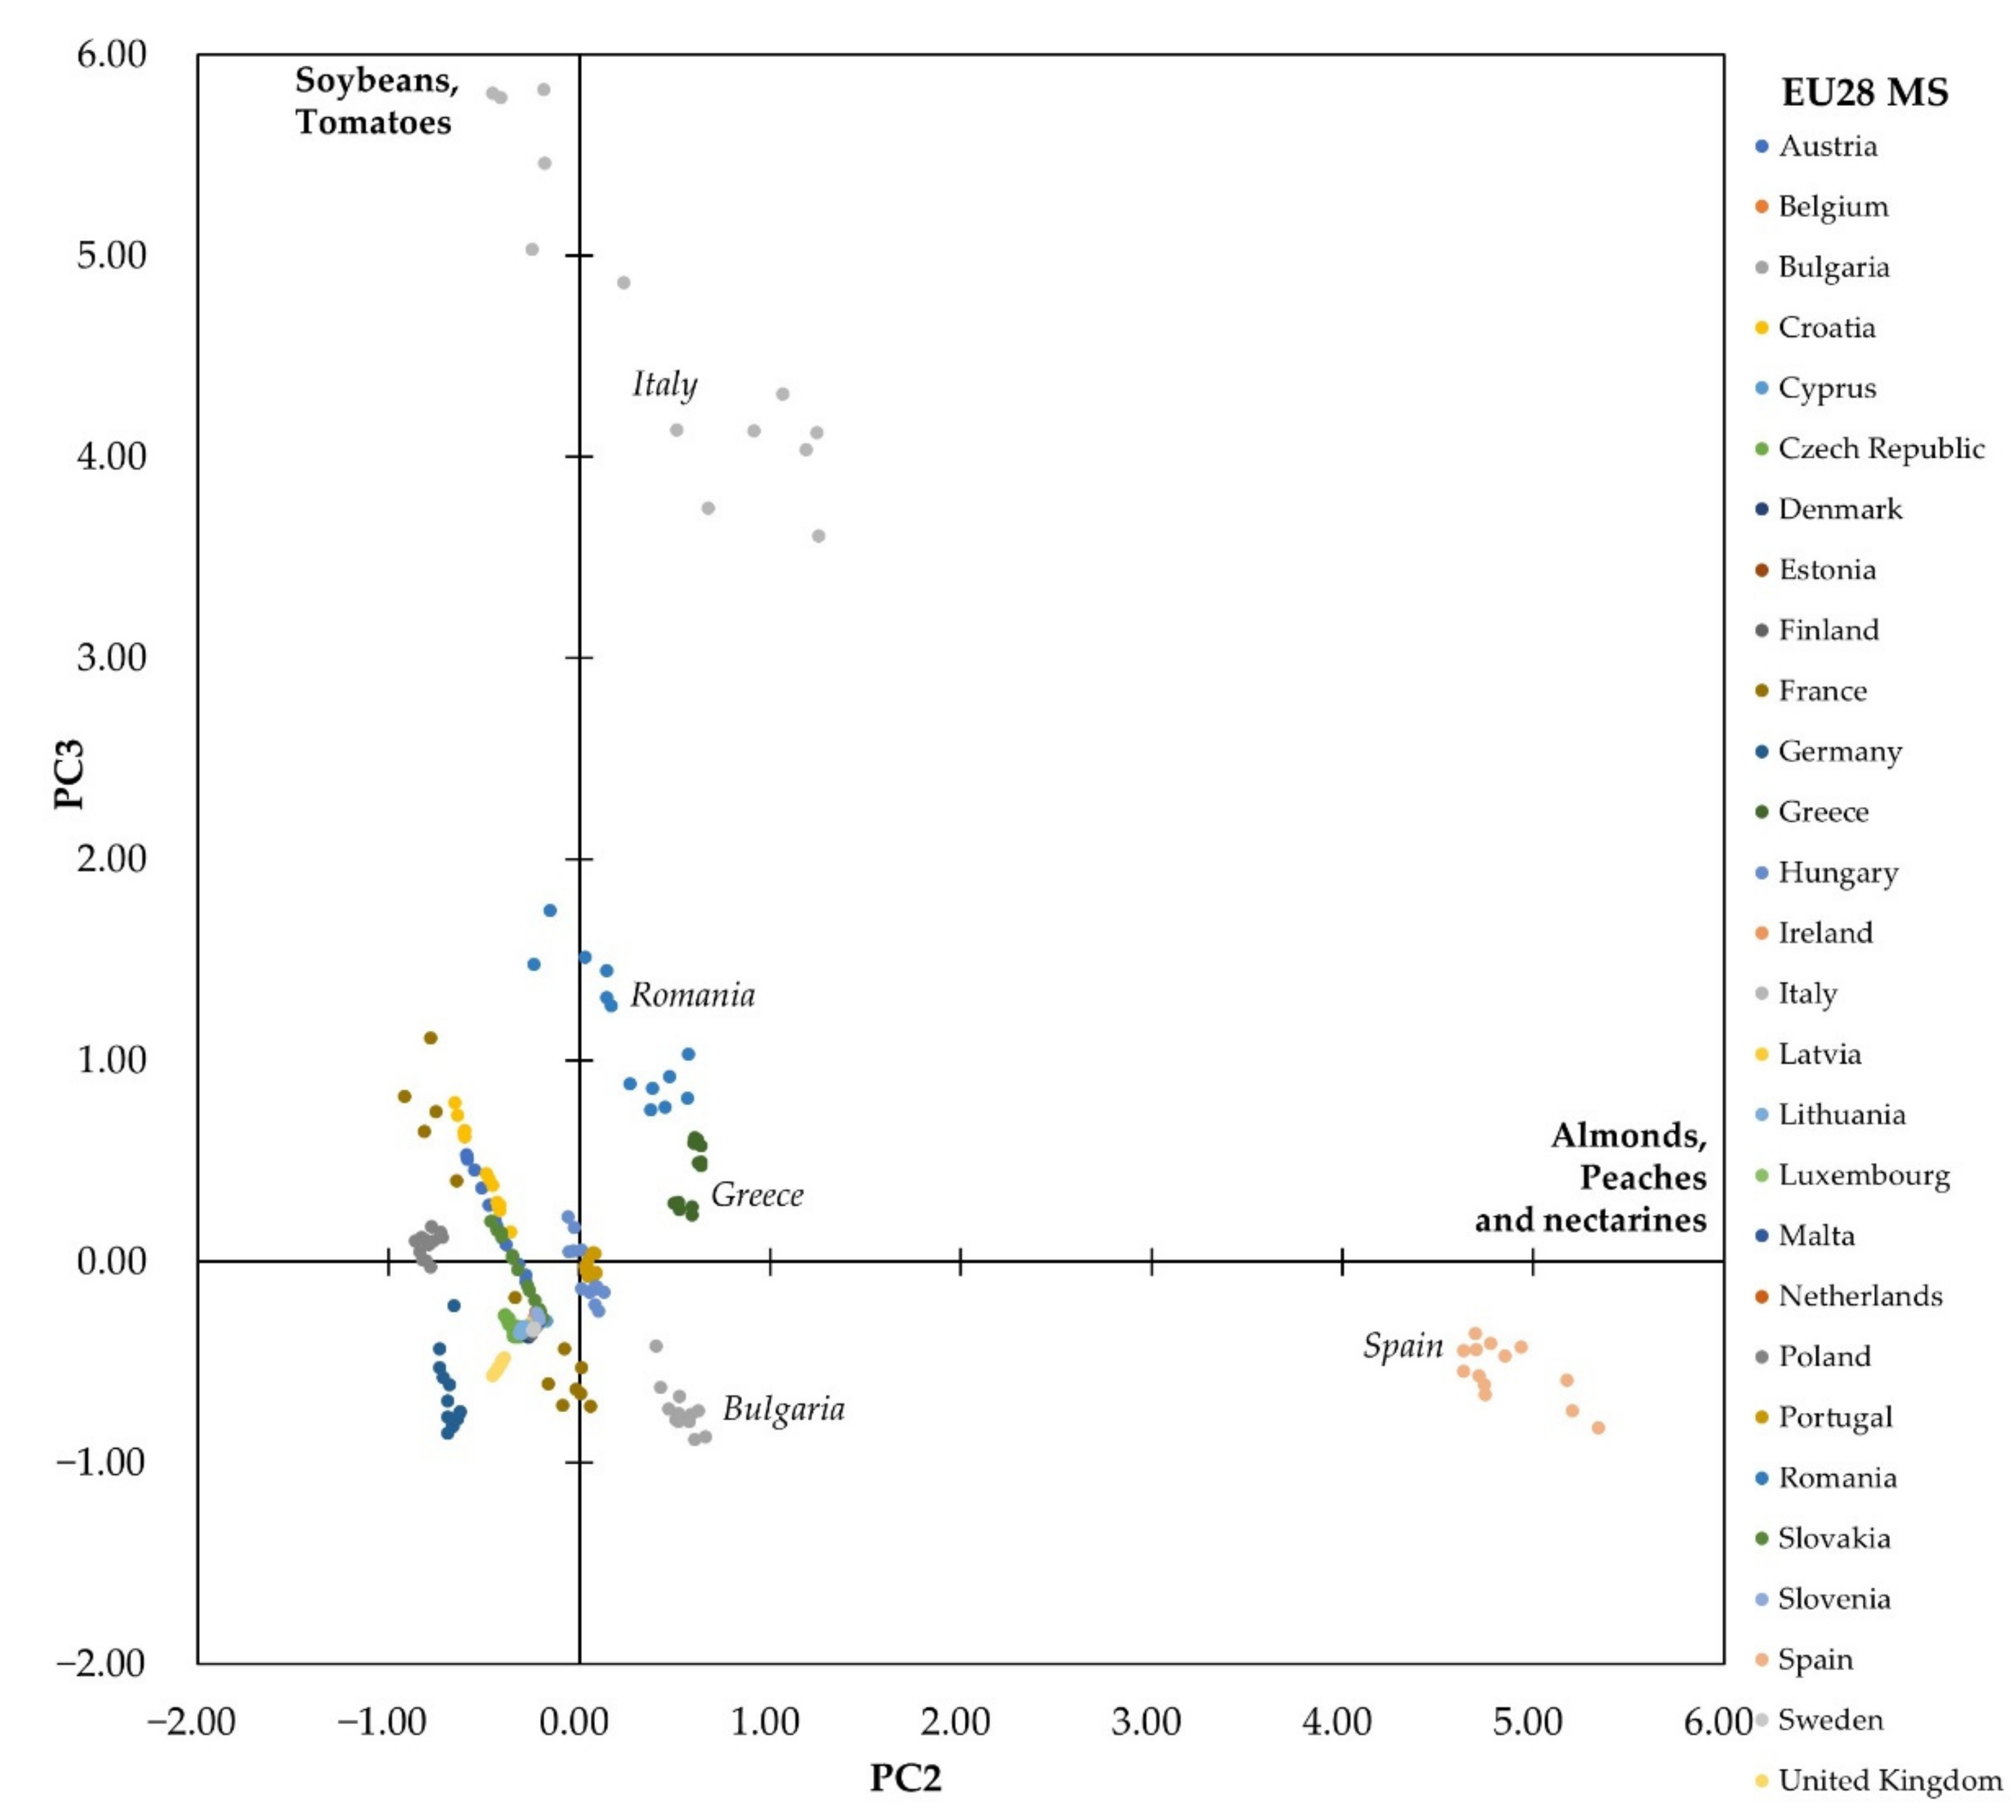
3.3. Which Crops Influenced ADIMS Variation by MS?

Table 3 shows the ADIMS change between the first and second CAP periods by MS (columns 1 to 4). Column 5 indicates the two crops with the higher surface values multiplied by the PDI for each MS as reported in columns 6 and 7. Column 8 shows the difference between columns 7 and 6.
The ADIMS difference by MS shows an equal distribution between states with high ADIMS (15) and states with reduced ADIMS (13). Croatia (+2.38), Hungary (+2.23), Bulgaria (+1.18) and Romania (+0.81) registered the main ADIMS increase in absolute terms driven by rapeseed. Although at EU level the rapeseed area in the period 2007–2019 decreased by −899,255 ha (−13.73%), it was replaced with barley, corn and sunflower. Rapeseed reduction is linked to climate change and pest pressure—in particular, unfavorable climatic conditions characterized by drier summers and autumns accompanied by insufficient winter and spring rainfall. Flea beetle (Phyllotreta cruciferae) attacks in countries most intensely cultivated such as France, Germany and Bulgaria and simultaneous bans of neonicotinoid products discourages the cultivation. ADIMS decreased in Lithuania (−0.86), Cyprus (−0.64) and Malta (−0.60) because of surface reduction in buckwheat, carob and tomatoes.
In order to identify the crop effect on ADIMS by MS in the Figure 6, Figure 7 and Figure 8, we report the PCA analysis results. The PCA was conducted using as variables the annual harvested crop surface multiplied by per dependence index (PDI) in the period 2007–2019 and MS. The titles of the graphs’ axes show the first two crops with the highest eigenvalue for each component. The PCA explained 77% of the cumulative variance.
Spain recorded an increase in the pollination dependence index driven by almonds (component 2). At EU28 level, almonds’ surface expanded by 100,528 ha (+14.38%). Among the perennial fruit trees, almond is the only one that increased during the period due to rising demand and genetic improvement. Among nuts, almond is the most used ingredient in Europe in new food products of confectionery, snacks, bakery, bars, dairy and cereal categories [31]. The increasing demand is driven by consumer awareness of the beneficial effects on health. The almond traditional Mediterranean cultivation area is expanding towards areas with a less mild climate thanks to genetic improvement. New self-fertile and late flowering varieties suitable for intensive cultivation are being introduced on the market.
Italy is the first EU soybean producer (43% of total EU production) followed by France and Romania. The cultivated area is growing due to the protein demand from the feed industry. Soy cultivation is favored by low production costs and high sales prices, interrupts the single-succession cereal and enriches the land. France, Germany, Poland and Romania stand out for rapeseed cultivation since rapeseed cropping is suitable for colder continental climates [32]. Rapeseed is mainly used in the non-food sectors (biodiesel, tire compound, lubricant, hydraulic oil, etc.) [33].
In Belgium, Bulgaria and the Netherlands, the ADIMS decrease is driven by apple tree reduction. Apple tree decreasing trends involved the EU with a loss of 40,705 hectares (−7.28%) but with a stable production due to the intensification process [34].

4. Discussion and Conclusions

The study showed no significant variation between the first (2007–2013) and second (2014–2019) CAP periods in the average ADIMS at the EU level. EU agriculture is dominated by crops not dependent on entomophilic pollination. However, this does not affect the importance of natural pollinators which play a fundamental role in the agroecosystems [35]. The AIDMS index highlighted three types of EU agriculture: agriculture in Eastern Europe (Bulgaria, Hungary, Romania and Slovakia) characterized by a high level of ADIMS (7.8–22) due to the widespread cultivation of oil crops such as rapeseed and sunflower; Mediterranean agriculture (Portugal, Spain, Italy, Croatia, Greece, Malta, Cyprus and France) with lower AIDMS level (5.3–10.3) and more heterogeneous crop portfolios with different degrees of dependence on animal pollination (almond, soy, rapeseed, sunflower and tomatoes); continental agriculture (Germany, Austria, Slovenia, Poland, Czech Republic, Baltic countries, Benelux, Finland, Sweden and Ireland) characterized by the lowest ADIMS level (0.7–4.9) due to the widespread cultivation of cereals (self-pollinating in wheat, rice, barley and oats and anemophilous in rye, corn) which increases the denominator of the index.
Intensification of agricultural systems is leading to a landscape homogenization with a growing gap between agriculture and natural ecosystems—a new landscape characterized by disappearance of ruderal, riparian and semi-natural vegetation [36].
Agriculture, forestry and other land use (AFOLU) activities represent 23% of total net anthropogenic emissions of GHGs during 2007–2016 period. Sustainable land management, including agricultural practices, contributes to climate change adaptation and reduction in land degradation. For instance, cover crops, crop residue retention and reduced or no tillage have important effects in reducing soil erosion, nutrient loss, water surface runoff and biodiversity decline [37].
A need is emerging to rebalance cultivated and non-cultivated areas, increasing natural or semi-natural habitats, in order to allow the conservation of biodiversity, the diversification of landscape and the biological crop pest control [38,39] and to improve the carbon balance in agroecosystems. Such agriculture must certainly be revised through integrated, organic and biodynamic pest management techniques. Managed honeybees are a useful agricultural tool [40] for improving the yield of many mass-flowering crops. However, managed honeybees are not sufficient to replace wild pollinators’ ecosystem service and biodiversity [41].
Additionally, many factors that negatively affect managed honeybees (such as pesticides, parasites and diseases) are also harming other native pollinators; honeybees may simply be the “canary in a coalmine” [42]. Apis mellifera is the most widely managed species, while more than 20,000 known species are considered wild [43], so a holistic approach is suggested in managing pollinators. Farmers should consider different bee taxa in relation to blooms, flight ranges and seasonal activities in order to integrate managed bees with the availability and abundance of wild pollinators. Farmers’ activities should be supported by sustainable agriculture policies, including ecological principles in farming systems and agroecological or organic farming practices providing ecological infrastructures and semi-natural areas [8,44,45].
The CAP has proposed tools for crop diversification (see EFA, crop rotations, etc.) with the purpose of improving sustainable land management and reducing habitat fragmentation and biodiversity-loss-related farming, by obligation under the green direct payment scheme [46] but without proven effects. The result was the favoring of intensification processes that contrast with the needs of wild pollinators that live in a limited area. For these reasons, conservation of natural and semi-natural areas is fundamental for offering continuous food and nesting points. A sustainable management of the agroecosystem will be possible in the future only if CAP considers pollinators’ requirements by quantifying the timing and spatial food availability from cultivated and uncultivated areas. However, above all, the pollination ecosystem service should be an integral part of biodiversity conservation, land use and natural resource management and environmental and agricultural policies [47]. The ADIMS fosters this aim, but it is not enough because it does not take into account the natural elements, as it considers only agricultural crops and their dependence on entomophilic pollination. To become a useful CAP programming tool, ADIMS must be integrated with other indexes in order to quantify the crops’ intensification degree with special concern for pesticide use and food resources and supplies for pollinators (nectar and pollen) by extra agricultural crops [48]. In addition, calculating ADIMS at the regional scale supports policy maker’s decisions about the local scale, integrating indexes to Corine Land Cover data or remote sensing imaging, both for programming and assessing policies tools. Once the integrated ADIMS has been developed, a range of values can be quantified to guarantee the pollinators’ wellbeing in a given agroecosystem.

Author Contributions

Conceiving research and designing research framework, C.B., C.P. and A.Z.; analyzing and processing data, G.B., G.R., L.B. and L.L. All authors wrote and reviewed the paper. All authors have read and agreed to the published version of the manuscript.

Funding

This research received no external funding.

Institutional Review Board Statement

Not applicable.

Informed Consent Statement

Not applicable.

Data Availability Statement

Not applicable.

Conflicts of Interest

The authors declare no conflict of interest.

References

  1. Roubik, D.W. Pollination of Cultivated Plants in the Tropics; Food and Agriculture Organization of the United: Rome, Italy, 1995. [Google Scholar]
  2. Williams, I.H. The Dependence of Crop Production within the European Union on Pollination by Honey Bees. Agric. Zool. Rev. 1994, 6, 229–257. [Google Scholar]
  3. Aizen, M.A.; Garibaldi, L.A.; Cunningham, S.A.; Klein, A.M. How Much Does Agriculture Depend on Pollinators? Lessons from Long-Term Trends in Crop Production. Ann. Bot. 2009, 103, 1579–1588. [Google Scholar] [CrossRef] [PubMed]
  4. Klein, A.M.; Vaissière, B.E.; Cane, J.H.; Steffan-Dewenter, I.; Cunningham, S.A.; Kremen, C.; Tscharntke, T. Importance of Pollinators in Changing Landscapes for World Crops. Proc. R. Soc. B Biol. Sci. 2007, 274, 303–313. [Google Scholar] [CrossRef] [PubMed] [Green Version]
  5. Gallai, N.; Salles, J.M.; Settele, J.; Vaissière, B.E. Economic Valuation of the Vulnerability of World Agriculture Confronted with Pollinator Decline. Ecol. Econ. 2009, 68, 810–821. [Google Scholar] [CrossRef]
  6. Kevan, P.G.; Baker, H.G. Insects as Flower Visitors and Pollinators. Annu. Rev. Entomol. 1983, 28, 407–453. [Google Scholar] [CrossRef]
  7. Fisogni, A.; Quaranta, M.; Grillenzoni, F.V.; Corvucci, F.; de Manincor, N.; Bogo, G.; Bortolotti, L.; Galloni, M. Pollen Load Diversity and Foraging Niche Overlap in a Pollinator Community of the Rare Dictamnus Albus, L. Arthropod-Plant Interact. 2018, 12, 191–200. [Google Scholar] [CrossRef]
  8. Potts, S.G.; Imperatriz-Fonseca, V.L.; Ngo, H.T.; Biesmeijer, J.C.; Breeze, T.D.; Dicks, L.V.; Garibaldi, L.A.; Hill, R.; Settele, J.; Vanbergen, A.J. The Assessment Report on Pollinators, Pollination and Food Production: Summary for Policymakers; IPBES: Bonn, Germany, 2016; ISBN 9789280735680. [Google Scholar]
  9. Ollerton, J. Pollinator Diversity: Distribution, Ecological Function, and Conservation. Annu. Rev. Ecol. Evol. Syst. 2017, 48, 353–376. [Google Scholar] [CrossRef] [Green Version]
  10. Dunn, L.; Lequerica, M.; Reid, C.R.; Latty, T. Dual Ecosystem Services of Syrphid Flies (Diptera: Syrphidae): Pollinators and Biological Control Agents. Pest Manag. Sci. 2020, 76, 1973–1979. [Google Scholar] [CrossRef]
  11. Andersson, G.K.S.; Ekroos, J.; Stjernman, M.; Rundlöf, M.; Smith, H.G. Effects of Farming Intensity, Crop Rotation and Landscape Heterogeneity on Field Bean Pollination. Agric. Ecosyst. Environ. 2014, 184, 145–148. [Google Scholar] [CrossRef]
  12. Blaauw, B.R.; Isaacs, R. Flower Plantings Increase Wild Bee Abundance and the Pollination Services Provided to a Pollination-Dependent Crop. J. Appl. Ecol. 2014, 51, 890–898. [Google Scholar] [CrossRef]
  13. Hardman, C.J.; Norris, K.; Nevard, T.D.; Hughes, B.; Potts, S.G. Delivery of Floral Resources and Pollination Services on Farmland under Three Different Wildlife-Friendly Schemes. Agric. Ecosyst. Environ. 2016, 220, 142–151. [Google Scholar] [CrossRef] [Green Version]
  14. Garibaldi, L.A.; Steffan-Dewenter, I.; Winfree, R.; Aizen, M.A.; Bommarco, R.; Cunningham, S.A.; Kremen, C.; Carvalheiro, L.G.; Harder, L.D.; Afik, O.; et al. Wild Pollinators Enhance Fruit Set of Crops Regardless of Honey Bee Abundance. Science 2013, 339, 1608–1611. [Google Scholar] [CrossRef]
  15. Garratt, M.P.D.; Breeze, T.D.; Jenner, N.; Polce, C.; Biesmeijer, J.C.; Potts, S.G. Avoiding a Bad Apple: Insect Pollination Enhances Fruit Quality and Economic Value. Agric. Ecosyst. Environ. 2014, 184, 34–40. [Google Scholar] [CrossRef] [Green Version]
  16. Földesi, R.; Kovács-Hostyánszki, A.; Korösi, Á.; Somay, L.; Elek, Z.; Markó, V.; Sárospataki, M.; Bakos, R.; Varga, Á.; Nyisztor, K.; et al. Relationships between Wild Bees, Hoverflies and Pollination Success in Apple Orchards with Different Landscape Contexts. Agric. For. Entomol. 2016, 18, 68–75. [Google Scholar] [CrossRef] [Green Version]
  17. Le Féon, V.; Schermann-Legionnet, A.; Delettre, Y.; Aviron, S.; Billeter, R.; Bugter, R.; Hendrickx, F.; Burel, F. Intensification of Agriculture, Landscape Composition and Wild Bee Communities: A Large Scale Study in Four European Countries. Agric. Ecosyst. Environ. 2010, 137, 143–150. [Google Scholar] [CrossRef]
  18. Evans, E.; Smart, M.; Cariveau, D.; Spivak, M. Wild, Native Bees and Managed Honey Bees Benefit from Similar Agricultural Land Uses. Agric. Ecosyst. Environ. 2018, 268, 162–170. [Google Scholar] [CrossRef] [Green Version]
  19. Leska, A.; Nowak, A.; Nowak, I.; Górczyńska, A. Effects of Insecticides and Microbiological Contaminants on Apis Mellifera Health. Molecules 2021, 26, 5080. [Google Scholar] [CrossRef]
  20. Bolzonella, C.; Lucchetta, M.; Teo, G.; Boatto, V.; Zanella, A. Is There a Way to Rate Insecticides That Is Less Detrimental to Human and Environmental Health? Glob. Ecol. Conserv. 2019, 20, e00699. [Google Scholar] [CrossRef]
  21. Brittain, C.; Bommarco, R.; Vighi, M.; Settele, J.; Potts, S.G. Organic Farming in Isolated Landscapes Does Not Benefit Flower-Visiting Insects and Pollination. Biol. Conserv. 2010, 143, 1860–1867. [Google Scholar] [CrossRef]
  22. Nicholson, C.C.; Koh, I.; Richardson, L.L.; Beauchemin, A.; Ricketts, T.H. Farm and Landscape Factors Interact to Affect the Supply of Pollination Services. Agric. Ecosyst. Environ. 2017, 250, 113–122. [Google Scholar] [CrossRef]
  23. Porcel, M.; Andersson, G.K.S.; Pålsson, J.; Tasin, M. Organic Management in Apple Orchards: Higher Impacts on Biological Control than on Pollination. J. Appl. Ecol. 2018, 55, 2779–2789. [Google Scholar] [CrossRef] [Green Version]
  24. (EC) No 1107/2009 (EC) No 1107/2009. Off. J. Eur. Union 2009, 309, 1–50. Available online: https://eur-lex.europa.eu/legal-content/EN/TXT/?uri=celex%3A32009R1107 (accessed on 2 February 2022).
  25. Statistics. Eurostat. Available online: https://ec.europa.eu/eurostat/databrowser/view/tag00025/default/table?lang=en (accessed on 2 February 2022).
  26. The Institute for European Environmental Policy. Pollinators in the CAP Integration of Pollinator Conservation into the Common Agricultural Policy; The Institute for European Environmental Policy: Brussels, Belgium, 2021. [Google Scholar]
  27. FAOSTAT. Available online: https://www.fao.org/faostat/en/#data/QCL (accessed on 2 February 2022).
  28. Trattato Di Roma (CEE). Available online: https://www.europarl.europa.eu/about-parliament/it/in-the-past/the-parliament-and-the-treaties/treaty-of-rome (accessed on 2 February 2022).
  29. L’evoluzione Della Pac e Le Imprese Agricole: Sessant’anni Di Adattamento | Agriregionieuropa. Available online: https://agriregionieuropa.univpm.it/it/content/article/31/50/levoluzione-della-pac-e-le-imprese-agricole-sessantanni-di-adattamento (accessed on 2 February 2022).
  30. Gallai, N.; Vaissière, B.E. Guidelines for the Economic Valuation of Pollination Services at National Scale; Food and Agriculture Organization of the United Nations: Rome, Italy, 2009. [Google Scholar]
  31. Almonds Maintain Top Spot as Most Used Nut in New European Products. Available online: https://www.newfoodmagazine.com/news/115637/almonds-maintain-top-spot-as-most-used-nut-in-new-european-products/ (accessed on 2 February 2022).
  32. Krautgartner, R.; Lefebvre, L.; Rehder, L.E.; Boshnakova, M. Oilseeds and Products Update-Lowest Rapeseed Crop in Over a Decade; USDA: Washington, DC, USA, 2019.
  33. European Parliament Directive 2009/28/EC of the European Parliament and of the Council of 23 April 2009. Off. J. Eur. Union 2009, 140, 16–62.
  34. El Cambio Climático y Las Frutas: El Efecto En El Rojo de Las Manzanas. TN. Available online: https://tn.com.ar/campo/2021/11/03/el-cambio-climatico-y-las-frutas-el-efecto-en-el-rojo-de-las-manzanas/ (accessed on 2 February 2022).
  35. Giovanetti, M.; Albertazzi, S.; Flaminio, S.; Ranalli, R.; Bortolotti, L.; Quaranta, M. Pollination in Agroecosystems: A Review of the Conceptual Framework with a View to Sound Monitoring. Land 2021, 10, 540. [Google Scholar] [CrossRef]
  36. Landis, D.A. Designing Agricultural Landscapes for Biodiversity-Based Ecosystem Services. Basic Appl. Ecol. 2017, 18, 1–12. [Google Scholar] [CrossRef] [Green Version]
  37. IPCC. Climate Change and Land: An IPCC Special Report; IPCC: Geneva, Switzerland, 2019. [Google Scholar]
  38. Sirami, C.; Gross, N.; Baillod, A.B.; Bertrand, C.; Carrié, R.; Hass, A.; Henckel, L.; Miguet, P.; Vuillot, C.; Alignier, A.; et al. Increasing Crop Heterogeneity Enhances Multitrophic Diversity across Agricultural Regions. Proc. Natl. Acad. Sci. USA 2019, 116, 16442–16447. [Google Scholar] [CrossRef] [PubMed] [Green Version]
  39. Rusch, A.; Chaplin-Kramer, R.; Gardiner, M.M.; Hawro, V.; Holland, J.; Landis, D.; Thies, C.; Tscharntke, T.; Weisser, W.W.; Winqvist, C.; et al. Agricultural Landscape Simplification Reduces Natural Pest Control: A Quantitative Synthesis. Agric. Ecosyst. Environ. 2016, 221, 198–204. [Google Scholar] [CrossRef] [Green Version]
  40. Klatt, B.K.; Holzschuh, A.; Westphal, C.; Clough, Y.; Smit, I.; Pawelzik, E.; Tscharntke, T. Bee Pollination Improves Crop Quality, Shelf Life and Commercial Value. Proc. R. Soc. B Biol. Sci. 2013, 281, 20132440. [Google Scholar] [CrossRef]
  41. Holzschuh, A.; Dainese, M.; González-Varo, J.P.; Mudri-Stojnić, S.; Riedinger, V.; Rundlöf, M.; Scheper, J.; Wickens, J.B.; Wickens, V.J.; Bommarco, R.; et al. Mass-Flowering Crops Dilute Pollinator Abundance in Agricultural Landscapes across Europe. Ecol. Lett. 2016, 19, 1228–1236. [Google Scholar] [CrossRef]
  42. Geldmann, J.; González-Varo, J.P. Conserving Honey Bees Does Not Help Wildlife: High Densities of Managed Honey Bees Can Harm Populations of Wild Pollinators. Science 2018, 359, 392–393. [Google Scholar] [CrossRef]
  43. Osterman, J.; Aizen, M.A.; Biesmeijer, J.C.; Bosch, J.; Howlett, B.G.; Inouye, D.W.; Jung, C.; Martins, D.J.; Medel, R.; Pauw, A.; et al. Global Trends in the Number and Diversity of Managed Pollinator Species. Agric. Ecosyst. Environ. 2021, 322, 107653. [Google Scholar] [CrossRef]
  44. Isaacs, R.; Williams, N.; Ellis, J.; Pitts-Singer, T.L.; Bommarco, R.; Vaughan, M. Integrated Crop Pollination: Combining Strategies to Ensure Stable and Sustainable Yields of Pollination-Dependent Crops. Basic Appl. Ecol. 2017, 22, 44–60. [Google Scholar] [CrossRef]
  45. Garibaldi, L.A.; Carvalheiro, L.G.; Leonhardt, S.D.; Aizen, M.A.; Blaauw, B.R.; Isaacs, R.; Kuhlmann, M.; Kleijn, D.; Klein, A.M.; Kremen, C.; et al. From Research to Action: Enhancing Crop Yield through Wild Pollinators. Front. Ecol. Environ. 2014, 12, 439–447. [Google Scholar] [CrossRef] [Green Version]
  46. Report from the Commission to the European Parliament and the Council on the Implementation of the Ecological Focus Area Obligation under the Green Direct Payment Scheme. COM(2017)152/F1-EN. Available online: https://ec.europa.eu/transparency/documents-register/detail?ref=COM(2017)152&lang=en (accessed on 2 February 2022).
  47. Gemmill-Herren, B.; Garibaldi, L.A.; Kremen, C.; Ngo, H.T. Building Effective Policies to Conserve Pollinators: Translating Knowledge into Policy. Curr. Opin. Insect Sci. 2021, 46, 64–71. [Google Scholar] [CrossRef]
  48. Schulp, C.J.E.; Lautenbach, S.; Verburg, P.H. Quantifying and Mapping Ecosystem Services: Demand and Supply of Pollination in the European Union. Ecol. Indic. 2014, 36, 131–141. [Google Scholar] [CrossRef]
Figure 1. Research workflow diagram.
Sustainability 14 03644 g001
Figure 2. ADIMS distribution by MS per year (2007–2019).
Sustainability 14 03644 g002
Figure 3. Average ADIMS (2007–2019) distribution by EU28 MS.
Sustainability 14 03644 g003
Figure 4. Comparison of average ADIMS (2007–2019) for the three main agriculture groups in the EU (p < 0.005).
Sustainability 14 03644 g004
Figure 5. Differences in crop surface (ha) when grouped by pollinator dependence index level (PDI) (2007–2019) in EU28.
Sustainability 14 03644 g005
Figure 6. PCA analysis component 1 (Rapeseed, Plums and sloes) vs. component 2 (Almonds, Peaches and nectarines). The PCA was conducted using the annual crop harvested surface from the FAOSTAT database multiplied by the respective dependence index (DPI) in the period 2007–2019 and MS.
Sustainability 14 03644 g006
Figure 7. PCA analysis component 1 (Rapeseed, Plums and sloes) vs. component 3 (Soybeans, Tomatoes). The PCA was conducted using the annual crop harvested surface from the FAOSTAT database multiplied by the respective dependence index (DPI) in the period 2007–2019 and MS.
Sustainability 14 03644 g007
Figure 8. PCA analysis component 2 (Almonds, Peaches and nectarines) vs. component 3 (Soybeans, Tomatoes). The PCA was conducted using the annual crop harvested surface from the FAOSTAT database multiplied by the respective dependence index (DPI) in the period 2007–2019 and MS.
Sustainability 14 03644 g008
Table 1. List of the 119 crops grown in 28 MS (Member States) during the 2007–2019 period.
CropsPollination Dependency Index (PDI)Dependence CategoriesNumber of MS Growing the CropAverage Harvested Crop Surface (ha) during
2007–2019 Period
Percentage of Average Harvested Crop Surface on Total Average Cultivated Area
Almonds, with shell0.65Great10692,707.310.78
Anise, badian, fennel, coriander0None946,508.770.05
Apples0.65Great28537,018.920.6
Apricots0.65Great1772,230.460.08
Artichokes0None1070,564.380.08
Asparagus0None2255,164.620.06
Avocados0.65Great411,859.380.01
Bananas0None611,714.310.01
Barley0None2812,683,738.3114.25
Beans, dry0.25Modest20103,491.620.12
Beans, green0.25Modest2581,384.690.09
Berries nes0.25Modest2529,413.770.03
Blueberries0.65Great2013,881.540.02
Broad beans, horse beans, dry0.25Modest28356,149.920.4
Buckwheat0.65Great10135,112.310.15
Cabbages and other brassicas0None28170,425.460.19
Canary seed0None34134.770.00
Carobs0.25Modest623,166.920.03
Carrots and turnips0None28132,518.460.15
Cauliflowers and broccoli0None28134,352.310.15
Cereals nes0None22165,041.310.19
Cherries0.65Great24124,098.150.14
Cherries, sour0.65Great2057,584.230.06
Chestnut0.25Modest11106,673.770.12
Chickpeas0.25Modest945,552.920.05
Chicory roots0None711,905.850.01
Chilies and peppers, dry0.05Little746,139.770.05
Chilies and peppers, green0.05Little2065,570.230.07
Coconuts0.25Modest1391.770.00
Cow peas, dry0.05Little3744.850.00
Cranberries0.65Great3407.850.00
Cucumbers and gherkins0.65Great2853,695.460.06
Currants0.25Modest2461,671.150.07
Dates0.05Little1579.150.00
Eggplants (aubergines)0.25Modest1627,057.380.03
Figs0.25Modest1025,690.000.03
Flax fiber and tow0.05Little14103,699.380.12
Fruit, citrus nes0.25Modest53928.150.00
Fruit, fresh nes0None1758,991.000.07
Fruit, pome nes0None91096.920.00
Fruit, stone nes0None159056.380.01
Fruit, tropical fresh nes0None511,909.460.01
Garlic0None2241,830.770.05
Gooseberries0.25Modest1414,491.620.02
Grain, mixed0None181,274,740.541.43
Grapefruit (inc. pomelos)0.05Little73194.850.00
Grapes0None223,271,681.853.67
Groundnuts, with shell0.05Little51297.000
Hazelnuts, with shell0None1497,647.380.11
Hemp tow waste0None179036.540.01
Hempseed0None511,167.460.01
Hops0None1628,971.000.03
Kiwi fruit0.95Essential838,619.310.04
Leeks, other alliaceous vegetables0None2729,020.850.03
Lemons and limes0.05Little877,678.690.09
Lentils0.25Modest945,072.850.05
Lettuce and chicory0None27128,202.380.14
Linseed0.05Little2281,223.850.09
Lupins0.25Modest15129,540.000.15
Maize0None218,950,883.3810.05
Maize, green0None987,724.770.1
Melons, other (inc. cantaloupes)0.95Essential1580,747.620.09
Melonseed0.95Essential11934.380.00
Millet0None1138,041.690.04
Mushrooms and truffles0None141770.620.00
Mustard seed0None1044,028.150.05
Nuts nes0None819,515.460.02
Oats0None272,707,016.233.04
Oilseeds nes0None22113,660.460.13
Okra0.25Modest167.080.00
Olives0None94,875,850.005.48
Onions, dry0None28184,529.540.21
Onions, shallots, green0None1010,893.000.01
Oranges0.25Modest8293,831.770.33
Peaches and nectarines0.65Great17233,352.150.26
Pears0.65Great26125,002.000.14
Peas, dry0.05Little26689,649.920.77
Peas, green0.05Little28170,534.770.19
Peppermint0None286.690.00
Persimmons0.05Little310,899.380.01
Pineapples0None150.920.00
Pistachios0.25Modest412,416.620.01
Plums and sloes0.65Great25166,822.000.19
Poppy seed0.25Modest1167,203.690.08
Potatoes0None281,874,528.462.11
Pulses nes0.05Little24342,637.310.38
Pumpkins, squash and gourds0.95Essential2552,097.380.06
Quinces0.65Great134184.620.00
Rapeseed0.25Modest256,539,190.547.34
Raspberries0.65Great2437,560.310.04
Rice, paddy0None8441,226.770.5
Roots and tubers nes0None47510.000.01
Rye0None262,291,657.382.57
Safflower seed0.65Great23383.690.00
Seed cotton0.25Modest3286,910.380.32
Sesame seed0.25Modest33700.00
Sorghum0None11130,301.150.15
Soybeans0.25Modest16607,399.920.68
Spices nes0None34296.770.00
Spinach0None2333,733.460.04
Strawberries0.25Modest28106,316.150.12
String beans0.25Modest230,162.230.03
Sugar beet0None241,632,742.381.83
Sugar cane0None311,626.080.01
Sunflower seed0.65Great174,090,919.924.59
Sweet potatoes0None42970.920.00
Tangerines, mandarins, clementines, satsumas0.05Little8170,650.460.19
Taro (cocoyam)0None167.380.00
Tea0None120.230.00
Tobacco, unmanufactured0None1598,268.150.11
Tomatoes0.65Great28277,620.150.31
Triticale0None252,733,456.083.07
Vegetables, fresh nes0None28306,573.540.34
Vegetables, leguminous nes0None1730,451.460.03
Vetches0.25Modest1488,068.850.1
Walnuts, with shell0None1878,468.850.09
Watermelons0.95Essential1480,416.540.09
Wheat0None2826,117,138.0029.34
Yams0None1117.150.00
Table 2. Total crop surface (ha) classified by pollinator dependence index level (PDI) from 2007 to 2019.
YearNone
(PDI = 0.0)
Little
(PDI ∈ ]0; 0.10])
Modest
(PDI ∈ ]0.10; 0.40])
Great
(PDI ∈ ]0.40; 0.90])
Essential
(PDI ∈ ]0.90; 1.00])
200772,322,8521,522,1408,823,6345,970,830259,972
200875,442,2741,336,5888,129,4476,420,167255,727
200973,704,2701,513,5178,622,8386,557,592259,852
201070,444,2151,738,0319,511,7396,381,924263,184
201170,864,0391,658,3209,142,3306,904,868254,806
201271,578,0651,506,1948,528,4816,793,795253,858
201371,375,7221,397,5559,033,7527,087,081252,704
201471,557,9581,541,8239,345,4616,708,432241,882
201570,728,3591,908,6459,728,6806,665,56324,886
201670,388,7482,036,6589,664,3976,694,428256,089
201769,165,8662,231,95710,172,0916,944,051244,304
201868,882,0552,353,1989,388,4626,417,551253,760
201970,297,7182,193,8698,021,6676,740,444254,600
Variation (2019–2007)−2,025,134671,729−801,967769,614−5372
Var. %−2.80+44.13−9.08+12.88−2.06
Table 3. ADIMS variation and surface variation of the first and second most important pollinated crops by MS.
MSADIMS
(2012–2014)
ADIMS
(2017–2019)
Difference Most Important
Pollinated Crops by MS
Crop Surface (ha) × PDI
(2012–2014)
Crop Surface (ha) × PDI
(2017–2019)
Difference
Austria4.14.60.5Soybeans10,248.7516,774.756526.00
Rapeseed13,932.839747.67−4185.17
Belgium3.413.550.14Pears5763.336613.32849.98
Apples4615.003892.20−722.80
Bulgaria19.3920.581.18Rapeseed38,280.5041,203.332922.83
Apples2900.082620.15−279.93
Croatia6.669.042.38Rapeseed4248.9212,083.837834.92
Apples3748.553145.57−602.98
Cyprus8.037.39−0.64Tomatoes134.77180.0545.28
Carobs373.7581.83−291.92
Czech Republic6.596.46−0.12Soybeans1624.253567.831943.58
Poppy seed5469.422715.50−2753.92
Denmark2.482.750.27Broad beans, horse beans, dry0.003533.333533.33
Cherries, sour728.43283.40−445.03
Estonia6.095.65−0.44Broad beans, horse beans, dry0.002345.002345.00
Rapeseed21,107.0818,239.67−2867.42
Finland1.311.760.45Broad beans, horse beans, dry0.002608.332608.33
Rapeseed12,758.3311,666.67−1091.67
France7.296.73−0.56Soybeans13,012.9238,289.9225,277.00
Sunflower seed456,758.03377,479.92−79,278.12
Germany4.724.35−0.37Broad beans, horse beans, dry4400.0012,575.008175.00
Rapeseed347,166.67282,500.00−64,666.67
Greece9.188.61−0.57Sunflower seed45,514.3055,948.9710,434.67
Seed cotton70,346.5021,681.83−48,664.67
Hungary12.8515.082.23Rapeseed48,024.1777,847.0829,822.92
Poppy seed1601.67430.67−1171.00
Ireland1.41.810.41Broad beans, horse beans, dry0.001272.501272.50
Rapeseed3383.332495.83−887.50
Italy7.498.110.61Soybeans47,500.5076,861.4229,360.92
Peaches and nectarines47,951.3740,854.45−7096.92
Latvia5.185.50.32Broad beans, horse beans, dry0.005416.675416.67
Buckwheat5893.333965.00−1928.33
Lithuania6.585.71−0.86Broad beans, horse beans, dry300.0010,417.5010,117.50
Buckwheat22,056.6710,508.12−11,548.55
Luxembourg3.763.19−0.58Apples157.30174.8517.55
Rapeseed1103.50794.75−308.75
Malta6.55.9−0.6
Tomatoes204.3261.10−143.22
Netherlands3.123.380.26Pears5477.556463.38985.83
Apples5135.654327.48−808.17
Poland5.455.04−0.41Lupines16,125.6726,362.1710,236.50
Buckwheat44,223.8316,905.85−27,317.98
Portugal8.268.970.71Almonds, with shell18,317.4324,544.436227.00
Sunflower seed11,195.606749.17−4446.43
Romania12.1812.980.81Rapeseed64,815.92131,904.8367,088.92
Tomatoes30,725.9318,804.28−11,921.65
Slovakia9.099.10.01Rapeseed30,747.5837,606.836859.25
Sunflower seed54,349.3244,351.23−9998.08
Slovenia4.063.67−0.39Soybeans68.50508.17439.67
Rapeseed1402.92840.42−562.50
Spain9.879.970.1Almonds, with shell344,642.57428,688.4384,045.87
Sunflower seed516,867.00458,830.45−58,036.55
Sweden3.073.04−0.03Broad beans, horse beans, dry4401.676247.501845.83
Rapeseed29,340.8326,422.50−2918.33
United Kingdom5.024.64−0.38Broad beans, horse beans, dry20,207.3340,354.1720,146.83
Rapeseed178,792.92139,583.33−39,209.58
EU287.868.010.16Soybeans123,014.67235,328.33112,313.67
Sunflower seed2,841,879.302,743,078.22−98,801.08
Publisher’s Note: MDPI stays neutral with regard to jurisdictional claims in published maps and institutional affiliations.

