Article

Production and Characterization of a Novel Biosurfactant Molecule from Bacillus safensis YKS2 and Assessment of Its Efficiencies in Wastewater Treatment by a Directed Metagenomic Approach

by
Dharman Kalaimurugan
1,2,
Balasubramanian Balamuralikrishnan
3,†,
Rasiravathanahalli Kaveriyappan Govindarajan
1,
Naif Abdullah Al-Dhabi
4,
Mariadhas Valan Arasu
4,
Chithravel Vadivalagan
5,
Srinivasan Venkatesan
2,*,
Hesam Kamyab
6,7,
Shreeshivadasan Chelliapan
8 and
Chartchai Khanongnuch
1,*
1
Division of Biotechnology, Faculty of Agro-Industry, School of Agro-Industry, Chiang Mai University, Chiang Mai 50100, Thailand
2
Department of Environmental Science, School of Life Sciences, Periyar University, Salem 636 011, India
3
Department of Food Science and Biotechnology, College of Life Science, Sejong University, Seoul 05006, Korea
4
Department of Botany and Microbiology, College of Science, King Saud University, P.O. Box 2455, Riyadh 11451, Saudi Arabia
5
Department of Biochemistry, School of Medicine, AKFA University, Tashkent 100042, Uzbekistan
6
Malaysia-Japan International Institute of Technology, Universiti Teknologi Malaysia, Jalan Sultan Yahya Petra, Kuala Lumpur 54100, Malaysia
7
Department of Electric Power Stations, Network and Supply Systems, South Ural State University (National Research University), 76 Prospekt Lenina, 454080 Chelyabinsk, Russia
8
Engineering Department, Razak Faculty of Technology & Informatics, Universiti Teknologi Malaysia, Jalan Sultan Yahya Petra, Kuala Lumpur 54100, Malaysia
*
Authors to whom correspondence should be addressed.
Equally contributed as first author.
Sustainability 2022, 14(4), 2142; https://doi.org/10.3390/su14042142
Submission received: 9 November 2021 / Revised: 13 January 2022 / Accepted: 17 January 2022 / Published: 14 February 2022
(This article belongs to the Special Issue Organic Waste Management to Promote the Recycling System)

Abstract

:
Biosurfactant is a biodegradation accelerator that improves bioavailability and facilitates degradation by microorganisms. The study was meant to produce a novel biosurfactant molecule from Bacillus safensis YKS2. An efficient biosurfactant-producing strain, namely, Bacillus safensis YKS2, was selected using hemolytic activity, drop collapsing test, oil spreading test and blue agar plate methods in four oil-degrading strains isolated from a soil sample. Biosurfactant production in the optimization of bacteria culture conditions by RSM is a statistical grouping technique that is analyzed using the AVOVA approach to surface tention. In addition, the study was characterized by UV spectrophotometer FT-IR, HR-SEM, and GC-MS analyses to explain its structural and chemical details. Wastewater treatment was monitored for pH, EC, turbidity, alkalinity, chemical oxygen demand (COD), biochemical oxygen demand (BOD) and dissolved oxygen (DO) in order to justify the efficacy of the biosurfactant during wastewater treatment. The results of the UV spectrophotometer showed absorption at 530 nm, and the FT-IR analyzed carboxylic acids, alcohol and phenols groups, whichthe GC-MS analysis indicated were lipopeptide purified by hexadecanoic andtetradecanoic processes, respectively. The results show that the wastewater removal efficiency of 70% wasachieved within 24 h. In comparison, metagenomics was conducted during the treatment process to identify changes in the microbial load and diversity, which essentially indicatethe biosurfactant performance of the wastewater treatment process. The microbial load in the treated biosurfactant wastewater (84,374 sequences) was greatly decreased compared to untreated wastewater (139,568 sequences). It was concluded that B. safensis YKS2, producing a glycolipid form of biosurfactant, has possible benefits in the remediation of wastewater, and can be used for large-scale processing inbiosurfactant industries.

1. Introduction

Biosurfactants are a class of microorganism-formed compounds with surface activities. Biosurfactants are microbial substances that have significant surfactant and emulsifying properties. They are less toxic, structurally complex, extremely biodegradable, eco-friendly and highly substrate-specific [1,2]. Biosurfactants are often either anionic or acidic, and sugars, amino acids, phosphates, or any other compounds can be hydrophilic [3]. Because of their variety, environment-friendly character, adaptability for large-scale production, and selectivity, they have mostly been used for ecological applications [4]. Despite their promise and biological origins, only a few studieson their potential application in the biomedical sector have been conducted. Biosurfactant activity has been extended to cover future applications in several industries, such as food, agriculture, pharmaceuticals, petrochemicals and the paper industry [5,6,7].
In addition, biosurfactants also play a vital function in the treatment of wastewater. The oil sector pollutes the environment, and has an impact on the balance of the ecosystem [8]. Some biosurfactants are safe and effective therapeutic agents that can be utilized as an alternative to synthetic medications and antibacterial agents [9]. As a new technique to minimize adhesion, the bio-conditioning of the surface viathe application of microbial surfactants has been performed. Wastewater from these agricultural and anthropogenic sources has an effectnot only on the health of the ecosystem, but also on human health, which causes numerous diseases. Toxicity has been treated using a variety of management measures, including biological, physiochemical, and thermal methods. Wastewater is known to contain multiple radioactive elements, along with dangerous microorganisms, which are released into the atmosphere and pose a danger to the local community [10].
However, the difficulties ofbiosurfactant commercialization include the lack of efficient strains and effective identification routes, and the high processing cost [11]. Several species of Bacillus, Alcaligenes, Pseudomonas, and Corynebacterium have been found to produce biosurfactants that aid in the degradation of wastewater. Compared to these techniques, biological treatment using these bio-surfactants helps us to reduce the interfacial surface tension, which, in turn, inhibits the mobility of organic compounds. lt can also inhibit the transformation of organic compounds, and therefore reduce the formation of toxic by-products [12,13]. In this case, biosurfactants are a good choice for the treatment and remediation of waste in the environment. Biosurfactants have also been shown to have antibacterial and antifungal effects. Keeping this in mind, ourstudyplanned to use microbial surfactants for the remediation of wastewater from agricultural and household operations, and the elimination of the involved dangerous microorganisms and toxic chemicals. The biosurfactant-mediated treatment of wastewater was further verified by an intergenomic approach [14]. Metagenomic approaches are currently being used to analyze the structure of the microbial population during the remediation of wastewater by biosurfactants. This method providesaccurate knowledge related to the existence of microorganisms in wastewater [15]. The sequencing of 16S rRNA genes with ahigh-performance metagenomic method, such as Illumina Mi-Seq, has beensuccessfully implemented in anaerobic digestion for the identification of different microbial communities. As a result, bacterial strains with the ability to create biosurfactants with improved oil-degrading abilitiesare suggested for use in achieving rapid crude oil degradation.
The metagenomic approach illustrates the efficacy of biosurfactant wastewater treatment by evaluating microbial wastewater populations, in view of the need to mitigate wastewater and troubling aquatic contamination. As a consequence, the objective of this study is to find the most effective biosurfactant-producer, optimize bacterial culture by RSM, and analyze experimental data using ANOVA. The wastewater isanalyzed for the parameters pH, EC, DO, COD and BOD, enabling us to characterize thebiosurfactants we make. We planned to treat wastewater with the help of Bacillus safensis (YKS2) surfactant. In addition, the efficacy of the surfactant against theharmful microorganisms present in wastewater was investigated by an antimicrobial and metagenomic method.

2. Materials and Methods

2.1. Sample Collection and Isolation of Bacteria

Soil samples were collected from Yercaud hills, Salem, India (11°50′44.61 N, 78°14′55.32 E). In the Yercaud hills, twenty separate soil samples were taken from five different places. Sub-soil leaflets were harvested, and the soil was collected using a sterile scoop (up to 10 cm deep) and sterilized polyethylene bags were transferred to the laboratory and kept at 20 °C for further investigation. Soil samples were serially diluted to 10−1- to 10−7-fold and spread plated on nutrient aga, which was incubated at 37 °C for 24 h. The colonies that were morphologically distinct were chosen, purified, and stored on nutrient agar slants for additional investigations.

2.2. Screening of Biosurfactant Producing Bacteria

The selected bacterial strains were screened for biosurfactant production by following the standard methods, and the strain with higher biosurfactant production was selected for further studies [16].

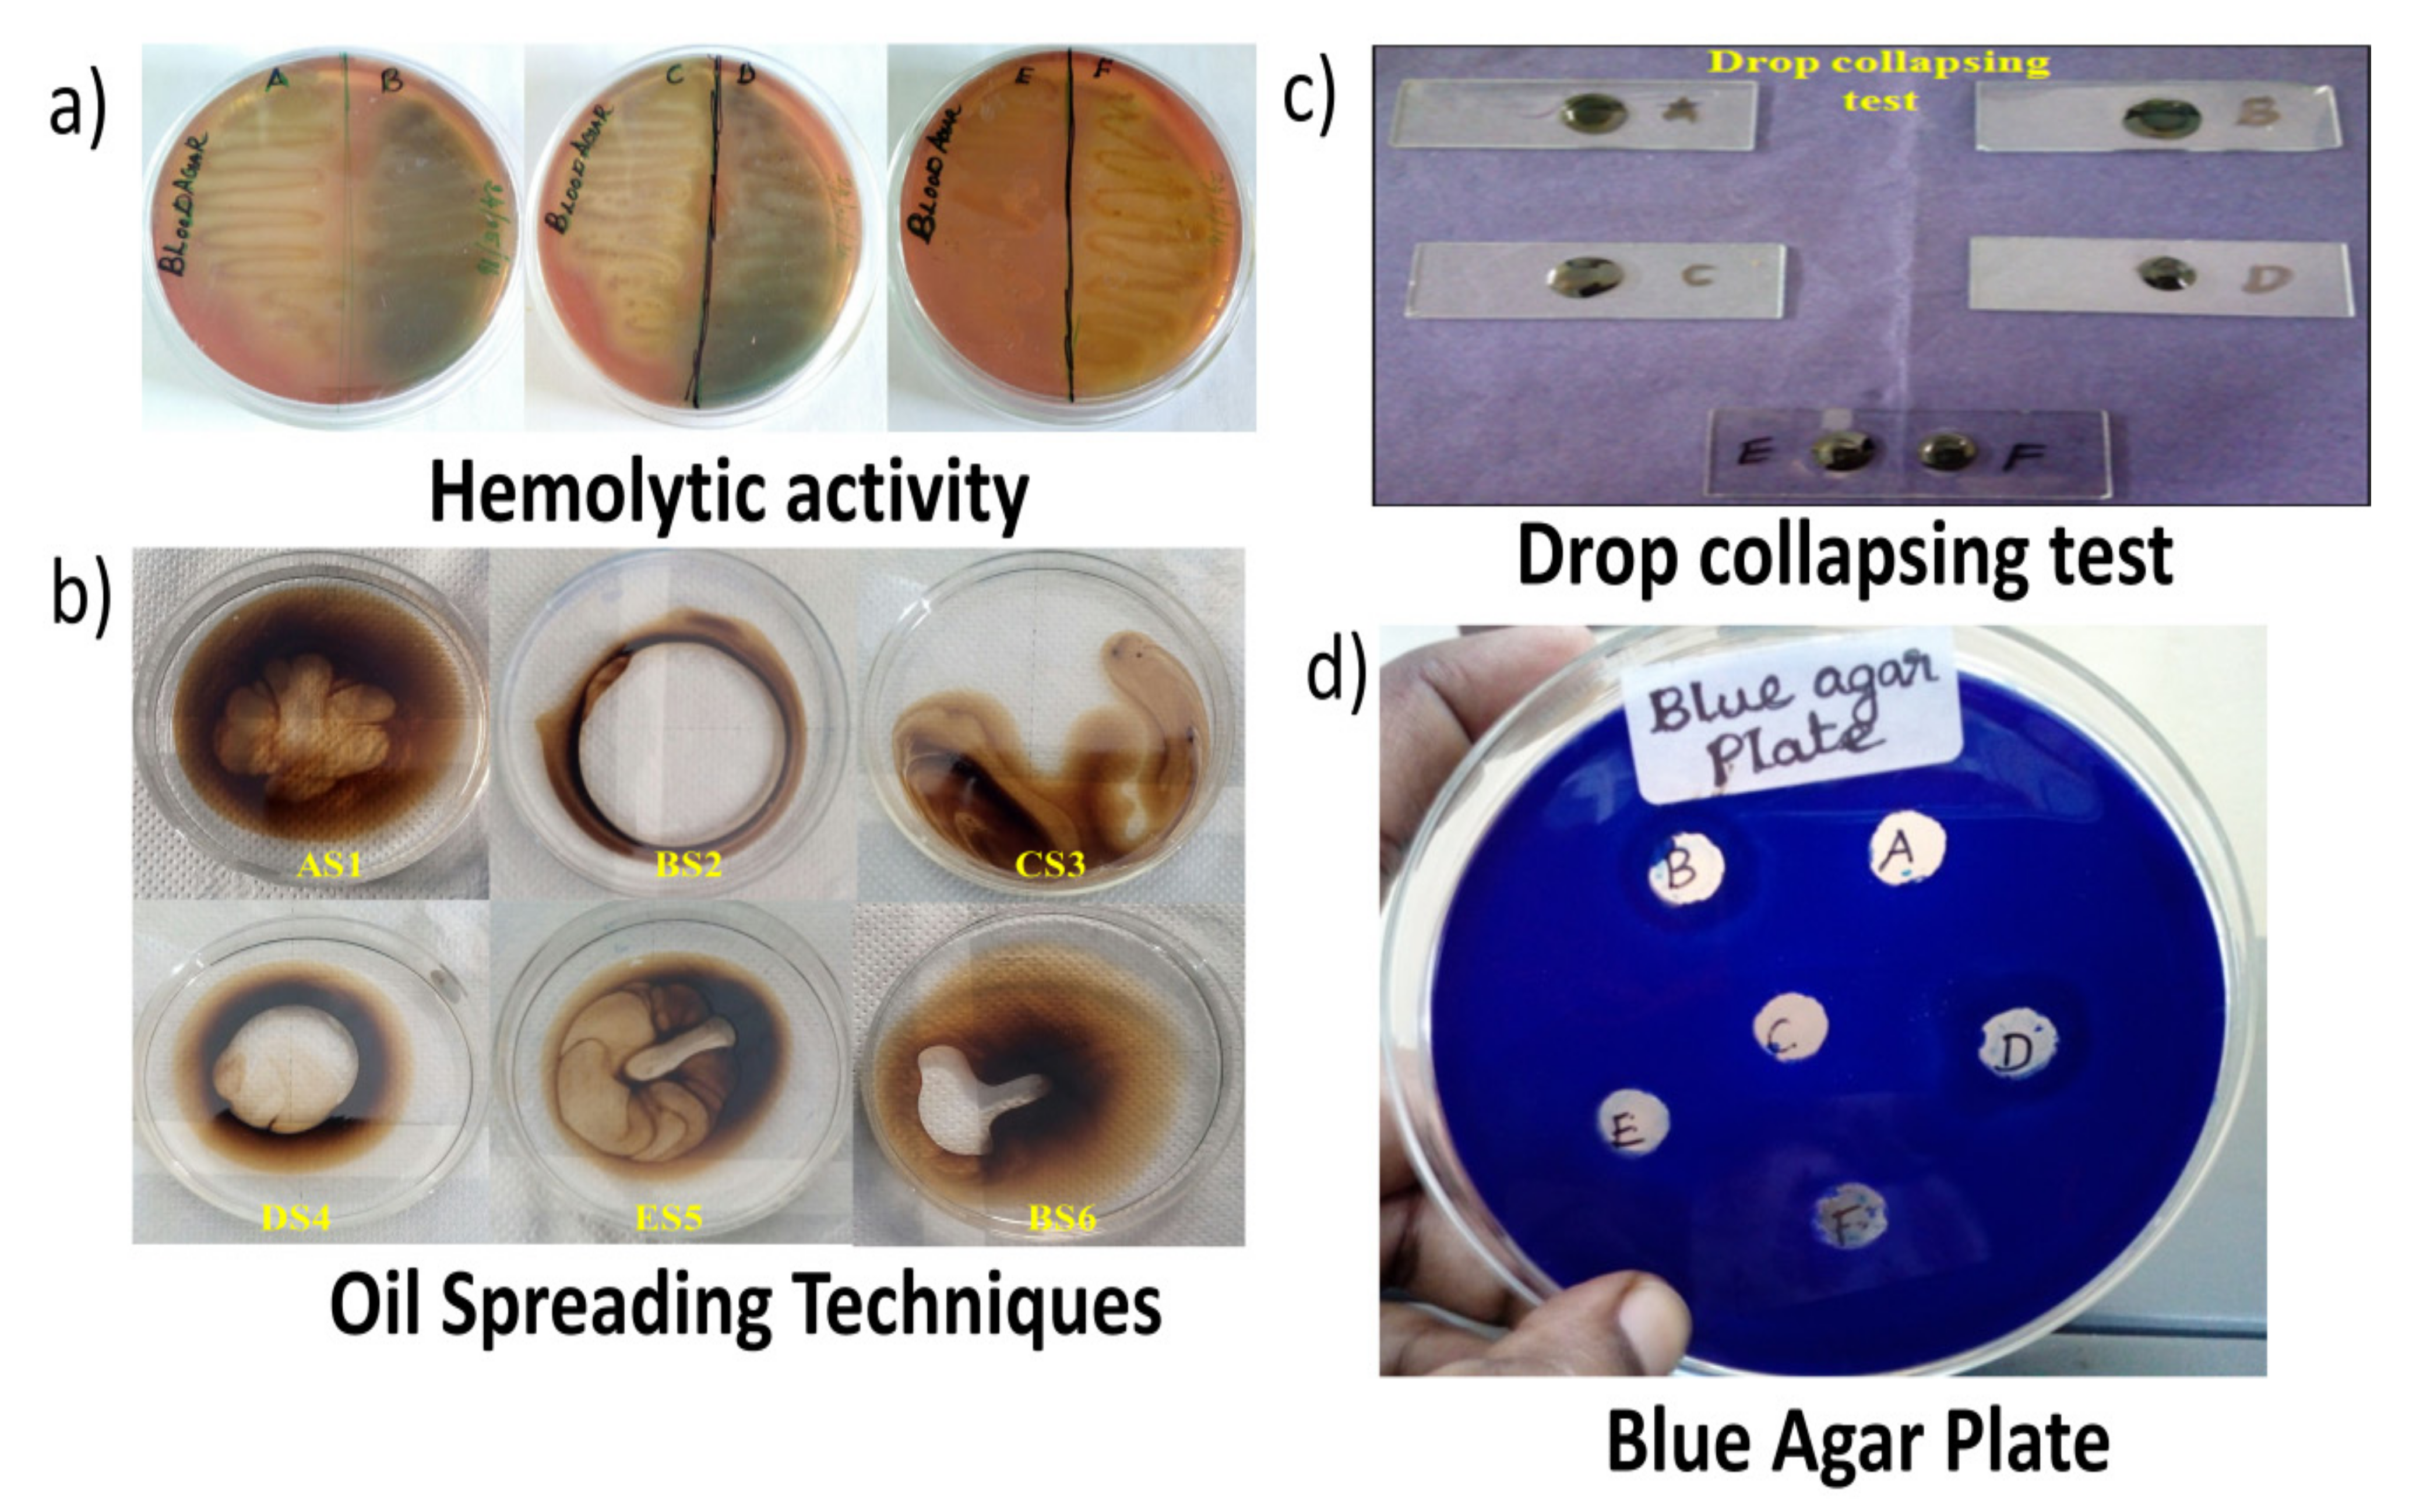
2.2.1. Hemolytic Activity

The freshly prepared blood agar was streaked with pure bacterial strain culture and incubated for 48–72 h at 37 °C. The clear zone type found was used to report the results, i.e., alpha-hemolytic when the colony was surrounded by a greenish zone, β-hemolysis when the colony was surrounded by a clear white zone, and γ-hemolysis when the medium around the colony remained unchanged [16].

2.2.2. Drop-Collapsing Test

The qualitative drop-collapse test was used to conduct biosurfactant output screening [17]. In this test, crude oil was used. On the 96-well microplate covers, delimited to the well regions, 2 μL of oil was added. At 12,000 rpm, 5 μL of the 48 h culture was centrifuged for 5 min; the cells were removed and the supernatant was transferred to the oil-coated well areas, and with the use of a magnifying lens, the drop size was measured after 1 min. When the drop was flat, the effect was deemed beneficial for biosurfactant production, whereas cultures that produced rounder drops were considered negative. This indicated that the production of biosurfactants was lacking [18].

2.2.3. Oil Spreading Assay

Oil displacement activity of surfactants was assessedin the oil spreading assay as per the method described by Maneerat and Phetrong [18]. The concept of this method isbased on the biosurfactant’s ability to change the angle of interaction at the oil–water interface. The oil was displaced by the surface pressure of the biosurfactant. In this method, 10 μL of kerosene oil was added to the surface of the petri dish with 50 mL of distilled water. As a result, the oil forms a thin layer, in the middle of which is softly placed 10 μL of cultured supernatant. If the oil is displaced and a clear zone is formed, the presence of biosurfactants is suggested. The amount of surfactant forming 1 cm2 of oil displacement area was specified as one biosurfactant unit (BS unit) [19].

2.2.4. Blue Agar Plate (Bap) Method

Mineral salt agar media combined with glucose as carbon source (2%) and cetyltrimethylammonium ammonium bromide (CTAB: 0.5 mg/mL), and methylene blue (MB: 0.2 mg/mL) were used for the detection of anionic biosurfactant [20]. Each methylene blue agar plate is filled with thirty microliters of cell-free supernatant produced with a cork borer (4 mm). At 37 °C for 48–72 h, the plate was then incubated. For the development of anionic biosurfactants, the presence of a dark blue halo surrounding the culture was regarded as favorable.

2.3. Identification of Biosurfactant Production Strain

2.3.1. Morphology and Biochemical Characterization

Gram staining and the biochemical activities of the biosurfactant bacterial strains, such as indole production, MR-VP test, catalase, oxidase and urease test, and motility and citrate utilization activities, were examined as per the method followed by Cappuccino-Sherman [21].

2.3.2. Molecular Identification of the Biosurfactant Producing Bacteria

The genomic DNA of bacteria-producing biosurfactants was purified using the technique described by Barakat et al. [22]. The 16S rRNA gene was amplified using universal primers forward (5′d AGAGTTTGATCMTGGCTCAG3′) and reverse (5′TACGTTATCCAGCCGCA 3′). The reaction mixture for PCR amplification was set for atotal volume of 25 µL with autoclaved deionized water (17.3 µL), 10XTaq buffer (2.5 µL), forward primer (1 µM/µL) (1.0 µL), reverse primer (1 µM/µL) (1.0 µL), dNTPs (10 mM/µL)(2.0 µL), Taq polymerase (3 U/µL) (0.2 µL) and genomic DNA template (1.0 µL). 16S rRNA gene sequencing was further characterized by the isolated bacterium as followed by Kumar et al. [
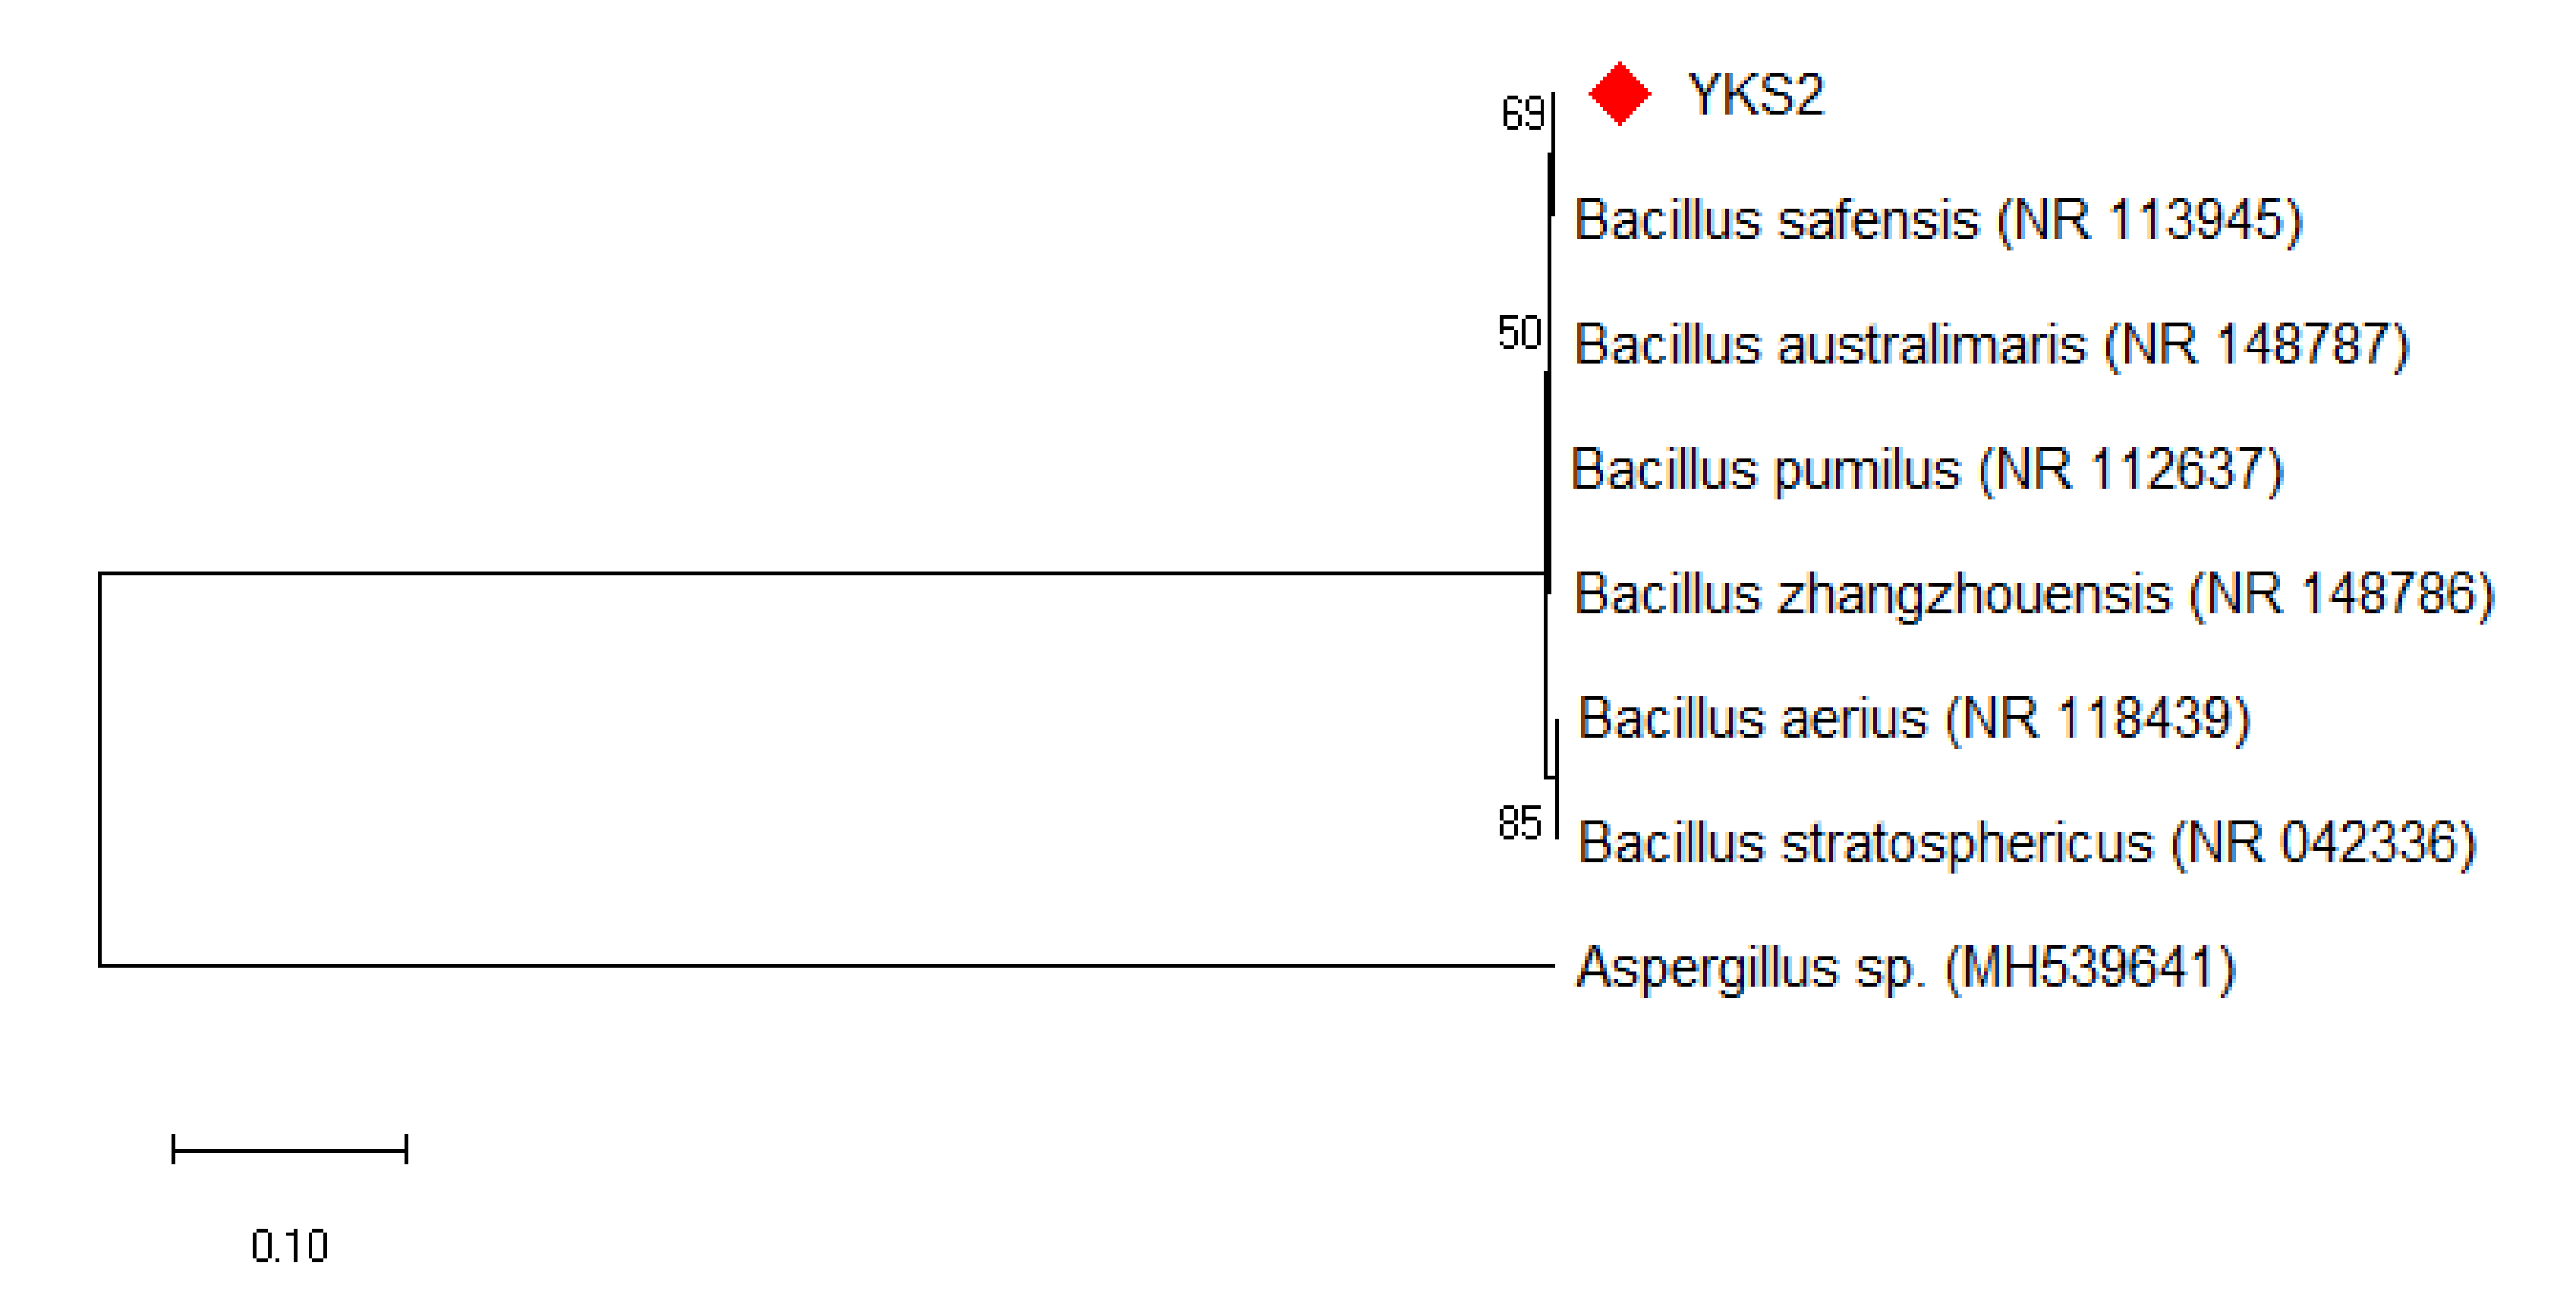
23]. For bacterial strain identification, the sequences were compared using BLAST (National Center for Biotechnology Information). The sequence was aligned using the cantor model of jukes. In the Molecular Evolutionary Genetics Analysis (MEGA 7.0), the phylogenetic analysis was performed using the neighbor-joining method and submitted to the GenBank.

2.4. Optimization of Bacterial Culture Conditions by RSM

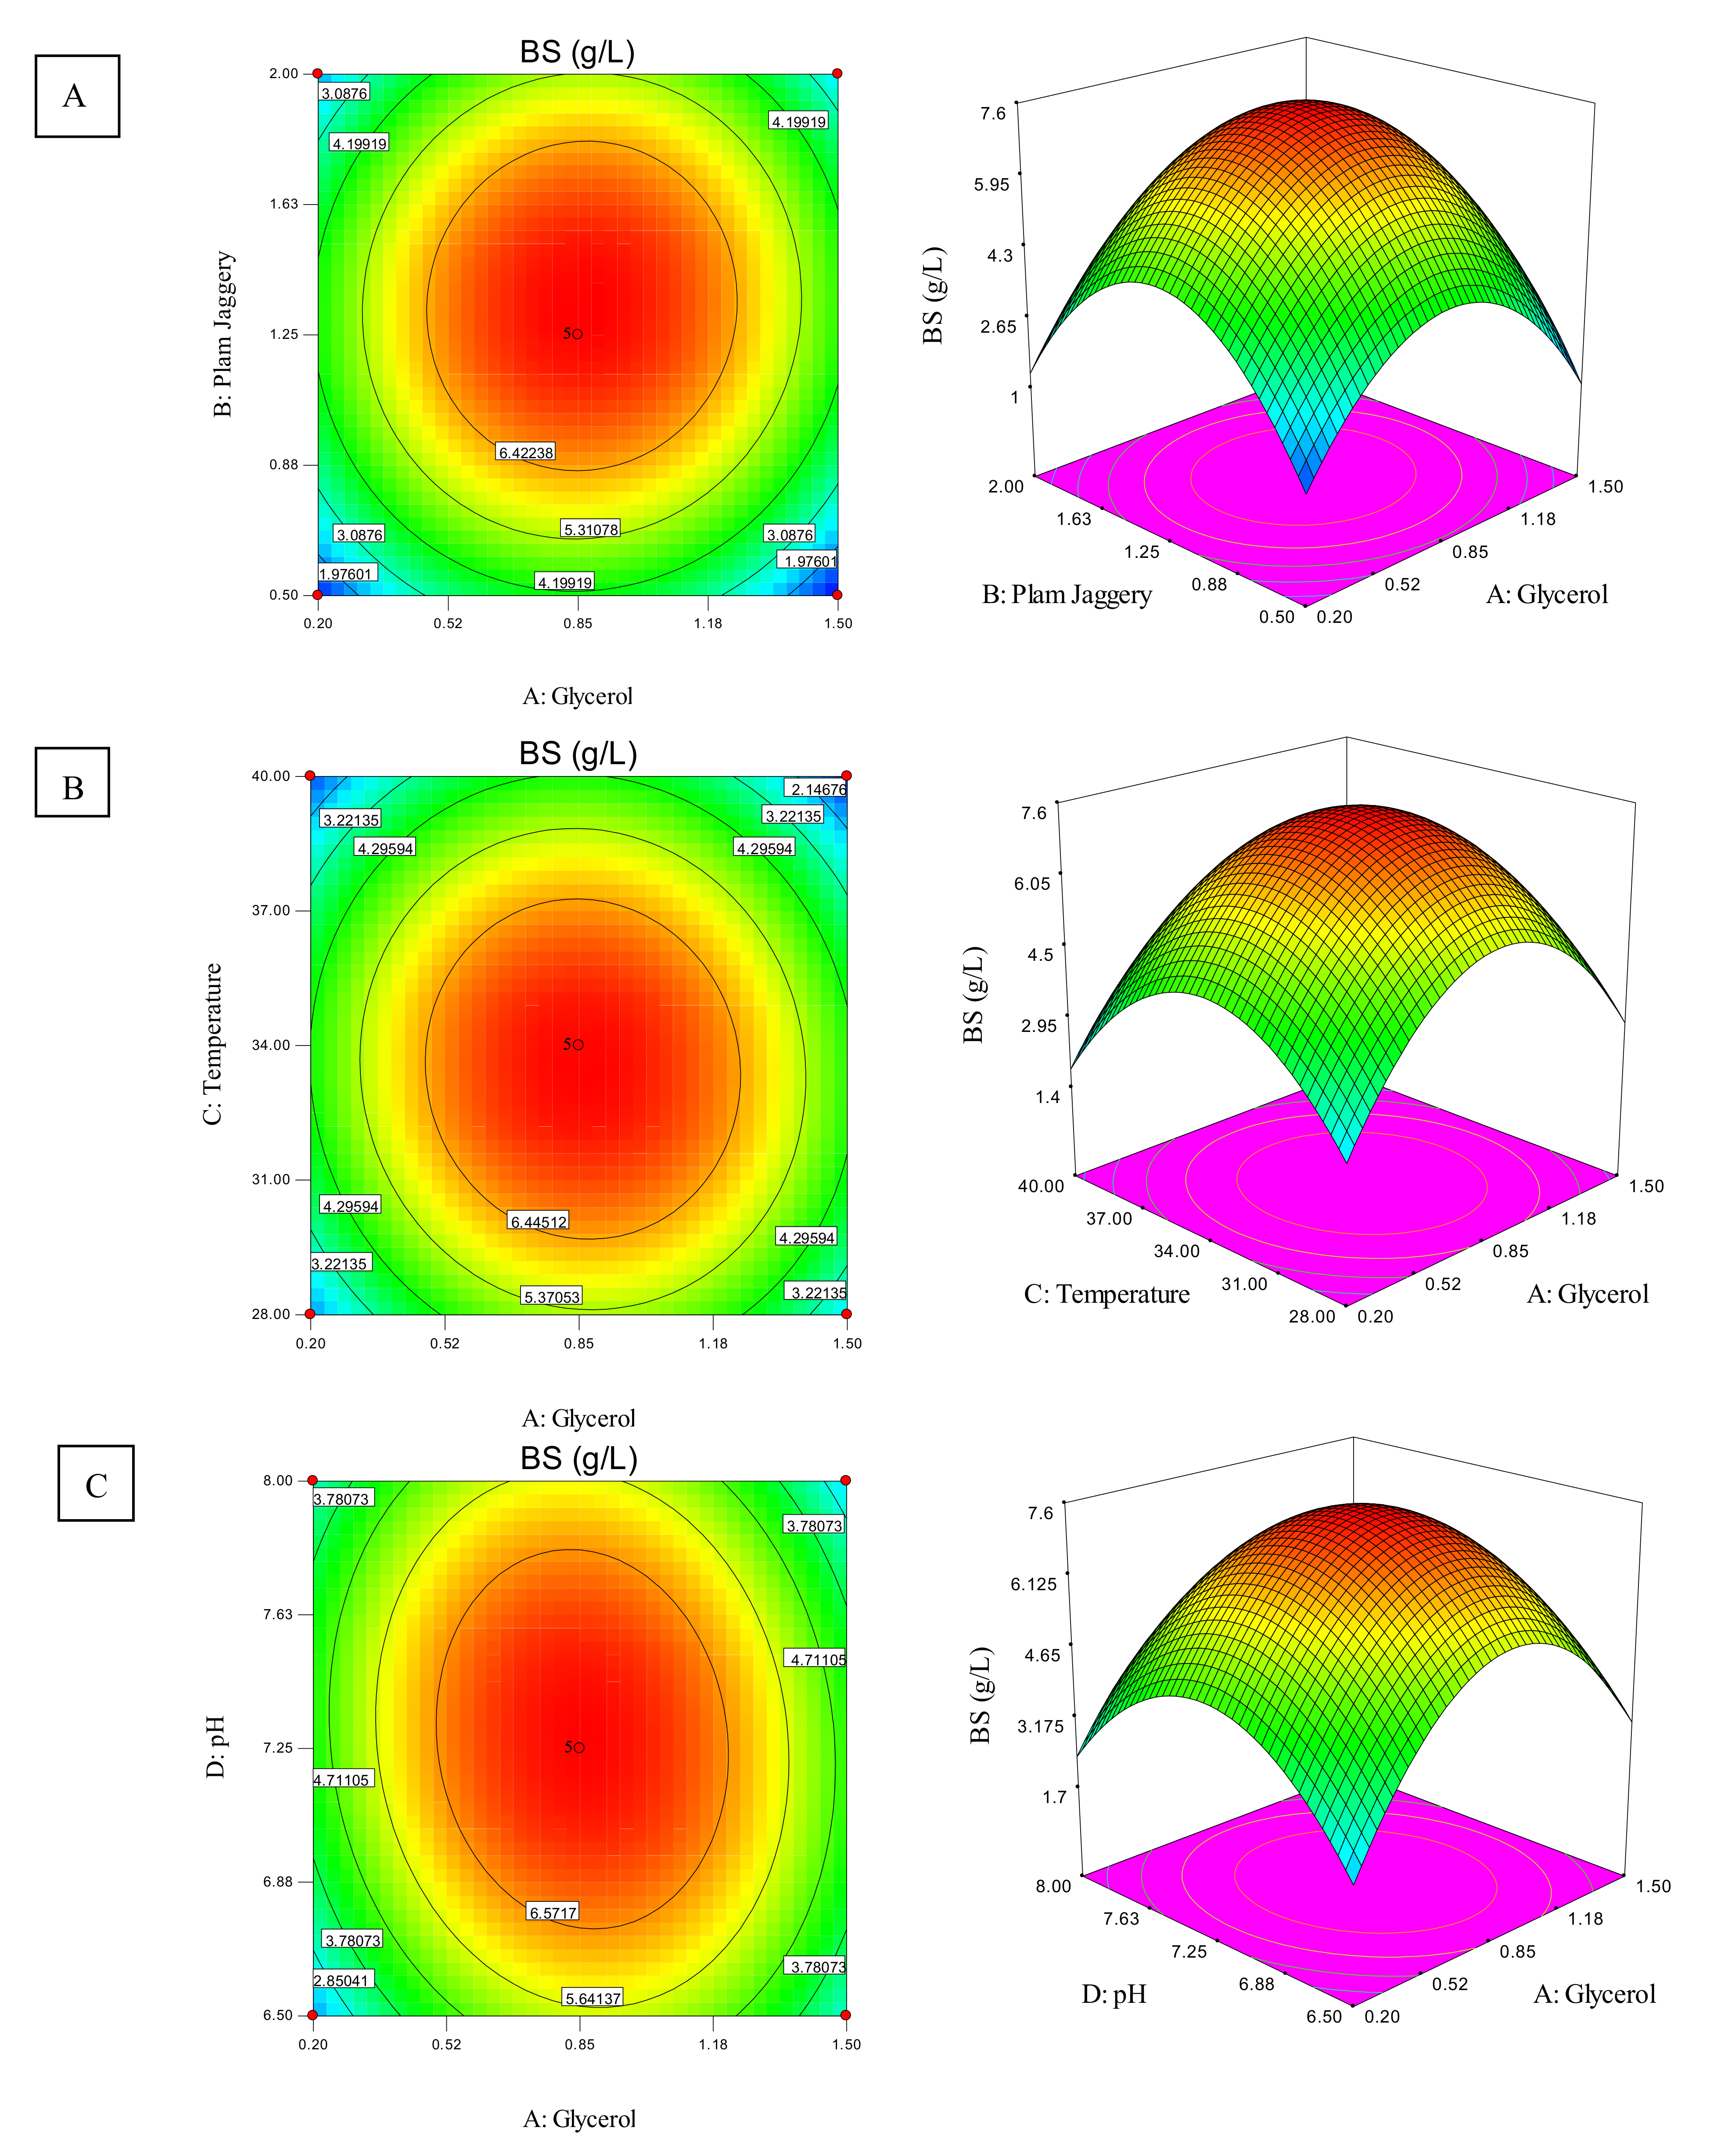
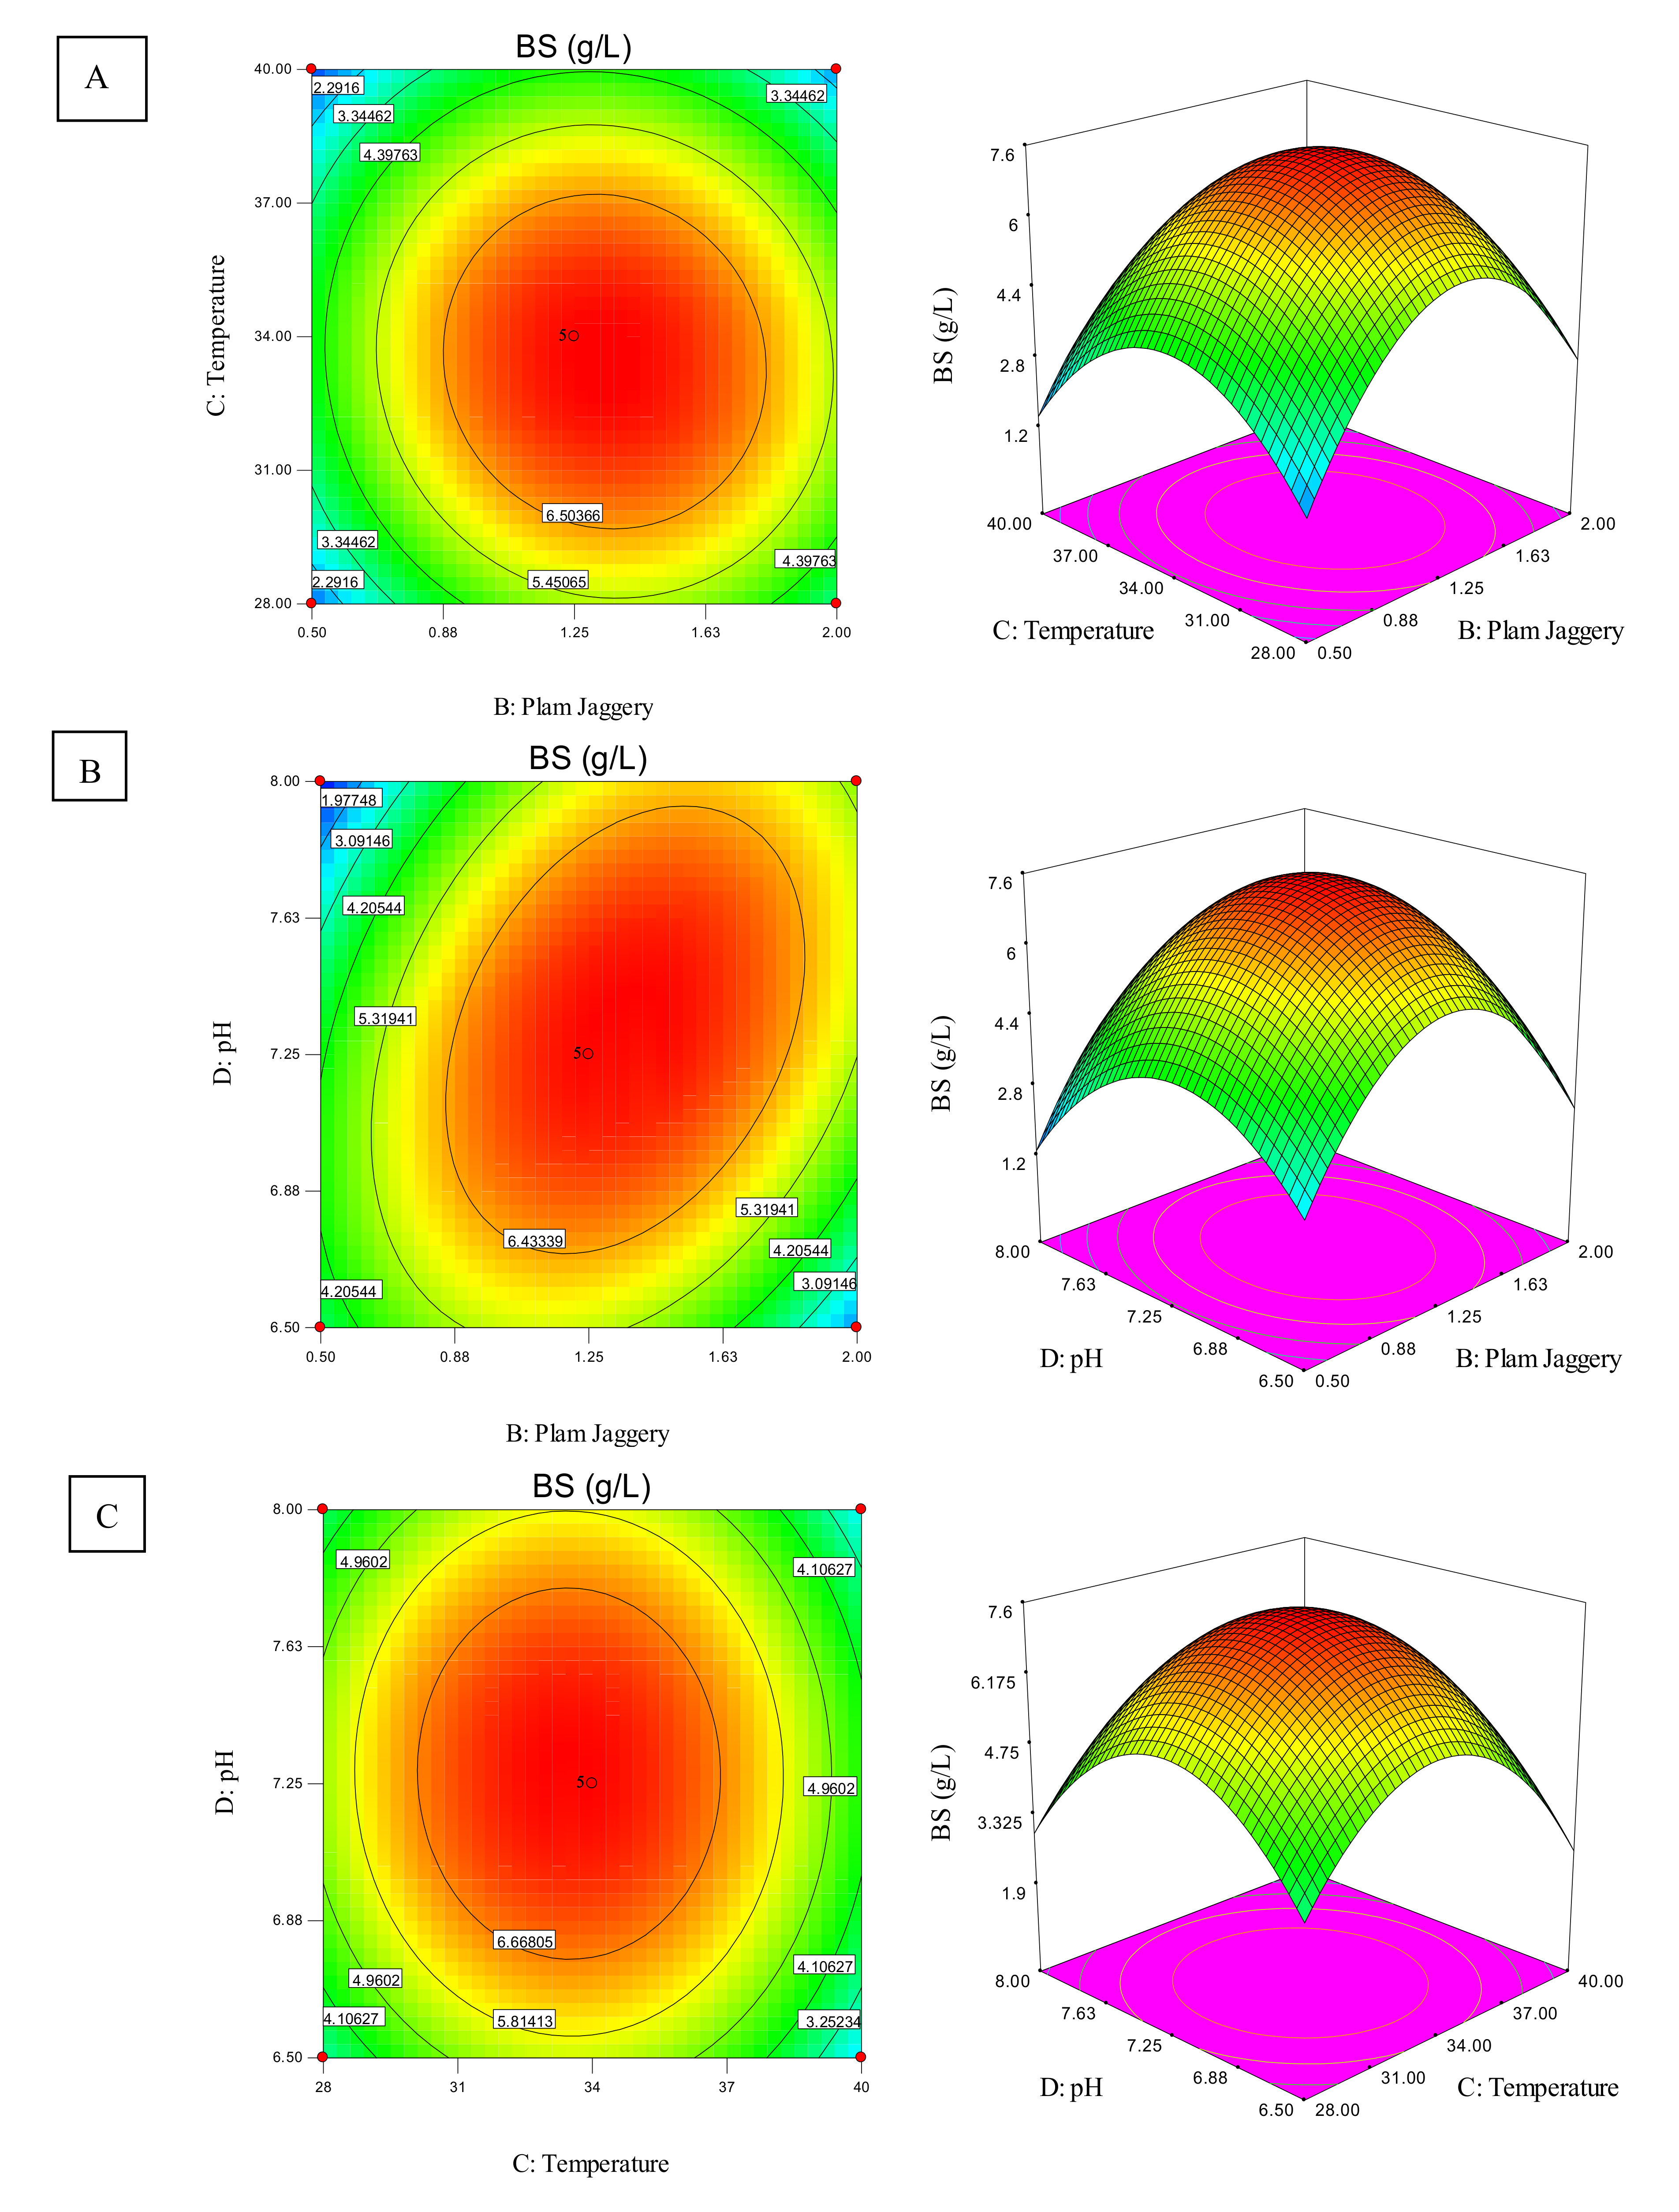
Response Surface Methodology (RSM) is a statistical grouping technique that is practical for analyzing the special effects on the system response of more than a few autonomous variables, without the need for a given relationship between the function of the intention and the variables. To get the best results for bacteria growth and activity, the composition of the medium and the growth parameters were improved using four distinct culture conditions with the use of RSM. Temperature, pH, carbon sources (palm jaggery) and nitrogen sources were all used as input factors in the model’s developmen(glycerol). Codes were assigned to each parameter, and a variety of parameters wasemployed to simulate the biosurfactant [24]. Culture samples were taken at regular intervals.The experimental data werethen analyzed using the Analysis of Variance (ANOVA) approach to determine which factors create the most effective interactions and help in the lowering of surface tension [25].

2.5. Extraction and Purification of Biosurfactant

After 48 h, the biosurfactant was recovered from cell-free supernatant. By reducing the pH level to 2.0, acid precipitation was carried outon cell-free supernatants. At an acidic pH, the biosurfactant was precipitated. The precipitate was then recovered by centrifugation and the pH was corrected to pH 7.0 before being freeze-dried.

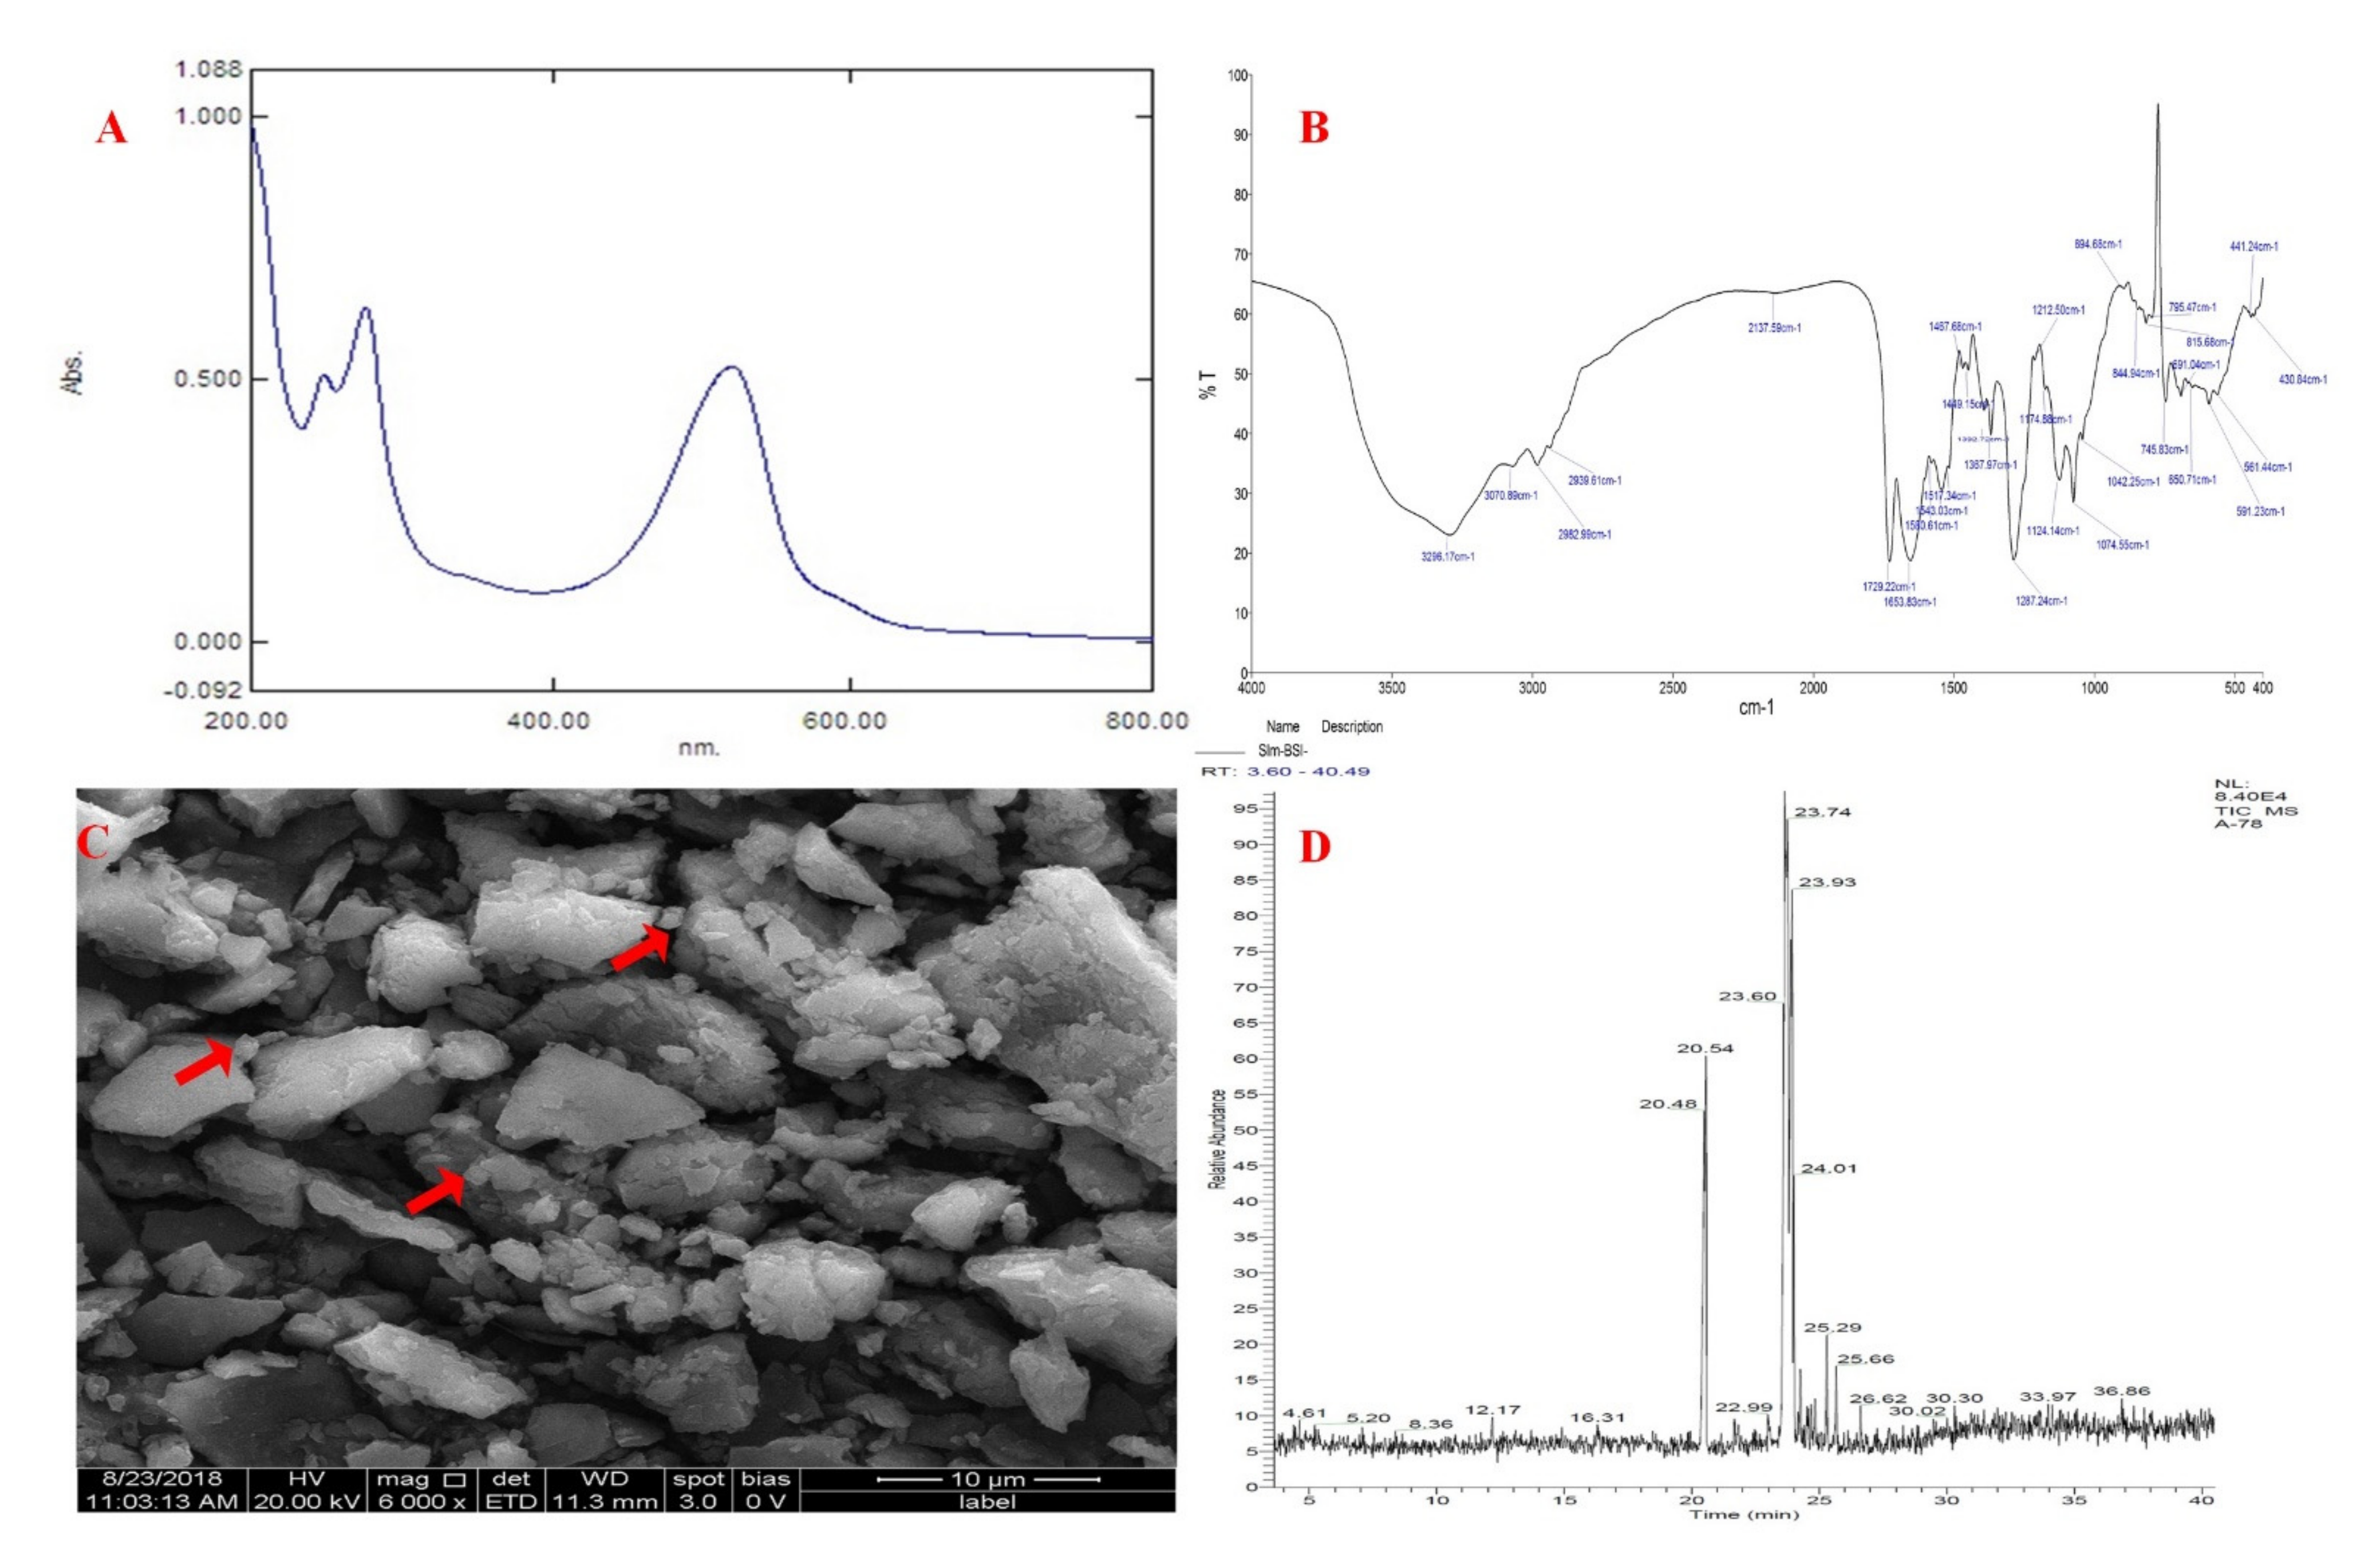
2.6. Characterization of Biosurfactant

The UVspectrophotometer is used either in the ultraviolet, visible, or near-IR spectral regions (200–800 nm) to measure the quantity of chemicals in the solution viathe chemical’s reflective or distribution properties depending on the wavelength of radiated light [26]. In order to identify the chemical in the mid-infrared (MIR) range of 4000–400 cm−1 of biosurfactants from samples isolated from bacteria, FTIR analysis was performed using the Perkin Elmer Spectrum. The scanning electron microscopic (SEM) study was conducted using the FEI QUANTA 200 FEG HR-SEM model with a working distance of 8 mm at 30 kV. A very small amount of the specimen was placed on the sample holder and thin films of the samples were prepared on carbon-coated paper. Using blotting paper, the extra solution was removed and the film on the SEM was allowed to dry by keeping it under a mercury lamp for 5 min. The GC-MS (Gas Chromatograph Mass Spectrometer) was used to analyze partly filtered biosurfactants. As the carrier gas, helium with a flow rate of 1.0 mLmin−1 was used. The initial temperature of the column was 1000 °C for 1 min, which was then ramped up to 2700 °C at 300 °C, and eventually kept for 10 min at 2700 °C. The inlet temperature, transfer line, ion trap, and quadruple were 270, 280, 230, and 1500 °C, respectively. Using the DB 35-MS capillary standard non-polar column (30 Mts, ID: 0.25 mm, FILM: 0.25 μm), the GC analysis may be carried out. The analytical conditions that can be used are: The temperature of the injector oven of 50 ° C for 0.5 min increased to 235 °C at 65 °C/min for 12 min. Electron effect with a 50–450 Da scan range and an injection volume of 1 m Lat 70 eV. The temperature of the source was 200 °C and the temperature of the interface was 250 °C, with 70 even energy and EI + 50–700 m/z. At the South India Textile Research Group, Coimbatore, India, GC-MS analysis was carried out.

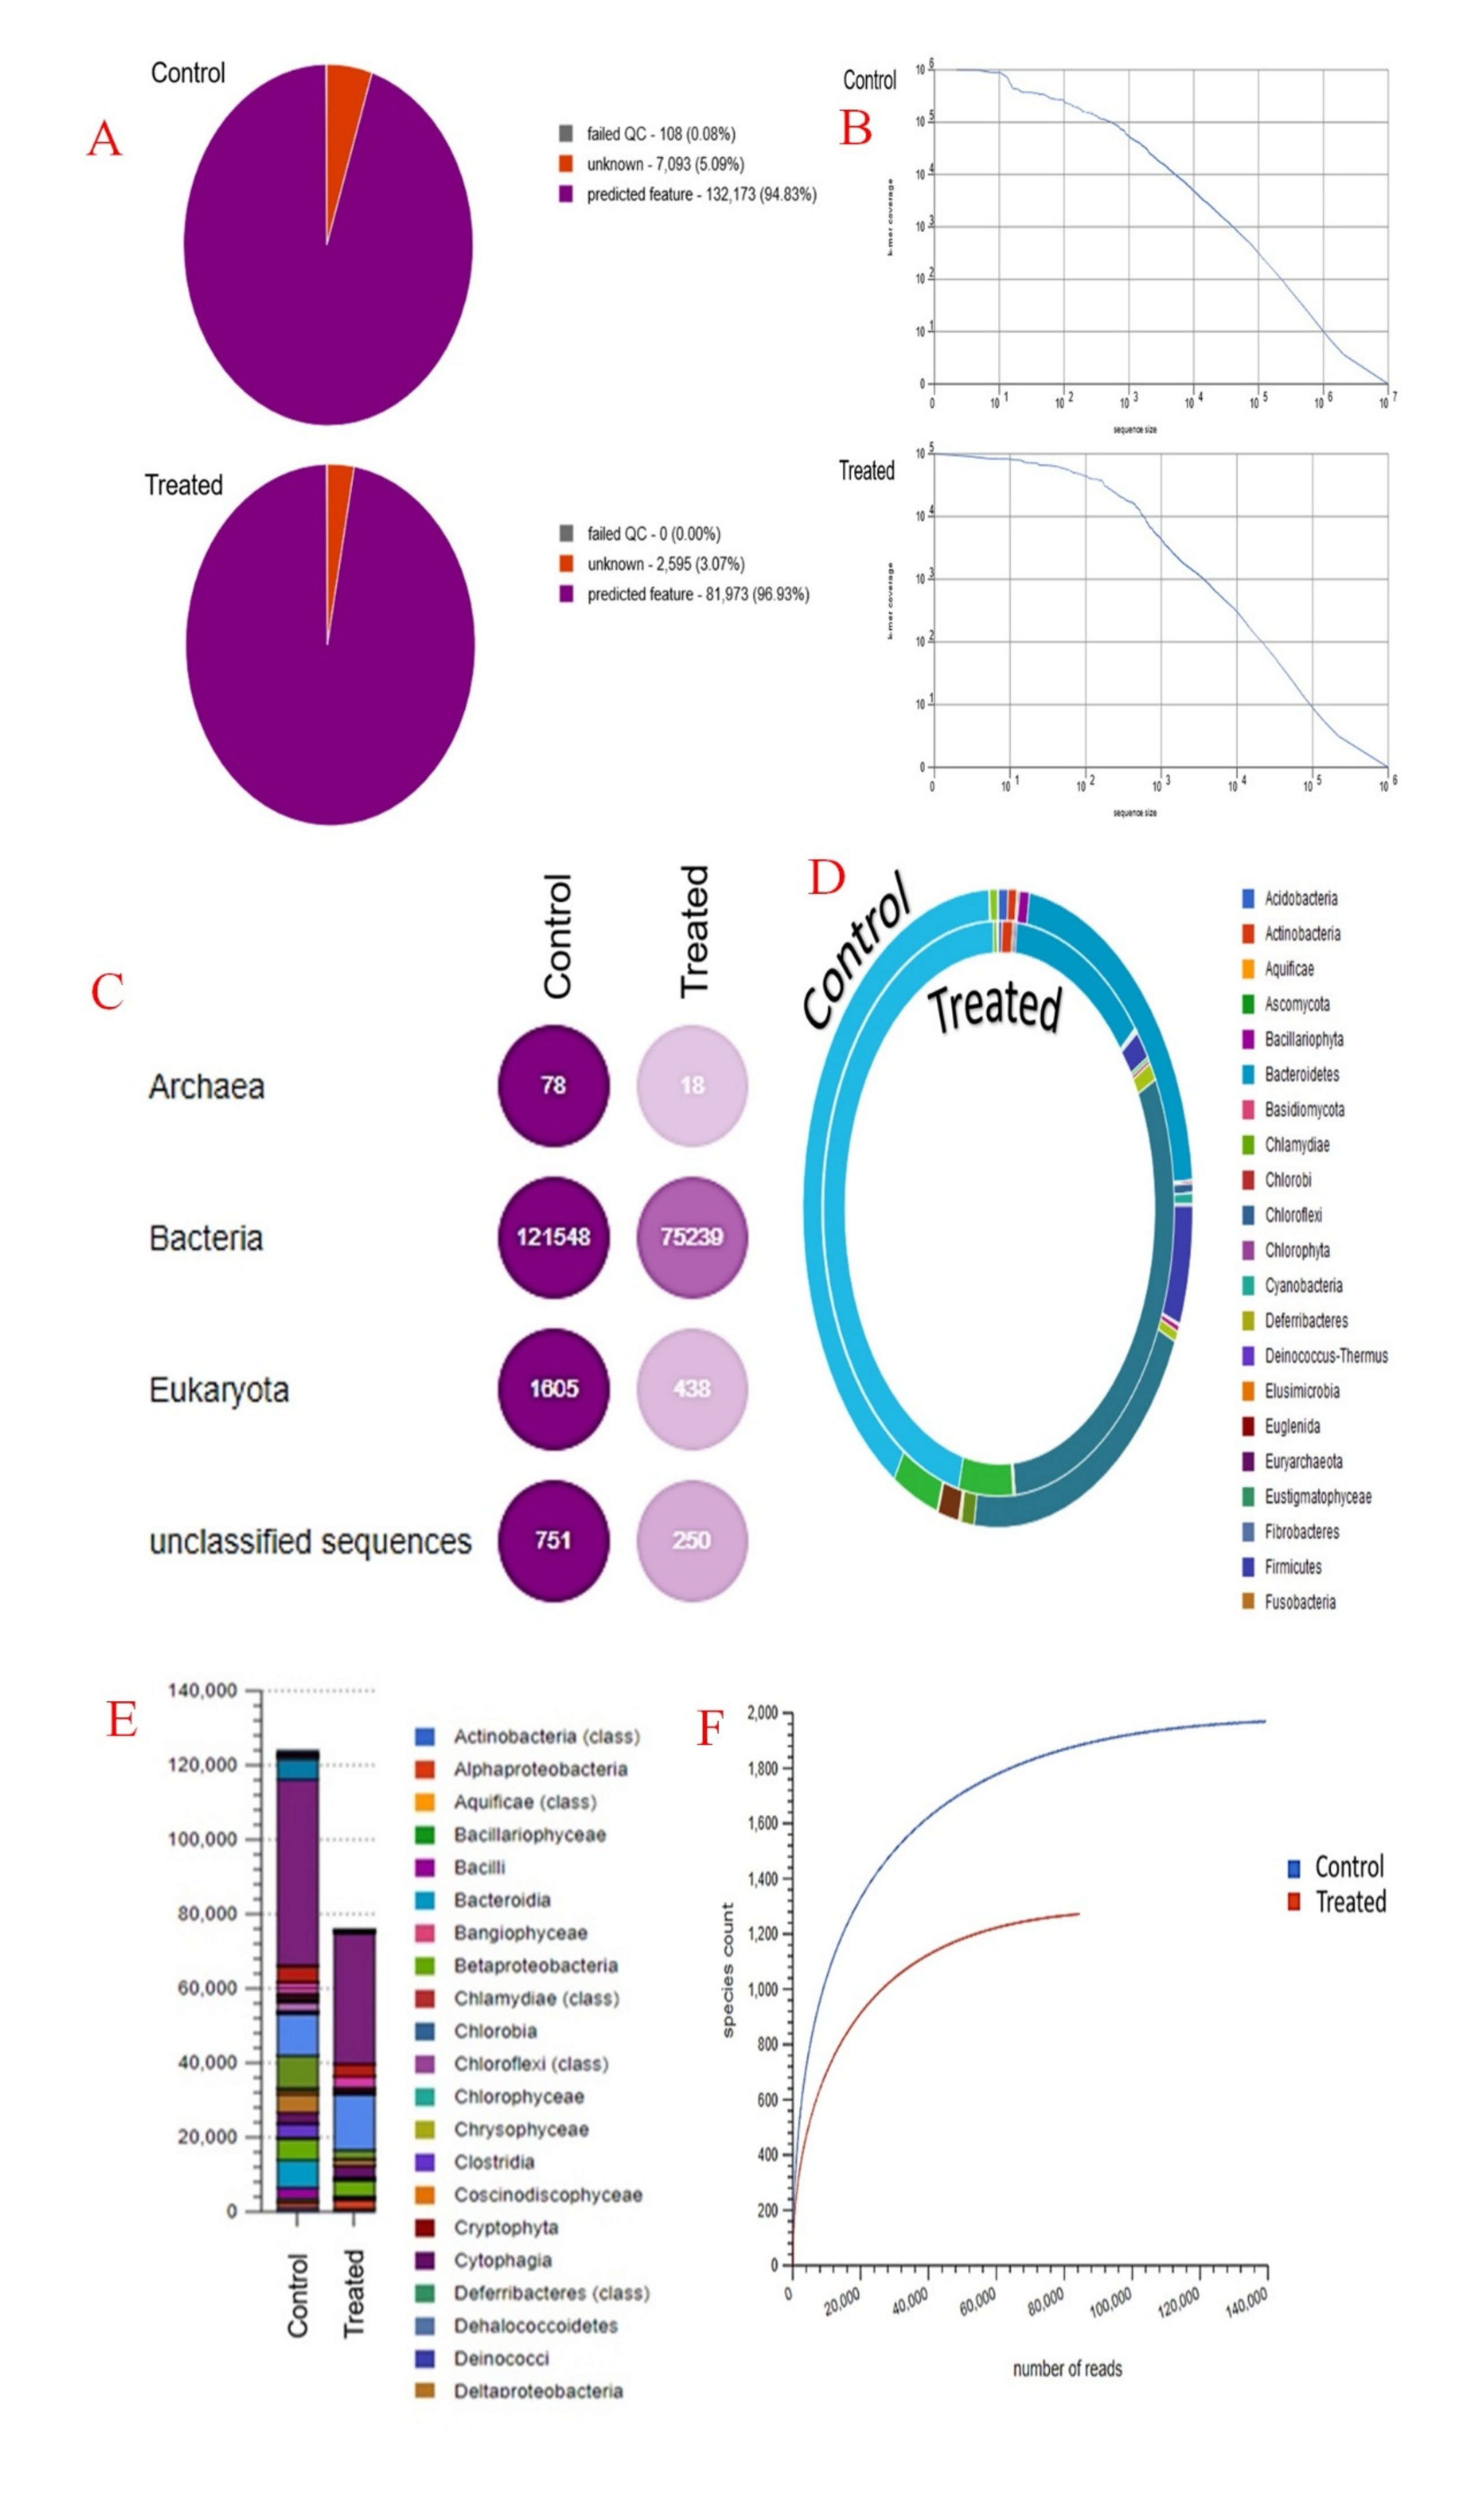
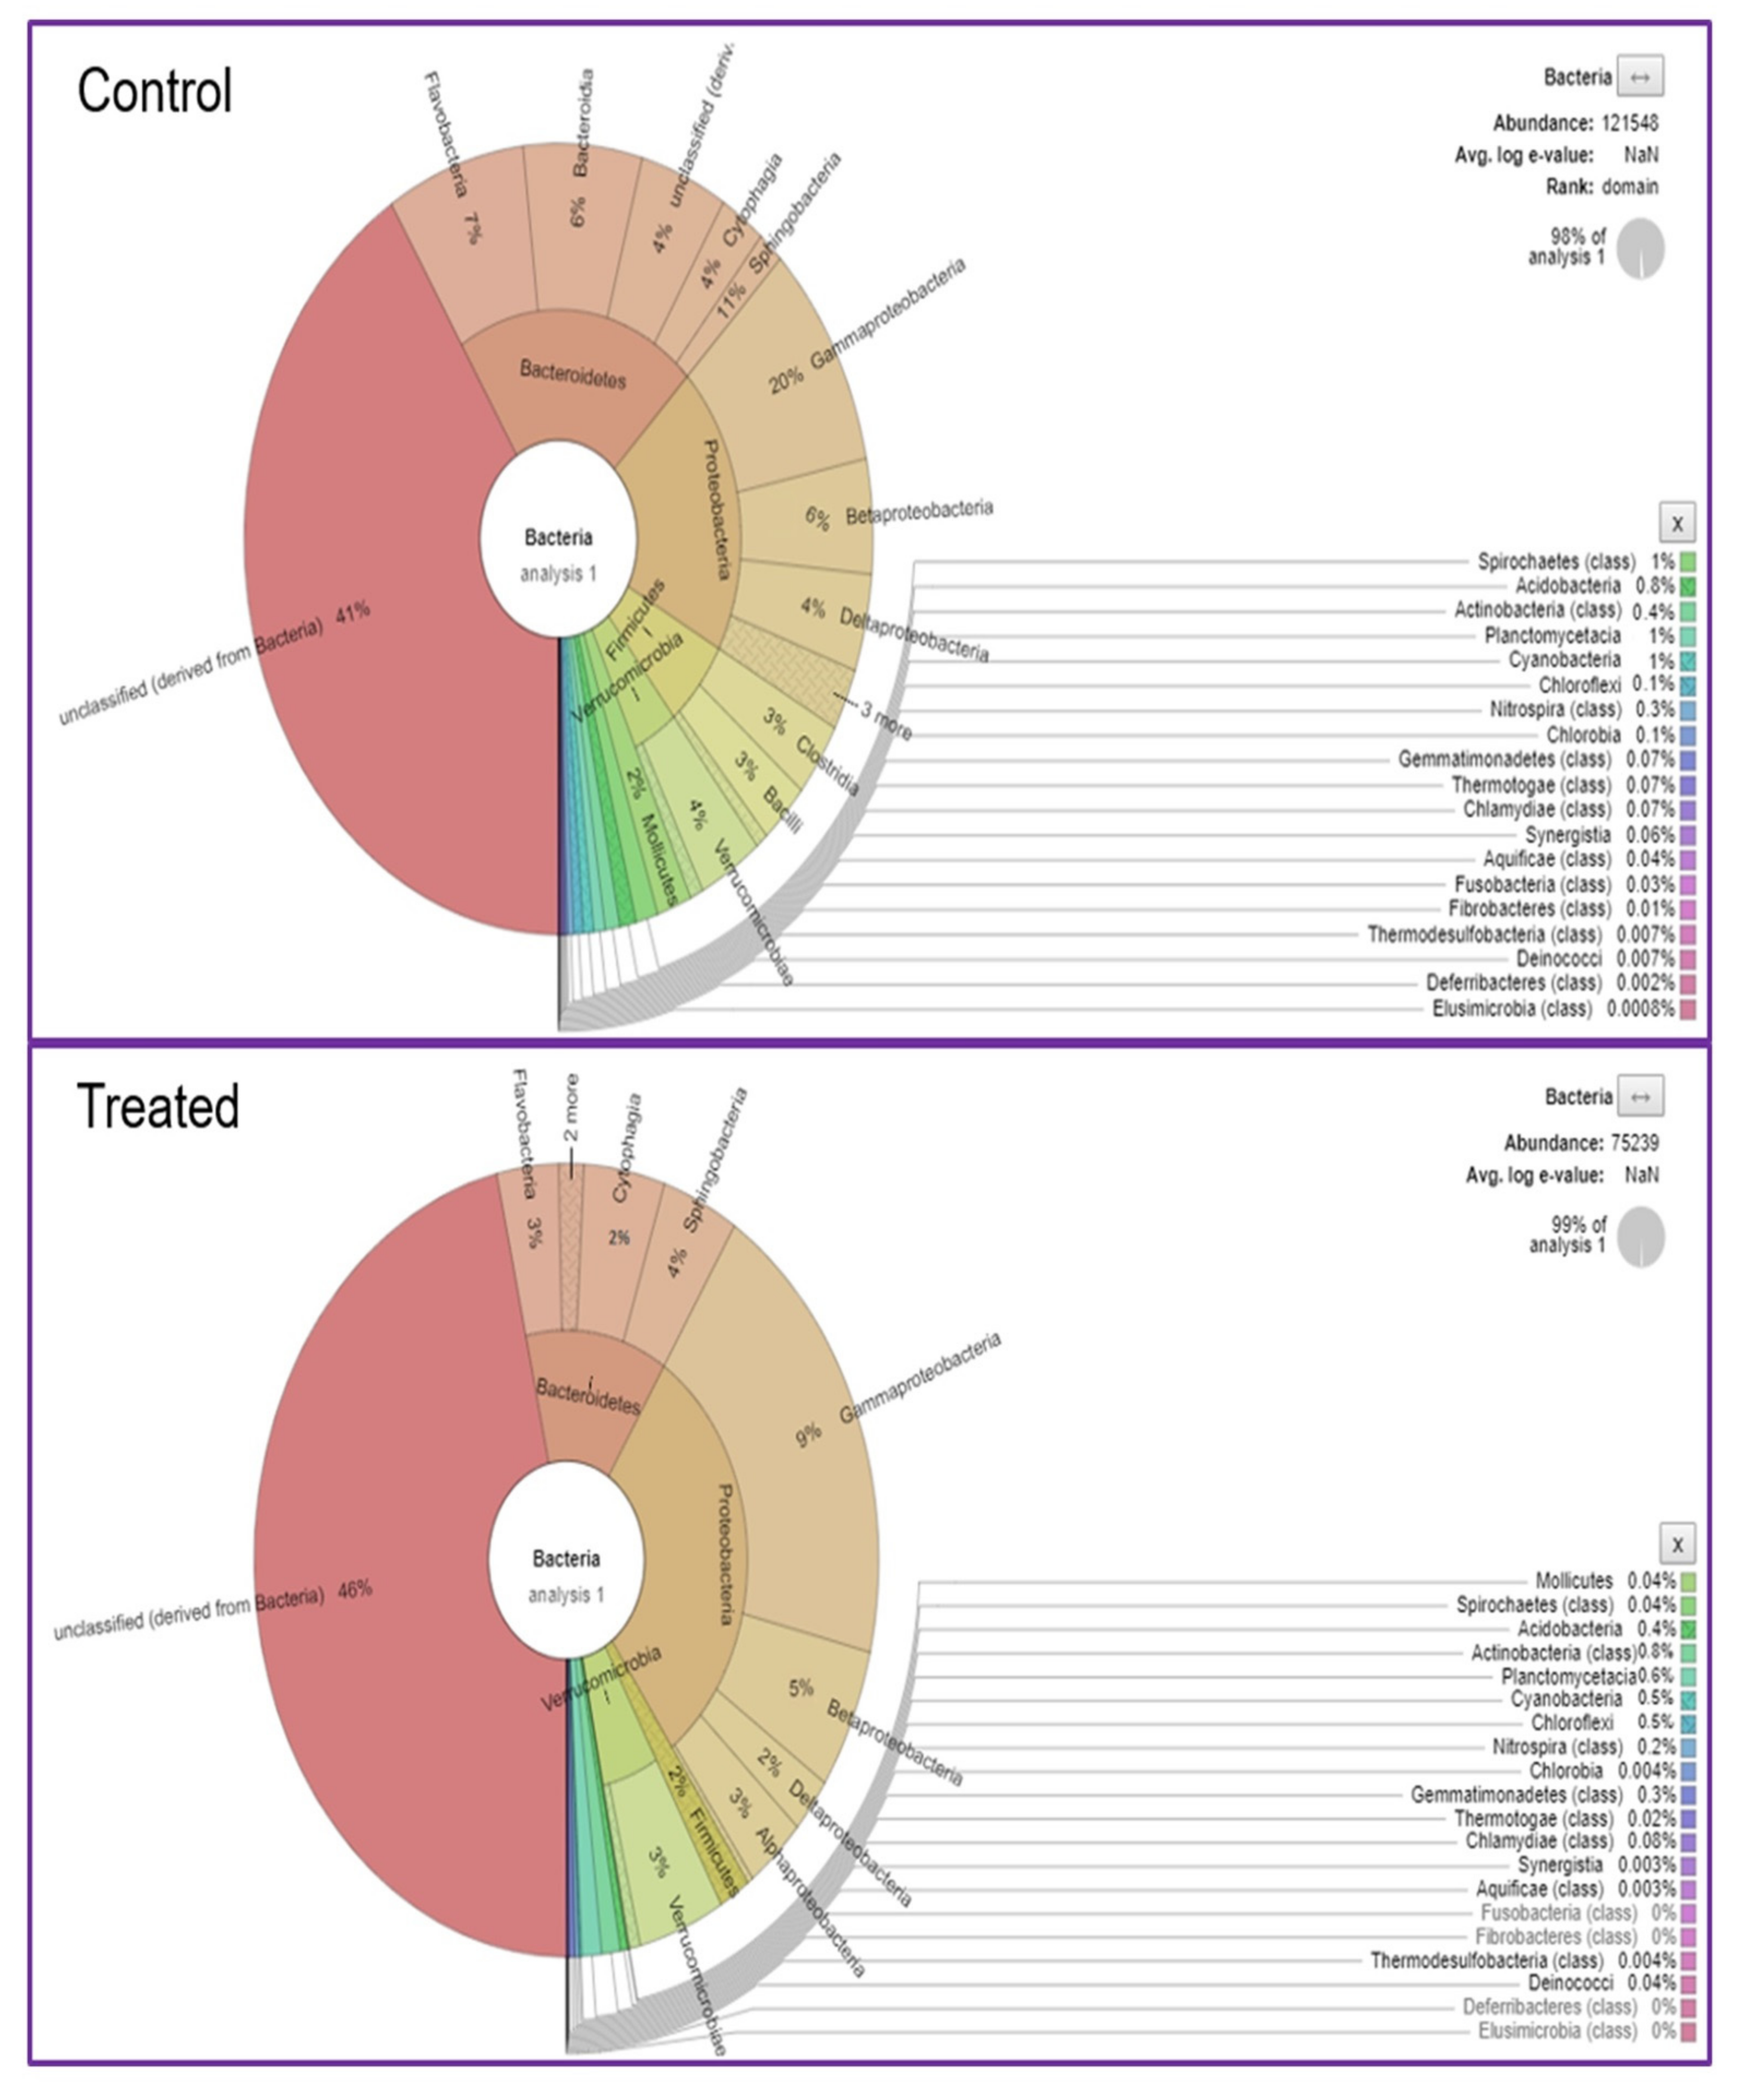
2.7. Biosurfactant-Mediated Wastewater Treatment and Microbial Community Analysis Using NGS Technique

The domestic wastewater samples were collected from the discharge sites of the Salem district and were used for treatment (Latitude of 11.664° N and Longitude of 78.146° E). The wastewater sample was collected using sterile containers and stored in arefrigerator at 4 °C until further processing. The wastewater treatment was performed by adding 1 gm of biosurfactant into 100 mL of wastewater and incubating at room temperature for 3 h. Physico-chemical parameters such as pH, EC, alkalinity, turbidity, dissolved oxygen (DO), chemical oxygen demand (COD) and biochemical oxygen demand (BOD) were analyzed in the wastewater before and after treatment. Treated (SWT) and untreated (SWC) wastewater samples were used to estimate the microbial communities by employing metagenomic sequencing. The wastewater samples were filtered to remove the floating particles before DNA extraction. A power water DNA extraction kit (MoBio, Carlsbad, CA, USA) was used to extract the total microbial DNA, which prevents humic acid interaction from the DNA. The recovered DNA was tested in Nano Drop to estimate the quantity and purity. Universal bacterial primers covering the V3–V4 regions were used for 16S rRNA gene amplification (34′F-CCTACG GGN GGCWGCAG; 805R GACTAC HVG GGTATCTAATCC) [27]. The amplification reactions were performed as per the methods of [28]. Using a next-generation DNA library preparation kit, the metagenomic library was prepared and sequenced using the Illumina MiSeq Next Generation Sequencer [29].

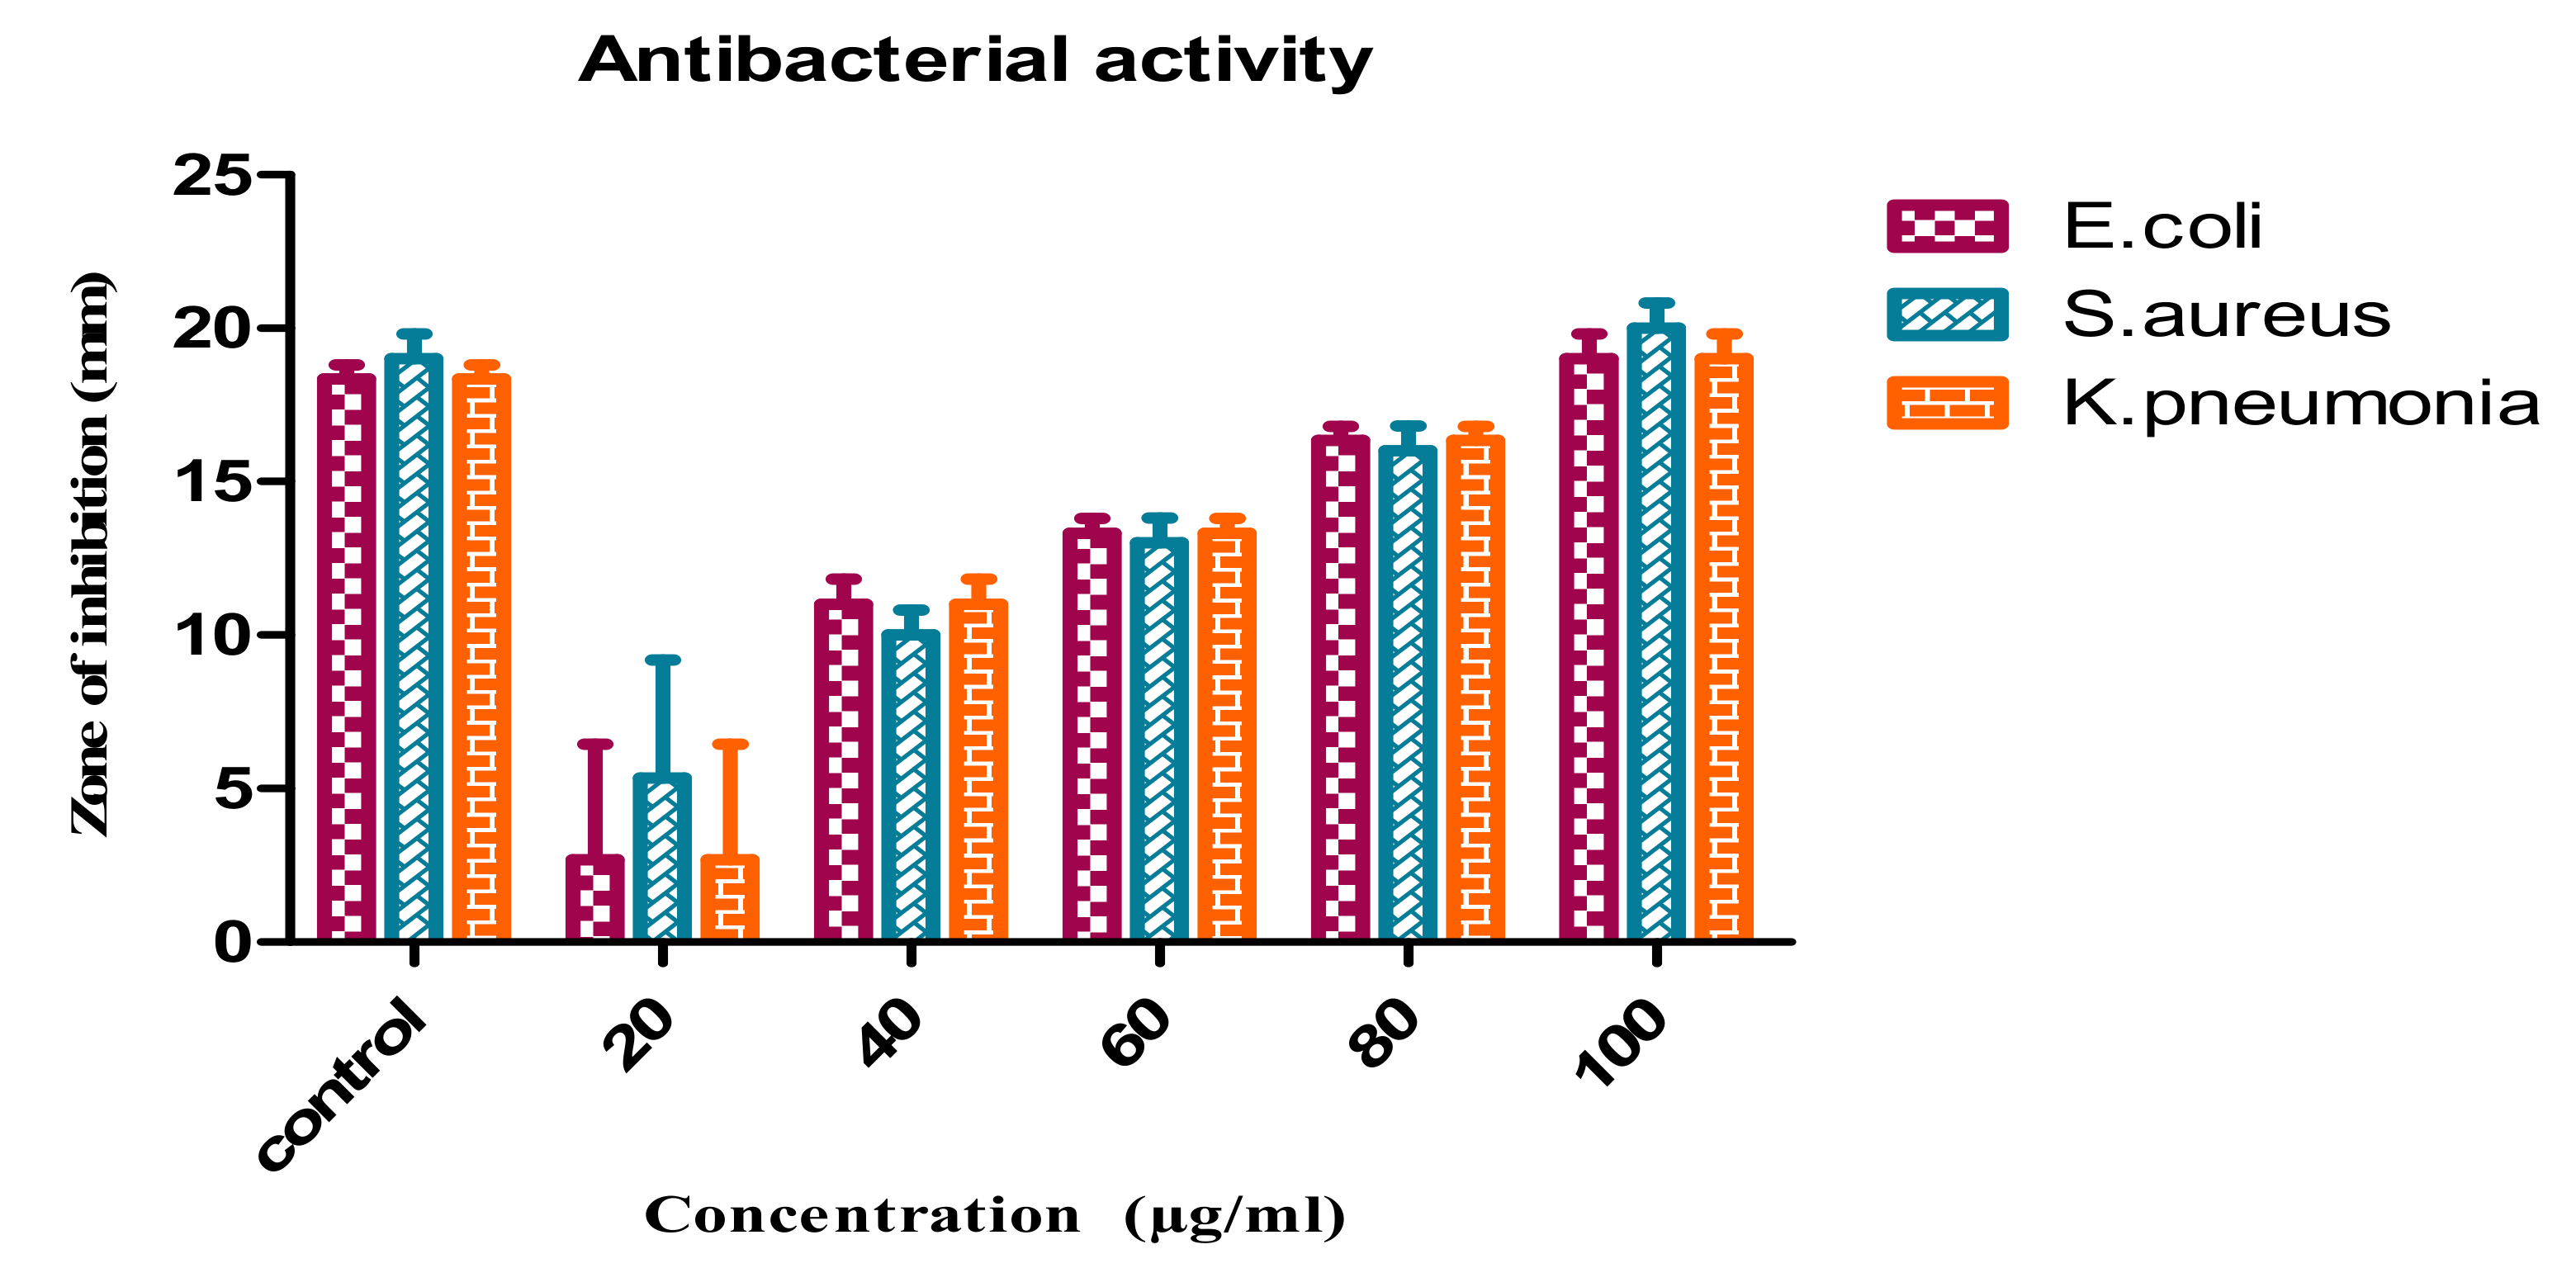
2.8. Antibacterial Activity of Biosurfactant

The antimicrobial activities of the biosurfactant developed from the B. safensis (YKS2) strain wereinvestigated against different pathogen bacterial strains. This was achieved by utilizing the agar well plate susceptibility method [30].

2.9. Statistical Analysis

ANOVA and Duncan’s multiple range examination were used to analyzeall the results (three replicates of each treatment). Microbial enumeration data were was subjected to two-ways ANOVA (SPSS version 16.0, Inc., Chicago, IL, USA) for data processing.

3. Result and Discussion

3.1. Isolation and Screening of Bacteria Producing Biosurfactant

Twenty morphologically different colonies were isolated, and six of them were found suitable for producing biosurfactants, which was verified using the drop-collapse, hemolytic activity, drop-collapsing, oil spreading and blue agar plate (Bap) methods. The highly biosurfactant-producing strain was identified using molecular techniques. The result show that the strain YKS2 was found in B. safensis (GenBank acc-MH539636) (Figure 1). Using culture media, B. safensis (YKS2) strain isolates were screened for biosurfactant production. B. safensis (YKS2) showed the maximum hemolytic activity, and it produced a green-colored zone on the agar, which clearly indicated α-hemolytic activity (Figure 2a). The drop-collapsing test also confirmed the biosurfactant activity (Figure 2b). The oil displacement test outlined the biosurfactant activity, and thus proved that the strain YKS2 has ahigher biosurfactant production potential (Figure 2c). The YKS2 strain produced clear oil displacement on the surface of the crude oil, which has a high surfactant property. The blue agar plate assay also revealed that a zone around the well was produced by the YKS2 strain, which indicated the production of anionic biosurfactant at 37 °C after 72 h of incubation (Figure 2d).

3.2. Optimization of Biosurfactant Production

The intermediate composition included carbon sources (palm jaggery) and nitrogen sources (glycerol), pH, temperature, and other growth factors greatly impacting cell growth and metabolic product accumulation. The optimization of these parameters will thus increase the performance of biosurfactants. As previously indicated, RSM may be a useful tool for analyzing a process and determining the strongest relationship between its characteristics. Numerical simulations can be performed with the aid of RSM, and the effects of the parameters of a given mechanism can be analyzed, as well as optimizing the conditions for desirable responses. As a statistical tool, RSM is used to model the production process of biosurfactants, and also to assess the importance of growth parameters and their interactions. The factors affecting the production of biosurfactants have been intensively studied. However, only a handful of these experiments have used the following statistical tool for experimental design (Table 1). The classical medium optimization approach consists of changing a variable while holding the others at a constant level. However, in the current study, with the aid of RSM, the growth condition of B. safensis (YKS2) was optimized for the nature of the experiments to achieve the maximum rate of development of the biosurfactants.
The operational parameters of the concentration of medium temperature, pH, palm jaggery, and glycerol were then utilized to develop an analytical model for modeling the reduction in surface tension (biosurfactants generation) in terms of RSM. The ANOVA results show that the model equation derived by Plackett-Burman Design 7.1 from RSM is a term that may be used to describe the generation of biosurfactants in a variety of situations. There was no shortage of fit for this model, and the quadratic R2 was 0.99987 (Figure 3). The production of biosurfactants depends primarily on pH and temperature, with optimal production occurring within a specific range. A combination of the right chemical components produces a culture medium for the isolation and development of bacteria, which are necessary for the provision of all the elements requiredfor the mass production of the cells and energy needed for biosynthesis and maintenance. The maximum biosurfactant production apparently depends on the quantity of nutrients salts and a substratum supplycontaining a carbon source and a nitrogen source. One of the critical parameters of biosurfactant production was found to be glycerol, and with a lack of salt, the productivity and development were stunted. NaCl supplementation was found to be around 5.2% (w/v) in the strain with full biosurfactant production. In a trend similar to the previous figure, as the glucose and temperature decreased or increased, we saw corresponding decrease or increase, whereas the worst conditions arose for both parameters in the centerof the specified spectrum. With glycerol concentrations set at 11 g/L and temperatures of 35 °C, the joint effects of salt concentration and pH are shown. The worse conditions prevailing at the lowest salinity areconsidered (Figure 4) as low and high pH; when salinity enhances the biosurfactant at a lower pH, this is suitable, but not so when the ideal circumstances occur in the middle.
The effects of biosurfactant production on glycerol concentration with medium pH at a fixed temperature of 37 °C and salt concentration of 50 g/L are here discussed. The production of biosurfactants by the YKS2 strain was continuously improved by increasing the glycerol concentration by 13.03 g/L as the maximum biosurfactant production was obtained. The yield of biosurfactants declined at higher concentrations of glycerol. At an optimum range of pH 7.0 with 13 g/L glycerol concentration, the response of the surface increased, and this proved to be an appropriate condition for the production of biosurfactants. Increasing the pH with a lower glycerol concentration, as shown/mentioned in the figure, contributes to the worst conditions for biosurfactant production. Glycerol concentration and temperature influence the production of biosurfactants, resulting in the reduction insurface tension at a fixed pH of 7 and a salt concentration of 50 g/L, which represents the reduction insurface tension when the temperature is between 32 and 42 °C.
Similarly, Mizumoto and Shoda [31] have used response surface methods for estimating optimum levels of the source of carbon and nitrogen for the production of biosurfactants, using Bacillus sp. as a mediator, by solid-state fermentation. They reported that the maximum yield for production under optimized conditions was 15.591 mg/g. Wei et al. [32] reported that at a concentration of 9 g/L−1, the dry weight of the biosurfactant produced by S. marcescens was noticeable. In a similar way, sunflower oil was also reported to be a good source for the yield of the biosurfactant [33,34,35]. Similar to in our study, Bacillus sp. was found to produce biosurfactants that are stable at varying temperatures (30–45 °C) and pH levels (4–9) [36,37]. In accordance with our findings, there was also evidence of a decrease in the E24% at lower pH levels, as studied by Chebbiet et al. [38].

3.3. Characterization and Purification of Biosurfactant

Biosurfactants wereeffectively produced using B. safensis (YKS2), which was initially confirmed by a UV–visible spectrophotometer. The biosurfactants that were produced showed maximum absorption at 530 nm (Figure 5a). The FT-IR was analyzed, and it was found that the various functional groups of O–H stretching, C–H stretching, O–H stretching, −N=C stretching, C=O stretching, secondary amide C=O stretching, C–O stretching, C–O stretching, and N–H stretching correspond to the N–H wagging group formed by the YKS2 biosurfactant (Figure 5b and Table 2).
Similarly, Zou et al. [39] predicted that the biosurfactants of Bacillus sp. contain relative functional groups;viz., peak at l443 crn−1 due to the presence of N–H, and peaks at 2933, 2863, l471 and 1491 cm−1 indicating the presence of aliphatic chains (-CH3 and -CH2-). A strong peak at 1642 specified the occurrence of the CO–N bond. The occurrence of peaks at l09l and 722 cm−1 can lead to the vibrations of C–N stretching. Previous lipopeptide biosurfactant reports have revealed that the presence of the 178 aliphatic groups correlates with a peptide moiety, as distinctive properties of lipopeptide biosurfactants were confirmed by these FT-IR definitions [40]. Singh and Tiwary [41] have reported similar absorption ranges. According to Ramani [42],the characteristic frequency of amide stretching in the 3250–3300 cm−1 and l500–1650 cm−1 regions is unique to the form of lipopeptide biosurfactant, and is usually not observed in glycolipid biosurfactants.
In the FE-SEM analysis, poly-dispersed and roughly spherical biosurfactants were reported within the average size range of 11.3–50.95 nm (Figure 5c). Similarly, the previous literature also reported on the relative SEM analysis for biosurfactant production and cell adherence [43,44]. Major peaks were observed at retention periods of 23.74, 23.93, 23.60 and 24.01 min after conducting the GC-MS of the biosurfactant, as shown in Figure 5d. The GC-MS analysis ofbiosurfactant fatty acid compositions produced from Bacillus sp. showed the presence of 3-hydroxy decanoic acid (C10:0) as the most abundant fatty acid, with a relative percentage of 88.27 ± 0.07 (Table 3).
Qiao and Shao [45] also reported the presence of a mixture of hexadecanoic, pentadecanoic, dodecanoic, tetradecanoic, octadecanoic, (9)-octadecenoic and (9,12)-octadecadienoic β-hydroxy fatty acids in the lipoprotein biosurfactant. Conversely, the higher-molecular-weight biosurfactants displayed higher emulsification activity [46]. Several studies have reported on the efficiency of using bacteria in biosurfactant production, and theyhave thus been used in many applications, such as wastewater treatment, oil degradation and recovery.

3.4. Microbial Community Analysis in Biosurfactant-Treated Wastewater by Metagenomics Technique

The wastewater parameters, viz.pH, EC, turbidity, alkalinity, dissolved oxygen (DO), chemical oxygen demand (COD) and biochemical oxygen demand (BOD), were tested for the control (SWC) and biosurfactant-treated wastewater (SWT) to determine the efficiency of using biosurfactant inwastewater treatment, as depicted in Table 4. Metagenomics is one of the more trusted approaches forstudying the microbial diversity and functional potential of extreme habitats. Previously, many studies have been conducted to determine the functional diversity of such extreme environments. Sequences of two different (SWC and SWT) samples were used for comparative analyses of the microbial community profile. The initial sequences obtained in the FASTA format were uploaded into MG-RAST for analysis. These raw sequences were then passed through quality filtering. The bad-quality sequences were trimmed, and good-quality sequences were used for further analysis.

3.4.1. Sequence Quality and Statistics

The results of the microbial community analysis show that approximately 0.00 percent of the sequences analyzed (0.08 percent) failed the superiority control pipeline, 108 of the sequences (0 percent) that passed quality control had rRNA genes, and approximately 132,173 (94.83 percent) of the sequences did not have rRNA genes (96.93 percent). The rarefaction bends level to the right at a maximum E-value cutoff of 1e−5,dependent on the accessible source databases utilized for investigation (Figure 6a). Annotated species richness is the quantity of particular species comments in the consolidated MG-RAST informational collection. The Shannon diversity variety is a weighted average of the logarithm for the overall abundances of assessedspecies. The species-level explanations are derived from every one of the comment source databases used by MG-RAST.
The base pair count SWC (41,951,574) and SWT (25,454,968) sequences, totaling 75,861,768 support pairs, had a normal length of 1000 bps. The sequences were analyzed in different categories. A total of 3,809,704 SWC and 1,943,367 SWT (8.9%) failed to pass the QC pipeline. Among the sequences, 12,818 SWC and 6483 SWT sequences contain predicted proteins, with (SWC) 156 and (SWT) 62 known functions with unknown functions. (SWC) 12,818 and (SWT) 6483 sequences that passed QC did not have rRNA genes or predicted proteins (Table 5). The K-merprofile indicates the species richness of a given sample. In our study, the rarefaction curve revealed that the most species-rich sample had a value of (SWC) 10−6 to 10−7, followed by (SWT) 10−5 to 10−6. The species richness in graphical form is shown in Figure 6b. The reduction in the abundance of the microbial communities upon biosurfactant treatment reveals the efficiency of using biosurfactants in awastewater treatment system [47]. These sustainable remediation strategies reveal a lower evenness inthe microbial communities in terms of population and diversity [48,49].

3.4.2. Microbial Classification

The sample was found to contain representative sequences from the three domains, viz., archaea, bacteria, and eukaryota. The most abundant group was found to be bacteria, followed by eukaryota, archaea, and unclassified sequences. As the sample belonged to different locations withdiverse geochemistries and ecological niches, each group of organisms might have specific requirements, and the availability of such necessities helps the growth and survival of specific groups of organisms. The diversity of each sample is briefly summarized in the following: in bacteria, SWC—121, 548 and SWT—75,239. Archaea: control—78, treated—18. Eukaryota: control—1605, treated—438. Unclassified sequences: control—751, treated—250 (Figure 6c). In both the control (93%) and treatment (63%) groups, Phylum predominated, and was higher than in other species. At this level, the domain or-ganisms in the water layer were the ratios of each phylum of microorganisms in a layer that varied from the other levels (with bacteroidetes: control—93%, treated—63%) The proteobacteria group widely dominates in all environments, as well as atnormal temperatures across the globe from polar to non-polar (Figure 6d). The classification into lower taxonomic levels showed that the diverse population in the reactor samples was up to 21, ordered into 17 families and 35 genes, shown (Figure 6e) at the class level forthe wastewater sample. The class level of Deferribacteria (class) showedthat the ordersamong the 16S rRNA encoding readswere: Actinobacteria control—7.07%, treated—0.3%; Chlamydiae control—13%, treated—6.73%; Chloroflexi (class) control—71.37%, treated—47.03%.

3.4.3. Rarefaction Curve and Krona Map

The rarefaction curve annotates species richness. This curve is the total number of separate species observations and the function of thesequence number in each of the samples. In this study, rarefaction revealed that the most species-rich sample was the sewage water sample control, with a value of 123,679, followed by the treatment sample, with 91,654. The species richness in graphical form is shown in Figure 6f. The sequence results reveal the phylum Proteobacteria SWC (41.98%) and SWT (15.28%) as the foremost community, followed by the phylum Bacteroidetes SWC (17.85%) and SWC (13.19%), Verrucomicrobia SWC (7.06%) and SWT (6.54%) and Planctomycetes SWC (1.70%) and SWT (2.22%), while the unclassified bacteria accounted for SWC (36.09%) SWT (26.83). The metagenomic study revealed that the biosurfactant-treated wastewater containsa smallermicrobial community than the untreated control. In conclusion, the biosurfactant effectively removed a significant number of microbial populationsfromthe treated wastewater sample. The taxonomically distributed control contained 96% bacteria after being treated; 67% of the Flavobacteria, Spirochaetales, Gammaproteobacteria and Beteproteobacteria, and a low percentage of other sequences, including bacteria. The ranks of the plots representing the taxonomic productivity and abundance of unclassified sequences at the species level are shown in Figure 7. Indeed, NGS analysis of 16S rRNA gene diversity has always been a strategy to explore andreveal microbial diversity and population density, as it isan effective molecular tool [50,51].

3.5. Antimicrobial Activity of the Biosurfactant

Antibacterial activity against pathogenic bacteria S. aureus, E. coli and K. pneumonia cultures was reported by a biosurfactant partly purified from B. safensis (YKS2). The biosurfactant produced a zone of inhibition against S. aureus, E. coli and K. pneumonia in a well-diffused assay (Table 6). Increased concentrations of biosurfactant led to an increase in the diameter of the inhibition zone.
Maximum inhibition zones of 20, 40, 60, 80 and 100 μg were observed at the given biosurfactant concentration. The zone of inhibition was approximately 20 mm for E. coli, 21 mm for S. aureus and 23 mm for K. pneumonia. Thezone of inhibition’s diameterwas found to be larger for E. coli than for S. aureus (Figure 8). Several biosurfactants have been previously identified toexhibit antimicrobial activity against different microorganisms [52]. The antibacterial effects of known biosurfactants arecomparable tothose of previous studies [53,54,55]. Moreover, few reports on the antimicrobial activity of Lactobacillus-isolated biosurfactants have been reported; only biosurfactants derived from S. thermnyhilus and Lactis 53 have shown strong antimicrobial activity against several strains of bacteria and yeast isolated from explanted speech prostheses. A broad spectrum of action, including antimicrobial activity against multidrug-resistant microorganism profiles, was shown by the biosurfactant isolated in this study. The maximum inhibition zone was observed at a concentration of 15 mg/mLof thebiosurfactant, whereat it was roughly 287 cm for E. coli and 266 cm for S. aureus.

4. Conclusions

The present study evaluated a B. safensis (YKS2) biosurfactant for use in wastewater treatmentand itsantibacterial activity. The biosurfactant was shown to have good surface tension-lowering and emulsification properties. The biosurfactant showed the potential for enhanced antimicrobial activity. The characterization analysis of theFT-IR and GC-MS results of the wastewater reveal that the biosurfactant generated by B.safensis YKS2 is similar to glycolipid, hexadecanoic, pentadecanoic, dodecanoic, tetradecanoic, and octadecanoic biosurfactants.This biosurfactant’s thermal stability, tolerance ofa wide range of pH values and salt concentrations, and lack of toxicity make it a viable choice for biotechnological, environmental, cosmetic, food and medicinal applications. It isconcluded that B. safensis YKS2, producinga glycolipid type of biosurfactant, has potential benefitsin wastewater remediation and can be utilized in the biosurfactant industry on a large scale. Future technologies, such as wastewater and various drone applications, are also seen to be compatible with biosurfactants. The fascinating stability and efficient emulsifying capability of the biosurfactant make it a promising economic alternative for various industrial and environmental applications.

Author Contributions

Conceptualization, S.V., C.K.; methodology, analysis, and data curation, D.K., R.K.G.; writing—original draft preparation, D.K., B.B., N.A.A.-D.; data validation and interpretation, review/revision; C.K., B.B., M.V.A., N.A.A.-D., C.V., S.V., H.K., M.V.A.; writing—review and editing, B.B., S.V., M.V.A., N.A.A.-D., H.K., S.C.; supervision, project administration, S.V., C.K. All authors have read and agreed to the published version of the manuscript.

Funding

This research received no external funding.

Institutional Review Board Statement

Not applicable.

Informed Consent Statement

Not applicable.

Data Availability Statement

The data presented in this study are available on request from the corresponding author. Further inquiries can be directed to the corresponding author.

Acknowledgments

The authors would like to thank Division of Biotechnology, School of Agro-Industry, Faculty of Agro-Industry, Chiang Mai University, for their facilities. We also acknowledge Science and Technology Park, Chiang Mai University, Thailand. The authors are thankful to the authorities of Periyar University for providing the necessary facilities to carry out the research work. Additionally, the authors gratefully acknowledge support from the University Teknologi Malaysia, the Post-Doctoral fellow (Teaching and Learning) Scheme under MJIIT-UTM, and are thankful to the South Ural State University for extending support for research collaboration and invitations as visiting senior researchers.

Conflicts of Interest

The authors declare that they have no known competing financial interests or personal relationships that could have appeared to influence the work reported in this paper.

References

  1. Bezerra, K.G.O.; Rufino, R.D.; Luna, J.M.; Sarubbo, L.A. Saponins and microbial biosurfactants: Potential raw materials for the formulation of cosmetics. Biotechnol. Prog. 2018, 34, 1482–1493. [Google Scholar] [CrossRef] [PubMed]
  2. Hanano, A.; Shaban, M.; Almousally, I. Biochemical, molecular and transcriptional highlights of the biosynthesis of an effective biosurfactant produced by Bacillus safensis PHA3, a petroleum-dwelling bacteria. Front. Microbiol. 2017, 8, 77. [Google Scholar] [CrossRef] [PubMed] [Green Version]
  3. Santos, D.K.F.; Rufino, R.D.; Luna, J.M.; Santos, V.A.; Sarubbo, L.A. Biosurfactants: Multifunctional biomolecules of the 21st century. Inter. J. Mol. Sci. 2016, 17, 401. [Google Scholar] [CrossRef] [PubMed] [Green Version]
  4. Khopade, A.; Ren, B.; Liu, X.Y.; Mahadik, K.; Zhang, L.; Kokare, C. Production and characterization of biosurfactant from marine Streptomyces species B3. J. Colloid Interf. Sci. 2012, 367, 311–318. [Google Scholar] [CrossRef]
  5. Akbari, S.; Abdurahman, N.H.; Yunus, R.M.; Fayaz, F.; Alara, O.R. Biosurfactants—A new frontier for social and environmental safety: A mini review. Biotechnol. Res. Innov. 2018, 2, 81–90. [Google Scholar] [CrossRef]
  6. Silva, A.C.S.D.; Santos, P.N.D.; Andrade, R.F.S.; Campos Takaki, G.M. Biosurfactant production by fungi as a sustainable alternative. Arq. Instituto Biol. 2018, 85. [Google Scholar] [CrossRef] [Green Version]
  7. Sil, J.; Dandapat, P.; Das, S. Health care applications of different biosurfactants: Review. Int. J. Sci. Res. 2017, 6, 41–50. [Google Scholar]
  8. Khopade, A.; Biao, R.; Liu, X.; Mahadik, K.; Zhang, L.; Kokare, C. Production and stability studies of the biosurfactant isolated from marine Nocardiopsis sp. B4. Desalination 2012, 285, 198–204. [Google Scholar] [CrossRef]
  9. Xu, M.; Fu, X.; Gao, Y.; Duan, L.; Xu, C.; Sun, W.; Li, Y.; Meng, X.; Xiao, X. Characterization of a biosurfactant-producing bacteria isolated from Marine environment: Surface activity, chemical characterization and biodegradation. J. Environ. Chem. Eng. 2020, 8, 104277. [Google Scholar] [CrossRef]
  10. Usman, M.M.; Dadrasnia, A.; Lim, K.T.; Mahmud, A.F.; Ismail, S. Application of biosurfactants in environmental biotechnology; remediation of oil and heavy metal. AIMS Bioeng. 2016, 3, 289–304. [Google Scholar] [CrossRef]
  11. Cerrone, F.; Radivojevic, J.; Nikodinovic Runic, J.; Walsh, M.; Kenny, S.T.; Babu, R.; O’Connor, K.E. Novel sodium alkyl-1, 3-disulfates, anionic biosurfactants produced from microbial polyesters. Coll. Surf. B Biointerfaces 2019, 182, 110333. [Google Scholar] [CrossRef]
  12. Chaprao, M.J.; Rita De Cassia, F.; Rufino, R.D.; Luna, J.M.; Santos, V.A.; Sarubbo, L.A. Production of a biosurfactant from Bacillus methylotrophicus UCP1616 for use in the bioremediation of oil-contaminated environments. Ecotoxicology 2018, 27, 1310–1322. [Google Scholar] [CrossRef]
  13. Akyol, C.; Ince, O.; Bozan, M.; Ozbayram, E.G.; Ince, B. Biological pretreatment with Trametes versicolor to enhance methane production from lignocellulosic biomass: A metagenomic approach. Ind. Crops Prod. 2019, 140, 111659. [Google Scholar] [CrossRef]
  14. Walter, V.; Syldatk, C.; Hausmann, R. Screening concepts for the isolation of biosurfactant producing microorganisms. Adv. Exp. Med. Biol. 2010, 672, 1–13. [Google Scholar]
  15. Wattanaphon, H.T.; Kerdsin, A.; Thammacharoen, C.; Sangvanich, P.; Vangnai, A.S. A Biosurfactant from Burkholderiacenocepacia BSP3 and its enhancment of pesticide solubilization, Thailand. J. Appl. Microbiol. 2008, 105, 416–423. [Google Scholar] [CrossRef]
  16. Youssef, N.H.; Duncan, K.E.; Nagle, D.P.; Savage, K.N.; Knapp, R.M.; McInerney, M.J. Comparison of methods to detect biosurfactant production by diverse microorganisms. J. Microbiolog. Methods 2004, 56, 339–347. [Google Scholar] [CrossRef]
  17. Perfumo, A.; Banat, I.M.; Marchant, R. Going green and cold: Biosurfactants from low-temperature environments to biotechnology applications. Trends Biotechnol. 2018, 36, 277–289. [Google Scholar] [CrossRef] [Green Version]
  18. Maneerat, S.; Phetrong, K. Isolation of biosurfactant-producing marine bacteria and characteristics of selected biosurfactant. Songklanakarin J. Sci. Technol. 2007, 29, 781–791. [Google Scholar]
  19. Thaniyavarn, J.; Roongsawang, N.; Kameyama, T.; Haruki, M.; Imanaka, T.; Morikawa, M.; Kanaya, S. Production and characterization of biosurfactants from Bacillus licheniformis F2. Biosci. Biotechnol. Biochem. 2003, 67, 1239–1244. [Google Scholar] [CrossRef]
  20. Satpute, S.K.; Bhawsar, B.D.; Dhakephalkar, P.K.; Chopade, B.A. Assessment of different screening methods for selecting biosurfactant producing marine bacteria. Indian J. Geo-Mar. Sci. 2008, 37, 243–250. [Google Scholar]
  21. Cappuccino, J.G.; Sherman, N. Microbiology-a Laboratory Manual; Harlow: Essex, UK, 1999. [Google Scholar]
  22. Barakat, K.M.; Hassan, S.W.; Darwesh, O.M. Biosurfactant production by haloalkaliphilic Bacillus strains isolated from Red Sea, Egypt. Egypt J. Aquat. Res. 2017, 43, 205–211. [Google Scholar] [CrossRef]
  23. Kumar, S.; Stecher, G.; Tamura, K. MEGA7: Molecular evolutionary genetics analysis version 7.0 for bigger datasets. Mol. Biol. Evol. 2016, 33, 1870–1874. [Google Scholar] [CrossRef] [PubMed] [Green Version]
  24. Aktas, N.; Boyacı, I.H.; Mutlu, M.; Tanyolac, A. Optimization of lactose utilization in deproteinated whey by Kluyveromycesmarxianus using response surface methodology (RSM). Bioresour. Technol. 2006, 97, 2252–2259. [Google Scholar] [CrossRef]
  25. Najafi, A.R.; Rahimpour, M.R.; Jahanmiri, A.H.; Roostaazad, R.; Arabian, D.; Soleimani, M.; Jamshidnejad, Z. Interactive optimization of biosurfactant production by Paenibacillus alvei ARN63 isolated from an Iranian oil well. Colloids Surf. B Biointerfaces 2011, 82, 33–39. [Google Scholar] [CrossRef] [PubMed]
  26. Yadav, A.K.; Manna, S.; Pandiyan, K.; Singh, A.; Kumar, M.; Chakdar, H.; Kashyap, P.L.; Srivastava, A.K. Isolation and characterization of biosurfactant producing Bacillus sp. from diesel fuel-contaminated site. Microbiology 2016, 85, 56–62. [Google Scholar] [CrossRef]
  27. Wang, W.L.; Xu, S.Y.; Ren, Z.G.; Tao, L.; Jiang, J.W.; Zheng, S.S. Application of metagenomics in the human gut microbiome. World J. Gastroenterol. WJG 2015, 21, 803. [Google Scholar] [CrossRef]
  28. Tang, J.; Bu, Y.; Zhang, X.X.; Huang, K.; He, X.; Ye, L.; Shan, Z.; Ren, H. Metagenomic analysis of bacterial community composition and antibiotic resistance genes in a wastewater treatment plant and its receiving surface water. Ecotoxocol. Environ. Saf. 2016, 132, 260–269. [Google Scholar] [CrossRef]
  29. Klindworth, A.; Pruesse, E.; Schweer, T.; Peplies, J.; Quast, C.; Horn, M.; Glockner, F.O. Evaluation of general 16S ribosomal RNA gene PCR primers for classical and next-generation sequencing-based diversity studies. Nucleic Acids Res. 2013, 41, 1. [Google Scholar] [CrossRef]
  30. Das, P.; Mukherjee, S.; Sen, R. Antimicrobial potential of a lipopeptide biosurfactant derived from a marine Bacillus circulans. J. Appl. Microbiol. 2008, 104, 1675–1684. [Google Scholar] [CrossRef]
  31. Mizumoto, S.; Shoda, M. Medium optimization of antifungal lipopeptide, iturin A, production by Bacillus subtilis in solid-state fermentation by response surface methodology. Appl. Microbiol. Biotechnol. 2007, 76, 101–108. [Google Scholar] [CrossRef]
  32. Wei, Q.F.; Mather, R.R.; Fotheringham, A.F. Oil removal from used sorbents using a biosurfactant. Bioresour. Technol. 2005, 96, 331–334. [Google Scholar] [CrossRef]
  33. Santos, A.P.P.; Silva, M.D.S.; Costa, E.V.L.; Rufino, R.D.; Santos, V.A.; Ramos, C.S.; Sarubbo, L.A.; Porto, A.L.F. Production and characterization of a biosurfactant produced by Streptomyces sp. DPUA 1559 isolated from lichens of the Amazon region. Brazil. Braz. J. Med. Biol. Res. 2018, 51. [Google Scholar] [CrossRef]
  34. Moshtagh, B.; Hawboldt, K.; Zhang, B. Optimization of biosurfactant production by Bacillus subtilis N3-1P using the brewery waste as the carbon source. Environ. Technol. 2018, 40, 1–10. [Google Scholar] [CrossRef]
  35. Deepali, K.; Sneha, P.; Sucheta, P. Larvicidal activity of rhamnolipid biosurfactant produced by Stenotrophomonas maltophilia. Int. J. Sci. Eng. Res. 2014, 5, 60–63. [Google Scholar]
  36. Naughton, P.J.; Marchant, R.; Naughton, V.; Banat, I.M. Microbial Biosurfactants: Current trends and applications in Agricultural and Biomedical industries. J. Appl. Microbiol. 2019, 127, 12–28. [Google Scholar] [CrossRef] [Green Version]
  37. Mulligan, C.N.; Gibbs, B.F. Types, production and applications of biosurfactants. Proc. Indian Nat. Sci. Acad. 2004, 70, 31–55. [Google Scholar]
  38. Chebbi, A.; Hentati, D.; Zaghden, H.; Baccar, N.; Rezgui, F.; Chalbi, M.; Sayadi, S.; Chamkha, M. Polycyclic aromatic hydrocarbon degradation and biosurfactant production by a newly isolated Pseudomonas sp. strain from used motor oil-contaminated soil. Int. Biodeterior. Biodegrad. 2017, 122, 128–140. [Google Scholar] [CrossRef]
  39. Zou, C.; Wang, M.; Xing, Y.; Lan, G.; Ge, T.; Yan, X.; Gu, T. Characterization and optimization of biosurfactants produced by Acinetobacter baylyi ZJ2 isolated from crude oil-contaminated soil sample toward microbial enhanced oil recovery applications. Biochem. Eng. J. 2014, 90, 49–58. [Google Scholar] [CrossRef]
  40. El-Sheshtawy, H.S.; Aiad, I.; Osman, M.E.; Abo ELnasr, A.A.; Kobisy, A.S. Production of biosurfactants by Bacillus licheniformis and Candida albicans for application in microbial enhanced oil recovery. Egypt J. Pet. 2016, 25, 293–298. [Google Scholar] [CrossRef] [Green Version]
  41. Singh, P.; Tiwary, B.N. Isolation and characterization of glycolipid biosurfactant produced by a Pseudomonas otitidis strain isolated from Chirimiri coal mines, India. Bioresour. Bioprocess. 2016, 3, 42. [Google Scholar] [CrossRef] [Green Version]
  42. Ramani, K.; Jain, S.C.; Mandal, A.B.; Sekaran, G. Microbial induced lipoprotein biosurfactant from slaughterhouse lipid waste and its application to the removal of metal ions from aqueous solution. Colloids Surf. B Biointerfaces 2012, 97, 254–263. [Google Scholar] [CrossRef] [PubMed]
  43. Ohadi, M.; Dehghannoudeh, G.; Shakibaie, M.; Banat, I.M.; Pournamdari, M.; Forootanfar, H. Isolation, characterization, and optimization of biosurfactant production by an oil-degrading Acinetobacter junii B6 isolated from an Iranian oil excavation site. Biocatal. Agric. Biotechnol. 2017, 12, 1–9. [Google Scholar] [CrossRef]
  44. Jain, R.M.; Mody, K.; Joshi, N.; Mishra, A.; Jha, B. Production and structural characterization of biosurfactant produced by an alkaliphilic bacterium, Klebsiella sp.: Evaluation of different carbon sources. Colloids Surf. B Biointerfaces 2013, 108, 199–204. [Google Scholar] [CrossRef] [PubMed]
  45. Qiao, N.; Shao, Z. Isolation and characterization of a novel biosurfactant produced by hydrocarbon-degrading bacterium Alcanivoraxdieselolei B-5. J. Appl. Microbiol. 2010, 108, 1207–1216. [Google Scholar] [CrossRef]
  46. Martins, P.C.; Martins, V.G. Biosurfactant production from industrial wastes with potential remove of insoluble paint. Int. Biodeterior. Biodegrad. 2018, 127, 10–16. [Google Scholar] [CrossRef]
  47. Rodriguez-R, L.M.; Konstantinidis, K.T. Estimating coverage in metagenomic data sets and why it matters. ISME J. 2014, 8, 2349. [Google Scholar] [CrossRef] [Green Version]
  48. Zumsteg, A.; Luster, J.; Goransson, H.; Smittenberg, R.H.; Brunner, I.; Bernasconi, S.M.; Zeyer, J.; Frey, B. Bacterial, archaeal and fungal succession in the fore field of a receding glacier. Microb. Ecol. 2012, 63, 552–564. [Google Scholar] [CrossRef] [Green Version]
  49. Fierer, N.; Jackson, J.A.; Vilgalys, R.; Jackson, R.B. Assessment of soil microbial community structure by use of taxon-specific quantitative PCR assays. Appl. Environ. Microbiol. 2005, 71, 4117–4120. [Google Scholar] [CrossRef] [Green Version]
  50. Campanaro, S.; Treu, L.; Kougias, P.G.; De Francisci, D.; Valle, G.; Angelidaki, I. Metagenomic analysis and functional characterization of the biogas microbiome using high throughput shotgun sequencing and a novel binning strategy. Biotechnol. Biofuels 2016, 9, 26. [Google Scholar] [CrossRef] [Green Version]
  51. Stolze, Y.; Zakrzewski, M.; Maus, I.; Eikmeyer, F.; Jaenicke, S.; Rottmann, N.; Siebner, C.; Puhler, A.; Schlüter, A. Comparative metagenomics of biogas-producing microbial communities from production-scale biogas plants operating under wet or dry fermentation conditions. Biotechnol. Biofuels 2015, 8, 1–18. [Google Scholar] [CrossRef] [Green Version]
  52. Sriram, M.I.; Gayathiri, S.; Gnanaselvi, U.; Jenifer, P.S.; Raj, S.M.; Gurunathan, S. Novel lipopeptide biosurfactant produced by hydrocarbon degrading and heavy metal tolerant bacterium Escherichia fergusonii KLU01 as a potential tool for bioremediation. Bioresour. Technol. 2011, 102, 9291–9295. [Google Scholar] [CrossRef]
  53. Rodrigues, L.; Banat, I.M.; Teixeira, J.; Oliveira, R. Biosurfactants: Potential applications in medicine. J. Antimicrob. Chemothe. 2006, 57, 609–618. [Google Scholar] [CrossRef]
  54. Di Rienzo, V.; Fanelli, V.; Miazzi, M.M.; Savino, V.; Pasqualone, A.; Summo, C.; Giannini, P.; Sabetta, W.; Montemurro, C. A reliable analytical procedure to discover table grape DNA adulteration in industrial wines and musts. Acta Hortic. 2016, 1188, 365–370. [Google Scholar] [CrossRef]
  55. Mani, P.; Dineshkumar, G.; Jayaseelan, T.; Deepalakshmi, K.; Ganesh Kumar, C.; Senthil Balan, S. Antimicrobial activities of a promising glycolipid biosurfactant from a novel marine Staphylococcus saprophyticus SBPS 15. 3 Biotech 2016, 6, 1–9. [Google Scholar] [CrossRef] [Green Version]
Figure 1. The neighbor-joining method used represents the predating phylogenetic tree, by 16SrRNA gene sequencing, belonging to B. safensis (YKS2).
Sustainability 14 02142 g001
Figure 2. Screening identification of biosurfactants:(a) Hemolytic activity; (b) drop-collapsing test; (c) oil spreading techniques; (d) blue agar plate.
Sustainability 14 02142 g002
Figure 3. Three-dimensional contour plots of B. safensis (YKS2) for minimum surface tension response to biosurface showing the effect of temperature, pH, carbon and nitrogen source. RSM plots were generated using the data. (A) Reduction in surface tension as a function of temperatureand pH. (B) Reduction in surface tension as a function of palm jaggery and pH. (C) Reduction in surface tension as a function of palm jaggeryand temperature.
Sustainability 14 02142 g003
Figure 4. RSM plots were generated using the data. (A) Reduction in surface tension as a function of glycerol and pH concentration. (B) Reduction in surface tension as a function of temperature and glycerol concentration. (C) Reduction in surface tension as a function of palm jaggery and glycerol concentration.
Sustainability 14 02142 g004
Figure 5. (A) Spectrometric absorption of the B. safensis (YKS2)-mediated biosurfactant at 530 nm. (B) FT-IR shows an exact value from 3296.17 to the lowest peak value at 430.84, and also outlines a vibration assignedtothe appropriate observed wavelength with a functional group, as well as the visible intensity ranges. (C) Bacterial strainwas B. safensis (YKS2); the biosurfactants produced were found in the range of 11.3–50.95 nm. (D) Graphs obtained from GC-MS, showing GC, whereas they show MS at a retention timeof 23.74 min. The molecule identified through library searching was found to be 13-Docosenamide.
Sustainability 14 02142 g005
Figure 6. (A) The sequence quality was computed using the MG-RAST-automated processing pipeline for SWC and SWT. (B) The K-mer rank abundance graph plots K-mer coverage as a function of abundance rank with the most abundant sequences at the left. (C) Domain-level distribution plot representingthe effect of the biosurfactant on wastewater. (D) The phylum-level classification of different classes of wastewater samples. (E) The ratios of different class levels of wastewater samples. (F) Rarefaction curve plot of SWC and SWT samples.
Sustainability 14 02142 g006
Figure 7. The Krona graph showing the relative abundance of sewage water in the control and treated wastewaters.
Sustainability 14 02142 g007
Figure 8. The antibacterial activity of biosurfactants against pathogenic bacteria. The antibacterial activity of the biosurfactant againstdifferent pathogenic bacteria (E. coli, S. aureus and K. pneumonia) at different concentrations (20, 40, 60, 80 and 100 µg/mL) and the control antibiotic Ciprofloxacin (the zone of inhibition values are expressed as mean ± SD and analyzed by two-way analysis of variance (ANOVA)).
Sustainability 14 02142 g008
Table 1. Analysis of variance for BS (g/L) (Coded units).
SourceSum of SquaresdfMean SquareF Valuep-Value Prob > F
Model137.7693149.8406627.4233610.0001significant
A-Glycerol0.05810210.0581020.043830.8372
B-Plam Jaggery4.58679714.5867973.4600770.0840
C-Temperature2.60866912.6086691.9678640.1825
D-pH0.213610.21360.161130.6942
AB0.136910.13690.1032710.7527
AC0.20025610.2002560.1510640.7034
AD0.6410.640.4827880.4985
BC0.3610.360.2715680.6104
BD9.0631119.063116.836810.0204
CD0.0110.010.0075440.9320
A262.98868162.9886847.51587<0.0001
B250.33624150.3362437.97144<0.0001
C246.97904146.9790435.43891<0.0001
D222.45774122.4577416.941130.0010
Residual18.55888141.3256340.903690.1363
Lack of Fit18.55888101.8558880.95230.1769Not significant
Pure Error040
Cor Total156.328228
Table 2. FT-IR functional group analysis for (B. safensis YKS2)derived biosurfactant.
Vibrational AssignmentObserved Wave Number (cm−1)Functional GroupVisible Intensity
O–Hstretch3296.17alkanesmmall medium peak
C–H stretch3070.89amidesmall medium peak
O–Hstretch2982.99carboxylic acidsmedium peak
–N≡C stretch2137.59nitrogensmall medium peak
C=O stretch1729.22carboxylic acidsvery sharp peak
Secondary amide C=O stretch1653.83amidessharp peak
C–O stretch1287.24Esterssharp peak
C–O stretch1074.55alcohol and phenolsvery sharp peak
N–H stretch745.83amidessharp peak
N–H stretch650.71amideswide peak
Table 3. Deduced structure of the purified lipopeptide biosurfactant from B. safensis strain YKS2.
S. No.Retention TimeMolecular FormulaMolecular WeightCompound NameStructure
1.12.313C14H25F3O22823-Trifluoroacetoxydodecane Sustainability 14 02142 i001
2.22.949C10H14O2166Phenol, 3-Methoxy-2,4,6-Trime Sustainability 14 02142 i002
3.23.517C17H36240Heptadecane Sustainability 14 02142 i003
4.24.146C13H13N3O227Hydrazinecarboxamide, N,N- Sustainability 14 02142 i004
5.25.935C14H281961-Dodecene, 2-Ethyl- Sustainability 14 02142 i005
6.26.642C14H28O2228Tetradecanoic Acid Sustainability 14 02142 i006
7.30.077C7H11Cl1301-(3-Chloropropyl)-2-Methyle Sustainability 14 02142 i007
8.30.331C9H15Cl158(4Z)-5-Chloro-3,4-dimethyl-2,4-heptad Sustainability 14 02142 i008
9.36.464C14H16N2O2244Pyrrolo[1,2-a]pyrazine-1,4-dione, hexah Sustainability 14 02142 i009
Table 4. Physico-chemical parameter wastewater analysis.
ParameterControlTreated
pH8.97.1
Electrical Conductivity (mMho/cm)940.00241.66
Turbidity (mg/L)22.3516.39
Total Suspended Solids (mg/L)968.33289.16
Total dissolved solids (mg/L)657.35159.38
Dissolved Oxygen (mg/L)243.05197.39
Chemical Oxygen Demand (mg/L)856.15223.18
Biological Oxygen Demand (mg/L)317.46148.26
Table 5. Sequence analysis statistics of the control (SWC) and treated (SET) wastewater samples.
S. No.ControlTreated
Analysis StatisticsTotal Number of SpeciesAnalysis StatisticsTotal Number of Species
1Upload: bp count41,951,574 bpUpload: bp count25,454,968 bp
2Upload: Sequences count139,374Upload: Sequences count84,568
3Upload: Mean sequences301 ± 0 bpUpload: Mean sequences301 ± 0 bp
4Upload: Mean GC percent55 ± 3%Upload: Mean GC percent56 ± 2%
5Artificial Duplicate Reads: Sequence count126,445Artificial Duplicate Reads: Sequence count78,076
6Post QC: bp count3,809,704 bpPost QC: bp count1,943,367 bp
7Post QC: Sequences count12.818Post QC: Sequences count6.483
8Post QC: Mean sequences297 ± 11 bpPost QC: Mean sequences300 ± 14 bp
9Post QC: Mean GC percent55 ± 3%Post QC: Mean GC percent55 ± 3%
10Processed: Predicted Protein Features156Processed: Predicted Protein Features62
11Processed: Predicted rRNA Features49.550Processed: Predicted rRNA Features22.905
12Alignment:Identifiedprotein Features22Alignment:Identifiedprotein Features6
13Alignment: Identified rRNA Feature44.900Alignment: Identified rRNA Feature21.905
14Annotation: Identified functional CategoriesUndefinedAnnotation: Identified functional CategoriesUndefined
Table 6. The antibacterial activity of the B. safensis (YKS2)-derived biosurfactant against the pathogen bacteria.
Strain Name Standard Antibiotic (Ciprofloxacin)Concentrations in µg/mL
20406080100
E. coli18.3 ± 0.42.6 ± 3.713.6 ± 0.413.7 ± 0.416.3 ± 0.519 ± 0.8
S. aureus19 ± 0.85.3 ± 3.910 ± 0.813.3 ± 0.816.2 ± 0.820 ± 0.8
K. pneumonia20.6 ± 0.410 ± 0.812.3 ± 0.413.6 ± 0.417 ± 0.821.6 ± 0.5
Publisher’s Note: MDPI stays neutral with regard to jurisdictional claims in published maps and institutional affiliations.

