1. Introduction
Biobased materials are increasingly taken into consideration as a way to achieve a circular economy, since they come from renewable resources [
1]. However, their environmental impacts should be carefully compared with their non-renewable counterparts [
2]. The most studied biobased product category, from this point of view, is that of bio based fuels [
3]. The comparison made, in this case, is between the impacts from fossil fuels (from extraction to burning) and that from biofuels (from well to wheel). The main discriminant in the comparison is land use change (LUC): the production of biofuels requires land dedicated to the cultivation of the source crops and, since most of the agricultural land is already used for food production, this may result in deforestation and expansion of agriculture on natural areas [
4].
The most difficult aspect of LUC to be taken into account is related to the indirect LUC (ILUC, [
5,
6]). LUC effects of biofuels production can be reduced by natural land protection and the requirement to cultivate source crops in specific areas. However, the market demand for either source crops (if not produced in the quantity required by a certain nation to meet its production of biofuels) or food crops (displaced to make space for biofuel crop production) can easily shift to other countries in the modern global economy, resulting in a cascade of LUC, with the risk of eventually encroaching on natural land somewhere else in the world. Since it is difficult to observe directly, ILUC for biofuel production has been mainly estimated by modeling [
7]; statistical evidence of ILUC a posteriori, however, has been collected [
8] mostly by using remote sensing methods to assess the changes in crop cultivation worldwide [
9,
10,
11].
Biobased materials other than biofuels have the same need to use land for the production of the source feedstocks (e.g., maize production for bioplastics, or wood for construction and furniture) and are thus prone to result in ILUC [
2,
12]. Whenever the demand for a certain source feedstock increases, then the demand for land on which to grow that feedstock increases as well, possibly leading to LUC and increasing the risk of leakage to ILUC effects. The proper inclusion of biomaterials in the strategy for a circular and biobased economy needs, therefore, to assess the risk of ILUC effects related to bio based materials, just as is already done for biofuels [
13].
ILUC is often the tipping point between whether biofuels are deemed less impactful than fossil fuels or not [
14]; however, due to the large uncertainties involved in ILUC modeling, it is hard to draw a conclusion useful for biofuel policies yet. Recent studies reviewing ILUC modeling work show that the different models not only produce very different results, but also have different assumptions and setup, so that estimated ILUC effects vary widely across approaches, making it difficult to use them for policymaking, as further explained in
Section 2.1 [
15,
16,
17,
18].
Mitigation measures to reduce ILUC effects, hence, cannot be developed just based on modeling work, but should be complemented by certification activities [
13,
19]. Assessments conducted by [
6,
20] and several others have flagged the high risks for increasing pressure on natural areas as a consequence of a policy-induced additional demand for biofuels and the respective areas for crop production (see also [
21,
22]). Consequently, policymakers started working on mitigation measures and introduced actions, which aimed to avoid or reduce negative impacts, associated with biofuels being produced and used as a consequence of, for example, European Union (EU) biofuel policies. The EU Directive 2009/28/EC (RED), thus, focused specifically on the definition of sustainability criteria in two ways: (1) by including requirements and thresholds for the greenhouse gas (GHG) mitigation potential of a biofuel; (2) by defining areas not suitable for the production of biofuel feedstock [
23]. While these measures do in general address the risk of direct LUC scenarios, they are, alone, not appropriate to tackle the risk of ILUC effects resulting from an increasing use of biofuels. Several authors have conducted estimations and assessments related to the GHG emission implications from ILUC scenarios resulting from EU biofuel targets: 10% of renewable energies in the EU transport system in 2020 as in the EU RED; and 14% until 2030 as defined in the recast of the EU Renewable Energy Directive RED [
23,
24].
With the 2015/1513 amendment of the EU RED directive [
25] and the revised Renewable Energy Directive 2018/2001/EU (RED II; [
24]) for the timeframe of 2021 to 2030, the European Commission (EC) tried to address these limitations. The introduction of a cap for biofuels from conventional agricultural crops was aiming to limit the overall additional demand for crops produced on agricultural land. Secondly, the commission introduced a risk-based approach, which shall allow for a differentiation of the ILUC risks of biofuels. The definition of “risk” used in the directive is not the same as in specific disciplines (e.g., hydrological risk, economical risk, medical dose-response risk); rather it is a loose definition coming from the very large uncertainties in modeling that make it impossible to calculate precise figures for ILUC. In this sense, a specific sub-target is aiming at the promotion of advanced fuels, produced mainly from specific waste and residue categories (defined in Annex IX, Part A of the Directive 2018/2001). Furthermore, the RED II differentiates between low- and high-ILUC-risk biofuels, as further explained in
Section 2.2.
There is still, however, the lack of a level playing field with either; a scientific assessment with large uncertainties and complex modeling on the one hand, and simple certification approaches with very narrow scope and flexibility on the other hand. The latter concerns the development of practices that can help to reduce the individual ILUC risks of producers of biobased products by increasing the efficiency of resource use (i.e., land and biomass resources). However, the actual sustainability assessment of these practices at general and specific levels and the definition of clear guidelines for the verification of these practices is an open question. The definition of clear guidelines for the verification of practices that reduce the risk of ILUC is therefore necessary [
26]. The robust certification of biobased products with low ILUC risk must provide evidence that additional biobased raw materials are produced due to the application of additionality practices [
27,
28]. Such certification should interact with, and build upon, the scientific assessment and the models estimate: there is a need, hence, to create a bridge between ILUC modeling and additionality practices.
In similar situations where complexity of the issue at hand (e.g., sustainability, soil carbon sequestration) results in large modeling uncertainties, tools obtained from the simplification of scientifically based models have been successful, especially in comparing different practices between them [
28,
29]. The main problems are that: the existing ILUC models do not take additionality practices explicitly into account [
13], complex ILUC models evaluate global ILUC effects rather than the risk of ILUC associated with locally applied additionality practices, and that such complex models cannot be used by policymakers and producers to assess their specific conditions [
15,
16,
17].
Here, we propose a tool for the assessment of the reduction in ILUC risk by additionality practices, by (a) Simplifying a system dynamic model for the estimate of ILUC risk; (b) Including explicitly, in the simplified model, different low-ILUC-risk practices which can be certified in a coherent and robust scheme; (c) Downscaling the simplified model in order to assess the ILUC risk related with the conditions of a single producer in the biobased value chain; (d) Implementing it in a simple, user-friendly, and transparent way. Thus, our objective is to show a methodology to bridge the existing gap between ILUC models, with their large uncertainties, and ILUC policies, with their need for ILUC assessment and auditing. In
Section 2, we first give some relevant background on ILUC risk modeling, available certification approaches to evaluate low-ILUC-risk measures, and how to merge the two. Then, in
Section 3 we explain how the ILUC risk model was simplified into a tool integrating methodologies for the robust certification of low-ILUC-risk biomass. In
Section 4, we test the tool on example studies to show how to apply both the tool and the certification methods to assess the direct production of low-ILUC-risk biomass. In
Section 5, we discuss the application of the methodology and the limitations of the approach.
3. Methods
3.1. The SydILUC Model
The method proposed here will be tested on the SydILUC model, a model developed directly for the STAR-ProBio project to deliver ILUC estimates and incorporate explicitly the additionality measures identified in previous stages of the project, and described in [
51]. However, the authors want to stress that the methodology described here to transform the ILUC estimates obtained from an ILUC model into a user-friendly tool could be used for other ILUC models as well. The focus here is on the methodology used to link explicitly: (a) the model ILUC estimate with the risk approach as proposed in the EU REDII directive [
27]; (b) the additionality measures identified in [
51], which are verifiable actions useful to reduce the ILUC risk of a feedstock.
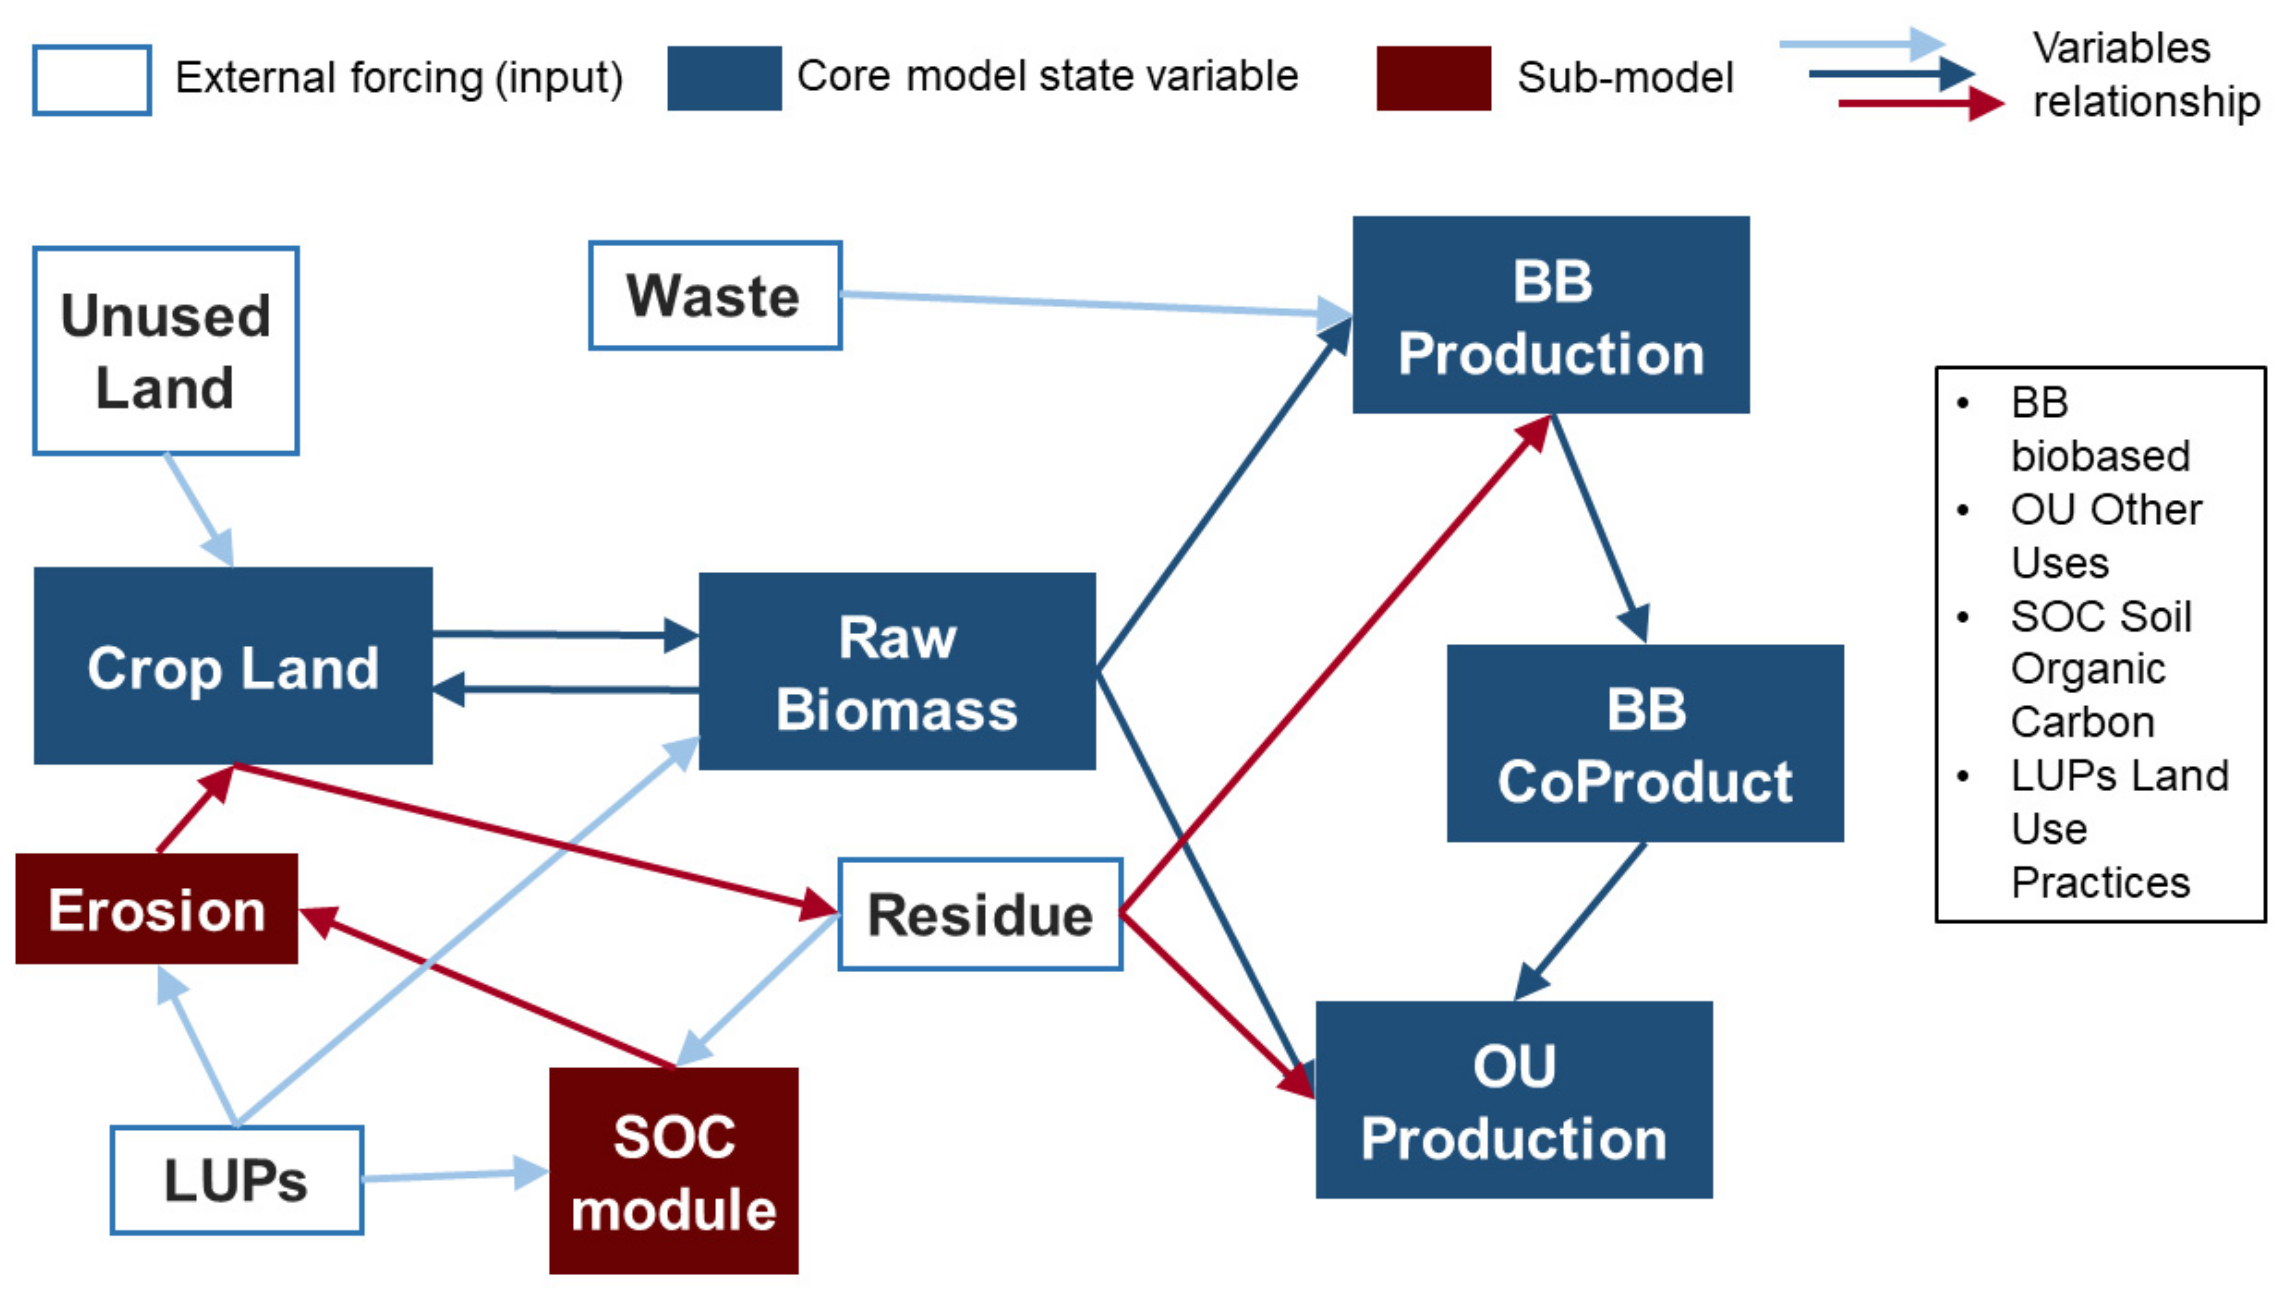
The System Dynamics Indirect Land Use Change (SydILUC) model is a dynamic causal-descriptive model that estimates the risk of future global land demand based on projections of biobased material production (
Figure 1). The model was developed within the STAR-ProBio EU H2020 project [
51], to tackle the limitations of existing models highlighted in
Section 2.1. The model evaluates policies aimed at increasing biobased material production, by estimating the risk any of these policies has to create ILUC, in line with the RED II approach. The ILUC risk calculated accounts for the effects of the deployment of additionality practices aimed at reducing such risk (
Section 2.2.2). It works on a global scale to decrease the uncertainty related to ILUC calculation due to allocation (i.e., to determine where the ILUC will take place), trade efficiencies (the demand for land will eventually be transferred to another country), and country-specific policies. The model has yearly time steps, to reduce the uncertainty related to short-term market shocks. Since it is a dynamic model, it explicitly accounts for feedback loops, delay effects, and time-dependent exogenous variables. The model takes into consideration other relevant aspects influencing LUC, such as erosion, changes in soil carbon stock, the effect of extending the crop production area on less suitable land (the extensive margin), market effects on crop yields (the intensive margin), and changes in agricultural yields as reported in the literature. An important parameter introduced in the SydILUC model, aimed at the inclusion of the additionality practices, is the crop yield gap: the difference between the actual crop yield and the maximum achievable crop yield [
52,
53,
54,
55].
The model was implemented in a system dynamic framework and was later calibrated and validated using FAOSTAT global data. The intermediate output of the model is the calculation of the crop land demand increase due to an increase in biobased material production. When the model is run on a probability distribution of the input variables and constants, the output is a probability distribution of increase in crop land demand. Since global demand for land will eventually result in a land use change somewhere in the world, the probability distribution of the intermediate output can be converted into risk of ILUC (see
Section 3.3). Projections of ILUC risk require the model to run multiple times in a Monte Carlo framework; the results are then given a relative risk class, following the approach employed in the RED II.
3.2. Approaches for Implementation and Verification of Additionality Practices
The objective of this section is to present options for how the additionality practices discussed in
Section 2.2 can be implemented and verified in the certification process of biobased products. With this objective, we do not provide recommendations regarding the excellence of specific agricultural practices, but discuss potential additionality practices that are under consideration in recent publications.
3.2.1. Increased Agricultural Crop Yield
The main rationale behind the yield increase approach is to improve the land use efficiency on existing cropland. The approach is generally based on defining a baseline situation and an above-baseline situation [
26]. The baseline can be determined by documented historical yield data from a farm or group of farms [
28] or by combining data from a farm with data from similar producers within a given region (dynamic baseline yield), which we tested in the examples in
Section 4 [
50,
56]. Yield variability is a difficult issue for the appropriate assessment of the yield increases under consideration. There are two possible recently presented approaches to address this problem. The first approach proposes a balanced combination of crediting a low-ILUC-risk project by considering the expected yield increase as a result of the successful implementation of a yield improvement plan and the actual yields achieved [
27]. The other approach compares a dynamic baseline yield with a trendline yield that considers realized yields in all years since a producer was certified. The trendline yields move each year with respect to the actual yield achieved [
57].
3.2.2. Biomass Cultivation on Unused Land
Biomass cultivation on formerly unused land pursues the aim of producing additional feedstocks on currently unused land in compliance with the sustainability criteria set out in the RED II. The identification of unused land is based on a clear definition and several criteria that a plot of land must meet [
7]. These criteria include both regulatory criteria, e.g., legal claims, and land cover and use criteria, e.g., low-carbon stocks [
28]. In addition, the investigation must verify that the land has not been used for provisioning services in the past [
56] and that other ecosystem services, especially potential damage to wildlife, are avoided [
27]. Further, activities of low-intensity land users in particular must be taken into account [
27,
56]. Especially for abandoned land, [
27] suggests that the considered land has to meet at least one of three conditions to demonstrate additional biomass production (compare
Section 2.2.2): (1) a reduction in cultivated land has been observed in the region in the previous 5 years; (2) land with favorable conditions for agriculture is available; (3) the land has been abandoned due to soil degradation, and the cultivation of degraded land is not common practice in the region [
27]. Following the successful identification of a suitable plot of land, the low-ILUC-risk biomass can be determined based on the actual yield and the size of the previously unused area [
50,
56].
3.2.3. Improved Production Chain Integration of Co-Products, Waste, and Residues
Improvements in the production chain of biobased products include increasing the number of materials that are already available but are actually not or inefficiently used as feedstock for biobased products. On the one hand, the increased amount of feedstock can be used directly for the production of biobased materials. On the other hand, this process could provide additional feedstock for other land-based production systems, such as livestock feeding, or releasing arable land for the cultivation of feedstock used in the production of biobased materials [
7]. A multi-stage approach could be used to certify the use of waste and/or residues for the production of biobased materials. This approach would start with an assessment of whether a particular material is a waste or residue in a particular region, leading to the definition of a positive list that includes a specific feedstock-region combination [
50]. Another possible approach is to verify whether a waste or residue meets certain criteria in order to be considered a low-ILUC-risk feedstock. This latter approach is based on calculating an average conversion rate as the result of a simple input (waste or residue)–output (biobased product) analysis [
56]. For bioethanol with a low ILUC risk, a specific approach could be applied that takes into account co-products from ethanol production in sugar mills as feed for cattle production [
50].
3.2.4. Other Potential Approaches
Two other potential approaches for additionality practices are the reduction of biomass losses in the production chain of biobased products and the introduction of efficiency improvements in livestock systems. Both of these approaches are currently only available for assessing low-ILUC-risk biomass at the regional level and are therefore not directly applicable in sustainability certification [
7]. The main feature of biomass loss reduction is to increase efficiency in the production chain of biobased products to reduce significant biomass losses, e.g., post-harvest losses, thus providing additional raw materials that can be directly used for the production of biobased products. Improving the efficiency of livestock production is characterized by increasing productivity per animal, e.g., milk production, or increasing the density of animals per area. This could result in less land needed for feed production, which could be used for the cultivation of feedstock for biobased products [
58].
3.3. ILUC Model Simplification into a Tool to Assess Low-ILUC-Risk Practices
The main limitation of the SydILUC model is its accessibility: even though it is much simpler than a partial or global equilibrium economic model, and more representative of the actual dynamics than a normative model, it is still too complex for direct use by a producer (of biomass, of an intermediate product, of biobased materials) or by a policy maker. Other limitations of the model are that: it requires intensive computation (due to the Monte Carlo approach), and its global scale makes it difficult to assess small-scale low-ILUC-risk practices, for example, in the case of biomass produced on former unused land. Therefore, a tool was developed as a simplification of the model, aimed at allowing single producers and policymakers to assess different possible actions to reduce the ILUC risk of their products. Moreover, this tool could be also useful to auditors who would have to assess the reduction of ILUC risk achieved by a certain producer in the biobased material value chain.
The tool was implemented in spreadsheet software with different sheets dedicated to different purposes (simple interface, auditor interface, parameters, dataset for risk estimation). The idea is that most people would be comfortable with spreadsheet software, and that a spreadsheet exposes clearly the calculations and the dataset used for the assessment of the ILUC risk. Moreover, a spreadsheet allows a different level of sophistication for different users, i.e., a simple interface for producers and policymakers to get an idea of possible ILUC risk reductions, and a more complex interface for auditors who are allowed to adjust model parameters to fit observed data and to get more accurate ILUC risk estimates for certification purposes. Comments in the spreadsheet help the user understand how the tool works, what inputs are needed, and how to read the outputs.
The tool had to be adapted, with respect to the model, to take explicitly into account the additionality practices identified, namely increased agricultural crop yield, biomass cultivation on unused land, and improved production chain integration of co-products, waste, and residues in the biobased material production. Some of the additionality practices were implicitly integrated into the SydILUC model by modifying efficiency parameters (expansion on unused land, crop yield increases), while others had to be explicitly modeled to include possible feedback loops (co-products substitution, soil erosion, use of residues instead of the main biomass). A principal component analysis was conducted to extract the aggregate components that explained up to 95% of the dataset variance; in that way, it was possible to cut the number of inputs to the model from 12 to 5, reducing the dimensionality of the problem [
59].
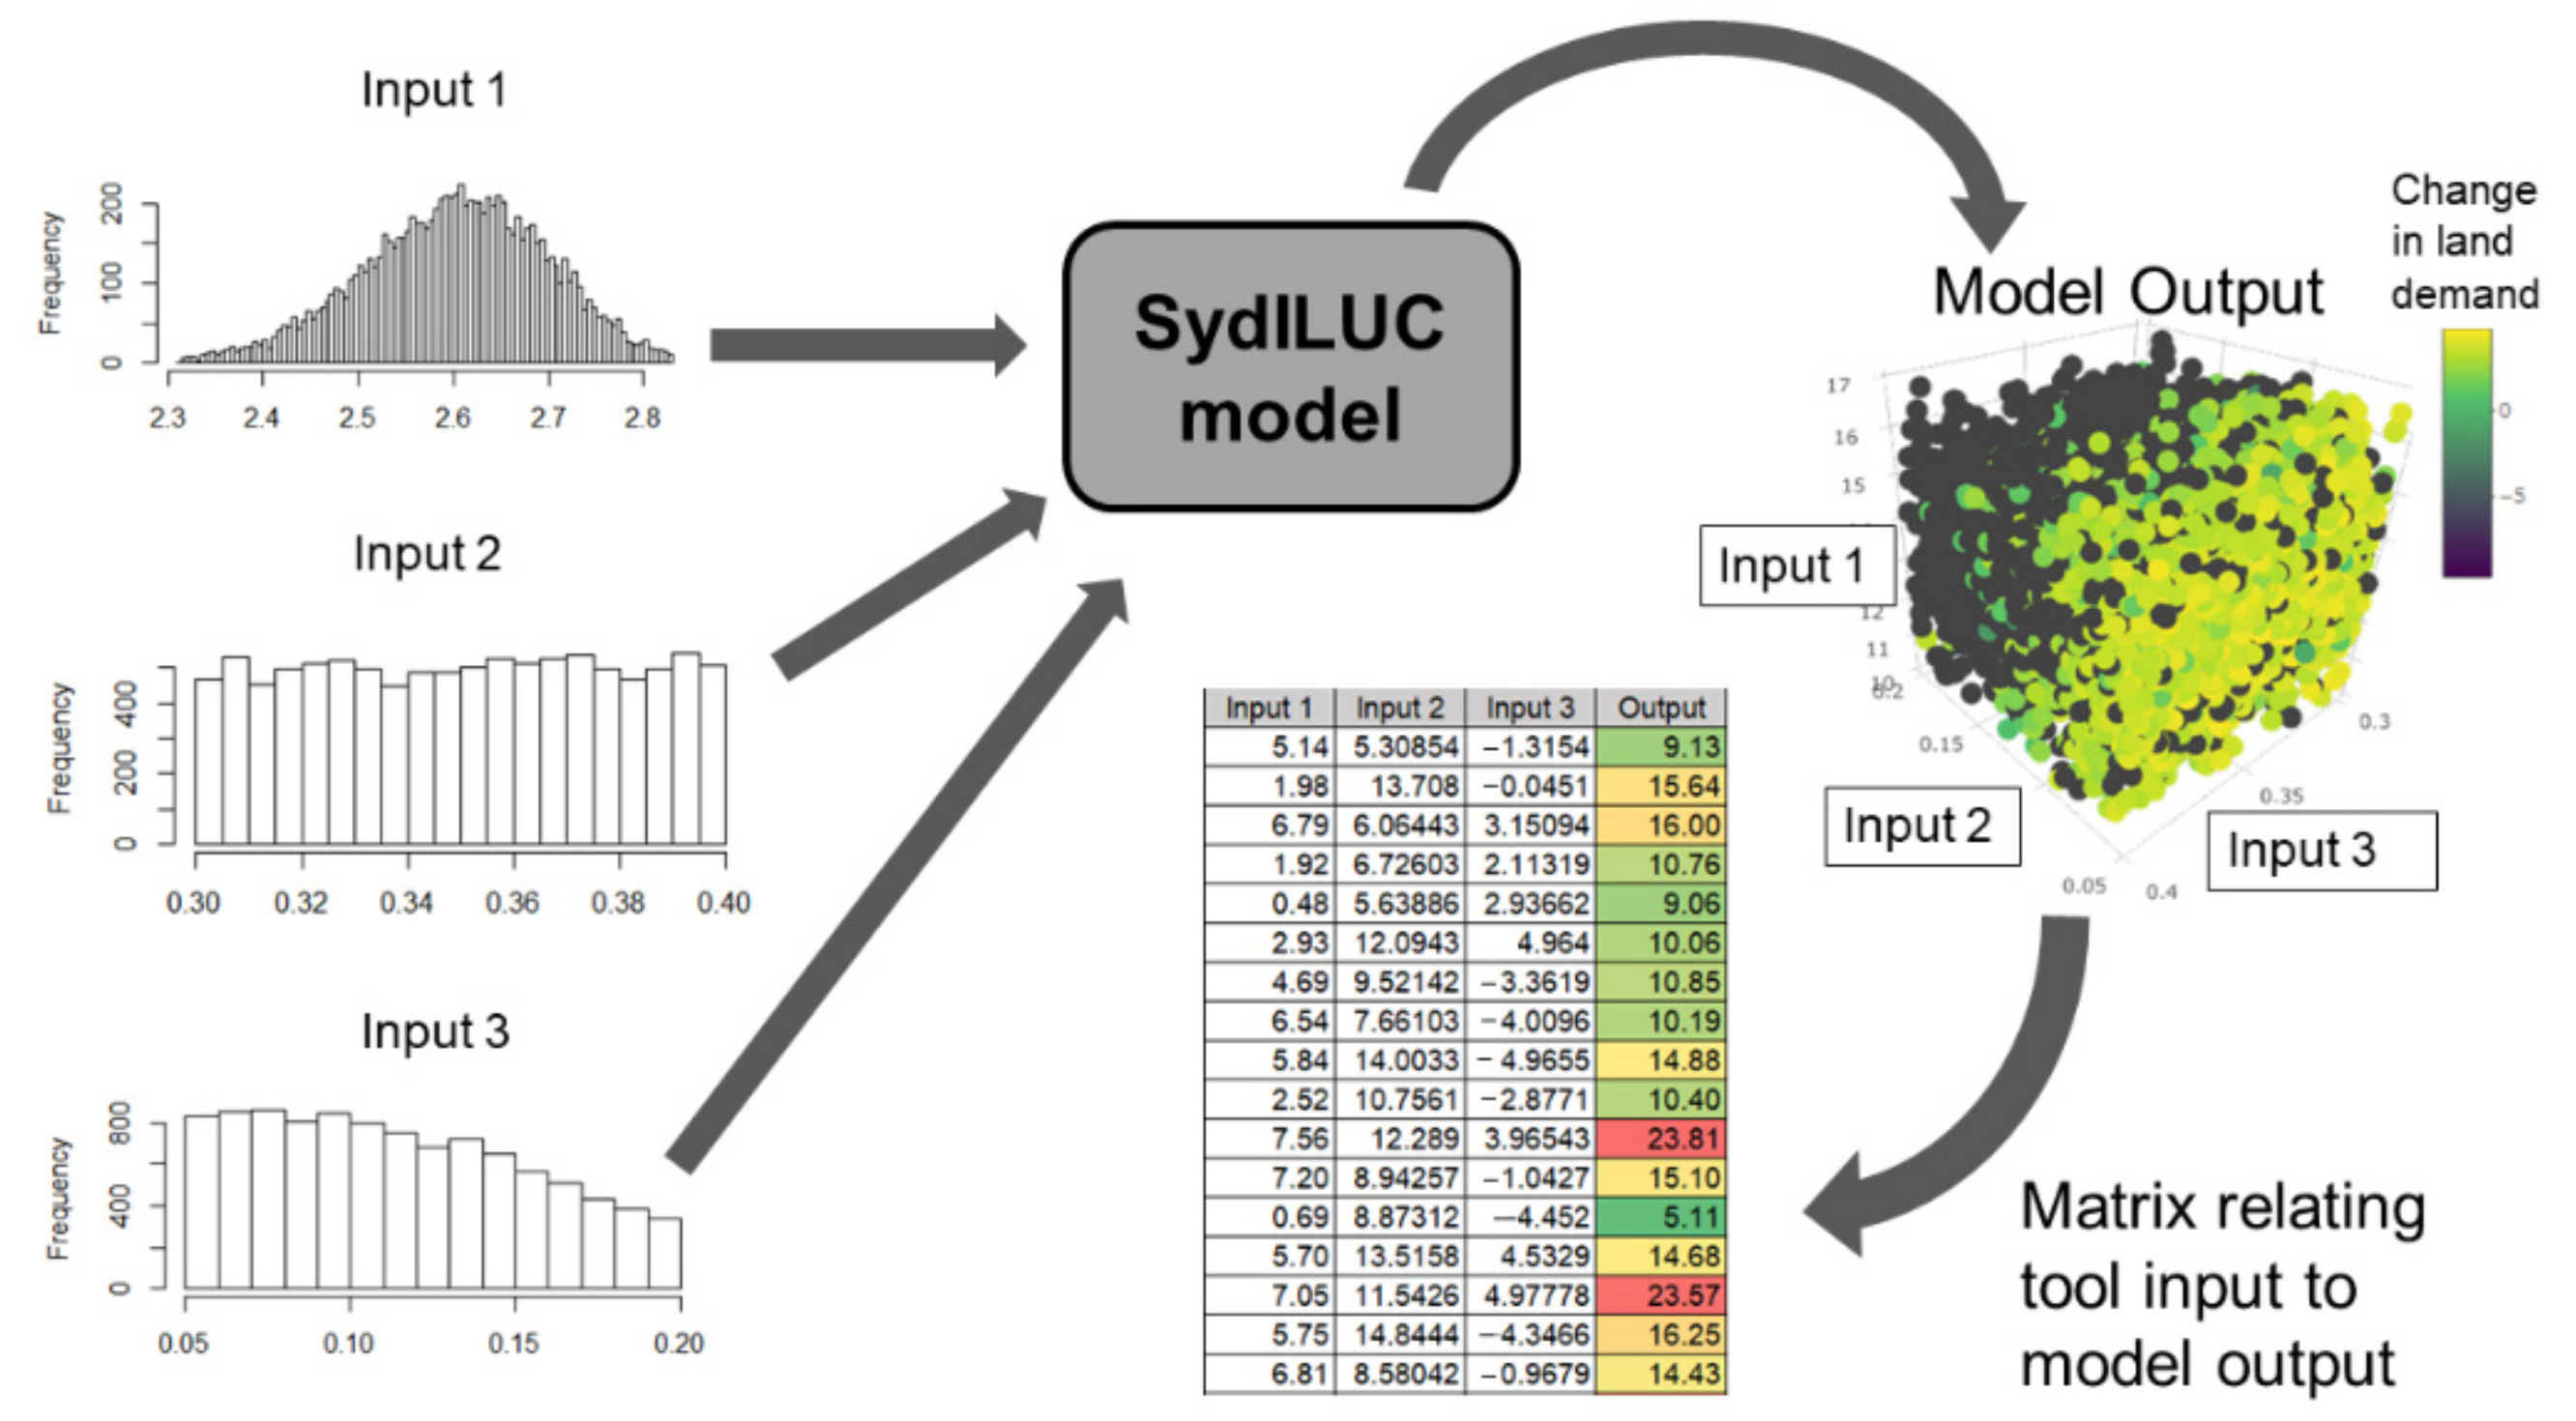
The idea is to simulate a wide range of possible sets of inputs, e.g., different agricultural yields, different use of co-products, different types of biobased material produced, and obtain estimates of change in land demand for each of them. Then, both the sets of inputs and the related outputs are collated into a matrix copied in the spreadsheet. The set of model outputs is then statistically divided into ten groups with increasing ILUC risk levels. When the user inserts in the spreadsheet the particular condition of interest, the tool translates them into a set of inputs for the model, and locates the closest set of inputs in the matrix, adjudicating it a certain land demand increase estimate (
Figure 2). This is, then, translated into a certain ILUC risk level. The user can insert data for different levels of the value chain, e.g., for the production of biomass, for the intermediate steps only, or for the production of biobased material from intermediate products.
Due to spreadsheet limitations in matrix dimensions (at one million rows the tool becomes too slow), a decision had to be made between generality of the results (how many different situations a spreadsheet tool could handle) and precision of the results (how dense the model outputs had to be in the input space to get close estimates from user-provided inputs). Using the maximum number of rows for a spreadsheet, but decreasing the dataset variance by selecting only one feedstock biomass, we were able to limit the simplification error to be ≤5% of the estimated change in land demand. Therefore, it was decided to limit each tool spreadsheet to one biomass only (in our case, one for maize, one for sugar beet, one for soybean), concentrate the model outputs on the most probable inputs, and explore the input space with a Latin Hypercube method.
The model results, then, had to be downscaled to local conditions. To do so, a matrix containing the country average values of the parameters used in the SydILUC model simulations was included in the tool. In this way the user does not have to include all the required inputs in the model, since the default is set by the country average values; this was essential to keep the tool simple and the required data low. An experienced user is still able to modify the country default values in order to give more precise ILUC risk estimates. This allows a global model to give robust ILUC risks at the local level: the effect of the local (country) production may have a certain global effect depending on local and global conditions. For example, local production of maize will use local information about crop yields, crop yield gaps, available unused land, etc., while the crop effects on the market price of the crop and its trading on the global market will use global data.
3.4. Description of the Tool
The first page of the SydILUC tool is the user interface (
Figure 3). It takes in the input provided by the user (if available), the reference country of production, the conditions of biomass production, the use of additionality practices, and the biobased material produced, and returns to the user the assigned risk level. The inputs are divided into three categories, depending on the value chain level of interest: biomass, intermediate product (e.g., hydrolysate), and the biobased product. The best case scenario is that a biomass producer would fill in its part, then give its results to the intermediate producer, and finally to the biobased material producer, so that all the production is given the appropriate ILUC risk level. However, the model can also be used by individual users; in this case the user from the other levels of the value chain will be assessed at default values (for the specific country of interest). The assigned ILUC risk works in the following way: the lowest risk achievable (i.e., using all additionality practices) for a certain biomass is given a value of A+++; the highest risk achievable (when production of biobased material requires the largest amount of land, e.g., due to no additionality practices and low yields) for a certain biomass is given a value of G; the other classes are binned depending on the statistical distribution of the ILUC land demand output, and the default value of each country is set within this boundaries. Thus, the ILUC risk level assigned is comparable only with other ILUC risks obtained for products using the same biomass, i.e., a low risk for maize production may still be a higher risk than the high risk for soybean production. This is due to the limitations in the matrix dimension for the spreadsheet software; however, auditors are still able to make cross-crop risk comparisons, as explained below.
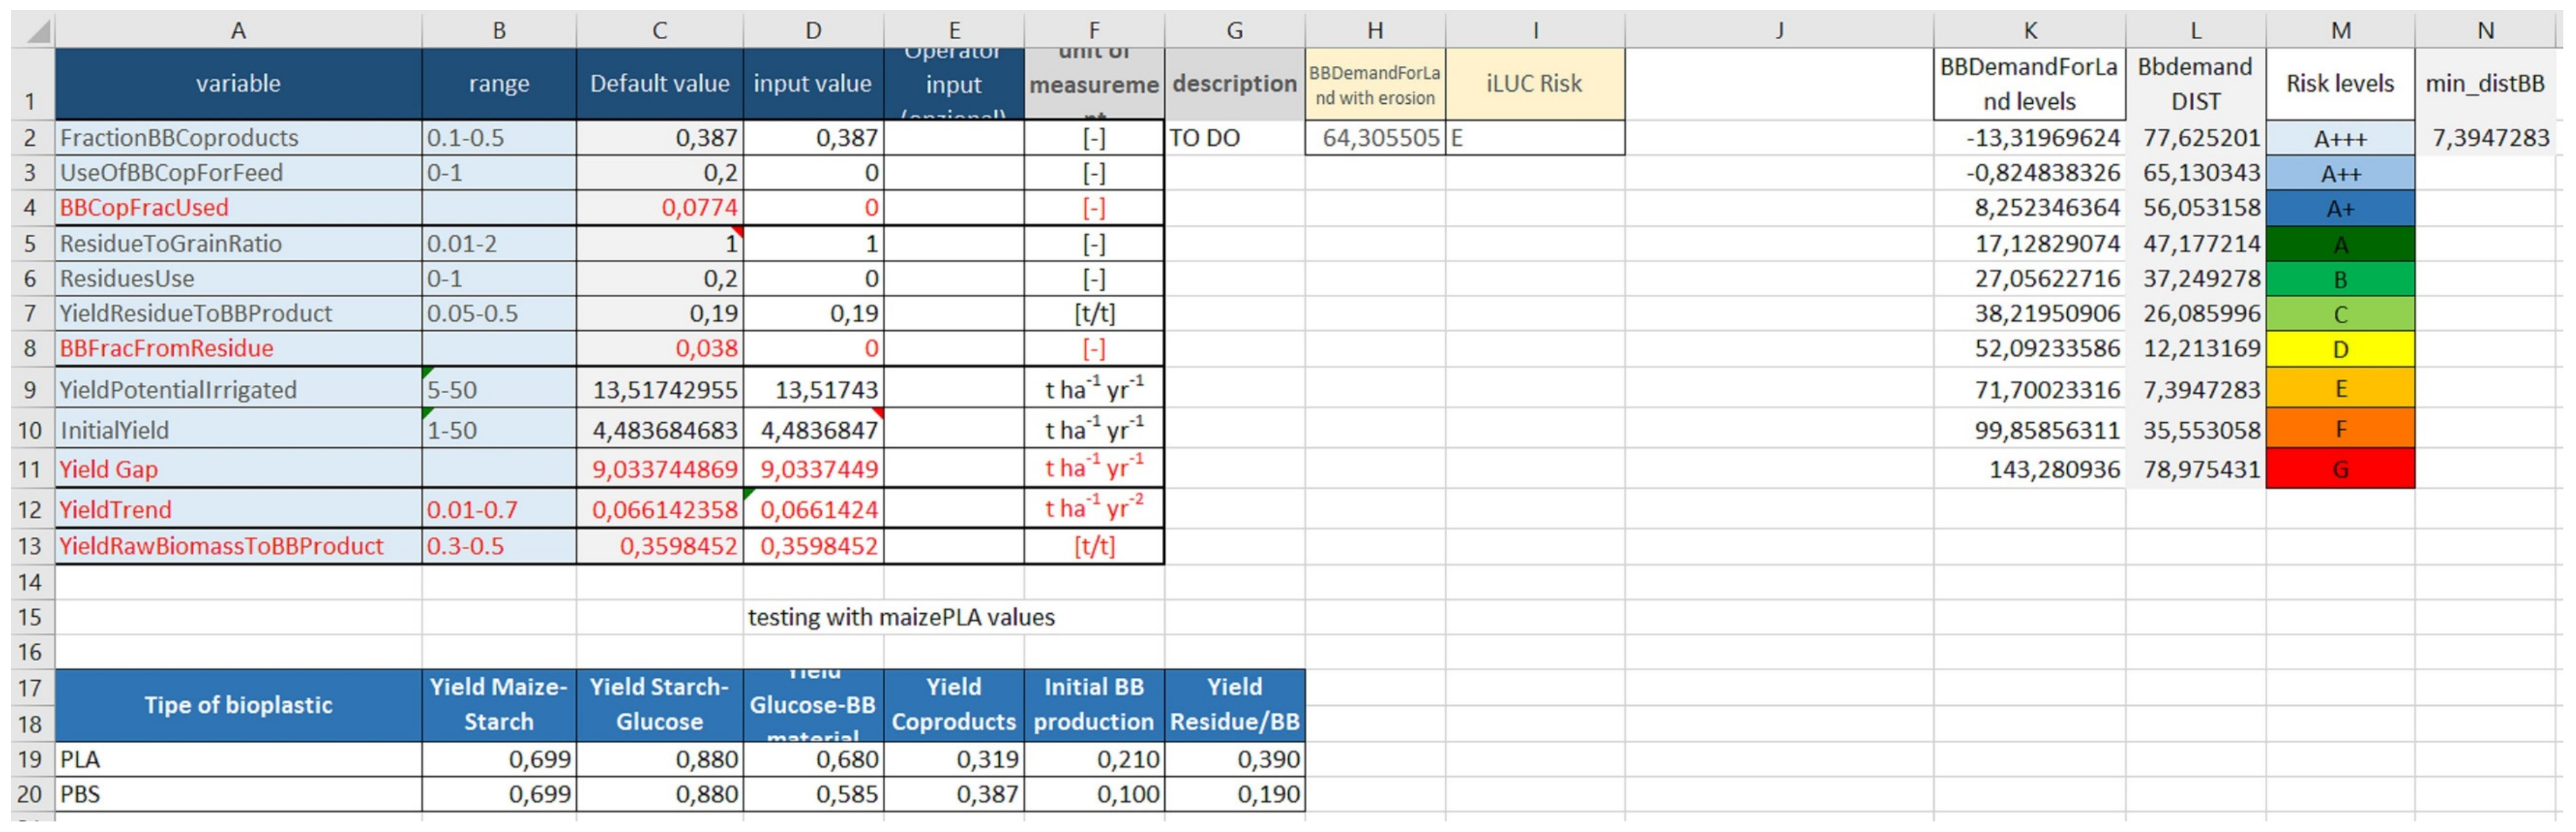
The second page of the tool (
Figure 4) is dedicated to auditors and shows how the inputs in the first page are converted into the matrix inputs, together with the default values and equations used. On this page, the information on biobased material production is listed, so an auditor could (a) update the values as new, more efficient production methods become available, and (b) include new types of biobased materials. Moreover, in this page the land use assigned to the user’s input is translated into the ILUC risk; the auditor can use the information provided and, using the SydILUC model (either by running it or by looking at the sensitivity analysis published in the STAR-ProBio deliverables 7.2 and 7.3, [
51,
60]), compare the ILUC risk for that specific crop with other crops.
The following pages are dedicated to the data used to estimate the final land change related to the user input. The third page contains the country default values, which the auditor can change to update them, or to include more specific regions of interest. The fourth page contains the data to assess soil erosion and soil organic carbon change effects on ILUC risk. Finally, the last page contains the SydILUC matrix, together with the method for the assignment of the land change corresponding to the user input, based on the minimum distance method. The last page is the only one that should be modified only by a user trained in the use of the SydILUC model.
4. Tool Use Examples
The SydILUC tool was, then, tested in two example scenarios to recreate a real- world example of the application of the tool. In this way, it is possible to assess the difficulties that a potential user could face, and if the tool can reproduce local conditions appropriately. The two scenarios analyzed were those of a farmer growing maize in Iowa, USA, where the production is heavily mechanized, and of a farmer growing maize in Romania, where the cultivation of maize is still partially performed in a traditional way. The two scenarios were selected based on the availability of data not only to apply the tool, but to select appropriate additionality practices based on the country-specific conditions and to assess their correct application in the local context (more information on the tool example scenarios is in the
Supplementary Materials, and more example scenarios can be found on STAR-ProBio Deliverable 7.2 [
51]).
4.1. Example Scenario: Iowa, USA
Iowa is the biggest USA producer of maize, producing ~20% of US maize. The average yield is 12.8 t ha−1 year−1 (United States Department of Agriculture-USDA 2020 data). Area harvested is 5.7 × 10⁶ ha. Since Iowa is a farmer state, and maize is the main crop produced, there is a strong push to use it efficiently and promote it on a national level. The maize agricultural production is heavily mechanized and ~70% of farms are managed in some way using computers (USDA 2020 data). There is plenty of information on maize production in the US, coming from the USDA. The main end use of the maize is for bioethanol production (39% of the total Iowa production, 30% of USA), the second is for livestock feed (21% of Iowa production). Sweet maize for human consumption makes up only 1% of the total production.
Regarding the three main additionality practices, Iowa has small room for yield improvement, small amount of unused land on which to expand, and co-products are already sold on the market. The maize market in Iowa is growing in production, in area, and in yield. Yield potential, the maximum achievable yield for certain conditions, for the USA is 13.99 t ha−1 year−1; the estimate for Iowa is of ~15 t ha−1 year−1; this means that the yield gap is ~2.2 t ha−1 year−1. The yield increases linearly in time by 0.13 t ha−1 year−2. Unused and abandoned land in Iowa consist of abandoned (coal) mines and undeveloped land (700 ha). Satellite images show a heavily cultivated landscape, with only few “free” areas around rivers and mines. This is to be expected, due to the high productivity, value, and morphological homogeneity of the state. The main co-product of maize production in the USA is dry distillers grain soluble (DDGS), which is sold for livestock feed, being rich in proteins (maize meal). Hence, it is feasible to assume a complete use of co-products as feed. The calculation of the additionality practices is described in the following paragraphs.
The maize yield increase of the example farm for a certain year of interest was assumed on the basis of the average annual crop yield growth rate (% year
−1) for the USA, taken from literature. According to [
58] it ranges from 1.2% to 1.3% for maize. Assuming that the yield of the farm is 12.8 t ha
−1 year
−1, the farm could increase its yield in this year by ~0.16 t ha
−1 year
−1 after implementation of a yield improvement measure. Thus, the farm could harvest 12.96 t ha
−1 in this year. The maize production needs to take place at an existing cultivation site on the farm. Due to the intensive production system, better adapted crop varieties and improvements in plant breeding are possible measures the farm can apply. The farm needs to demonstrate that the maize production results from the application of these measures. Most importantly, the attained yield needs to be additional compared to a business-as-usual situation and therefore above a specific baseline yield (compare
Section 2.2.2). Hence, the low-ILUC-risk yield of maize needs to be above the actual yield plus the yield trend in Iowa, to be in line with the approach considering a dynamic baseline yield (compare
Section 3.2.1). This means it needs to be above 12.93 t ha
−1 year
−1. Thus, the maize yield of the farm that can be claimed as low-ILUC-risk is 0.03 t ha
−1 year
−1.
For cultivation of formerly unused land, an expansion of 3 ha is assumed here due to the low availability of unused land in Iowa. As part of a site-specific investigation, the farm must verify that the land under consideration meets the criteria for low-ILUC-risk biomass cultivation (see
Section 3.2.2). The farm will need to demonstrate that the cultivation of the claimed land would not have taken place in the business-as-usual case and is therefore additional (compare
Section 2.2.2); i.e., that it is larger than the average expansion of maize land in Iowa estimated at the time (a recent study refers to a tripled cropland expansion in Iowa between 2006 and 2016, [
61]). The amount of low-ILUC-risk maize that would be produced on such land, assuming a yield of 12.93 t ha
−1 year
−1 (considering the dynamic baseline yield by summing the effects of yield increase), is 38.79 t in the year the area is cultivated. Finally, the possibility of using the co-products is not assessed here, since they are already largely sold on the market at good prices.
In the analysis, since the ILUC risk assessment is relative in nature, a baseline situation needs to be assessed first. So, the ILUC risk level for the production of PBS from maize produced in a business-as-usual way in Iowa can be determined in the ILUC risk tool by entering the average values for the USA maize production in the first page (which can be selected from a drop-down menu), or setting the default variables in the “country matrix” to represent Iowa specifically, an option available to an experienced user (e.g., an auditor). The ILUC risk produced, with respect to the rest of the world, is A++, due mainly to the high efficiency and yields of the cultivation of maize in Iowa. However, this already low risk is hard to reduce further: when the additional yield increase is entered into the calculation, there is no change in ILUC risk class. However, counting the additional expansion on unused land, the ILUC risk decreases to A+++.
4.2. Example Scenario: Romania, EU
Maize agriculture has been changing recently in Romania. In the period 1960–1980 there was a steady increase in maize production, sustained by a parallel increase in yield even while cultivated area slightly decreased. Between the 1980s and 2006, the yields trend was generally stable, even though it changed erratically from year to year; in the meantime, the land cultivated fluctuated up and down a few times, so that the overall production varied wildly between years. However, from 2016, the maize production stabilized at 18.7 × 10⁶ t (27% of EU maize production), with an average yield of 7.6 t ha−1 year−1 (which is on average for the EU) and 2.7 × 10⁶ ha of harvested area (data for 2018, FAOSTAT). Maize production is not yet completely mechanized, with most of the cultivated area consisting of small farms. Transportation may be an issue in the region, due to small and pothole-ridden country roads. Agricultural residues are usually left on the field, and often burned.
Regarding the three main additionality practices, Romania has large potential for yield improvement, and a substantial amount of unused land on which to expand. The yield potential in Romania is estimated at 12.2 t ha
−1 year
−1; this means that the yield gap is 4.6 t ha
−1 year
−1. The yield has increased linearly in time since 1990 by 0.0571 t ha
−1 year
−2. After 1991, a land reform sought to privatize land resources owned by the state, with the goal to give them back to pre-collectivization owners. However, the restitution was capped at 10 ha. It is estimated that 2.17 × 10
6 ha are not used in Romania [
62]. This resulted in small parcels of land being owned by every small holder. By 2004, 97% of land was privately owned [
63]. Due to a variety of causes (decreasing Romanian population, remoteness, socioeconomic factors), agricultural land is partly abandoned and is projected to be abandoned even more by 2030 [
64]. Hence, abandoned land seems to have a policy-driven characteristic in Romania, and it seems that better road connections, land rights policy, and agricultural production organization could reverse that, without affecting social structures negatively.
According to [
65], in countries or regions with a large yield gap, a higher yield increase due to the implementation of yield improvement measures can be realized. Because the yield gap of maize of 4.6 t ha
−1 year
−1 in Romania is larger than in the first scenario in Iowa, we assume for the example of a Romanian maize-producing farm a doubled average annual crop yield growth rate (% year
−1) of 2.5%. To calculate the yield increase, we use the method applied in the case of Iowa. If we assume that the actual yield of the farm is 7.6 t ha
−1 year
−1, the yield increase is ~0.19 t ha
−1 year
−1 after the implementation of the yield improvement measure. Hence, the Romanian maize-producing farm could harvest 7.79 t ha
−1 in this year. As in the case of Iowa, the low-ILUC-risk maize needs to be produced in addition to the business-as-usual case (compare
Section 2.2.2). Thus, the low-ILUC-risk yield of the cultivated maize needs to be above the actual yield plus the yield trend of similar Romanian farms (dynamic baseline yield, compare
Section 3.2.1). In this case, since the acceleration in the yield trend was recent enough (only 3 years), it was possible to use the yield trend of the period 1991–2016. Therefore, all the yield increase can be regarded as additional, in this case.
As in Iowa, assuming a best case scenario, due to the large area of unused land, the assumption is that of an additional expansion on 10 ha of unused land. However, to demonstrate that the cultivation of the 10 ha of unused land is additional, the requirements for low-ILUC-risk biomass need to be considered (compare
Section 3.2.2). Therefore, the expected production of low-ILUC-risk maize is of 77.9 t. Using the default values for Romania, the baseline ILUC risk for maize production is F, relatively high. However, after accounting for the additional increase in crop yields, the ILUC risk drops to A++. If we include only the effect of the additional unused land, we get from F to C. When combining the two additionality practices, the risk drops to the A+++ category, the lowest, as expected, since the two additionality practices taken into account are the ones with larger impact on ILUC risk.
5. Discussion
The two example studies show how the tool allows flexibility in its approach. In the Iowa case, the crop production is already heavily mechanized and controlled, and the ILUC risk is very low, due to the very high yields and efficiencies of the production (with the use of co-products). However, there is little room for yield improvement over the baseline crop yield increase, and the available agricultural land is already completely used. Thus, in Iowa yield crop increase and land expansion will hardly comply with the additionality principles. In the case of Romania, in contrast, there is a high potential for ILUC risk reduction, due to both the large yield gap in the region and to the presence of unused land that was previously cultivated. Increasing the yields and expanding on unused land would, hence, probably comply with the requirements of the additionality principle.
Both areas examined have large amounts of data available for the proper assessment of the crop production. In case the ILUC risk tool had to be applied in areas with data scarcity, or where data were highly uncertain, the use of default values coming from FAOSTAT would be a better choice than making unfounded assumptions on the conditions of the crop production. The use of country averages implies the ILUC risk could be locally much higher than estimated; however, this ILUC risk assessment is already more precise than other methods used to estimate ILUC risk (e.g., the RED II). This shows the potential of the “granular” approach, which links the local production of biobased materials with global risk of ILUC effects. Even if there are large uncertainties if and where the local production of biomass will have ILUC effects, it is still possible to estimate the local increase in land demand due to such biomass production, and translate it into a global risk of ILUC. The tool estimates (a) the probability that the use of crops grown in a certain area will eventually result in an increase in land demand and, thus, ILUC effects somewhere across the globe, and (b) how additionality practices help to reduce that risk, and by how much.
The tool does not take time into account explicitly, but time enters implicitly in both: the assignment of ILUC risk, since the matrix that is used to assign ILUC risk values comes from the dynamic model; and in the ILUC risk reduction assessment, since time series need to be used to demonstrate the additionality of crop yield increase and expansion on unused land. The inclusion of time is very important: a static approach would hardly be compatible with the principle of crop yield additionality increase; moreover, a static approach would miss the feedback loop effect included in the SydILUC model, such as the long-term effects of taking residues off the agricultural land for biobased material production, instead of using them for erosion protection and soil organic carbon improvements.
The tool can be used as a way to trace the biomass in the value chain of the biobased material. Here, both examples were focused on the production of biomass, since it is where the possibilities for additionality practices are larger. However, the following step would be for the producer of the intermediate product to collect the ILUC risk predictions for the various biomasses used: insert additionality practices (e.g., the efficiencies of transformation of the biomass to intermediate product), and combine them. The combination of ILUC risks from different sources should penalize large-ILUC-risk biomasses by using a weighted average to prevent free-riders mixing high- and low-risk-biomasses to improve the overall ILUC risk level of the intermediate product. The combination can be made automatically, so as to create an ILUC risk level for a large, heterogenous set of biomass material. The same approach will be used at the stage of the biobased material production, producing that way an overall ILUC risk assessment, and promoting the certification of the whole value chain.
One limitation of the tool approach is the need to use a large matrix, which is hard to process on a spreadsheet, limiting the tool’s application to one biomass only per spreadsheet. Another limitation is the fact that the SydILUC model needs to be run to obtain a new matrix each time there is an update in the biobased material production methods and, anyway, to include the new conditions of the agricultural market. However, the validation of the SydILUC model shows that the results of the tool are valid for at least a period of 5 years. Finally, one big limitation is that the tool does not evaluate ILUC precisely enough to be included in a LCA approach; however, that was never intended, as the risk approach is not aimed at obtaining precise estimates of GHG emissions, but rather robust assessment of probable outcome, in order to manage the large uncertainties inherent in ILUC estimates.
6. Conclusions
The ILUC risk tool proposed here is able to bridge the two main methods to deal with ILUC effects caused by biobased materials production: the modeling approach and the certification approach. The additionality practices identified as potential methods for a robust certification scheme for low-ILUC risk-biobased material production were explicitly included in a dedicated ILUC risk model. In this way, the risk assessment was performed on a global level using a dedicated ILUC model (the SydILUC model) which was calibrated and validated. The SydILUC model was, then, simplified through use of statistical techniques (global sensitivity analysis, Sobol sequences, PCA) to condense its results in a matrix. Then, the ILUC risk is downscaled to the single producer by taking into account the conditions of the region (country or, if data available, local) where it was produced, and accounting for the effect of additionality practices. The matrix, the downscaling method, and the ILUC risk category calculation were then condensed into a user-friendly and transparent tool, in order to allow policymakers and producers to compare different strategies to reduce their global ILUC risk.
The output of the tool is adaptable enough to be included in the STAR-ProBio assessment tool [
66], and to be comparable with the RED II classification scheme. Part of the tool is dedicated to auditors, who can use the tool to assess the ILUC risk based on specific local conditions, can update the model to include innovative production methods, and can interpret the results in a more specific or general way, e.g., to compare different biomasses, or to assess small differences between local productions. It should be pointed out that, in a risk approach, risk is never zero, but it can be minimized. The decision of the level of risk deemed as acceptable is a political one, however, not a scientific one.
Here, we proposed a methodology to help bridge the gap between ILUC modeling, with its large uncertainties and different assumptions, and ILUC policy, with its need to take informed decisions and to audit the application of the policies themselves. We also presented two example case studies, in order to display how the method (and the tool) would be applied in real life. However, the results presented for the examples are only preliminary calculations. Moreover, we want to stress here that this is just the first step toward bridging the aforementioned gap, and that the method should be further developed in the future, for example, by testing different models to build the tool dataset, and the auditing processes should be tested in the field.
Future work will see the tool applied in real case studies, and other biomasses included in the approach. One focus will be assessing how much the uncertainties in the inputs (e.g., using default values instead of local ones, or incorrect reporting) may affect the results on a large scale (e.g., for the whole EU production). The inclusion of other biomasses (at this moment the tool is available only for maize, soybean, and sugar beet) is not straightforward, since the SydILUC model structure needs adjustments to simulate properly the market conditions of a certain crop, e.g., the maize market is a global one, while sugar beet is mainly used in the EU, and is heavily affected by the Common Agricultural Policy.


