
A BIM-Based Solution for the Optimisation of Fire Safety Measures in the Building Design

 , ,
, ,  , and
, and
Abstract
:1. Introduction
2. Theoretical Background
2.1. Evacuation
2.2. Smoke Propagation
2.3. Fire Safety Measures
2.4. Application of BIM and Graph Theory in Fire Safety
2.5. Application of Optimization Methods in the AEC Industry
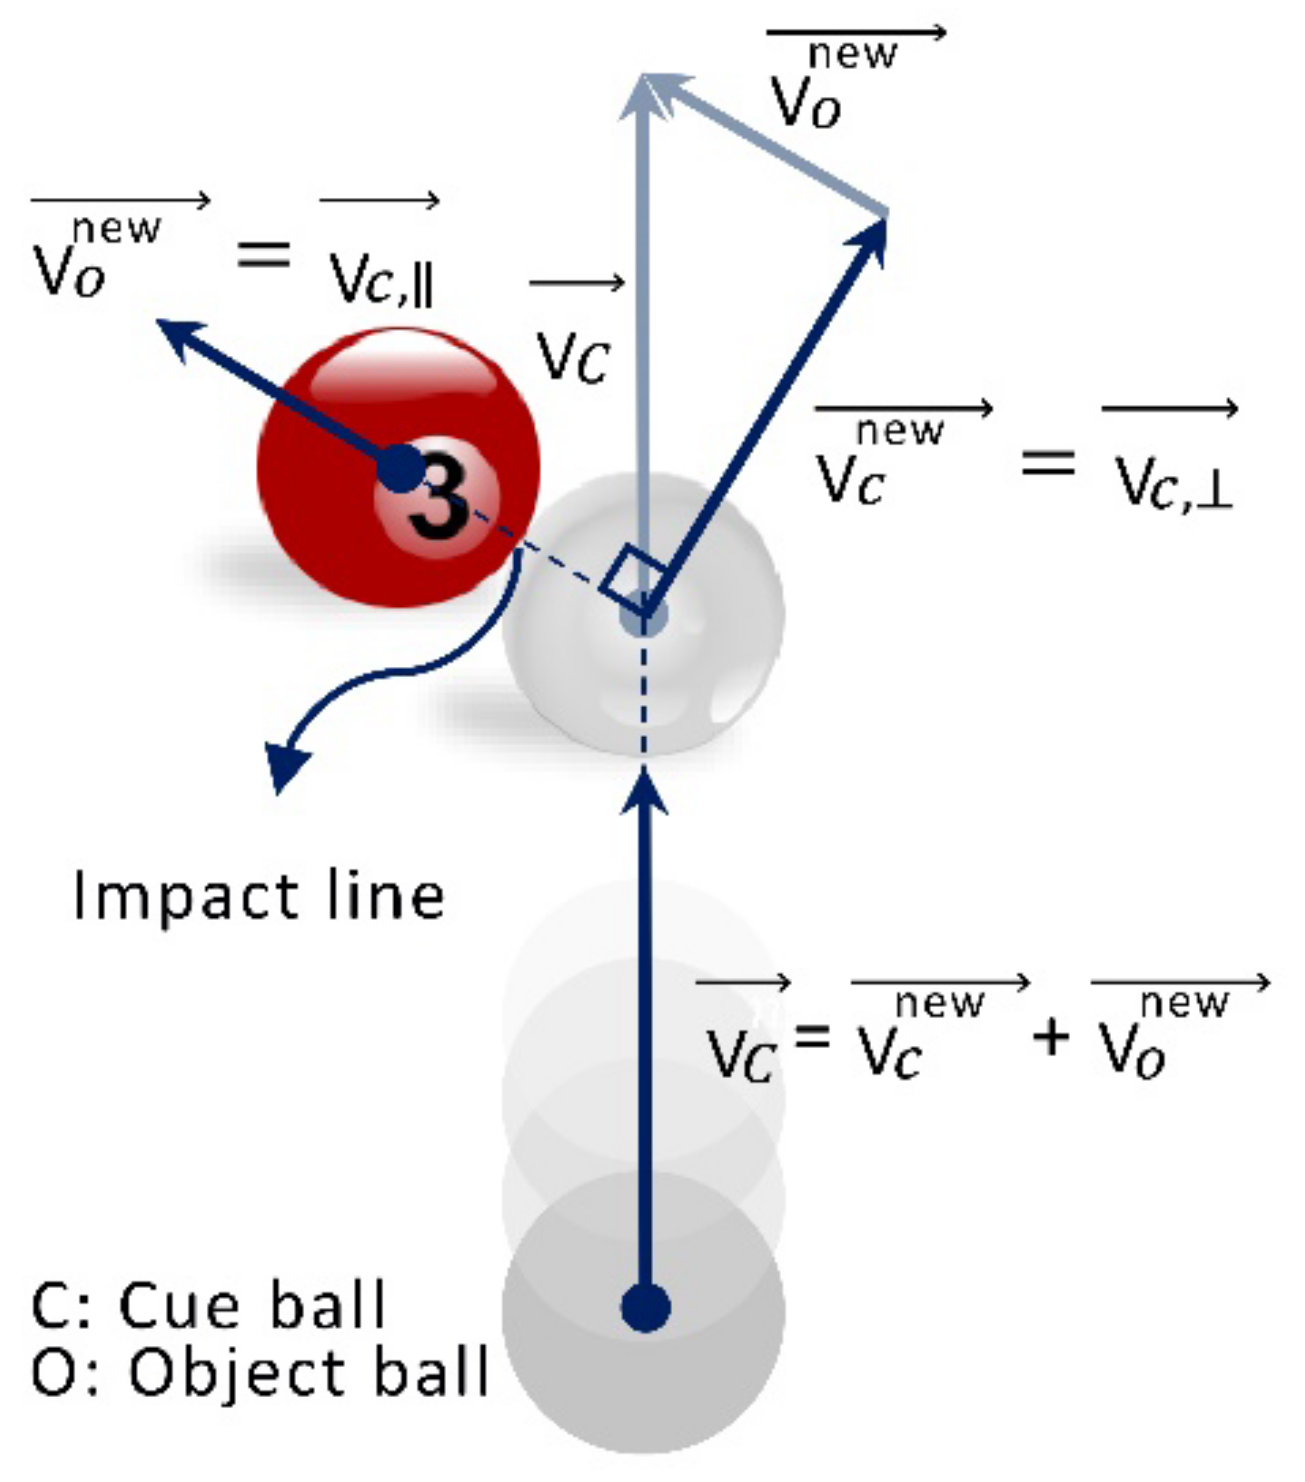
2.6. Binary Billiards-Inspired Optimization Algorithm (BBOA)
3. Proposed BIM-Based Framework Mechanism and Developed Plugin
- The initial framework and BIM plugin was developed based on a synthesis of the findings from the literature review.
- The binary version of the Billiards-inspired Optimisation Algorithm (BOA) is developed and utilised in the optimisation phase of the proposed framework.
- The proposed method was implemented and validated in an explorative case study in two projects. The findings from the implementation of this framework can be found in the Case Study section.
- The proposed framework is implemented in two case projects. The lead time sensitivity analysis is carried out to determine the appropriate lead time for each case project. Moreover, the effectiveness of the proposed approach was evaluated based on increasing the percentage of survived occupants using optimised fire safety measures effectively and economically in two case projects.
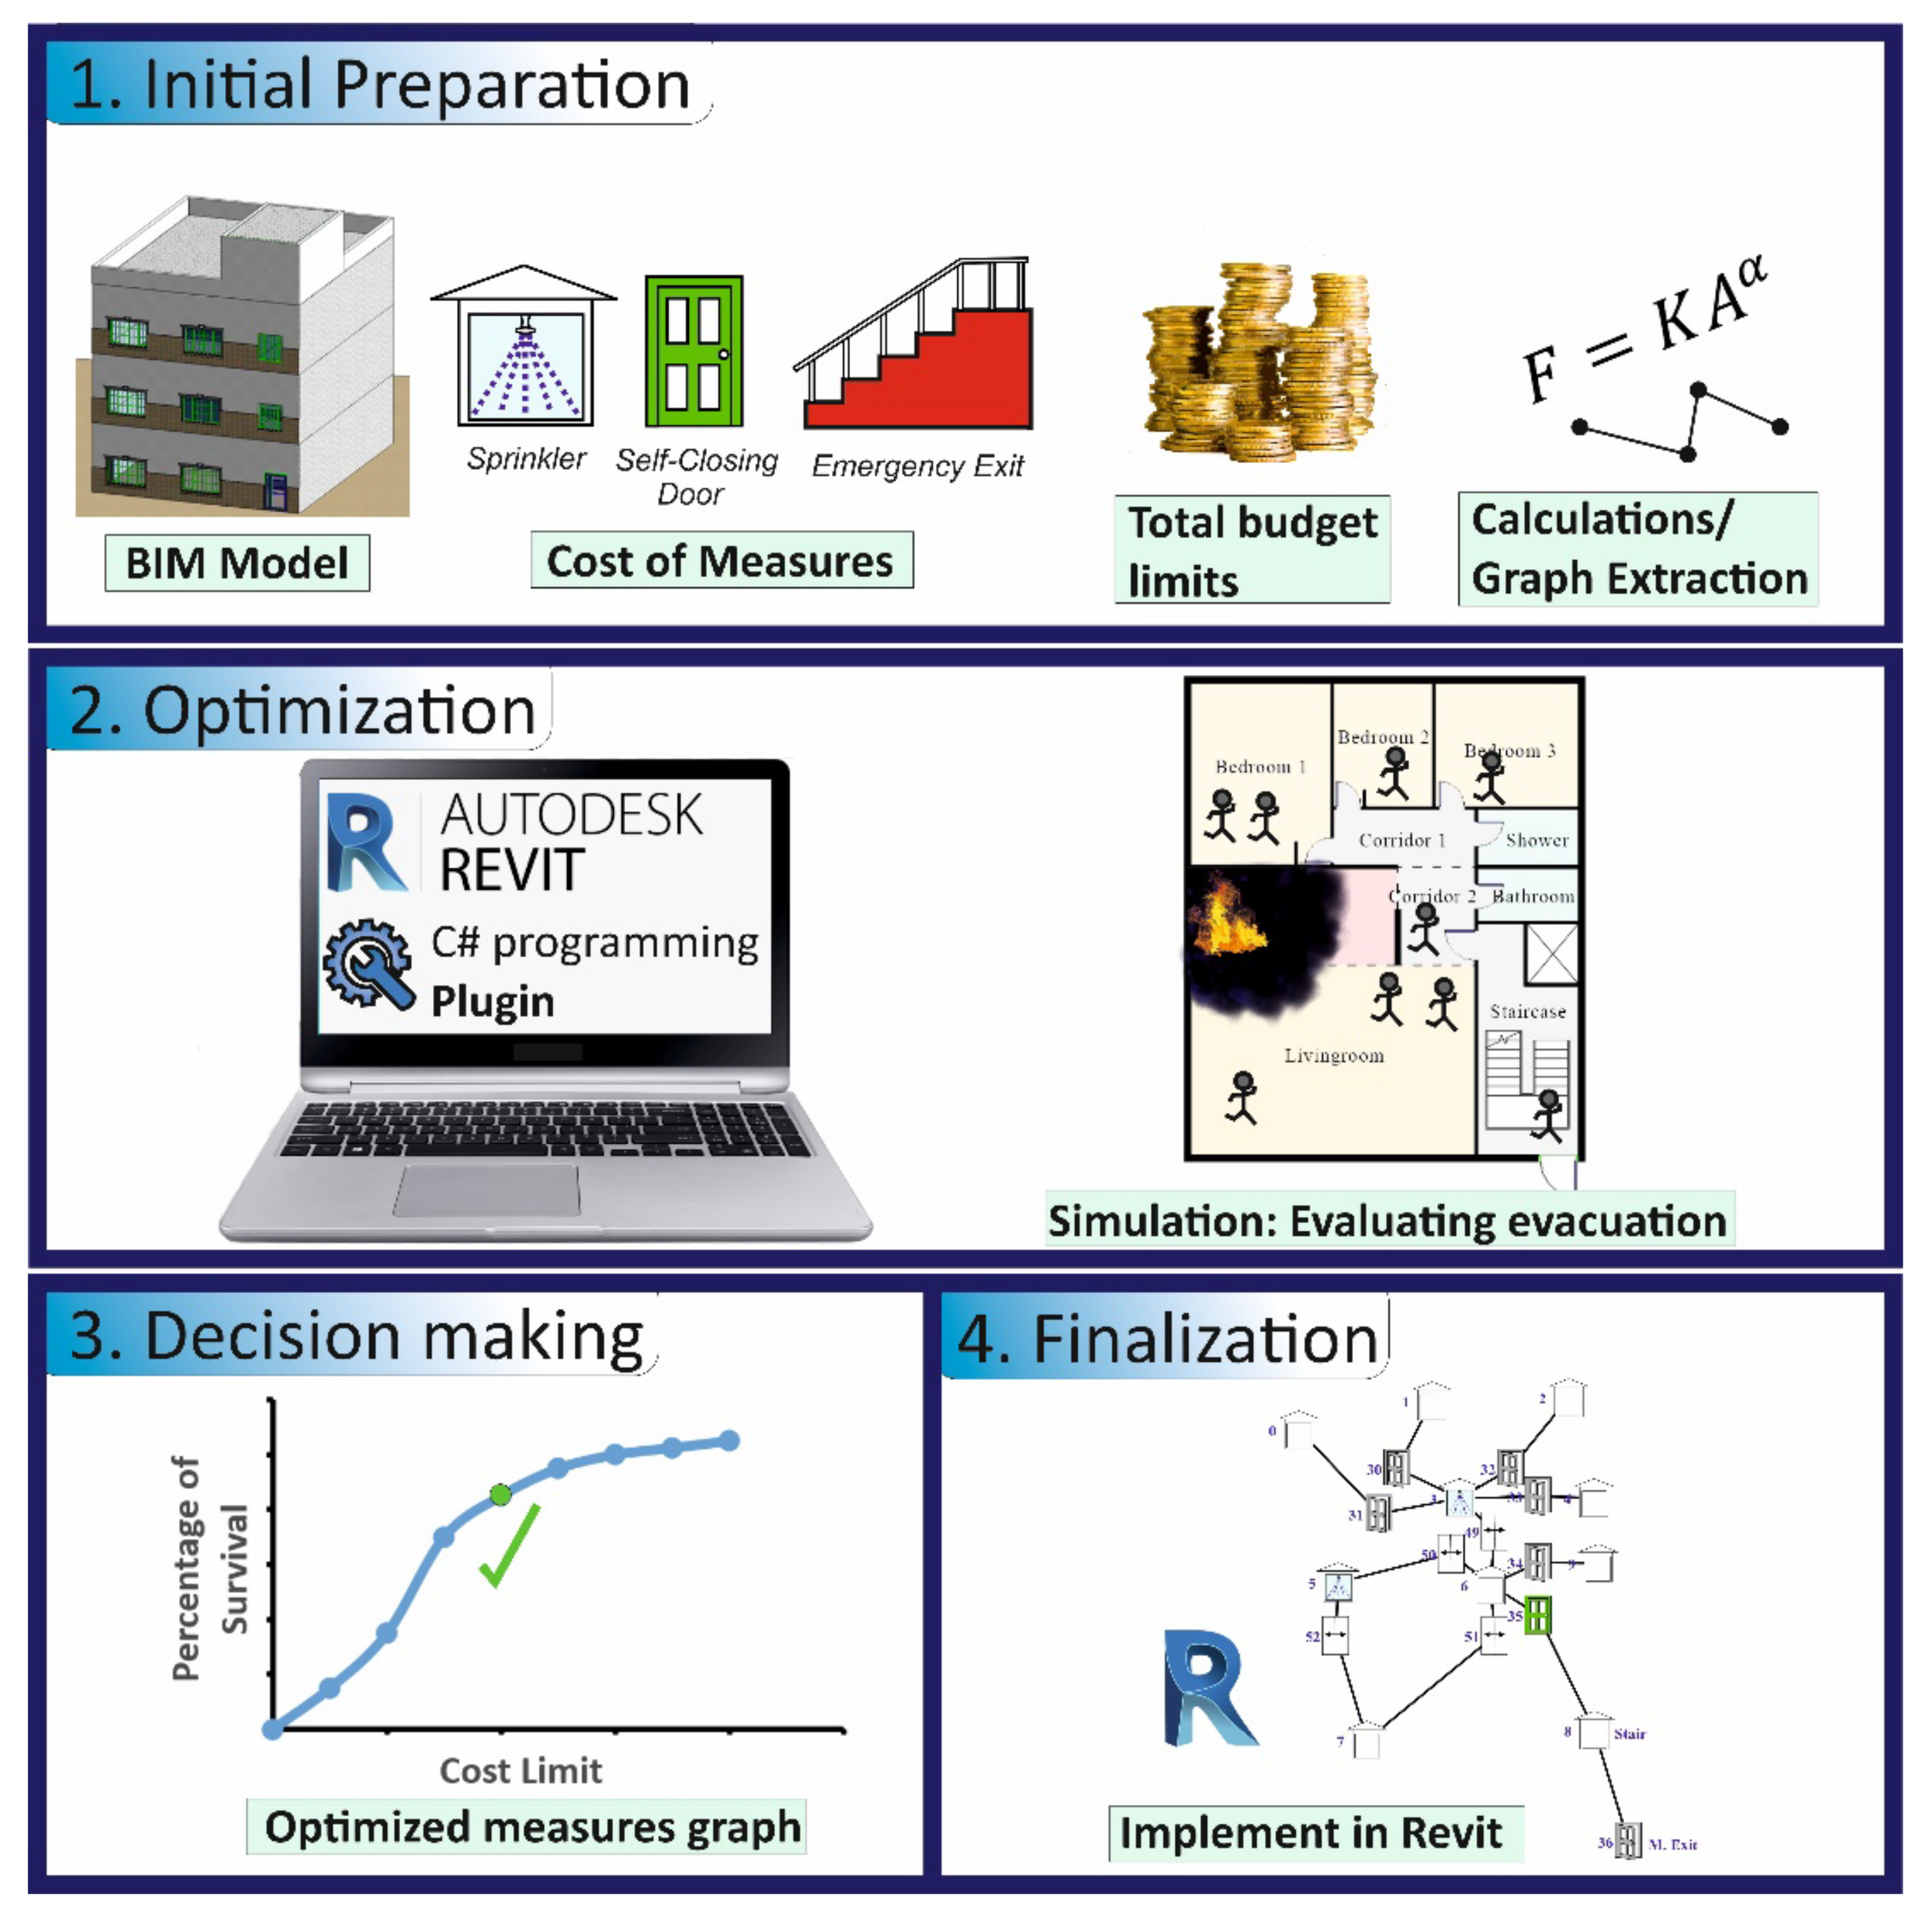
3.1. Phases List
3.2. BIM-Based Framework Description
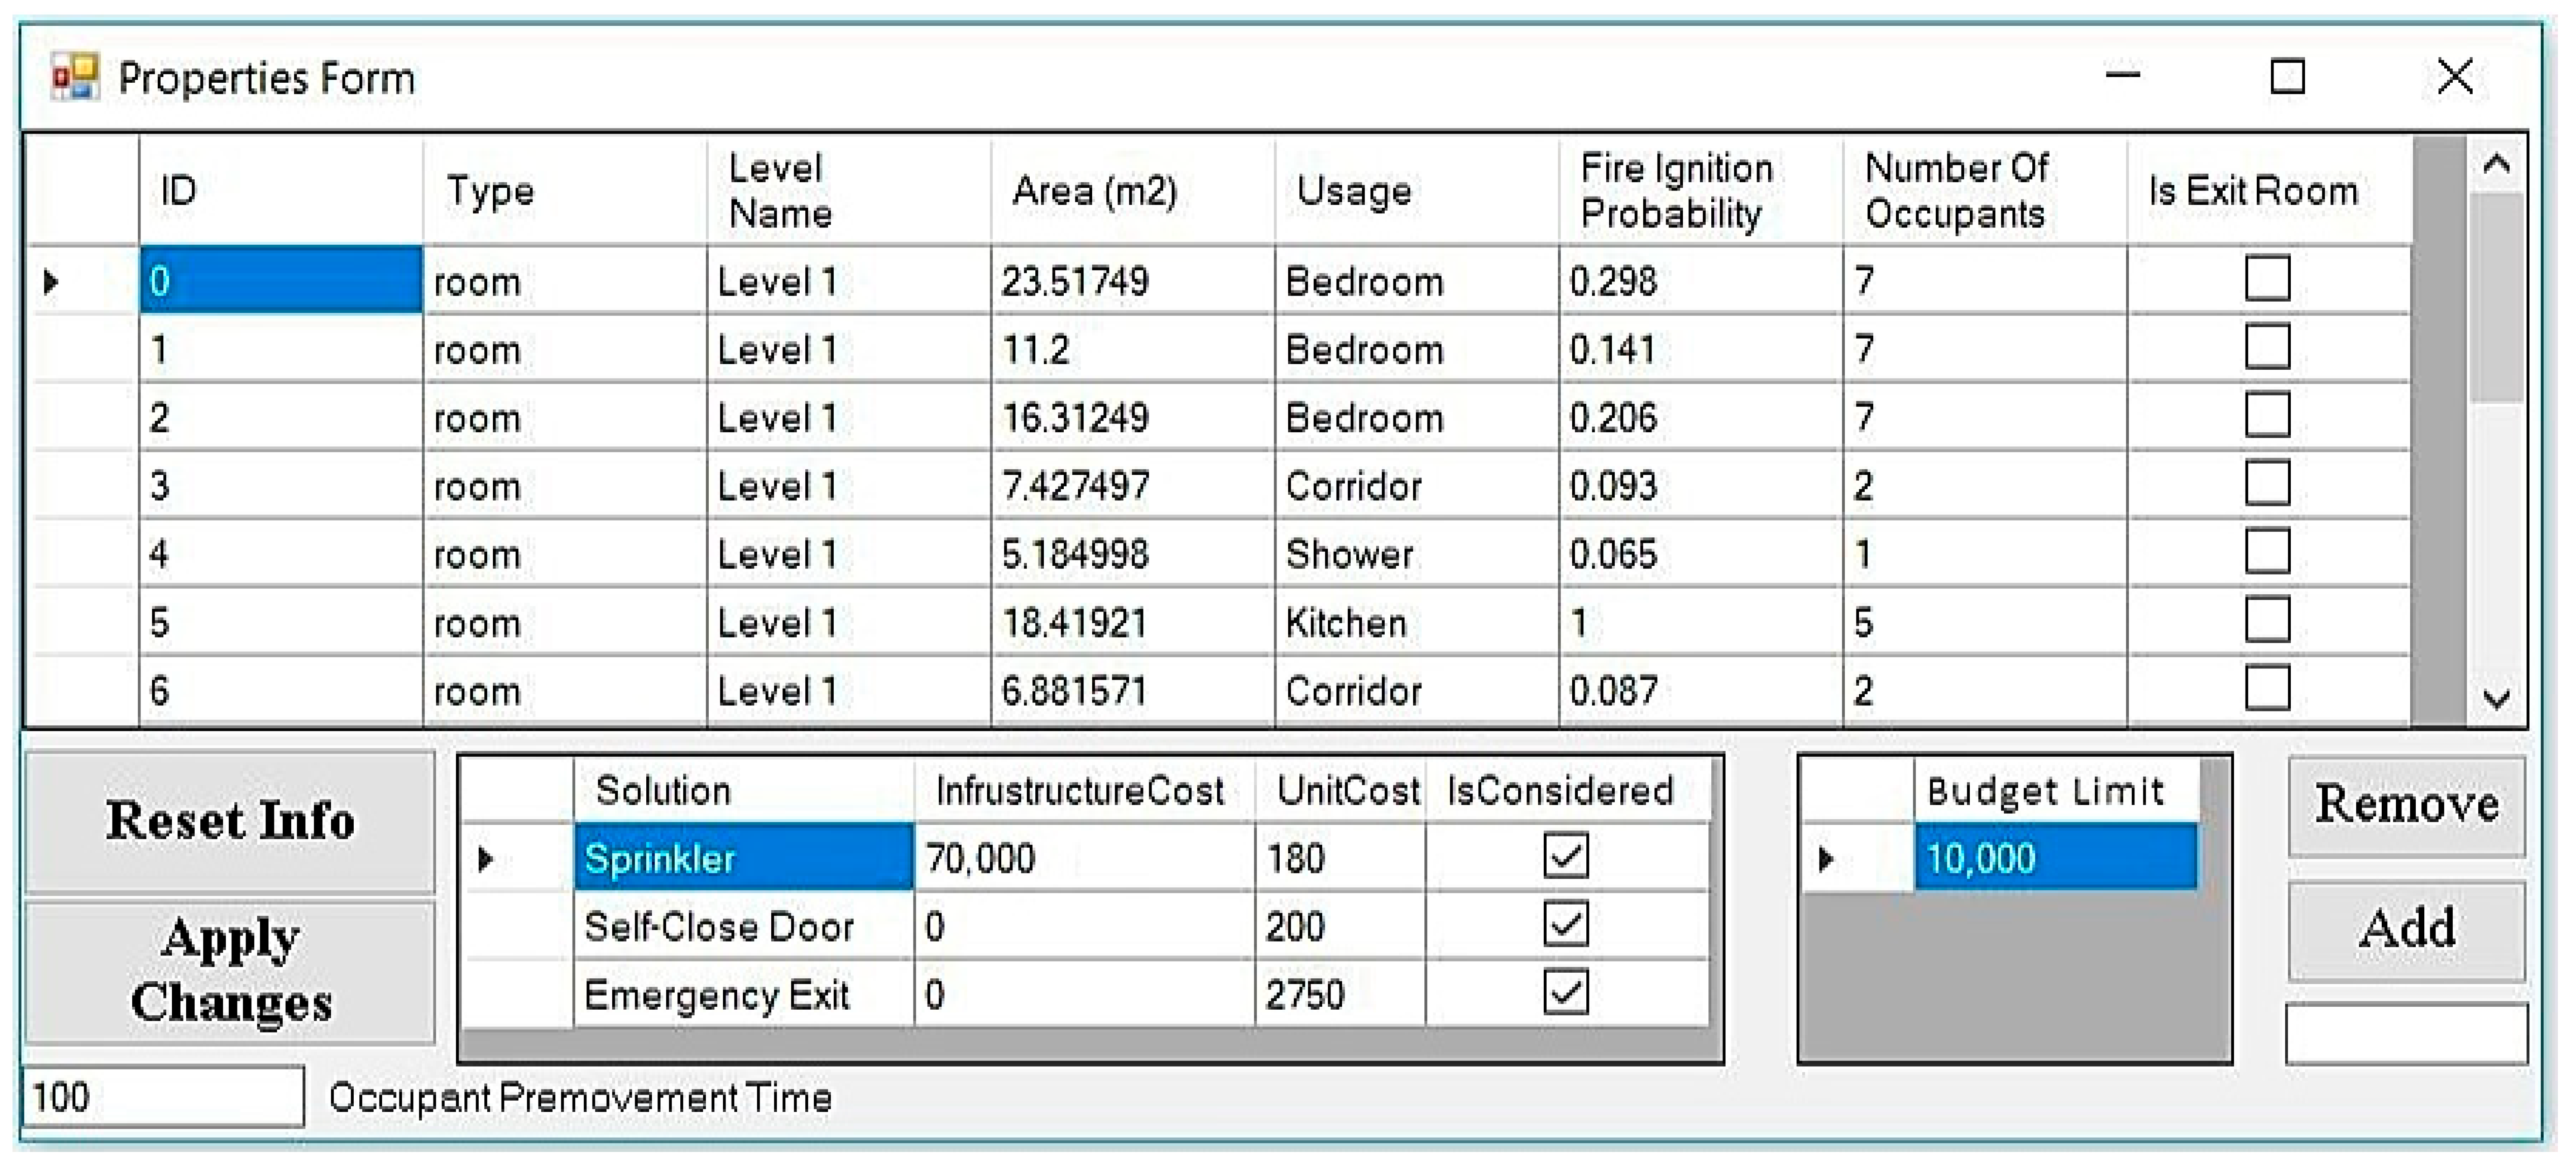
3.2.1. Initial Preparation Phase
Manual and Automatically Calculated Inputs
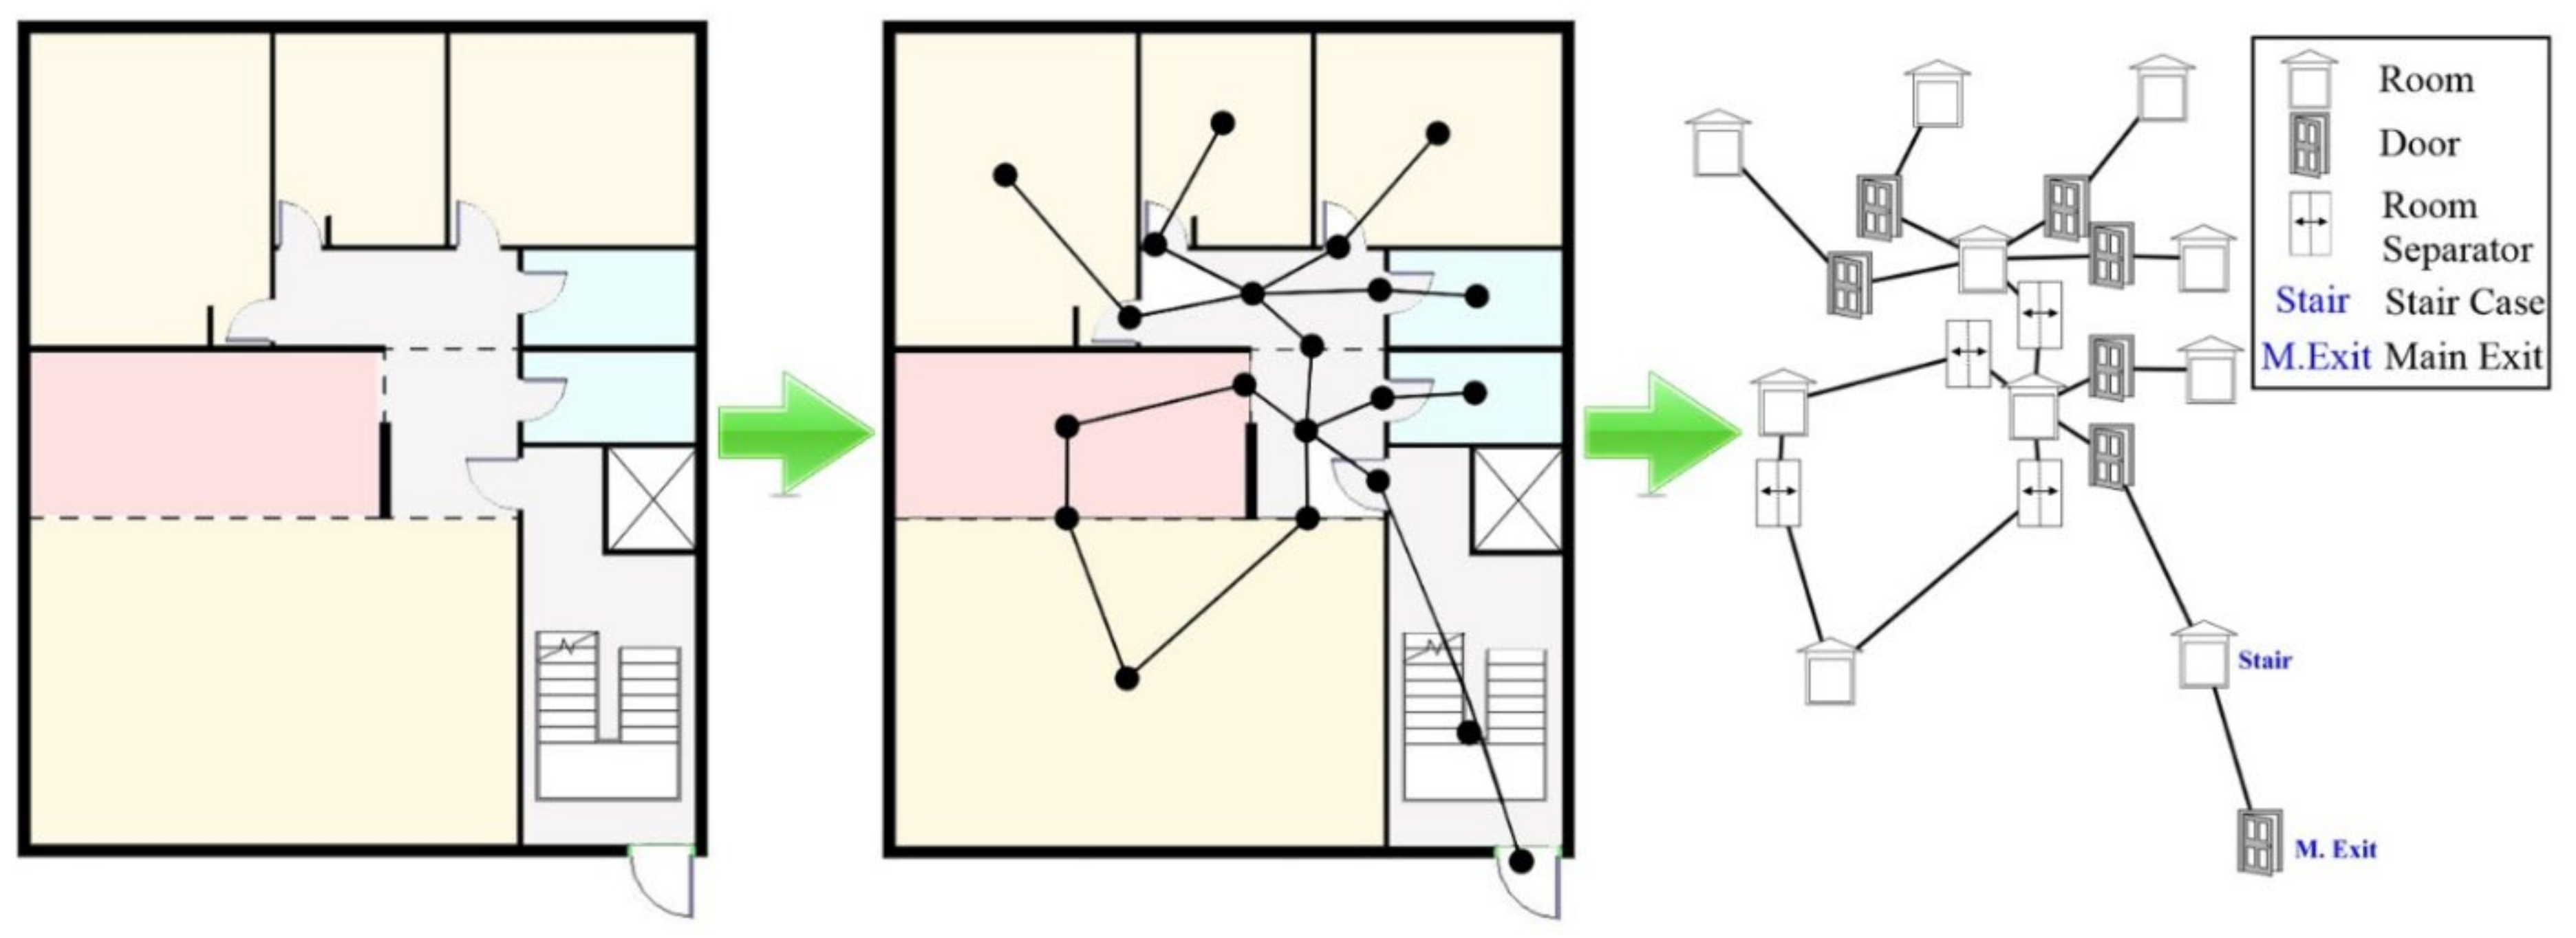
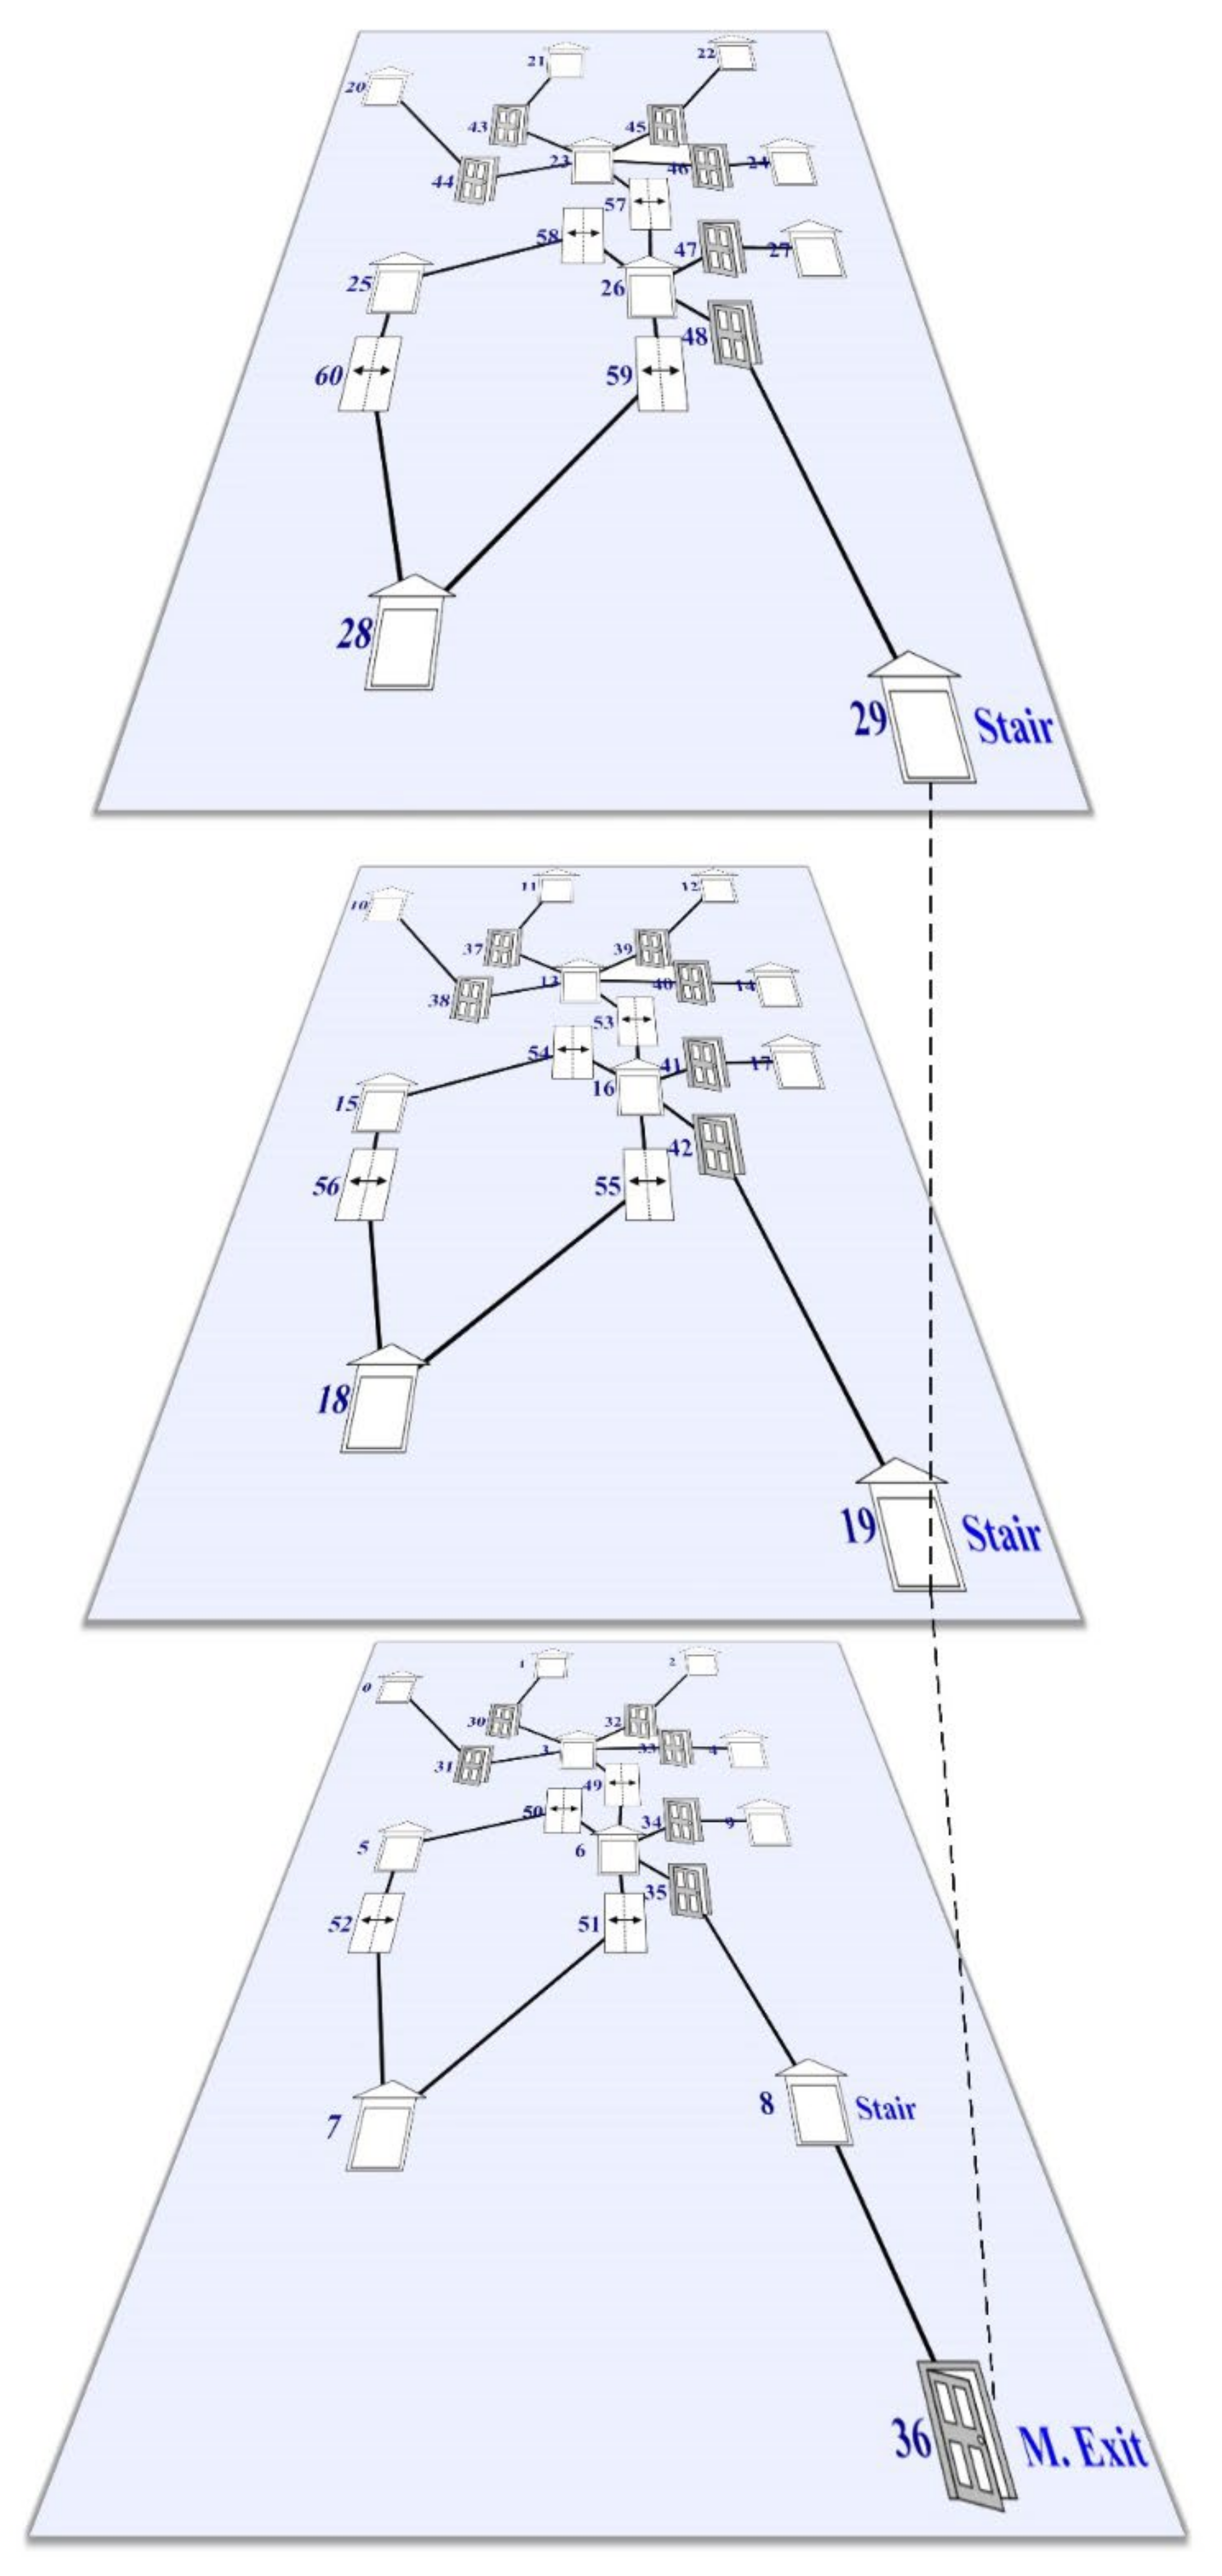
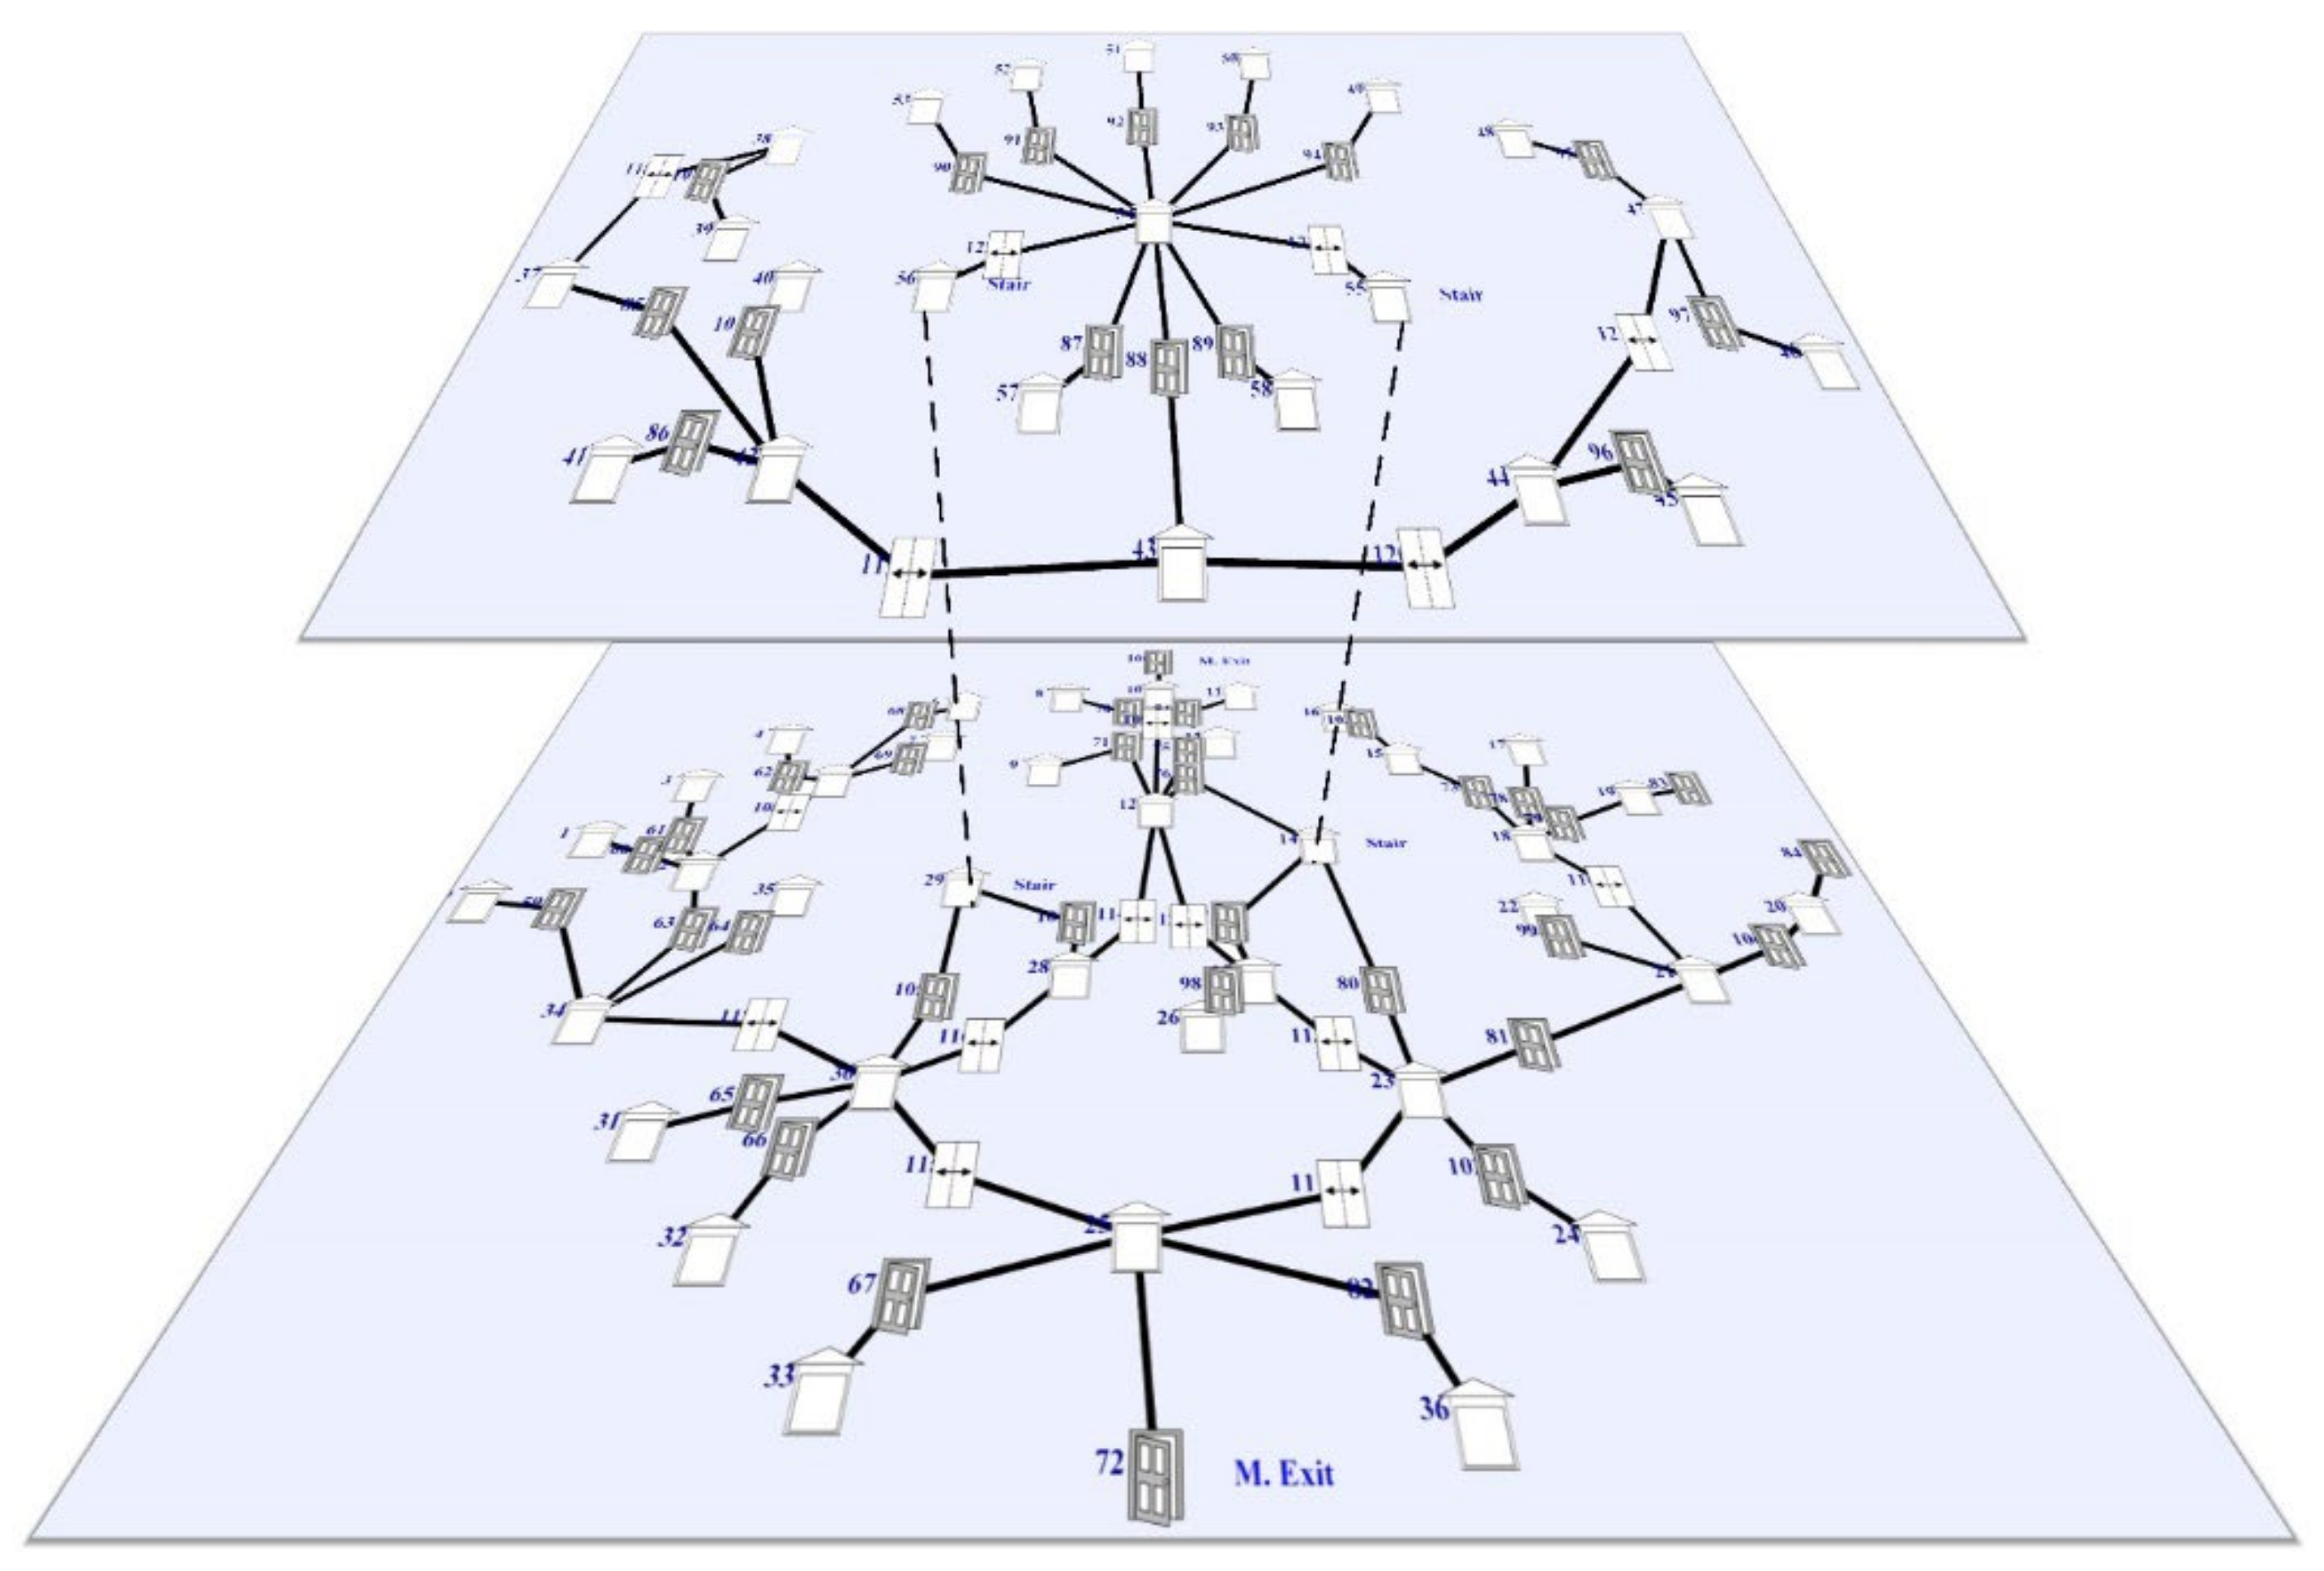
Graph Extraction from BIM
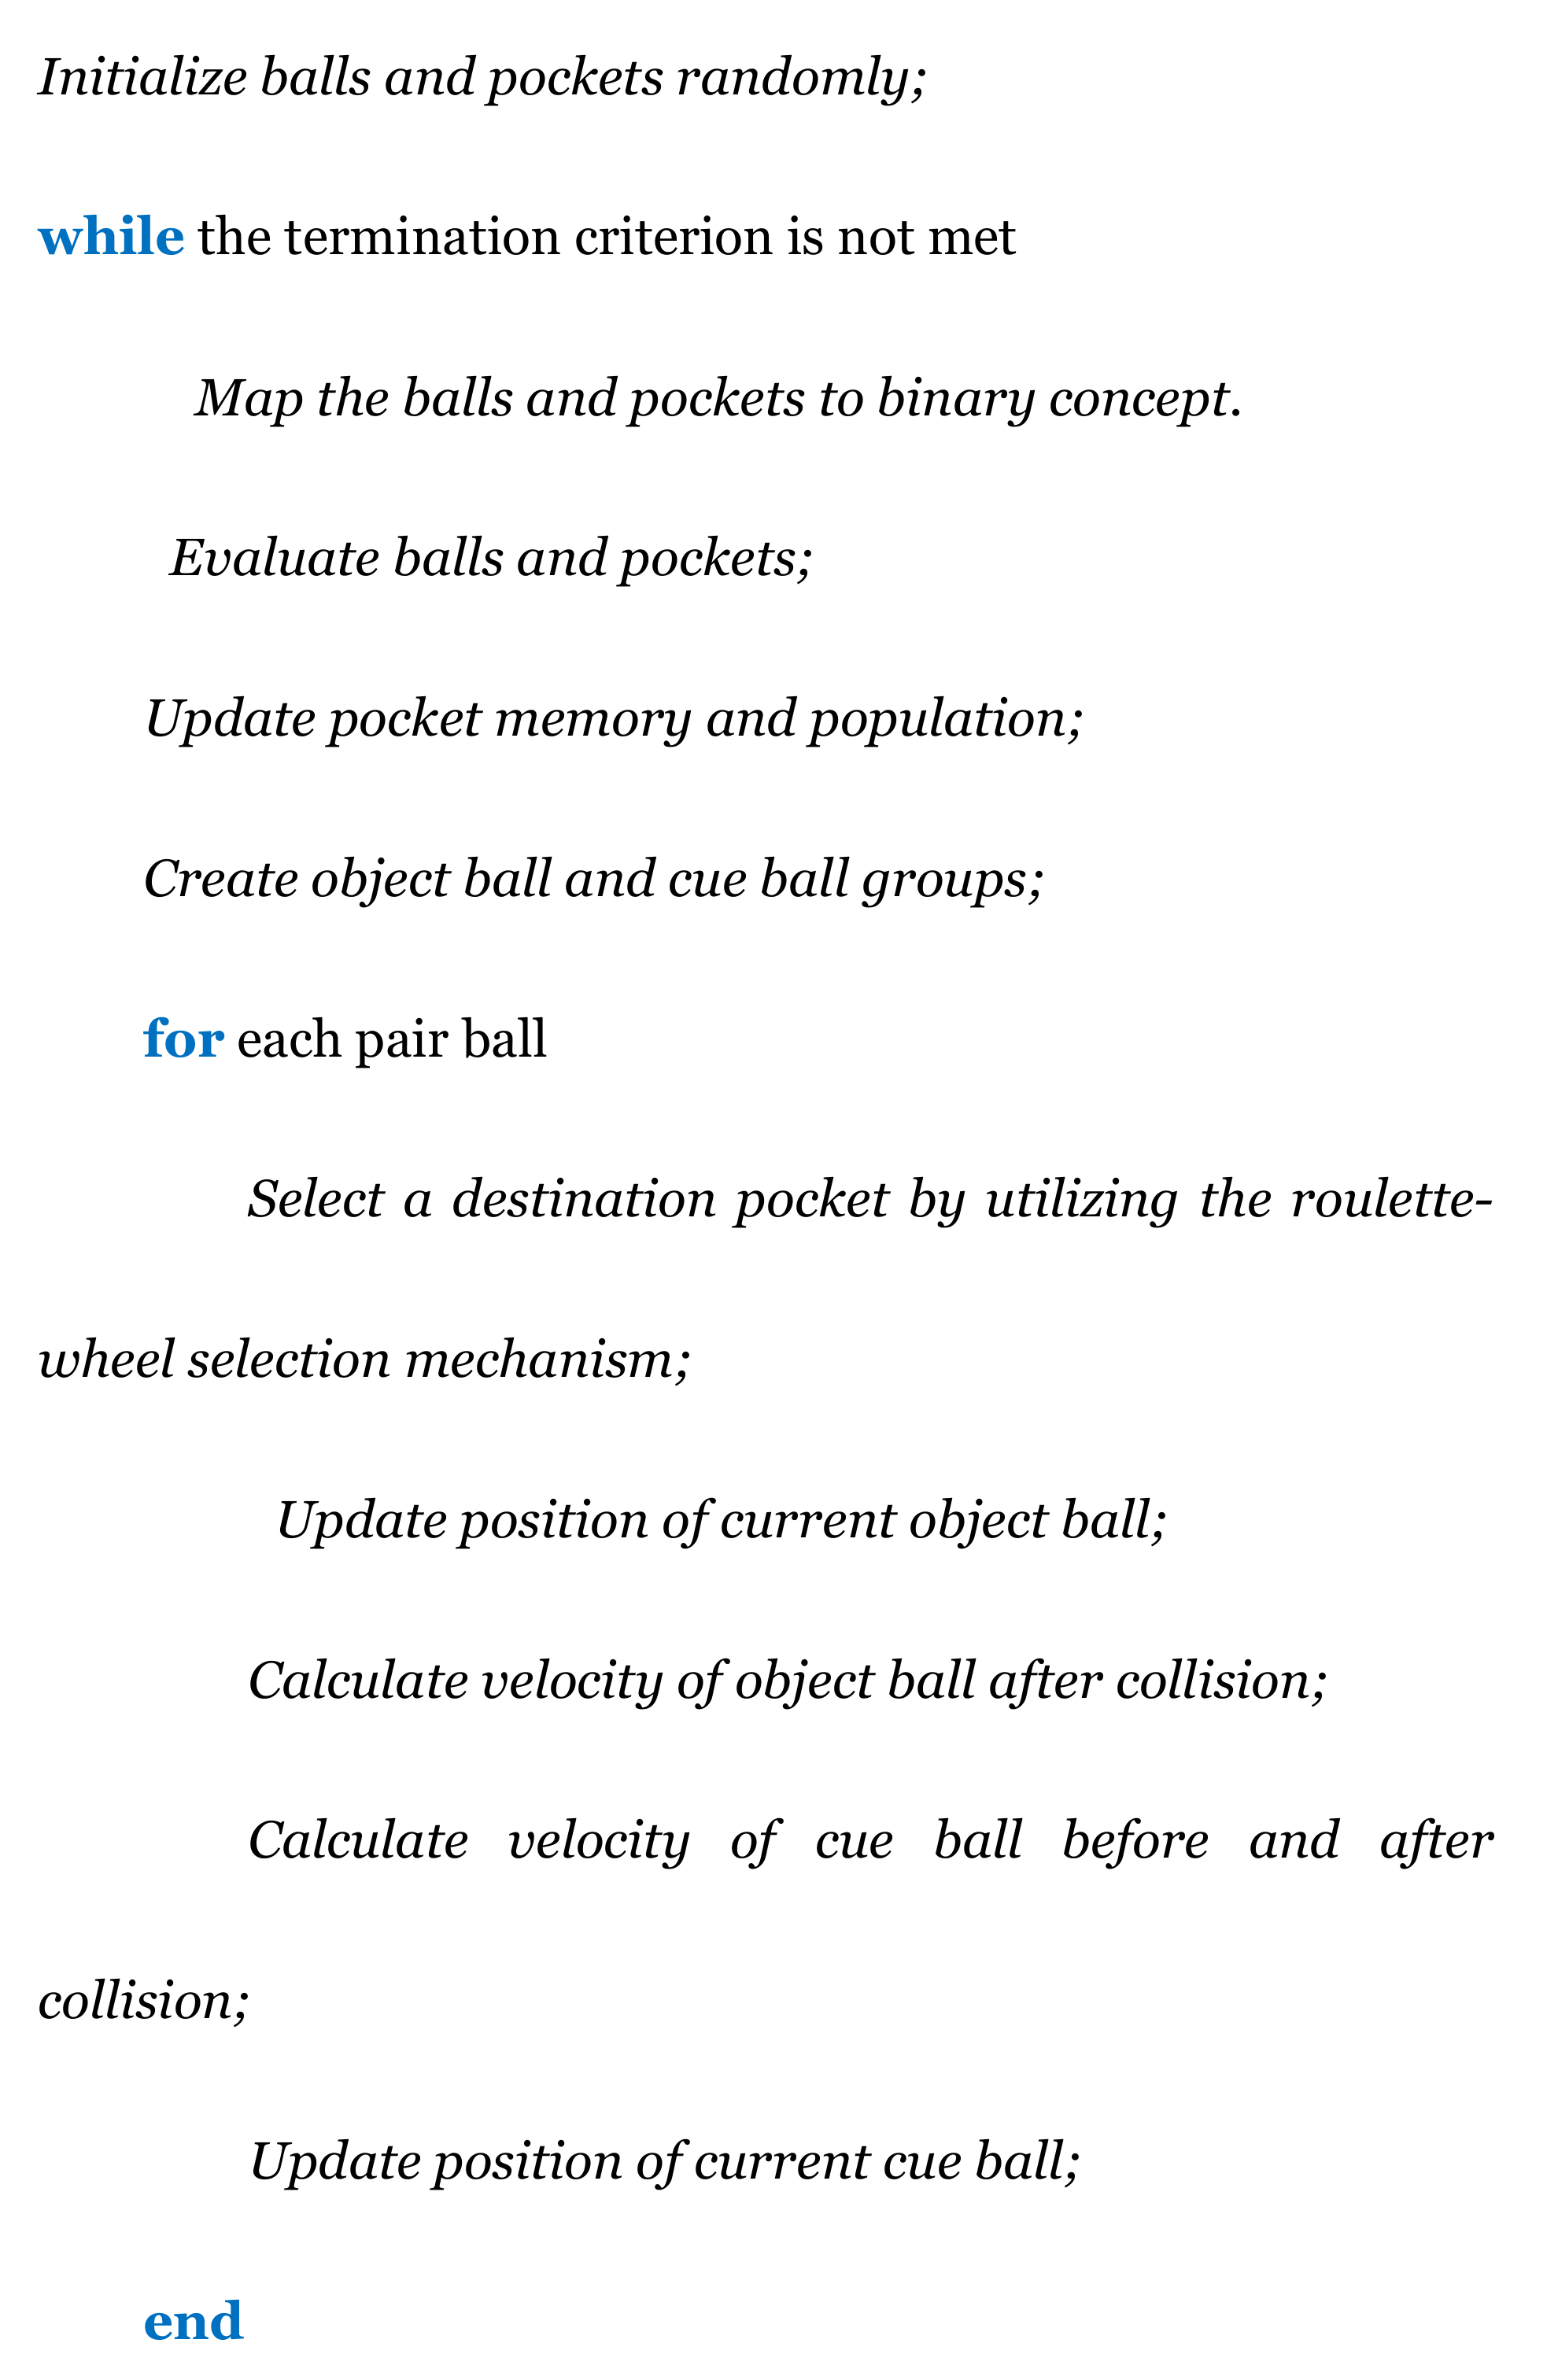
3.2.2. Optimization Phase
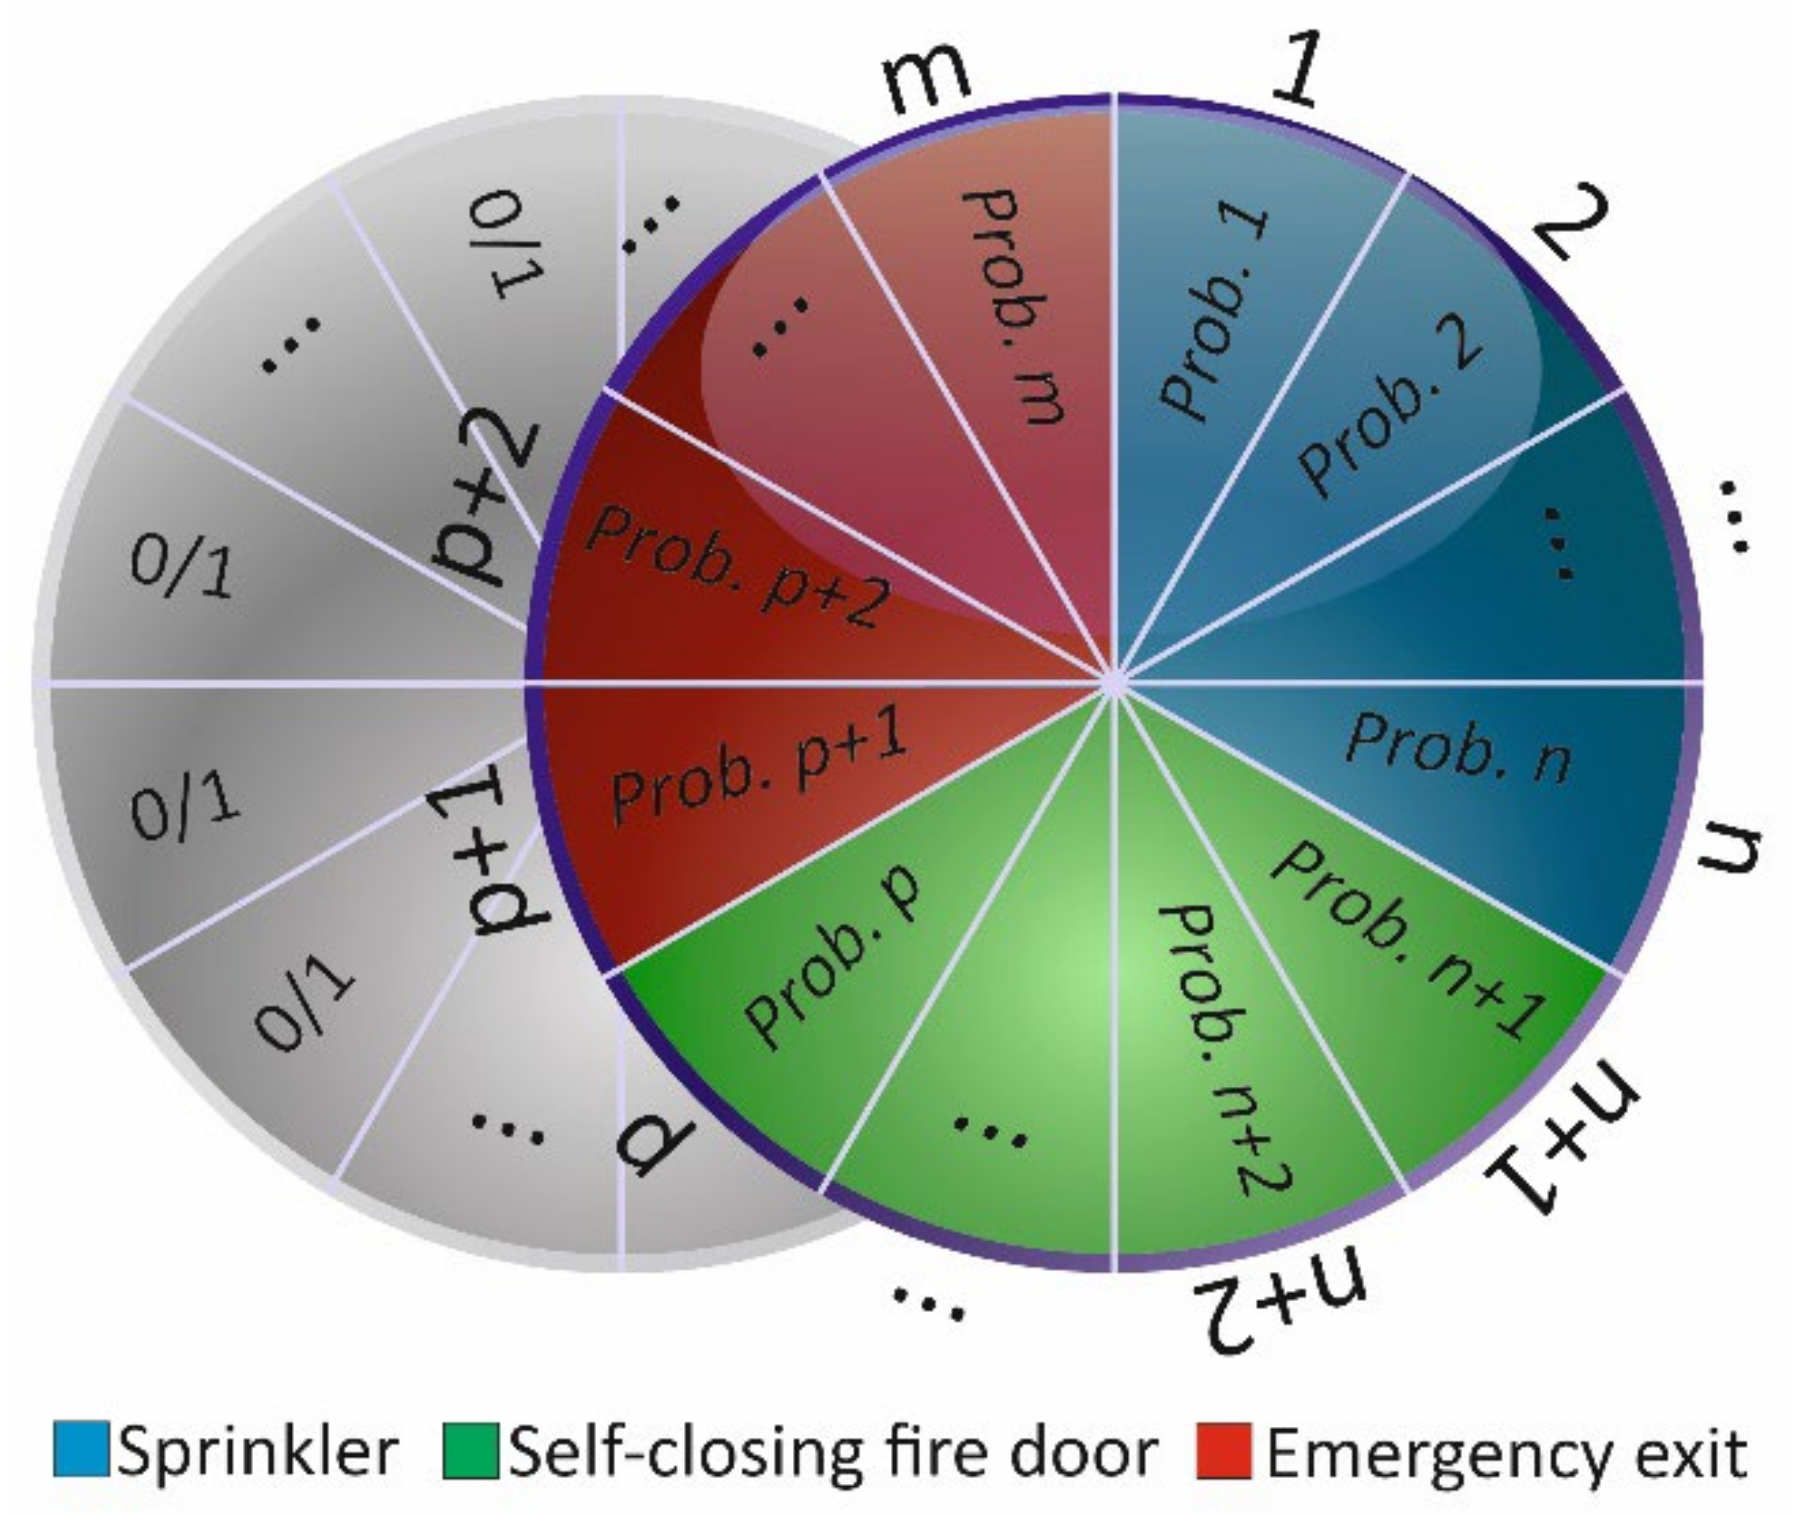
Optimization Mechanism
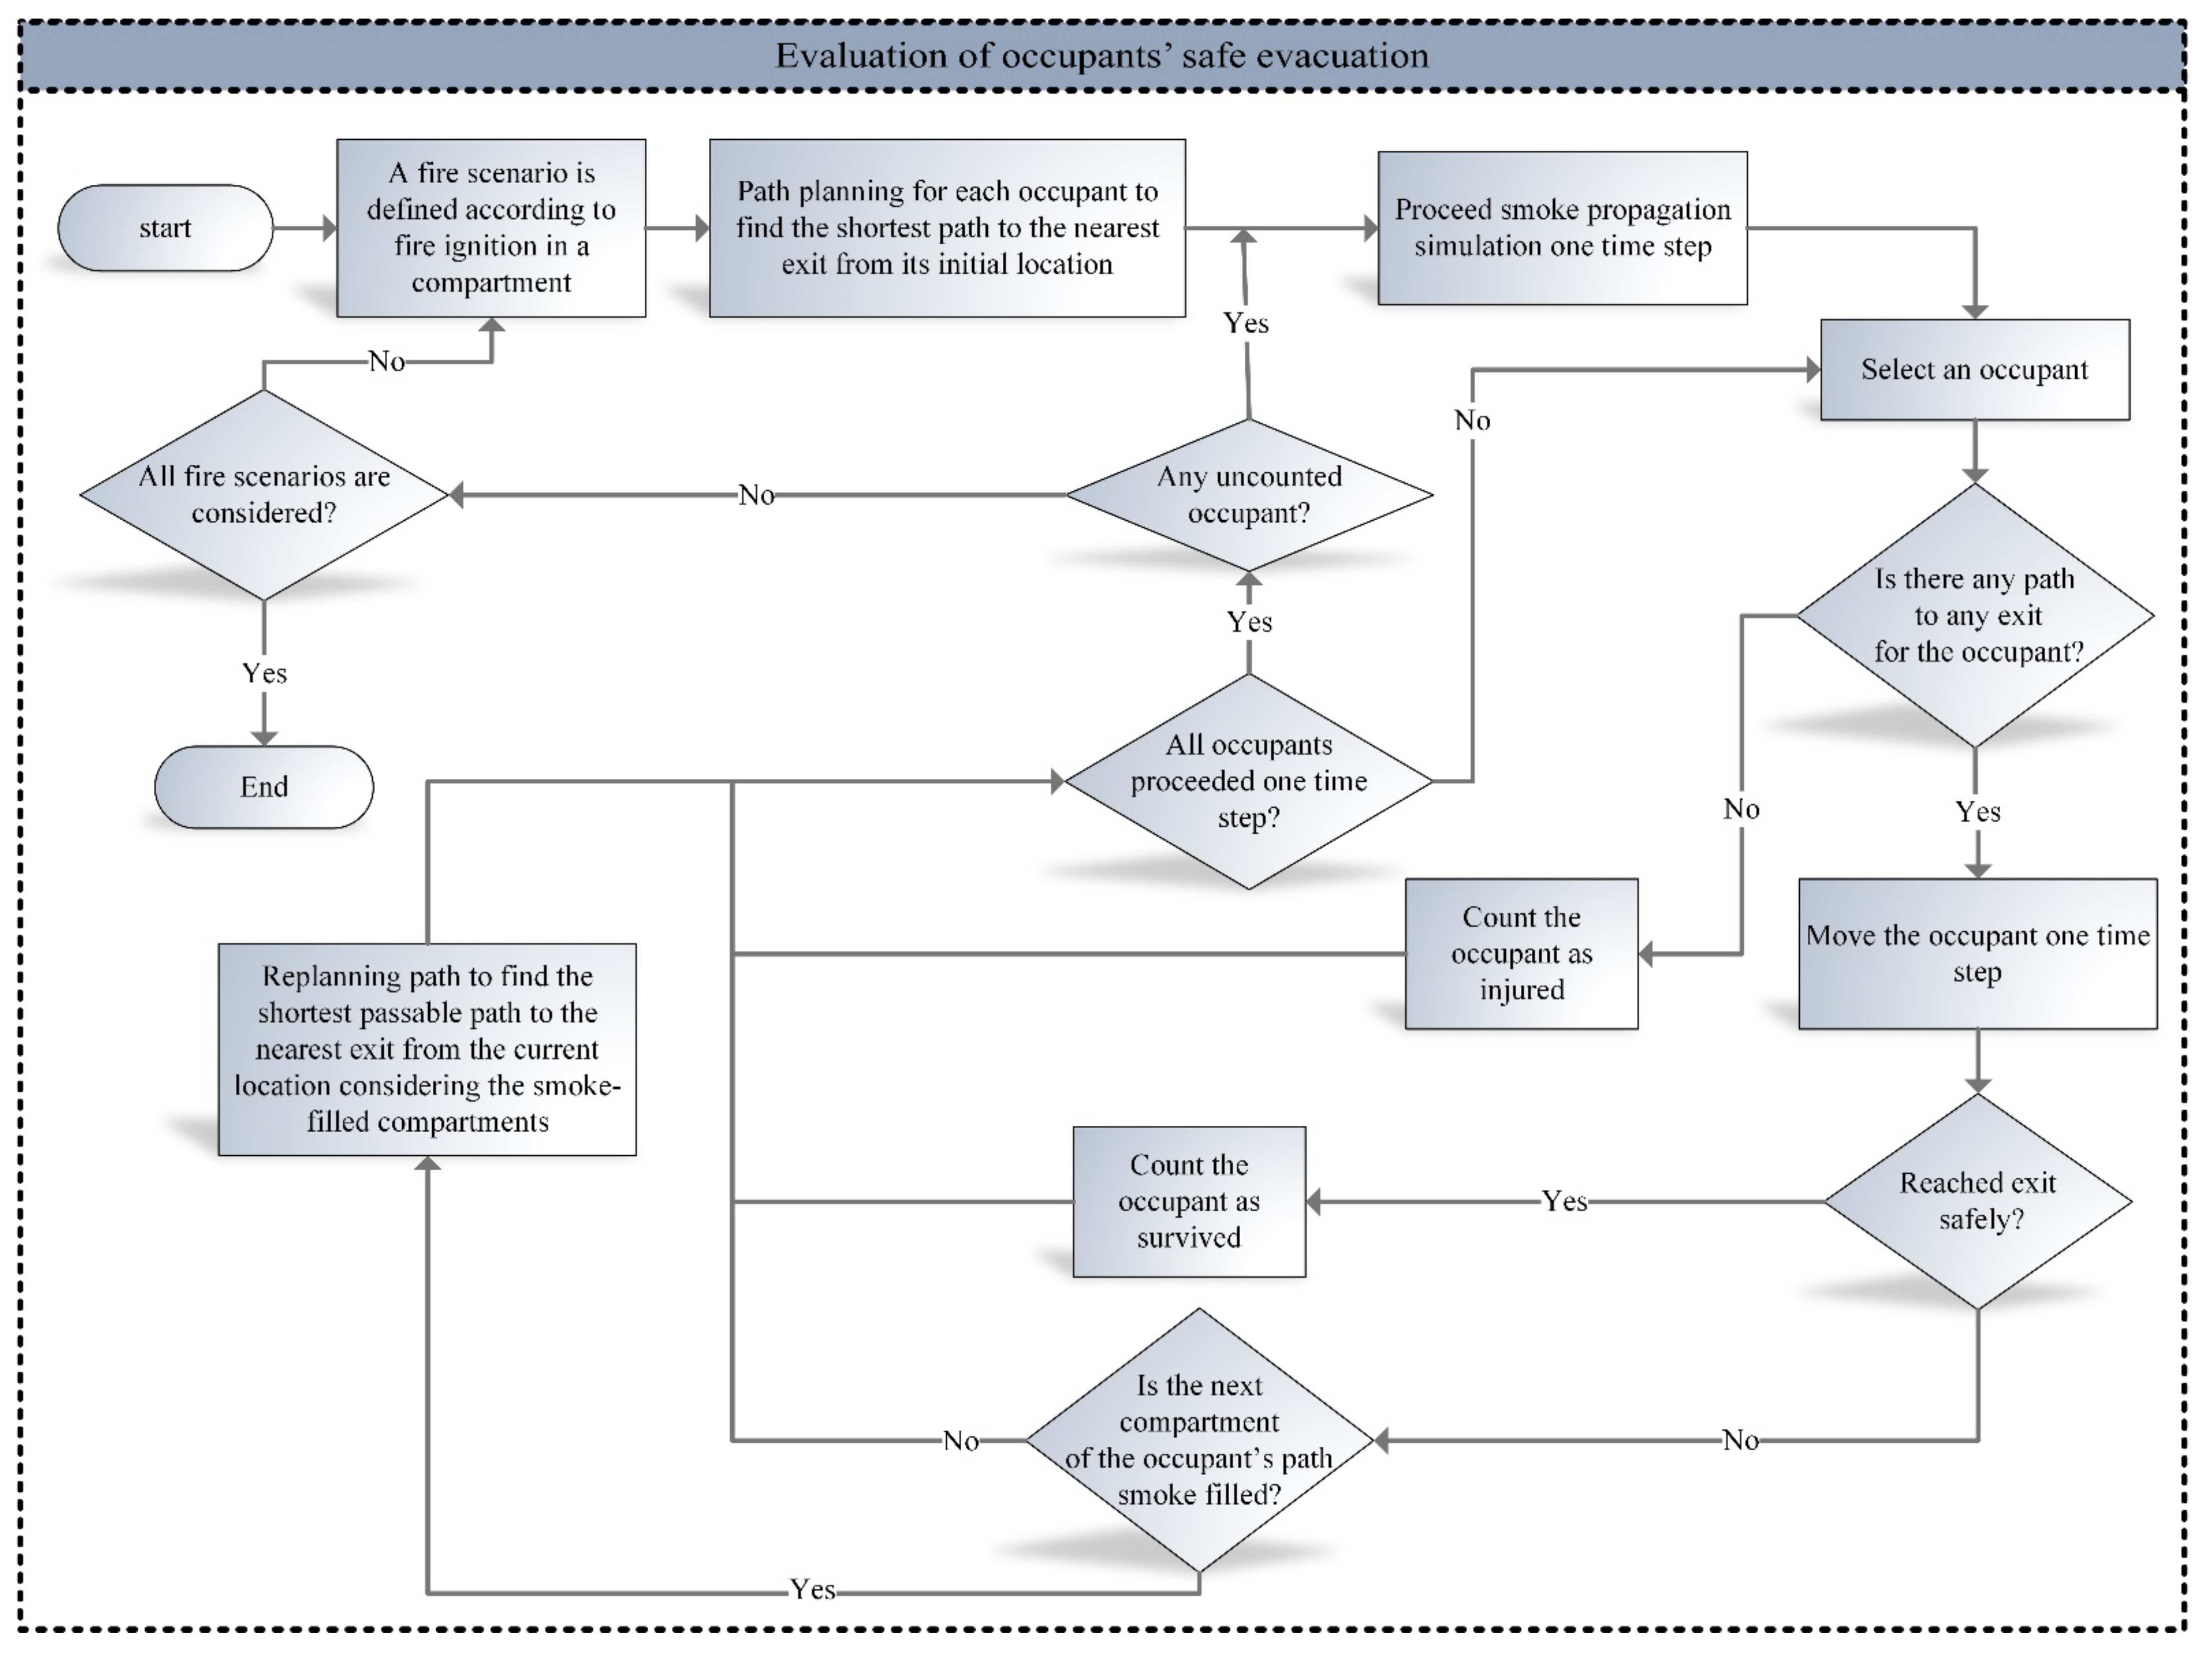
Evaluation of Occupants’ Safe Evacuation Considering Smoke Propagation
3.2.3. Decision Making Phase
3.2.4. Finalization Phase
3.3. Assumptions Made in the Proposed Framework
- Process of occupants’ evacuation and smoke propagation are updated at each lead time, which is considered 0.5 s and 1.5 s for the hospital building and the residential building respectively.
- When occupants try to pass an entrance or passage that is not wide enough, they are stuck in queues and the required time for each occupant to pass a queue depends on the entrance or passage width and the density of occupants in there, which is considered in computations via equations in Table 1.
- All the doors are assumed to be open at the time of fire ignition and smoke can propagate between compartments. This assumption is particularly similar to the assumption of software packages such as CFAST.
- Costs of fire safety measures are presented in Table 3 according to the market:
- Population sizes of residential and hospital buildings for optimisation are considered 32 and 64, respectively.
4. Results
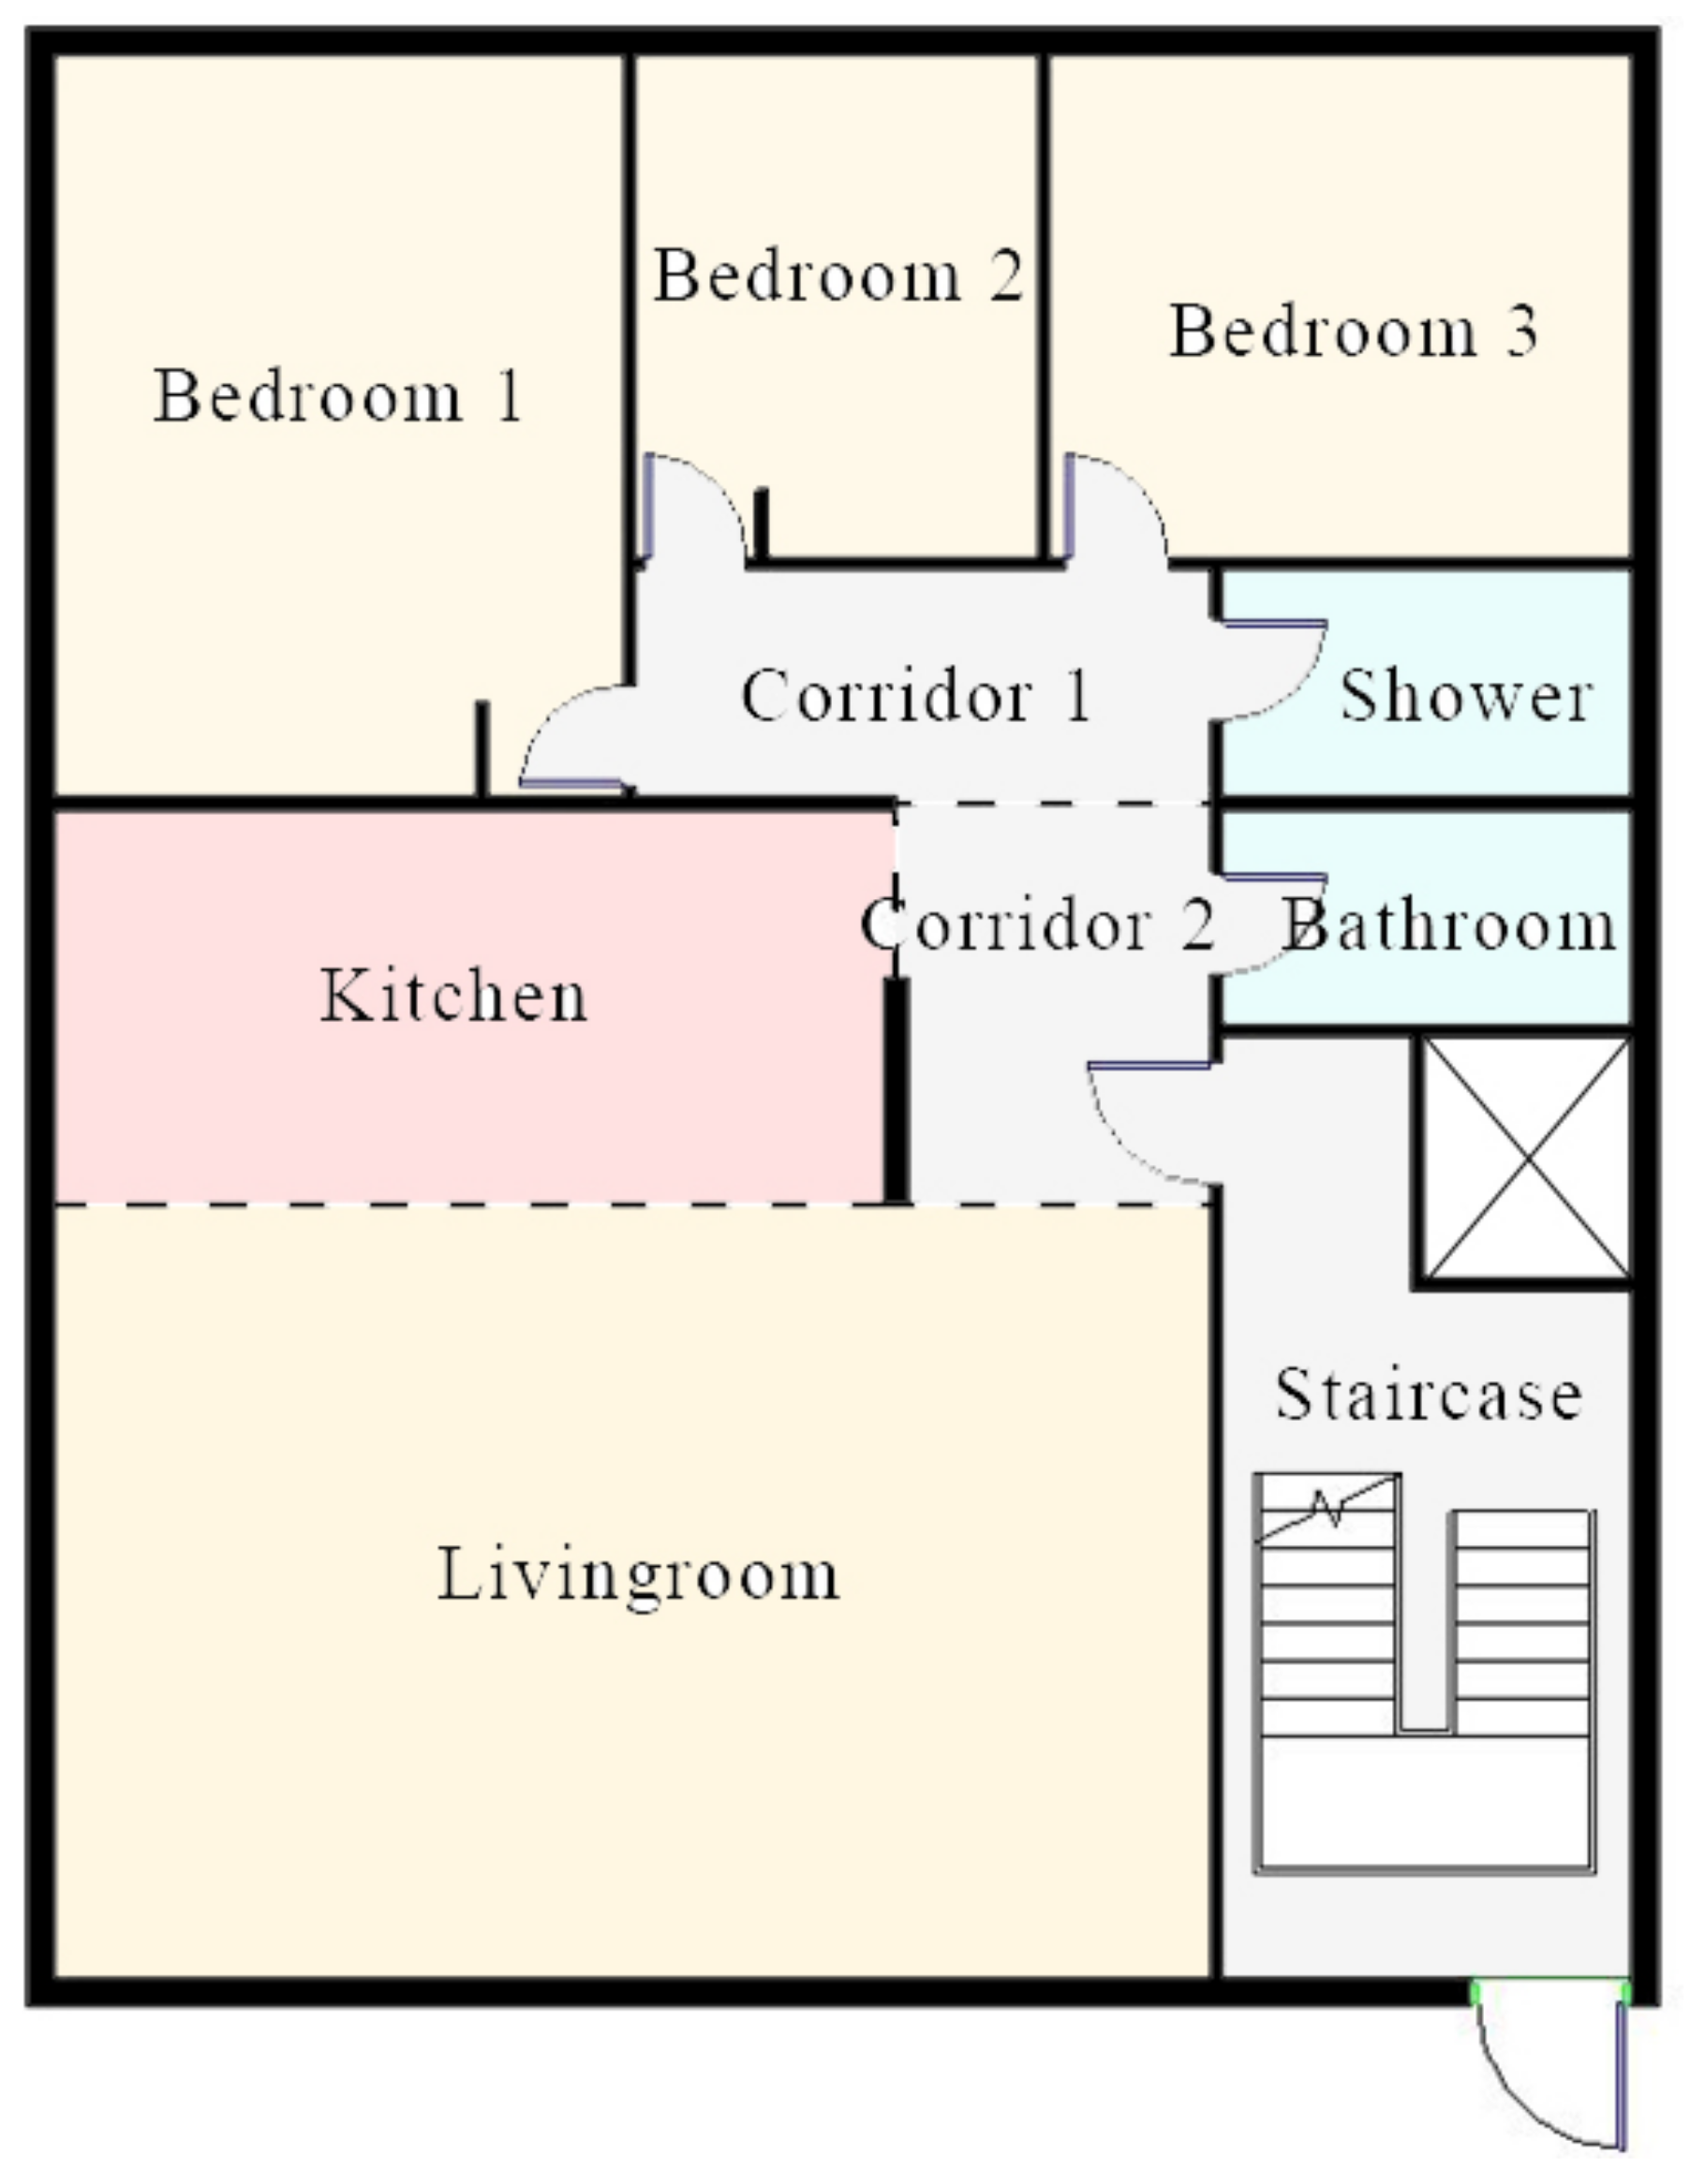
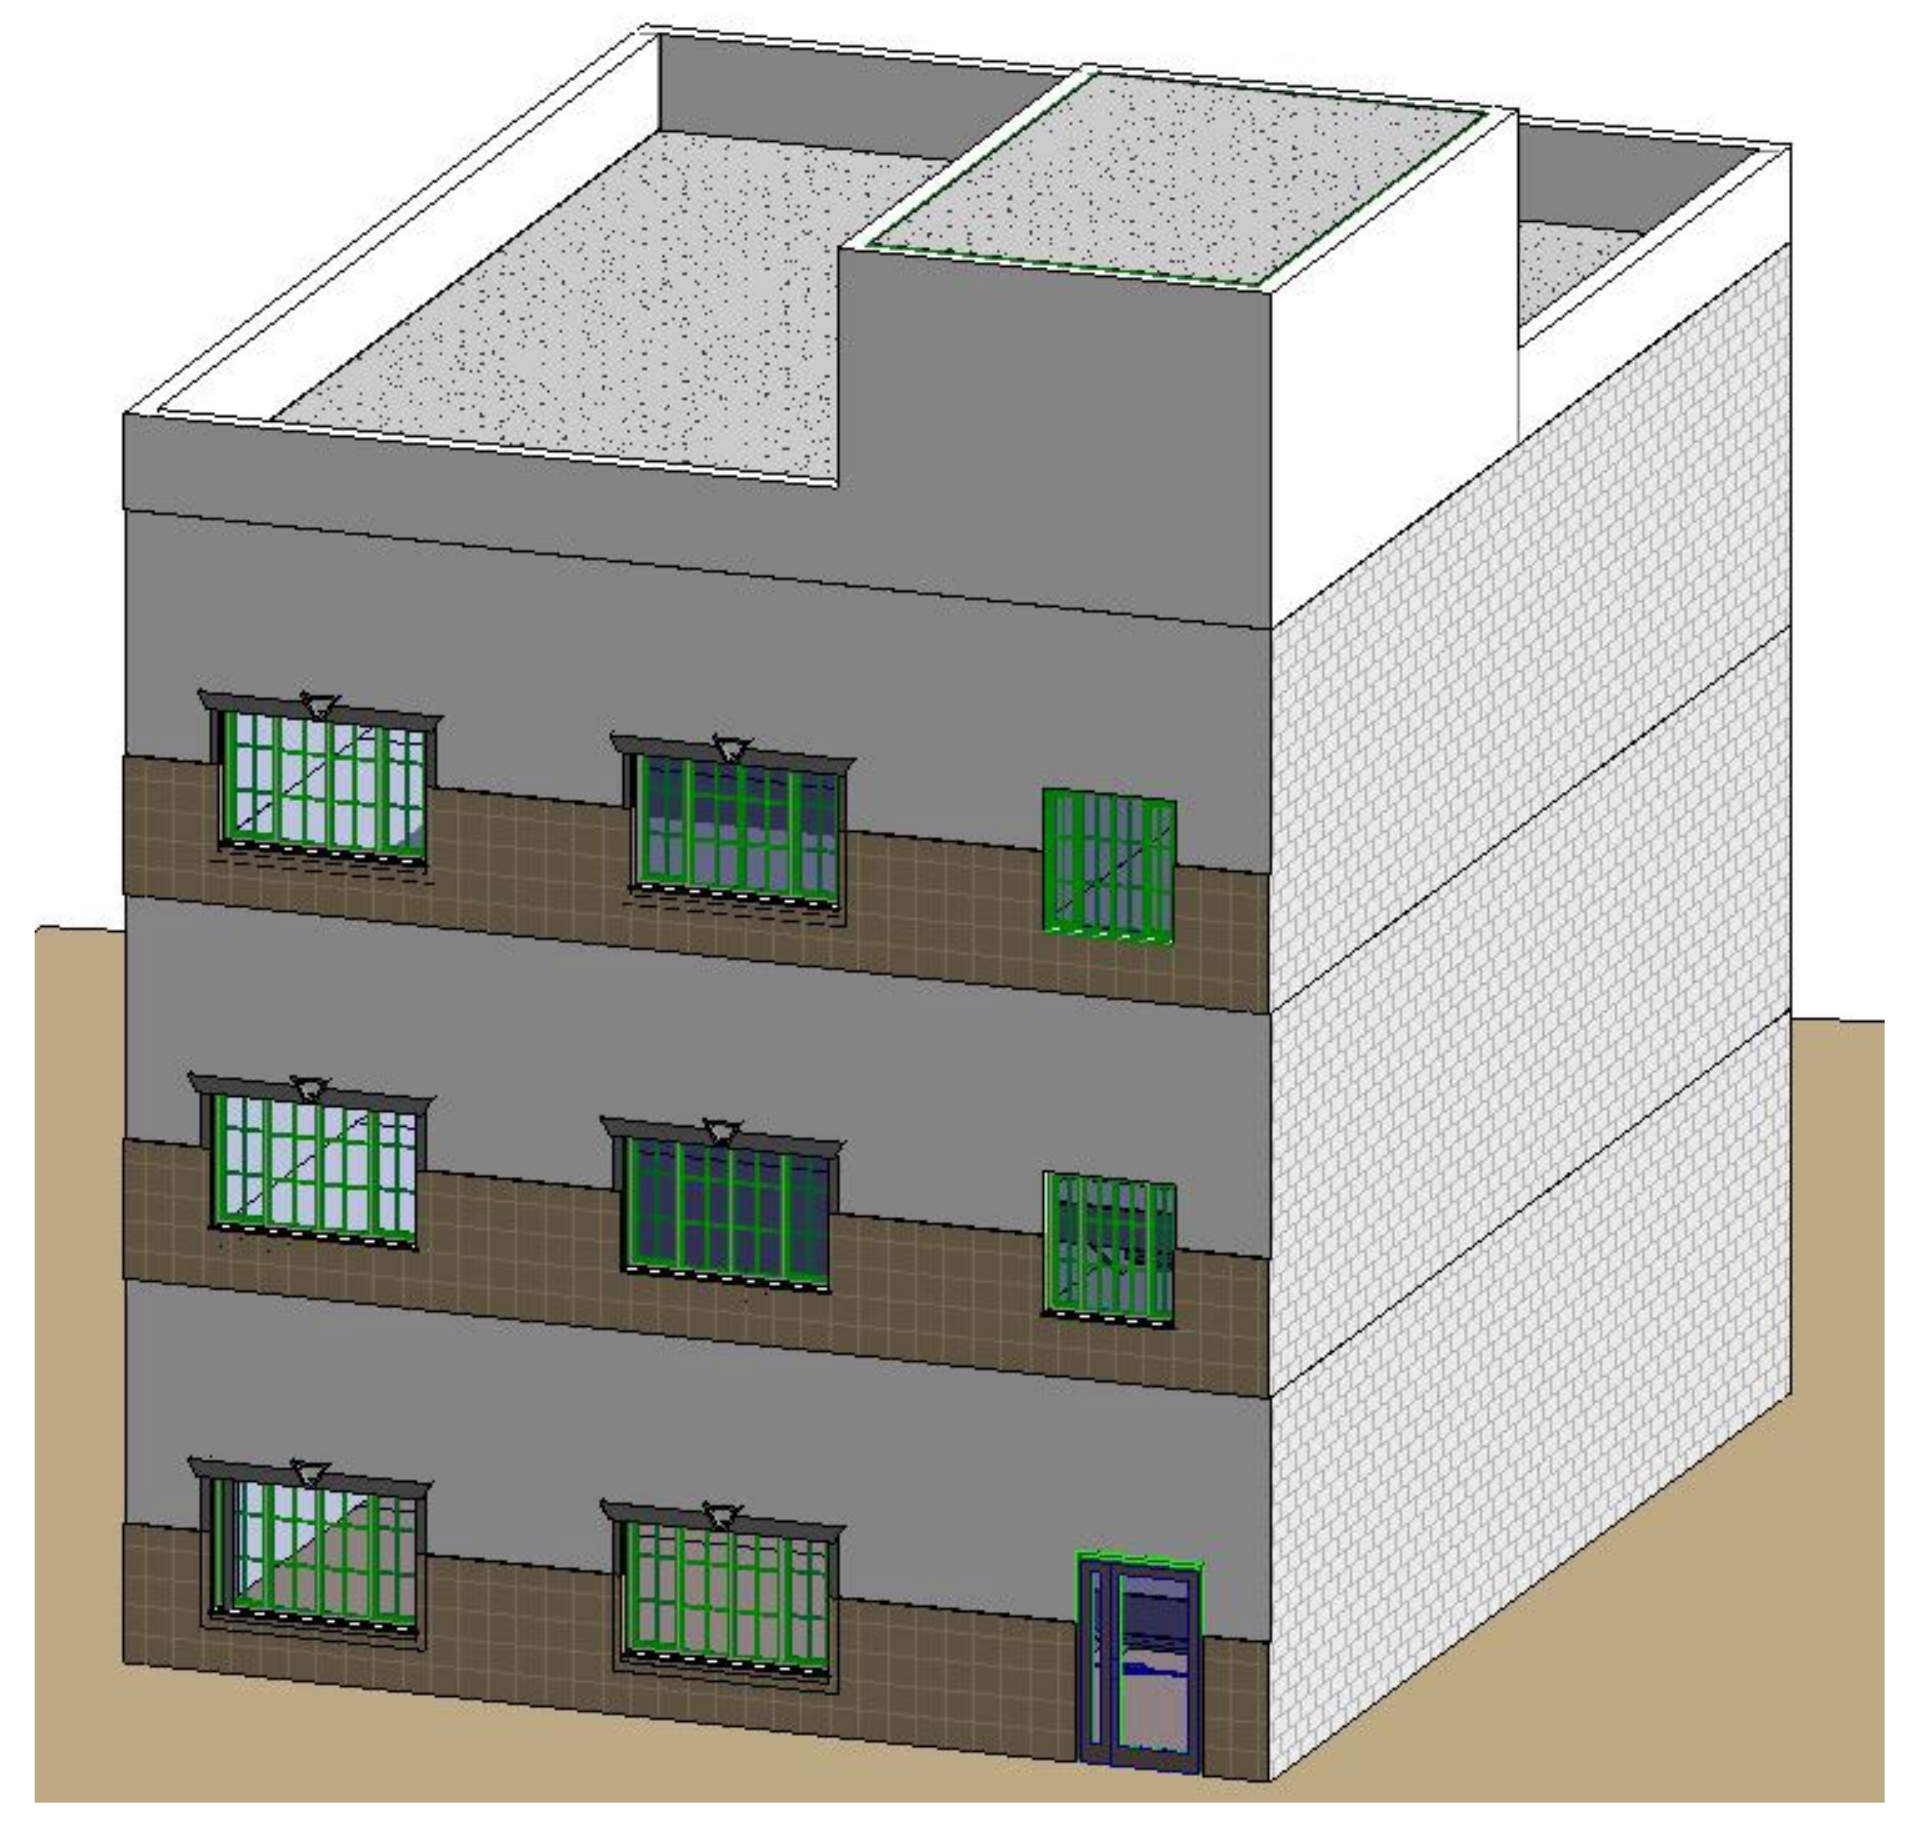
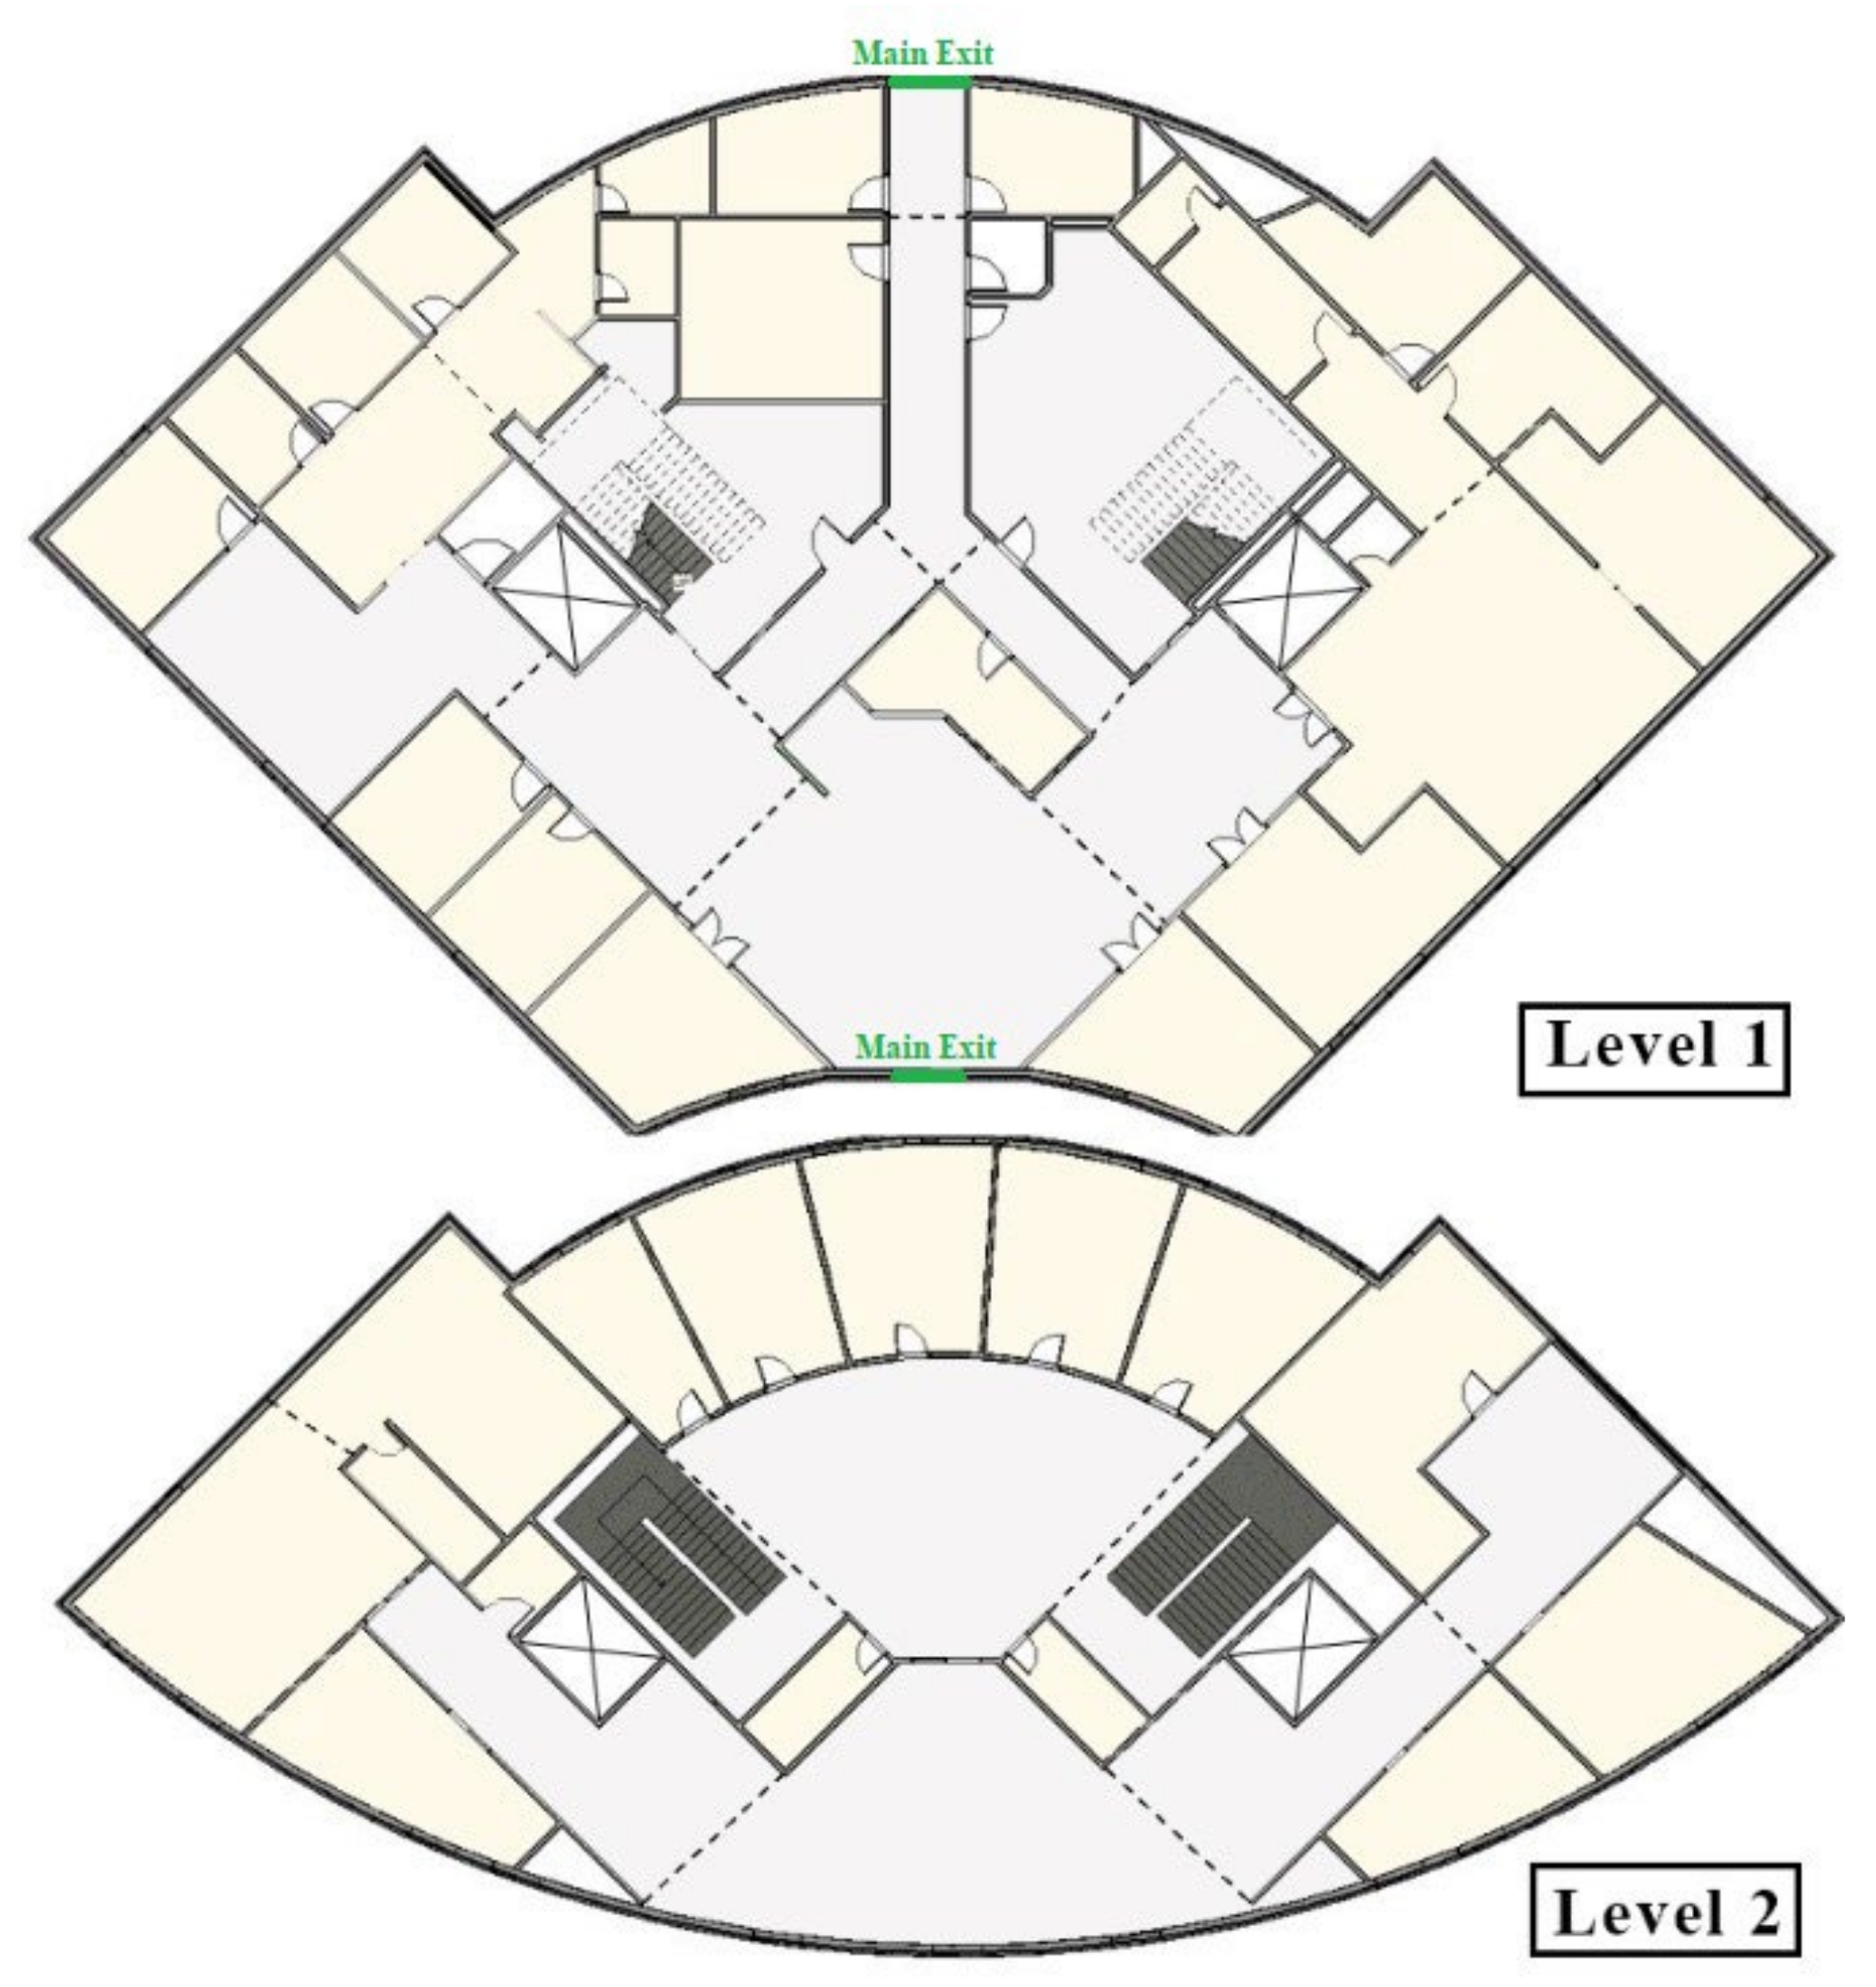
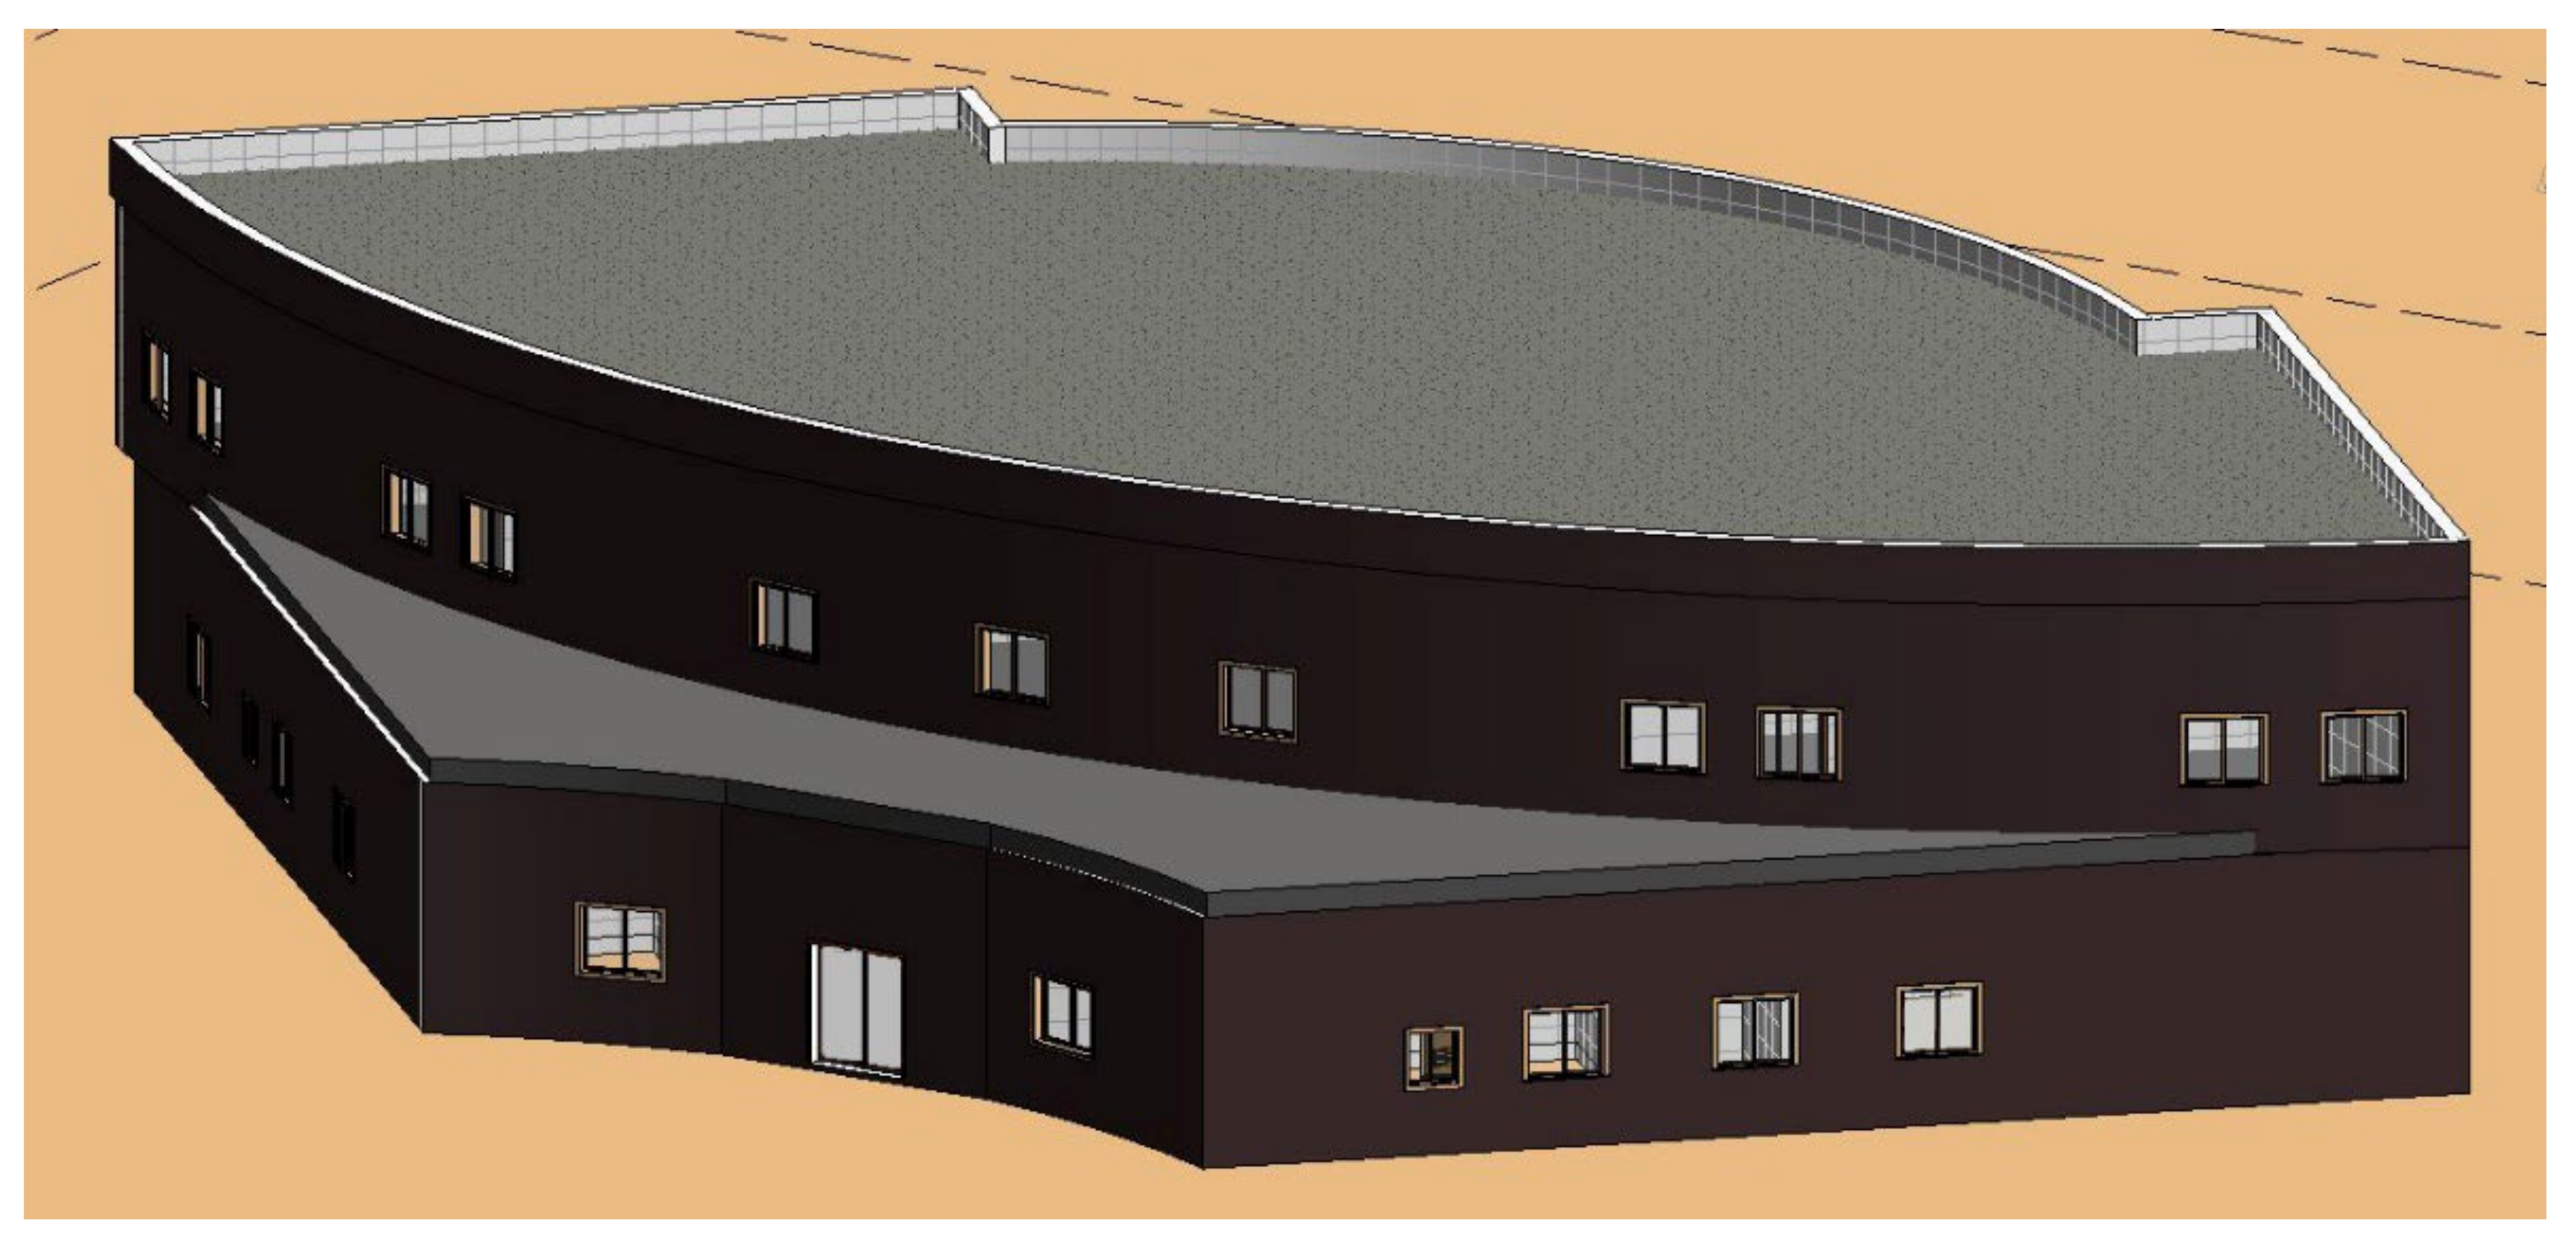
4.1. Case Study
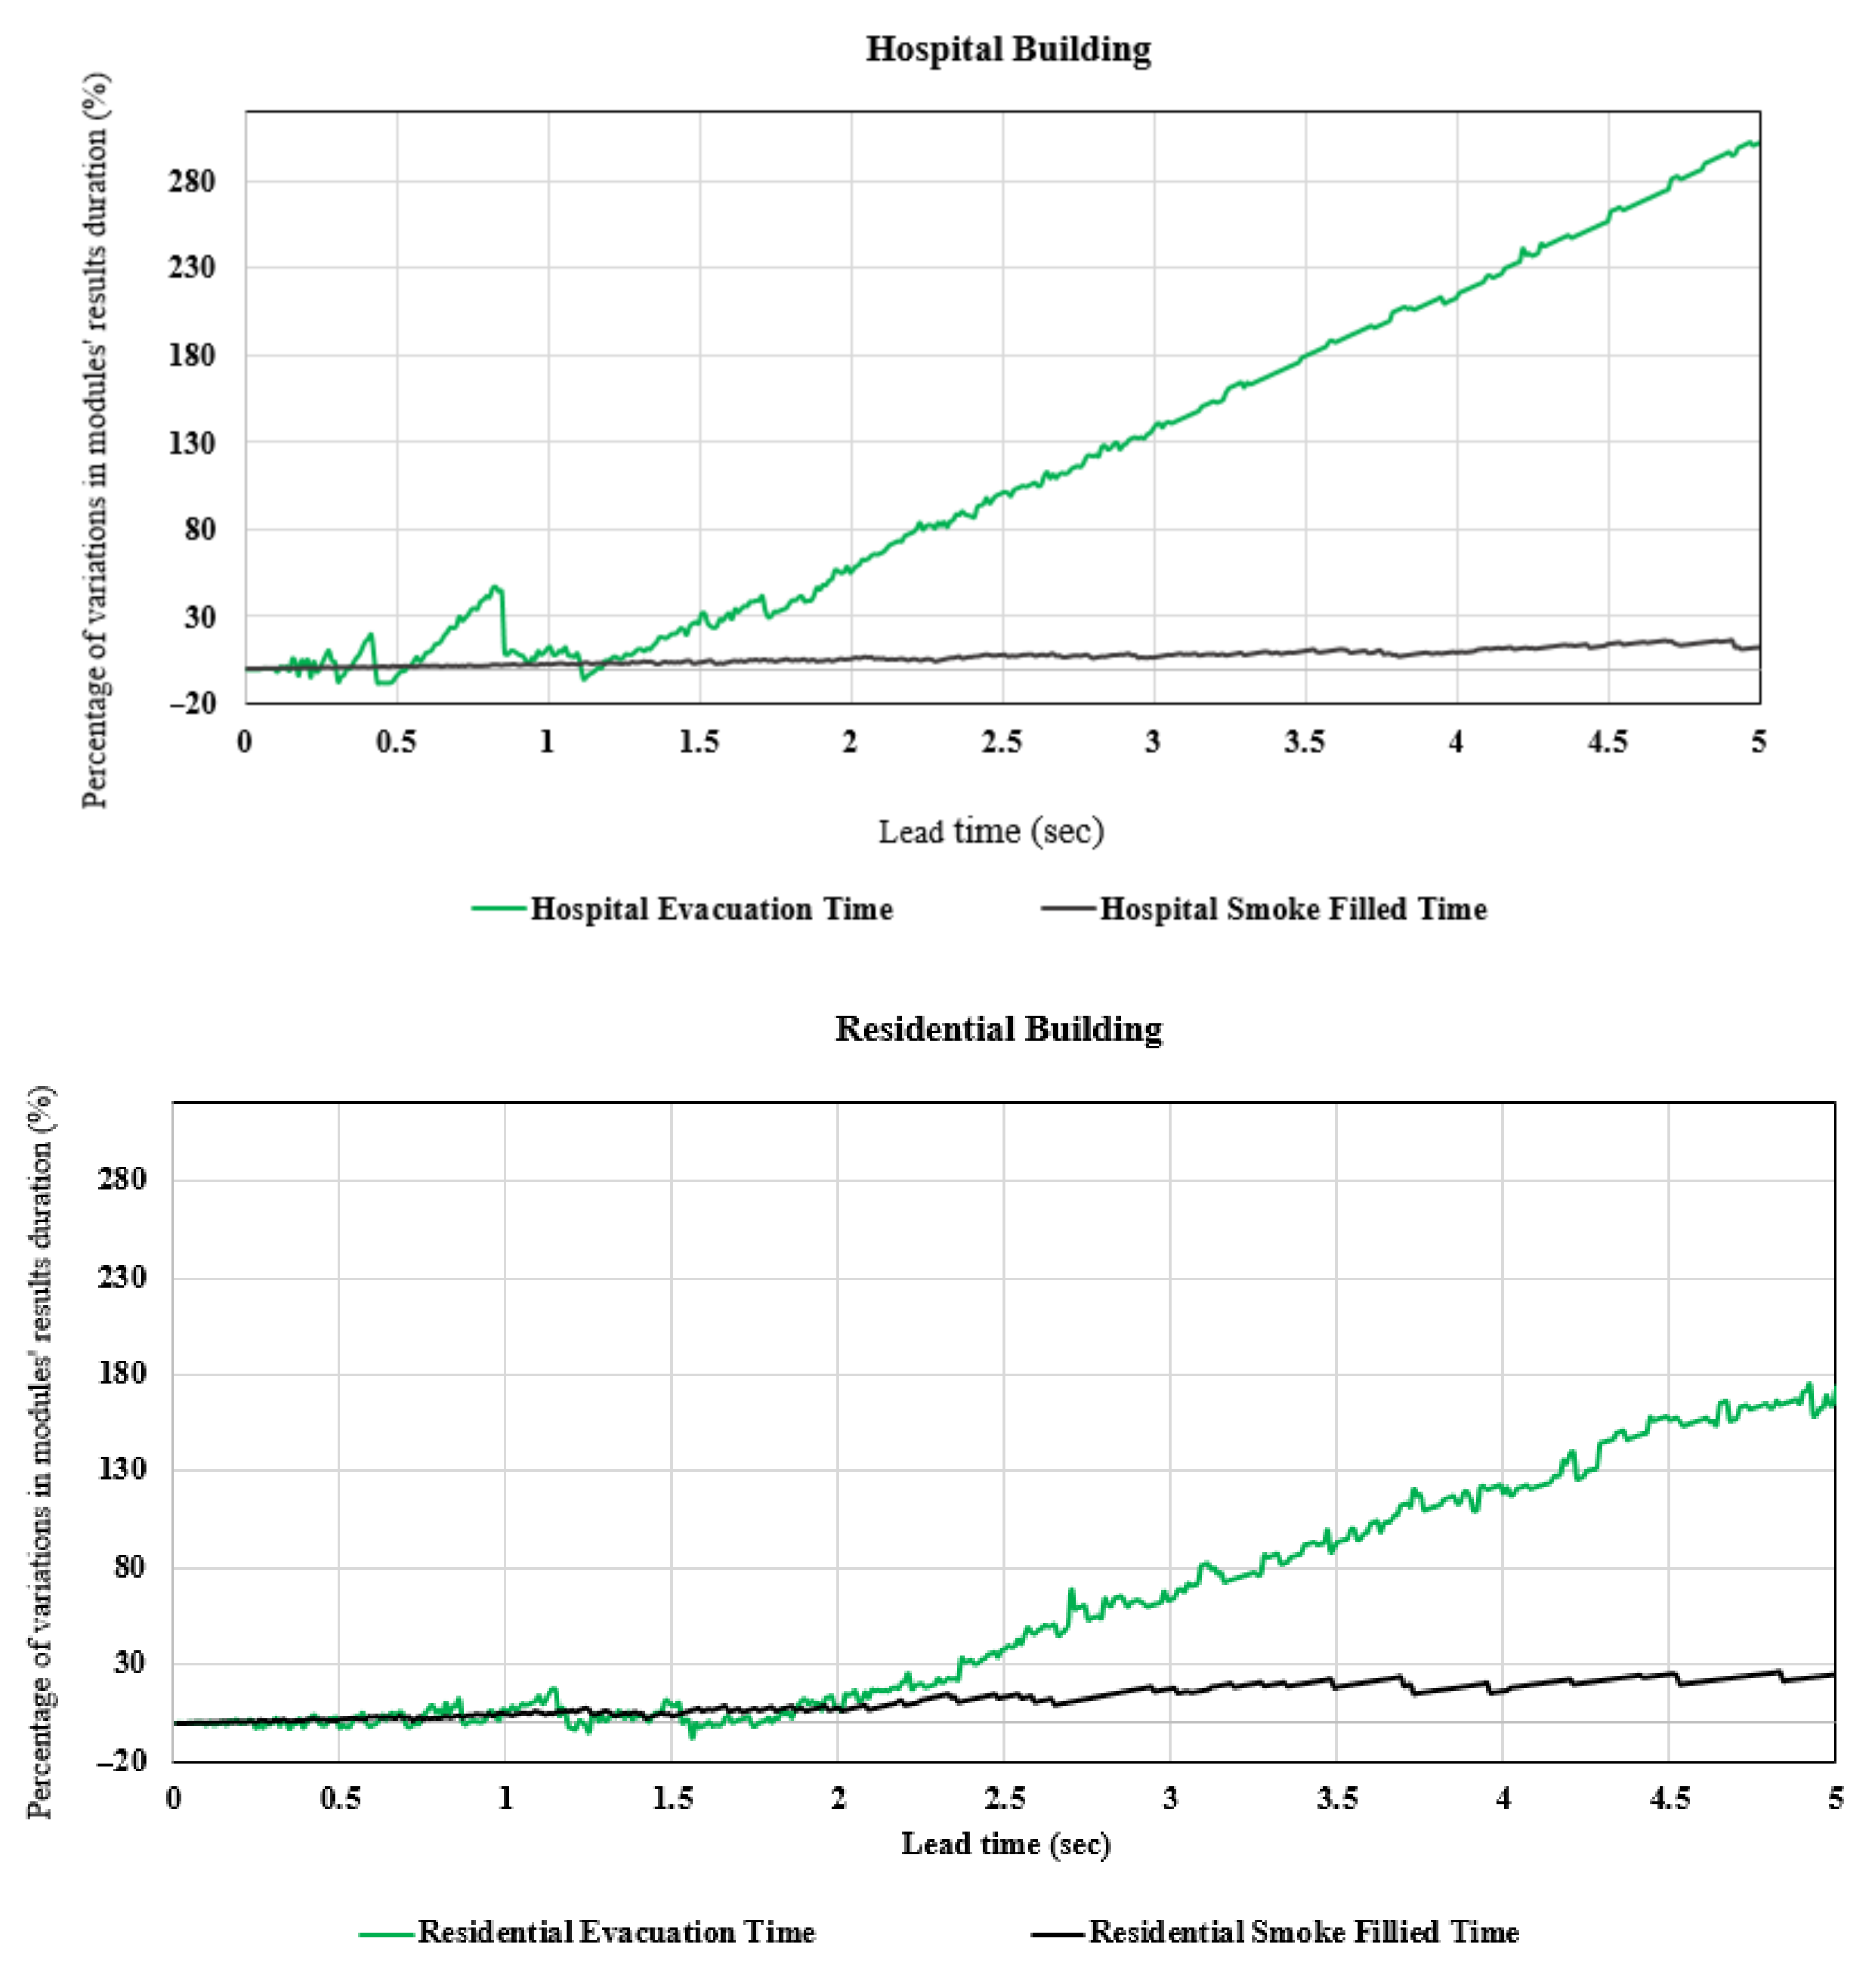
4.2. Lead Time Sensitivity Analysis
4.3. Validation
4.3.1. Evacuation Validation
4.3.2. Smoke Propagation Validation
4.3.3. BBOA Validation
4.4. Results of Applying the Framework to the Case Studies
4.4.1. Optimisation Results of Case Projects
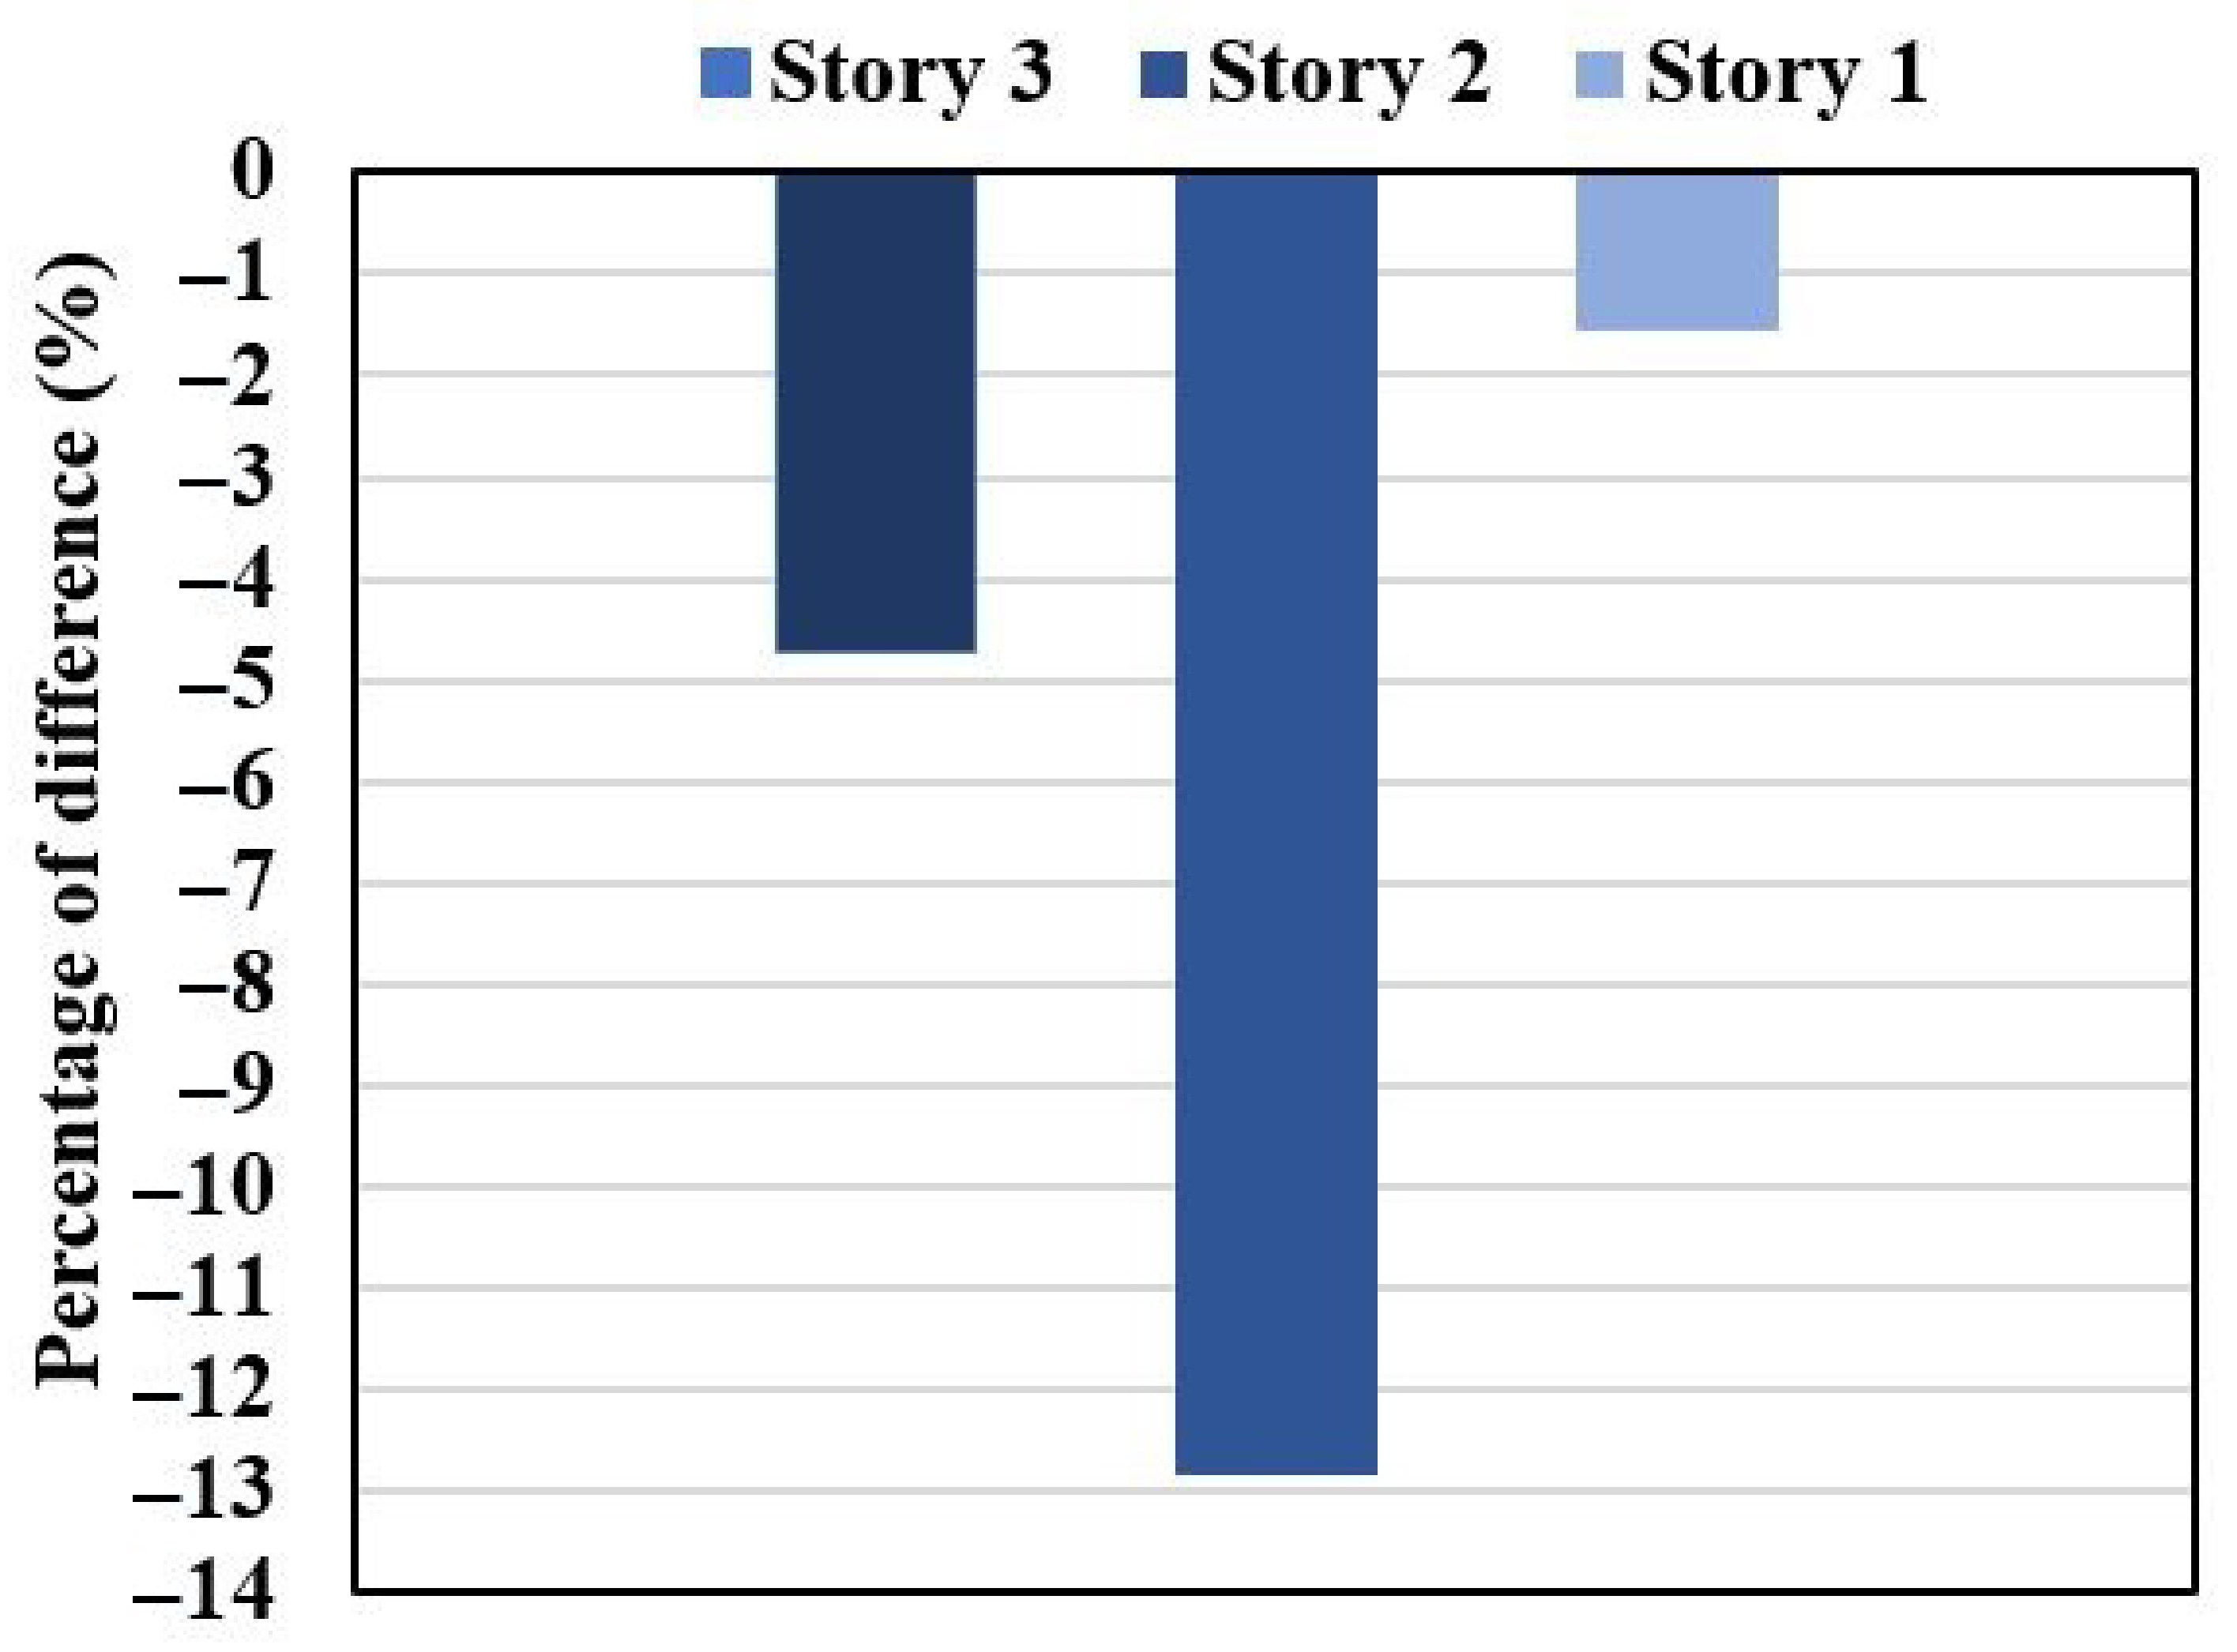
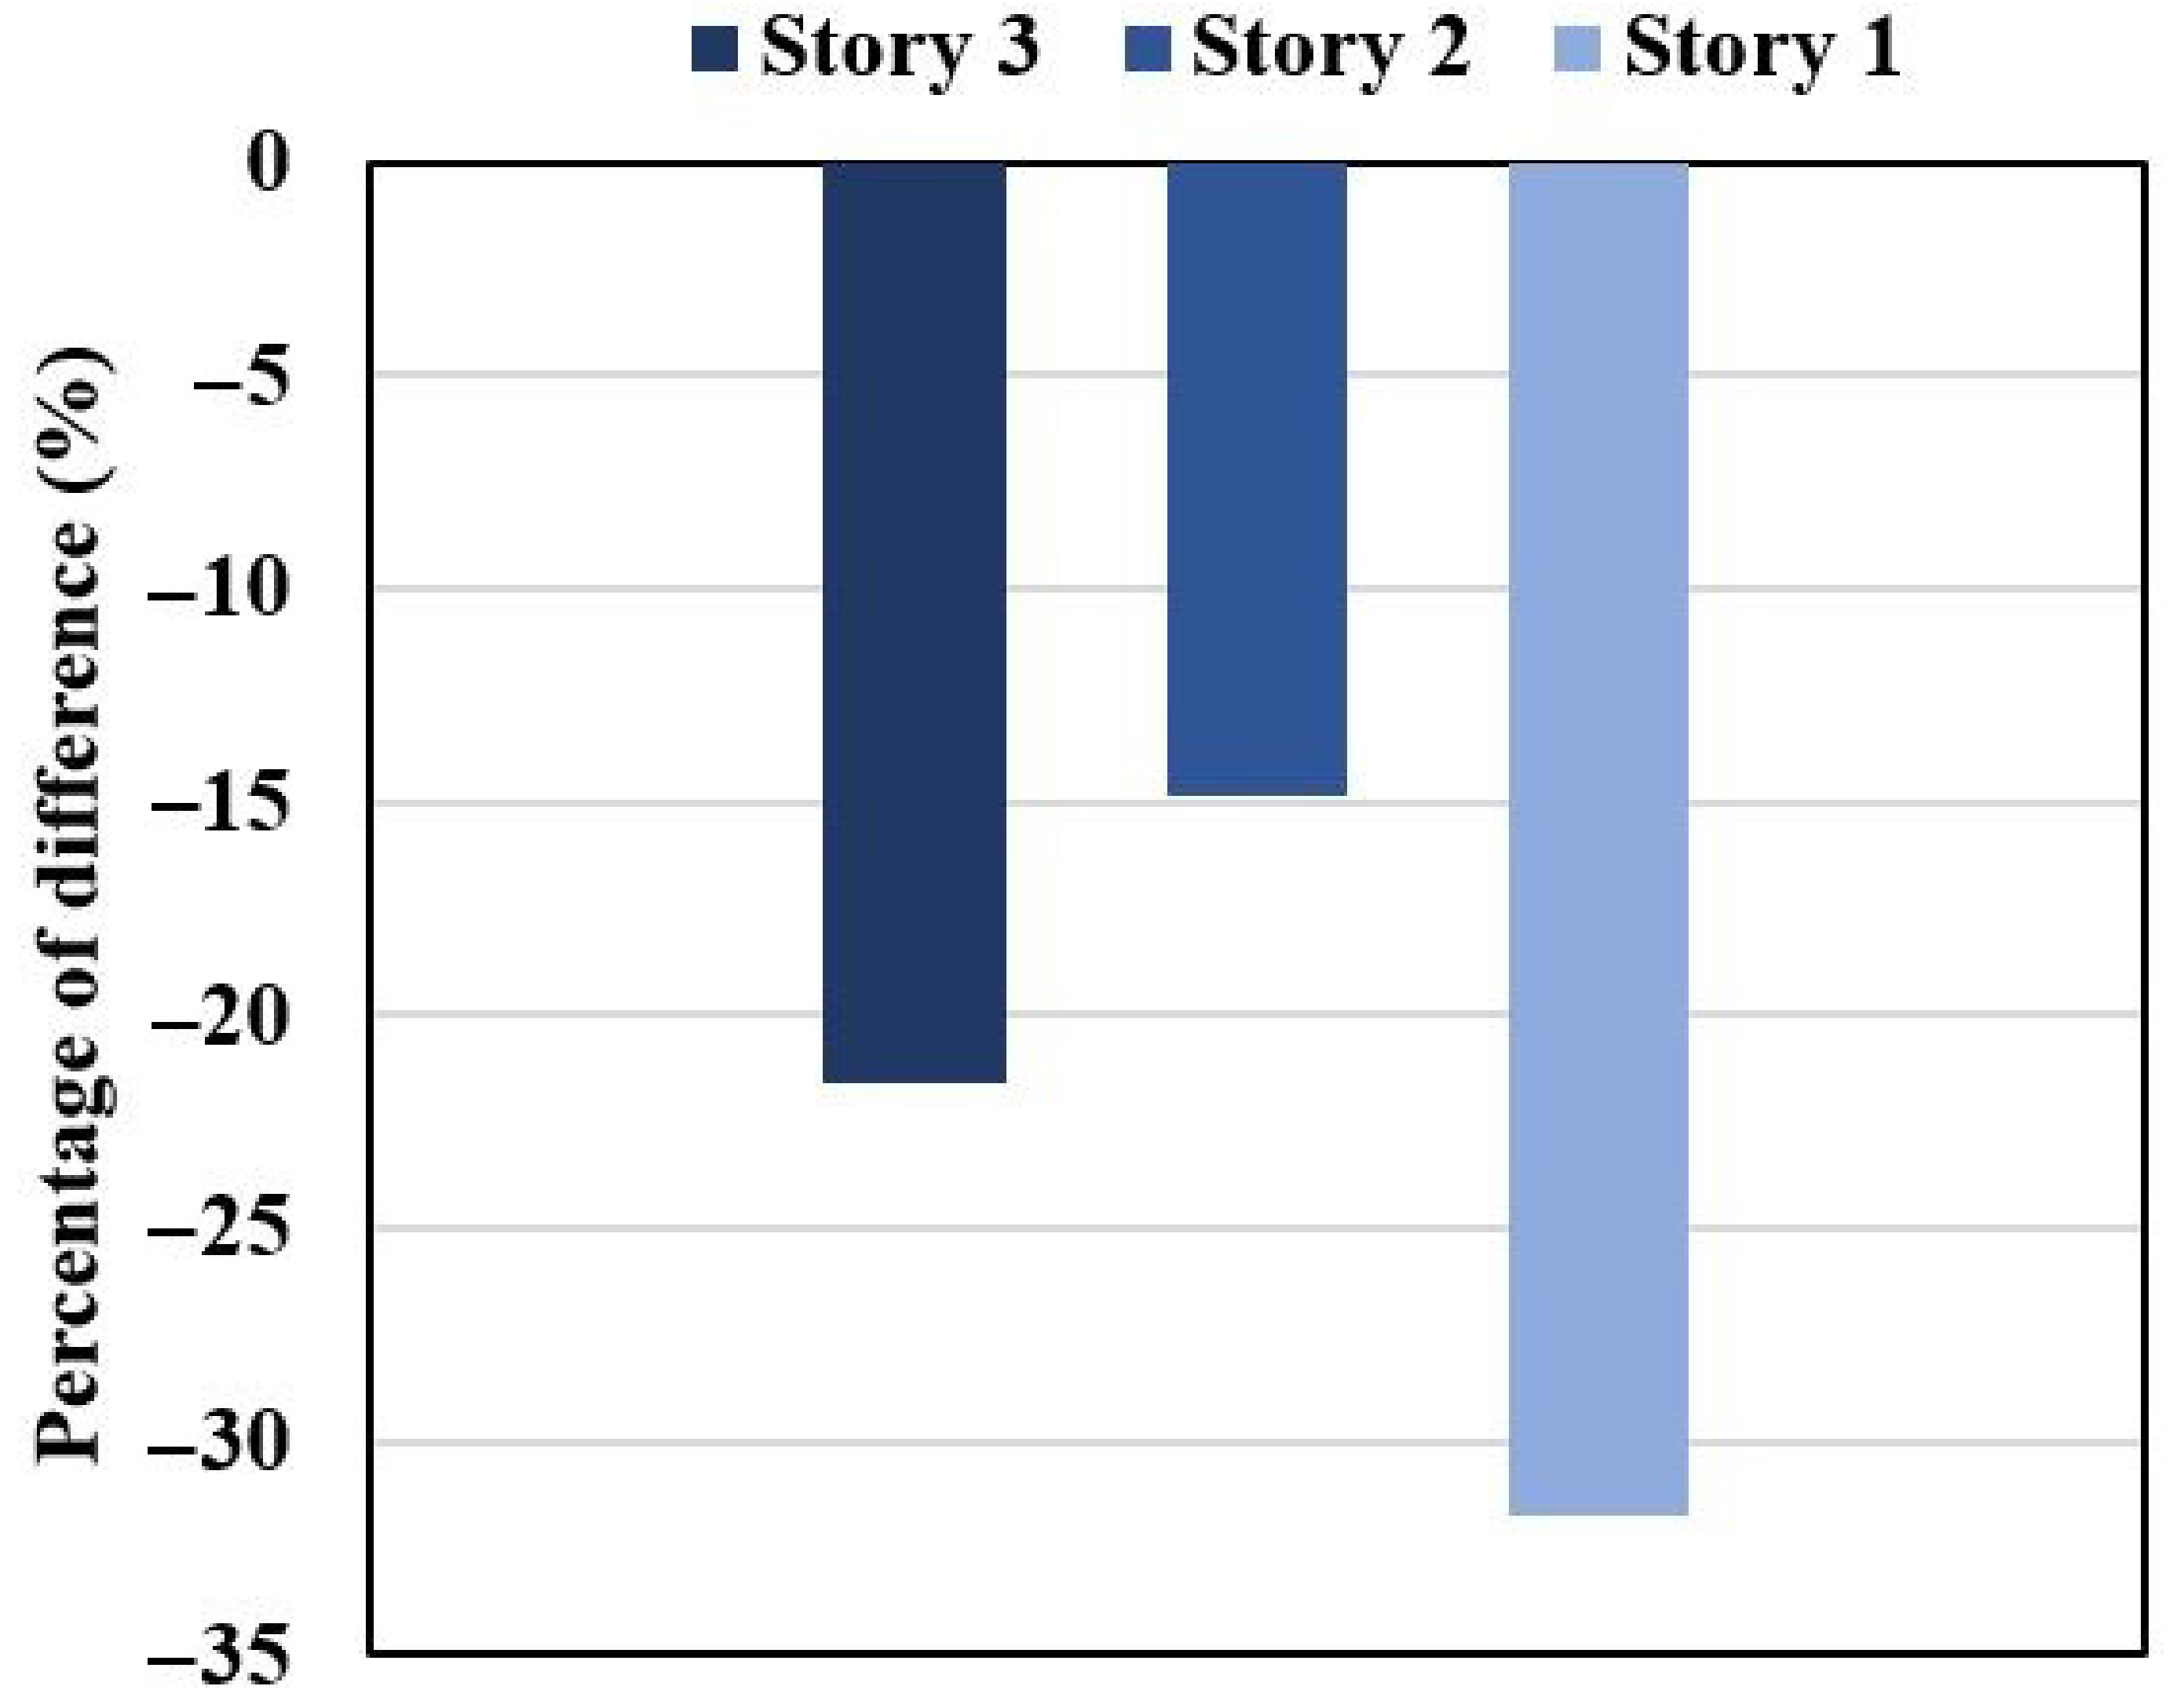
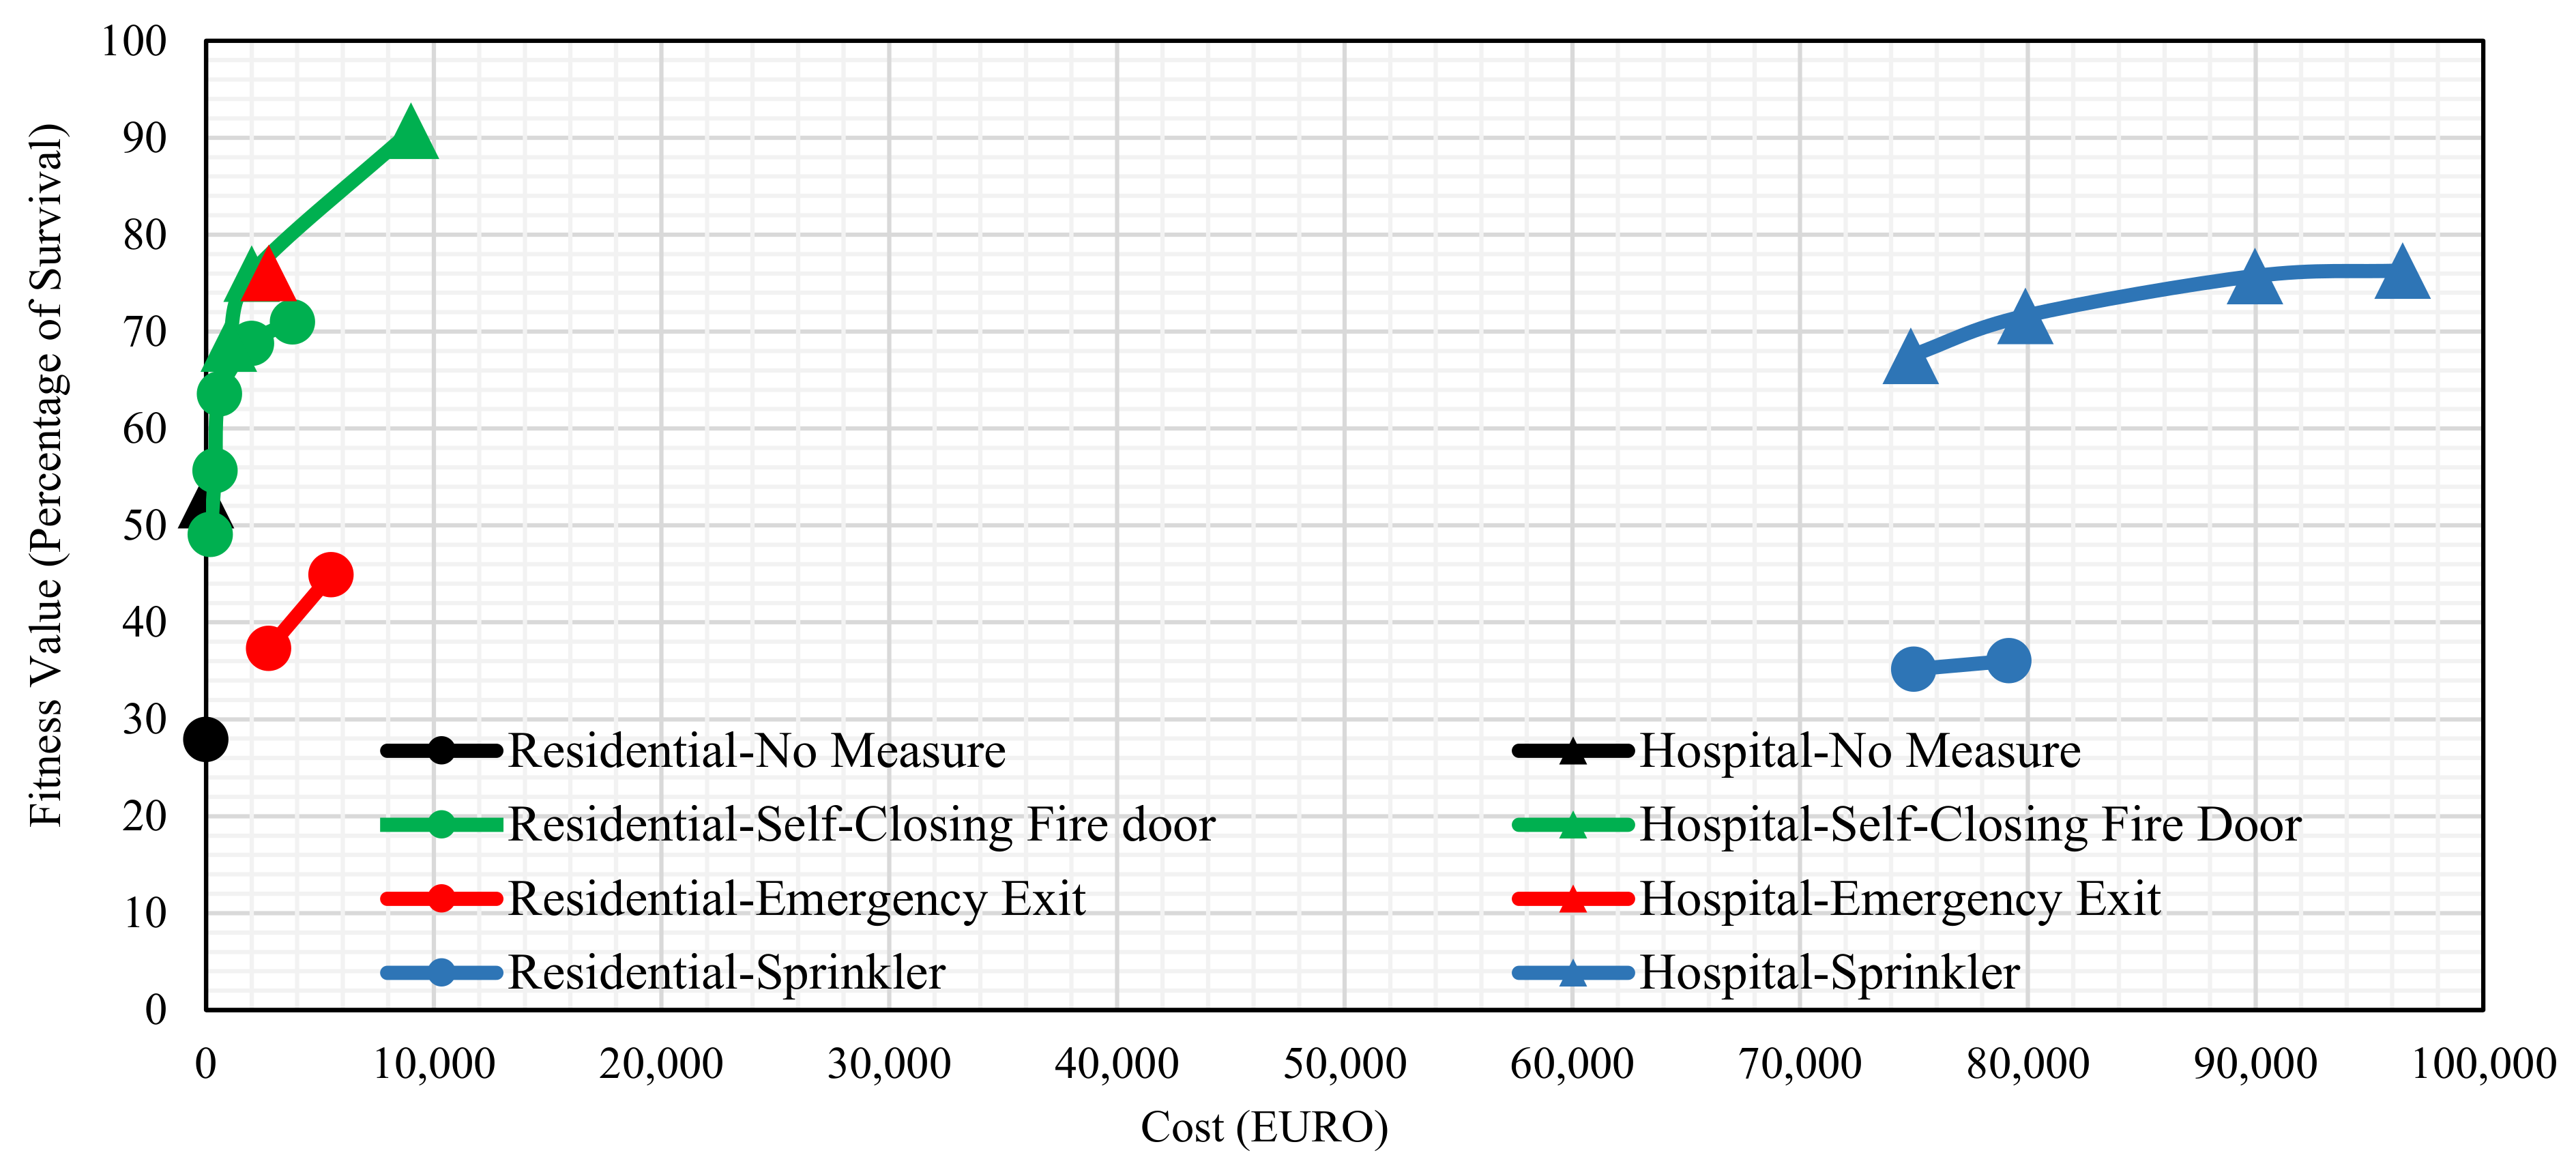
4.4.2. Comparison of Individual Measures
5. Discussion
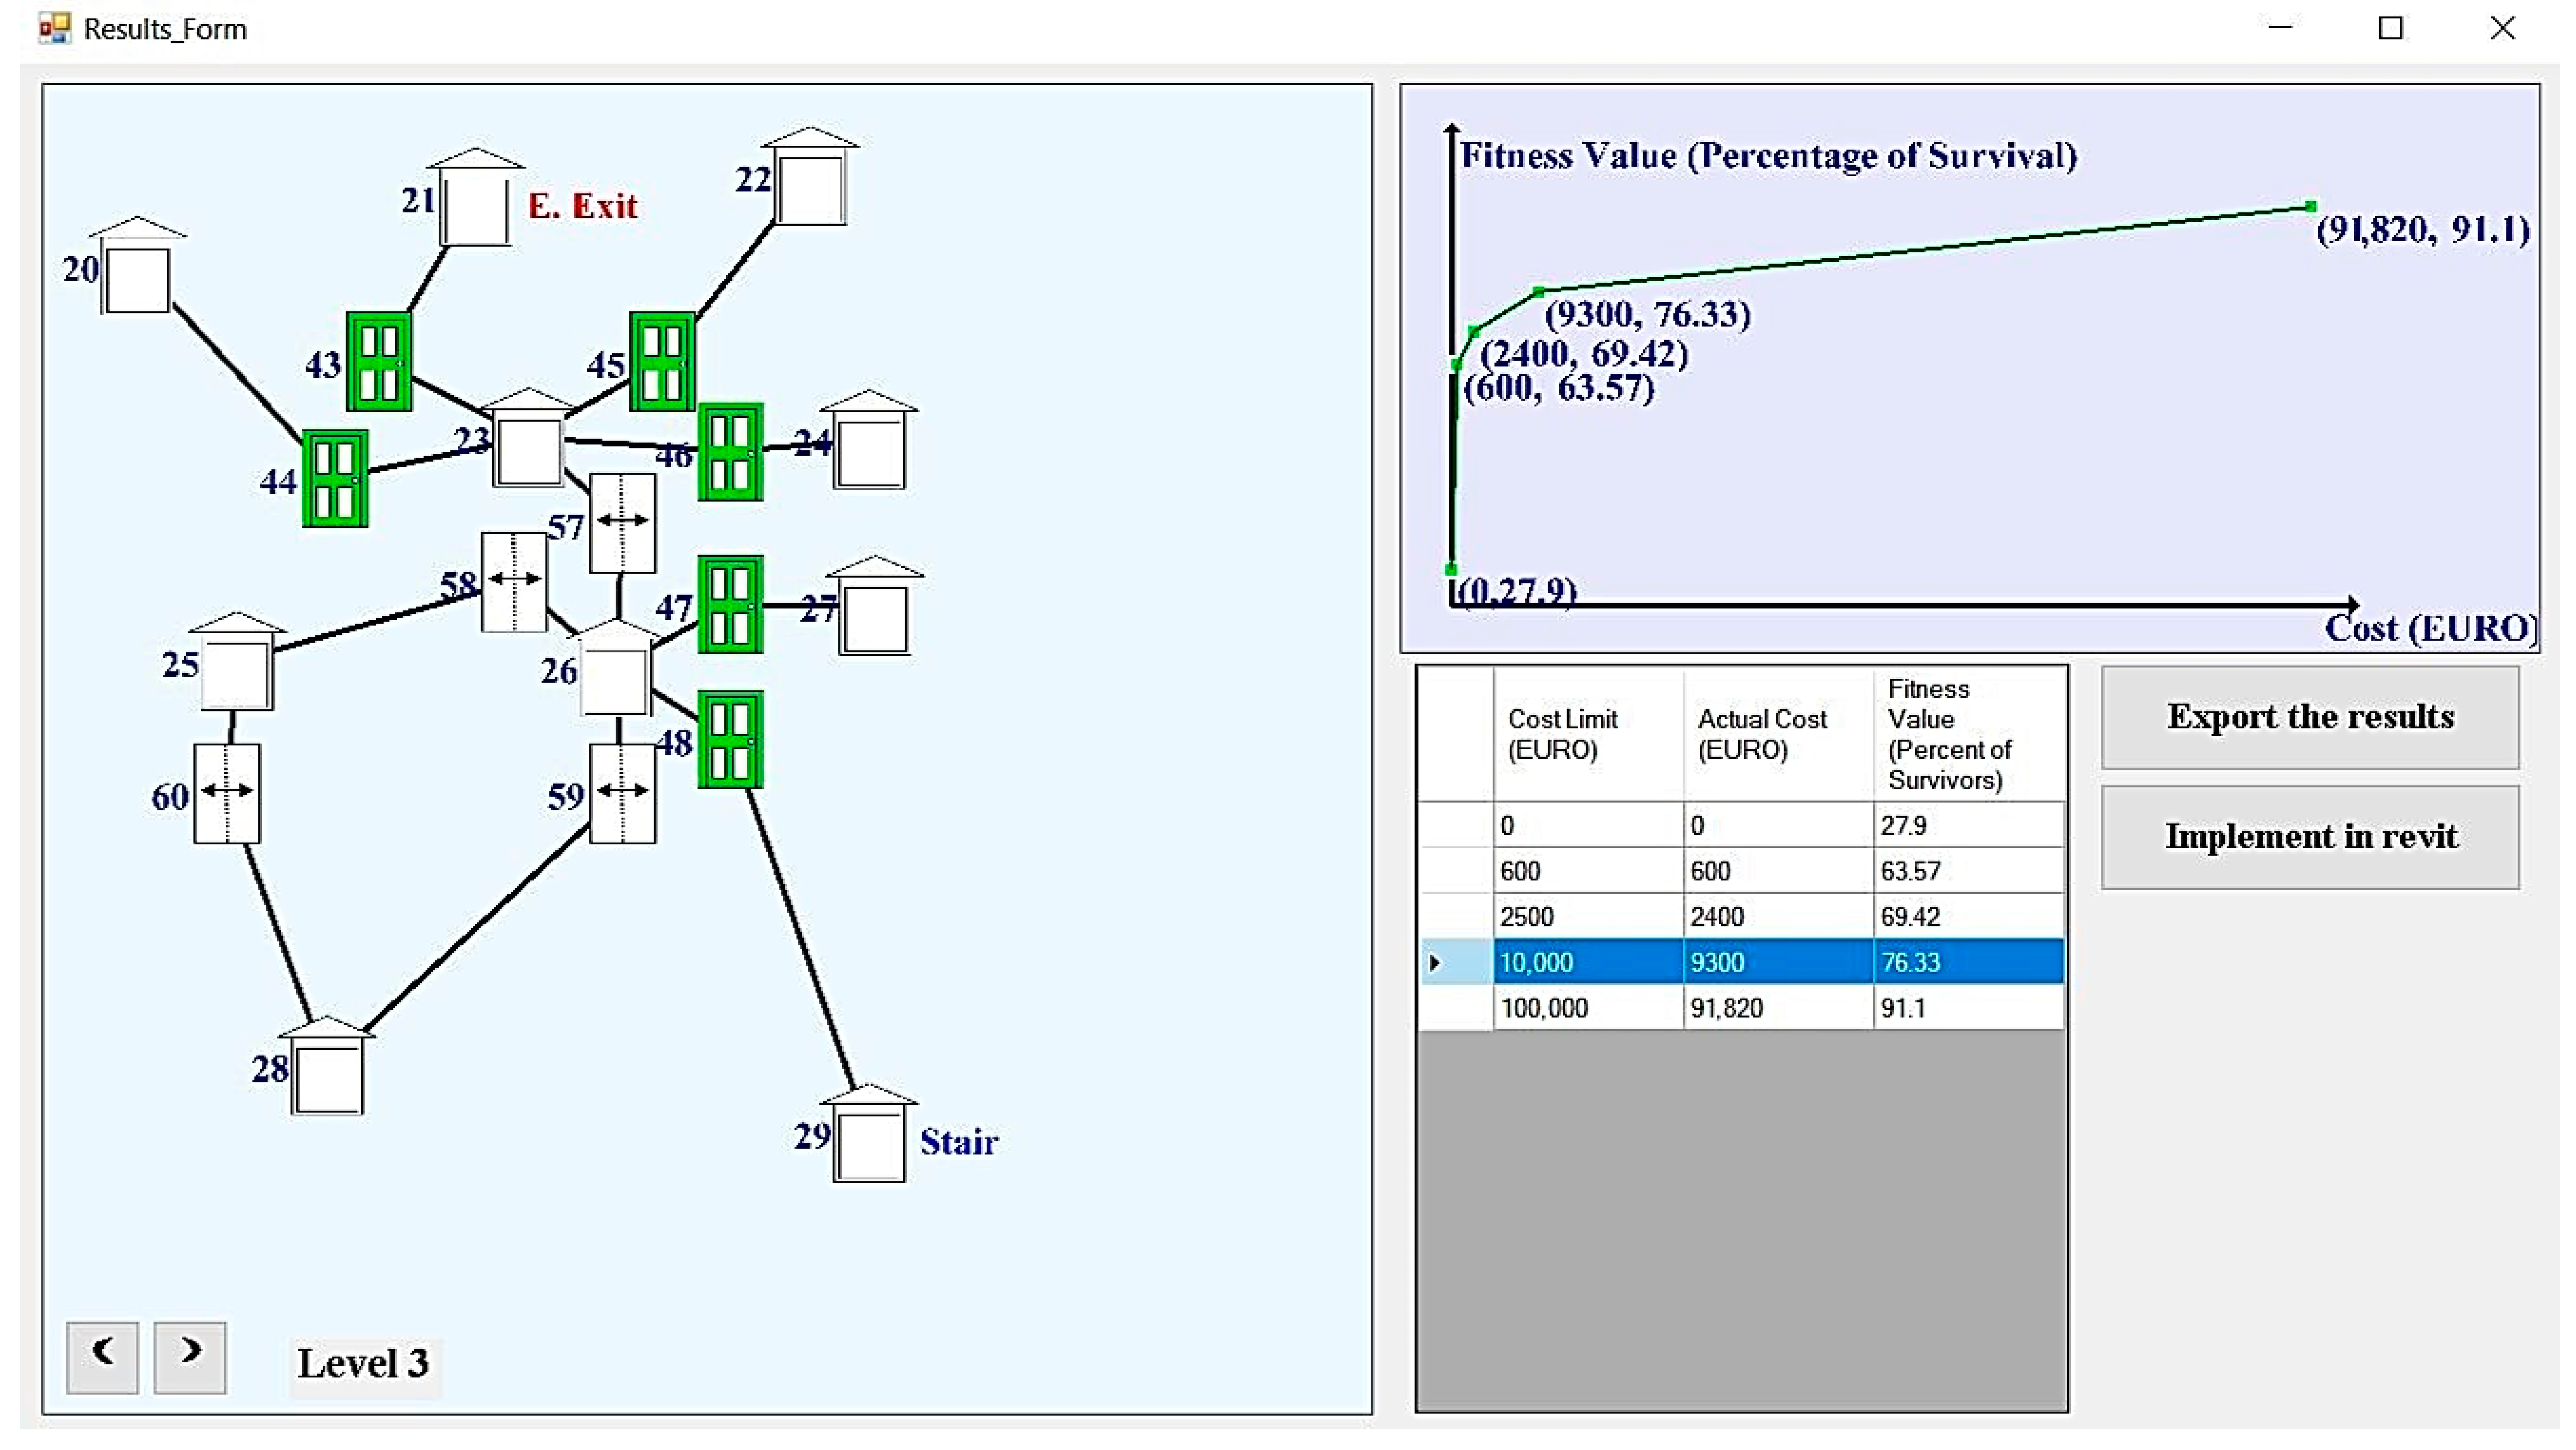
- According to Table 4 and Table 5, without utilizing any fire safety measures, only 27.9% and 52.65% of occupants were able to evacuate from the residential and hospital buildings, respectively. Given the characteristics of the hospital building (e.g., two stairways, two main exits), the percentage of survival for the hospital building is more in comparison with the residential building. In the residential building, the only exit route of the building was quickly filled with smoke prohibiting occupants from evacuating the building. This finding emphasizes the number of main exits and generally exit paths outside of the building, which must be considered in complex public buildings.
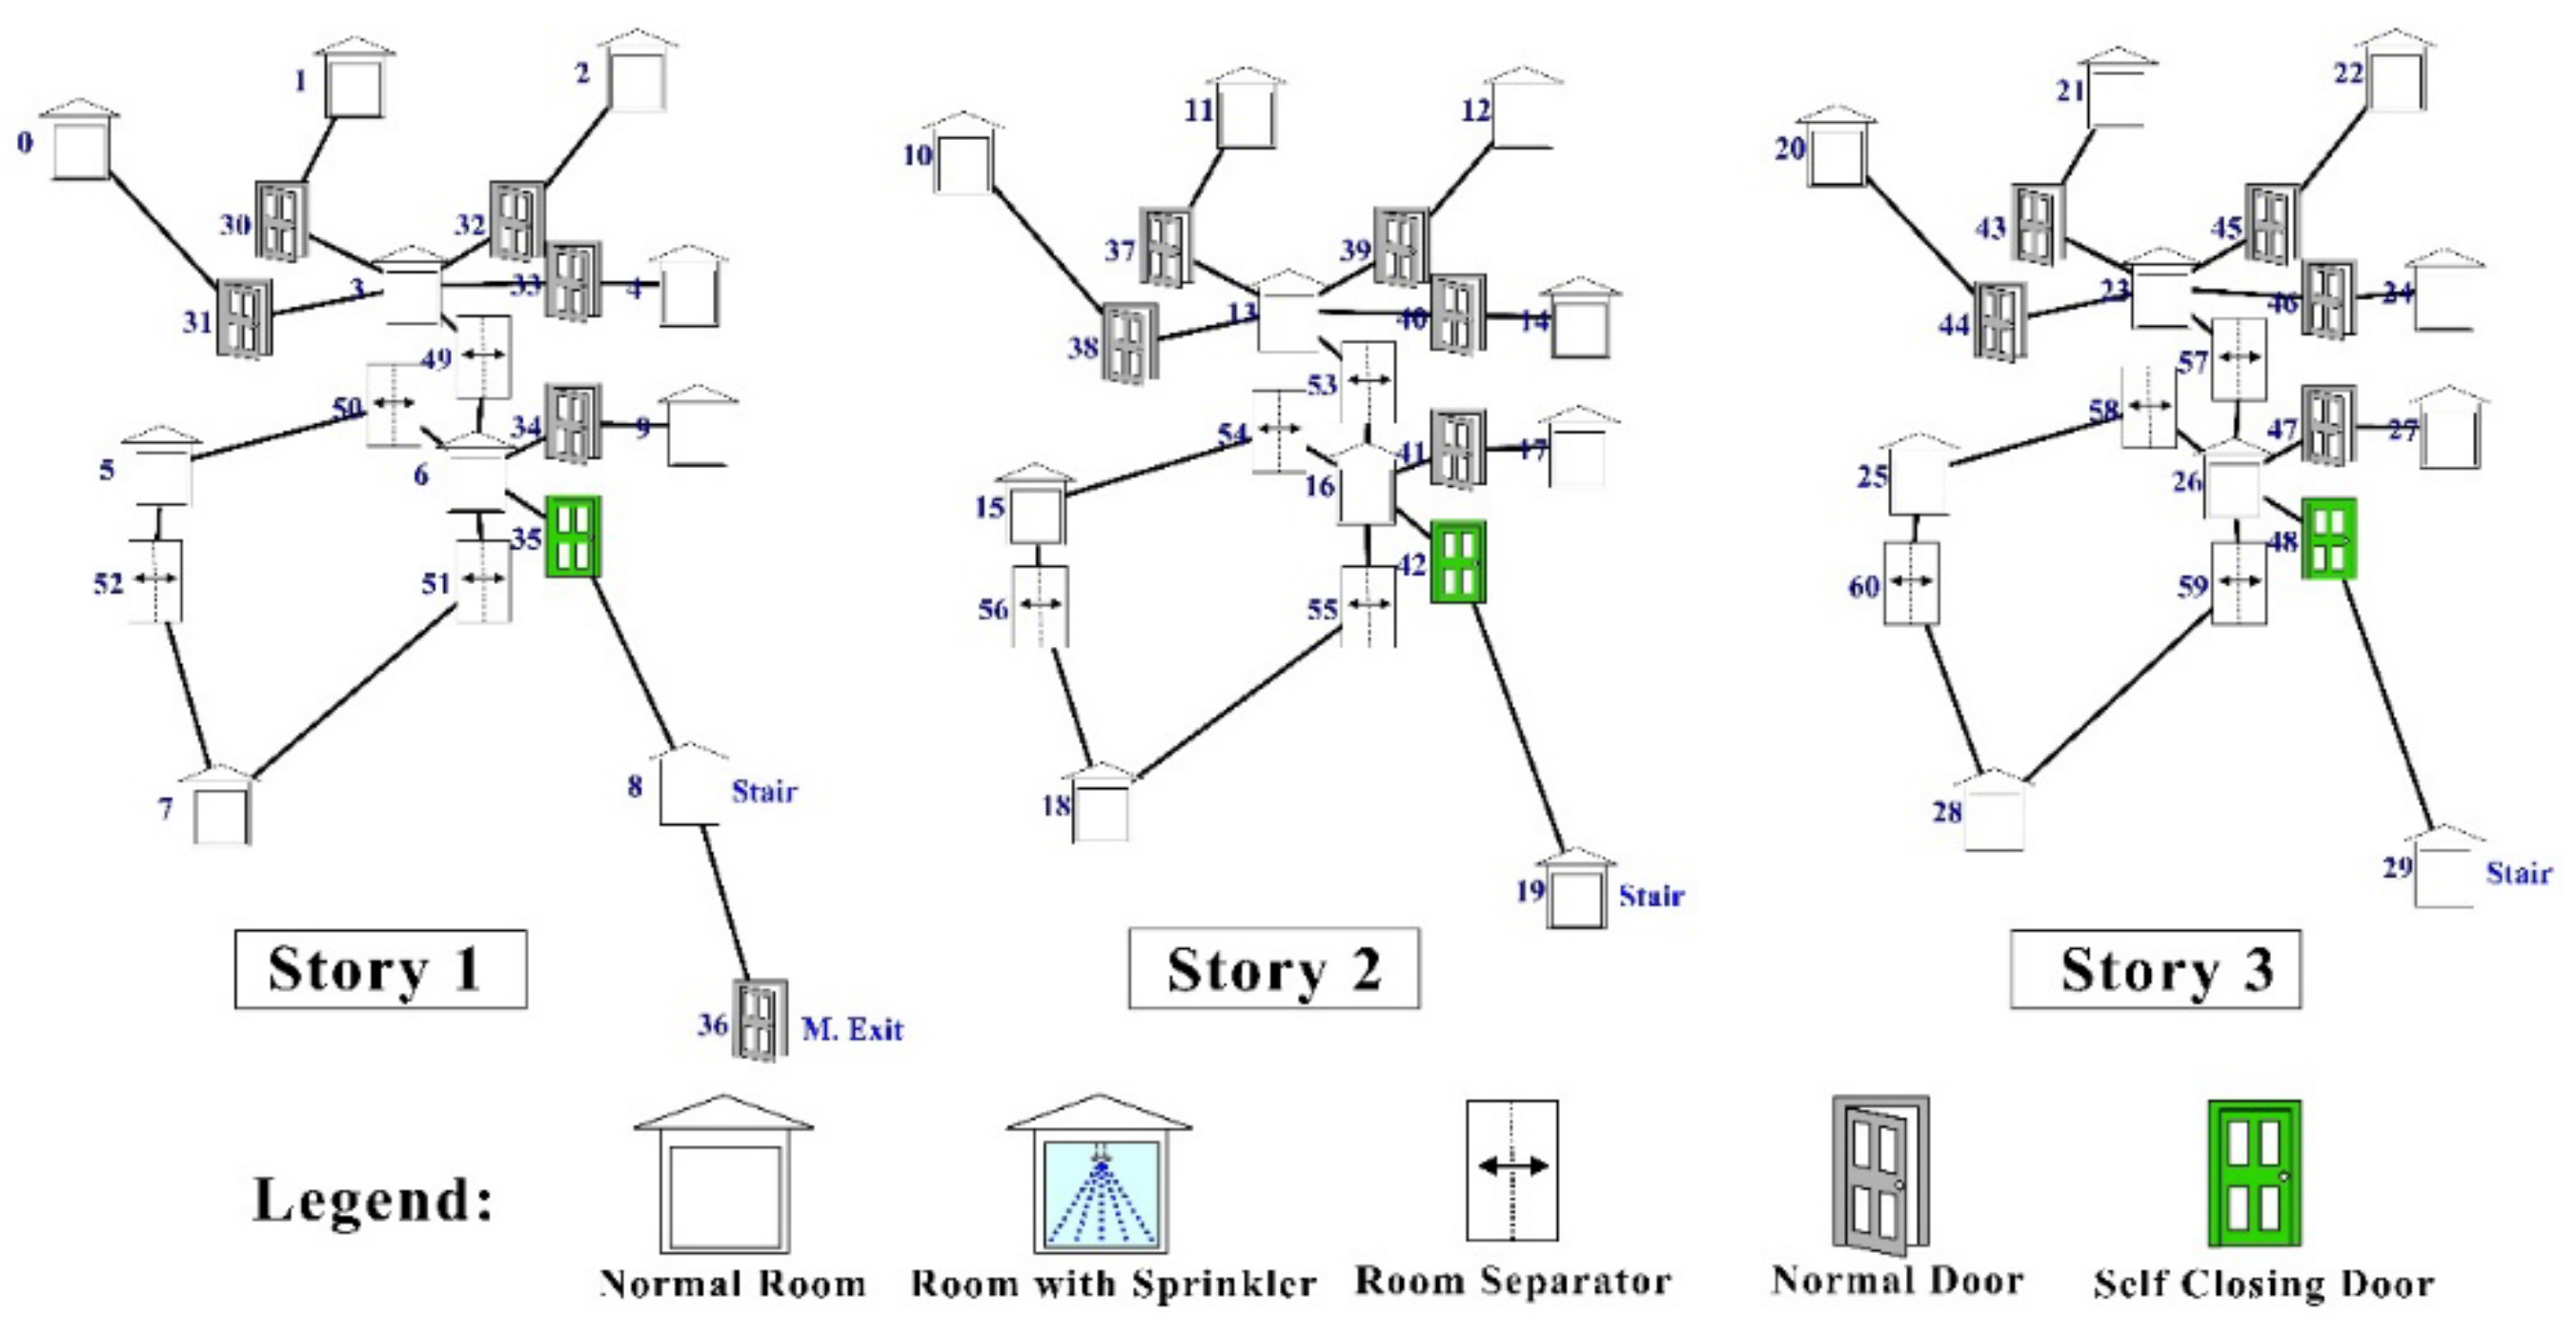
- As can be seen in Figure 24, at the cost of €600, only self-closing fire doors are feasible. The optimised position of the self-closing fire doors prohibits the spread of smoke from each floor to the stairway (the evacuation route of the building). This can substantially increase the chance of occupants evacuating the building safely. Thus, this indicates the importance of using self-closing fire doors in the entrance of the main exit paths. This provides a safe exit path for occupants and consequently more available evacuation time.
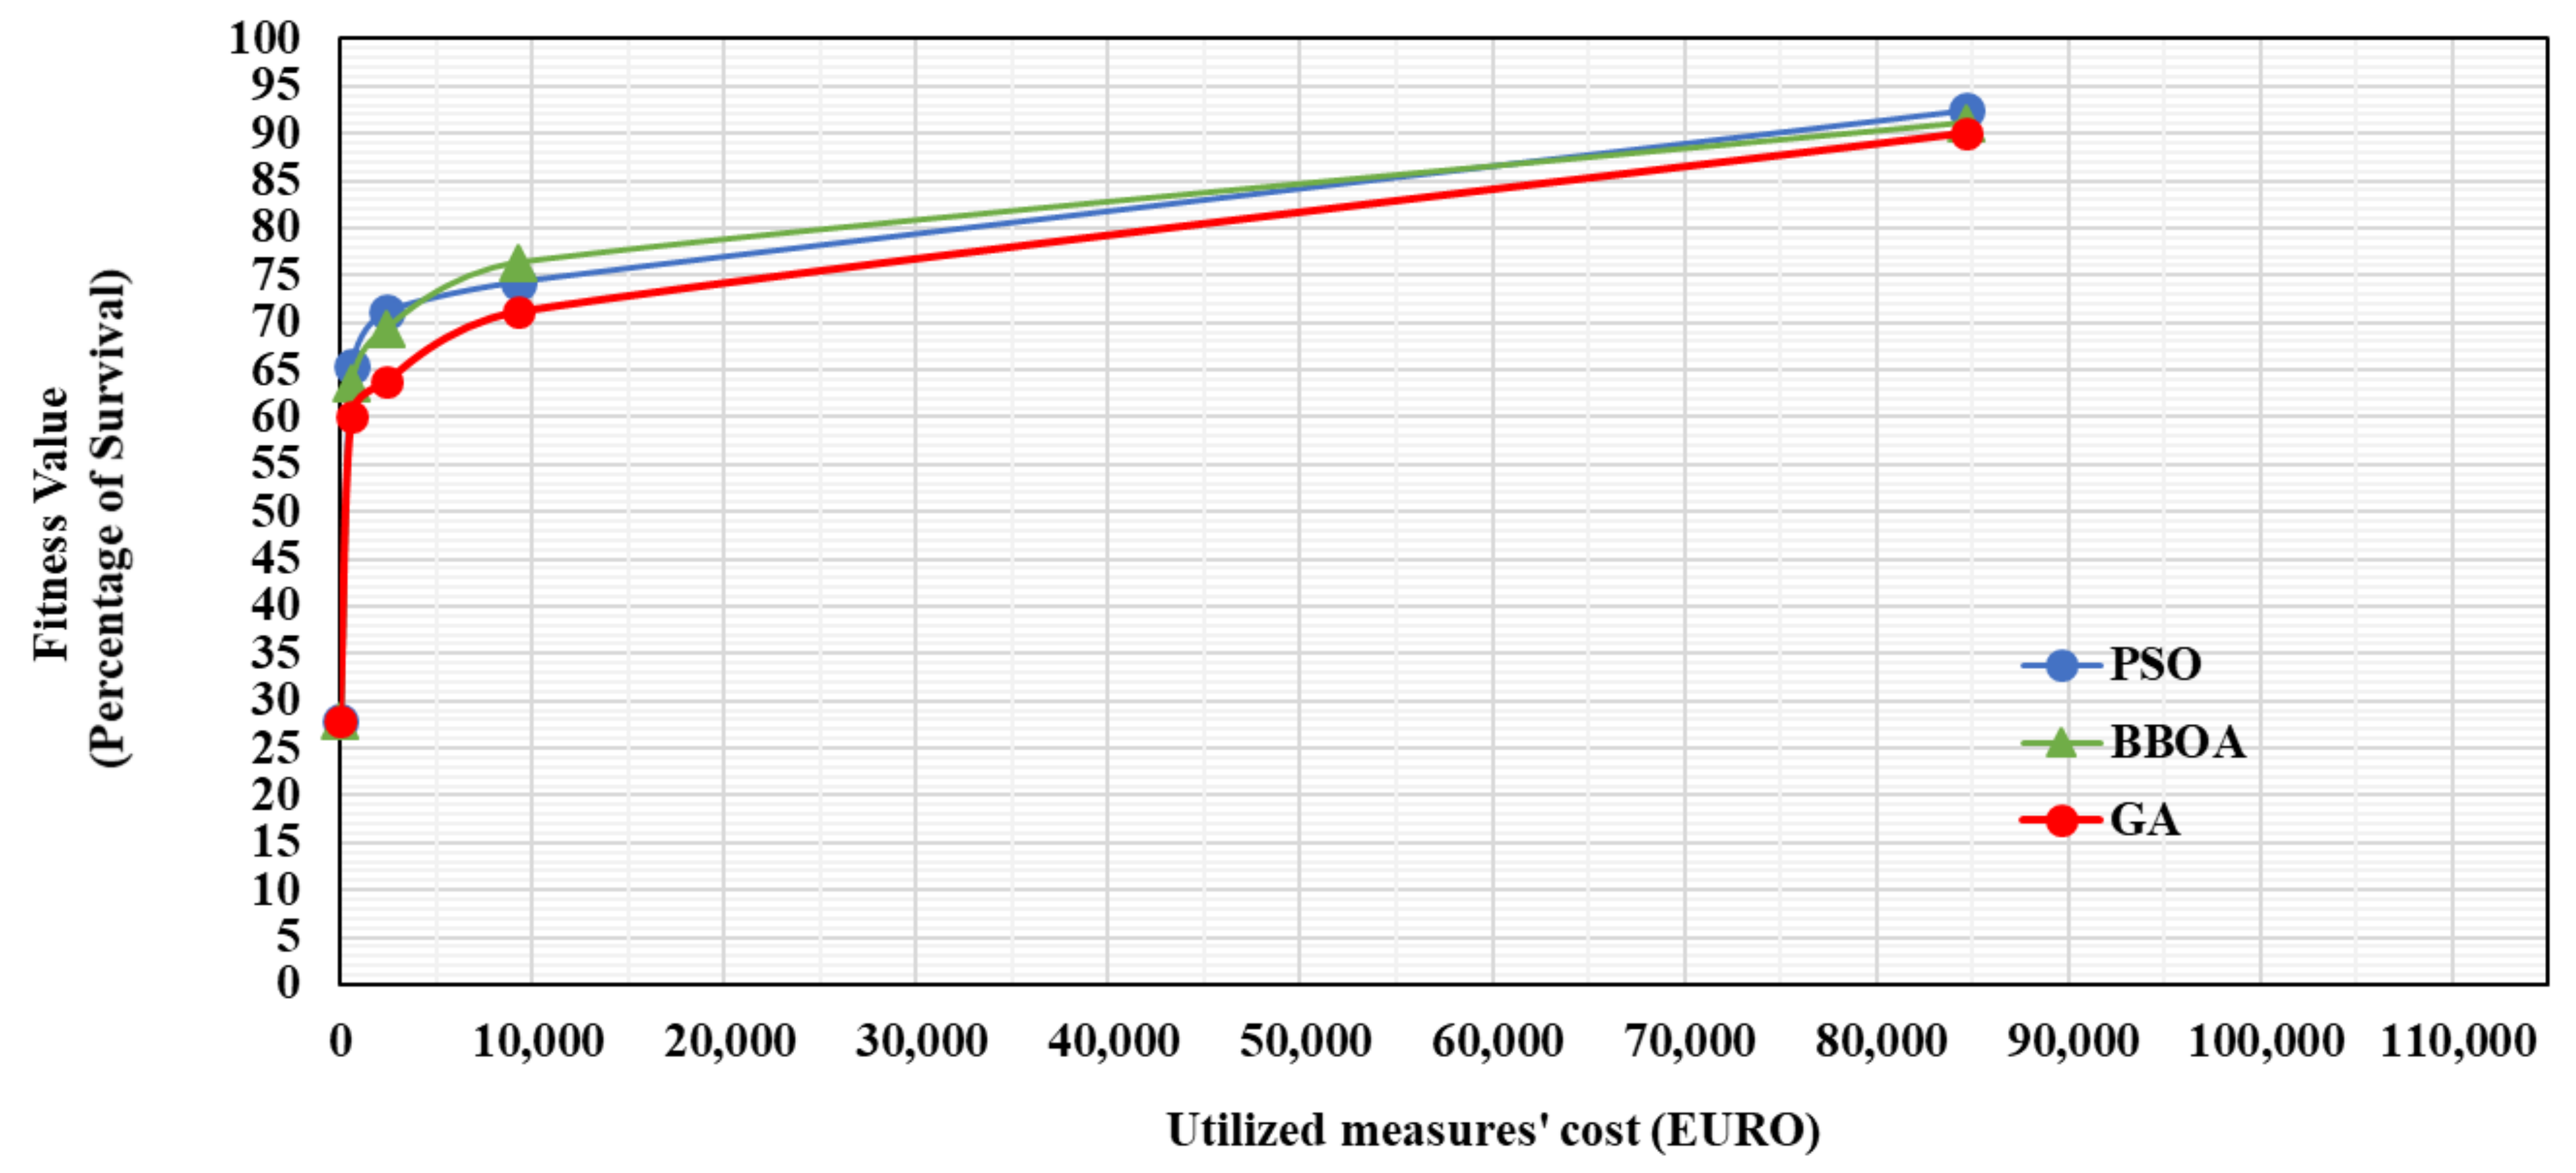
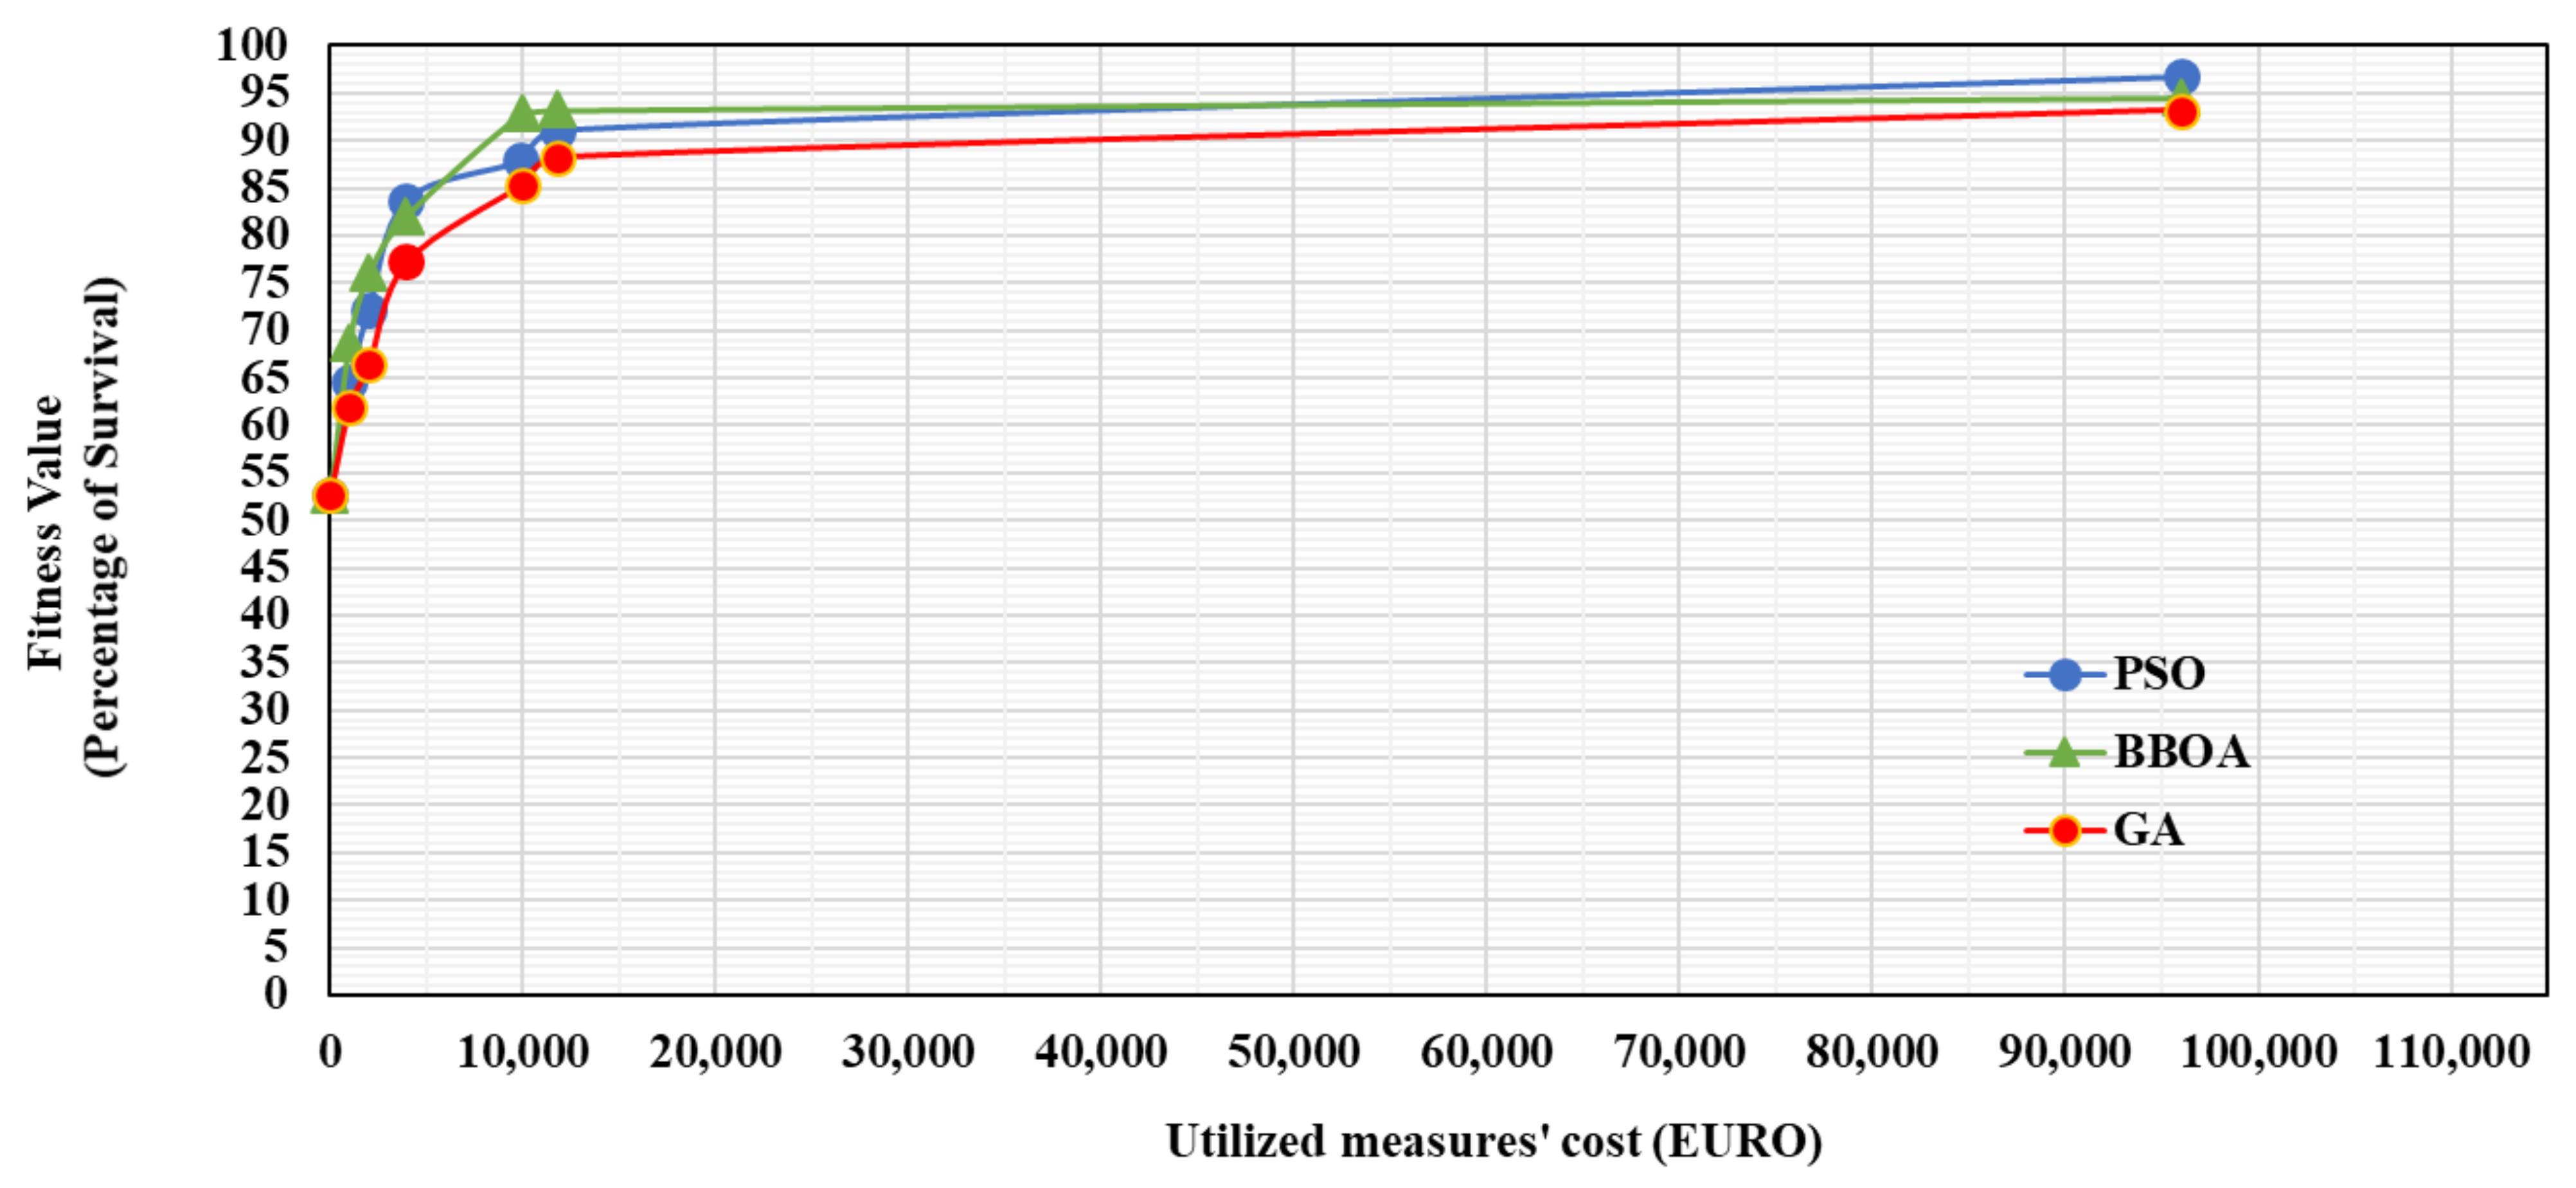
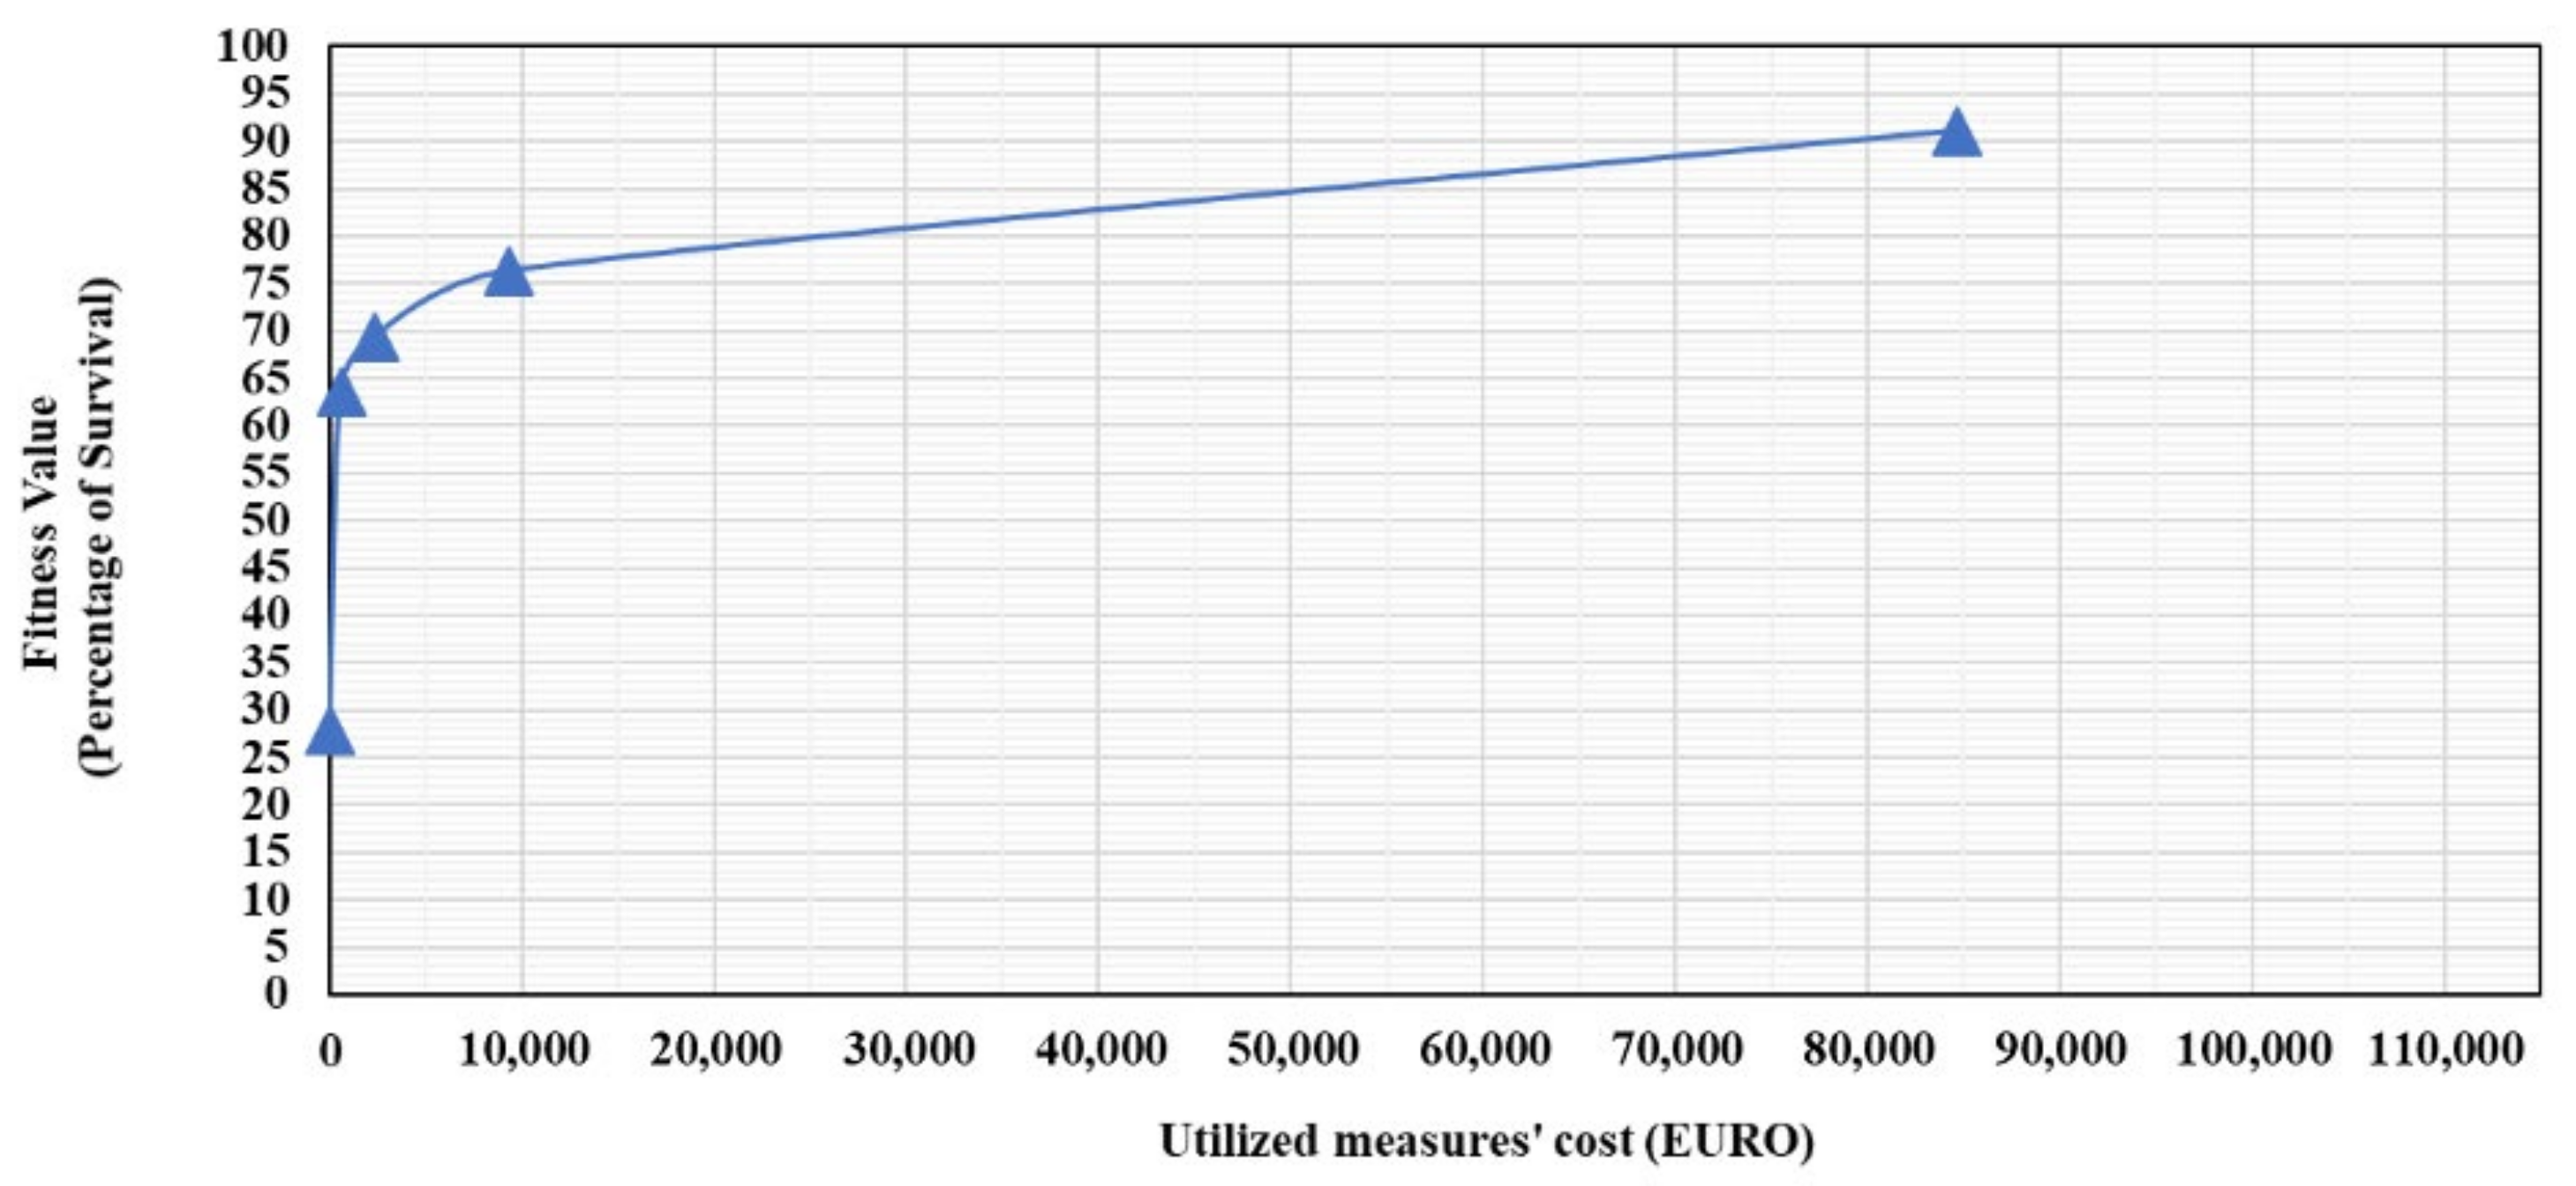
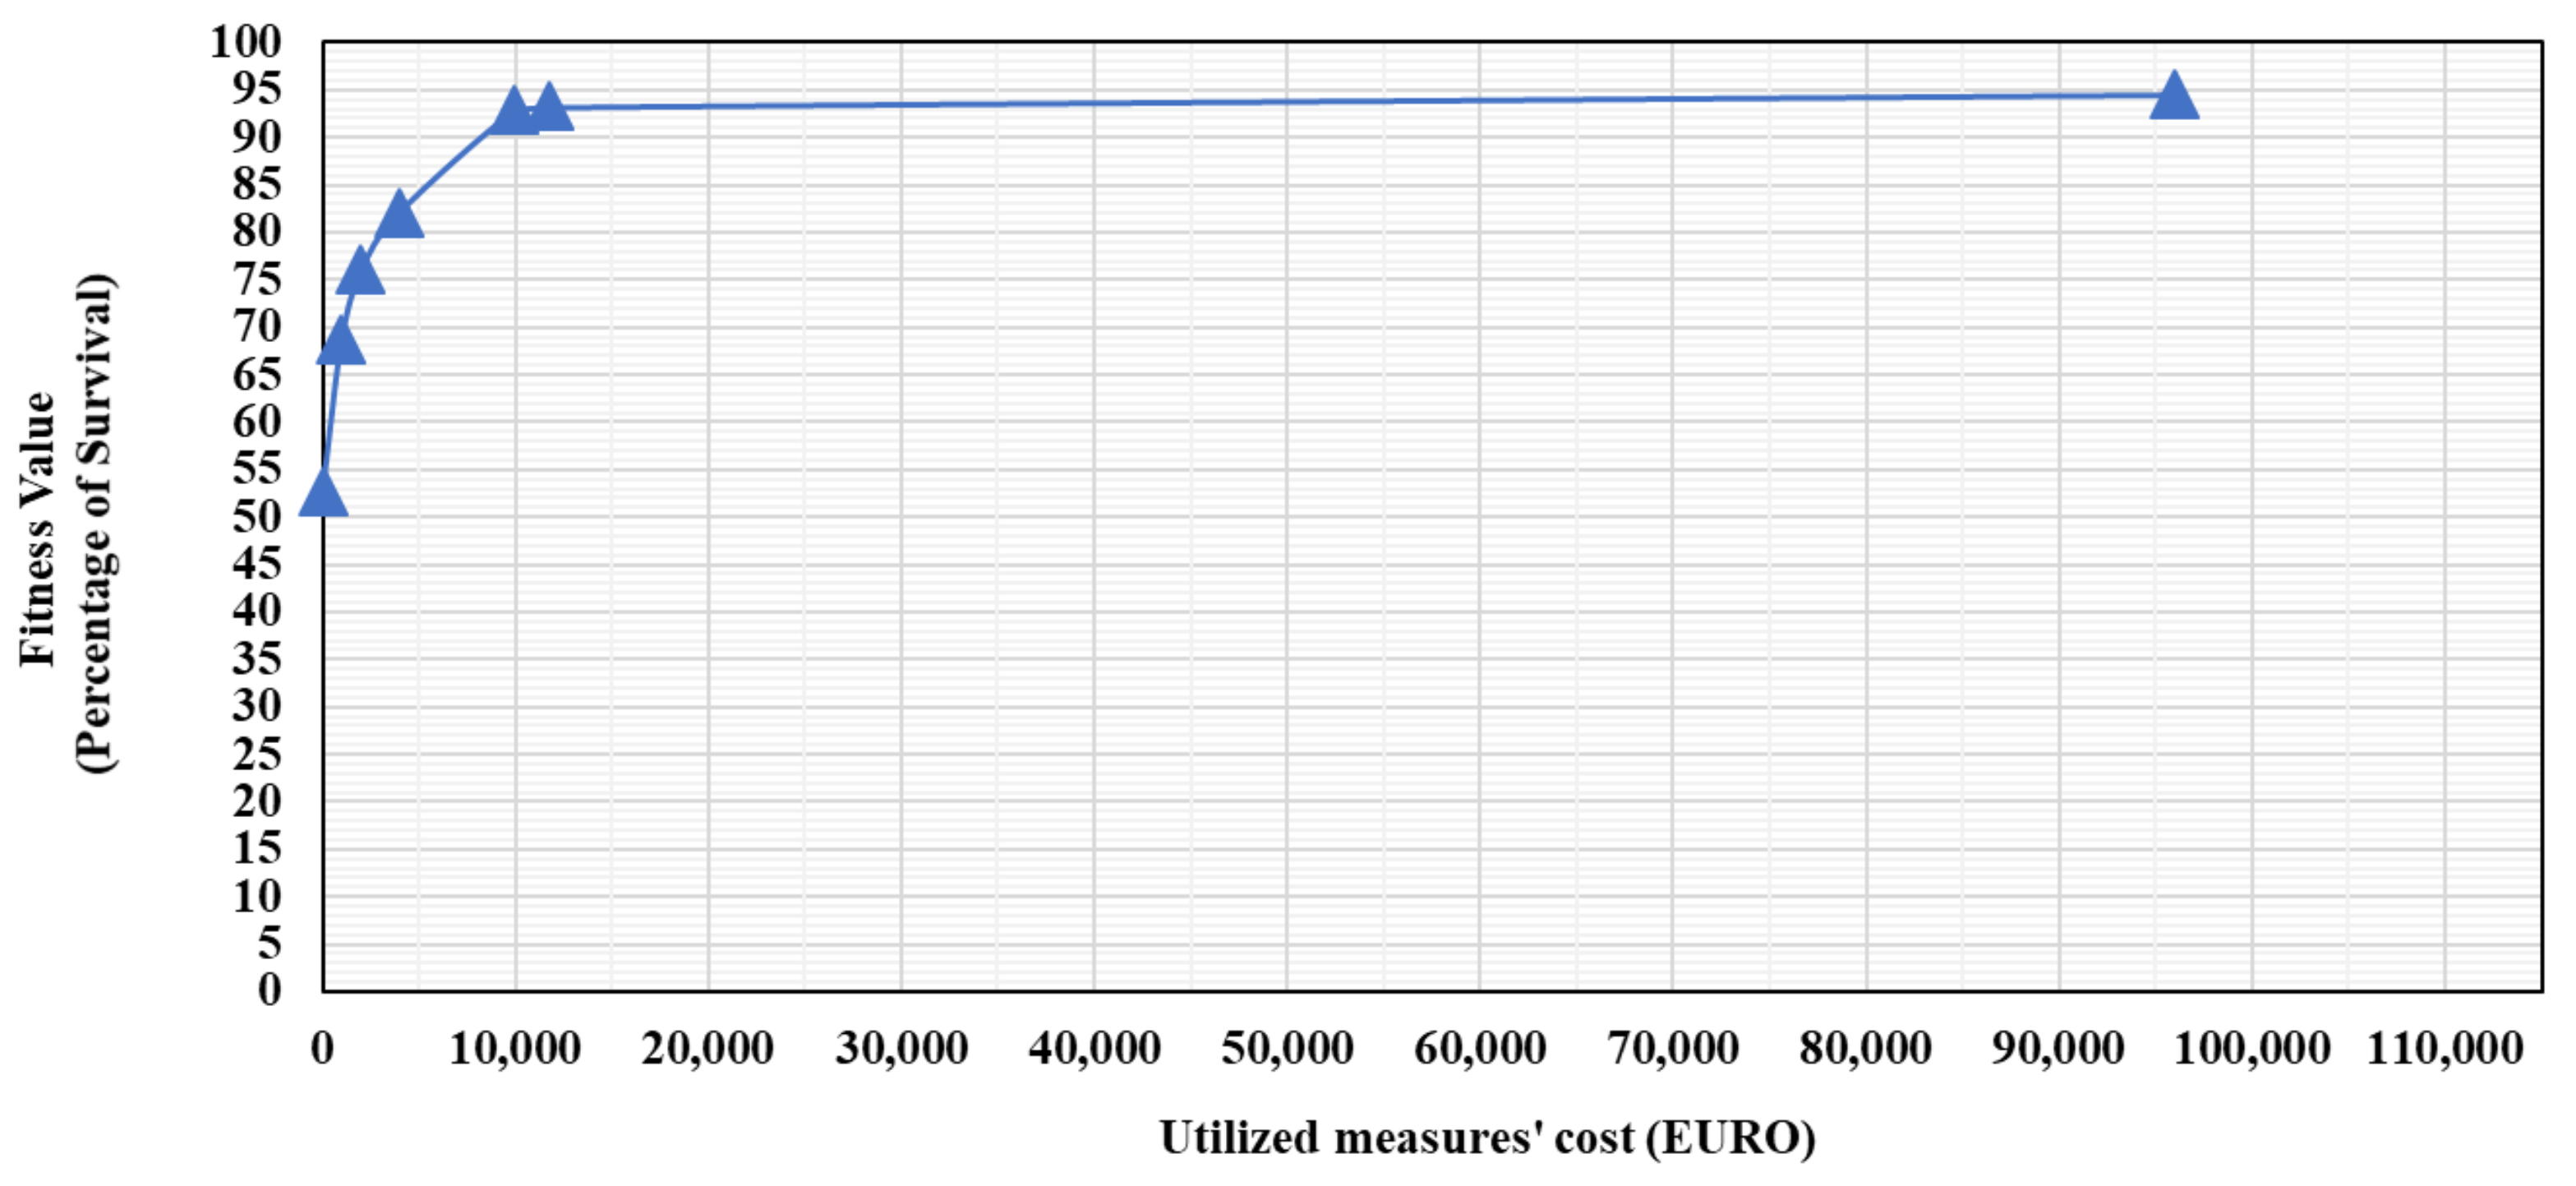
- According to the budget limits, the proposed framework indicates that the initial rising trend in both cases plateaus for costs higher than €10,000. In other words, a 19% increase in the percentage of survival requires up to an 81% rise in expenditure (demonstrated in Figure 22 and Figure 23). This shows that spending about €10,000 for fire safety measures with their optimal positions in these buildings seems acceptable and economic.
- Until the cost limit surpasses €70,000, which is the infrastructure cost of sprinklers, no change in the percentage of survival is observed. At €95,970 budget, all the measures are utilised, and this results in a 94.55% survival. In this case, spending more than €11,750 is not economical anymore as it does not make any changes to the survival rate.
- Given the high infrastructure cost of sprinklers, sprinkler heads are not utilized in the building design until the cost limit surpasses €70,000.
- The results of the comparison of individual fire safety measures reveal that self-closing fire doors are the most economical and effective measures to hinder the smoke movement and increase the percentage of survival for these two case projects. The sprinklers play a critical role in diminishing the fire spread and smoke movement in the building to prevent high property losses. However, the required time for a sprinkler to be activated and extinguish the fire may be enough to produce a considerable amount of smoke. This leads to injuries of some occupants and threatens the safety of others by blocking their routes to the exits, especially in the residential building case projects.
- Existing studies use and assess fire safety measures in the building designs and also evaluate safe evacuation to examine effective factors on safe evacuation. However, this study implemented optimisation of fire safety measures to find sets of measures with optimal positions in the building design while considering all of the fire scenarios, which were not taken into account in the previous studies. Unlike existing literature, this research provides optimised fire safety measures with an optimised budget. It helps determine the most appropriate position for fire safety measures considering budget limits, which is a challenge for stakeholders.
6. Conclusions
Author Contributions
Funding
Institutional Review Board Statement
Informed Consent Statement
Data Availability Statement
Acknowledgments
Conflicts of Interest
References
- Ahrens, M.; Evarts, B. NFPA Report-Fire Loss in the United States; NFPA: Quincy, MA, USA, 2020. [Google Scholar]
- Purkiss, J.A.; Li, L.-Y.Y. Fire Safety Engineering Design of Structures; CRC Press: Boca Raton, FL, USA, 2013; ISBN 1466585471. [Google Scholar]
- Kohler, N.; Moffatt, S. Life-cycle analysis of the built environment. Ind. Environ. 2003, 26, 17–21. [Google Scholar]
- Shi, J.; Ren, A.; Chen, C. Agent-based evacuation model of large public buildings under fire conditions. Autom. Constr. 2009, 18, 338–347. [Google Scholar] [CrossRef]
- Kobes, M.; Helsloot, I.; De Vries, B.; Post, J.G. Building safety and human behaviour in fire: A literature review. Fire Saf. J. 2010, 45, 1–11. [Google Scholar] [CrossRef]
- Hall, J.R., Jr. Evaluation of Fire Safety by D. Rasbash, G. Ramachandran, B. Kandola, J. Watts, and M. Law. Fire Technol. 2005, 41, 67–70. [Google Scholar] [CrossRef]
- Wang, S.H.; Wang, W.C.; Wang, K.C.; Shih, S.Y. Applying building information modeling to support fire safety management. Autom. Constr. 2015, 59, 158–167. [Google Scholar] [CrossRef]
- Sun, Q.; Turkan, Y. A BIM-based simulation framework for fire safety management and investigation of the critical factors affecting human evacuation performance. Adv. Eng. Inform. 2020, 44, 101093. [Google Scholar] [CrossRef]
- Bina, K.; Moghadas, N. BIM-ABM simulation for emergency evacuation from conference hall, considering gender segregation and architectural design. Archit. Eng. Des. Manag. 2021, 17, 361–375. [Google Scholar] [CrossRef]
- Irizarry, J.; Meadati, P.; Barham, W.S.; Akhnoukh, A. Exploring Applications of Building Information Modeling for Enhancing Visualization and Information Access in Engineering and Construction Education Environments. Int. J. Constr. Educ. Res. 2012, 8, 119–145. [Google Scholar] [CrossRef]
- Yang, F.; Bouchlaghem, D. Genetic algorithm-based multiobjective optimization for building design. Archit. Eng. Des. Manag. 2010, 6, 68–82. [Google Scholar] [CrossRef]
- Kennedy, J.; Eberhart, R. Particle swarm optimization. In Proceedings of the ICNN’95—International Conference on Neural Networks, Perth, WA, Australia, 27 November–1 December 1995; Volume 4, pp. 1942–1948. [Google Scholar]
- Kaveh, A.; Khanzadi, M.; Moghaddam, M.R. Billiards-inspired optimization algorithm; a new meta-heuristic method. Structures 2020, 27, 1722–1739. [Google Scholar] [CrossRef]
- Proulx, G. A stress model for people facing a fire. J. Environ. Psychol. 1993, 13, 137–147. [Google Scholar] [CrossRef] [Green Version]
- Horiuchi, S.; Murozaki, Y.; Hukugo, A. A case study of fire and evacuation in a multi-purpose office building, Osaka, Japan. Fire Saf. Sci. 1986, 1, 523–532. [Google Scholar] [CrossRef] [Green Version]
- Abolghasemzadeh, P. A comprehensive method for environmentally sensitive and behavioral microscopic egress analysis in case of fire in buildings. Saf. Sci. 2013, 59, 1–9. [Google Scholar] [CrossRef]
- Halldórsson, Á.; Kovács, G. The sustainable agenda and energy efficiency: Logistics solutions and supply chains in times of climate change. Int. J. Phys. Distrib. Logist. Manag. 2010, 40, 5–13. [Google Scholar] [CrossRef]
- Van Wassenhove, L.N. Humanitarian aid logistics: Supply chain management in high gear. J. Oper. Res. Soc. 2006, 57, 475–489. [Google Scholar] [CrossRef]
- Sopha, B.M.; Triasari, A.I.; Cheah, L. Sustainable Humanitarian Operations: Multi-Method Simulation for Large-Scale Evacuation. Sustainability 2021, 13, 7488. [Google Scholar] [CrossRef]
- Hamacher, H.W.; Tjandra, S.A. Mathematical modelling of evacuation problems: A state of the art. Pedestr. Evacuation Dyn. 2001, 24, 227–266. [Google Scholar]
- Borrmann, A.; Kneidl, A.; Köster, G.; Ruzika, S.; Thiemann, M. Bidirectional coupling of macroscopic and microscopic pedestrian evacuation models. Saf. Sci. 2012, 50, 1695–1703. [Google Scholar] [CrossRef]
- Wang, Z.; Yang, H.; Zhu, Z. Development of a simulation model for pedestrian evacuation under fire condition. In Proceedings of the 50th Annual Simulation Symposium, Virginia Beach, VA, USA, 23–26 April 2017; pp. 1–11. [Google Scholar]
- Song, P.; Gao, Y.; Xue, Y.; Jia, J.; Luo, W.; Li, W. Human behavior modeling for evacuation from classroom using cellular automata. IEEE Access 2019, 7, 98694–98701. [Google Scholar] [CrossRef]
- Schomborg, A.; Nökel, K.; Seyfried, A. Evacuation Assistance for a Sports Arena Using a Macroscopic Network Model. In Pedestrian and Evacuation Dynamics; Springer US: Jersey City, NJ, USA, 2011; pp. 389–398. [Google Scholar]
- Ndiaye, I.A.; Neron, E.; Jouglet, A. Macroscopic evacuation plans for natural disasters: A lexicographical approach for duration and safety criteria: Lex((Q|S) Flow). OR Spectr. 2017, 39, 231–272. [Google Scholar] [CrossRef]
- Ndiaye, I.A.; Neron, E.; Linot, A.; Monmarche, N.; Goerigk, M. A new model for macroscopic pedestrian evacuation planning with safety and duration criteria. Transp. Res. Procedia 2014, 2, 486–494. [Google Scholar] [CrossRef]
- Nelson, H.E.; Mowrer, F.W. Emergency Movement. In SFPE Handbook of Fire Protection Engineering, 3rd ed.; Chapter 3–14; National Fire Protection Association: Quincy, MA, USA, 2002. [Google Scholar]
- Poon, L.S. EvacSim: A simulation model of occupants with behavioural attributes in emergency evacuation of high-rise building fires. Fire Saf. Sci. 1994, 4, 681–692. [Google Scholar] [CrossRef] [Green Version]
- Francis, R.L.; Saunders, P.B. EVACNET: Prototype Network Optimization Models for Building Evacuation; National Institute of Standards and Technology: Gaithersburg, MD, USA, 1979. [Google Scholar]
- Wąs, J.; Gudowski, B.; Matuszyk, P.J. Social distances model of pedestrian dynamics. In International Conference on Cellular Automata; Springer: Berlin/Heidelberg, Germany, 2006; pp. 492–501. [Google Scholar]
- Thornton, C.; O’Konski, R.; Hardeman, B.; Swenson, D. Pathfinder: An agent-based egress simulator. In Pedestrian and Evacuation Dynamics; Springer: Berlin/Heidelberg, Germany, 2011; pp. 889–892. [Google Scholar]
- Owen, M.; Galea, E.R.; Lawrence, P.J. The EXODUS evacuation model applied to building evacuation scenarios. J. Fire Prot. Eng. 1996, 8, 65–84. [Google Scholar] [CrossRef]
- Kuligowski, E.D.; Peacock, R.D.; Hoskins, B.L. A Review of Building Evacuation Models; US Department of Commerce, National Institute of Standards and Technology: Gaithersburg, MD, USA, 2005; ISBN 1621982866.
- Fire Model Survey. Combustion Science & Engineering. 2015. Available online: http://www.firemodelsurvey.com/EgressModels.html (accessed on 31 December 2015).
- Chung, K.-C.; Tung, H.-S. A Simplified Model for Smoke Filling Time Calculation with Sprinkler Effects. J. Fire Sci. 2005, 23, 279–301. [Google Scholar] [CrossRef]
- Klote, J.H.; Milke, J.A.; Turnbull, P.G.; Kashef, A.; Ferreira, M.J. Handbook of Smoke Control Engineering; American Society of Heating: Atlanta, GA, USA, 2012; ISBN 9781936504244. [Google Scholar]
- Purser, D.A. Toxicity assessment of combustion products. In SFPE Handbook of Fire Protection Engineering, 3rd ed.; National Fire Protection Association: Quincy, MA, USA, 2002. [Google Scholar]
- Buchanan, A.H. Fire Engineering Design Guide; Centre for Advanced Engineering, University of Canterbury: Christchurch, New Zealand, 2001; Volume 53, ISBN 0908993218. [Google Scholar]
- Nishino, T. Two-layer zone model including entrainment into the horizontally spreading smoke under the ceiling for application to fires in large area rooms. Fire Saf. J. 2017, 91, 355–360. [Google Scholar] [CrossRef]
- Hua, J.; Wang, J.; Kumar, K. Development of a hybrid field and zone model for fire smoke propagation simulation in buildings. Fire Saf. J. 2005, 40, 99–119. [Google Scholar] [CrossRef]
- Fire Model Survey. Combustion Science & Engineering. 2015. Available online: http://www.firemodelsurvey.com/FieldModels.html (accessed on 31 December 2015).
- Fire Model Survey. Combustion Science & Engineering. 2015. Available online: http://www.firemodelsurvey.com/ZoneModels.html (accessed on 31 December 2015).
- McGrattan, K.; Hostikka, S.; McDermott, R.; Floyd, J.; Weinschenk, C.; Overholt, K. Fire dynamics simulator user’s guide. NIST Spec. Publ. 2013, 1019. [Google Scholar] [CrossRef]
- Peacock, R.D.; Reneke, P.A.; Forney, G.P. CFAST—Consolidated Model of Fire Growth and Smoke Transport (Version 7) Volume 2: User’s Guide; NIST Technical Note 1889v2; NIST—National Institute of Standards and Technology: Gaithersburg, MD, USA, 2017. [CrossRef]
- Mawhinney, J.R.; Tamura, G.T. Effect of automatic sprinkler protection on smoke control systems. Trans. Soc. Heat. Refrig. AIR Cond. Eng. 1994, 100, 494. [Google Scholar] [CrossRef] [Green Version]
- Fleming, R.P. Automatic sprinkler system calculations. In SFPE Handbook of Fire Protection Engineering; Springer: Berlin/Heidelberg, Germany, 2016; pp. 1423–1449. [Google Scholar]
- Yung, D. Principles of Fire Risk Assessment in Buildings; John Wiley & Sons: Hoboken, NJ, USA, 2008; ISBN 9780470854020. [Google Scholar]
- Yamamoto, K.; Takeuchi, Y.; Nishiki, S. Effects of a sprinkler on evacuation dynamics in fire. Computation 2015, 3, 274–284. [Google Scholar] [CrossRef] [Green Version]
- Filippidis, L.; Xie, H.; Galea, E.R.; Lawrence, P.J. Exploring the potential effectiveness of dynamic and static emergency exit signage in complex spaces through simulation. Fire Saf. J. 2021, 125, 103404. [Google Scholar] [CrossRef]
- Hopkin, C.; Spearpoint, M.; Wang, Y. Internal door closing habits in domestic premises: Results of a survey and the potential implications on fire safety. Saf. Sci. 2019, 120, 44–56. [Google Scholar] [CrossRef]
- Talebi, S.; Koskela, L.; Tzortzopoulos, P.; Kagioglou, M.; Rausch, C.; Elghaish, F.; Poshdar, M. Causes of Defects Associated with Tolerances in Construction: A Case Study. J. Manag. Eng. 2021, 37, 5021005. [Google Scholar] [CrossRef]
- Talebi, S.; Koskela, L.; Tzortzopoulos, P.; Kagioglou, M. Tolerance management in construction: A conceptual framework. Sustainability 2020, 12, 1039. [Google Scholar] [CrossRef] [Green Version]
- West, D.B. Introduction to Graph Theory; Prentice Hall: Upper Saddle River, NJ, USA, 2001; Volume 2. [Google Scholar]
- Skandhakumar, N.; Salim, F.; Reid, J.; Drogemuller, R.; Dawson, E. Graph theory based representation of building information models for access control applications. Autom. Constr. 2016, 68, 44–51. [Google Scholar] [CrossRef] [Green Version]
- Zhi, G.S.; Lo, S.M.; Fang, Z. A graph-based algorithm for extracting units and loops from architectural floor plans for a building evacuation model. CAD Comput. Aided Des. 2003, 35, 1–14. [Google Scholar] [CrossRef]
- Desmet, A.; Gelenbe, E. Graph and analytical models for emergency evacuation. Futur. Internet 2013, 5, 46–55. [Google Scholar] [CrossRef] [Green Version]
- Fu, M.; Liu, R. An approach of checking an exit sign system based on navigation graph networks. Adv. Eng. Inform. 2020, 46, 101168. [Google Scholar] [CrossRef]
- Hamieh, A.; Makhlouf, A.B.; Louhichi, B.; Deneux, D. A BIM-based method to plan indoor paths. Autom. Constr. 2020, 113, 103120. [Google Scholar] [CrossRef]
- Fathollahi-Fard, A.M.; Hajiaghaei-Keshteli, M.; Tavakkoli-Moghaddam, R. Red deer algorithm (RDA): A new nature-inspired meta-heuristic. Soft Comput. 2020, 24, 14637–14665. [Google Scholar] [CrossRef]
- Mirjalili, S.; Lewis, A. The whale optimization algorithm. Adv. Eng. Softw. 2016, 95, 51–67. [Google Scholar] [CrossRef]
- Askari, Q.; Younas, I.; Saeed, M. Political Optimizer: A novel socio-inspired meta-heuristic for global optimization. Knowl.-Based Syst. 2020, 195, 105709. [Google Scholar] [CrossRef]
- Gao, W.; Liu, S.; Huang, L. A global best artificial bee colony algorithm for global optimization. J. Comput. Appl. Math. 2012, 236, 2741–2753. [Google Scholar] [CrossRef] [Green Version]
- Sivanandam, S.N.; Deepa, S.N. Genetic algorithms. In Introduction to Genetic Algorithms; Springer: Berlin/Heidelberg, Germany, 2008; pp. 15–37. [Google Scholar]
- Tang, B.; Han, J.; Guo, G.; Chen, Y.; Zhang, S. Building material prices forecasting based on least square support vector machine and improved particle swarm optimization. Archit. Eng. Des. Manag. 2019, 15, 196–212. [Google Scholar] [CrossRef]
- Kaveh, A. Advances in Metaheuristic Algorithms for Optimal Design of Structures; Springer: Berlin/Heidelberg, Germany, 2014; ISBN 3319055496. [Google Scholar]
- Asgari Siahboomy, M.; Sarvari, H.; Chan, D.W.M.; Nassereddine, H.; Chen, Z. A multi-criteria optimization study for locating industrial warehouses with the integration of BIM and GIS data. Archit. Eng. Des. Manag. 2021, 17, 1–18. [Google Scholar] [CrossRef]
- Khanzadi, M.; Kaveh, A.; Moghaddam, M.R.; Pourbagheri, S.M. Optimization of building components with sustainability aspects in BIM environment. Period. Polytech. Civ. Eng. 2019, 63, 93–103. [Google Scholar] [CrossRef] [Green Version]
- Moghaddam, M.R.; Khanzadi, M.; Kaveh, A. Multi-objective Billiards-Inspired Optimization Algorithm for Construction Management Problems. Iran. J. Sci. Technol. Trans. Civ. Eng. 2020, 45, 2177–2200. [Google Scholar] [CrossRef]
- Gao, H.; Medjdoub, B.; Luo, H.; Zhong, H.; Zhong, B.; Sheng, D. Building evacuation time optimization using constraint-based design approach. Sustain. Cities Soc. 2020, 52, 101839. [Google Scholar] [CrossRef]
- Li, Y.; Cai, W.; Kana, A.A. Design of level of service on facilities for crowd evacuation using genetic algorithm optimization. Saf. Sci. 2019, 120, 237–247. [Google Scholar] [CrossRef]
- Liu, M.; Zhang, F.; Ma, Y.; Pota, H.R.; Shen, W. Evacuation path optimization based on quantum ant colony algorithm. Adv. Eng. Inform. 2016, 30, 259–267. [Google Scholar] [CrossRef]
- Yin, R.K. Validity and generalization in future case study evaluations. Evaluation 2013, 19, 321–332. [Google Scholar] [CrossRef]
- Ghauri, P.; Grønhaug, K.; Strange, R. Research Methods in Business Studies; Cambridge University Press: Cambridge, UK, 2020; ISBN 1108802745. [Google Scholar]
- Rutstein, R. The estimation of the fire hazard in different occupancies. Fire Surv. 1979, 8, 21–25. [Google Scholar]
- Ramachandran, G. Probabilistic approach to fire risk evaluation. Fire Technol. 1988, 24, 204–226. [Google Scholar] [CrossRef]
- Hopkin, C.; Spearpoint, M.; Hopkin, D.; Wang, Y. Residential occupant density distributions derived from English Housing Survey data. Fire Saf. J. 2019, 104, 147–158. [Google Scholar] [CrossRef] [Green Version]
- Lizhong, Y.; Weifeng, F.; Weicheng, F. Modeling occupant evacuation using cellular automata-effect of human behavior and building characteristics on evacuation. J. Fire Sci. 2003, 21, 227–240. [Google Scholar] [CrossRef]
- Kułakowski, A.; Rogala, B. Agent simulation of the evacuation process from a building during a fire. In Proceedings of the 2017 12th International Scientific and Technical Conference on Computer Sciences and Information Technologies (CSIT), Lviv, Ukraine, 5–8 September 2017; Volume 1, pp. 385–388. [Google Scholar]
- Mirahadi, F.; McCabe, B. A Real-time Path-Planning Model for Building Evacuations. In Proceedings of the 36th International Symposium on Automation and Robotics in Construction (ISARC), Banff, AB, Canada, 21–24 May 2019; IAARC Publications: Edinburgh, UK, 2019; Volume 36, pp. 998–1004. [Google Scholar]
- Chu, J.C.; Yeh, C.-Y. Emergency evacuation guidance design for complex building geometries. J. Infrastruct. Syst. 2012, 18, 288–296. [Google Scholar] [CrossRef]
- Persson, S.M.; Sharf, I. Sampling-based A∗ algorithm for robot path-planning. Int. J. Rob. Res. 2014, 33, 1683–1708. [Google Scholar] [CrossRef]
- Howie, M.C.; Seth, H.; Kevin, M.L.; George, K.; Wolfram, B.; Lydia, E.K.; Sebastian, T.; Ronald, C.A. Principles of Robot Motion: Theory, Algorithms, and Implementation; MIT Press: Cambridge, MA, USA, 2005. [Google Scholar]
- Rausch, C.; Lu, R.; Talebi, S.; Haas, C. Deploying 3D scanning based geometric digital twins during fabrication and assembly in offsite manufacturing. Int. J. Constr. Manag. 2021. [Google Scholar] [CrossRef]
- Sprinkler System Cost. Designing Buildings Ltd. 2021. Available online: https://www.designingbuildings.co.uk/wiki/Costs_of_water_automatic_sprinkler_systems (accessed on 20 November 2021).
- Emergency Exit Cost. Alibaba.com. 2021. Available online: https://www.alibaba.com/showroom/fire-escape-stairs.html (accessed on 20 November 2021).
- Self Closing Fire Door Cost. Trudoor, LLC. 2021. Available online: https://www.trudoor.com/commercial-hollow-metal-doors/fire-rated-metal-door/ (accessed on 20 November 2021).
- Liu, C.; Tian, X.; Zhong, M.; Lin, P.; Gong, Y.; Yin, B.; Wang, H. Full-scale experimental study on fire-induced smoke propagation in large underground plant of hydropower station. Tunn. Undergr. Sp. Technol. 2020, 103, 103447. [Google Scholar] [CrossRef]
- Choi, J.S.; Kim, M.B.; Choi, D.H. Experimental investigation on smoke propagation in a transversely ventilated tunnel. J. Fire Sci. 2005, 23, 469–483. [Google Scholar] [CrossRef]
- Ronchi, E.; Nilsson, D.; Kojić, S.; Eriksson, J.; Lovreglio, R.; Modig, H.; Walter, A.L. A virtual reality experiment on flashing lights at emergency exit portals for road tunnel evacuation. Fire Technol. 2016, 52, 623–647. [Google Scholar] [CrossRef]
- Xiao, M.; Zhou, X.; Han, Y.; Bai, G.; Wang, J.; Li, X.; Sunya, S. Simulation and optimization of fire safety emergency evacuation in university library. AIP Adv. 2021, 11, 65323. [Google Scholar] [CrossRef]
- Tian, S.; Chen, Y.; Shen, X.; Dong, W.; Liu, Q. Evacuation simulation and optimization of exit shape based on Pathfinder. Fire Sci. Technol. 2018, 37, 1660–1662. [Google Scholar]
- Talebi, S.; Koskela, L.; Tzortzopoulos, P.; Kagioglou, M.; Krulikowski, A. Deploying geometric dimensioning and tolerancing in construction. Buildings 2020, 10, 62. [Google Scholar] [CrossRef] [Green Version]
- Cleary, T.; Taylor, G. Evaluation of Empirical Evidence Against Zone Models for Smoke Detector Activation Prediction. Fire Technol. 2020, 1–28. [Google Scholar] [CrossRef]
- Szilagyi, C. The comparison of the results of a full scale evacuation test to the calculation method of Hungarian regulations to the Pathfinder softwaren. In Proceedings of the 2013 International Conference in Prague, Prague, Czech Republic, 19–20 April 2013; Czech Technical University in Prague: Prague, Czech Republic, 2013. [Google Scholar]
- Ronchi, E.; Alvear, D.; Berloco, N.; Capote, J.; Colonna, P.; Cuesta, A. Human behaviour in road tunnel fires: Comparison between egress models (FDS+Evac, Steps, Pathfinder). In Proceedings of the 12th International Interflam 2010 Conference, Nottingham, UK, 5–7 July 2010; pp. 837–848. [Google Scholar]
- Rein, G.; Bar-Ilan, A.; Fernandez-Pello, A.C.; Alvares, N. A comparison of three models for the simulation of accidental fires. J. Fire Prot. Eng. 2006, 16, 183–209. [Google Scholar] [CrossRef]


| Equations | Parameter Definition |
|---|---|
| This equation calculates the required evacuation time for occupants to reach the exit, where RSET (s) is required safe evacuation time (s) and (s) depend on the alarm system | |
| (s) and (s) depend on occupants’ characteristics | |
| (s) is the duration between start and end of occupants’ movement | |
| (s) is the duration between start and end of occupants’ movement (s) is occupants’ travel time without queuing (s) is time for passing a queue | |
| (m/s) is the Velocity of occupants | |
| (persons/ ) is the density of occupants in a determined area k is constant a is constant | |
| (s) is occupants’ travel time without queuing L (m) is the travel distance (m/s) is the Velocity of occupants | |
| is specific flow (persons/s/m) (m/s) is Velocity of occupants (persons/ ) is the density of occupants in a determined area | |
| is the occupant’s flow rate (persons/s) is the effective width of the passage (meters) is specific flow (persons/s/m) | |
| is time for passing a queue (s) is the number of persons | |
| is the occupant’s flow rate (persons/s) |
| Equations | Parameter Definition |
|---|---|
| is the heat release rate of fire (kW) | |
| is the time after fire starts flaming (s) | |
| is growth time (s) | |
| is limiting height (m) | |
| is the convective part of the heat release rate (kW) | |
| Qc= χ Q | is the convective part of the fire’s heat release rate (kW) χ is a convective deduction |
When , | z is the height from the bottom of the floor to the smoke stratum (m) is the mass flow rate in a plume at distance (kg/sec.) |
| Ts is smoke stratum temperature (°K) To is environment temperature (°K) is a deduction of convective heat release encompassed in the smoke stratum is the specific heat of fume (1.0 kJ/kg-°K) | |
| V is the volumetric flow rate of smoke (m3/sec.) ρ is density of smoke (kg/m3) | |
| is atmospheric pressure (Pa) R is gas constant (287) T is smoke’s absolute temperature (°K) |
| Fire Safety Measures | Cost (€) | Reference |
|---|---|---|
| Sprinkler | 70,000€ cost for the water reservoir and pumps + 180€ cost for each room | [84] |
| Emergency exit | 2750€ | [85] |
| Self-closing fire door | 200€ | [86] |
| Actual Costs | Percentage of Survivors | Number of Self-Closing Fire Door | Number of Utilized Emergency Exit | Number of Utilized Sprinkler Head |
|---|---|---|---|---|
| 0 | 27.9 | 0 | 0 | 0 |
| 600 | 63.57 | 3 | 0 | 0 |
| 2400 | 69.42 | 12 | 0 | 0 |
| 9300 | 76.33 | 17 | 2 | 0 |
| 84,700 | 91.1 | 17 | 2 | 30 |
| Actual Costs | Percentage of Survivors | Number of Self-Closing Fire Door | Number of Utilized Emergency Exit | Number of Utilized Sprinkler Head |
|---|---|---|---|---|
| 0 | 52.65 | 0 | 0 | 0 |
| 1000 | 68.78 | 5 | 0 | 0 |
| 2000 | 76 | 10 | 0 | 0 |
| 3950 | 82.1 | 6 | 1 | 0 |
| 9950 | 92.9 | 36 | 1 | 0 |
| 11,750 | 93.24 | 45 | 1 | |
| 95,970 | 94.55 | 63 | 2 | 59 |
Publisher’s Note: MDPI stays neutral with regard to jurisdictional claims in published maps and institutional affiliations. |
© 2022 by the authors. Licensee MDPI, Basel, Switzerland. This article is an open access article distributed under the terms and conditions of the Creative Commons Attribution (CC BY) license (https://creativecommons.org/licenses/by/4.0/).
Share and Cite
Sabbaghzadeh, M.; Sheikhkhoshkar, M.; Talebi, S.; Rezazadeh, M.; Rastegar Moghaddam, M.; Khanzadi, M. A BIM-Based Solution for the Optimisation of Fire Safety Measures in the Building Design. Sustainability 2022, 14, 1626. https://doi.org/10.3390/su14031626
Sabbaghzadeh M, Sheikhkhoshkar M, Talebi S, Rezazadeh M, Rastegar Moghaddam M, Khanzadi M. A BIM-Based Solution for the Optimisation of Fire Safety Measures in the Building Design. Sustainability. 2022; 14(3):1626. https://doi.org/10.3390/su14031626
Chicago/Turabian StyleSabbaghzadeh, Mahdi, Moslem Sheikhkhoshkar, Saeed Talebi, Mohammad Rezazadeh, Mohammad Rastegar Moghaddam, and Mostafa Khanzadi. 2022. "A BIM-Based Solution for the Optimisation of Fire Safety Measures in the Building Design" Sustainability 14, no. 3: 1626. https://doi.org/10.3390/su14031626