Article

Assessing Education from Space: Using Satellite Earth Observation to Quantify Overcrowding in Primary Schools in Rural Areas of Nigeria

1
Centre for Environment and Sustainability, Faculty of Engineering and Physical Sciences, University of Surrey, Guildford GU2 7XH, UK
2
Climate and Earth Observation Group, National Physical Laboratory, Teddington TW11 0LW, UK
*
Author to whom correspondence should be addressed.
Sustainability 2022, 14(3), 1408; https://doi.org/10.3390/su14031408
Submission received: 3 December 2021 / Revised: 19 January 2022 / Accepted: 20 January 2022 / Published: 26 January 2022

Abstract

:
Nigeria is a country with a rapidly growing youthful population and the availability of good quality education for all is a key priority in the sustainable development of the country. An important element of this is the need to improve access to high-quality primary education in rural areas. A key indicator for progress on this is the provision of adequate classroom space for the more than 20 million learners in Nigerian public schools because overpopulated classrooms are known to have a strong negative impact on the performance of both pupils and their teachers. However, it can be challenging to rapidly monitor this indicator for the over 60 thousand primary schools, especially in rural areas. In this research, we used satellite Earth Observation (EO) and Nigerian government data to determine the size of available teaching spaces and evaluate the degree of overcrowding in a sample of 1900 randomly selected rural primary schools across 19 Nigerian states spanning all regions of the country. Our analysis shows that 81.4% of the schools examined were overcrowded according to the minimum standard threshold for school size of at least 1.2 m2 of classroom space per pupil defined by the Federal Government of Nigeria. Such overcrowding can be expected to have a negative impact on educational performance, on achieving universal basic education and UN Sustainable Development Goal (SDG) 4 (Quality Education), and it can lead to poverty. While measuring floor area can be performed manually on site, collecting, and reporting such data for the number of rural primary schools in a large and populous country such as Nigeria is a serious, time-consuming administrative task with considerable potential for errors and data gaps. Satellite EO data are readily available including for remote areas, are reproducible and are easy to update over time. This paper provides a proof-of-concept example of how such EO data can contribute to addressing this socio-economic dimension of the SDGs framework.

1. Introduction

Nigeria is the most populous country in Africa, and seventh in the world. It also has one of the largest populations of youth in the world [1]. From an estimated 42.5 million people at the time of independence in 1960, Nigeria’s population has grown to around 195 million in 2018 [2]. Although Nigeria became the largest economy on the African continent in 2014 [3], the country still faces many serious issues such as violent rebellion and terrorism, endemic corruption, low life expectancy, inadequacies in public health systems, income inequalities, and high illiteracy rates [4,5].
The educational system in Nigeria is based on the Universal Basic Education (UBE) programme that was launched in 1999 aiming to provide free, universal, and compulsory basic education for children aged 6 to 15 years old. UBE covers six years of primary school and three years of junior secondary education. This can be followed by optional three years of senior secondary education and four years of tertiary education [6]. It needs to be noted that primary education is the only level of education that is available in urban and rural areas throughout the developed and developing world and is the largest subsector of any education system and so offers a unique opportunity to contribute to the transformation of societies [7,8].
Nigeria’s education system struggles with the challenge of a persistent lack of adequate facilities. There is evidence that UBE is challenged by multiple issues such as insufficient classroom space in relation to high pupil enrolment, inadequate furniture and no functional chalkboards, lack of maintenance of building infrastructure and the lack of teachers [9,10]. All these lead to overcrowded classrooms and limit the quality of educational attainment [11,12,13]. While the UBEC’s report does not specify a legal minimum space requirement for classroom dimensions, it does provide provisions and guidance on space norms which include a minimum standard learning space of 1.2 m2/ pupil in rural primary schools (1.4 m2/pupil for semi-urban and urban primary schools) [6]. Currently, among the suite of standards listed in the UBEC report, the key indicator that the Nigerian government uses for measuring quality education and equity is the Pupil—Teacher Ratio (PTR), with an ideal value set at 35:1 for primary schools [14]. Values higher than this equates to overcrowding in schools. However, while it is often claimed to be a key indicator, we found limited literature showing the PTR at the state and Local Government Areas (LGA) level in Nigeria, reflecting a weak and often highly politicised statistical system [15,16]. Many issues for national statistics offices in developing countries such as Nigeria often include a lack of timely data of suitable quality, a simple lack of data, limited independence of statistical information, unstable budgets, and misaligned incentives. These issues encourage the production of inaccurate data, the domination of national priorities by various sponsors, and limited access to and usability of the traditional data [17,18,19,20].
Despite these data challenges, researchers have conducted surveys in different states of Nigeria. For example, Opanuga et al. [14] noted that 81% of the 133 public primary schools in Ogun State have a PTR over 35:1. Moreover, a survey conducted by Ndem et al. [21] in Cross River State schools found an occurrence of high PTRs, such as 49:1 in primary and 62:1 at the junior secondary level. A most remarkable example of high PTR linked with overcrowding is noted in Sherry’s 2008 [22]: “all the schools I have seen are hugely overcrowded. In one record case, in a rural school, I saw a class of over 200 pupils of ages ranging from 11 to 21 with only one teacher to attend to them.” ([22], pp. 39–40). A five-year study that sought to support equitable access to education and improve the learning outcomes from basic education systems entitled ‘Education Data, Research and Evaluation in Nigeria (EDOREN)’ found that: “consideration needs to be given to alternative ways of assessing classroom overcrowding, to complement pupil–teacher ratio rates, as the latter does not necessarily give an accurate indication of the numbers on the ground and can give the impression that classes are of manageable size when in reality they are not” [9]. Overcrowded classrooms are well-known to be detrimental to educational outcomes [14,23] and have been reported in many studies as having a negative impact on adult and youth literacy [24,25]. Respondents of a survey conducted by Olaleye et al. [26] concluded that the shortage of building infrastructure of adequate quality was a major cause of overcrowded classrooms in Nigeria and Ikoya and Onoyase [27] presented a comprehensive national survey of primary school infrastructure that found 53% of the schools surveyed lacked fundamental structures. In addition, the assessment of basic education facilities in Kano, Jigawa, and Kaduna States by the Education Sector Support Programme in Nigeria (ESSPIN) concluded that around 75% of school infrastructure was “very poor” [28], while in Adamawa State 67% of public primary school classrooms were deemed to be in “poor condition” [13]. In a federal system such as in Nigeria, where taxes are raised at national and state levels, there can be disparities in wealth between states and this can influence the resources they have available to allocate to education [9]. Disparities in the resourcing of education between states can, in turn, lead to differences in education outcomes (e.g., literacy and numeracy) and differences in educational outcomes can in turn influence socio-economic indicators such as poverty; thus, there can be a negative reinforcement of inequality between states [29].
The present research aimed to evaluate the utility of data derived from satellite Earth Observation (EO) data as a direct measurement of classroom size and to determine the amount of classroom space allocated to pupils in rural primary schools in Nigeria. Although classroom areas could be individually measured by school staff, EO provides an opportunity for an independent, and, through image recognition machine learning algorithms, rapid assessment applicable to the whole country. Because Nigerian rural primary schools are built to a common pattern, they are easy to detect from satellite imagery. Each school is located near a road, with a playing field in front and a line of rectangular buildings (classrooms) behind and typically running parallel with the road. Thus, unlike surveys and measurements on site, EO satellite data provide the potential for a rapid, inexpensive, and accurate assessment [30].
In this study, we provide a first proof-of-concept assessment of the use of EO data for measuring school building footprints (area m2) that could help governments and non-governmental organisations (NGOs) quickly identify schools with overcrowded classrooms. Classroom areas (m2) were measured for 1900 rural primary schools across 19 Nigerian states and in combination with available enrolment data, a determination was made of the area per pupil for each school. Primary schools in rural areas were chosen for the research because i) they are an important component of delivering Nigeria’s UBE ambitions and ii) most rural primary schools are single-storey buildings facilitating accurate measurements from satellite imagery.
Having estimated the area per pupil as an indicator of resourcing per pupil, the research then sought to use the data to explore whether there are links with existing data on educational outcomes such as literacy and numeracy. The latter has often been noted in studies based in the developed world [31], but literature is scarce to support such an association for the developing world, especially for Sub-Saharan Africa [26,32].

2. Materials and Methods
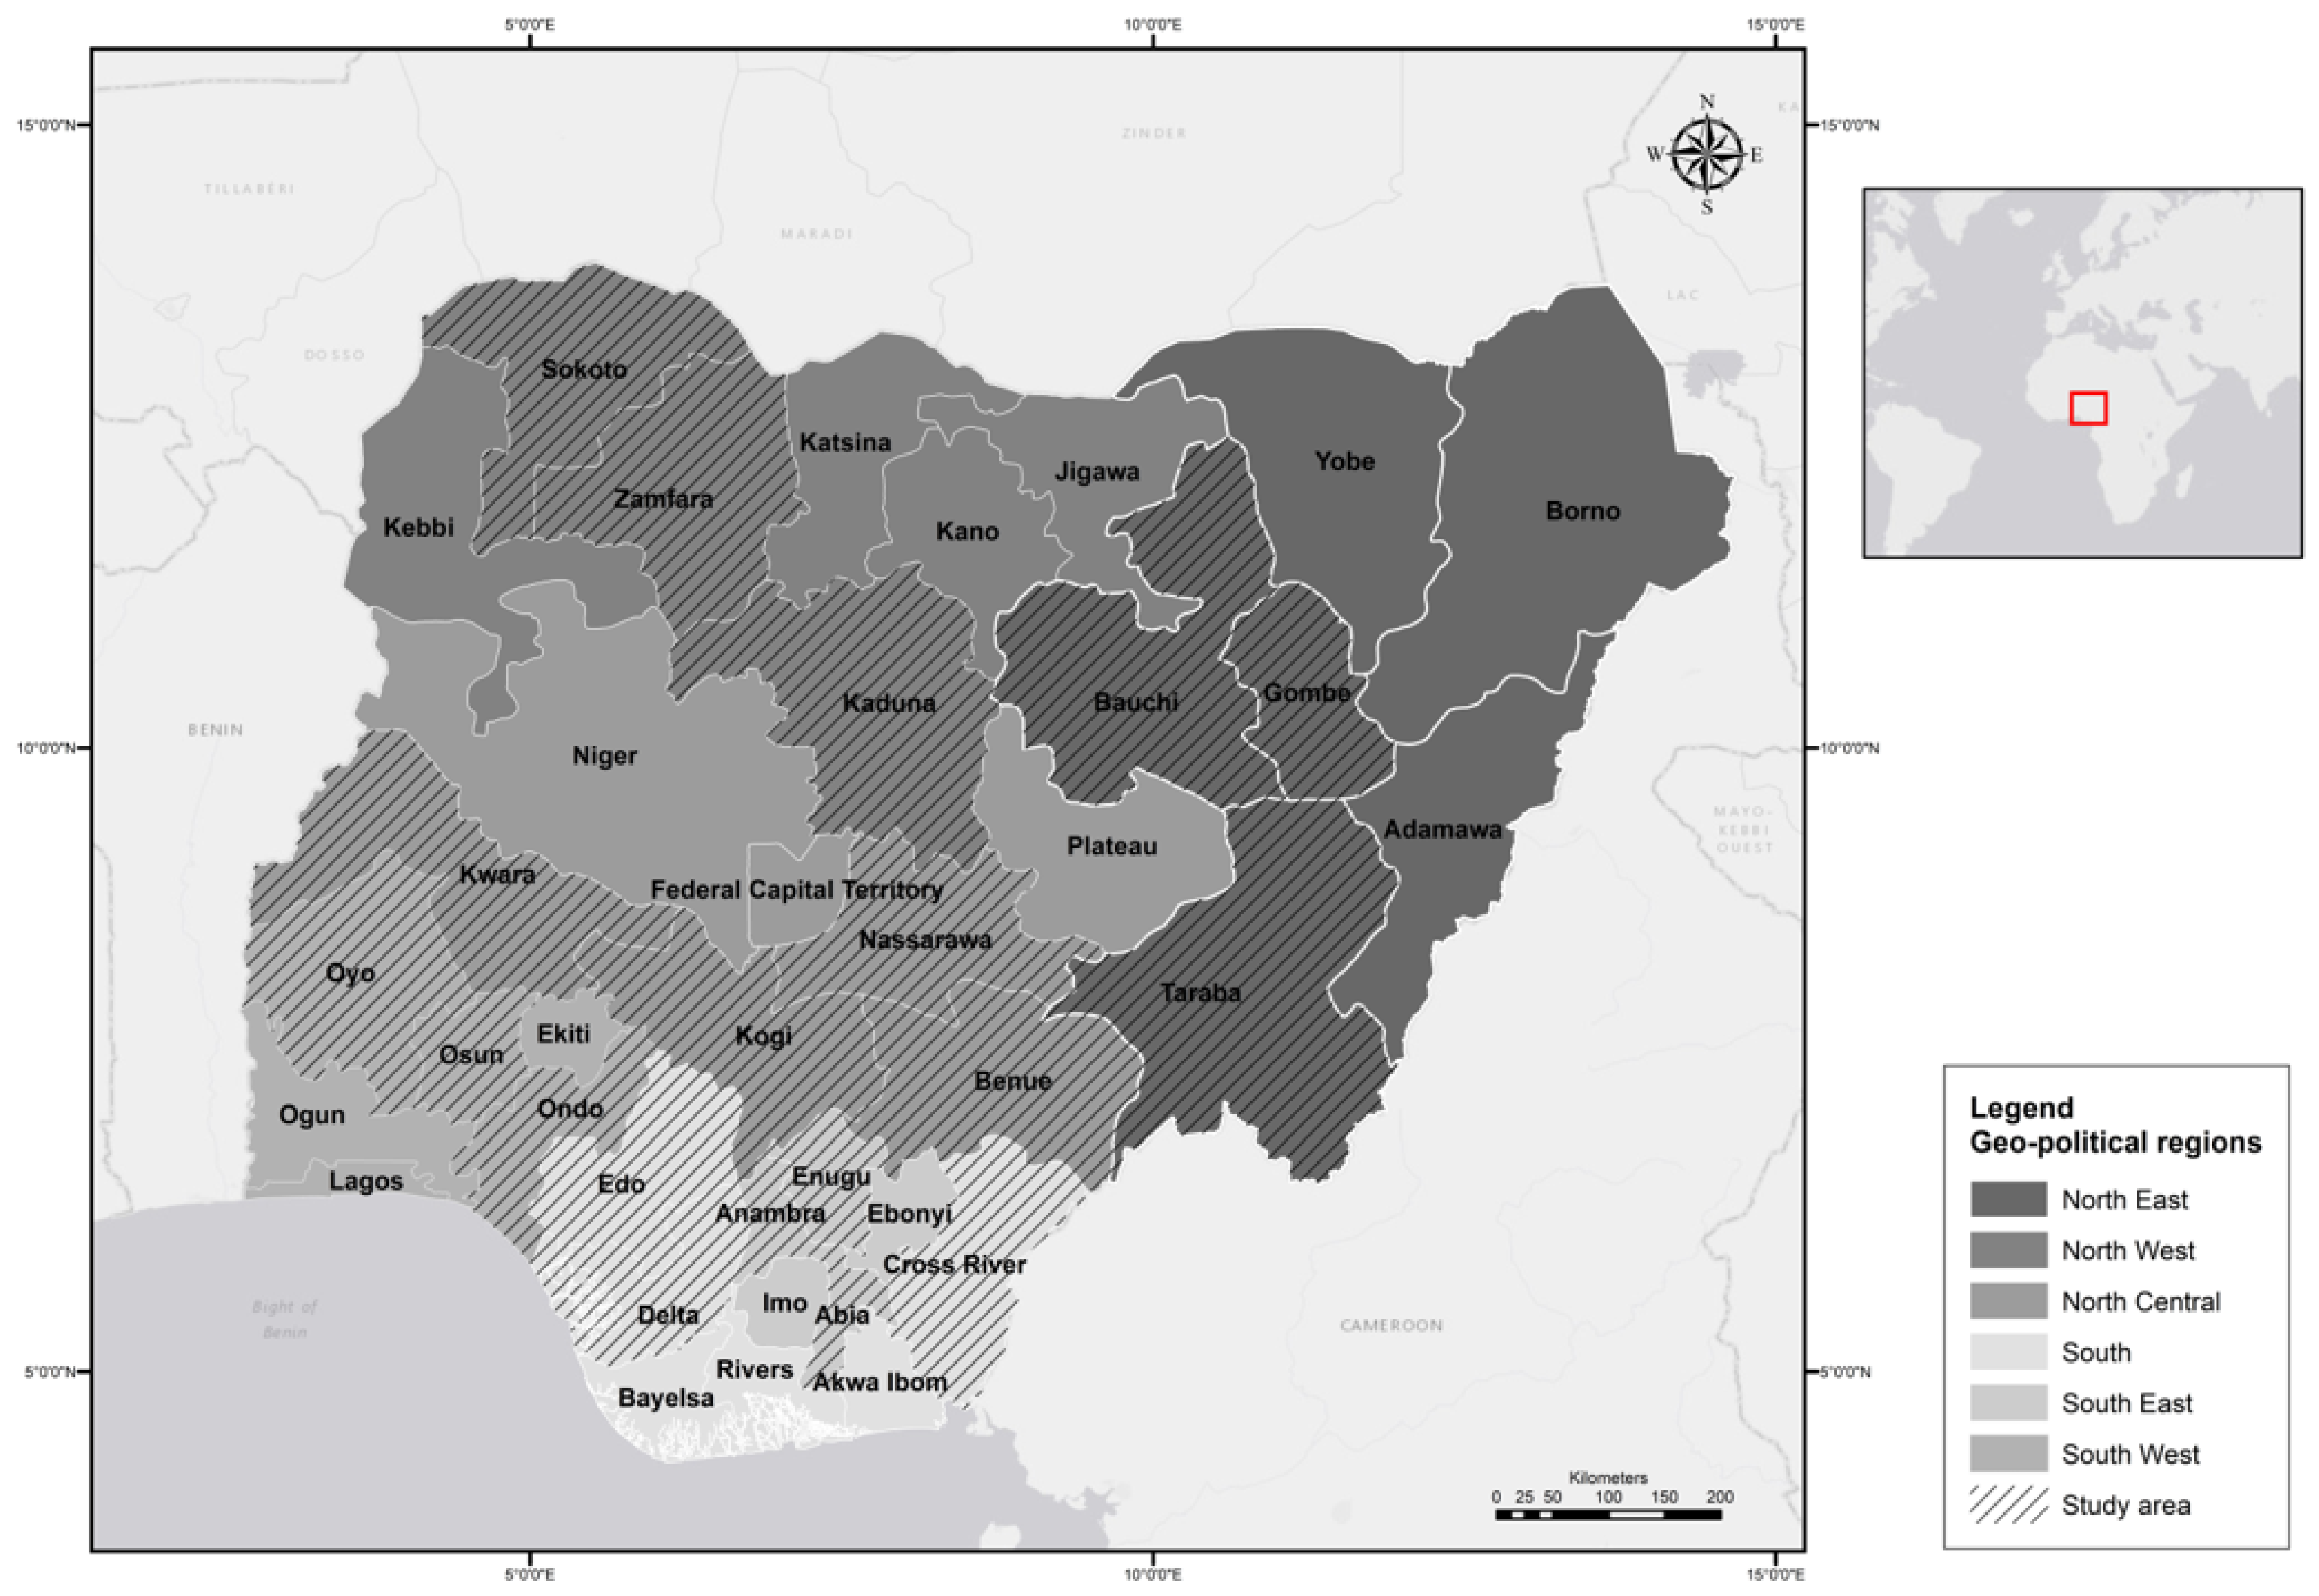
2.1. Study Area

Policies aimed at providing free universal primary education for all children in Nigeria pre-date independence from Britain in 1960. In the 1950s the colonial government recognised that secondary and tertiary education should be prioritised to provide the required number of teachers to achieve universal primary education (UPE). The attainment of UPE gathered pace during the 1960s but was piecemeal as separate states implemented their policies [33]. However, in 1976 the military government launched a major effort to implement free UPE across the entire country based on a significant school building programme and the recruitment and training of teachers [33]. Despite the prioritisation of UPE by successive governments (both civilian and military), the realisation of UPE remains a challenge and, since 1976, there have been many initiatives designed to address bottlenecks and constraints within the system. Later the UPE programme has morphed into UBE.
Nigeria has a federal system of governance, and the country comprises 36 states, each with its own governor and state assembly, plus the Federal Capital Territory (FCT) which houses the capital city of Abuja. Within the states, there are 768 Local Government Areas (LGA) and six Area Councils within the FCT, totalling 774 [34]. Responsibility for educational institutions is shared between different bodies at the federal, state, and local government levels, and a suite of indicators have been developed to help assess the quality of UBE received by pupils and their attainment. Various standards for basic education were urged by the Universal Basic Education Commission (UBEC) in 2000 as part of Nigeria’s efforts to achieve the second Millennium Development Goal (MDG) of universal primary education [6]. For convenience, these states and the FCT are often classified in terms of six geopolitical zones primarily based on location, but which would also broadly encompass the major ethnic groups in the country. The South-West geopolitical zone, for example, largely comprises the Yoruba ethnic group while the South-East largely comprises the Igbo ethnic group [35,36]. But given the country comprises hundreds of ethnic groups a geopolitical zone will not be homogenous [36,37]. The same point applies to factors such as religious belief. In broad terms, the country comprises an Islamic north and Christian south, but geopolitical zones such as the South-West and North-Central, in particular, will be mixed [36]. The country also has an economic axis that runs from south to north in terms of wealth per capita; the southern zones tend to be richer than the northern ones [38] and this results in southern states having more resources available for investment in education. The authors hypothesised that these differences in wealth between states would, in turn, result in differences in area per pupil.
For this study, 19 states (Figure 1) were selected to span all six geopolitical regions of the country. These were:
  • North Central—Kogi, Benue, Kwara, Nasarawa;
  • North Eastern—Bauchi, Taraba, Gombe;
  • North Western—Sokoto, Kaduna, Zamfira;
  • South—Edo, Delta, Cross River;
  • South Eastern—Enugu, Abia, Anambra;
  • South Western—Ondo, Oyo, Osun.
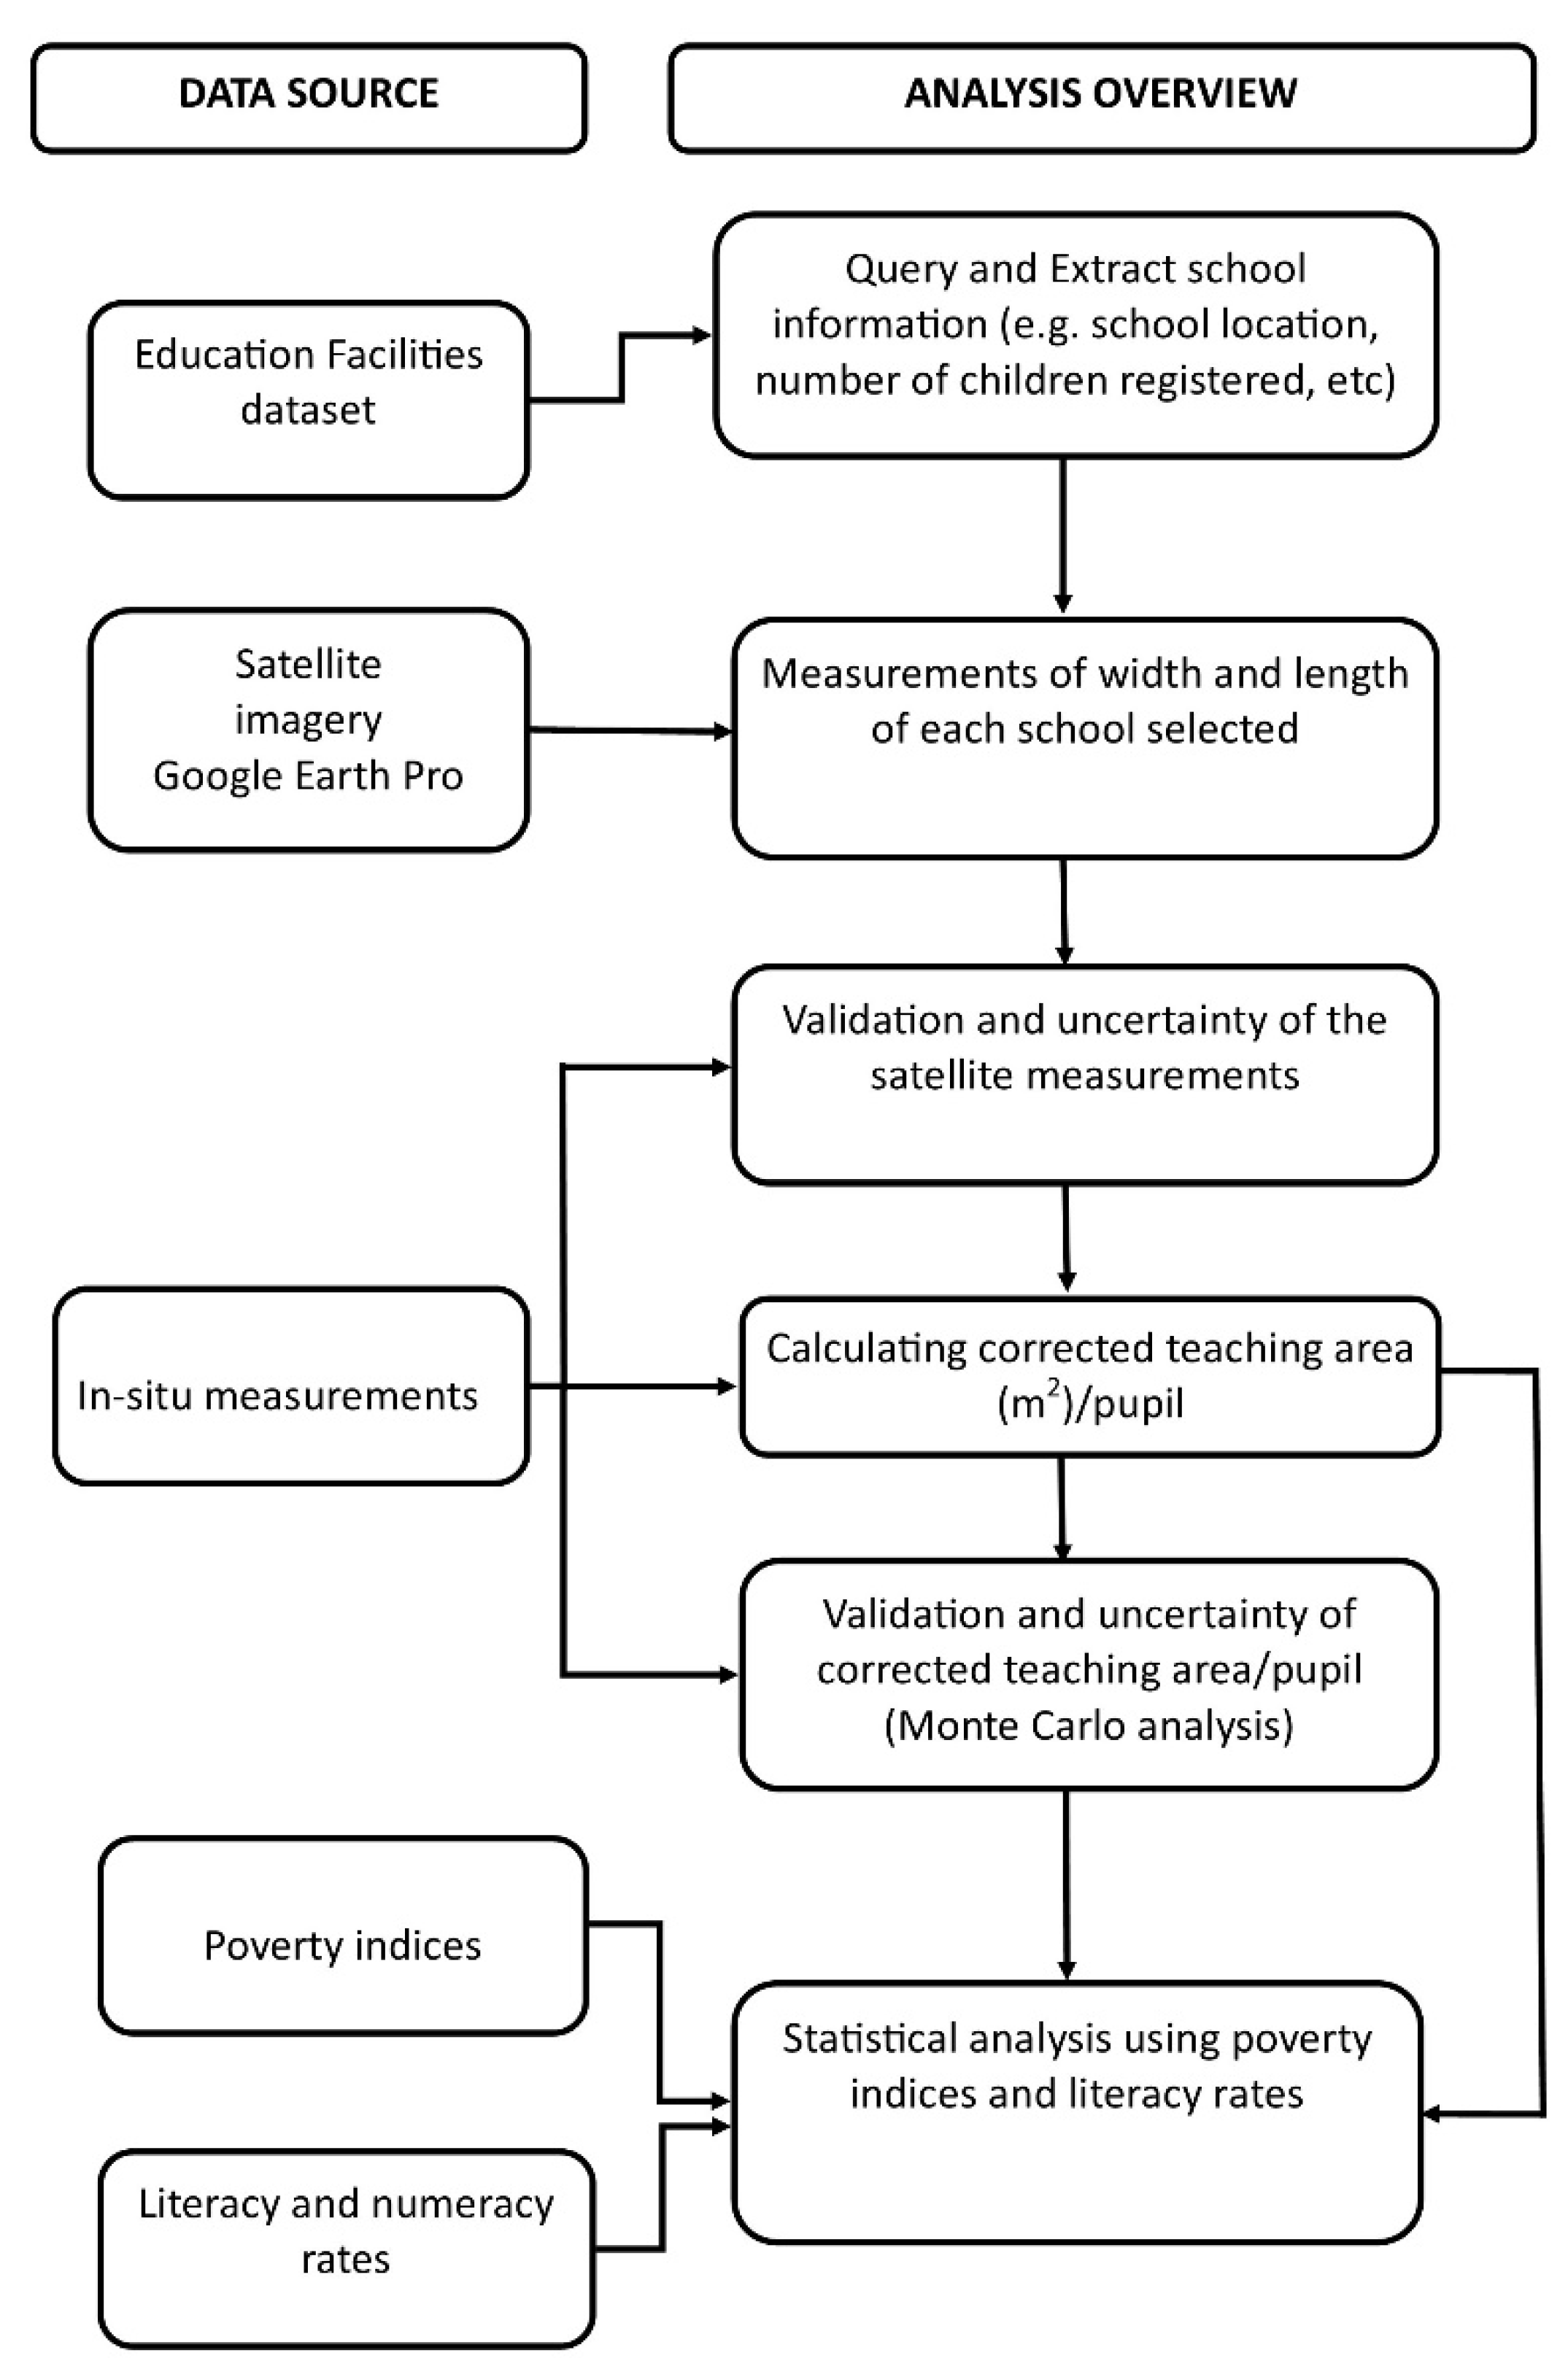
2.2. Data Sources

Nigerian government data resources for rural primary schools [39] and satellite imageries from Google Earth Pro were used as the main data sources for the research. Firstly, the location of all primary schools was obtained via the Education Facilities in Nigeria (EFN) dataset [40] which includes school location (latitude and longitude), school type (primary, secondary, etc), school name, number of children registered, number of toilets, date of survey (survey period between 2009 and 2014), and number of teachers. The database comprises 98,667 primary schools across Nigeria and its goal was to build Nigeria’s first nation-wide inventory of education facilities, to make the data collected available to planners, government officials, and the public, to be used to make strategic decisions for planning relevant interventions and to help achieve the MDGs.
The Google Earth Pro platform uses historical satellite and aerial imagery, at different spatial resolutions, which collect each image at a specific date and time. Most images used for this study came from satellites of very high resolution, and the date of the images was chosen to be close to the data of the pupil number survey (listed in [39]). For best results in measuring the footprints of school buildings, a top-down view of the images has been used as recommended in [39].
Given the lack of published and official data on the area (m2)/pupil or pupil density in primary schools in Nigeria, but also to support validation of Google Earth measurements and later the calculation of the teaching area per pupil, classroom buildings in a subset of schools were physically measured. A professional town planner team was recruited to conduct on-site measurements of school buildings in Ogun State. Due to the COVID-19 travel restrictions and practical issues, this state was one of the few where travelling was allowed at the time of the research but still there were constraints in terms of accessing the school interior. Although this state was not part of our original selection, the fact that all rural schools were built in a nationwide characteristic pattern and in a typical morphology, we expect similar results in other parts of the country.
The team measured the exterior dimensions of the building for 21 primary schools from rural areas (listed in Table S1), and these were compared to the estimates made via satellite images (Table S2).
A series of national survey data was used to establish a causal relationship between the space per pupil and the educational outcomes of literacy and numeracy rates, as these variables have often been noted in the literature to have a significant negative association with pupil density.
The youth literacy and numeracy percentages (children age 5–16 able to read) by the state were taken from the Nigeria Education Data Survey [41] for the 19 studied states (Table 1). This survey was designed to provide information about the ability of children aged 5–16 years old and adults in a sample of 30,000 households to read and be numerate.
As a further level of exploration, we sought to check whether the area/pupil indicator is linked with data on a variety of socio-economic measures of poverty available at the state level in Nigeria. For the latter, we used the following widely used indices for measuring poverty [42]: the poverty headcount ratio at US$3.20, consumption poverty headcount, Multidimensional Poverty Index (MPI) headcount, and relative poverty. The data have been collected under different surveys and methodologies and calculated at the state level in Nigeria (Table 2). The poverty rates of these indicators are given in Table 3 for each state in the present research.

2.3. Analysis

An overview of the analysis approach used in this paper is shown in Figure 2. The analysis had the main aim of exploring the utility of a method for evaluating the overcrowding of an individual school from satellite EO imagery of the school buildings and national statistical office data on pupil enrolments. The question being asked here was whether it is feasible to use EO-derived data to assess building footprint area and thereby use that measure as part of the area per pupil indicator? This process includes an analysis of the challenges involved in the measurement process. The EO-based measurements were used to assess area per pupil and based on the target employed in Nigeria of at least 1.2 m2 being needed for a pupil it was possible to assess the degree of overcrowding (i.e., the proportion of schools having < 1.2 m2/pupil). Firstly, we queried and extracted the EFN information relating to school type (e.g., primary), school management (e.g., public), schools’ location, name, date of survey, and the number of pupils registered. Then, the width and length of each school building were measured using very high resolution (VHR) satellite images and the external area (m2) was determined. The assessment of building footprint was directly checked against results obtained via ground-truthing (using a sample of schools in Ogun State; details below) and UBEC information that 15% of a school’s built area should be attributed for administration [6]. This process allowed the authors to assess whether their measurements via EO had potential inaccuracies due to factors such as correct identification of buildings used for teaching rather than for other uses such as storage and also school buildings having a large veranda. However, even in the latter case, it is common for schools in Nigeria to use verandas as teaching spaces. Furthermore, we explored the results of the corrected teaching area to test for a possible association between educational attainment (youth literacy and numeracy rates) and poverty indices.

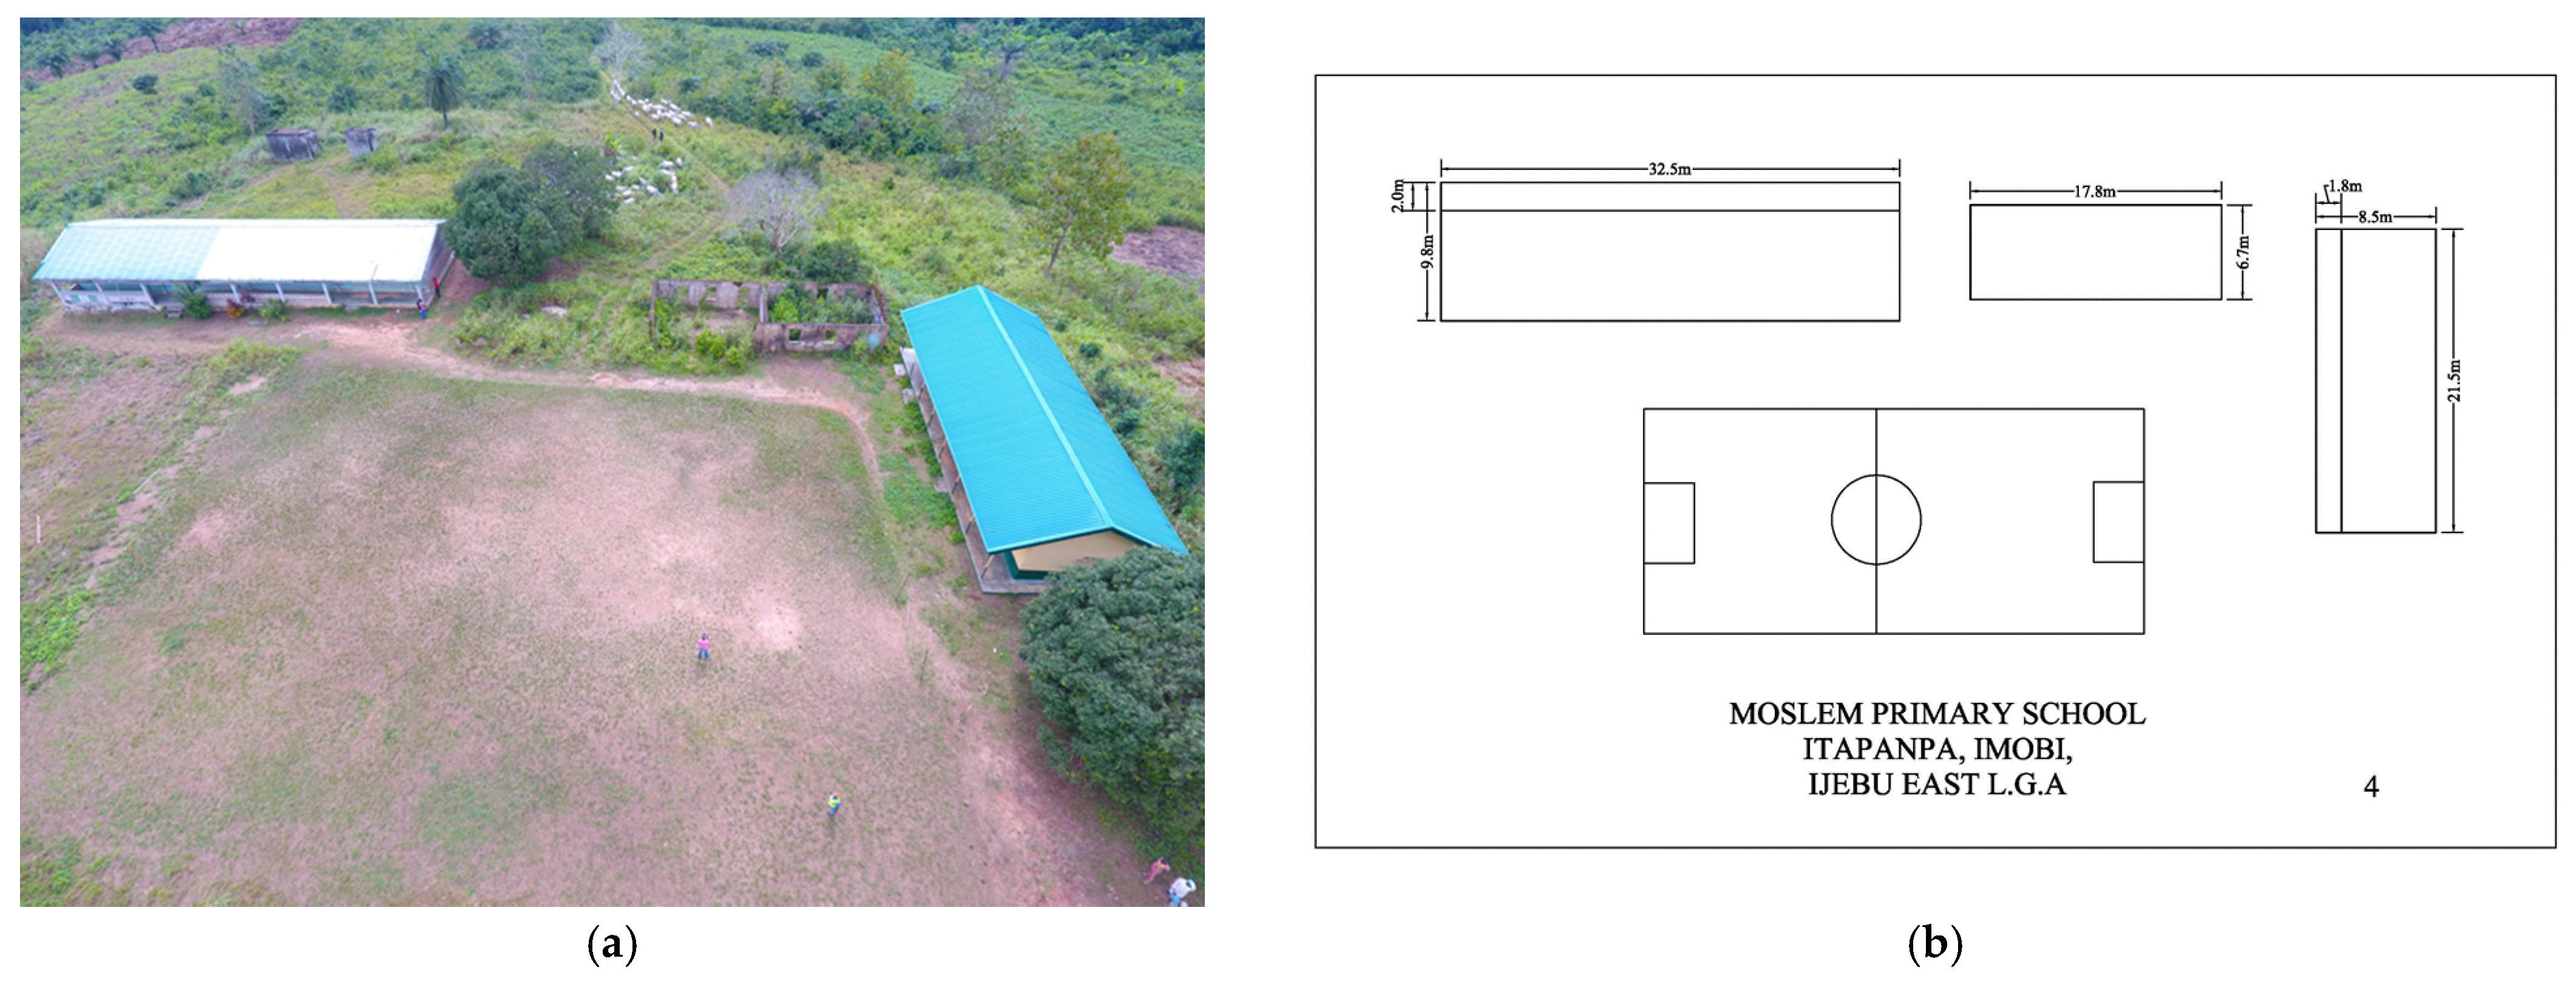
2.4. Evaluating the Teaching Area

The EFN datasets were queried by school type, to obtain data on 60,000 public primary schools across the country. Having the approximate coordinates of the school location, these were overlaid on the Google Earth satellite images and 1900 schools (100 schools per state) from rural areas were selected using a random selection, with at least 2 km between schools, from rural areas using buffer measure tool in Google Earth, spanning all the geopolitical zones.

2.4.1. Google Earth Schools’ Measurements

The total area (m2) of the school building was obtained by measuring the length and width of each building within the selected school, using historical images from the same year as the EFN survey (from 2011–2016). The measurements were performed by the same operator manually measuring the length and width of each building within the school using the ruler tool in Google Earth and storing these measurements in an Excel spreadsheet. Where images from the same year were not available, the closest year for when images were available was selected. Identifying the school buildings was straightforward, as almost all sample schools followed a common pattern as expected from the rapid school building programme that took place during the mid-1970s. Figure 3 shows four examples of school configurations and locations that present characteristic patterns and a typical morphology, such as a schoolyard with bare soil or mowed grass, rectangular-shaped buildings, having up to 5 building units in a row, L or U building layout, and being in a peripheral location in the village adjacent to the main road (dirt road in most cases). Thus, teaching blocks (perhaps comprising more than one classroom) can be readily identified as being the larger buildings surrounding the playing field. While a typical school classroom block will have a veranda, the pressure on space is such that these are also often used for teaching. For operational use at the national scale, an image-processing classification algorithm supported by machine learning techniques could be alternatively used to perform this step and there are likely to be benefits in acquiring operational VHR data and using a more sophisticated processing platform.

2.4.2. Validation and Uncertainty Analysis

In any analysis method, and particularly when an approach is new, it is important to understand the uncertainty associated with the approach and to validate the results. This provides the information for users to judge the fitness for purpose of the data and the inferences drawn from them. Here, we wanted to evaluate a quantitative uncertainty associated with the area per pupil estimates and to validate the satellite measurements against on site measurements.
To validate the measurements taken from satellite images of Google Earth, we were aware of two main sources of uncertainties, one is that satellite images would not provide information about the building functionality (classroom, laboratory, office, veranda, etc.). The second concerns the repeatability of the measurement process in Google Earth.
The Guide to the Expression of Uncertainty in Measurement (GUM) provides a standard method for evaluating and propagating uncertainties [47] using two methods: the Law of Propagation of Uncertainties and Monte Carlo Analysis [48]. Both were employed in this analysis.
To evaluate the uncertainty, a sub-sample of 21 rural schools (with a total of 55 buildings) were selected for ground-truth measurement in Ogun State (South-Western Zone) and UBEC standards for administrative areas [6]. The team of planners provided for each school the width and length of each building and veranda (if present), along with a building plan as a pdf format document and a drone image (one example is presented in Figure 4). They also provided the number of buildings, number of building floors (always one for primary schools in our sample), details about building conditions, number of offices, and lavatory facilities within the school (see Table S1). From the on-site measurements, it was apparent that buildings with at least 6.5 m width had a veranda and toilets with a width of less than 4 m, and length less than 7 m are detached as small buildings (as seen in Figure 4—the building without roof) (see Table S2). As the planner team was not allowed to take internal measurements within buildings, the administrative area is unknown. UBEC [6] recommends that 15% of the total building area for each school should be attributed for administrative purposes (e.g., office, storage).
To estimate the uncertainty associated with the measured building sizes, we considered two components that we defined as “reproducibility uncertainty” (accuracy of the Google Earth measurements compared to on-site measurements) and “repeatability uncertainty” (repeatability of multiple measurements in Google Earth).
It should be noted that Google imagery does not have the resolution needed to provide sharp demarcations for the buildings. Thus, it was not possible to know precisely where the edge of the building was in the image. Hence it is important to establish an uncertainty associated with the Google-based assessments of area and inferences.

2.5. Calculating Corrected Teaching Area Per Pupil

2.5.1. Model Development

As described above, the initial measurements of buildings using Google Earth might contain inaccuracies associated with building functionality since there are aspects that are opaque to satellite EO, such as the size of administrative areas (e.g., offices), storage areas, and verandas. The on-site measurements revealed that small buildings with less than 4 m width and 7 m length are non-teaching areas (e.g., toilet blocks or storage areas) and hence they were removed from further analysis. For this analysis, and despite the fact that schools often use verandas as teaching areas, we removed a veranda area for larger buildings. We also removed our best estimate of administrative areas.
The calculation of “teaching area per pupil” thus followed Equations (1) and (2).
    A T , j = [ i = 1 n L i ( W i W V , i )   ] × ( 1 S off B j )  
where,
A T , j is the corrected teaching area of the j th school (in m2),
i is an index representing the individual school buildings (in total there are n buildings),
L i is the measured (from satellite imagery) external length of the i th building, in metres,
W i   is the measured (from satellite imagery) external width of the i th building, in metres,
W V , i is the assumed width of the veranda for school building i .
Based on the analysis of the 21 schools measured on-site, it was assumed that the veranda width would be 2 m for buildings wider than 10 m and 1.6 m for buildings from 6.5 m to 10 m wide. Smaller buildings less than 6.5 m had no veranda. Mathematically expressed:
W V , i = { 2   m ,   W i > 10   m 1.6   m , 10   m > W i > 6.5   m 0   m , W i < 6.5   m
To account for the space of administrative areas, an extra term was included: ( 1 S off ) B j is a term that reduces the teaching area of the school if the buildings are big enough to have office and storage space. If the school has more than three buildings, then it was assumed that the office space is 15% of the total school area after removing the veranda.
S off = 0.15 is the proportion of the building area taken up by offices.
B j = { 1 n 3 0 n = 1 , 2
is a Boolean that takes the value 1 if there are 3 or more buildings in school j and 0 otherwise. Therefore, the teaching area per pupil ( α )   is given by
α = A T N p
where,
A T is the corrected teaching area,
N p is the number of pupils in a measured school.

2.5.2. Estimation of the Uncertainty of the Google Earth Measurements of the Buildings

To estimate the repeatability uncertainty, each of the 55 buildings in the 21 reference schools was measured 10 times (by the same operator) in Google Earth. The standard deviations of the 10 measurements are shown in Figure 5a and show the spread (28%) expected from a standard deviation calculated from just ten measurements. Those values also show no pattern as a function of actual length or width and therefore we consider the mean value (0.3 m) to be the uncertainty associated with random effects in a single Google Earth Pro measurement (the 1900 schools in the main set were each only measured once).
To estimate the reproducibility uncertainty, we took the average value of the 10 measurements of the length and width from the Google Earth Pro measurements and subtracted the on-site measured length or width from this. The differences obtained are given in Figure 5b. If the difference could be entirely explained by the random repeatability effects, we would expect the uncertainty associated with the mean of the ten measurements to be equal to the uncertainty associated with a single measurement (0.3 m) divided by 10 (i.e., 0.095 m). We see from Figure 5b that the actual spread is closer to 0.4 m (the standard deviation of the points is 0.43 m).
The increased spread of 0.4 m, in Figure 5b is symmetrical around the 0 axis; there is no obvious systematic bias between on site measurements and Google Earth Pro, but there is a randomly distributed difference between the two that cannot be accounted for by the random spread in the Google Earth Pro measurements alone.
From these two analyses, we can determine that the uncertainty associated with a single (rather than the mean of ten) measurement in Google Earth Pro contains a repeatability component of 0.3 m and a reproducibility component of 0.4 m. The uncertainty associated with a single building’s length and/or width is obtained by combining these two quantities according to the GUM’s law of propagation of uncertainties, and is, therefore:
u ( L i ) = u repeat 2 + u reproduce 2 = 0.3 2 + 0.4 2 = 0.5   m

2.5.3. Uncertainty Analysis for Teaching Area per Pupil

To establish the uncertainty associated with the teaching area per pupil for a single school, Monte Carlo analysis was performed, using the uncertainty distributions described in Table 4. For this, a Python-coded algorithm that calculates Equations (1) and (2) was placed within a “for loop” and run 50 times (see Table S3). Within each loop, the different parameters were varied, for example by adding to the length and width of each building a random error from a Gaussian distribution with a standard deviation of 0.5 m, or by treating the office proportion, Soff as a quantity taken from a uniform random distribution between 0.10 and 0.20. The different errors were treated entirely independently —that is a separate random number was generated for every length and width measurement of every building in every school and for every Monte Carlo iteration.
Monte Carlo simulations are a method of uncertainty analysis described in the GUM [48]. The standard deviation of the results of the 50 individual Monte Carlo iterations provides an uncertainty estimate for the results obtained without perturbing the data. For Monte Carlo simulation to provide a reliable estimate of the uncertainty, an estimate of the uncertainty associated with the individual input parameters is required in order to define the probability distribution from which the random errors are calculated. Table 4 lists the uncertainties that we assumed.

2.6. Summary Statistics

2.6.1. Corrected Teaching Area Per Pupil

Basic summary statistics are calculated for the data set, both coming from the original data set and the Monte Carlo outputs. The original data set results are presented as the results of the analysis and the standard deviation of the Monte Carlo outputs are used to evaluate the uncertainty.

2.6.2. Statistical Analysis using Socio-Economic Indicators

It has been well-reported in the literature that pupil density (or area/pupil) is linked to outcomes such as literacy and numeracy [14,23,24,25]. Therefore, we attempted to test the validity of the values obtained from Equation (2) and evaluate the relationship between teaching area/pupil and percentage of children (age 5–16) able to read and be numerate at the state level using Welch’s ANOVA.
Welch’s ANOVA is a test of multiple comparisons of means (a modified one-way ANOVA) that is appropriate to use when there are unequal sample sizes and heterogeneity variance. Non-parametric methods such as Kruskal Wallis can be also used but Welch’s ANOVA fits better especially with heterogeneous large datasets [49]. Welch’s ANOVA was performed in Excel (extension Sigma XL), so we tested the hypothesis as follows:
  • Null Hypothesis (H0): all five groups means are the same
  • Alternative hypothesis (Ha): at least one mean is different
First, we used the teaching area (m2)/pupil data measured for 1900 schools and the literacy and numeracy rates related to the states where the schools are located. Then, we grouped the states into 5 classes for the literacy and numeracy rates in Table 5 and Table 6. To demonstrate Welch’s ANOVA, we used the literacy and numerate groups in relation to the mean teaching area (m2)/ pupil.

3. Results

3.1. Values and Associated Uncertainties for Each School

To establish the uncertainty associated with the teaching area per pupil calculated according to Equation (2), a Python program was written to calculate Equations (1) and (2) 50 times as a Monte Carlo simulation (Table S3). As an example of the output, Figure 6 shows the 50 Monte Carlo runs on the teaching area/pupil and the original data analysis (Equations (1) and (2)) (illustrated in black diamond) on the first 50 schools in the dataset. For the vast majority of schools, the originally measured value is close to the centre of the Monte Carlo distribution. However, there are cases when it comes closer to the top or bottom, due to those schools where at least one building is close in width to the boundary conditions for having a veranda or not. Such cases create a bias between the Monte Carlo result set and the original data. Moreover, Tables S4 and S5, Figures S1–S3 include a further investigation on both biases (difference between the average of the Monte Carlo output and the originally determined value) and the standard deviation of the Monte Carlo output.

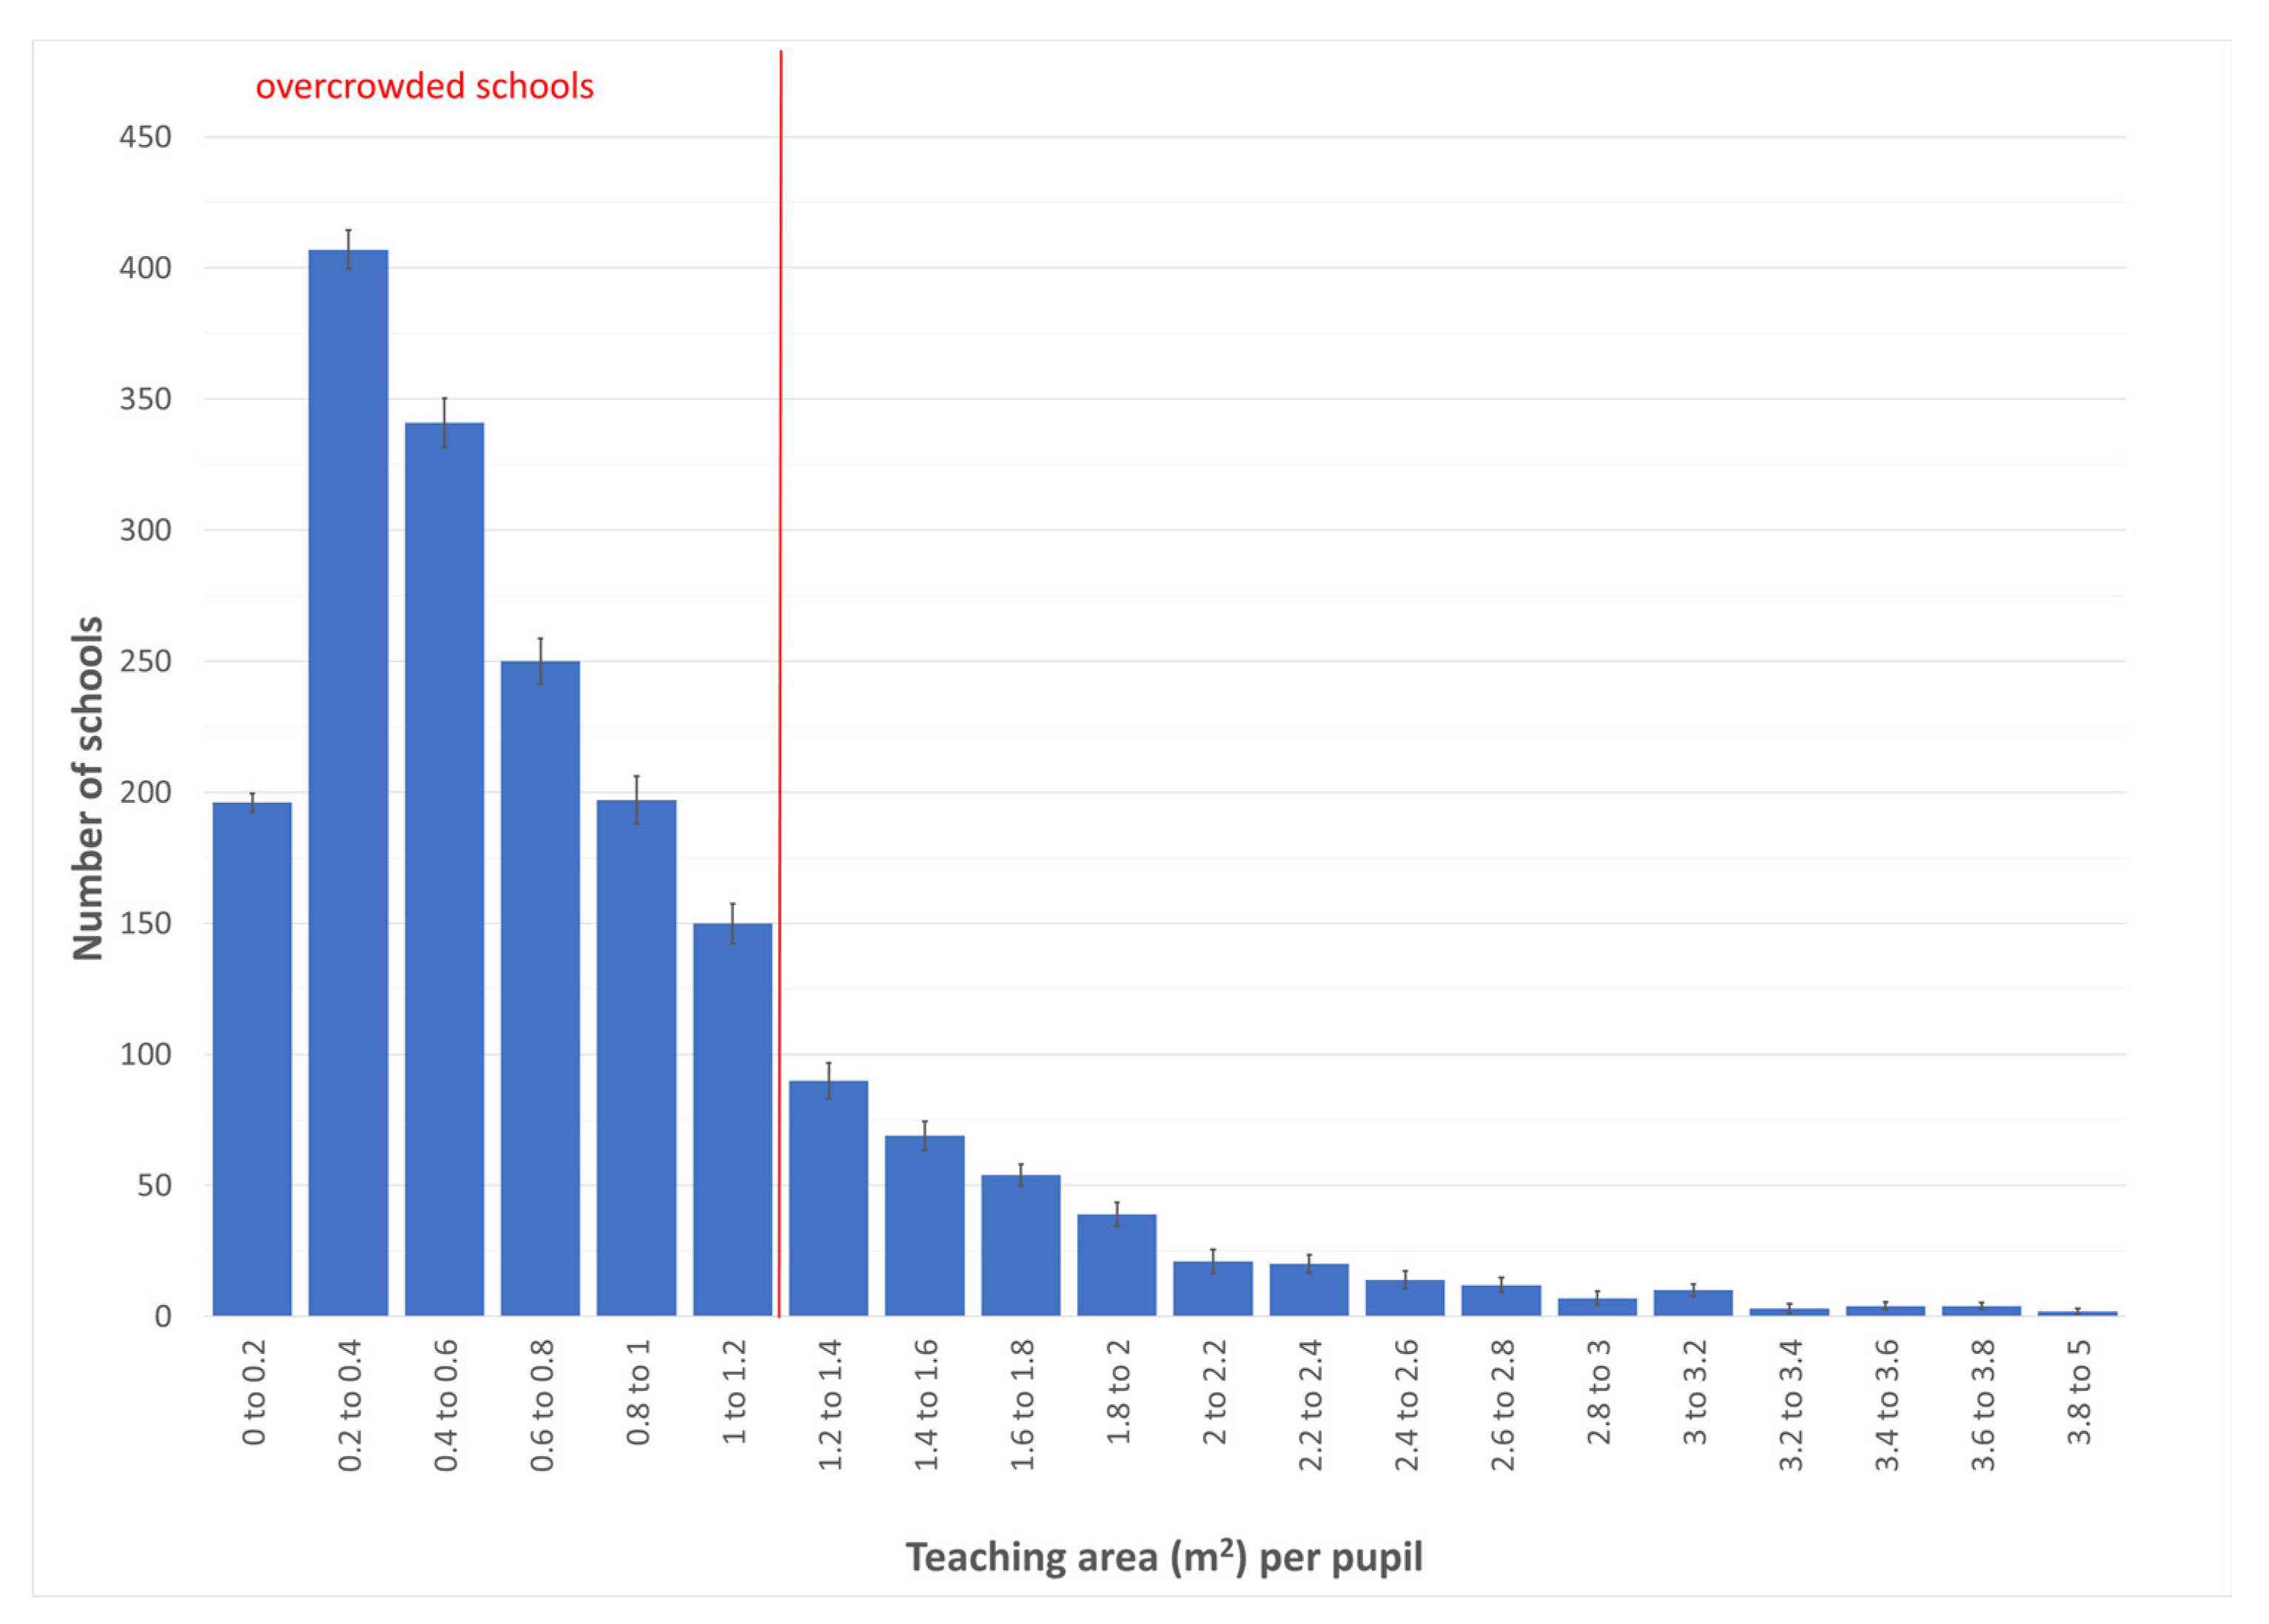
3.2. Basic Summary Statistics

From the Monte Carlo analysis, we determined that, typically, for a single school with the teaching area per pupil calculated according to Equations (1) and (2), the uncertainty associated with that school “teaching area per pupil” was 10% of the value (see Supplementary Material Table S5, Figures S2 and S3).
A histogram of the area per pupil calculated for the 1900 individual schools is given in Figure 7. This histogram was calculated an additional 50 times, each time using the results of a separate Monte Carlo run for the 1900 schools. The error bars in Figure 7 are calculated as the standard deviation of the histograms calculated for the 50 Monte Carlo runs results.
We calculated the summary statistics for the set of 1900 schools (Table 7) and found that 81.4% of the measured schools do not have a minimum required teaching space for children (a school is overcrowded if the teaching area per pupil is less than 1.2 m2). Note that the standard uncertainties for the statistical values in Table 7 are considerably less than the 10% standard uncertainty associated with a single school. This is because the uncertainties are random from school to school and are reduced in effect by the very large number of schools considered.

3.3. Teaching Area/Pupil in Relation to Socio-Economic Indicators

3.3.1. Literacy and Numeracy Rates

Welch’s ANOVA was applied to understand the relationship between the mean area m2/ pupil and education performance (literacy and numeracy rates) analyses. Therefore, Table 8 presents the sample size (number of schools), the mean of area m2/ pupil, standard error and standard deviation of each literacy and numeracy group (also presented above in Table 5 and Table 6, Section 2.6.2), as well as the results of Welch’s ANOVA. The results of applying Welch’s ANOVA’s show that there are statistically significant (p < 0.0001) differences in teaching area/pupil between the five literacy and numeracy groups, indicating that lower teaching means area m2/pupil (overcrowded) are associated with low literacy and numeracy rates (% children 5–12 able to read and numerate), and conversely when more space is allocated to the pupil gradually increased, there is better performance in schools.

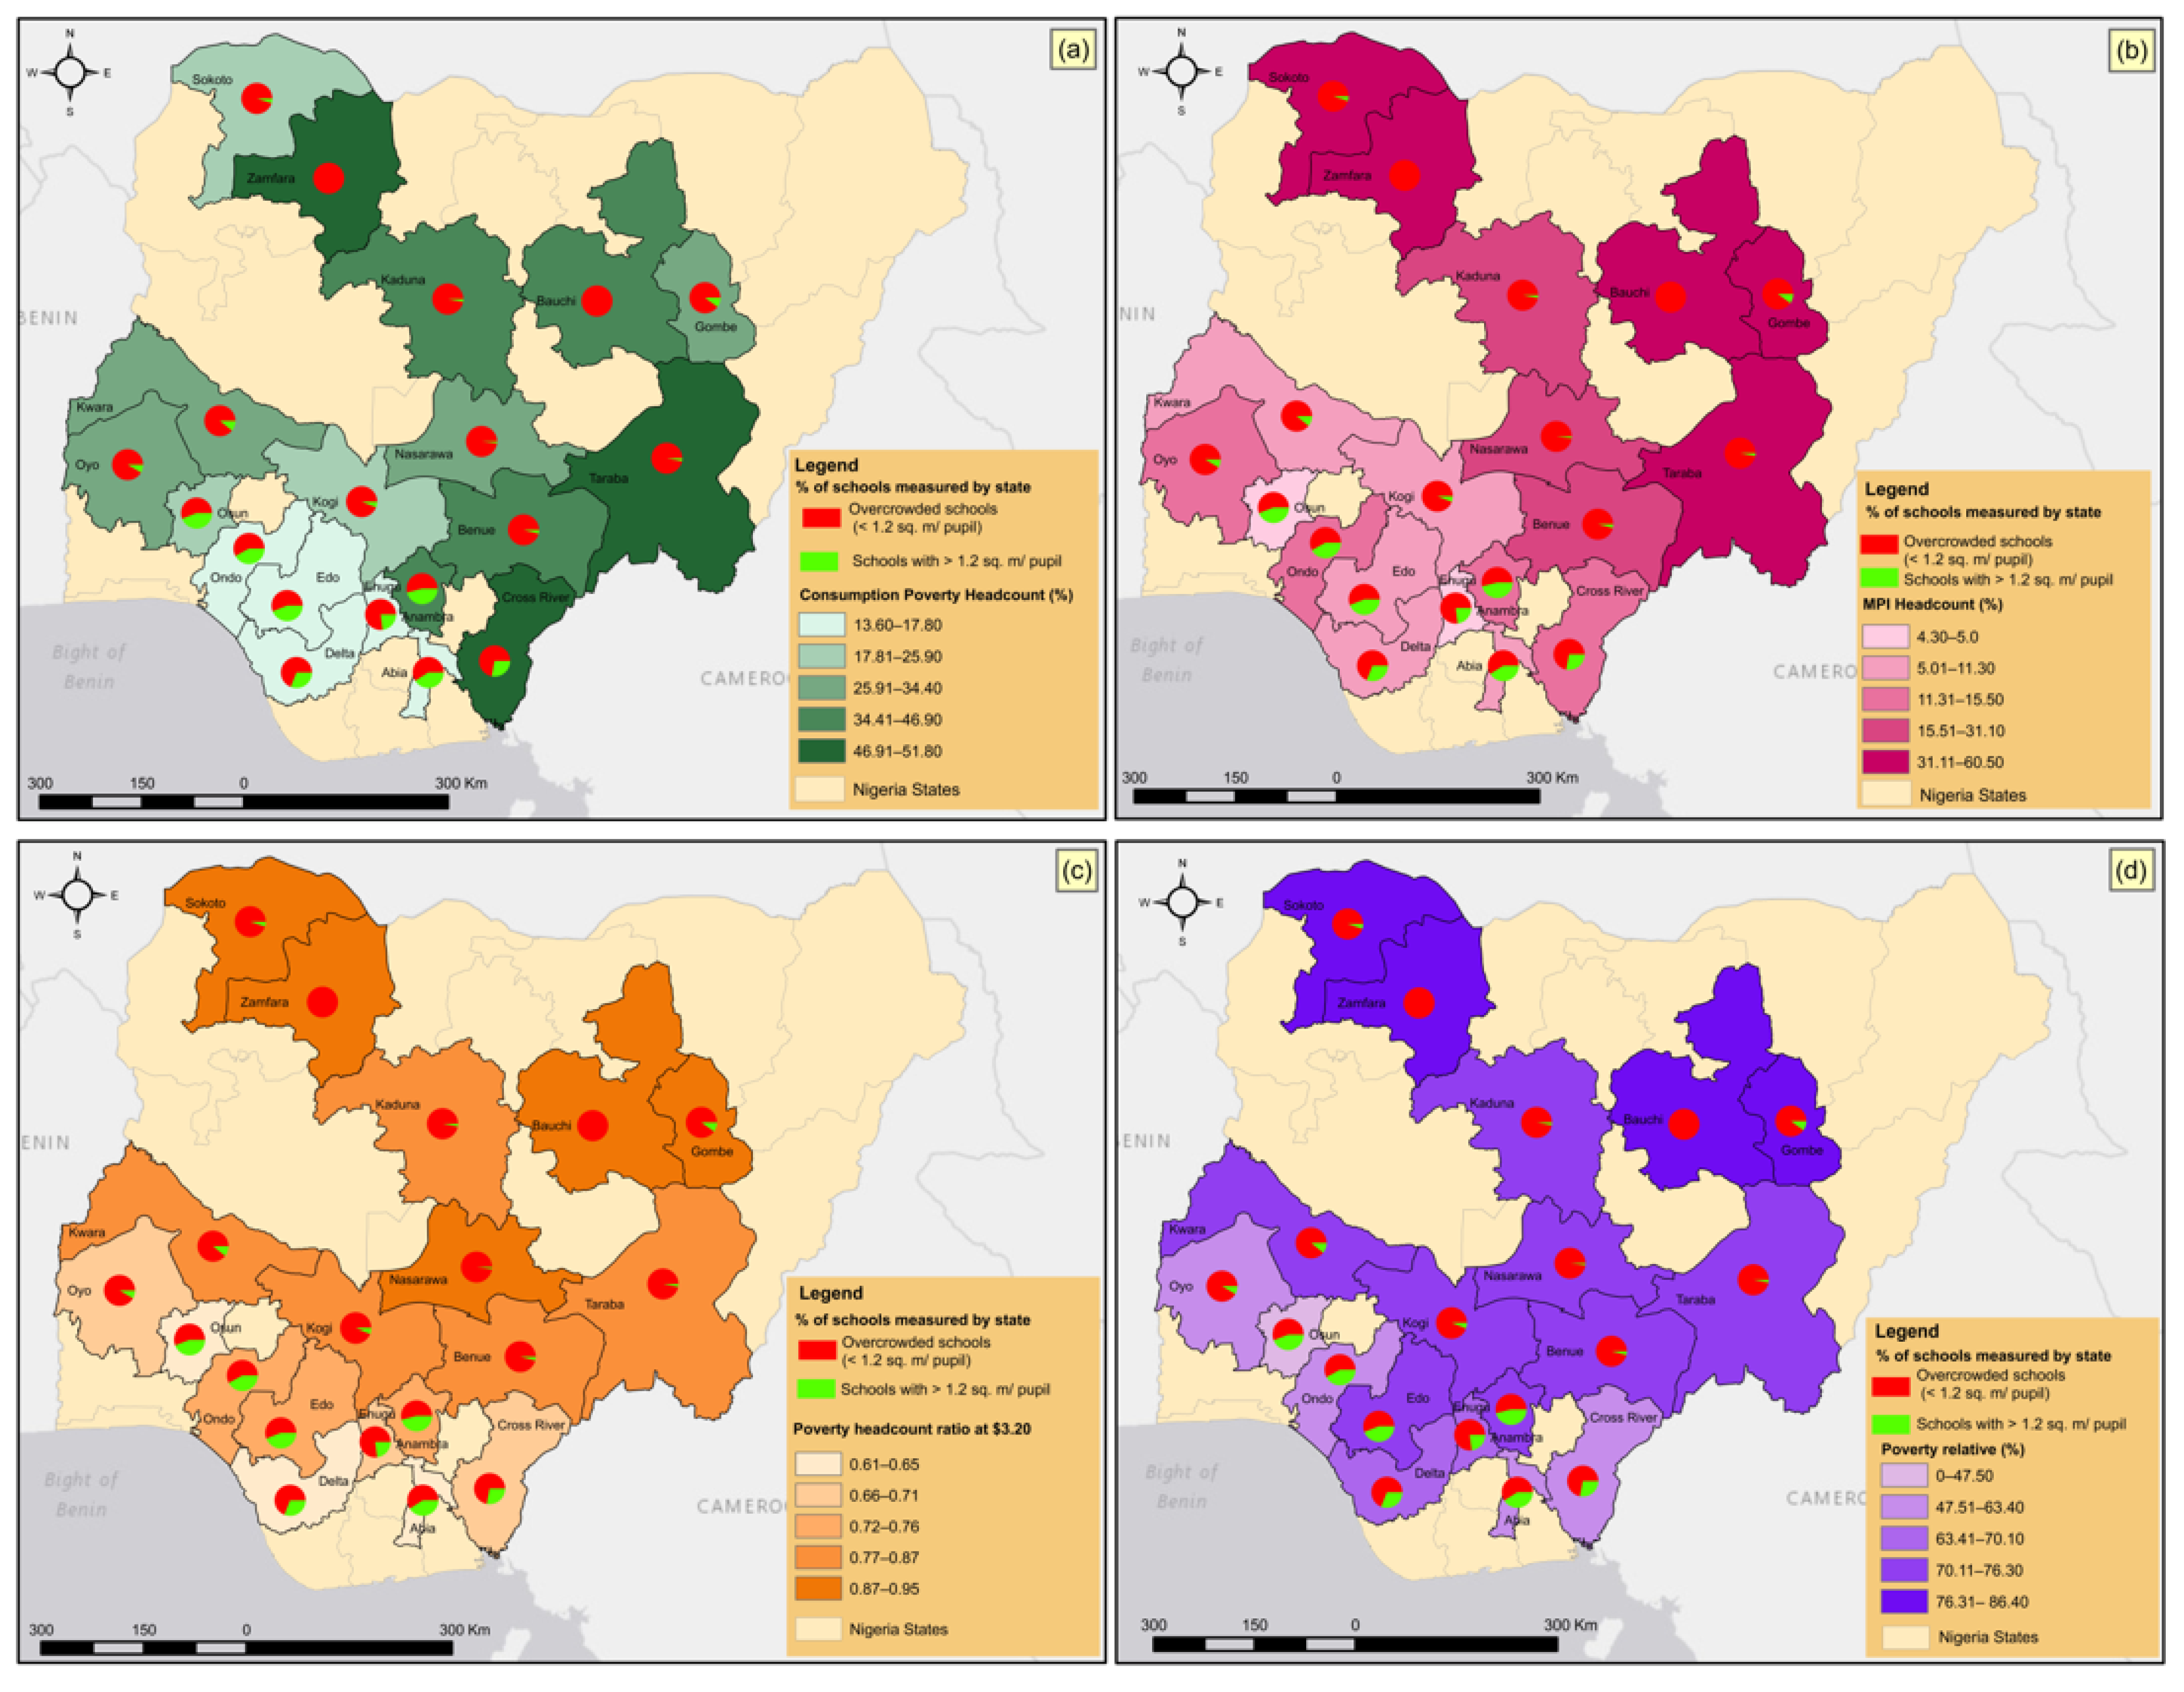
3.3.2. Poverty Indices

Figure 8 illustrates the percentage of schools measured that are overcrowded or meet the minimum size required, overlaid on the poverty indices: (a) poverty headcount ratio at $3.20 (% of total population, state level), (b) consumption poverty headcount (by state), (c) MPI headcount (by state), (d) poverty relative (% of total population, state-level). The poverty rates described by the four indicators have similar trends, Northeastern and Northwestern States are the poorest states, while Southwestern and South-Southern states show the lowest poverty rates, with slight differences in Consumption poverty (b) probably because our estimates were performed in the rural areas and the consumption rates are normally higher in urban zones. Overall, schools with lower teaching areas/pupils (<1.2 m2) are associated with the populations of that state being poorer. States such as Sokoto, Zamfara, Bauchi, Gombe, Kaduna, Oyo, Benue, Taraba, Nasarawa, and Kwara, where over 80% of measured schools per state are overcrowded, poverty is also at the highest level. Conversely, the states with lower poverty rates (e.g., Anambra, Enugu, Delta, Cross River, Abia, Ondo, Osun, and Cross River) generally have less overcrowded schools.

4. Discussion

This paper presents a novel application of EO satellite data in measuring the teaching floor area of a sample of 1900 rural public primary school buildings across 19 Nigerian States. We relate these measurements to nationally reported pupil enrolment data, thus determining how many of these schools would be deemed overcrowded. This approach identified that 81.4% (±0.2%) of the schools measured appeared to be overcrowded. In order to illustrate the potential value of our results, we performed further exploration of the distribution of the overcrowded schools and their interlinkage with literacy and numeracy rates, and poverty indices.
While measuring floor area could be performed manually on-site by school staff or others, the collection and reporting of such data for the number of rural primary schools in a large and populous country such as Nigeria is a substantial, expensive, and time-consuming administrative task, with potential for miscalculation and data gaps. On the other hand, EO data are readily available, address issues of accessibility in remote areas, are easily operated (convenient and free use of Google Earth), and are easy to update over time as schools add more classroom buildings. For example, from the historical satellite imagery incorporated in Google Earth, we were able to observe from establishing our sample of 1900 schools, that 113 of the schools had been extended and another 130 schools had been demolished between 2011 and 2019. Therefore, we suggest that EO data can provide a reliable, accurate, and convenient means for assessing classroom areas at the national scale and this has the potential to be automated via Artificial Intelligent/machine learning approaches (see Yazdani et al., [50] for identifying rural schools in Liberia). The advantages of this approach are probably most likely to be realised in the developing world where issues of accessibility to rural schools are especially challenging. Indeed, we consider the ability to rapidly and remotely evaluate overcrowding in the rural primary schools presented in this study, can help government agencies and NGOs in recognising priorities and to target attention and investment. Likewise, the method can be used in other countries where the spatial pattern of the school buildings and the number of students enrolled in school is understood.
As noted, EO data are convenient and easily available, but some limitations exist. We based our analysis on the total area of the school buildings and assumed that this was primarily dedicated to classrooms. Classrooms are understood to be the major use of the space, but satellite images cannot distinguish other usages within the building (e.g., administration uses, storerooms, etc.). Therefore, for calculation of classroom space per pupil, small buildings (width < 4 m and length < 7 m) were removed from the analysis for schools with more than 2 buildings assuming these are lavatory facilities. Veranda space was also extracted from classroom space based on the building width measurements, detailed exclusion criteria, and uncertainty analysis. All assumptions were established using the trends observed from the on-site measurements. The total remaining school building area obtained for classroom space was further reduced by 15% as per UBEC recommendations for administration uses [6].
Secondly, the EO images cannot determine the quality of the classroom space such as the internal condition of the building, availability of desks, availability of equipment, blackboards, etc., or lack of teachers (e.g., ‘ghost’ teachers—a type of fraud that often occurs in developing countries) [51]. Thirdly, the approach is not straightforward for schools that have more than one storey (mostly in urban areas). In Nigeria, the majority of rural schools were built to a common single-storey design, but urban schools often have multiple storeys. It may be possible to estimate height using shadow length taken at a particular time of the day, but even so, the assumptions become more complicated.
In our previous work [52,53], we discussed the importance of providing validation information and estimating uncertainty associated with indicators calculated from EO data sets. Despite the pandemic time, we obtained the on-site school measurements of 21 schools from one state and consider that to be a representative sample of common single-storey designed buildings used across rural areas in the country. Hence, the results of this study have been validated by both on-site measurements and statistical analysis using socio-economic indicators.
Overcrowded schools result from increases in student enrollment that are unmatched by school resources. School overcrowding and poverty are two distinct social issues, but literature shows that they are related and take part in a cause-effect relationship (shown in Figure 9). Insufficient classroom area can cause indirectly poverty, as children drop out of primary school without achieving minimal academic performance [54,55] and is also reflected in literacy and numeracy results [14,23,24,25], and vice versa when poverty (state not having enough money to spend in education) causes a lack of school resources [56,57,58]. Our study has shown that EO approaches can be important, efficient, enabling tools revealing school overcrowding in this case and helping authorities to make progress on a number of the UN SDGs. Figure 9 provides a conceptual model showing where EO can play a key role in making progress on the critical socio-economic relationships that affect the achievement of both SDG4 for quality education and promotion of lifelong learning and SDG 1 on poverty alleviation.
This study supports the need for an increased awareness of the value of satellite EO approaches for identifying both the specific example of overcrowded classrooms and, more generally, in supporting the socio-economic SDGs (as well as the environmentally focussed ones). Given the challenges involved in implementing the SDGs then the adaptation of a number of indicators to enable them to make use of readily available EO data presents a valuable opportunity to calibrate progress efficiently and economically.

5. Conclusions

The following conclusions can be drawn from this research:
  • Overcrowded classrooms with less than 1.2 m2/pupil in rural primary schools in Nigeria were readily identified using satellite EO tools in combination with available school enrolment data.
  • Results show that 84.4% (±0.2%) of schools measured are overcrowded and these are reflected in the education attainment (using literacy and numeracy rates) and poverty levels. The use of satellite images offers cost and time-efficient data to support improvements to education in Nigeria and elsewhere, particularly for those schools with one floor, and a simple measurement model and Monte Carlo Analysis can provide uncertainty to those satellite estimations that can be used to assess the fitness-for-purpose of the satellite data.
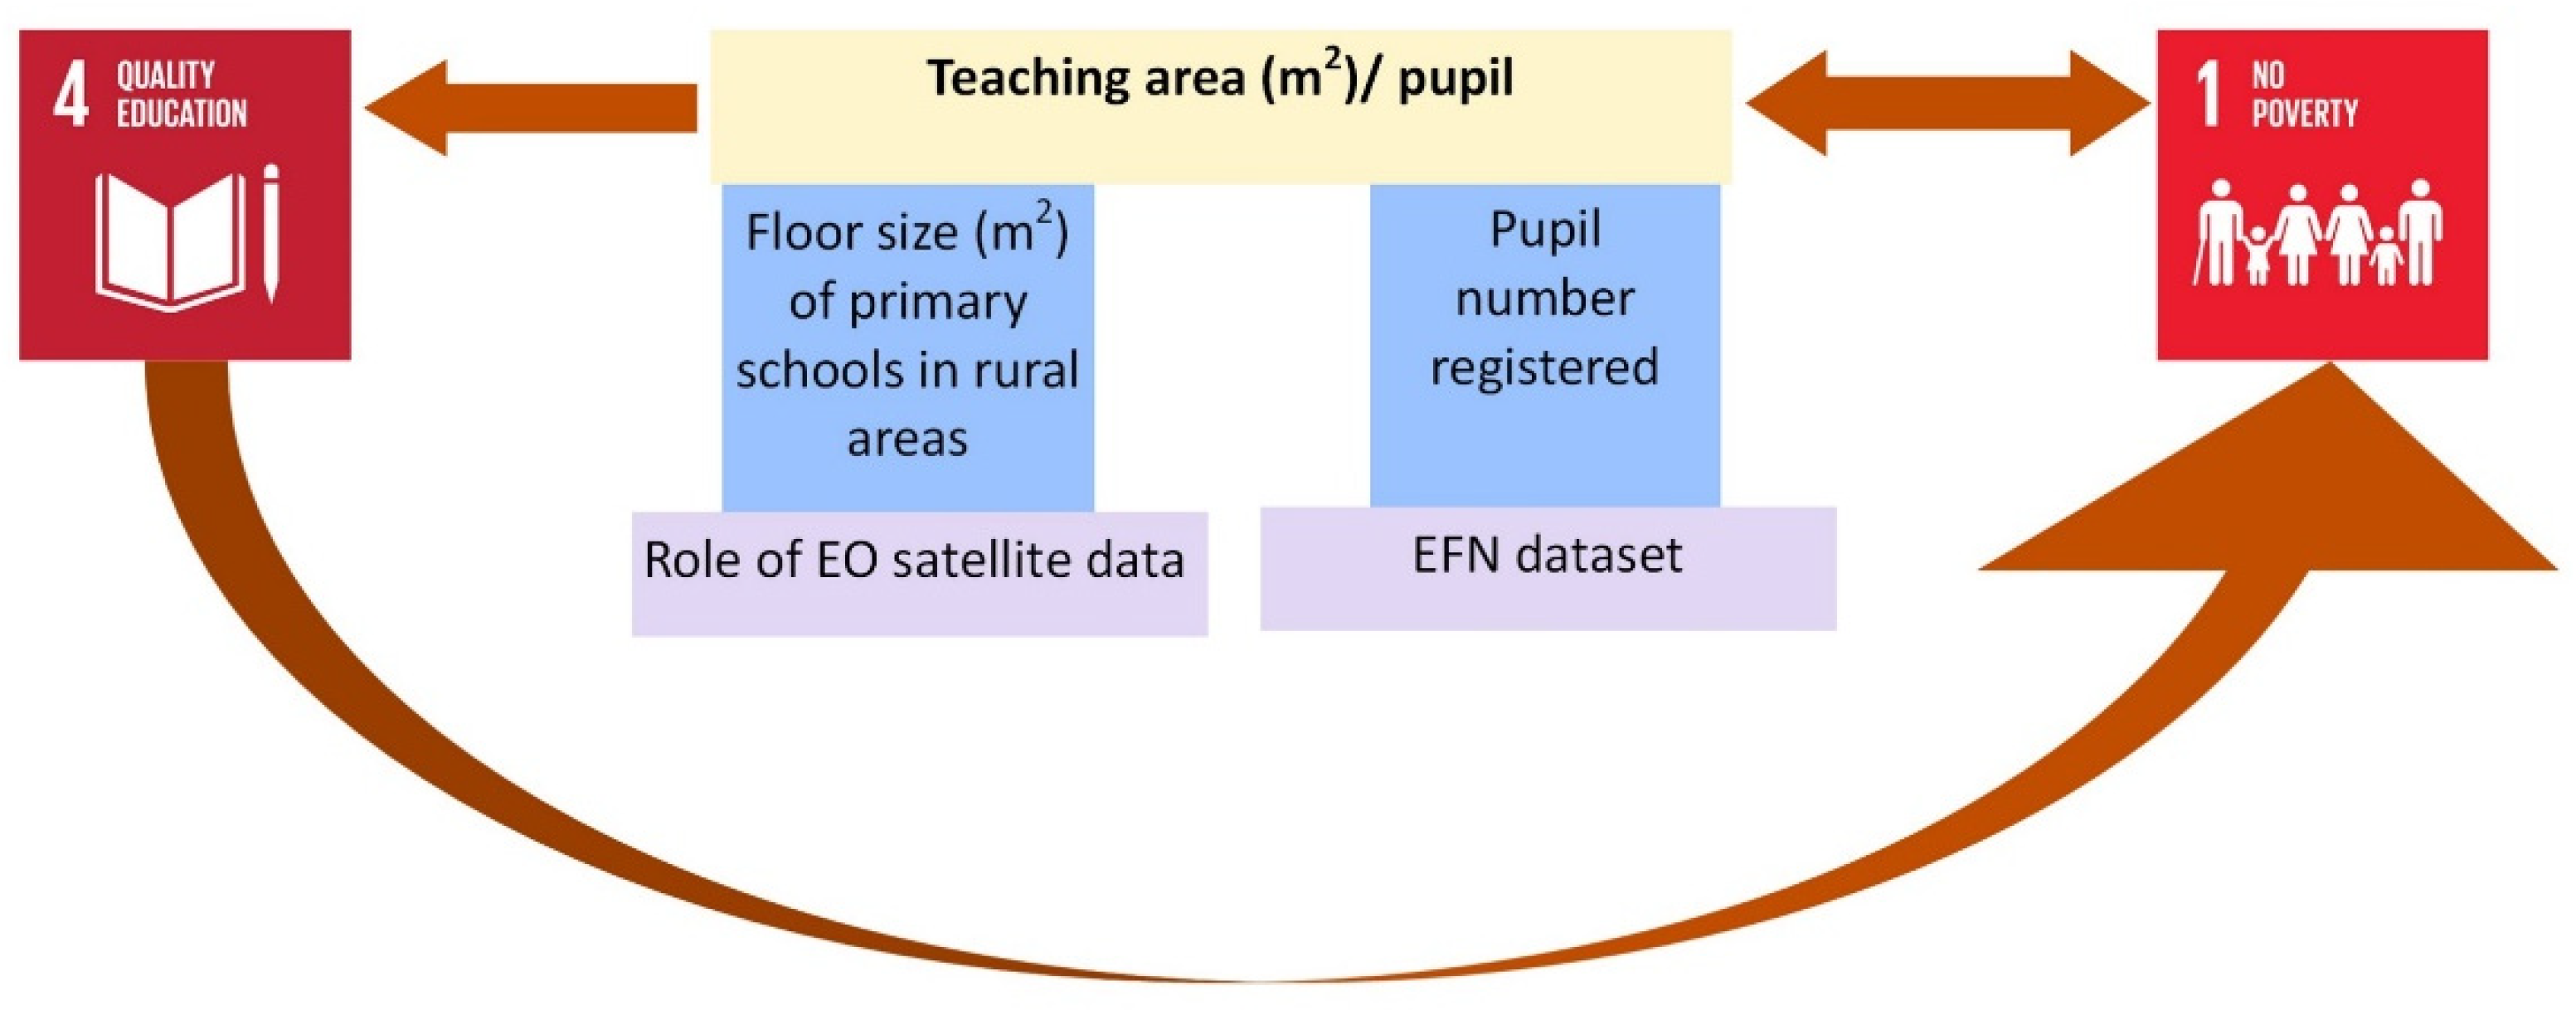
  • Assessing pupil density using satellite EO can provide important information to help progress towards the UN SDGs for quality education and lifelong learning (SDG 4), equal access to opportunities (SDG 10), and reduce poverty (SDG 1). In wider terms, this study has also highlighted how EO-derived information can offer effective and complementary support for sustainable development, including for indicators that are more closely aligned with social dimensions.

Supplementary Materials

The following supporting information can be downloaded at: https://www.mdpi.com/article/10.3390/su14031408/s1, Table S1. Information about the on-site school measurements, Table S2. On site measurements compared to satellite images measurements, Table S3. Python codes are used to calculate school overcrowding and the associated uncertainty Table S4. Further explanation of differences between original calculations and the Monte Carlo analysis, Table S5. Monte Carlo Analysis for individual schools. Figure S1. School number 6 (blue dots) and 36 (grey dots) show the 50 Monte Carlo (MC) runs and the original measurements (brown and green lines) on the teaching area (m2)/pupil, Figure S2. In blue is the standard deviation of the school teaching area per pupil as a function of school teaching area per pupil. Negative values are given (calculated as -1 times the standard deviation) as well, to show the full spread. In orange the bias, calculated as the difference between the mean of the Monte Carlo output and the teaching area per pupil calculated from the original dataset, Figure S3. In blue is the standard deviation of the school teaching area per pupil as a function of school teaching area per pupil. Negative values are given (calculated as -1 times the standard deviation) as well, to show the full spread. In orange, the bias, calculated as the difference between the mean of the Monte Carlo output and the teaching area per pupil calculated from the original dataset.

Author Contributions

Conceptualization, A.A., E.R.W., S.M., R.J.M. and J.L.; methodology, A.A., S.M., E.R.W.; software, A.A., E.R.W.; validation, A.A., S.M., R.J.M., E.R.W. and J.L.; formal analysis, A.A., E.R.W.; investigation, A.A., S.M., R.J.M., E.R.W.; resources, A.A., S.M., R.J.M. and J.L.; data curation, A.A., E.R.W.; writing—original draft preparation, A.A., E.R.W.; writing—review and editing, A.A., S.M., R.J.M., E.R.W. and J.L., visualization, A.A., E.R.W.; supervision, S.M., R.J.M., E.R.W. and J.L.; project administration, R.J.M.; funding acquisition, S.M., R.J.M. and E.R.W. All authors have read and agreed to the published version of the manuscript.

Funding

This research was funded by the Natural Environment Research Council (NERC) SCENARIO Doctoral Training Partnership, Grant/Award NE/L002566/1, CASE award partner the National Physical Laboratory (NPL) and by UKRI/Research England SPF funding via the University of Surrey. ERW’s time on this research was funded by the UK Government’s Department for Business, Energy and Industrial Strategy (BEIS) through the UK’s National Measurement System programmes. The APC was funded by the University of Surrey.

Institutional Review Board Statement

Not applicable.

Informed Consent Statement

Not applicable.

Data Availability Statement

Not applicable.

Acknowledgments

This research was supported by the SCENARIO Doctoral Training Partnership of the UK Natural Environment Research Council (NERC), with PhD funding for the first author. We thank the National Physical Laboratory (NPL) for their contribution and co-funding as the CASE award partner. We also would like to thank the Nigerian team of town planners who made the on-site measurements possible despite challenging conditions brought on by COVID.

Conflicts of Interest

The authors declare no conflict of interest.

References

  1. The World Bank in Nigeria. Available online: https://www.worldbank.org/en/country/nigeria/overview (accessed on 25 September 2021).
  2. UN. Nigeria General Information. Available online: http://data.un.org/en/iso/ng.html (accessed on 30 August 2021).
  3. Terwase, I.T.; Abdul-Talib, A.-N.; Zengeni, K.T. Nigeria, Africa’s largest economy: International business perspective. Int. J. Manag. Sci. 2014, 3, 534–543. [Google Scholar] [CrossRef]
  4. Ajiye, S. Achievements of millennium development goals in Nigeria: A critical examination. Int. Aff. Glob. Strategy 2014, 25, 24–36. [Google Scholar]
  5. UNDP. National Human Development Report 2018—Timor-Leste; United Nations: San Francisco, CA, USA, 2018. [Google Scholar]
  6. UBEC. Minumum standard for basic education in Nigeria. 2000. Available online: http://wbgfiles.worldbank.org/documents/hdn/ed/saber/supporting_doc/AFR/Nigeria/TCH/Minimum%20Standards%20for%20Basic%20Education.pdf (accessed on 30 August 2021).
  7. Boland, T. The importance of being literate: Reading development in primary school and its consequences for the school career in secondary education. Eur. J. Psychol. Educ. 1993, 8, 289–305. [Google Scholar] [CrossRef]
  8. Lockheed, M.E.; Verspoor, A.M. Improving Primary Education in Developing Countries; Oxford University Press for World Bank: Oxford, UK, 1991. [Google Scholar]
  9. Humphreys, S.; Crawfurd, L. Review of the literature on basic education in Nigeria: Issues of access, quality, equity and impact. Educ. Data Res. Eval. Niger. 2014, 1, 1–189. [Google Scholar] [CrossRef]
  10. Okoroma, N. Educational policies and problems of implementation in Nigeria. Aust. J. Adult Learn. 2006, 46, 243–263. [Google Scholar]
  11. Chege, F.; Zakariya, J.O.; Okojie, C.; Aregbeyen, O. Girls’ Education Project (GEP) Evaluation Report; UNICEF: Abuja, Nigeria, 2008.
  12. Okojie, C. Formative Evaluation of the United Nations Girls’ Education Initiative: Nigeria Report; UNGEI: New York, NY, USA, 2012. [Google Scholar]
  13. Dunne, M.; Humphreys, S.; Dauda, M.; Kaibo, J.; Garuba, A. Adamawa State primary education research: Access, quality and outcomes, with specific reference to gender. In Centre for International Education; University of Sussex: Brighton, UK, 2013. [Google Scholar]
  14. Opanuga, A.A.; Okagbue, H.I.; Oguntunde, P.E.; Bishop, S.A.; Ogundile, O.P. Learning Analytics: Issues on the Pupil-Teacher Ratio in Public Primary Schools in Nigeria. Int. J. Emerg. Technol. Learn. 2019, 14, 180–199. [Google Scholar] [CrossRef] [Green Version]
  15. Glassman, A.; Ezeh, A. Delivering on the Data Revolution in Sub-Saharan Africa. 2014. Available online: https://www.cgdev.org/publication/delivering-data-revolution-sub-saharan-africa-0 (accessed on 30 August 2021).
  16. In the News: The Nigerian Census. Available online: https://www.prb.org/resources/in-the-news-the-nigerian-census/ (accessed on 25 September 2021).
  17. Demombynes, G.; Sandefur, J. Costing a Data Revolution. 2014. Available online: https://www.cgdev.org/publication/costing-data-revolution (accessed on 25 September 2021).
  18. Organisation for Economic Co-operation and Development. Overview: What Will It Take for Data to Enable Development? OECD: Paris, France, 2017. [Google Scholar] [CrossRef]
  19. SciDevNet. Africa’s ‘Sluggish Data Collection Needs a Revolution’. Available online: https://www.scidev.net/global/news/africa-s-sluggish-data-collection-needs-a-revolution/ (accessed on 18 August 2021).
  20. Bhattacharya, D.; Khan, T.; Rezbana, U.; Mostaque, L. Moving Forward with the SDGs: Implementation Challenges in Developing Countries; Center for Policy Dialogue (CPD): Rehman Sobhan, 2016. [Google Scholar]
  21. Ndem, A.; Uwem, E.; Udah, E. The universalization of basic education in Nigeria: The Cross River state experience. Wudpecker J. Pub. Admin 2013, 1, 7–19. [Google Scholar]
  22. Sherry, H. Teachers’ Voice: A Policy Research Report on Teachers’ Motivation and Perceptions of Their Profession in Nigeria, London, Voluntary Service Overseas. Available online: https://www.vsointernational.org/sites/default/files/nigeria_teachers_voice_tcm76-22699.pdf (accessed on 29 August 2021).
  23. Boyi, A. Education and Sustainable National Development in Nigeria: Challenges and Way Forward. Int. Lett. Soc. Humanist. Sci. 2012, 14, 65–72. [Google Scholar] [CrossRef] [Green Version]
  24. Fowler, W.J.; Walberg, H.J. School Size, Characteristics, and Outcomes. Educ. Eval. Policy Anal. 1991, 13, 189–202. [Google Scholar] [CrossRef]
  25. Chikadibia Domike, G.; Ogar Odey, E. An Evaluation of the Major Implementation Problems of Primary School Curriculum in Cross River State, Nigeria. Am. J. Educ. Res. 2014, 2, 397–401. [Google Scholar] [CrossRef] [Green Version]
  26. Olaleye, F.; Ajayi, A.; Oyebola, O.; Ajayi, O. Impact of overcrowded classroom on academic performance of students in selected public secondary schools in Surelere local government of Lagos state, Nigeria. Int. J. High. Educ. Res. 2017, 7, 110–132. [Google Scholar]
  27. Ikoya, P.O.; Onoyase, D. Universal basic education in Nigeria: Availability of schools’ infrastructure for effective program implementation. Educ. Stud. 2008, 34, 11–24. [Google Scholar] [CrossRef]
  28. ESSPIN. School Infrastructure and Maintenance Report. Available online: https://www.esspin.org/reports/download/67-file-1266228690-school_infrastr.pdf (accessed on 29 August 2021).
  29. Oxfam. Inequality in Nigeria—Exploring the Drivers. Available online: https://www-cdn.oxfam.org/s3fs-public/file_attachments/cr-inequality-in-nigeria-170517-en.pdf (accessed on 15 November 2021).
  30. Harrington, S.; Teitelman, J.; Rummel, E.; Morse, B.; Chen, P.; Eisentraut, D.; McDonough, D. Validating google earth pro as a scientific utility for use in accident reconstruction. SAE Int. J. Transp. Saf. 2017, 5, 135–167. [Google Scholar] [CrossRef]
  31. Isingoma, P. Overcrowded Classrooms and Learners’ Assessment in Primary Schools of Kamwenge District; Uganda University of South Africa: Pretoria, South Africa, 2013. [Google Scholar]
  32. Lawal, I. Overcrowding As Metaphor for Declining Educational Quality. Available online: https://guardian.ng/features/overcrowding-as-metaphor-for-declining-educational-quality/ (accessed on 15 November 2021).
  33. Oni, J. Universality of primary education in Nigeria: Trends and issues. Int. J. Afr. Afr.-Am. Stud. 2008, 7, 23–31. [Google Scholar]
  34. The Local Government System in Nigeria—Country Profile. 2020. Available online: http://www.clgf.org.uk/default/assets/File/Country_profiles/Nigeria.pdf (accessed on 25 September 2021).
  35. Ayomola, O.; Oketokun, O. Ethnicity, Separatists Agitations and National Stability in Nigeria: A Study of the South East Geo-Political Zone (1999–2020). KIU J. Soc. Sci. 2021, 7, 35–43. [Google Scholar]
  36. Adegbami, A.; Uche, C.I. Ethnicity and ethnic politics: An impediment to political development in Nigeria. Public Adm. Res. 2015, 4, 59. [Google Scholar] [CrossRef]
  37. Chikwado, N.K. An Overview of Ethnicity as a Leading Cause of Conflict in Nigeria. Int. Digit. Organ. Sci. Res. 2021, 7, 167–171. [Google Scholar]
  38. Aderounmu, B.; Azuh, D.; Onanuga, O.; Oluwatomisin, O.; Ebenezer, B.; Azuh, A. Poverty drivers and Nigeria’s development: Implications for policy intervention. Cogent Arts Humanit. 2021, 8, 1927495. [Google Scholar] [CrossRef]
  39. Educational Facilities in Nigeria. Available online: https://africaopendata.org/dataset/educational-facilities-in-nigeria (accessed on 15 September 2021).
  40. Measure Distances and Areas in Google Earth. Available online: https://support.google.com/earth/answer/9010337?co=GENIE.Platform%3DDesktop&hl=en (accessed on 15 September 2021).
  41. NPC. DHS EdData Survey. 2010. Available online: https://catalog.ihsn.org/catalog/3344/related-materials (accessed on 15 September 2021).
  42. Ferreira, F.H.; Chen, S.; Dabalen, A.; Dikhanov, Y.; Hamadeh, N.; Jolliffe, D.; Narayan, A.; Prydz, E.B.; Revenga, A.; Sangraula, P. A global count of the extreme poor in 2012: Data issues, methodology and initial results. J. Econ. Inequal. 2016, 14, 141–172. [Google Scholar] [CrossRef] [Green Version]
  43. Nigeria—Poverty Map (Admin 1–2012). Available online: https://data.apps.fao.org/catalog/dataset/poverty-map-admin-1-2012/resource/dcbb7b30-6ec2-44a4-8e7d-cf2c681103d6?view_id=e60b6917-8ccf-4d65-9bc0-206314bdcd14 (accessed on 15 September 2021).
  44. Gething, P.; Molini, V. Developing an Updated Poverty Map for Nigeria. Available online: https://data.apps.fao.org/catalog/dataset/54753faa-7f30-4841-ba8d-9b3685183f37/resource/beea75bc-afbf-41d3-9bdf-cd068acffb6b/download/developing-an-updated-poverty-map-for-nigeria.pdf (accessed on 15 September 2021).
  45. WorldBank. Federal Republic of Nigeria Poverty Work Program Poverty Reduction in Nigeria in the Last Decade. Available online: https://documents1.worldbank.org/curated/en/103491483646246005/pdf/ACS19141-REVISED-PUBLIC-Pov-assessment-final.pdf (accessed on 15 September 2021).
  46. (NBS), N.B.o.S. The Nigeria Poverty PROFILE 2010 Report. Available online: https://reliefweb.int/sites/reliefweb.int/files/resources/b410c26c2921c18a6839baebc9b1428fa98fa36a.pdf (accessed on 15 September 2021).
  47. Metrology, J.C.F.G.I. Evaluation of measurement data—guide to the expression of uncertainty in measurement. JCGM 2008, 100, 1–116. [Google Scholar]
  48. Shimaoka, K.; Kinoshita, M.; Fujii, K.; Tosaka, T. Evaluation of measurement data-supplement 1 to the guide to expression of uncertainty in measurement-propagation of distributions using a monte carlo method. JCGM 2008, 101, 1–82. [Google Scholar]
  49. Hangcheng, L. Comparing W Comparing Welch’s ANOVA, a Kruskal-W A, a Kruskal-Wallis Test and Trallis Test and Traditional Aditional ANOVA in Case of Heterogeneity of Variance, Virginia Commonwealth University. 2015. Available online: https://scholarscompass.vcu.edu/cgi/viewcontent.cgi?article=5026&context=etd (accessed on 15 September 2021).
  50. Yazdani, M.; Nguyen, M.H.; Block, J.; Crawl, D.; Zurutuza, N.; Kim, D.; Hanson, G.; Altintas, I. Scalable Detection of Rural Schools in Africa Using Convolutional Neural Networks and Satellite Imagery. In Proceedings of the 2018 IEEE/ACM International Conference on Utility and Cloud Computing Companion (UCC Companion), Zurich, Switzerland, 17–20 December 2018; pp. 142–147. [Google Scholar]
  51. Ibeh, A.I.; Uzegbu, A.J. The Effects of Corruption on the Implementation of Curriculum at the Secondary School Level in Nigeria: The Way Forward. Niger. J. Curric. Stud. 2021, 27, 120–133. [Google Scholar]
  52. Andries, A.; Morse, S.; Murphy, R.; Lynch, J.; Woolliams, E.; Fonweban, J. Translation of Earth observation data into sustainable development indicators: An analytical framework. Sustain. Dev. 2018, 27, 366–376. [Google Scholar] [CrossRef] [Green Version]
  53. Andries, A.; Morse, S.; Murphy, R.J.; Lynch, J.; Woolliams, E.R. Seeing Sustainability from Space: Using Earth Observation Data to Populate the UN Sustainable Development Goal Indicators. Sustainability 2019, 11, 5062. [Google Scholar] [CrossRef] [Green Version]
  54. Opotow, S. Rationalities and levels of analysis in complex social issues: The examples of school overcrowding and poverty. Soc. Justice Res. 2006, 19, 135–150. [Google Scholar] [CrossRef]
  55. Oriahi, C.; Aitufe, A. Education for the Eradication of Poverty. Curr. Res. J. Soc. Sci. 2010, 2, 306–310. [Google Scholar]
  56. Amzat, I.H. The effect of poverty on education in Nigeria: Obstacles and Solutions. OIDA Int. J. Sustain. Dev. 2010, 1, 55–72. [Google Scholar]
  57. Knight, J.; Shi, L.; Quheng, D. Education and the Poverty Trap in Rural China: Setting the Trap. Oxf. Dev. Stud. 2009, 37, 311–332. [Google Scholar] [CrossRef]
  58. Van der Berg, S. Poverty and Education, International Academy of Education. Available online: https://citeseerx.ist.psu.edu/viewdoc/download?doi=10.1.1.464.9607&rep=rep1&type=pdf (accessed on 25 September 2021).
Figure 1. Nigeria geopolitical regions and study area.
Sustainability 14 01408 g001
Figure 2. Data source and analysis overview.
Sustainability 14 01408 g002
Figure 3. Examples of the characteristic spatial patterns and locations of Nigerian rural primary schools. Note: Satellite images used are those closest to the date of the education facility survey [39] and some school structures might have changed since these images.
Sustainability 14 01408 g003
Figure 4. On site measurements of Moslem primary school Itapanpa, Imobi, Ijebu east LGA, Ogun State (a) drone image, (b) school plan and building on site measurements.
Sustainability 14 01408 g004
Figure 5. (a) Absolute standard deviation (in metres) of the ten independent measurements using Google Earth Pro of the length and width of the 55 buildings in the 21 reference set schools. Shown as a function of building length or width. (b) Distance error (calculated from the mean of the ten Google Earth Pro measurements minus the on site distance) for the 55 buildings in the 21 reference schools.
Sustainability 14 01408 g005
Figure 6. Output of the Monte Carlo analysis (circles) and original data analysis (black diamond) for each of the 50 runs for the first 50 schools in the study.
Sustainability 14 01408 g006
Figure 7. The number of schools with each corrected teaching area (m2) per pupil for the full set of 1900 schools considered. Main bars are based on the calculation of Equations (1) and (2), error bars represent the standard uncertainty associated with this calculated from the Monte Carlo outputs.
Sustainability 14 01408 g007
Figure 8. Poverty indices and % of schools overcrowded in the studied states, (a) consumption poverty headcount (%), (b) MPI Headcount (%), (c) Poverty headcount ratio at $3.20, (d) Poverty relative (%).
Sustainability 14 01408 g008
Figure 9. Cause effect relationship of overcrowded schools and social indices.
Sustainability 14 01408 g009
Table 1. Literacy and numeracy percentage at the state level, Source: [41].
StatePercentage of Children
Ages 5–16 Able to Read
Percentage of Children
Ages 5–16 Who are Numerate
Bauchi818
Benue3359
Edo7679
Kaduna4662
Kogi5271
Kwara5361
Nasarawa2957
Ondo7892
Oyo6884
Sokoto914
Enugu5181
Delta6581
Osun8392
Gombe3235
Zamfara2124
Taraba2141
Cross River5476
Anambra8469
Abia8392
Table 2. Poverty indices-Data description and source.
IndexDescriptionData Source
Poverty headcount ratio at US $3.20 (2011 PPP) (% of population, 2013)Data are based on primary household surveys obtained from Nigeria statistical agencies and the World Bank. The indicator is calculating the percentage of the population living on less than US $3.20 a day in 2011 international purchasing power parity (PPPs). A detailed description of this poverty indicator is presented by Ferreira et al. [42].[43]
Consumption Poverty Headcount (2013)Data on consumption are collected by the General Household Survey which asks the households about broad categories of consumed items of food, health care, schools. The indicator is obtained by aggregating information on food consumption and non-food consumption.[44,45]
MPI Headcount (2013)MPI uses 10 indicators to measure poverty in three dimensions: education, health and living standard in which the intensity of poverty denotes the proportion of weighted indicators in which they are deprived. A person who is deprived in 90% of the weighted indicators has a greater intensity of deprivation than someone deprived in 40% of the weighted indicators. The proportion of the population that is multidimensionally poor is the incidence of poverty or MPI headcount ratio. This index was calculated using 2013 data from Demographic Health Surveys.
The consumption poverty and MPI headcount indicators are both largely used to measure poverty, but the data are collected under two different surveys and methods, thus the poor according to the MPI does not always correspond to the poor measured according to consumption poverty.
Relative poverty (2010)Relative poverty measurement is defined by the living standards of the majority and separates the poor from the non-poor. The threshold at which relative poverty is defined varies from one country to another, thus households with expenditure in Nigeria greater than two-thirds of the total household per capita expenditure are considered non-poor whereas those below it is poor.[46]
Table 3. Poverty indices by state.
StatePoverty Headcount Ratio Based on a Poverty Line of US $3.20 (2011 PPP) (% of Population, 2013) (Values 0 = Poorest and
1 = Non-Poor)
Consumption Poverty Headcount
(% of Total Population)
MPI Headcount
(% of Total Population)
Relative Poverty
(% of Total Population)
Abia0.6517.88.863.4
Anambra0.7216568
Bauchi0.9646.958.383.7
Benue0.87442874.1
Cross River0.715114.659.7
Delta0.6513.610.770.1
Edo0.7317.4872.5
Enugu0.7645.812.372.1
Gombe0.9329.247.179.8
Kaduna0.854131.173
Kogi0.8422.411.373.5
Kwara0.8734.49.974.3
Nassarawa0.9333.625.171.7
Ondo0.7415.612.757
Osun0.6121.44.347.5
Oyo0.7134.315.560.7
Sokoto0.9625.954.886.4
Taraba0.8451.844.876.3
Zamfara0.9049.260.580.2
Table 4. Uncertainties associated with the terms in Equations (1) and (2), and the probability distribution used to create the error for the Monte Carlo simulation.
Equations (1) and (2) termProbability Distribution the Monte Carlo Error Is Drawn FromWhere This Came From
N p , number of pupils0It is assumed that the number of pupils is known from enrolment statistics without uncertainty.
Set of L i , W i for this school: lengths and widths of the external buildings measured in Google EarthA Gaussian (normal) distribution centred on the original measurement, with a standard deviation of 0.5 m. Note each length and width has a different random error drawn from this distribution.The analysis is described in Section 2.5.2 and Figure 5a,b.
Statistically determined.
W V , i = { 2   m ,   W i > 10   m 1.6   m , 10   m > W i > 6.5   m 0   m , W i < 6.5   m No uncertainty is associated with the step points (6.5 m and 10 m).
Veranda width is described by a Gaussian (normal) distribution centred on the calculated width (2 m or 1.6 m), with a standard deviation of 0.3 m.
The on situ data showed this variety in the veranda widths
(see Section 2.5.1).
S off = 0.15 , the proportion of the buildings taken up by offices (for a school big enough) is 15%Office proportion has taken as a uniform distribution from S off = 0.10 to S off = 0.20 . That is each school that is big enough for an office is assigned an office proportion randomly from this interval with an equally likely probability of any value in this intervalThe authors do not have any strong justification for this range and have made a “best guess” based on the UBEC report [6] requirement of 15% area for a school, and allowing for a “reasonable” range of values around this.
B j = { 1 n 3 0 n = 1 , 2 ,
Boolean criterion to decide whether or not to subtract office space.
No uncertainty is assumed.Arguably, other criteria could be used to decide whether or not to select office space, but this was not analysed in the Monte Carlo simulation.
Form of equation.No uncertainty is assumed.Arguably, the form of Equation (1) could be different–for example, the office area could be removed before subtracting a veranda. But for this analysis, alternative forms were not considered.
Table 5. Groups by Youth Literacy rates (%).
Youth Literacy (%)Group 1
0–25%
Group 2
26–50%
Group 3
51–64%
Group 4
65–80%
Group 5
81–100%
Studied StatesBauchiBenueKogiEdoAbia
TarabaNasarawaKwaraDeltaAnambra
SokotoGombeCross RiverOndoOsun
ZamfaraKadunaEnuguOyo
Table 6. Groups by Numeracy rates (%).
Youth Numeracy (%)Group 1
0–25%
Group 2
26–60%
Group 3
61–75%
Group 4
76–81%
Group 5
82–100%
Studied StatesSokotoGombeKwaraCross RiverOyo
BauchiTarabaKadunaEdoOndo
ZamfaraNasarawaAnambraEnuguOsun
BenueKogiDeltaAbia
Table 7. Summary statistics for the 1900 schools in the test data set. Overcrowded is defined as having a teaching area per pupil less than 1.2 m2.
StatisticsValueStandard Uncertainty Associatedwith this Value
Number of schools measured1900
Total of buildings measured4490
Mean teaching area per pupil0.782 m20.002 m2
Median teaching area per pupil0.601 m20.004 m2
Proportion of schools overcrowded81.4%0.2%
Table 8. Descriptive statistics and results of Welch’s ANOVA for literacy and numeracy groups.
Literacy Groups (as per Table 5)Numeracy Groups (as per Table 6)
1234512345
Statistics0–25%26–50%51–64%65–80%81–100%0–25%26–60%61–75%76–81%82–100%
Sample size (N)398400391406302298400391400408
Mean (area/pupil)0.430.500.861.041.140.430.510.651.111.11
Standard Error (SE)0.010.010.030.030.040.020.020.030.030.04
Standard Deviation (SD)0.280.370.650.640.750.280.360.530.690.72
Welch’s F Ratio = 144.10 (p < 0.0001)
df = 4879.14
Welch’s F Ratio = 139.86 (p < 0.0001)
df = 4936.59
Publisher’s Note: MDPI stays neutral with regard to jurisdictional claims in published maps and institutional affiliations.

