
Predicting Detached Housing Vacancy: A Multilevel Analysis

1
Department of Urban Design and Planning, Hongik University, Seoul 04066, Korea
2
Department of Landscape Architecture and Urban Planning, Texas A&M University, College Station, TX 77843, USA
3
Department of Urban Engineering, Jeonbuk National University, Jeonju 54896, Korea
*
Author to whom correspondence should be addressed.
Sustainability 2022, 14(2), 922; https://doi.org/10.3390/su14020922
Submission received: 4 November 2021
/
Revised: 6 January 2022
/
Accepted: 12 January 2022
/
Published: 14 January 2022
(This article belongs to the Special Issue Advances in Green Infrastructure Planning)
Abstract
:Urban shrinkage is a critical issue in local small- and medium-sized cities in Korea. While there have been several studies to analyze the causes and consequences of vacancy increases, most have only focused on socioeconomic associations at larger scale and failed to consider individual housing level characteristics, primarily due to a lack of appropriate data. Based on data including 52,400 individual parcels, this study analyzes the primary contributors to vacant properties and their spatial distribution through a multilevel model design based on data for each parcel. Then, we identify areas at high risk of vacancy in the future to provide evidence to establish policies for improving the local environment. Results indicate that construction year, building structure, and road access conditions have a significant effect on vacant properties at the individual parcel level, and the presence of schools and hypermarket within 500 m are found to decrease vacant properties. Further, prediction outcomes show that the aged city center and areas with strict regulations on land use are expected to have a higher vacancy rate. These findings are used to provide a set of data-based revitalization strategies through the development of a vacancy prediction model.
1. Introduction
Recent rapid urban growth has forced Korean cities to focus on physical and spatial expansion [1]. As such, planning policies related to growth management or smart growth are being developed with sustainability and development in mind [2]. Accordingly, a large number of development projects have been put forth in response to the growing demand for housing in the Seoul Metropolitan Area (SMA) of South Korea, such as the ambitious 3rd Generation New Towns project. In contrast, many small- and medium-sized cities and rural areas outside of the SMA are experiencing depopulation that first began in the 1980s. Of 230 Korean cities, 139 (60.4%) experienced depopulation between 1990 and 2015. While only 18.6% (20) of cities in the SMA lost population during this period, non-metropolitan areas also showed a 30.1% (119) decline, indicating urban shrinkage in these regions [3]. In particular, this trend is expected to worsen for small- and medium-sized cities due to continued low fertility rates (in fact, Korea has the lowest among OECD member countries) and aging of the population [4].
Urban decline can be a result of shrinkage and cause not only a long-term economic recession, but also socioeconomic problems including deteriorating neighborhoods and living environments, poor regional competitiveness, and high crime rates [5]. Another related issue is that of excessive amounts of vacant land—a physical manifestation of economic decline brough about by depopulation [6,7]. According to the 2017 Housing Census by Statistics Korea [8], vacant properties accounted for 7.4% (1,270,000) of the housing properties in the country at the time—a 3.4-fold increase in just 22 years from 360,000 (3.9%) in 1995. Statistics Korea forecasts that vacant properties will account for 10% (3 million) of housing properties by 2050.
If left unattended long-term, vacant properties can cause complex physical, social, and economic problems such as deteriorating residential conditions, poor esthetics, increasing crime and disasters, falling housing prices, and higher administrative costs. We must establish a framework to both upgrade and reuse vacant properties, especially given the projected rise in vacant properties. Housing demand will decrease beyond absolute housing shortages based on the current housing supply rate above 100% (total number of houses to total number of households ratio). This will be coupled with a decreasing population growth rate and a declining working-age population.
We understand that all cities seek to promote economic growth through the use of diverse resources. Among these resources, land is crucial—especially vacant land [9]. As noted, shrinking cities have a much larger influence on the socioeconomic fabric of affected societies. Among these problems, the issue of vacant properties is especially critical to address [10]. If we recognize vacant properties as both the cause and result of a declining city, and accordingly identify and manage this cause-and-effect relationship, it may be possible to preemptively prevent the vicious cycle of vacant properties and deteriorating cities. Under the hypothesis that a property becomes vacant/abandoned not only due to individual building characteristics but also regional economic, social, and environmental characteristics, the multilevel logistic regression model was used to extract the determinants of vacancies at different levels and predict the probability of vacancy in each building in the future.
The literature has proposed various definitions of “vacant properties” and their contributing factors across different scales—from city-based macroscopic to neighborhood- and individual housing unit-based local scales. Vacant land is said to include not only underperforming or unoccupied properties, but also neglected or abandoned commercial/industrial buildings that may pose a threat to public safety [10,11]. Vacant land may also include open spaces such as parks, farm sites, and properties with natural resource value [6].
Vacant housing in residential areas are especially worrisome. Although there is no agreed-upon concept and definition of vacant properties in Korea in the literature, the Act on Special Cases Concerning Unoccupied House or Small-Scale Housing Improvement, 2017, defines vacant properties as “a house not occupied or used for at least one year as of the date the Special Self-Governing City Mayor has verified that the house was occupied or used.” Surveys into such properties in different regions have since been conducted routinely.
On the contributing factors of vacant properties, Scafidi et al. (1998) and Hillier et al. (2003) [12,13] found that housing characteristics and the socioeconomic characteristics of owners affected housing abandonment in declining cities across the US. They confirmed that, if housing properties have poor functional and economic conditions, or homeowners have poor financial conditions, they are more likely to be neglected and therefore become vacant. Bassett et al. (2006), Silverman et al. (2013), and Morckel et al. (2013) [14,15,16] found that the proportion of African-Americans, proportion of poorly educated, unemployment rates, poverty rates, age of the building, and housing prices are all related to housing abandonment; that is, a local area’s physical, social, and economic characteristics may trigger housing abandonment. Morckel (2013) [16] conducted a multilayer analysis of Youngstown and Columbus to analyze the effect of the neighborhood scale on housing abandonment, and identified the relationship between vacant properties and three conditions in the target and nearby areas: market conditions, gentrification, and physical abandonment.
Further, local market and economic conditions may also affect the emergence of vacant properties. According to the real estate market, the main cause of vacant housing is a low demand for such properties. Such properties arise because of a mismatch between supply and demand under conditions of housing oversupply [17,18]. If the demand is lower than the housing supply, consumers improve the quality of their houses through housing filtering; in this process, houses with low competitiveness are abandoned [19,20]. If many new housing properties are supplied without changes in local housing demand, properties with low market values, such as old and poor-quality ones, will be left vacant and abandoned. This phenomenon evolves beyond a single area. If a specific area has a low level of market competitiveness, residents who can afford to move will do so, thus producing more vacant properties.
Studies identifying the spatial distribution of vacant properties across the city and predicting areas at higher risk of vacancy are rare; a deep-learning-based vacancy prediction model was only developed in 2016 [10,13,21]. Hillier et al. [13] identified the determinants of vacancy and predicted housing abandonment in Philadelphia using a logistic regression model. They found that identifying the principal predictor of abandonment is essential for establishing long-term strategies to protect housing stock. Furthermore, they noted that the causes of vacancies differ depending on the scale.
Newman et al. (2016) and Lee and Newman (2017) [10,21] developed a neural-network-based vacancy prediction model. By comparing four different model accuracy tests, they proved that the model can be a suitable alternative for predicting future possible urban vacancy dynamics and conditions. By quantifying and comparing factors that occur in a growing city (Fort Wort, TX, USA) and a declining city (Chicago, IL, USA), they found that while transportation-related variables in the declining city are major contributors to vacancy, socioeconomic variables such as unemployment rate, housing price, and race have stronger influence in a growing city. With the latest technological advances that can collect and analyze various types of data, scholars are beginning to analyze and predict vacancy patterns based on the deep-learning-based prediction model. However, most deep-learning-based predictive models require time-series data, and it is difficult to conduct a more detailed analysis because the analysis must be conducted with raster-based pixel units. Since this study obtained 2020 parcel-level vacancy data, multilevel logistic regression model was utilized to predict the vacancy possibility of each parcel.
The primary objectives of this research are twofold: (1) to accurately analyze contributors to vacant properties and spatial distribution through a multilevel model design based on data for individual parcels, and (2) to provide evidence to establish policies to boost the local area by predicting areas at risk of vacancy. Our study differs from the prevailing works on vacant properties in three ways. First, prior studies are limited in their analysis of the characteristics of vacant properties in a more specific unit of land because they rely on data at the administrative district scale, given the challenges in obtaining proper data. For example, Morckel (2013) [16] used tax-delinquent information on individual properties as a proxy for abandonment, while Zou and Wang (2020) [22] detected vacant houses using high-resolution remote sensing images. We conducted a more detailed and accurate spatial analysis based on data from approximately 32,000 individual parcels in Jeonju, a small- and medium-sized local city in western South Korea experiencing a rapid decline.
Second, while some scholars use data from individual buildings, most limit their analysis to only a few areas in the city or focus on physical characteristics such as construction year and architectural type. We included not only the physical characteristics of individual parcels, but also the characteristics of neighborhood residential conditions such as access to amenities as key explanatory variables, not limiting ourselves to a certain small area within the city. Williams et al. (2019) [23] highlighted the importance of access to amenities such as schools, grocery stores, medical facilities, and malls to allow communities from ghost cities (i.e., cities with housing vacancies) to flourish. Access to public transport also increases housing value [24,25,26]. Accordingly, variables such as access to a variety of amenities, such as elementary schools, hypermarkets, and hospitals, the presence of unwanted facilities such as waste treatment plants, and vacant properties were employed in our analysis.
Third, vacant properties may be related to conditions differently across different scales. While Accordino and Johnson (2000) [20] showed that specific housing conditions and neighboring conditions influence housing properties, most other scholars seem to focus on the socioeconomic status of the entire city level due to the lack of vacancy-related data. This includes population and employment status rather than neighborhood conditions such as service accessibilities, and the physical conditions of each property, such as structures and the year built.
By investigating each house’s conditions, we included not only the local area’s socioeconomic characteristics but also the unique characteristics of individual buildings and access to infrastructure related to neighborhood environments as key explanatory variables. We employed a multilevel logistic regression model to identify parcels at high risk of vacancy in the future, instead of using past data to analyze trends and suggest policy alternatives. In addition to identifying parcels at high risk of vacancy, we identify high risk of vacancy clusters at the regional scale within the study area by examining their spatial distribution with hotspot analysis. Within this process, we present a reference to establish more realistic and future-oriented policies.
While there has been a concerted effort to study and understand how vacant properties can be used, without identifying the causes and consequences of the increase in vacancy, it is difficult to systematically manage and use these properties. In the context of our study—South Korea—we note that while the Korean government creates the available data on vacant housing property through the Housing Census of Statistics Korea, the information is only a simple aggregate that includes spatial ranges of cities or census tract levels. These data lack accuracy and specificity in identifying the number and status of vacant properties, thus rendering them ineffective for analyzing the microscopic and accurate causes of vacant properties that take regional heterogeneity into account. In the literature, for example, while Jeon as well as Kim and Park [27,28] conducted their studies at the scale of individual buildings, they failed to identify the spatial distribution or cause of vacant properties across the city; further, they did not consider access to amenities and the presence of nearby vacant properties.
2. Materials and Methods
2.1. Study Area
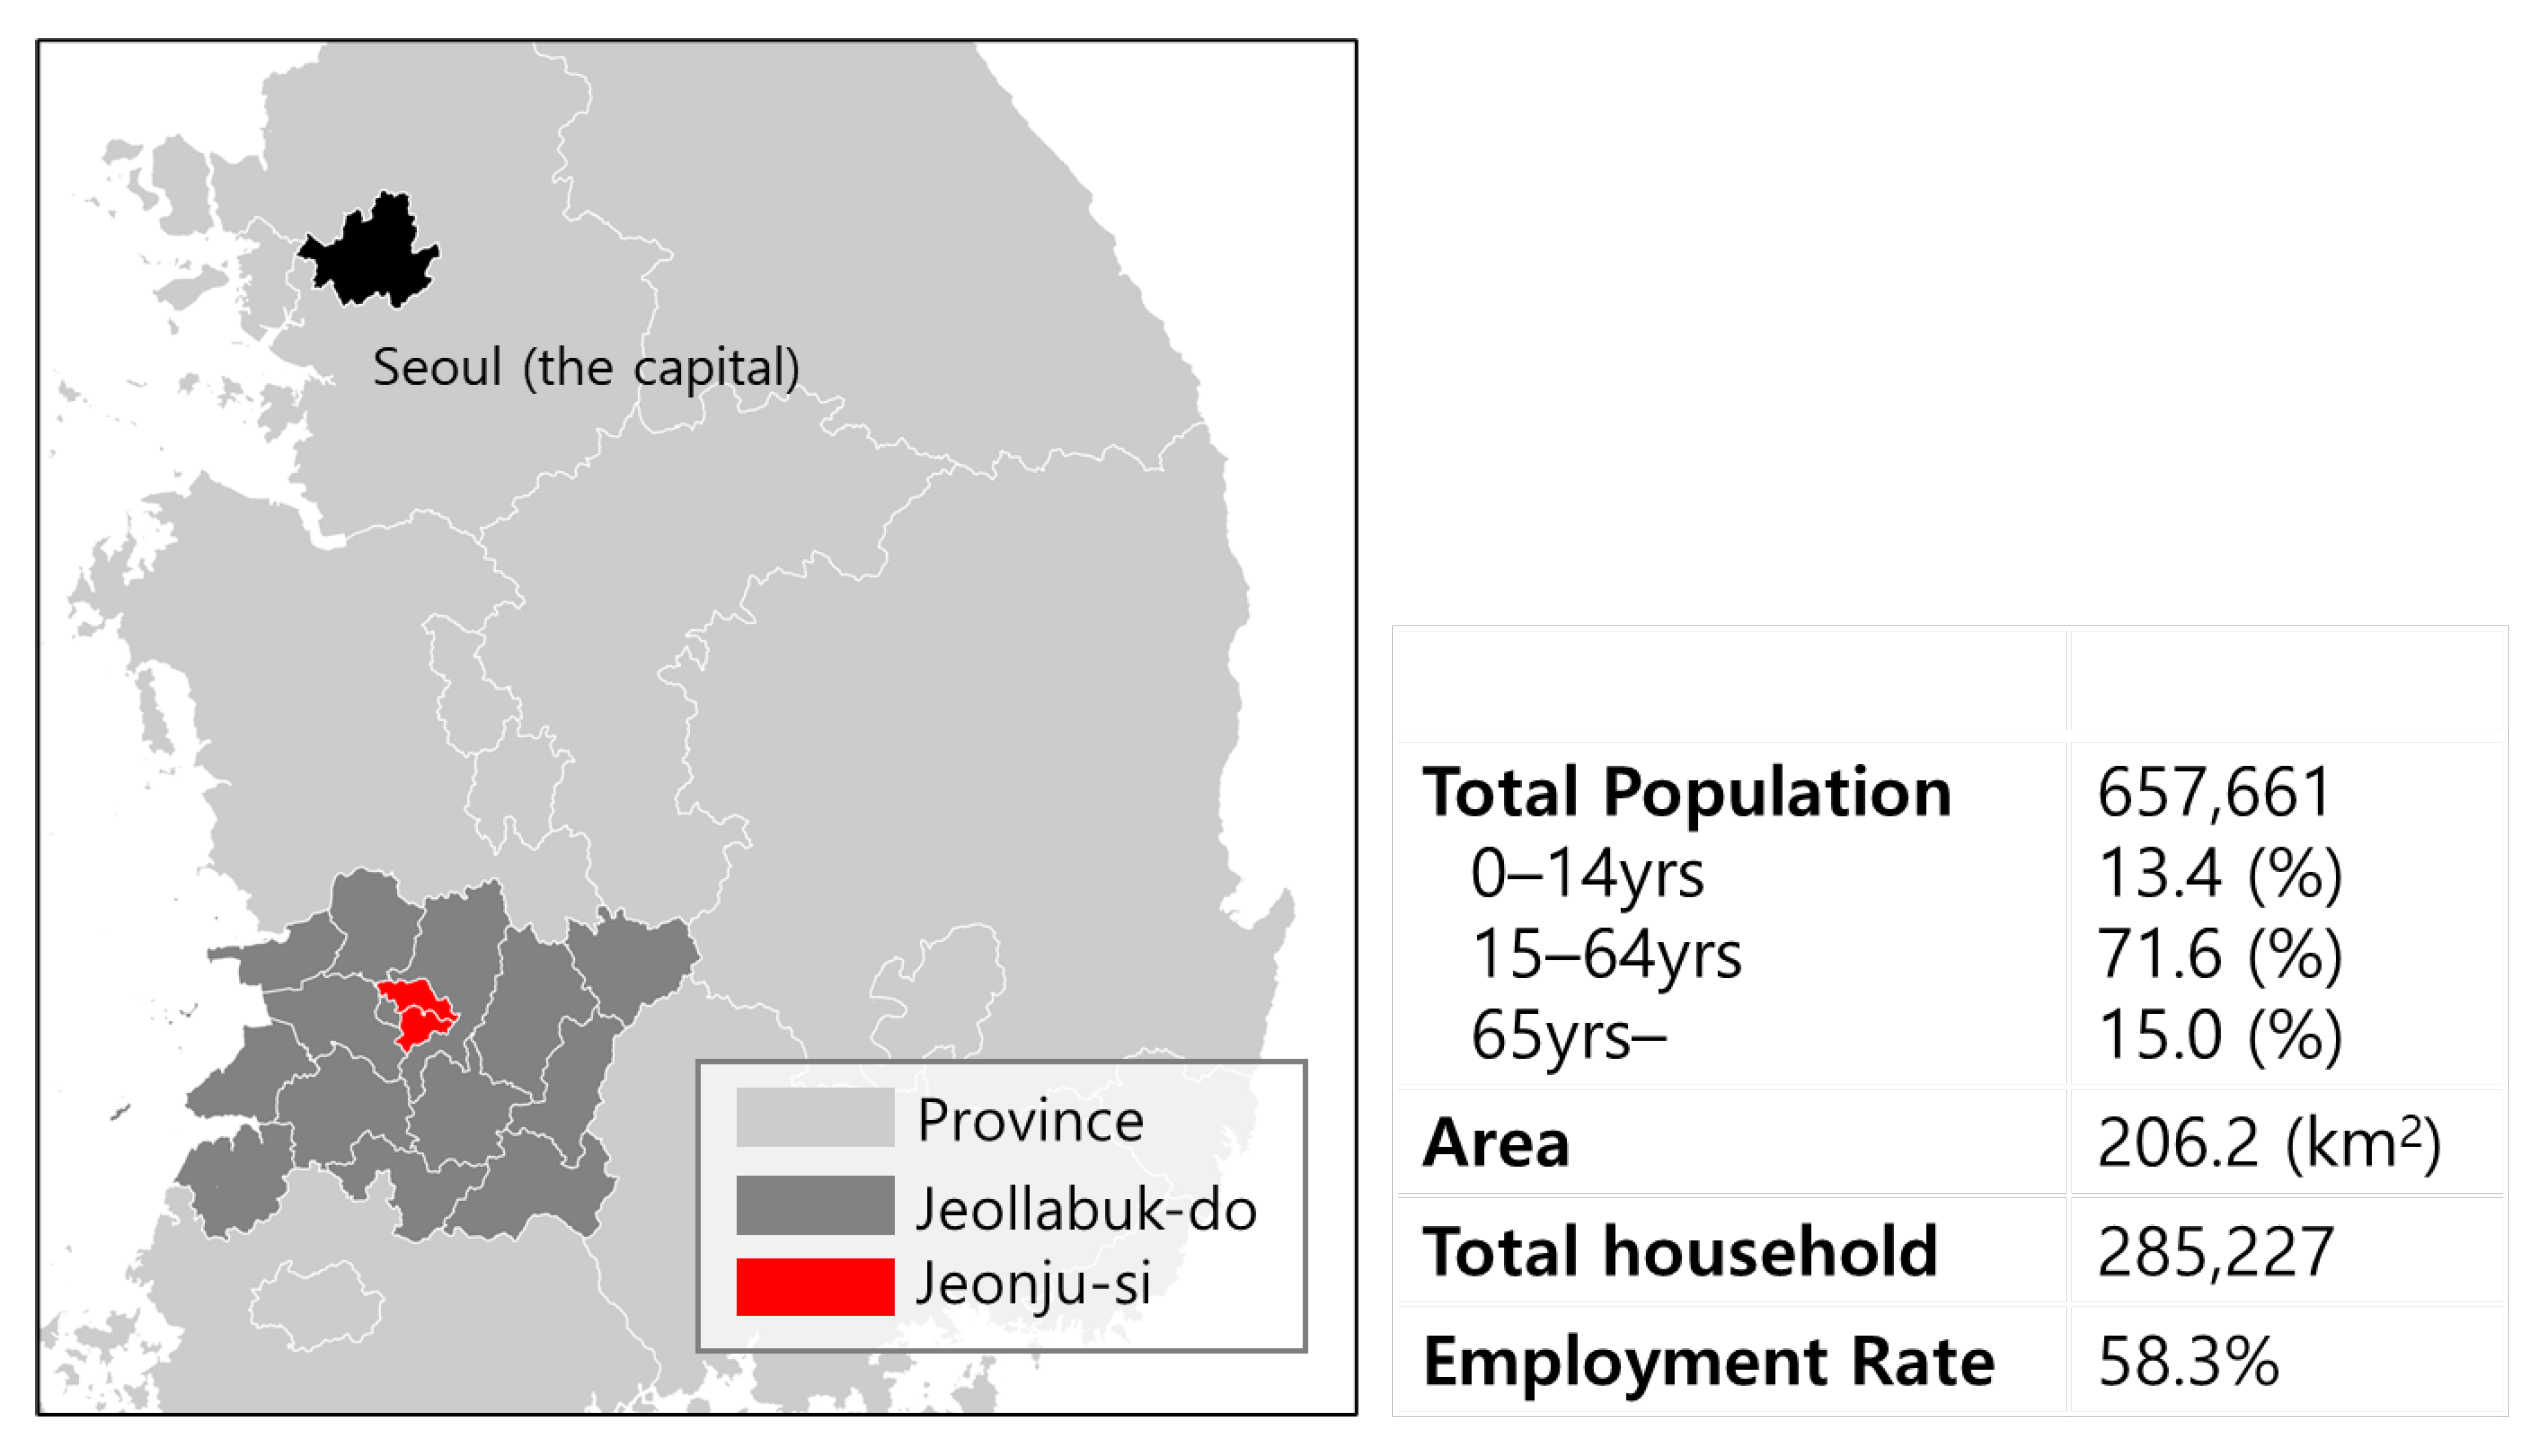
To examine urban vacancy patterns and their causes, we examined the case of Jeonju, located in the North Jeolla Province, South Korea (Figure 1). The extinction risk index was considered to measure the urban shrinkage. The index was first introduced to measure the urban shrinkage of Japan [29]. It is the value dividing the female population aged 20 to 39 years in a region by the population aged 65 years and above in the region. According to an analysis of trends in the local extinction risk index for 261 local governments across Korea, Jeonju was rated 0.67 as of 2020, which is quite low. However, as its risk has increased sharply since 2000, urgent measures need to be taken (see Table 1 for the extinction risk index). Lee [30,31] analyzed Korea’s local extinction and found that if the value is under 0.5, depopulation will continue to stagnate for over 20 years.
As vacant housing properties caused by population outflows are becoming a serious social issue, Jeonju is creating strategies to reuse vacant properties and explore how to manage and support these properties by reviewing relevant laws and ordinances. In 2020, Jeonju collaborated with the Land and Geospatial Informatrix Corporation to establish a database on vacant properties. They conducted a survey of vacant properties left unattended for over one year in the city and began to seek strategies to use these properties, taking into account aging and use of unoccupied properties.
We analyzed the factors contributing to vacant properties in 31,810 detached housing parcels in Jeonju. We then predicted the areas likely to have vacant properties in the future using a multilevel logistic regression model and explored measures to tackle housing vacancy issues. Our analysis provides implications for a more objective and systematic response, as we examined the status of vacant properties with two different levels of variables: (1) individual building level such as parcel size, shape, construction year, and access to infrastructure, and (2) the Dong, which is the smallest administrative unit in Korea, sharing relatively homogeneous socioeconomic conditions such as population density, employed population, and fertility rate [32].
2.2. Housing Vacancy Database
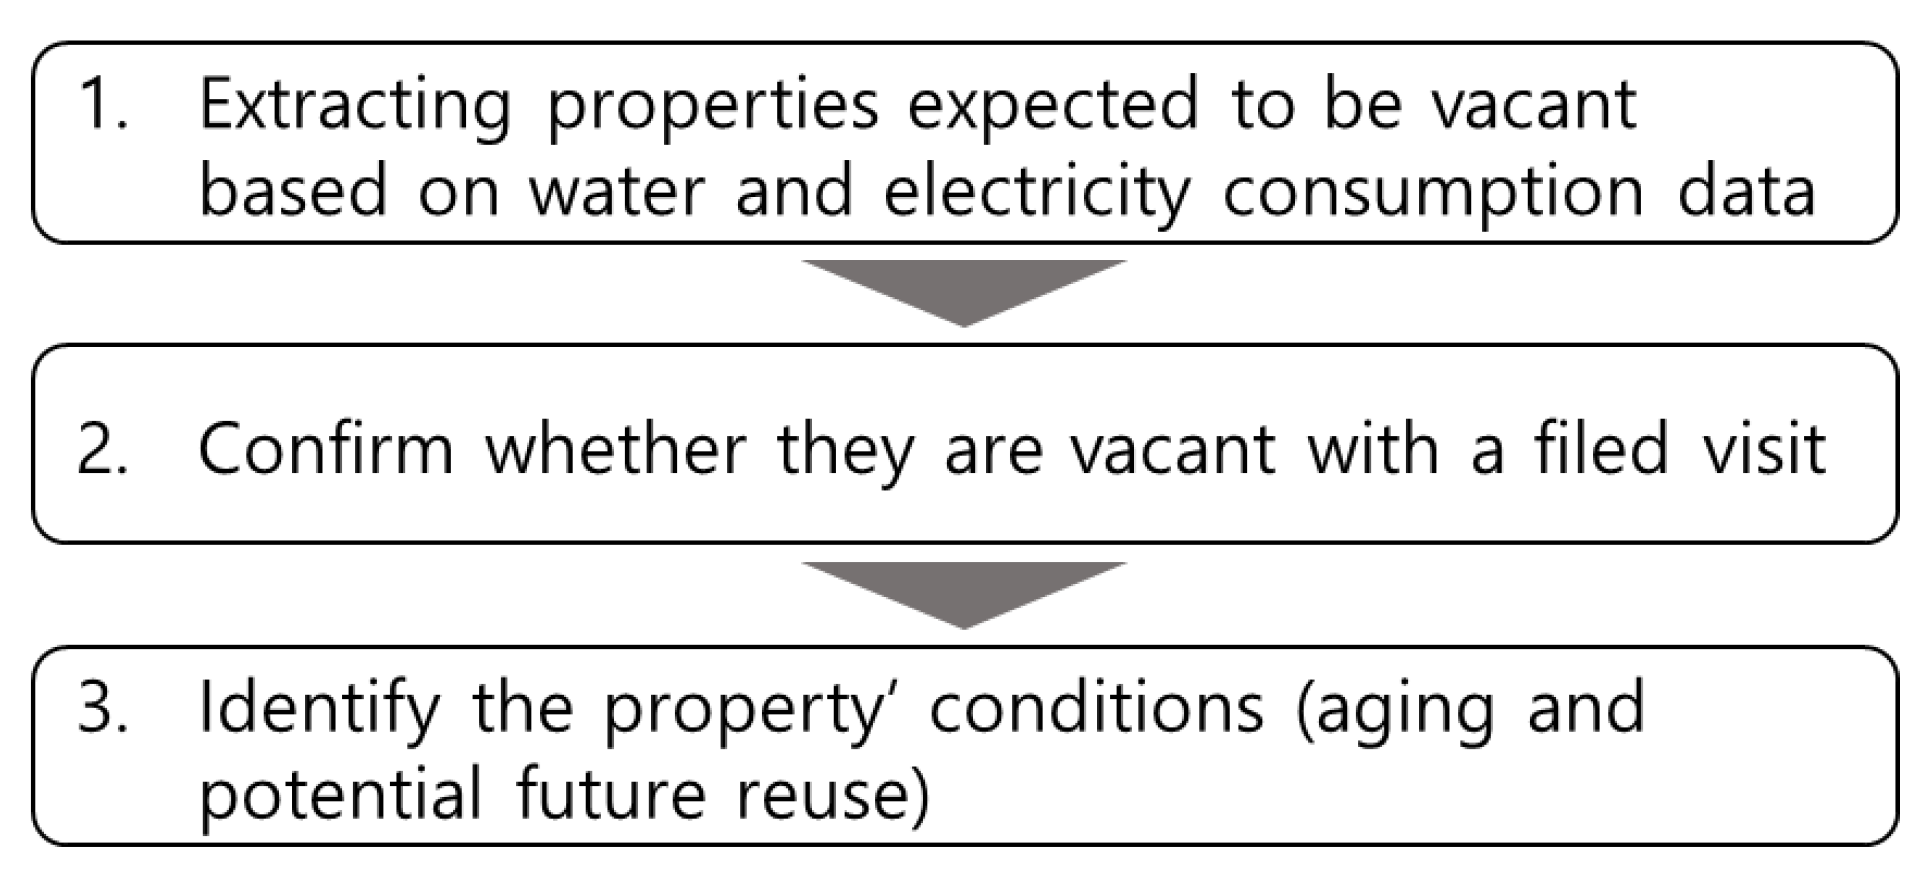
According to the “Act on Special Cases Concerning Unoccupied Houses or Small-scale Housing Improvement”, a vacant house is defined as a property that has been unoccupied for more than one year. Since it is difficult to keep track of properties that have been vacant for over one year, we identified the occupation status and building conditions of current housing. To obtain the vacancy data, the most accurate way to build data for vacant properties is to investigate the status of all buildings in the study area and determine whether they are vacant and how old they are. However, we surveyed the status of vacant properties to build a more effective data-limited budget using the following three steps (see Figure 2):
- (1)
- Extract buildings expected to be vacant properties based on data on water and electricity consumption in individual residential buildings;
- (2)
- Visit and investigate the buildings extracted from (1), and confirm whether they are actually vacant properties;
- (3)
- Identify the buildings’ conditions such as abandonment, aging, owner, access, and the possibility of potential future reuse for buildings confirmed to be vacant properties.
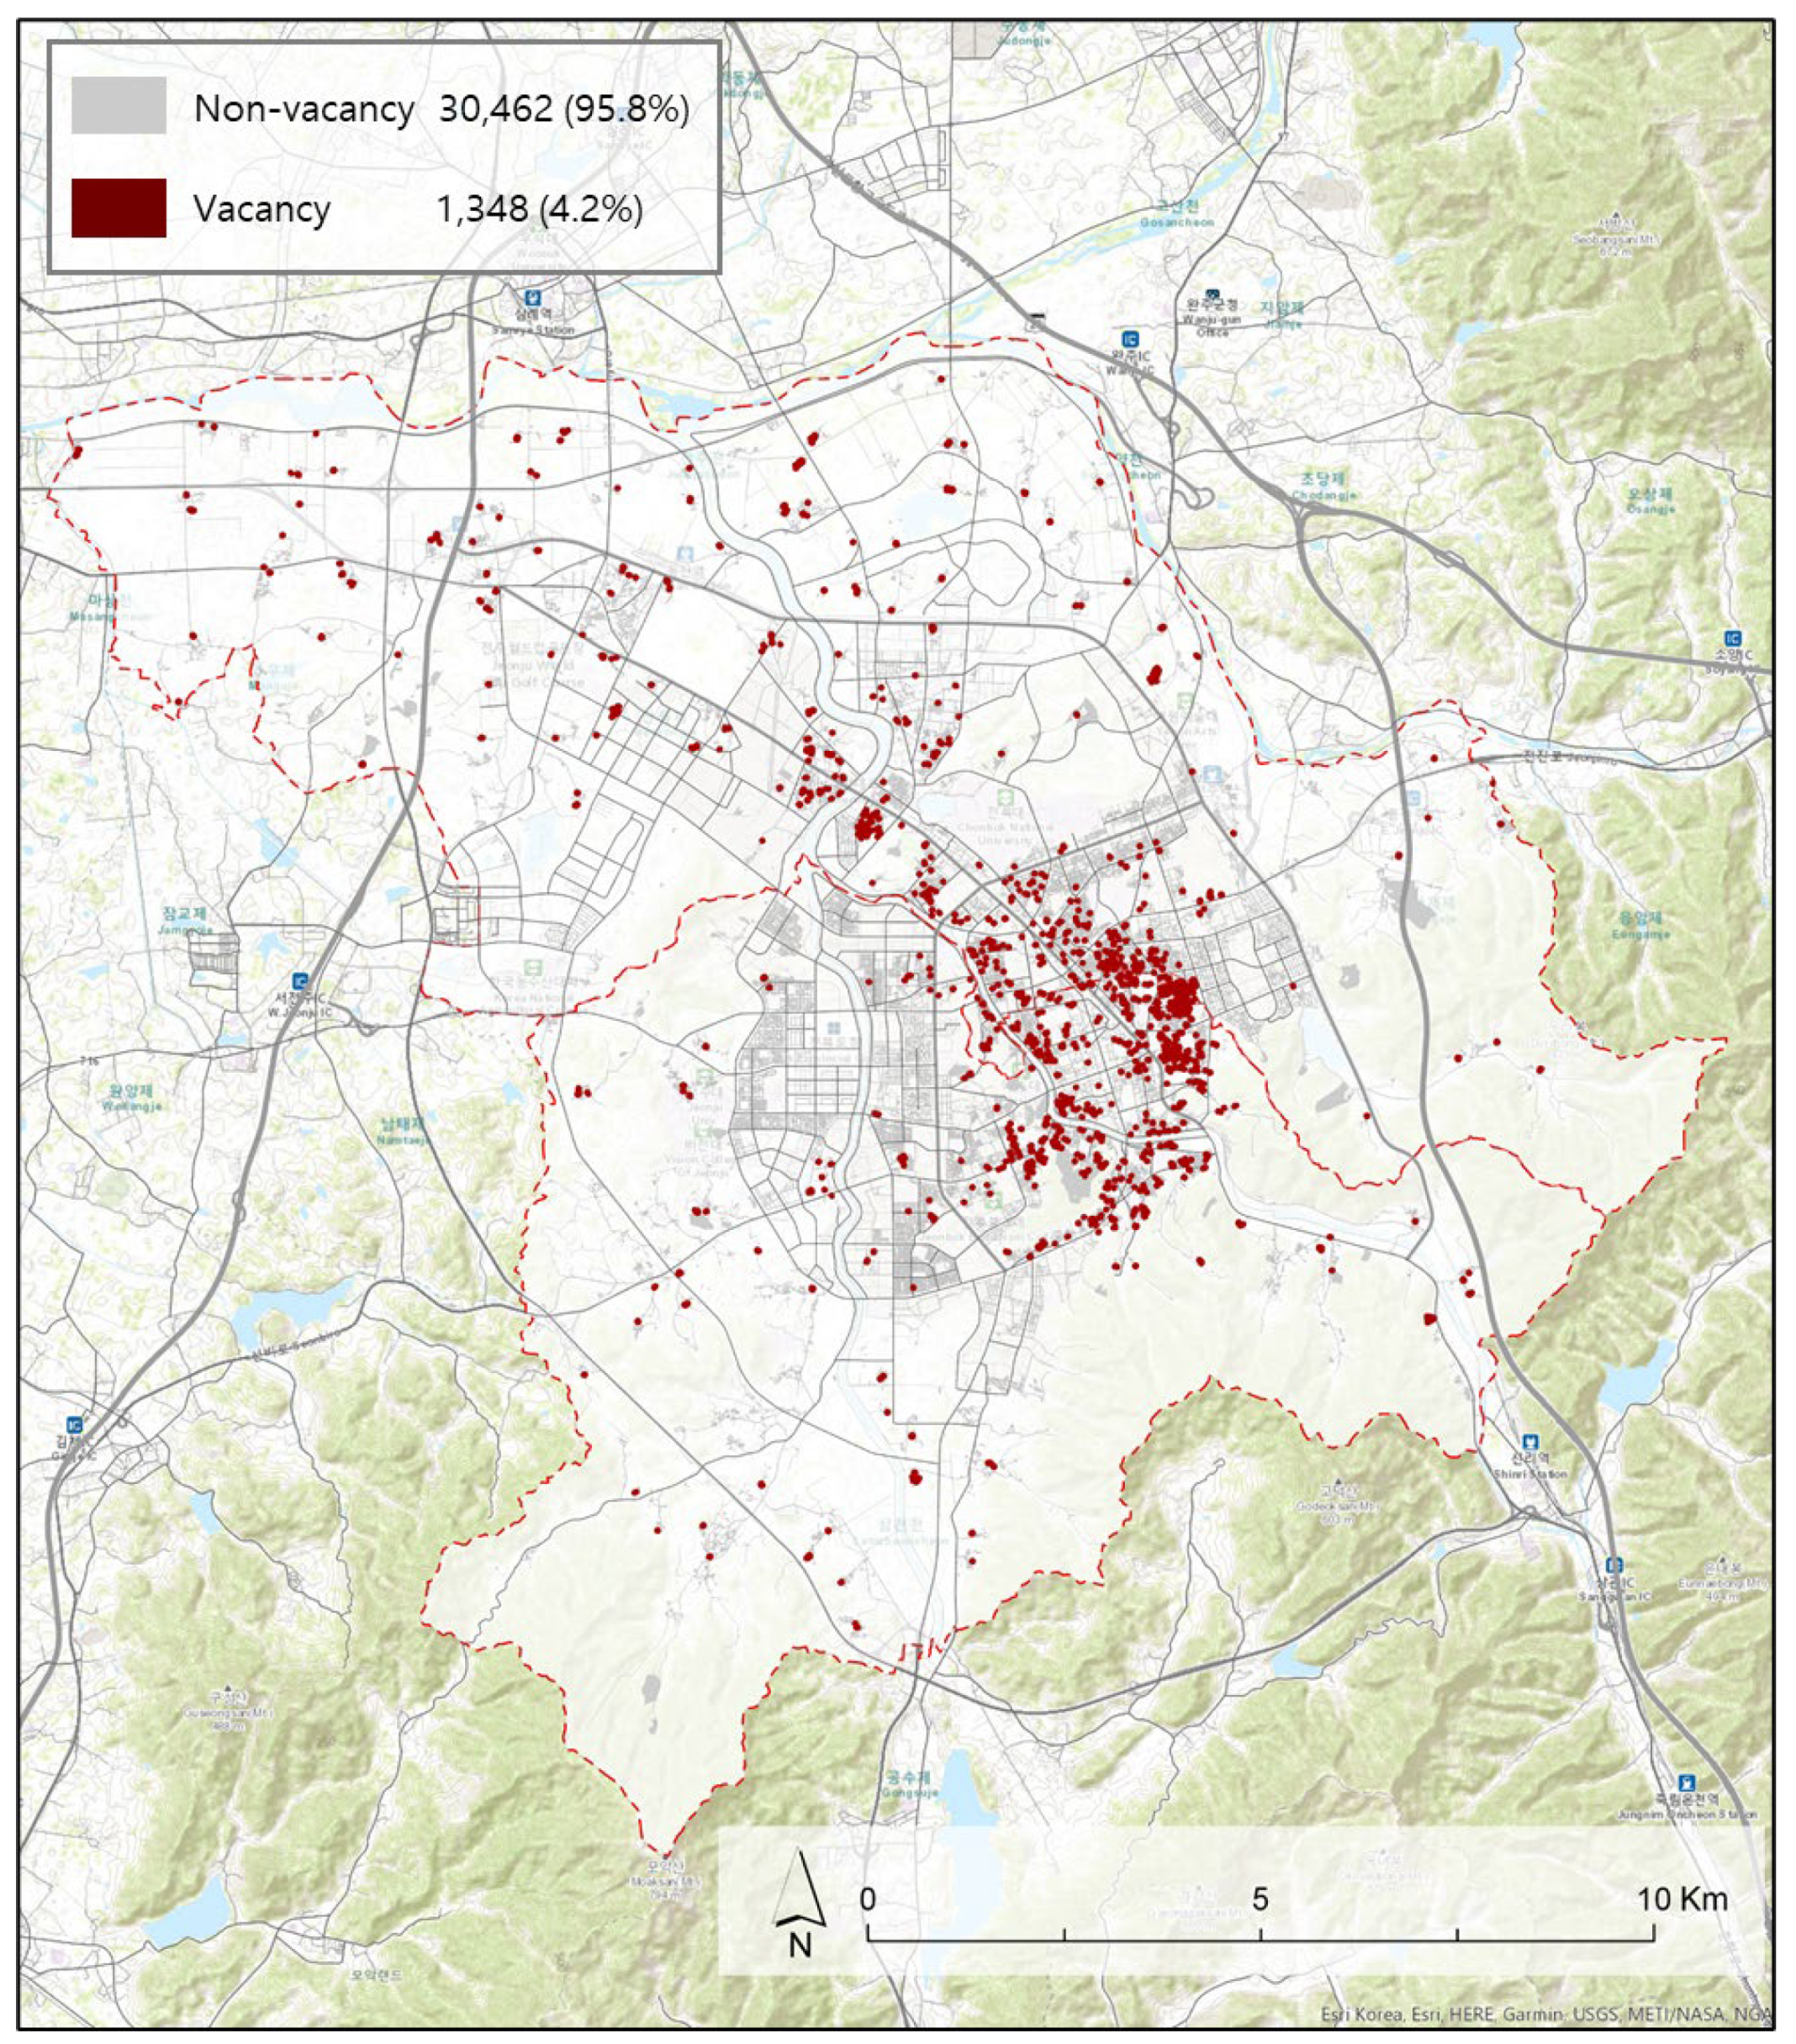
Based on the parcel numbering unit code for vacant properties derived from the above process, we established a building database along with building data from the geographic information system. The established building database includes various characteristics, including building identification number, parcel number, building structure, land area, gross floor area, violated building, building area, height, and construction year [1]. These data can be used to analyze contributors to vacant properties. From this process, a total of 52,429 parcels were extracted and spatialized out of 88,404 in Jeonju, excluding those that could not be analyzed (including illegal ones) as their characteristic data were not included in the building register. Since some multifamily properties share water and electricity usage, the survey has a limitation to determine whether a house is vacant within multifamily housing. Thus, 31,810 detached house parcels were re-extracted and used for analysis, and 4.2% of them (1348) were confirmed to be vacant (Table 2).
As shown in Figure 3, vacant properties are densely concentrated around the historic city center. For the historic city center, large-scale housing development projects on the edges of the city in the late 1970s led to a decline in population in residential areas in Jeonju; the North Jeolla Provincial Office was relocated to the outskirts of the city in 2005, bringing the city’s residential base into a further decline and exacerbating the issue of vacant properties. This reorganization of urban functions not only relocated or dispersed urban functions but forced residents to flow out to where the functions were relocated, thus increasing loss of employment and urban decline.
Because we analyzed vacancies within individual parcels, vacancies were expressed in binary code as 1 and non-vacancies as 0. Since the dependent variable was binary, a binary logistic regression analysis was performed.
Based on vacant property data from the above process, we identified the physical, spatial, and demographic characteristics of vacant properties using a dataset from two different scales: (1) individual building level and (2) the Dong level. Based on these characteristics, we predict the probability of non-vacant buildings becoming vacant properties in the future, identify areas at risk of vacancy, and establish a framework to devise relevant policies in the future.
2.3. Variable Data
Considering the factors reviewed from previous studies, seventeen variables at two levels were used as factors contributing to vacancy: those representing local characteristics and those reflecting the characteristics of individual parcels (Table 3). Variables representing local characteristics included five variables, such as the percentage of secondary industry workers, population density, the percentage of old buildings and parks and green area per person. Variables reflecting the characteristics of individual parcels included twelve variables, such as construction year, building structure, type of parcel, and road access conditions [33]. Within individual parcel variables, the total number of parcels within a radius of 500 m from amenities, such as elementary schools and hypermarkets, and the total number of parcels within a radius of 500 m from vacant ones were identified by spatial analysis in order to consider the effect of neighborhood environments around parcels on vacant properties.
Among individual parcel data, there were 11 dummy variables (0 or 1) excluding parcel area and construction year, and the reinforced concrete structure was set as default and compared with block, wood, steel, and other structures in order to obtain a relative vacancy probability. Regarding access to key infrastructure related to neighborhood environments, the area influenced by amenities was set at a radius of 500 m based on the literature examining a walkable and service-accessible distance [34,35,36], and we identified whether a parcel was included within a radius of 500 m from the center of amenities. Parcels within a radius of 500 m from unwanted facilities were also included in this study’s analysis because unwanted facilities such as waste treatment plants and wastewater discharge facilities may contribute to vacancies [37,38,39]. Over 50% of detached houses were located within a radius of 500 m from infrastructure for amenities such as elementary schools and hypermarkets.
Before analysis, a comparison of the characteristics of 31,810 detached house parcels confirmed that the percentage of wooden structures was 39.2% among vacant properties—2.7 times higher than that of wooden structures among non-vacant properties. Road access conditions and age (construction year) had poorer vacant properties than other detached house parcels. In contrast, the type of parcel (regular/irregular) in vacant properties was found to be regular, which is expected to have a positive effect on the use of the properties in the future (Table 4).
Basic statistics on variables also revealed that the percentage of aged buildings which were more than 30 years old among detached houses in Jeonju was 55.8%, and the average number of years since construction was ≥53—approximately 16.5 years older than non-vacant properties. As new buildings less than five years old accounted for only 1.2% of all buildings, a high percentage of old buildings is expected to worsen neighborhood environments and further exacerbate vacancies.
2.4. Methods
A multilevel logistic regression model calculates the probability that something will take place by considering other scales, and a logistic model is established based on exponential functions. The multilevel model is a statistical model that can be used to analyze data in hierarchical structures, where more than two units are included. This is also known as a hierarchical model. As vacant properties are locally affected by the characteristics assigned to the neighborhood level in addition to the individual building level, each effect may not be properly analyzed if the analysis is conducted at only one scale [20]. Because the multilayered model includes units at various scales when examining the effects of Dongs and the characteristics of buildings, as in this study, the model’s advantage is that it can calculate the variance of the dependent variable by level and identify the effect at each level. Because the dependent variable—whether an individual parcel is vacant (vacant property = 1; non-vacant property = 0)—is a discrete variable, a multilevel logistic regression model with a logit link function, and not a linear multilayer model, was used. Because we analyzed environmental factors contributing to vacant properties by considering two spatial layers of individual parcels and neighborhood environments, a two-level multilayer model was established and used for analysis.
The logistic regression model equation is as follows.
is the conditional probability that something will occur (vacant properties in this study). is the y-intercept; is the predictor variable; is the coefficient for , and is the residual.
Because it is difficult to intuitively interpret the logistic regression model, transforming the s-shape curve in the exponential function into a linear line with the logit model as an alternative may make interpretation easier. The logit model equation is as follows:
equals and is interpreted as a logit scale for conditional probability. For instance, assuming as the construction year and as 1.5, the odds ratio (OR) is . It is interpreted that an increase of one construction year increases the probability of vacancy by 4.5 times. In contrast, when is −1.5, it is . It is . It is therefore interpreted that a decrease of one construction year decreases the probability of vacancy by 4.5 times.
Before conducting a multilayer analysis, it must be validated by establishing an unrestricted model. An unrestricted model is a model in which only the dependent variable is input without any explanatory variable, and it consists only of the mean of the sample and the error term for each level. The sum of the error terms represents the total variance of the dependent variable, and the intra-class correlation can be obtained by calculating the percentage of the error term for each level. A high value means that the explanatory power is high at a certain level, and it is reasonable to analyze levels separately. In general, it is considered meaningful to use a multilayered model when it exceeds 5%. From the above process, we predicted the probability of vacancy for each detached house parcel, more objectively identified the spatial distribution of vacant properties using hotspot analysis, and confirmed the spatial distribution of vacant properties at risk of vacancy. The following equation was used:
where is the random intercept variance between Dongs.
The Stata/MP16 program was used for MLRM analysis. Then, hotspot analysis was conducted to determine where the vacant lands were statistically clustering by calculating the Getis-Ord Gi * of each parcel.
3. Results
3.1. Proportion of Variability in the Change of Vacancy
To determine whether a multilevel model is suitable for conducting the multilevel logistic regression model, we identified whether local characteristics contributed to an increase or decrease in vacancies between Dongs. Subsequently, a logistic regression analysis was conducted with 17 of the 18 variables extracted by considering previous studies, local characteristics, and data availability—except for the percentage of new buildings. New buildings built within the last five years were excluded from the analysis because they accounted for only 1.02% of the detached house parcels in Jeonju, which was considered insufficient for inclusion in the analysis.
Before analysis, we checked whether the variance in vacancy rate across Dongs was significant. As shown in Table 5, AIC and BIC were lower in the mixed effect model with a random intercept among Dongs than the standard logistic regression without a random intercept among Dongs. The difference was 755.06 with statistical significance at p < 0.05 in Chi-squared distributions. The results confirmed a local difference between Dongs in the effect on a vacancy increase or decrease, thus demonstrating the validity of the multilevel model.
We also examined variability in the probability of vacancy between Dongs with the ICC coefficient by considering only the random effect between Dongs without vacancy-related variables.
The ICC value indicates how much Dong scales compared to building scale account for the variations of vacancy. An analysis of local variance for the distribution of vacant properties, excluding the explanatory variable, with the above Equation (3) showed an intra-class correlation value in Jeonju of 0.206, which suggested that the variance in vacant properties in Jeonju is explained by 20.6% between Dongs (see Table 6). Since the ICC had high enough statistical reliability (over 5%), the results of volatility in the probability confirmed that the local characteristics of Jeonju greatly contributed to vacancy, and at the same time, proved that it is suitable to use the multilayered model. Therefore, we conducted a multilevel logistic regression model analysis to predict vacancies for each detached house parcel with the variables contributing to vacancy.
3.2. Multilevel Logistic Regression Model Analysis
Table 7 indicates the results of the multilevel logistic regression model analysis of variables that contribute to housing vacancies. The results of the analysis showed that 13 out of 20 variables had a statistically significant effect (95% significance) on vacancy. An analysis of the effect of each variable on vacant properties based on the estimated coefficient value showed that the probability of vacancy increased when the building structure was not concrete among other parcel and building characteristics. In particular, the variable that had the highest effect on vacant properties was the building structure and increasing the proportion of use of wooden structures by 1 (100%) increased the probability of the property being left vacant by 4.4 times compared to reinforced concrete structures. When detached houses and facilities in the neighborhood are old and poor and access to amenities decreases, preferences for the neighborhood decrease, which increases the probability of vacancy. Hence, it is necessary to continuously manage aged buildings with poor road access conditions.
Meanwhile, in terms of neighborhood environment characteristics, the presence of vacant properties or unwanted facilities around detached house parcels increased the probability of vacancy by about 1.17 times, while higher access to elementary schools and hypermarkets among other amenities led to a lower probability of vacancy. As such, vacant properties and unwanted facilities may harm the neighborhood, have a substantially negative effect on housing properties nearby, and eventually result in more vacant properties. High access to frequently used amenities, such as elementary schools and hypermarkets, also shows a negative relationship with vacant properties in our model, implying that the neighborhoods show less vacancies when anchor developments such as these are in place. The result indicates that such amenities are a positive attribute and result in decreased amounts of vacancy.
Four out of the five Dong-level variables, except for the percentage of secondary industry workers, were found to have an effect on vacant properties. In particular, buildings over 30 years old had the highest effect, and population density and fertility rate had little effect. Unlike the common expectation that a higher percentage of secondary industry workers (mining, manufacturing and construction industry) will increase vacant properties, Jeonju showed opposite results. It seems that secondary industries, including manufacturing, still play a positive role in the local economy, as Jeonju is not yet a shrinking city experiencing a rapid population and economic decline. This phenomenon was confirmed to have a similar pattern in other studies on vacant properties in some growing cities [11,21,40]. Secondary industries take the raw materials produced by the primary sector and process them into manufactured goods and products (e.g., heavy and light manufacturing, food processing, oil refineries, energy production, etc.) and Jeonju’s secondary industries still seem to be productive contributors to the local economy. It is important in the long term, however, that the city develops a method to phase out and reuse such industries as they become outdated or technological shifts require new facilities for existing services as to not increase their vacant land amount due to industrial life span dynamics.
3.3. Mean Multilevel Logistic Regression Model-Based Prediction of the Probability of Vacancy
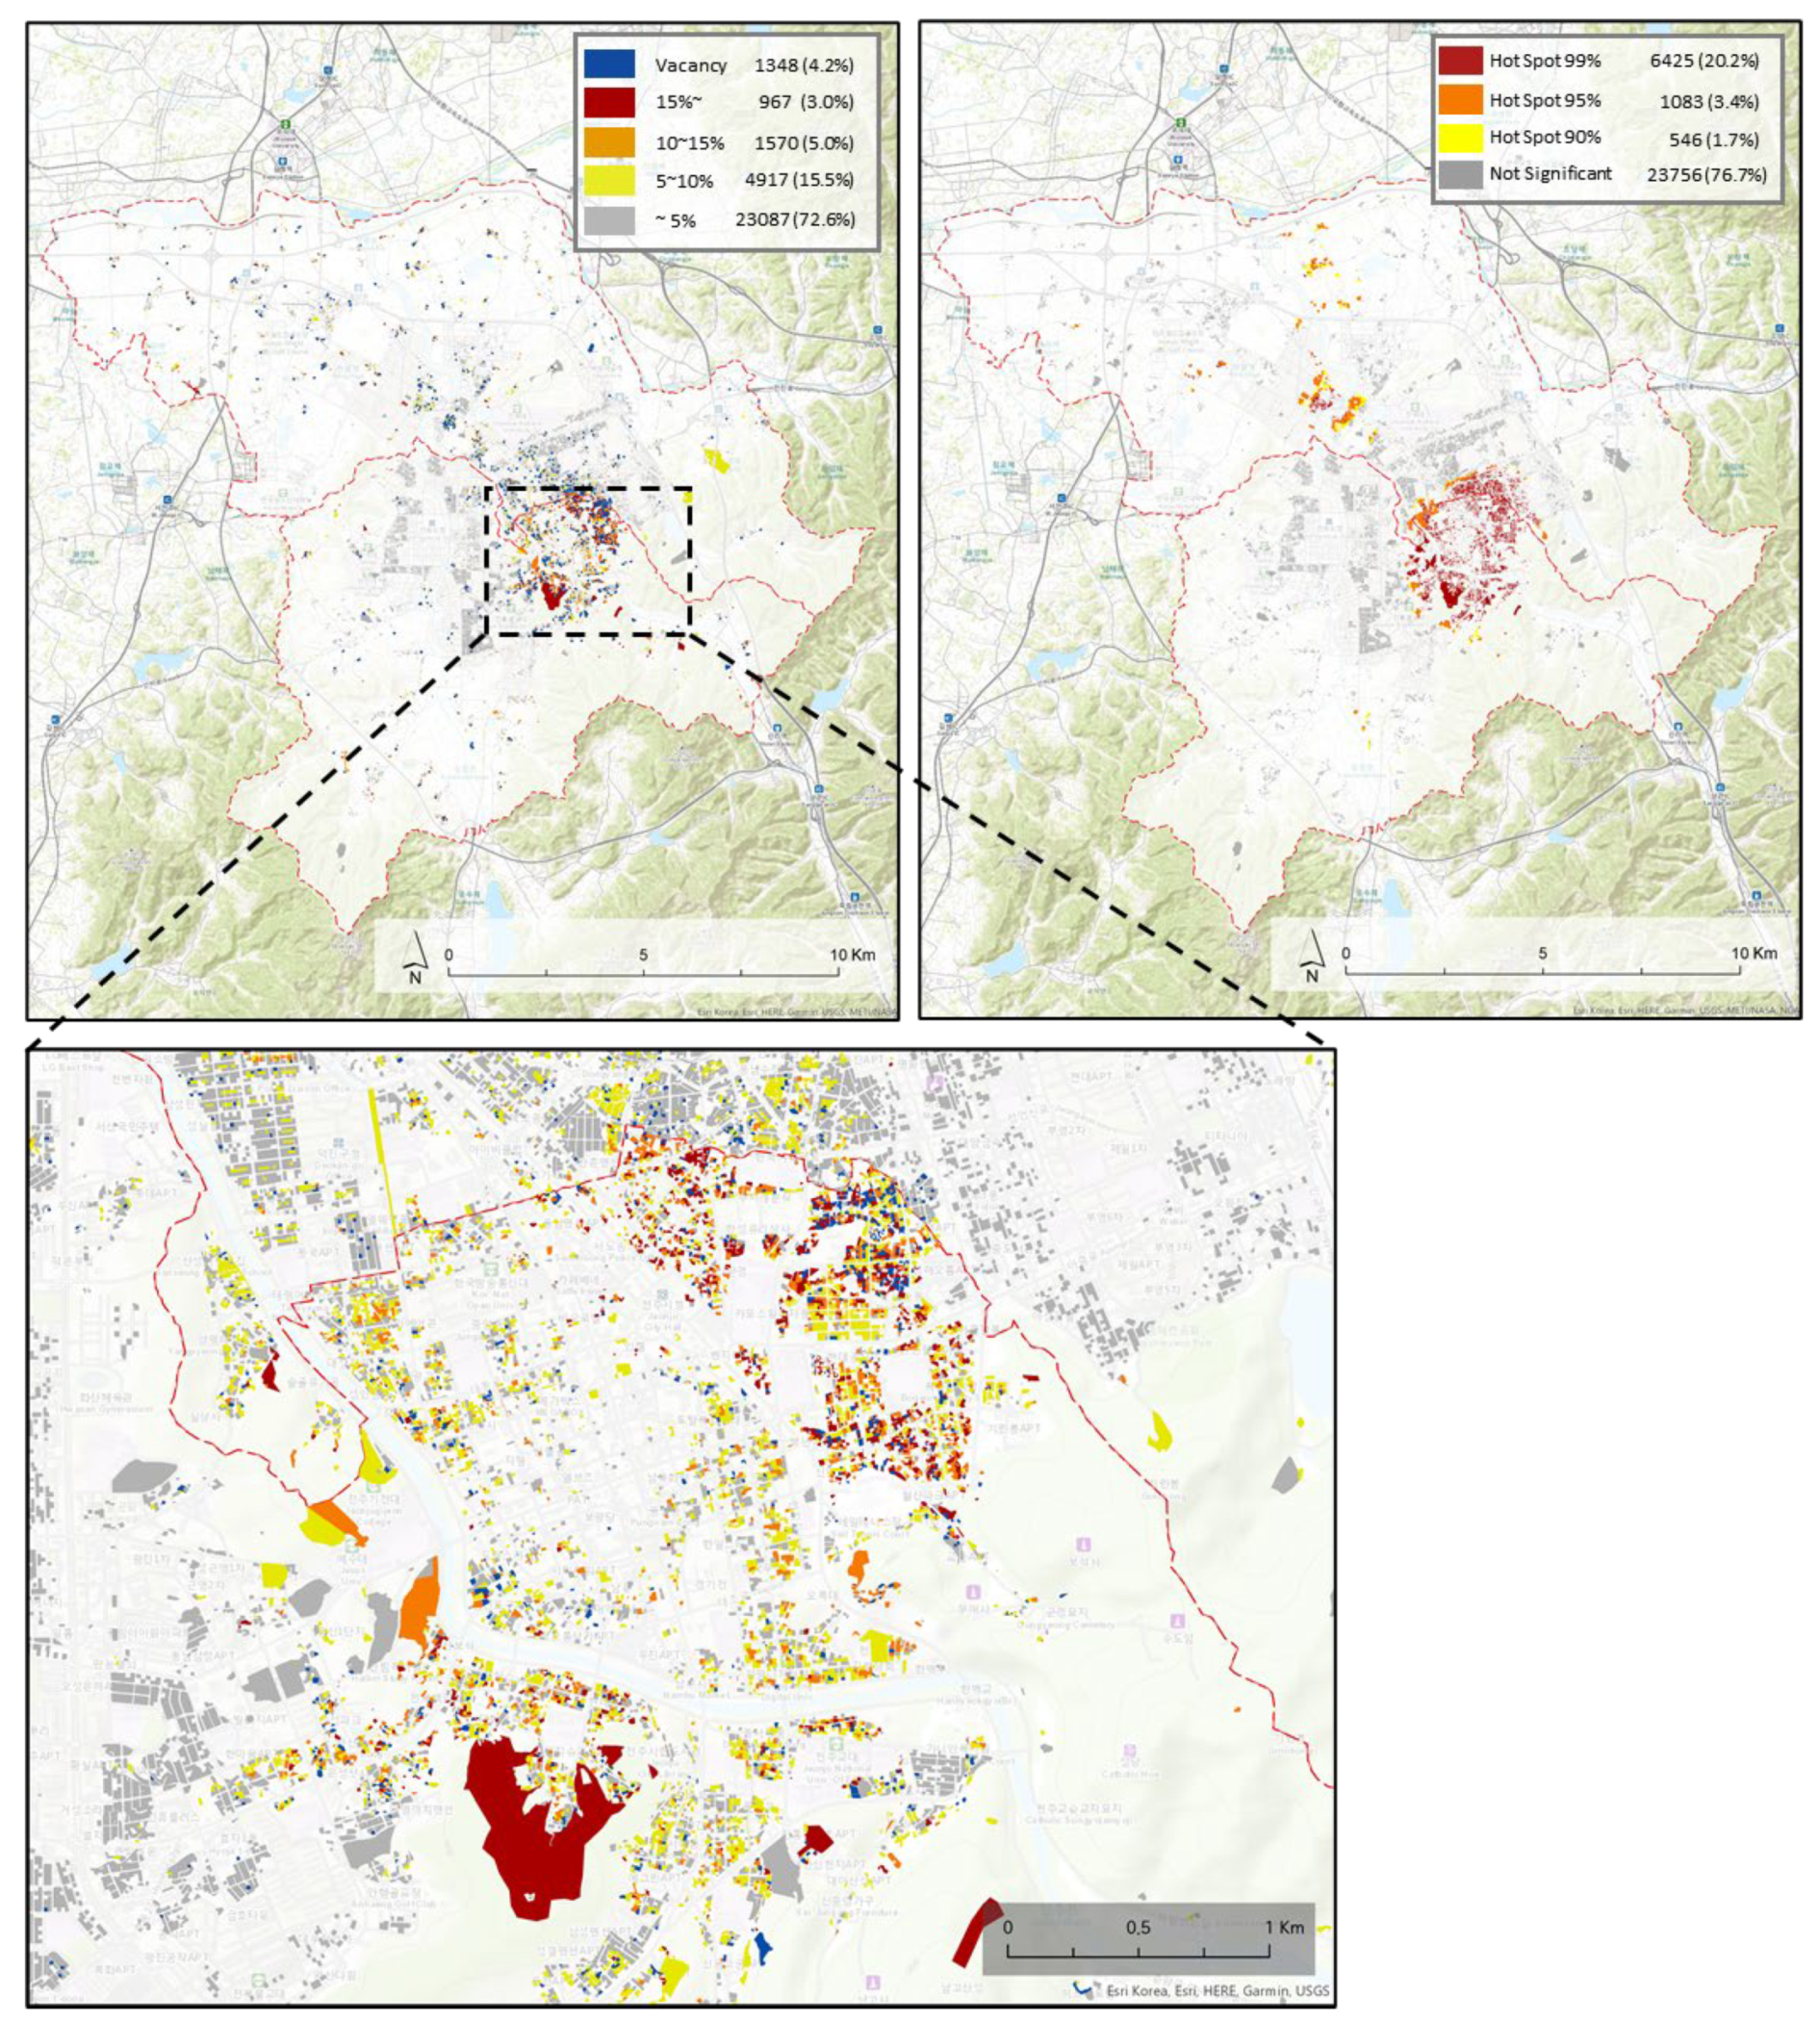
Through The MLRM analysis with the above 20 variables, a prediction of the probability of vacancy for each detached house parcel in Jeonju predicted the probability of vacancy for total detached houses in Jeonju as 7.6%. Considering the current vacancy rate of 4.2% in Jeonju, we set detached house parcels with ≥5% in the probability of vacancy as areas at risk, those with ≥5 to <10% as areas at low risk, those with ≥10 to <15% as areas at moderate risk, and those with ≥15% as areas at high risk, and then confirmed their distribution. The results showed that 8723 parcels (27.4%) of the total parcels were currently vacant or ≥5% in the probability of vacancy, and 2537 parcels were currently used, but their probability of vacancy was ≥10% (Figure 4). Vacant properties are more likely to be distributed densely in a certain area than randomly spread across a wide area. In particular, the spatial density and spread of vacant properties accelerate a slum’s growth into adjacent areas and facilities, leading to negative external effects such as deteriorating residential environments, risk of collapse, poor esthetics, increasing crime and disasters, falling housing prices, and increasing administrative costs.
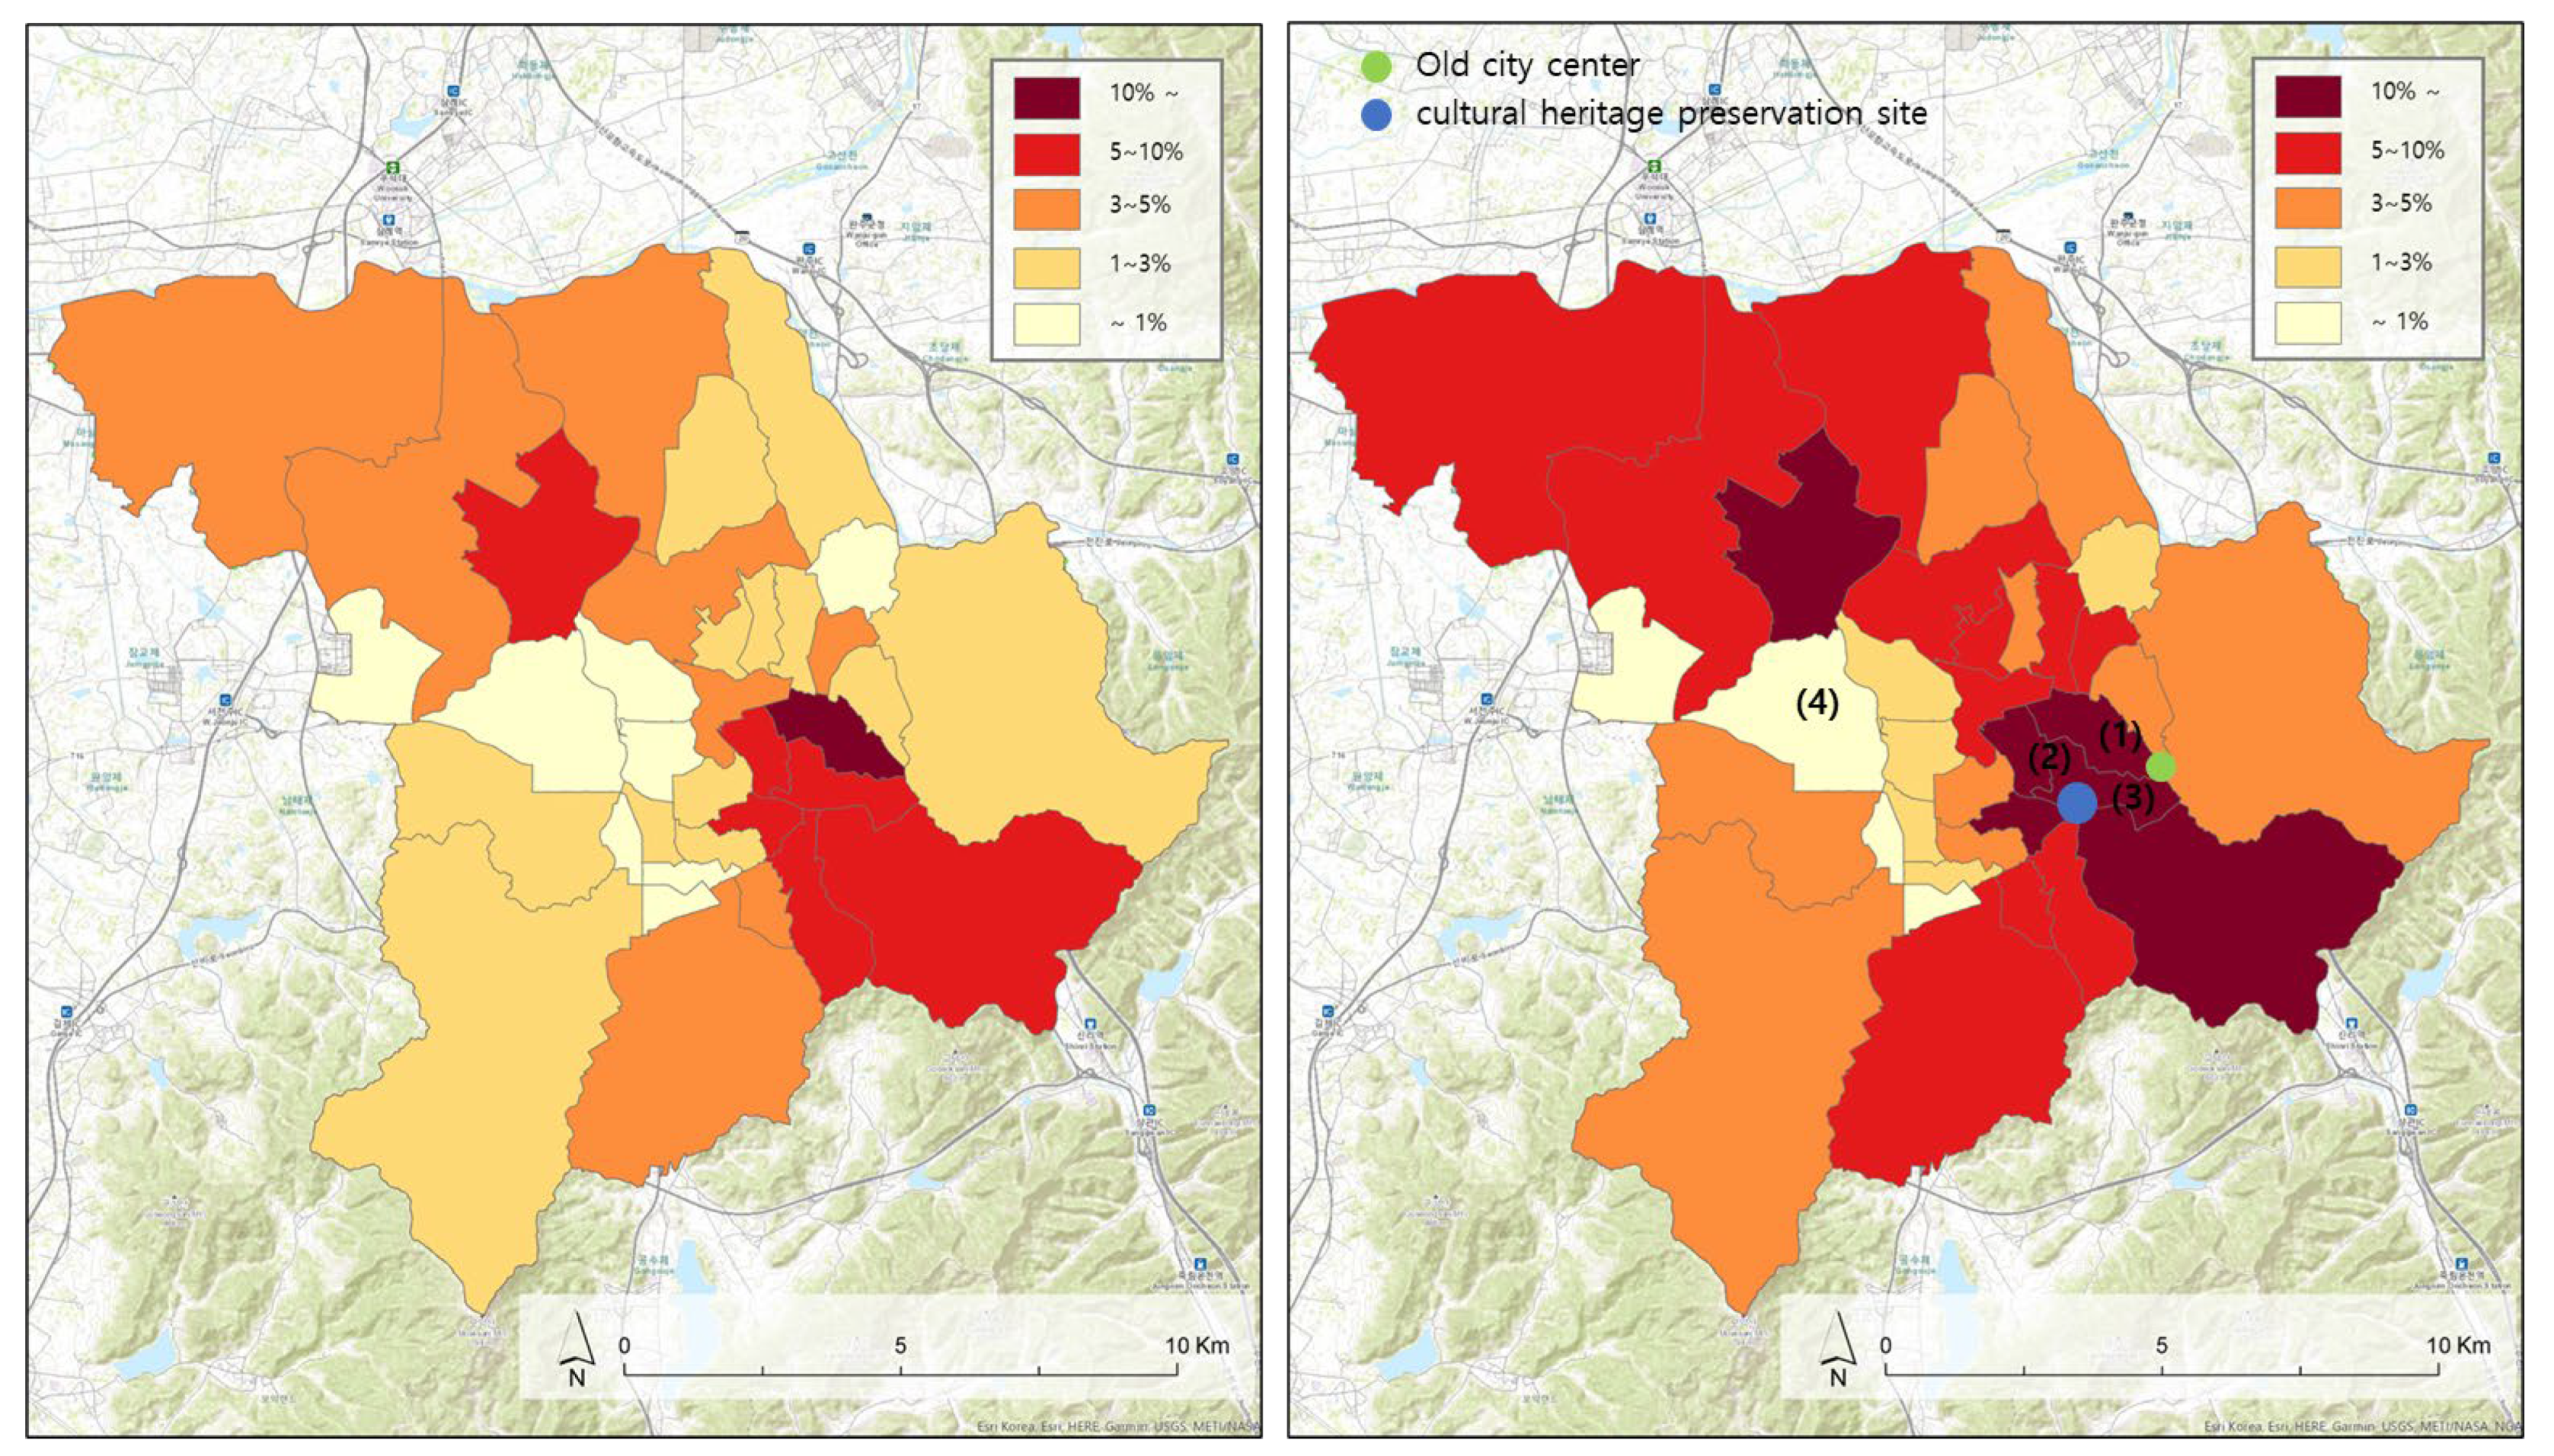
To empirically analyze the above findings, we used a hotspot analysis to confirm the spatial distribution of parcels with a vacancy probability of ≥5% and identified the probability of vacancy by Dong (Figure 5). The results showed that the vacancy rate is expected to increase in all 35 Dongs. Furthermore, it is expected that areas with high vacancy rates will face a vacancy threat in the future. More specifically, the probability of vacancy in Area (1), an old city center, is expected to be the highest (24.7%). Areas (2) and (3), adjacent to the old city center, where construction activities are limited to prevent loss or damage to cultural heritage and protect the landscape in the area designated as a cultural heritage preservation site, are expected to have a higher probability of vacancy (14.5%). In contrast, Area (4), where real estate development is the most active and new large-scale commercial zones are being formed, had better residential environments than other areas, and its probability of vacancy is less than 1% (Table 8).
The result indicated that the spatial clustering of high-risk of vacancy has similar characteristics, such as structure type and year of construction. Thus, these physical conditions might have a stronger influence on the spatial cluster of vacancy than socioeconomic status.
4. Conclusions
As vacant housing properties have recently emerged as a social issue, the central and local governments are making efforts to address this issue. To properly address the vacancy problem, it is more important than ever to establish a response strategy by first accurately identifying the contributors and characteristics of vacant properties, and then predicting areas at risk of vacancy in the future. We thus analyzed the causes and characteristics of vacant properties on a more local scale based on information on vacant properties in individual parcels in Jeonju. In addition, based on data for individual buildings, along with the local area’s socioeconomic characteristics examined in previous studies, the analysis of contributors to vacant properties in this study included not only the unique physical characteristics of individual parcels but also the neighborhood environments as key explanatory variables.
Then, we predicted areas at risk of vacancy in the future and analyzed the spatial distribution of vacant properties. More importantly, to empirically examine the effect at different spatial levels, we established a multilayer model, conducted analysis, and overcame the limitations of previous studies that analyzed hierarchical data at one level. By predicting areas at risk of vacancy based on the analyzed results, we also provided a reference for using vacant properties tailored to the region and establishing urban regeneration strategies.
The following summary describes the results of this study. First, an analysis of factors contributing to vacant properties in Jeonju found that structure type and access to public facilities parks, schools, and hypermarkets, was related to vacant possibilities. This is consistent with the argument of Williams et al. (2019) [23], who showed the importance of schools and malls to thriving cities. It suggests that local governments need to improve access to public amenities.at Level 1 (individual parcels). In particular, wooden structures exhibited a high probability of vacancy. At Level 2 (Dong level), the fertility rate and old building rate were significantly associated with the vacant possibilities. This suggests that locally poor physical conditions and low rate of young people are related to the local economic recession to increase vacant possibilities at the local scale [41,42]. The results show that the local government should establish urban regeneration plans in Dongs with high fertility and old building rates. Second, a prediction of the probability of vacancy in Jeonju and a hotspot analysis showed that the old city center and areas with strict regulations on land use are expected to have a higher vacancy rate. Hence, it is necessary to prepare measures to repurpose vacant properties. Areas where vacant properties are concentrated and form a cluster require a careful analysis of urban spatial characteristics, including streets, blocks, and unwanted facilities, as well as the architectural characteristics of the properties.
5. Discussion
This study is significant in that it identified the distribution patterns of vacant properties, found various environmental factors contributing to vacant properties, and analyzed areas at high risk of vacancy in the future. However, as there are limitations in generalizing this study’s results, an in-depth study would need to be conducted on the relationship between urban decline and vacant properties by region as well as the causes and characteristics of vacant properties. More notably, if time-series data were obtained with continuous follow-up of data on vacant properties, it would be possible to establish a more systematic management system for vacant housing properties.
Further, we conducted this study only on parcels, except for illegal buildings that did not have data on building characteristics. Nevertheless, as illegal buildings are actually old or highly likely to be vacant in the future, including them in the analysis would more accurately identify patterns in vacant properties and their changing effects on the properties. Finally, as this study’s analysis was conducted only for vacant detached house properties, factors contributing to different types of vacant housing properties were not examined.
According to the results of this study, various effects from individual parcels, neighborhoods, and spatial ranges at the local level should be considered to solve issues related to excessive vacant properties. If neighborhood or local environments are in high-quality condition, it may be possible to solve such problems by upgrading individual vacant properties. If vacant properties are caused by complex effects at different spatial levels, it would be desirable to implement multidimensional measures such as improving the conditions of individual houses, upgrading neighborhood environments, and mitigating socioeconomic vulnerabilities at the local level. Further, it is also necessary to suggest different revitalization strategies based specifically on the regional characteristics of the area. In the central business districts, new anchor developments may spur regeneration in the highly vacant properties. However, it might be more helpful to promote place attachment and social relationships to increase the quality of life in residential areas by providing qualified community service facilities.
Despite the growing number of vacant properties in local small- and medium-sized cities owing to continuously outflowing and aging populations, most local governments continue to adhere to growth-oriented urban regeneration strategies that are unsupported by accurate empirical studies. Plans and projects to upgrade vacant properties should prioritize the identification of causes and patterns contributing to vacant properties based on an accurate survey of the actual status. Therefore, it is necessary to accurately recognize the causes of vacant properties, as identified in this study, and establish appropriate measures to reduce the number of vacant properties with policies. Accordingly, more efficient urban regeneration strategies can be established. This process must precede the identification of optimal alternatives and set project priorities when implementing urban regeneration projects.
Author Contributions
Conceptualization, J.L.; methodology, C.L.; writing—original draft preparation, J.L.; writing—review and editing, supervision, G.N.; funding acquisition, J.L. All authors have read and agreed to the published version of the manuscript.
Funding
This research was supported by the Ministry of Education of the Republic of Korea and the National Research Foundation of Korea (NRF-2019S1A5A8032562).
Data Availability Statement
Not applicable.
Acknowledgments
Not applicable.
Conflicts of Interest
The authors declare no conflict of interest.
References
- Park, Y.; Newman, G.D.; Lee, J.-E.; Lee, S. Identifying and comparing vacant housing determinants across South Korean cities. Appl. Geogr. 2021, 136, 102566. [Google Scholar] [CrossRef]
- Tarsitano, E.; Rosa, A.G.; Posca, C.; Petruzzi, G.; Mundo, M.; Colao, M. A sustainable urban regeneration project to protect biodiversity. Urban Ecosyst. 2021, 24, 827–844. [Google Scholar] [CrossRef]
- Yoo, H.; Kwon, Y. Different Factors Affecting Vacant Housing According to Regional Characteristics in South Korea. Sustainability 2019, 11, 6913. [Google Scholar] [CrossRef] [Green Version]
- Kato, H. Total Fertility Rate, Economic–Social Conditions, and Public Policies in OECD Countries. In Macro-Econometric Analysis on Determinants of Fertility Behavior; Springer: Singapore, 2021; pp. 51–76. [Google Scholar]
- Kim, G.; Newman, G.; Jiang, B. Urban regeneration: Community engagement process for vacant land in declining cities. Cities 2020, 102, 102730. [Google Scholar] [CrossRef] [PubMed]
- Pagano, M.A.; Bowman, A.O.M. Vacant Land in Cities: An Urban Resource; Brookings Institution, Center on Urban and Metropolitan Policy: Washington, DC, USA, 2000. [Google Scholar]
- Olsen, A.K. Shrinking cities: Fuzzy concept or useful framework? Berkeley Plan. J. 2013, 26, 107–132. [Google Scholar] [CrossRef] [Green Version]
- Korea, S. 2017 Population and housing census. In Housing Census; Statistics Korea: Daejeon, Korea, 2018. [Google Scholar]
- Pagano, M.; Bowman, A. Vacant land as opportunity and challenge. In Recycling the City: The Use and Reuse of Urban Land; Lincoln Institute: Cambridge, MA, USA, 2004; pp. 15–32. [Google Scholar]
- Lee, J.; Newman, G. Forecasting Urban Vacancy Dynamics in a Shrinking City: A Land Transformation Model. ISPRS Int. J. Geo-Inf. 2017, 6, 124. [Google Scholar] [CrossRef] [Green Version]
- Lee, J.; Park, Y.; Kim, H.W. Evaluation of Local Comprehensive Plans to Vacancy Issue in a Growing and Shrinking City. Sustainability 2019, 11, 4966. [Google Scholar] [CrossRef] [Green Version]
- Scafidi, B.P.; Schill, M.H.; Wachter, S.M.; Culhane, D.P. An economic analysis of housing abandonment. J. Hous. Econ. 1998, 7, 287–303. [Google Scholar] [CrossRef]
- Hillier, A.E.; Culhane, D.P.; Smith, T.E.; Tomlin, C.D. Predicting housing abandonment with the Philadelphia neighborhood information system. J. Urban Aff. 2003, 25, 91–106. [Google Scholar] [CrossRef] [Green Version]
- Bassett, E.M.; Schweitzer, J.; Panken, S. Understanding Housing Abandonment and Owner Decision-Making in Flint, Michigan: An Exploratory Analysis; Lincoln Institute of Land Policy Working Paper; Lincoln Institute of Land Policy Information Services: Cambridge, MA, USA, 2006; pp. 1–62. [Google Scholar]
- Silverman, R.M.; Yin, L.; Patterson, K.L. Dawn of the dead city: An exploratory analysis of vacant addresses in Buffalo, NY 2008–2010. J. Urban Aff. 2013, 35, 131–152. [Google Scholar] [CrossRef]
- Morckel, V.C. Empty neighborhoods: Using constructs to predict the probability of housing abandonment. Hous. Policy Debate 2013, 23, 469–496. [Google Scholar] [CrossRef]
- Keenan, P.; Lowe, S.; Spencer, S. Housing abandonment in inner cities-the politics of low demand for housing. Hous. Stud. 1999, 14, 703–716. [Google Scholar] [CrossRef]
- Mallach, A. Bringing Buildings Back: From Abandoned Properties to Community Assets: A Guidebook for Policymakers and Practitioners; Rutgers University Press: New Brunswick, NJ, USA, 2006. [Google Scholar]
- Sternlieb, G.; Burchell, R.W.; Hughes, J.W.; James, F.J. Housing abandonment in the urban core. J. Am. Inst. Plan. 1974, 40, 321–332. [Google Scholar] [CrossRef]
- Accordino, J.; Johnson, G.T. Addressing the vacant and abandoned property problem. J. Urban Aff. 2000, 22, 301–315. [Google Scholar] [CrossRef]
- Newman, G.; Lee, J.; Berke, P. Using the land transformation model to forecast vacant land. J. Land Use Sci. 2016, 11, 450–475. [Google Scholar] [CrossRef]
- Zou, S.; Wang, L. Individual vacant house detection in very-high-resolution remote sensing images. Ann. Am. Assoc. Geogr. 2019, 110, 449–461. [Google Scholar]
- Williams, S.; Xu, W.; Bin Tan, S.; Foster, M.J.; Chen, C. Ghost cities of China: Identifying urban vacancy through social media data. Cities 2019, 94, 275–285. [Google Scholar] [CrossRef]
- Efthymiou, D.; Antoniou, C. How do transport infrastructure and policies affect house prices and rents? Evidence from Athens, Greece. Transp. Res. Part A Policy Pr. 2013, 52, 1–22. [Google Scholar] [CrossRef]
- Palm, M.; Gregor, B.; Wang, H.; McMullen, B.S. The trade-offs between population density and households׳ transportation-housing costs. Transp. Policy 2014, 36, 160–172. [Google Scholar] [CrossRef]
- Song, Z.; Cao, M.; Han, T.; Hickman, R. Public transport accessibility and housing value uplift: Evidence from the Docklands light railway in London. Case Stud. Transp. Policy 2019, 7, 607–616. [Google Scholar] [CrossRef]
- Jeon, Y.; Kim, S. The causes and characteristics of housing abandonment in an inner-city neighborhood—Focused on the Sungui-dong area, Nam-gu, Incheon. J. Urban Des. Inst. Korea Urban Des. 2016, 17, 83–100. [Google Scholar]
- Park, J.-I. A Multilevel Model Approach for Assessing the Effects of House and Neighborhood Characteristics on Housing Vacancy: A Case of Daegu, South Korea. Sustainability 2019, 11, 2515. [Google Scholar] [CrossRef] [Green Version]
- Masuda, H. Chihō Shōmetsu [The Extinction of Rural Areas]; Chūkō Shinsho: Tokyo, Japan, 2014. [Google Scholar]
- Lee, S.-H. Local Regions’ Extinction in South Korea 2018: Focusing on the Trend of 2013~2018 and Population Movement in Non-Capital Region Areas. Employ. Trend Brief 2018, 2018, 2–21. [Google Scholar]
- Lee, S. Seven Analysis on the Local Extinction in Korea, Regional Employment Trend Brief; Korea Employment Information Service: Seoul, Korea, 2016. [Google Scholar]
- Shah, I.H.; Dong, L.; Park, H.-S. Tracking urban sustainability transition: An eco-efficiency analysis on eco-industrial development in Ulsan, Korea. J. Clean. Prod. 2020, 262, 121286. [Google Scholar] [CrossRef]
- Jo, Y.-W.; Choi, Y.-B.; Park, C. Exploring Spatial Distribution of Empty Houses and Vacant Land Due to Population Decrease in Mokpo. J. Korean Soc. Environ. Restor. Technol. 2020, 23, 33–47. [Google Scholar]
- Osland, L.; Östh, J.; Nordvik, V. House price valuation of environmental amenities: An application of GIS-derived data. Reg. Sci. Policy Pr. 2020, 1–21. [Google Scholar] [CrossRef]
- Kaido, K. Urban densities, quality of life and local facility accessibility in principal Japanese cities. In Future forms and Design for Sustainable Cities; Routledge: London, UK, 2006; pp. 320–347. [Google Scholar]
- Niu, S.; Hu, A.; Shen, Z.; Lau, S.S.Y.; Gan, X. Study on land use characteristics of rail transit TOD sites in new towns—taking Singapore as an example. J. Asian Arch. Build. Eng. 2019, 18, 16–27. [Google Scholar] [CrossRef] [Green Version]
- Cozens, P.; Tarca, M. Exploring housing maintenance and vacancy in Western Australia: Perceptions of crime and crime prevention through environmental design (CPTED). Prop. Manag. 2016, 34, 199–220. [Google Scholar] [CrossRef]
- Pallagst, K. From urban shrinkage to urban qualities? J. Urban Des. 2019, 24, 68–70. [Google Scholar] [CrossRef]
- Schilling, J.; Logan, J. Greening the rust belt: A green infrastructure model for right sizing America’s shrinking cities. J. Am. Plan. Assoc. 2008, 74, 451–466. [Google Scholar] [CrossRef]
- Lee, J.; Newman, G.; Park, Y. A Comparison of Vacancy Dynamics between Growing and Shrinking Cities Using the Land Transformation Model. Sustainability 2018, 10, 1513. [Google Scholar] [CrossRef] [PubMed] [Green Version]
- Szafrańska, E.; De Lille, L.C.; Kazimierczak, J. Urban shrinkage and housing in a post-socialist city: Relationship between the demographic evolution and housing development in Łódź, Poland. Neth. J. Hous. Built Environ. 2019, 34, 441–464. [Google Scholar] [CrossRef] [Green Version]
- Esther Yakubu, I.; Egbelakin, T.; Dizhur, D.; Ingham, J.; Sungho Park, K.; Phipps, R. Why are older inner-city buildings vacant? Implications for town centre regeneration. J. Urban Regen. Renew. 2017, 11, 44–59. [Google Scholar]
Figure 1.
Location and demographics of the study area.

Figure 2.
Vacant property’s survey process.

Figure 3.
Distribution of parcel of detached house land and vacant properties in the study area.

Figure 4.
MLRM-based vacancy probability prediction (left) and hotspot analysis (right).

Figure 5.
Dong (Census district) level current vacancy status (left) and vacancy prediction (right).
Figure 5.
Dong (Census district) level current vacancy status (left) and vacancy prediction (right).


Table 1.
Location extinction risk index in the study area.
| 2000 | 2010 | 2020 | 2010–2020 Rate of Change | Local Extinction Risk Index | |
|---|---|---|---|---|---|
| Jeonju | 2.5 | 1.3 | 0.7 | 73.4% | Low extinction risk: ≥1.5 Moderate extinction risk: 1.0–1.5 High extinction risk: 0.5–1.0 Very high extinction risk: <0.5 |
| North Jeolla Province | 1.3 | 0.7 | 0.5 | 63.6% | |
| Nationwide | 2.1 | 1.1 | 0.6 | 71.5% |
Table 2.
Total and analyzed single family parcels in numbers and ratio.
| Total Parcels (%) | Total Vacant Properties (%) | Total Analyzed Parcels (%) | Vacant Properties in Analyzed Parcels (%) |
|---|---|---|---|
| 52,429 | 2046 | 31,810 | 1348 |
| (100%) | (3.9%) | (60.7%) | (4.2%) |
Table 3.
Characteristics of variables.
| Variable | Description | Source (Year) | ||
|---|---|---|---|---|
| Dependent variable | Vacancy |
| ||
| Dong level |
|
|
| |
| Individual parcel variables | Building characteristics |
|
|
|
| Neighborhood environment characteristics (access) |
|
|
|
Table 4.
Characteristics of analyzed parcels.
| Characteristics | Analyzed Parcels in Total | Vacant Properties | Parcels Except for Vacant Properties | ||||
|---|---|---|---|---|---|---|---|
| Number | Percentage (%) | Number | Percentage (%) | Number | Percentage (%) | ||
| Building structure | Reinforced concrete | 6786 | 21.3% | 20 | 1.5% | 6766 | 22.2% |
| Block | 19,120 | 60.1% | 766 | 56.8% | 18,354 | 60.3% | |
| Wooden | 4916 | 15.5% | 529 | 39.2% | 4387 | 14.4% | |
| Steel frame | 955 | 3.0% | 16 | 1.2% | 939 | 3.1% | |
| Others | 33 | 0.1% | 17 | 1.3% | 16 | 0.1% | |
| Type of parcel of land | Regular | 7860 | 24.7% | 475 | 35.2% | 7385 | 24.2% |
| Irregular | 23,950 | 75.3% | 873 | 64.8% | 23,077 | 75.8% | |
| Access | Not possible | 8097 | 25.5% | 720 | 53.4% | 7377 | 24.2% |
| Possible | 23,713 | 74.5% | 628 | 46.6% | 23,085 | 75.8% | |
| Construction year | 37.0 | 52.8 | 36.3 | ||||
| Parcel area (m2) | 288.4 | 447.8 | 281.4 | ||||
Table 5.
Comparison between models without a random intercept and those with a random intercept among Dongs.
Table 5.
Comparison between models without a random intercept and those with a random intercept among Dongs.
| AIC | BIC | p-Value | |
|---|---|---|---|
| Standard logistic regression without variables | 9222.1 | 9281.7 | 0.000 |
| Mixed effect model without variables | 9096.6 | 9099.2 |
Table 6.
Intraclass correlation coefficient value.
| Level 1 | Intra-Class Correlation | Std. Err. | [95% Conf. Interval] | |
|---|---|---|---|---|
| Dong Code | 0.206 | 0.048 | 0.127 | 0.314 |
Table 7.
The result of multilevel logistic regression analysis.
| Variables | Coefficient | SE | 95% Coefficient Interval | Exp(Coefficient) | 95% Coefficient Interval | Sig. | |||
|---|---|---|---|---|---|---|---|---|---|
| Lower | Upper | Lower | Upper (%) | ||||||
| Dong Level | Intercept | −6.548 | 0.329 | −7.193 | −5.904 | 0.001 | 0.001 | 0.003 | 0.000 |
| Secondary industry | −0.862 | 0.603 | −2.045 | 0.321 | 0.422 | 0.129 | 1.378 | 0.153 | |
| Fertility rate | 0.019 | 0.007 | 0.005 | 0.034 | 1.019 | 1.005 | 1.034 | 0.009 | |
| Population density | −0.000 | 0.000 | −0.000 | 0.000 | 1.000 | 1.000 | 1.000 | 0.053 | |
| Old building rate | 0.702 | 0.287 | 0.140 | 1.264 | 2.018 | 1.151 | 3.539 | 0.014 | |
| Building Characteristics | Park and green area | 0.001 | 0.001 | 0.000 | 0.002 | 1.001 | 1.000 | 1.002 | 0.016 |
| Vacancy (500 m) | 0.008 | 0.001 | 0.006 | 0.009 | 1.008 | 1.006 | 1.009 | 0.000 | |
| School (500 m) | −0.192 | 0.066 | −0.321 | −0.064 | 0.825 | 0.726 | 0.938 | 0.003 | |
| Hospital (500 m) | −0.087 | 0.079 | −0.241 | 0.067 | 0.917 | 0.786 | 1.069 | 0.268 | |
| Hypermarket (500 m) | −0.246 | 0.076 | −0.395 | −0.098 | 0.782 | 0.673 | 0.907 | 0.001 | |
| Welfare facility (500 m) | −0.035 | 0.070 | −0.174 | 0.103 | 0.965 | 0.841 | 1.108 | 0.615 | |
| Bus stop (100 m) | −0.102 | 0.069 | −0.237 | 0.033 | 0.903 | 0.789 | 1.033 | 0.138 | |
| Unwanted facility (500 m) | 0.153 | 0.078 | 0.001 | 0.305 | 1.166 | 1.001 | 1.357 | 0.048 | |
| Built year | 0.025 | 0.002 | 0.021 | 0.028 | 1.025 | 1.021 | 1.029 | 0.000 | |
| Parcel area | 0.000 | 0.000 | 0.000 | 0.000 | 1.000 | 1.000 | 1.000 | 0.105 | |
| Structure Block | 1.353 | 0.240 | 0.884 | 1.823 | 3.871 | 2.421 | 6.190 | 0.000 | |
| Structure Wood | 1.477 | 0.256 | 0.975 | 1.980 | 4.382 | 2.652 | 7.239 | 0.000 | |
| Structure Steel | 1.324 | 0.348 | 0.642 | 2.005 | 3.758 | 1.901 | 7.429 | 0.000 | |
| Structure Others | 4.753 | 0.455 | 3.861 | 5.644 | 115.874 | 47.502 | 282.656 | 0.000 | |
| Parcel type | 0.075 | 0.067 | −0.057 | 0.207 | 1.078 | 0.945 | 1.230 | 0.263 | |
| Road access | 0.649 | 0.063 | 0.526 | 0.773 | 1.914 | 1.692 | 2.166 | 0.000 | |
Table 8.
Current and predicted vacancy probability by Dong.
| (1) | (2) | (3) | (4) | |
|---|---|---|---|---|
| Current Vacancy (%) | 0.14 | 0.06 | 0.06 | 0.00 |
| Predicted Vacancy (%) | 0.25 | 0.12 | 0.12 | 0.00 |
Publisher’s Note: MDPI stays neutral with regard to jurisdictional claims in published maps and institutional affiliations. |
© 2022 by the authors. Licensee MDPI, Basel, Switzerland. This article is an open access article distributed under the terms and conditions of the Creative Commons Attribution (CC BY) license (https://creativecommons.org/licenses/by/4.0/).
Share and Cite
MDPI and ACS Style
Lee, J.; Newman, G.; Lee, C. Predicting Detached Housing Vacancy: A Multilevel Analysis. Sustainability 2022, 14, 922. https://doi.org/10.3390/su14020922
AMA Style
Lee J, Newman G, Lee C. Predicting Detached Housing Vacancy: A Multilevel Analysis. Sustainability. 2022; 14(2):922. https://doi.org/10.3390/su14020922
Chicago/Turabian StyleLee, Jaekyung, Galen Newman, and Changyeon Lee. 2022. "Predicting Detached Housing Vacancy: A Multilevel Analysis" Sustainability 14, no. 2: 922. https://doi.org/10.3390/su14020922
Note that from the first issue of 2016, this journal uses article numbers instead of page numbers. See further details here.