
Research and Optimization of the Coupling and Coordination of Environmental Regulation, Technological Innovation, and Green Development


1
School of Economics, Ocean University of China, Qingdao 266100, China
2
School of Management Science and Engineering, Shandong University of Finance and Economics, Jinan 250014, China
3
Institute of Marine Economy and Management, Shandong University of Finance and Economics, Jinan 250014, China
4
Faculty of Science, University of British Columbia, 2202 Main Mall, Vancouver, BC V6T 1Z4, Canada
5
School of Banking and Finance, University of International Business and Economics, Beijing 100029, China
*
Author to whom correspondence should be addressed.
Sustainability 2022, 14(1), 501; https://doi.org/10.3390/su14010501
Submission received: 17 November 2021
/
Revised: 9 December 2021
/
Accepted: 9 December 2021
/
Published: 4 January 2022
Abstract
:Environmental regulation and technological innovation play important strategic roles in green growth, and the three systems interact and influence each other. Herein, we used a comprehensive development level evaluation model for calculating the environmental regulation and technological innovation indices for 17 cities in Shandong Province. We used the slack-based measure-data envelopment analysis (SBM-DEA) model to measure green development efficiency. The coupling coordination degree model was used to determine the coordination of environmental regulation, technological innovation, and green development; we divided the cities into three systems: green economy lagging, environmental regulation lagging, and technological innovation lagging. We used grey correlation analysis to explore the factors affecting system development. Eastern coastal cities were better developed in the three systems and the degree of coupling and coordination, like Qingdao and Weihai, and the observed level of technological innovation development, a critical factor in the coordinated development of cities, was lowest in Shandong Province. The grey correlation analysis illustrated that the level of economic development and the level of foreign economic development impacts cities labeled green economy lagging; the impact of pollutant emissions is greater than pollution control expenditure in environmental regulation lagging cities; and the government’s attention and the cultivation and attraction of talent are foundational for technological innovation in lagging cities. Considering these factors, we make recommendations for the optimal development of cities and coordinated development of regions.
1. Introduction
In recent years, a green development method that considers “economic growth, resource conservation, and environmental friendliness” has been paid adequate attention. The green development model has gradually become mainstream with the introduction of quality development [1,2,3]. The enhancement of environmental regulations has put environmental protection pressure on enterprises [4], thus making them prefer to invest in technological innovation [5]. The direct ecological benefits brought by environmental regulations and the indirect ecological benefits that drive technological innovation play a positive role in green development [6], although environmental regulations may have a short-term impact on economic growth and technological innovation [7,8,9]. Improvements in scientific and technological innovation capabilities can directly or indirectly reduce pollution emissions and improve green development [10,11]. Environmental regulations can be targeted by using higher levels of technological innovation and green development, thus improving policy efficiency [12,13]. The improvement in the level of green development involves the progress of resource utilization efficiency and the improvement of the ecosystem so that more factors can contribute to the environmental regulation system and the scientific and technological innovation system, thus improving the infrastructure required and adding impetus for their further development.
Green development is a sustainable model generally followed by countries worldwide [14,15]. The coordination of various issues in the economic, environmental, and social fields promotes balanced sustainable development and improves the efficiency of green development, such that it is one of the critical areas of study for domestic and foreign research scholars. Concerning the analysis of environmental regulation and green development, empirical research has shown that increasing the intensity of environmental regulation can improve the efficiency of green development [16,17,18]. Strengthening environmental regulations provides both “top-to-top competition” and “bottom-to-bottom competition” for local and municipal governments [19,20]. At the same time, the implementation of green development strategies affects the formulation of environmental regulations [13,21]. The relationship between environmental regulations and the development of the green economy of our country conforms to a U-shaped change relationship, and the two factors influence each other [22,23,24]. Research studies show that enhancing environmental regulation can increase enterprises’ willingness to innovate [25,26,27], and strengthening environmental regulation has different impacts on the innovation activities of different enterprises based on the perspective of the relationship between environmental regulation and technological innovation [12,28,29]. On one side, it is often argued that there is a conflict between environmental protection and business performance [30], insofar as environmental improvement efforts increase companies’ costs and erode their competitive advantage and business performance [31]. From this perspective, it could be noted that environmental commitment is a luxury good [32]. In the empirical literature, some results support this belief. In this sense, some authors have found evidence that the relationship between environmental regulation and productivity is negative [33,34,35,36]. In contrast, some authors point out that the existence of strict environmental regulations encourages the replacement of underperforming assets, which contributes to an increase in the productivity of companies and an improvement in business performance [37]. In other words, the design and implementation of an environmental innovation strategy can bring both economic benefits to companies and environmental benefits to society; that is, it is a win-win solution [38]. The implementation of strict environmental regulations can induce the irruption of innovations that help reduce the environmental impact and, simultaneously, also contribute to the improvement of business performance. They constitute what Jaffe and Palmer [39] called the weak version and the strong version of Porter’s hypothesis, referring to the effect that government regulations have on environmental innovations, on the one hand, and business performance, on the other. In general, most empirical studies have corroborated the weak hypothesis, but few studies corroborate the strong hypothesis [40]. Research shows that there is an inverted U-shaped relationship between technological innovation and environmental regulation, which means that as the intensity of environmental regulation increases, the impact of environmental regulation on technological innovation will shift from restraint to leading [41]. As the intensity of environmental regulations increases, there will be an “inflection point” [42,43]. Beyond this point, environmental regulations will promote the development of technological innovation. Some scholars have found that the relationship between China’s environmental regulations and green technology innovation conforms to the U-shaped curve, and China is in a stage of restraint before the “inflection point” [44].
Concerning the relationship between technological innovation and green development, these two factors are important for the development of each other [45]. Research scholars have observed that technological innovation can promote green development, induce spatial spillover effects, and exhibit different influence capabilities in different regions [46]. However, the use of spillovers, in a certain geographical area, requires companies to have a high absorption capacity, as only in this way can small and medium-sized companies take advantage of their relationships with scientific agents [47]. Likewise, eco-innovation-oriented strategies have a positive impact on the labor productivity of enterprises, and the establishment of R&D cooperation agreements to receive public aid has a lower effect on the labor productivity of non-ecological innovation enterprises [48]. After determining the temporal and spatial evolution trends of regional innovation and green development synergy, it was observed that the coupling degree gradually increased between these two factors, and there were regional differences, although the overall coordination degree between them was low in China [49]. There is little research on the relationship between environmental regulation, technological innovation, and green development. Kerui used a partial linear function coefficient panel model to study 105 cities in our country and observed that green economic innovation is an important method for promoting urban green economic transformation [50]. By fostering green technological innovation, environmental regulation can promote urban green economic changes [51].
Most of the current research involves empirical analyses and the development of linear and non-linear regression models of various environmental regulations, technological innovation, and green development, focusing on the analysis of the relationship between the two factors, such as environmental regulations and technological innovation, environmental regulations and green development, and technological innovation and green development. Some of the current research focuses on determining whether there is harmony among the three factors. Few studies have been conducted on the development of a virtuous circle. In addition, most of the literature only analyzes the degree of influence without further in-depth analysis of the optimization of urban development.
Shandong Province has developed rapidly in terms of social economy, and its regional GDP ranks among the best of provinces in China. According to China Statistical Yearbook, Shandong Province is the third-largest economy in China. Its economic aggregates, exceeding one trillion US dollars, rank among the global top 20. However, there remain drawbacks such as heavy industrial structure, insufficient innovation ability, the destruction of resources and the environment, and the low efficiency of green approaches in its economic development. High-quality economic development is affected by the interaction between environmental regulation, technological innovation, and green growth, and any disconnect between these factors. Amidst the background of the new normal of economy, the following questions arise. What is the coordinated development relationship among the three major systems of environmental regulation, technological innovation, and green growth for each city? What are the critical systems and main factors hindering the comprehensive development of the region? How can the level of regional coordinated development be optimized? In this paper, we focus on these issues to promote the coordinated development of the three major systems of environmental regulation, scientific and technological innovation, and green growth in various cities of Shandong Province and further promote the high-quality development of the region.
Therefore, we selected 17 cities in Shandong Province as the research object, used the slack based measure-data envelopment analysis (SBM-DEA) model to measure the level of green growth, applied the comprehensive development level evaluation model to estimate the environmental regulation index and the scientific and technological innovation index, and developed a coupling coordination model based on these factors. We determined the coordinated development status of the three systems of environmental regulation, technological innovation, and green development in each city of Shandong Province. Finally, to analyze the main factors that restrict the efficiency of green growth, environmental regulation, and technological innovation, the grey correlation model was used to provide a reference and basis for optimizing the level of coordination of environmental law, technological innovation, and green development. The term “cities” in this article is an administrative term covering rural surroundings as well as urban areas. The total area of the province is the sum of 17 cities.
2. Materials and Methods
2.1. SBM-DEA Model
By combining the actual objectives of the research in this study, we adopted the DEA model based on slack variables proposed by Tone [52,53], namely, the SBM model for evaluating the green development efficiency of 17 cities in Shandong Province. The specific form can be expressed as follows [54,55,56,57]:
The above formula defines green development efficiency. In this formula, are the efficiency score, excess input, good output deficit, and excess of bad output, respectively. This means that the current factor input is inefficient when only the evaluation unit is efficient.
According to the principle of index selection, (1) the total number of selected input-output indices should not be overmuch, and the number of decision-making units (DMUs) should follow the condition , where represent the number of DMUs and the number of input and output variables, and (2) the absolute number index and the relative number index cannot exist simultaneously in the index to ensure the credibility of the results [53]. In this study, we established a green development efficiency evaluation index system, as shown in Table 1. To reduce the influencing factors of the price level, the actual GDP calculated in the base period of 2006 was selected to measure the expected output and to better consider the emissions and hazards of various pollutants, such as the emissions of sulfur dioxide and industrial wastewater. We used the entropy method [58,59] to calculate the respective weights of the emissions of sulfur dioxide, the emissions of industrial wastewater, industrial smoke (powder) dust emissions, and general industrial solid waste generation. Their corresponding weights are 0.22, 0.13, 0.30, and 0.35. We then used the comprehensive evaluation method to construct a comprehensive pollution index, which is undesired output.
2.2. Comprehensive Development Level Evaluation Model
In this study, we used the comprehensive development level evaluation model to select indicators for evaluation according to the index selection principle and the existing index system, given the complexity of the environmental regulation system and the scientific and technological innovation system [60,61,62]. Table 2 lists the selected specific indicators and their weights calculated by the entropy method. We used the range method and the entropy method to objectively determine the importance of the evaluation index. We then used the comprehensive evaluation method to construct the environmental regulation evaluation index and the scientific and technological innovation evaluation index.
2.3. Coupling Coordination Degree Model
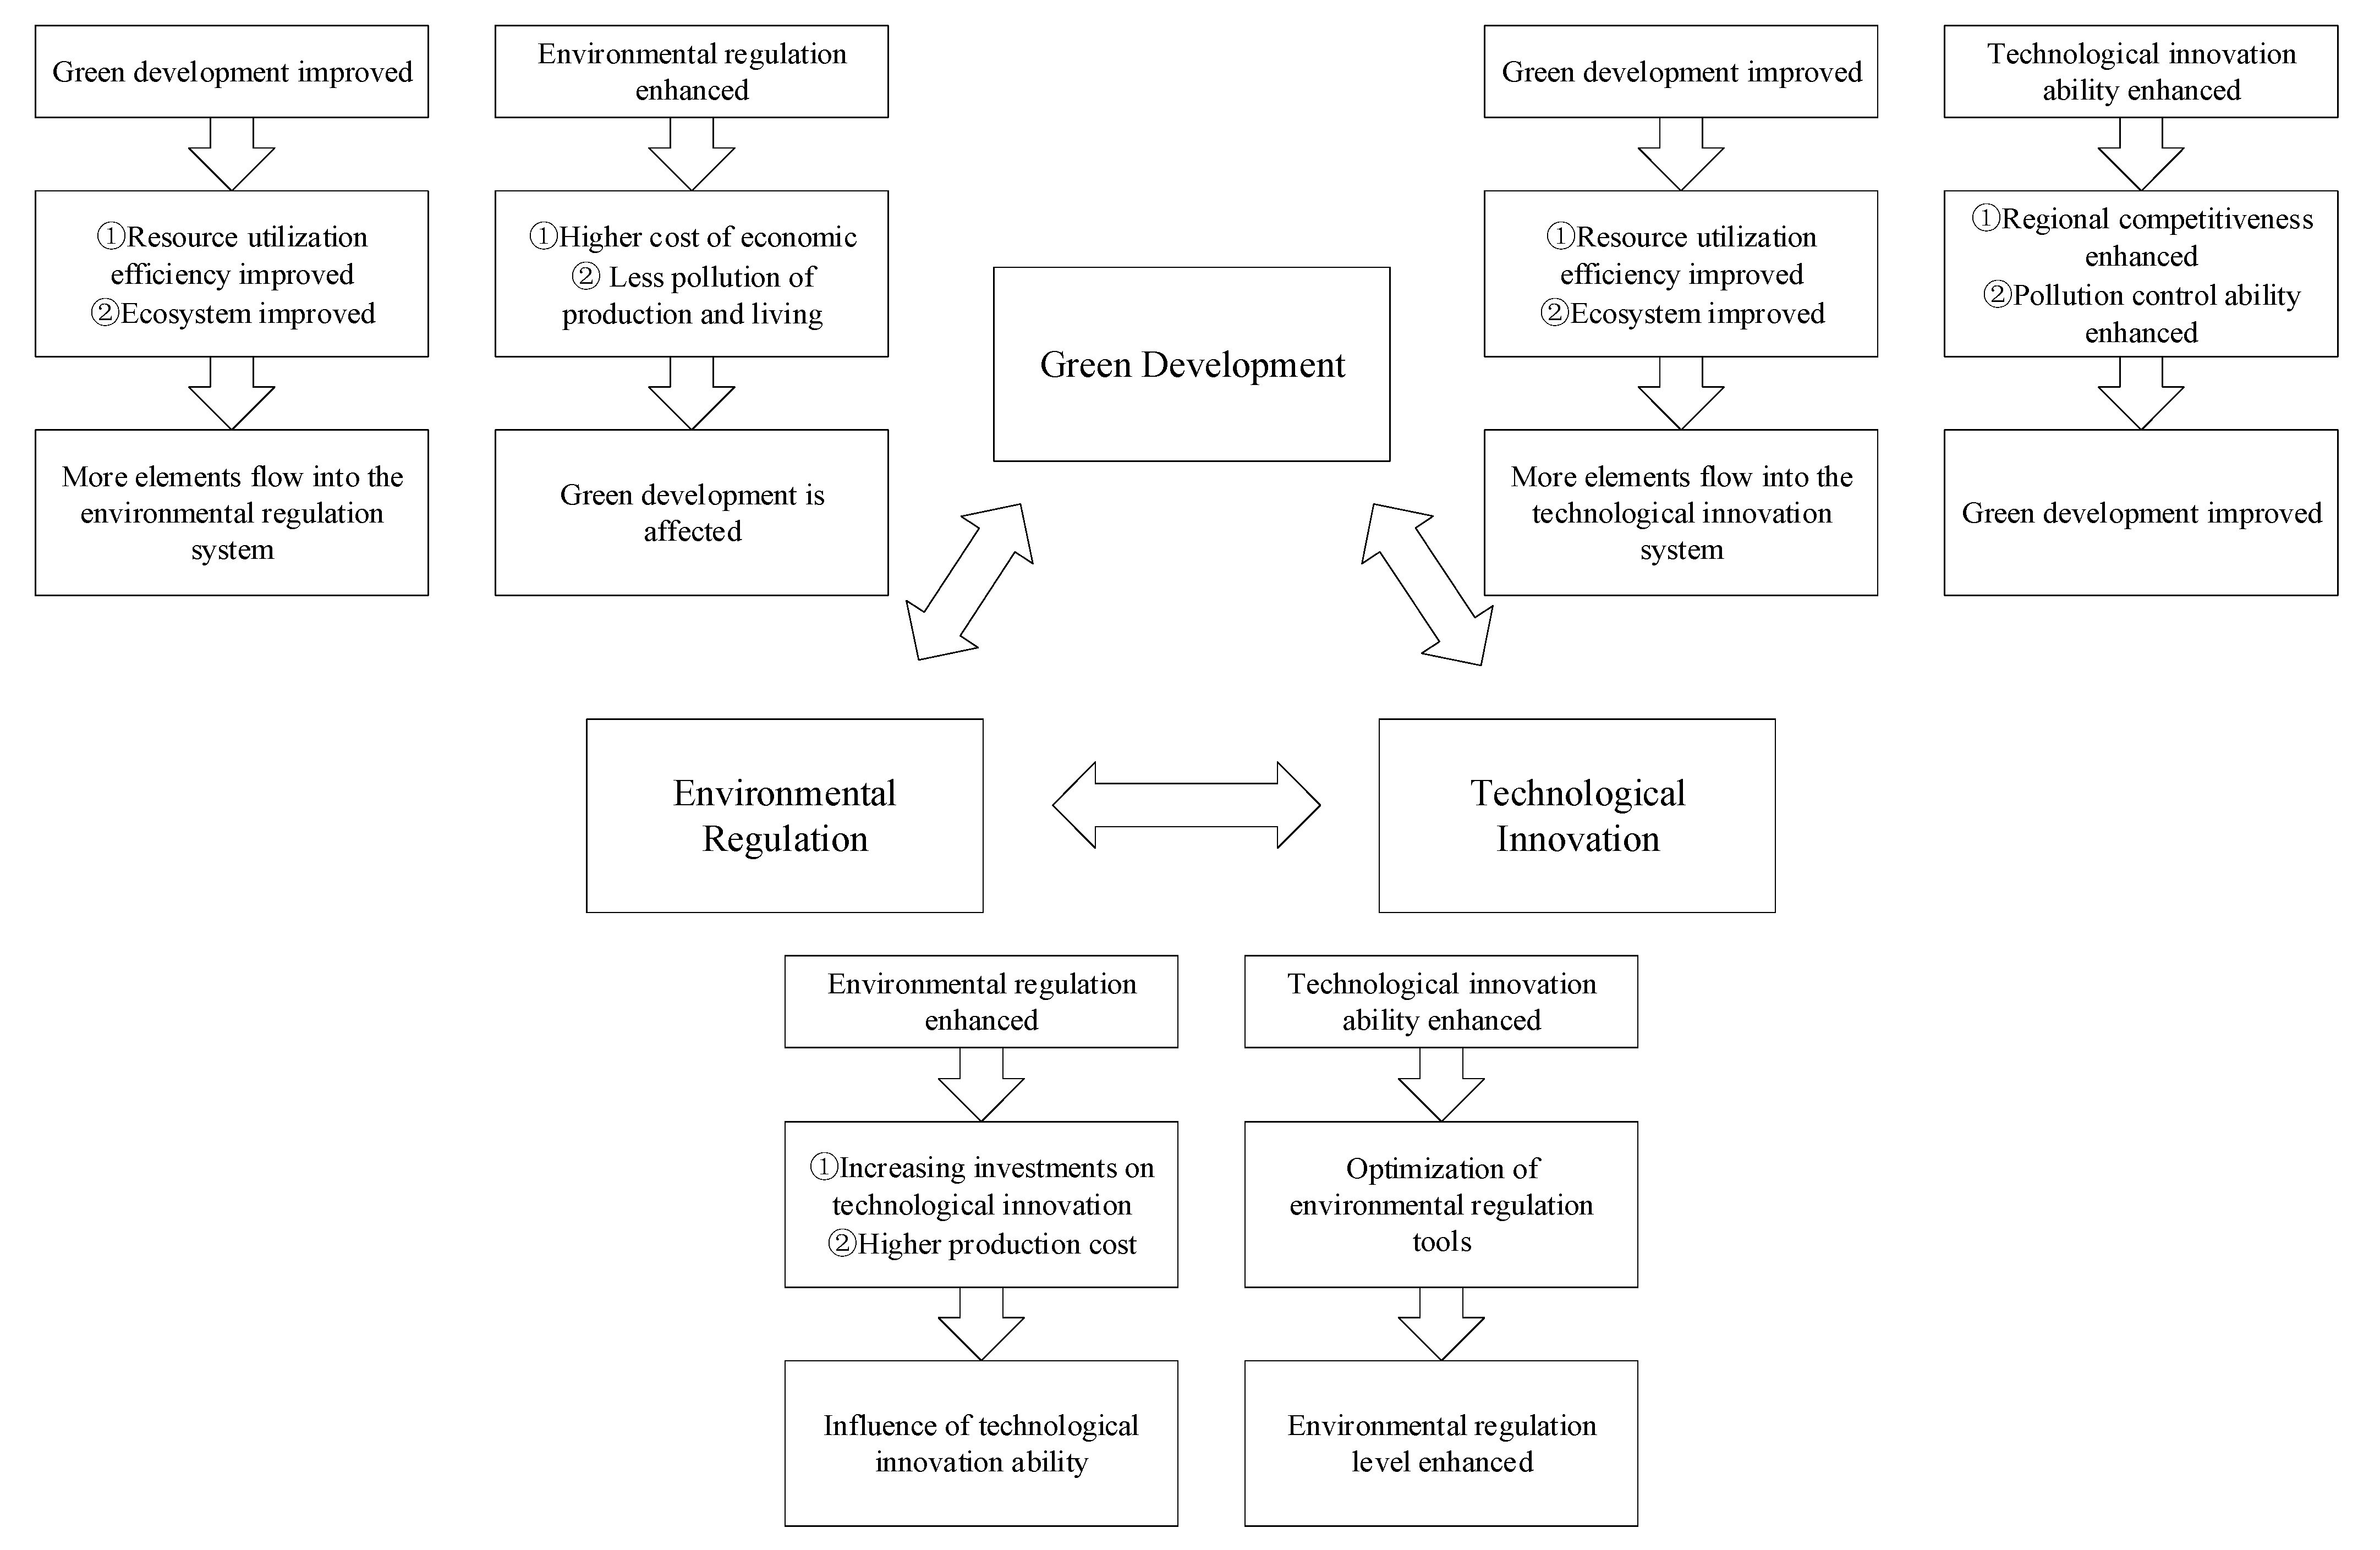
To measure the degree to which the environmental regulation system, technological innovation system, and green development system cooperate in the development of prefectures and cities, the coupling coordination degree model can be used [61,63]. The increase in the coordination degree reflects the transition trend of the three systems from their respective development to coordinated development. There is a mutual relationship between the three systems, as shown in Figure 1.
Based on this, we adopted the existing coupling coordination degree model to establish the interaction coupling between the environmental regulation systems, scientific and technological innovation systems, and green development systems of 17 cities in Shandong Province. For the coordinated development model, the specific calculation formula is expressed as follows [64,65,66]:
where C is the coupling degree, D is the coupling coordination degree, and T is the comprehensive evaluation index of the three systems; and , respectively, represent the evaluation of environmental regulation and technological innovation, and the efficiency of green development; , , and are the parameters to be determined. When determining these parameters, environmental regulation and technological innovation are considered to be the driving factors for green development, considering that the interaction between environmental regulation, technological innovation, and green development is asymmetric. Green development is regarded as a continuous development and evolution process. The realization of its core objectives primarily depends on the following two aspects. The first is to control pollution sources and to reduce damage to green development from the start, that is, to implement environmental regulations. The second is to innovate technological methods to create a more suitable environment for green development, that is, to carry out technological innovation. Based on a comprehensive survey of previous research, . According to the results of previous research studies, in this study, we divided the degree of coupling coordination into ten levels, as shown in Table 3.
2.4. Grey Relational Model
The development of a system is affected by complex information and has different driving factors. The grey relational analysis method can truly and objectively reflect the primary factors that affect the environmental regulation system, technological innovation system, and green development system as compared to the correlation analysis and regression analysis, and it is called the impact difference [67,68,69]. Therefore, in this study, we used the grey correlation model to find the factors that have a higher degree of correlation with the development of the system to optimize city development.
The general calculation steps of the grey correlation model can be expressed as follows:
- (1)
- Determine the reference and comparison sequences and standardize the data. The reference sequence is , the compare sequence is , and the reference sequence and comparison sequence after standardization are denoted as and..
- (2)
- The correlation coefficient was calculated . is the distinguishing coefficient that is used to reduce the impact of extreme values on calculations; in this study, .
- (3)
- Calculate the grey correlation degree, r.
2.5. Data Sources
In this study, data from 2018 were selected considering that the data of some environmental pollution indices in the Shandong province were not publicly released from 2019 to 2020. The primary data were predominantly derived from the 2019 and 2020 “Shandong Statistical Yearbook”, “China City Statistical Yearbook”, and the statistical yearbooks of various cities; some missing data were obtained by linear interpolation using the values of neighboring years.
3. Results
3.1. Environmental Regulation Evaluation Index, Technological Innovation Evaluation Index, and Green Development Efficiency Value
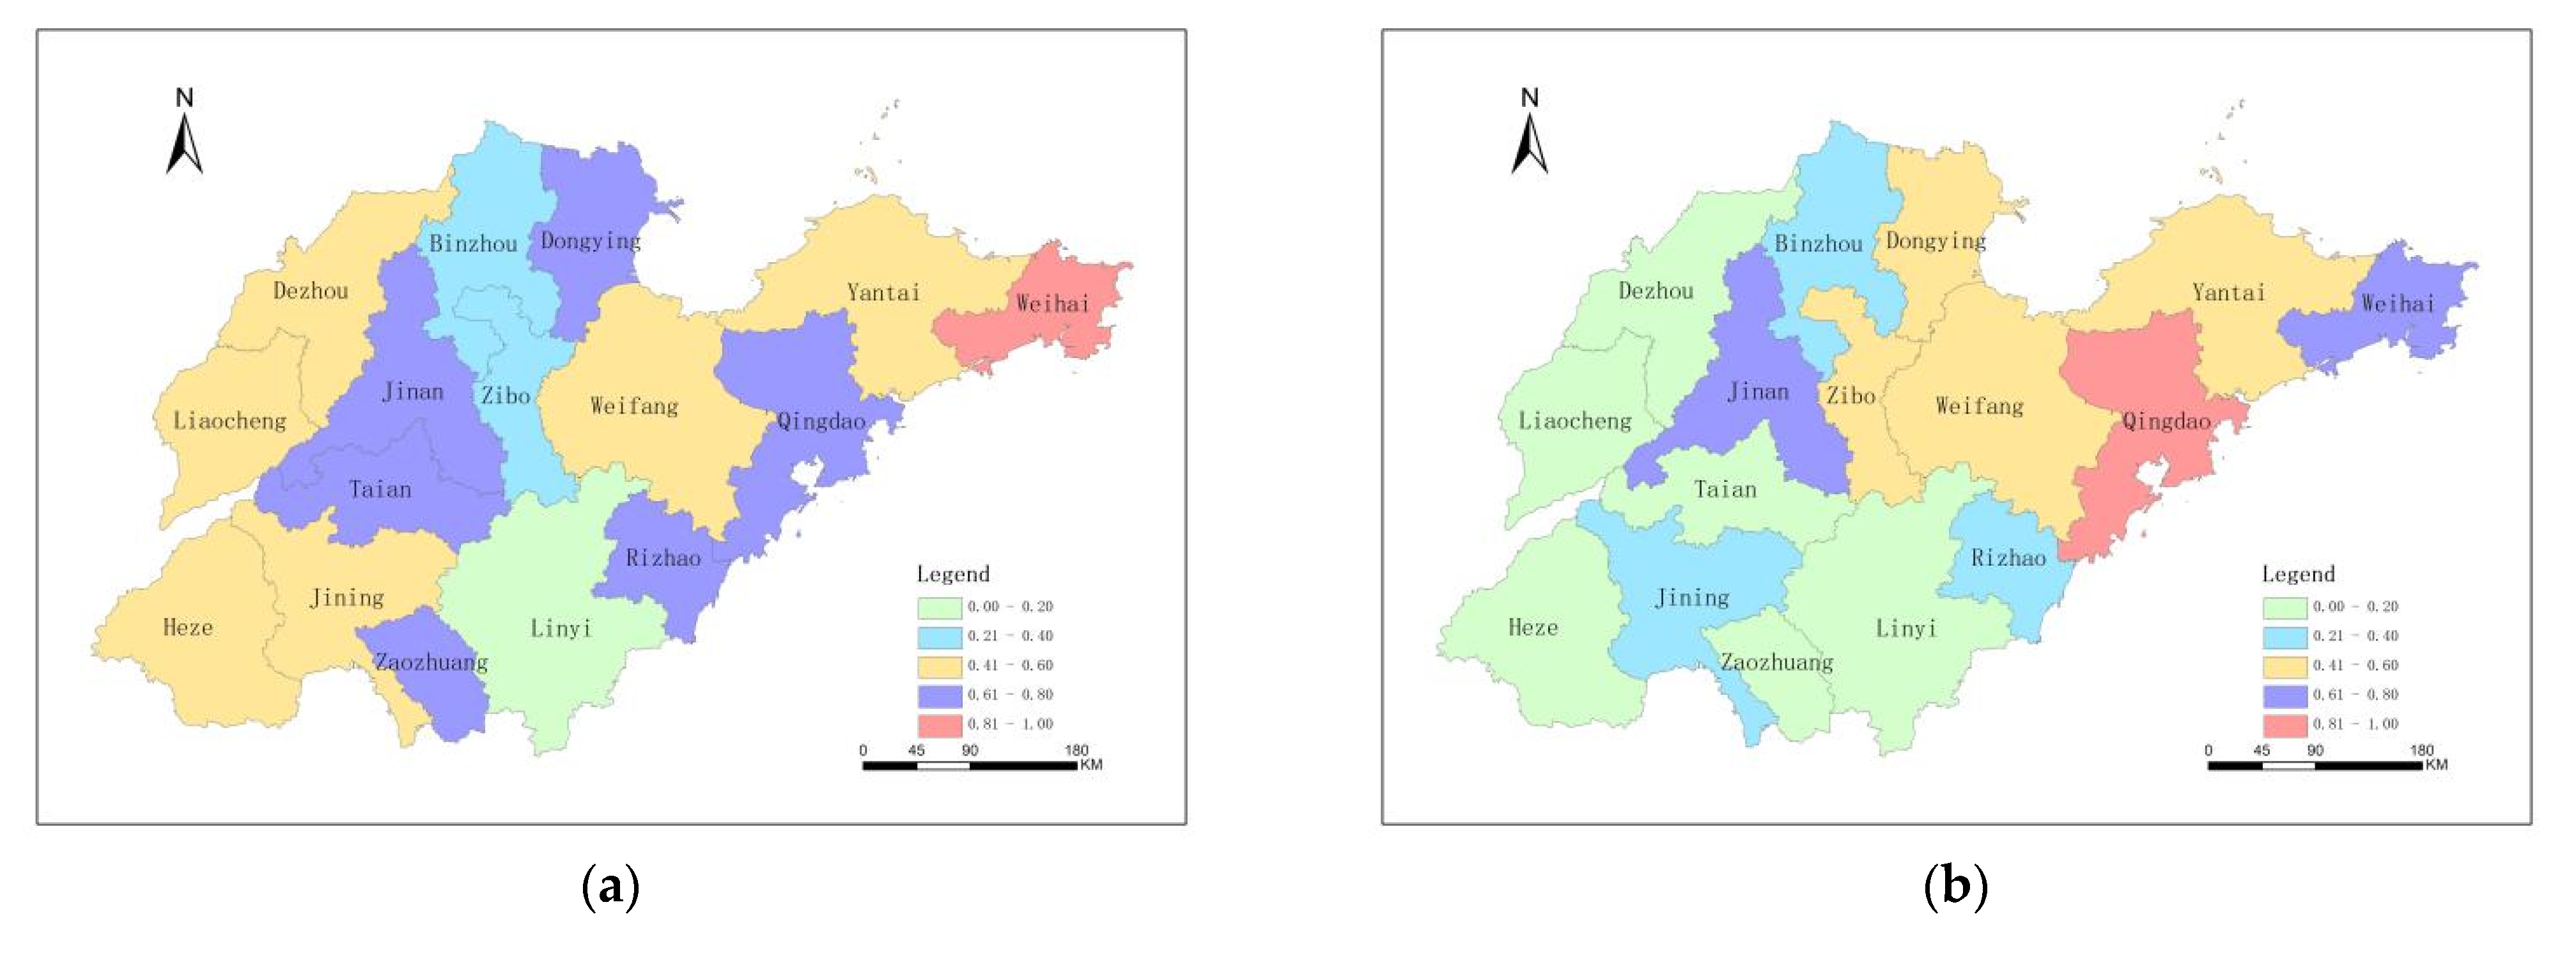
The SBM-DEA model was used to calculate the comprehensive development level evaluation model, the environmental regulation evaluation index, the scientific and technological innovation evaluation index, and the green development efficiency value of 17 cities, as shown in Table 4. Among them, the environmental regulation evaluation index, the scientific and technological innovation evaluation index, and the green development efficiency value demonstrated satisfactory values; the larger the value, the better the system development. Figure 2 shows spatial distribution diagrams of the three indices.
3.1.1. Analysis of the Characteristics of the Environmental Regulation Evaluation Index
There are differences in the environmental regulation evaluation indices among the 17 cities in Shandong Province. The highest evaluation index was estimated for Weihai City and the lowest for Linyi City. The average environmental regulation evaluation index was estimated at 0.5807. The development of environmental regulations in the eastern and western regions of Shandong Province was better than that in the central areas from a distribution point of view. Only Weihai City had an evaluation index of higher than 0.8. The environmental regulation evaluation indices of Jinan, Qingdao, Zaozhuang, Dongying, Taian, Rizhao, and Laiwu were estimated to be in the range of 0.6–0.8, with a relatively high evaluation index. Yantai City, Weifang City, Jining City, Dezhou City, Liaocheng City, and Heze City had relatively low environmental regulation evaluation indices, ranging from 0.4 to 0.6. The environmental regulation evaluation indices of Zibo City, Linyi City, and Binzhou City were estimated to be in the range of 0.2–0.4, indicating a relatively low level.
3.1.2. Analysis of the Characteristics of the Scientific and Technological Innovation Evaluation Index
The scientific and technological innovation evaluation indices of the 17 cities in Shandong Province were highly polarized. The highest evaluation index in Qingdao was estimated to be 0.9004, the lowest was 0.0020 in Heze City, and the average evaluation index of scientific and technological innovation was estimated to be 0.3490. From the distribution point of view, the evaluation indices of scientific and technological innovation in eastern coastal cities such as Qingdao and Weihai were found to be at a relatively high level, whereas the evaluation indices of most other cities were observed at a relatively low level. Among all cities, only Qingdao displayed an evaluation index higher than 0.8, much higher than that of other cities. Jinan City and Weihai City showed relatively high levels of technological innovation development, found to be in the range of 0.6–0.8. The technological innovation values of Zibo, Dongying, and Yantai were observed in the range of 0.4–0.6, which are still relatively low. The scientific and technological innovation evaluation indices of five prefectures in Weifang, Jining, Rizhao, Laiwu, and Binzhou were estimated to be 0.2–0.4, and six prefecture cities in Zaozhuang, Tai’an, Linyi, Dezhou, Liaocheng, and Heze showed technological innovation evaluation indices of less than 0.2, which are at a relatively low level.
3.1.3. Analysis of Characteristics of the Green Development Efficiency
The green development level of 17 cities in Shandong Province was observed to be highly uneven. Among them, the green development efficiencies of Qingdao, Weihai, and Dongying achieved a maximum value of 1, whereas the lowest value of 0.2558 was estimated for Binzhou City, and the average efficiency was estimated as 0.5298. From the distribution point of view, the green development efficiency values of the eastern coastal areas were found to be generally higher than those of the central and western inland areas. Apparent differences were observed in the green development between cities, and the polarization was found to be large. The green development efficiencies of all cities except Qingdao, Weihai, and Dongying were estimated to be below 0.8, and only Jinan and Yantai showed green development efficiency values of more than 0.6. The green development efficiencies of Zibo City, Zaozhuang City, Jining City, Tai’an City, and Dezhou City was found to be in the range of 0.4–0.6, and the green development efficiencies of other cities were found to be less than 0.4.
3.2. The Coupling and Coordination Development Level
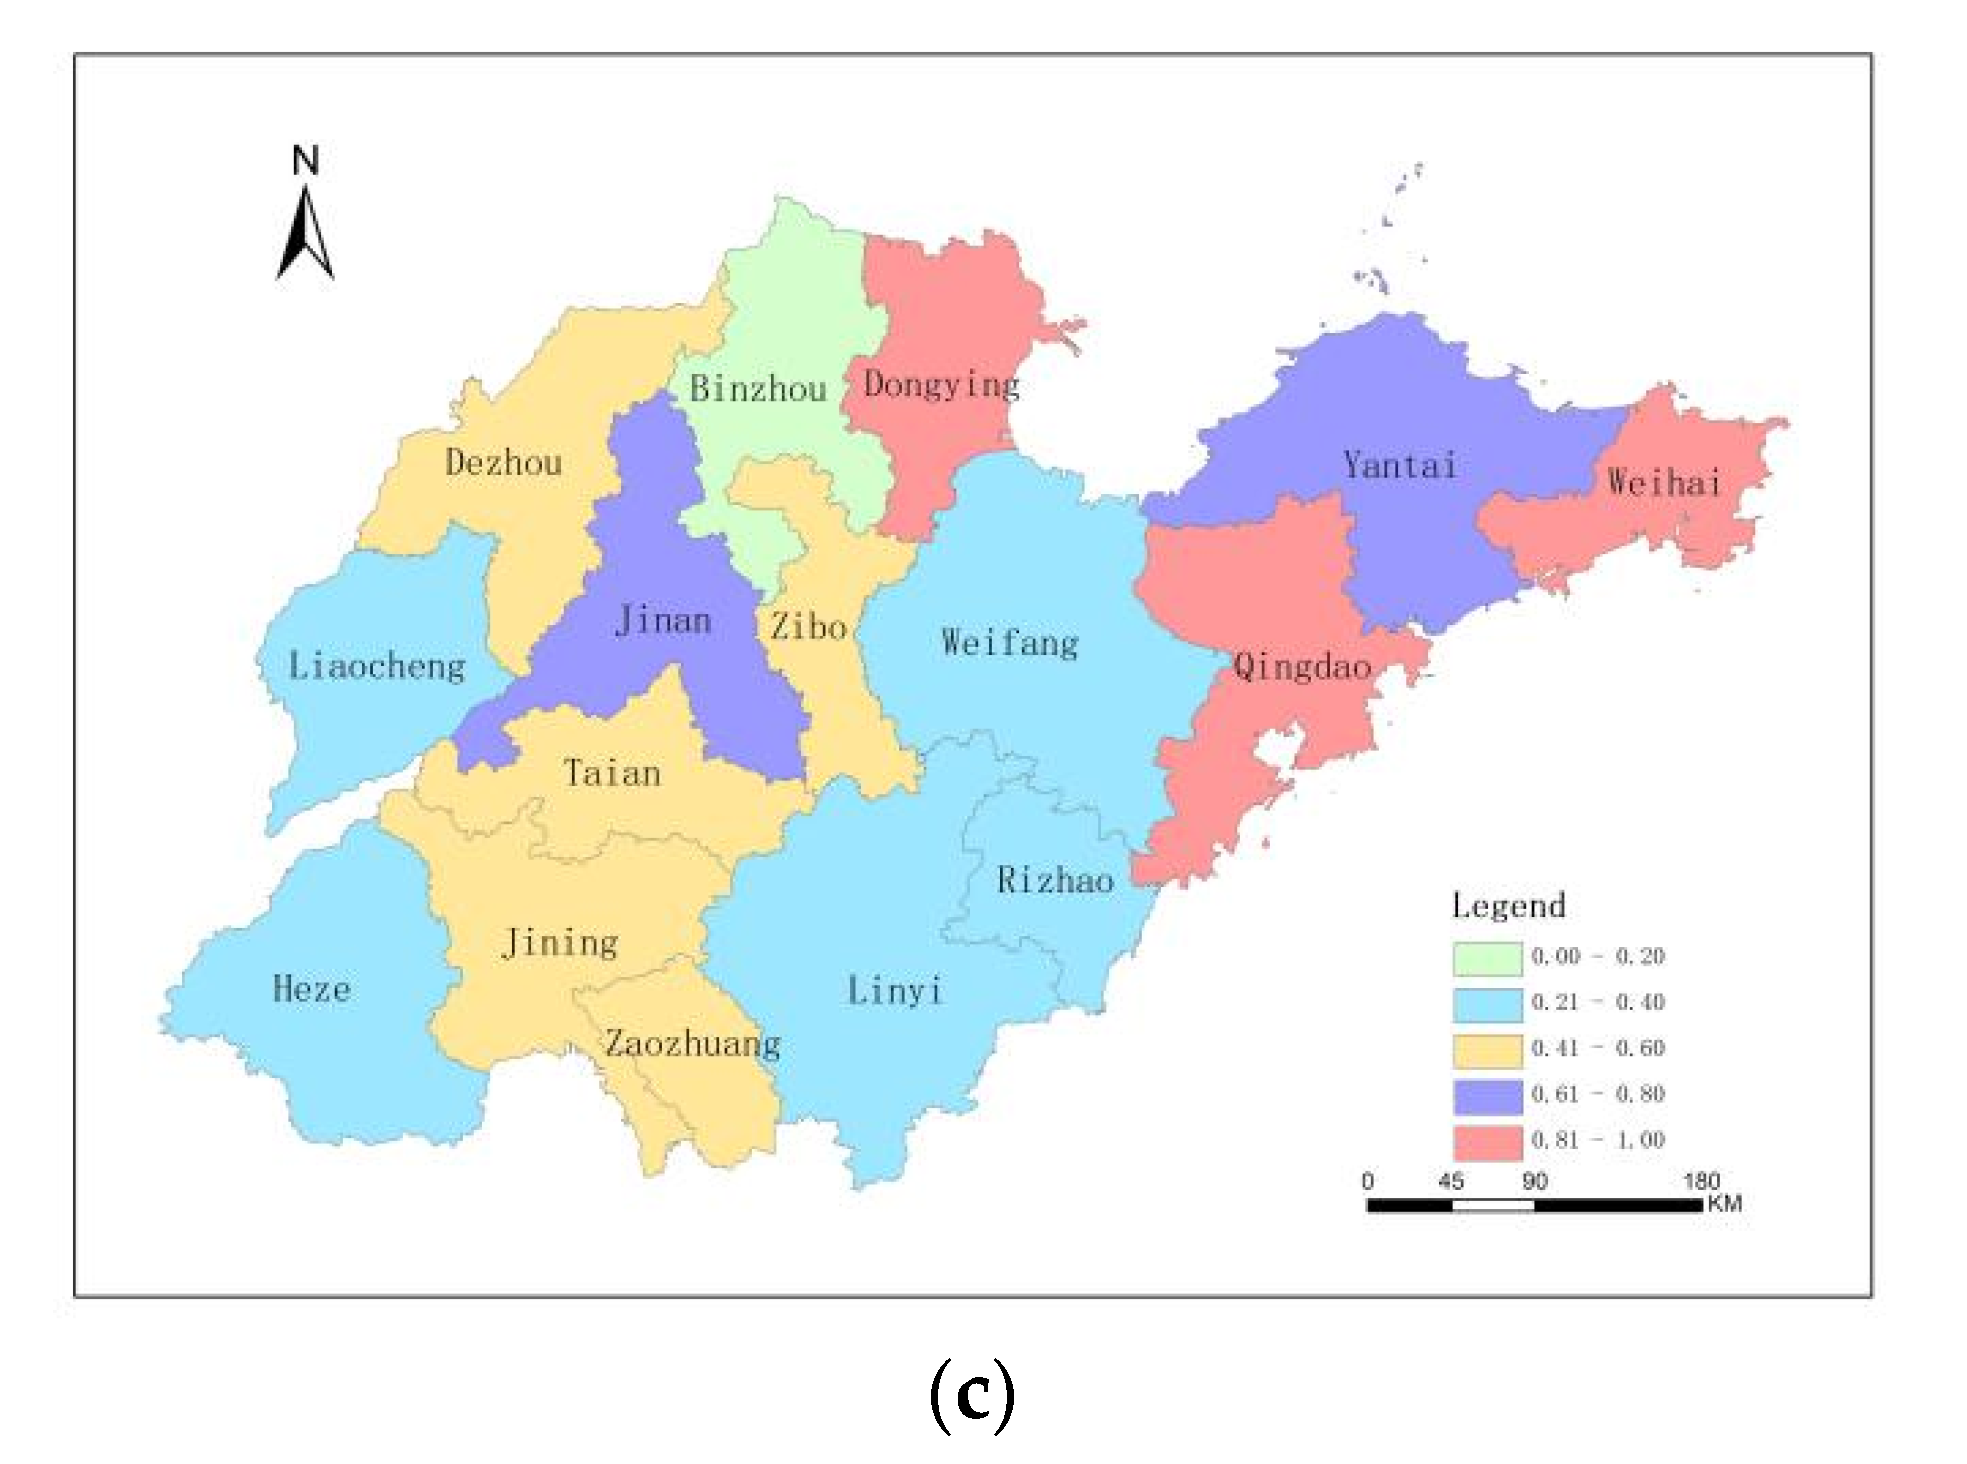
Based on the coupling coordination model, the coupling coordination degrees of 17 cities considering the environmental regulation system, technological innovation system, and green development system were obtained according to the evaluation index of green development efficiency, environmental regulation, and technological innovation; the analysis was conducted considering the classification standard of the coupling coordination degree. The results are presented in Table 5. The spatial distribution map of the coupling coordination degree was formed based on the coupling coordination degree, as shown in Figure 3.
In 2018, the value of the coupling coordination degrees between the environmental regulation system, technological innovation system, and green development system of 17 cities in Shandong Province were estimated to be between 0.2722 and 0.9398, as shown in Table 5, with an average value of 0.6554. The degree of coupling coordination was observed in the range of moderate-to-high-quality coordination. In addition, a large gap was observed between the prefectures and cities.
From the perspective of the geographical distribution, the degree of coupling coordination was observed to be the lowest in western Shandong and relatively high in eastern Shandong, as shown in Figure 3. The degree of coupling coordination in eastern coastal areas, such as Qingdao and Weihai, was found to be higher than in other regions. The coupling coordination degree of the other 16 cities was found to be within the scope of coordination, except for Heze City. Qingdao City and Weihai City exhibited high-quality coordination. Higher green development status and relatively complete environmental regulations and technological innovation systems have been crucial for the coordinated development of cities. The results of the green economy, environmental regulations, and technological innovation of Heze City were all in a backward state, thus leading to a moderate imbalance in its overall development.
Jinan City and Dongying City displayed a range of good coordination. The balanced development of the three systems in Jinan City and the relatively high level of green development in Dongying City were vital for the high degree of coupling coordination between the two cities. Among the 17 cities, only Yantai was observed during the intermediate coordination stage. Its green economy and environmental regulation development evaluation index was found to be >0.5, which is better than other cities, but the development of technological innovation was observed to be slow, so the level of coupled and coordinated development had not effectively improved.
Table 5 shows that most cities of the Shandong Province were in the primary or barely coordinated stage. Seven cities, including Zibo and Zaozhuang, were observed to be in primary coordination, and four cities, including Linyi and Dezhou, were found to be in the barely coordinated stage. Here, it is worth noting that 5 of the 11 cities showed a scientific and technological innovation evaluation index of less than 0.2, and the comprehensive level of scientific and technological innovation in nine cities was observed to be lower than those of green economy and environmental regulation. Technological innovation has become a constraint for most cities, especially for those that have just entered the stage of coordination and balanced and coordinated development.
3.3. City Classification
We classified 17 cities of Shandong Province into three categories to promote the improvement of the comprehensive development level of the city and optimize the development of the city, based on the estimated green development efficiency, the environmental regulation evaluation index, and the science and technology innovation evaluation index. Namely, the obstacles that affect the coordinated development of each area are obtained, and the cities were classified accordingly, considering the comparative relationship of the three systems. If , the city was found to be lagging in green development; if , the city was found to be lagging in environmental regulation; if , the city was found to be lagging in technological innovation. Thus, the 17 cities in Shandong Province were classified based on the aforementioned criteria, and the results are presented in Table 6.
For Rizhao City and Binzhou City, the relative lag in green development was the key factor leading to the imbalance of comprehensive development according to the classification of cities, such that there is an urgent requirement to improve the efficiency of green development. For Jinan, Qingdao, and Zibo cities, it is necessary to change the status quo of the development of environmental regulations. For 12 prefecture-level cities, such as Zaozhuang and Dongying, it is important to improve the level of technological development to optimize the comprehensive development of the city.
In this study, we attempted to use the grey correlation model to analyze the correlation between the environmental regulation system, technological innovation system, or the internal factors of the green development system and the level of green development, environmental regulation, or technological innovation development to optimize the comprehensive development of various cities and improve the shortcomings of development. We attempted to derive the factors most closely related to the development level of the three and provide a basis for optimizing the coordinated development of the three.
3.4. Coordinated Development Level Optimization
The entropy method was used to obtain the weights of the indicators representing the level of environmental regulation for cities where the development of environmental regulations is relatively lagging, as shown in Table 2. To obtain the environmental regulation level index as a reference series, the multi-objective summation method was used. For industrial sulfur dioxide emissions, industrial wastewater emissions, industrial smoke (dust) emissions, and general industrial solid waste emissions, the range method was used and standardized. They constituted five comparison series with per capita financial expenditure on energy conservation and environmental protection.
The entropy method was next used to obtain the weights of the indicators representing the technological innovation output for cities where technological innovation is relatively lagging, as shown in Table 2. To obtain the scientific and technological innovation level index as a reference series, the multi-objective summation method was used, and comprehensive research data were also used. The ratio of R&D internal expenditure to GDP, per capita science and technology fiscal expenditure, per capita education fiscal expenditure, and the number of ordinary colleges and universities constituted five comparative series concerning R&D personnel investment per 10,000 people.
The green development efficiency, which represents the level of green development, was taken as a reference series for cities with lagging green development. Comprehensive, relevant research combined data availability for calculating per capita GDP, the proportion of the tertiary industry, per capita social fixed investment, per capita local fiscal expenditure, foreign businessmen, the proportion of direct investment in GDP, the proportion of the urban population in the total population, and the number of college students per 10,000, which are the seven factors that influence the efficiency of green development, thus, forming seven comparative series. The calculated grey correlation degree of green development efficiency, environmental regulation level index, and technological innovation level index values were arranged in descending order. The results are presented in Table 7, Table 8 and Table 9.
4. Discussion
4.1. Analysis of the Relevance of Environmental Regulations
For cities with lagging environmental regulations, the impact of pollutant emissions on the environmental regulation level index was greater than the impact of government energy conservation and environmental protection expenditures; that is, the improvement in an environmental regulation level depends on controlling the discharge of pollutants at the source and balancing the relationship between economic development and pollution, as shown in Table 7. The per capita financial expenditure on energy conservation and environmental protection also had an important impact on the development of environmental regulations. The government’s emphasis on environmental protection affects the development of environmental regulations. The centralized sewage treatment rate in various cities is higher, mostly above 90%, so the adverse impact on the environment is relatively small, although industrial wastewater discharge has the most negligible impact on the environmental regulation index as compared to the first three pollutants. Therefore, we should focus on increasing the pollutant treatment rate and reducing the harm to the ecological environment by considering various pollutants and taking measures to control their emissions.
4.2. Analysis of the Relevance of Scientific and Technological Innovation
For cities with lagging technological innovation, the per capita education fiscal expenditure, which represents the government’s emphasis on education, had the most significant impact on the level of technological innovation, as shown in Table 8; this indicates that fiscal education expenditure and national scientific literacy are crucial for developing technological innovation. The investment of R&D personnel per 10,000 people, the ratio of R&D internal expenditure to GDP, and the per capita financial expenditure of science and technology also had an important impact on the development of science and technology innovation, reflecting the critical role of high-quality science and technology innovation talents and investment in science and technology innovation. The number of ordinary colleges and universities displays the lowest correlation among the other factors. However, ordinary colleges and universities are essential for supporting the development of scientific and technological innovation systems, as they are considered important places for talent training.
4.3. Analysis of the Relevance of Scientific and Technological Innovation
Per capita GDP and the proportion of foreign direct investment in GDP represent the level of domestic economic development and the degree of openness and illustrate the most significant impact on green development efficiency. The per capita GPD and the proportion of foreign direct investment in GDP for cities with lagging green development indicate the need to promote green development, as shown in Table 9. Certain economic accumulation, the proportion of the urban population in the total population, and the social fixed investment per capita also impact green development, that is, the level of urbanization and the level of investment, are considered essential factors for green development. Green development efficiency is highly correlated with per capita GDP, local fiscal expenditure, and the proportion of tertiary industry. Appropriate government control and development of the tertiary industry are considered essential foundational factors for advancing green development. Although the education level indicator has the lowest correlation between the number of college students per 10,000 students and the efficiency of green development, the importance of the education level is unequivocal.
5. Conclusions and Policy Recommendations
5.1. Conclusions
The coupling coordination degree model was developed to quantitatively analyze the situation of the coupled and coordinated development of environmental regulation, technological innovation, and green development in Shandong Province; classify the cities, and discuss the constraints by considering the evaluation of the environmental regulation system, technological innovation system, and green development system. Considering the main factors for the coordinated development of every kind of city, the following conclusions can be drawn:
In environmental regulation, technological innovation, and green development systems, gaps in technological innovation levels are becoming the key to hindering the coordinated development of most cities. In addition, the development status of the eastern coastal cities is better than that of other regions, and the gap is significant from the perspective of the respective development status of the three systems or the coupled and coordinated development status. In the central and western regions, the coupling coordination degree of other prefectures and cities ranged from barely coordinated to well-coordinated, and the overall development was good, except for Heze City, which is a moderately unbalanced city. Among environmental regulation, technological innovation, and green development, it is the lack of development of technological innovation systems that have become the key factor restraining the urban coupling and coordination improvement of cities that have just entered the coordination stage.
The impact of pollutant emissions on the environmental regulation level index is more significant than the impact of government energy conservation and environmental protection expenditures for cities with lagging environmental regulations. The government’s emphasis on environmental protection affects the development of environmental regulations. The government’s emphasis on education is relatively significant for cities with lagging technological innovations. In system development, high-quality scientific and technological innovation talents and scientific and technological innovation capital investment are essential. The level of economic development, especially foreign economic development, is vital for green development for cities with lagging green development, and the level of urbanization and investment shows a significant effect.
5.2. Policy Recommendations
The impact of pollutant discharge on environmental regulations is more significant than the effect of pollution control for cities with lagging environmental regulations. Increasing the pollutant treatment rate is considered key, such that to improve environmental regulations, source control and innovative pollution treatment methods are considered the most effective measures. To innovate in green technology, the government should increase the management and control of production enterprises, formulate strict emission standards, and encourage enterprises. Enterprises should strictly abide by pollution emission regulations, develop and introduce advanced pollution treatment equipment, control emissions, and reduce pollution. Local governments should implement environmental governance policies and weigh the tradeoffs between economic development and environmental protection. To encourage the government to increase energy conservation and environmental protection fiscal expenditures and promote enterprises to achieve green production, they should establish government performance evaluations linked to ecological and environmental protection. The government should develop transformation, cultivate the public’s green living habits, and improve local environmental regulations.
The government’s attention and the cultivation and attraction of talent are essential foundations for improving scientific and technological innovation capabilities in cities with lagging scientific and technological innovations. To improve the level of scientific and technological innovation, investment should be increased for the development of this domain, and the scientific and technological transformation rate should be heeded as well. The government should emphasize education, increase fiscal expenditures, and change the uneven distribution and uneven development of educational resources in different schools and classes. The key to regional talent competition lies in the talent system. In recent years, Shandong Province has become a province with a net population outflow, preventing the abundant graduate resources from being transformed into labor advantages. Therefore, targeted talent attraction policies should be actively introduced, and the talent training system and guarantee system should be gradually improved. Thus, the construction of innovative cities should be promoted. The conversion rate of scientific and technological achievements is closely related to investment. The effect of capital investment was significantly reduced by a low conversion rate. Funds should be actively implemented, and the use of funds should be properly supervised such that financial support can be transformed into scientific and technological innovation output.
The level of economic development and the level of foreign economic development have a more significant impact on green development for cities with lagging green development. Actively promoting the development of urbanization and high-level investment is essential for promoting the green development of cities while extending full assistance to the role of the government. In green development, the government plays a leading role. To promote the green development of the foreign economy, cities that have the location conditions for the development of the foreign economy should change their investment promotion policies considering environmental protection. Urbanization can be considered as the transfer of the primary industry to secondary and tertiary industries from the perspective of industrial structure. Supported by science and technology, the “three–two–one” industrial structure should be optimized, developed, and diversified to achieve high-quality urbanization. The improvement in the level of investment in fixed assets depends on the implementation of the government’s fiscal stimulus and monetary policies, and actively attracts investment based on optimizing the investment structure. At the same time, more emphasis on education and improvement in the education level of the urban population will help increase productivity and utilization efficiency, and thus will also improve the level of economic development based on low resource consumption.
As the analysis technique, DEA is a deterministic technique. This makes the efficiency measures obtained in the analysis biased by atypical observations. Because the input and output of green economy development are difficult to measure, the five selected indicators may not fully represent the development of the green economy in each region at a specific time. Additionally, DEA does not allow hypotheses to be raised and tested, so its conclusions are usually prescriptive. In future research, we will continue to improve the analysis process. Furthermore, as the focus is on 17 cities in Shandong Province, China, further research can include China-wide and other countries.
Author Contributions
Writing—original draft, R.Z.; writing—review and editing, X.J. and K.Y.; data curation, R.Z. and L.Y.; supervision, X.J. and K.Y. All authors have read and agreed to the published version of the manuscript.
Funding
This research was funded by the National Social Science Foundation of China (Grant No.18CJY018).
Institutional Review Board Statement
Not applicable.
Informed Consent Statement
Not applicable.
Data Availability Statement
The data presented in this study are available on request from the corresponding author.
Acknowledgments
The authors are grateful to the International Postdoctoral Exchange Fellowship Program. We offer our sincere thanks to the editor and anonymous reviewers for their careful evaluation and their fruitful observations, suggestions, corrections, and recommendations that substantially improved the initial manuscript.
Conflicts of Interest
The authors declare no conflict of interest.
References
- Jiang, L.; Zuo, Q.; Ma, J.; Zhang, Z. Evaluation and prediction of the level of high-quality development: A case study of the Yellow River Basin, China. Ecol. Indic. 2021, 129, 107994. [Google Scholar] [CrossRef]
- Yasmeen, H. Exploring the impact of technological innovation, environmental regulations and urbani-zation on ecological efficiency of China in the context of COP21. J. Environ. Manag. 2020, 274, 111210. [Google Scholar] [CrossRef] [PubMed]
- Jin, X.; Sumaila, U.R.; Yin, K.; Qi, Z. Evaluation of the Policy Effect of China’s Environmental Interview System for Effective Air Quality Governance. Int. J. Environ. Res. Public Health 2021, 18, 9006. [Google Scholar] [CrossRef] [PubMed]
- Heyes, A. Is environmental regulation bad for competition? A survey. J. Regul. Econ. 2009, 36, 1–28. [Google Scholar] [CrossRef]
- Linde, P. Toward a New Conception of the Environment-Competitiveness Relationship. J. Econ. Perspect. 1995, 9, 97–118. [Google Scholar]
- Porter, M.E.; Linde, C. Green and Competitive: Ending the Stalemate. Harvard Bus. Rev. 1999, 28, 128–129. [Google Scholar]
- Chintrakarn, P. Environmental regulation and U.S. states’ technical inefficiency. Econ. Lett. 2008, 100, 363–365. [Google Scholar] [CrossRef]
- Rubashkina, Y.; Galeotti, M.; Verdolini, E. Environmental regulation and competitiveness: Empirical evidence on the Porter Hypothesis from European manufacturing sectors. Energy Policy 2015, 83, 288–300. [Google Scholar] [CrossRef] [Green Version]
- Wang, X.; Luo, Y. Has technological innovation capability addressed environmental pollution from the dual perspective of FDI quantity and quality? Evidence from China. J. Clean. Prod. 2020, 258, 120941. [Google Scholar] [CrossRef]
- Walz, R.; Pfaff, M.; Marscheider-Weidemann, F.; Glser-Chahoud, S. Innovations for reaching the green sustainable develop-ment goals—Where will they come from? Int. Econ. Econ. Policy. 2017, 14, 449–480. [Google Scholar] [CrossRef]
- Johnstone, N.; Haščič, I.; Popp, D. Renewable Energy Policies and Technological Innovation: Evidence Based on Patent Counts. Environ. Resour. Econ. 2009, 45, 133–155. [Google Scholar] [CrossRef]
- Wang, A.; Hu, S.; Li, J. Does economic development help achieve the goals of environmental regulation? Evidence from par-tially linear functional-coefficient model. Energy Econ. 2021, 103, 105618. [Google Scholar] [CrossRef]
- Jackson, T. Blueprint for a green economy: By D. Pearce et al Earthscan Publications, London, UK, 1989, 192 pp, [pound sign] 6.95. Energy Policy 1990, 18, 118–121. [Google Scholar] [CrossRef]
- Chien, F.; Ananzeh, M.; Mirza, F.; Bakar, A.; Vu, H.M.; Ngo, T.Q. The effects of green growth, environmental-related tax, and eco-innovation towards carbon neutrality target in the US economy. J. Environ. Manag. 2021, 299, 113633. [Google Scholar] [CrossRef]
- Gemmell, J.C.; Scott, E.M. Sustainability accounting, management and policy journal environmental regulation, sustainability and risk. Sustain. Account. Manag. Policy J. 2013, 4, 120–144. [Google Scholar]
- Sun, J.; Wang, J.; Wang, T.; Zhang, T. Urbanization, economic growth, and environmental pollution: Partial differential anal-ysis based on the spatial Durbin model. Manag. Environ. Qual. 2018, 30, 483–494. [Google Scholar] [CrossRef]
- Khan, D.; Ulucak, R. How do environmental technologies affect green growth? Evidence from BRICS economies. Sci. Total Environ. 2020, 712, 136504. [Google Scholar]
- Eric, M.; Qian, Y.; Xu, C. Incentives, information, and organizational Form. Rev. Econ. Stud. 2000, 67, 359–378. [Google Scholar]
- Pu, Z.; Fu, J. Economic growth, environmental sustainability and China mayors’ promotion. J. Clean. Prod. 2018, 172, 454–465. [Google Scholar] [CrossRef]
- Zhang, N.; Jiang, X.F. The effect of environmental policy on Chinese firm’s green productivity and shadow price: A meta-frontier input distance function approach. Technol. Forecast. Soc. 2019, 144, 129–136. [Google Scholar] [CrossRef]
- Grossman, G.M.; Krueger, A.B. Environmental Impacts of a North American Free Trade Agreement; National Bureau of Economic Research: Cambridge, MA, USA, 1991; pp. 223–250. [Google Scholar]
- Shuai, S.; Fan, Z. Modeling the role of environmental regulations in regional green economy efficiency of China: Empirical evidence from super efficiency DEA-Tobit model. J. Environ. Manag. 2020, 261, 110227. [Google Scholar] [CrossRef]
- Song, Y.; Wei, Y.; Zhu, J.; Liu, J.; Zhang, M. Environmental regulation and economic growth: A new perspective based on technical level and healthy human capital. J. Clean. Prod. 2021, 318, 128520. [Google Scholar] [CrossRef]
- Ambec, S.; Cohen, M.A.; Elgie, S.; Lanoie, P. The Porter Hypothesis at 20: Can Environmental Regulation Enhance Innova-tion and Competitiveness? Rev. Environ. Econ. Policy 2013, 7, 2–22. [Google Scholar] [CrossRef] [Green Version]
- Farooq, U.; Ahmed, J.; Tabash, M.I.; Anagreh, S.; Subhani, B.H. Nexus between government green environmental concerns and corporate real investment: Empirical evidence from selected Asian economies. J. Clean. Prod. 2021, 314, 128089. [Google Scholar] [CrossRef]
- Gao, K.; Yuan, Y. The effect of innovation-driven development on pollution reduction: Empirical evidence from a quasi-natural experiment in China. Technol. Forecast. Soc. Chang. 2021, 172, 121047. [Google Scholar] [CrossRef]
- Yang, Q.; Gao, D.; Song, D.; Li, Y. Environmental regulation, pollution reduction and green innovation: The case of the Chi-nese Water Ecological Civilization City Pilot policy. Econ. Syst. 2021, 100911. [Google Scholar] [CrossRef]
- Jin, X.; Zhou, S.; Sumaila, U.R.; Yin, K.; Lv, X. Coevolution of Economic and Industrial Linkages within the Land-Sea Indus-trial Structure of China. Water 2021, 13, 3452. [Google Scholar] [CrossRef]
- Liu, Y.; Wang, A.; Wu, Y. Environmental regulation and green innovation: Evidence from China’s new environmental pro-tection Law. J. Clean. Prod. 2021, 297, 126698. [Google Scholar] [CrossRef]
- Eiadat, Y.; Kelly, A.; Roche, F.; Eyadat, H. Green and competitive? An empirical test of the mediating role of environmental innovation strategy. J. World Bus. 2008, 43, 131–145. [Google Scholar] [CrossRef]
- Feichtinger, G.; Hartl, R.F.; Kort, P.M.; Veliov, V.M. Environmental policy, the porter hypothesis and the composition of capi-tal: Effects of learning and technological progress. J. Environ. Econ. Manag. 2005, 50, 434–446. [Google Scholar] [CrossRef] [Green Version]
- Pearce, D.; Palmer, C. Public and private spending for environmental protection: A cross-country policy analysis. Fisc. Stud. 2005, 22, 403–456. [Google Scholar] [CrossRef]
- Gollop, F.M.; Roberts, M.J. Environmental Regulations and Productivity Growth: The Case of Fossil-fueled Electric Power Generation. J. Polit. Econ. 1983, 91, 654–674. [Google Scholar] [CrossRef]
- Gray, W.B.; Shadbegian, R.J. Plant vintage, technology, and environmental regulation. J. Environ. Econ. Manag. 2003, 46, 384–402. [Google Scholar] [CrossRef] [Green Version]
- Greenstone, M. The Impacts of Environmental Regulations on Industrial Activity: Evidence from the 1970 and 1977 Clean Air Act Amendments and the Census of Manufactures. J. Politi. Econ. 2002, 110, 1175–1219. [Google Scholar] [CrossRef]
- Shadbegian, R.J.; Gray, W.B. Pollution abatement expenditures and plant-level productivity: A production function approach. Ecol. Econ. 2005, 54, 196–208. [Google Scholar]
- Stoll, M.L. Green Chemistry Meets Green Business: A Match Long Overdue. J. Bus. Ethic. 2011, 99, 23–28. [Google Scholar] [CrossRef]
- Amores-Salvado, J.; Martin-De Castro, G.; Emilio Navas-Lopez, J. The importance of the complementarity between environ-mental management systems and environmental innovation capabilities: A firm level approach to environmental and busi-ness performance benefits. Technol. Forecast. Soc. Chang. 2015, 96, 288–297. [Google Scholar] [CrossRef]
- Jaffe, A.B.; Palmer, K. Environmental Regulation and Innovation: A Panel Data Study. Rev. Econ. Stat. 1997, 79, 610–619. [Google Scholar] [CrossRef]
- Leeuwen, G.V.; Mohnen, P. Revisiting the Porter hypothesis: An empirical analysis of Green innovation for the Netherlands. Econ. Innov. New Technol. 2017, 26, 63–77. [Google Scholar] [CrossRef] [Green Version]
- Qi, C.Q.; Zhang, H. Spatial differences of technological Innovation effects of Environmental Regulation: An empirical Analy-sis based on Chinese Panel data from 2000 to 2013. Macroeconomics 2015, 72–83. [Google Scholar]
- Zhang, H.; Wei, X.P. Green Paradox or Forced Emission-reduction: Dual Effect of Environmental Regulation on Carbon Emissions. China Popul. Resour. Environ. 2014, 24, 21–29. [Google Scholar]
- Guo, Y.; Xia, X.; Zhang, S.; Zhang, D. Environmental Regulation, Government R&D Funding and Green Technology Innovation: Evidence from China Provincial Data. Sustainability 2018, 10, 940. [Google Scholar]
- Peng, X. Strategic interaction of environmental regulation and green productivity growth in China: Green innovation or pol-lution refuge? Sci. Total. Environ. 2020, 732, 139200. [Google Scholar] [CrossRef] [PubMed]
- Zhao, S.; Jiang, Y.; Wang, S. Innovation stages, knowledge spillover, and green economy development: Moderating role of absorptive capacity and environmental regulation. Environ. Sci. Pollut. Res. 2019, 26, 25312–25325. [Google Scholar] [CrossRef]
- Yizhou, T.; Xin, L. Temporal and spatial evolution of the coupling relationship between regional innovation system and re-gional economy. Agro. Food Ind. Hi-Tech. 2017, 28, 2179–2184. [Google Scholar]
- Vega-Jurado, J.; García-Granero, A.; Manjarrés-Henríquez, L. Do firms benefit from interactions with public research organi-sations beyond innovation? An analysis of small firms. Eur. Res. Manag. Bus. Econ. 2021, 27, 100148. [Google Scholar] [CrossRef]
- Guisado-González, M.; Rodríguez-Domínguez, M.D.M.; Vila-Alonso, M.; González-Vázquez, E. The relationship between R&D subsidy and R&D cooperation in eco-innovative companies. An analysis taking a complementarity approach. Eur. Res. Manag. Bus. Econ. 2021, 27, 100170. [Google Scholar] [CrossRef]
- Du, K.; Cheng, Y.; Yao, X. Environmental regulation, green technology innovation, and industrial structure upgrading: The road to the green transformation of Chinese cities. Energy Econ. 2021, 98, 105247. [Google Scholar] [CrossRef]
- Liu, Y.; Zhu, J.; Li, E.Y.; Meng, Z.; Song, Y. Environmental regulation, green technological innovation, and eco-efficiency: The case of Yangtze river economic belt in China. Technol. Forecast. Soc. Chang. 2020, 155, 119993. [Google Scholar] [CrossRef]
- Cooper, W.W.; Seiford, L.M.; Tone, K. Data Envelopment Analysis: A Comprehensive Text with Models, Applications, References and DEA-Solver Software; Kluwer Academic Publishers: New York, NY, USA, 2007. [Google Scholar]
- Tone, K. A slacks-based measure of efficiency in data envelopment analysis. Eur. J. Oper. Res. 2001, 130, 498–509. [Google Scholar] [CrossRef] [Green Version]
- Wang, R.; Xia, B.; Dong, S.; Li, Y.; Li, Z.; Ba, D.; Zhang, W. Research on the Spatial Differentiation and Driving Forces of Eco-Efficiency of Regional Tourism in China. Sustainability 2020, 13, 280. [Google Scholar] [CrossRef]
- Zhou, Y.; Kong, Y.; Zhang, T. The spatial and temporal evolution of provincial eco-efficiency in China based on SBM modi-fied three-stage data envelopment analysis. Environ. Sci. Pollut. Res. 2020, 27, 8557–8569. [Google Scholar] [CrossRef]
- Tang, M.; Hong, J.; Wang, X.; He, R. Sustainability accounting of neighborhood metabolism and its applications for urban renewal based on emergy analysis and SBM-DEA. J. Environ. Manag. 2020, 275, 111177. [Google Scholar] [CrossRef]
- Jin, X.; Shi, X.; Gao, J.; Xu, T.; Yin, K. Evaluation of Loss Due to Storm Surge Disasters in China Based on Econometric Model Groups. Int. J. Environ. Res. Public Health 2018, 15, 604. [Google Scholar] [CrossRef] [Green Version]
- Jin, X.; Sumaila, U.R.; Yin, K. Direct and Indirect Loss Evaluation of Storm Surge Disaster Based on Static and Dynamic In-put-Output Models. Sustainability 2020, 12, 7347. [Google Scholar] [CrossRef]
- Ding, X.; Chong, X.; Bao, Z.; Xue, Y.; Zhang, S. Fuzzy comprehensive assessment method based on the entropy weight meth-od and its application in the water environmental safety evaluation of the heshangshan drinking water source area, three gorges reservoir area, China. Water 2017, 9, 329. [Google Scholar]
- Zhang, D. Marketization, environmental regulation, and eco-friendly productivity: A Malmquist–Luenberger index for pollu-tion emissions of large Chinese firms. J. Asian Econ. 2021, 76, 101342. [Google Scholar] [CrossRef]
- Zia, B.; Ja, C.; Lo, C.; Egc, D.; Eg, E. The productivity of national innovation systems in Europe: Catching up or falling be-hind? Technovation 2020, 102, 102215. [Google Scholar]
- Vefie, L. The Penguin Dictionary of Physics; Foreign Language Press: Beijing, China, 1996; pp. 92–93. [Google Scholar]
- Cai, B.; Shao, Z.; Fang, S.; Huang, X.; Huq, M.E.; Tang, Y.; Li, Y.; Zhuang, Q. Finer-scale spatiotemporal coupling coordina-tion model between socioeconomic activity and eco-environment: A case study of Beijing, China. Ecol. Indic. 2021, 131, 108165. [Google Scholar]
- Xiao, Y.; Tian, K.; Huang, H.; Wang, J.; Zhou, T. Coupling and coordination of socioeconomic and ecological environment in Wenchuan earthquake disaster areas: Case study of severely affected counties in southwestern China. Sustain. Cities Soc. 2021, 71, 102958. [Google Scholar] [CrossRef]
- Sun, Y.; Zhao, T.; Xia, L. Spatial-temporal differentiation of carbon efficiency and coupling coordination degree of Chinese county territory and obstacles analysis. Sustain. Cities Soc. 2021, 76, 103429. [Google Scholar] [CrossRef]
- Zuo, Z.; Guo, H.; Cheng, J.; Li, Y. How to achieve new progress in ecological civilization construction?—Based on cloud model and coupling coordination degree model. Ecol. Indic. 2021, 127, 107789. [Google Scholar] [CrossRef]
- Fei, J.; Lin, Y.; Jiang, Q.; Jiang, K.; Li, P.; Ye, G. Spatiotemporal coupling coordination measurement on islands’ economy-environment-tourism system. Ocean. Coast. Manag. 2021, 212, 105793. [Google Scholar] [CrossRef]
- Jin, X.; Yin, K.; Li, X. Grey relational analysis on the land-sea economy in China. Grey Syst. Theory Appl. 2017, 7, 31–44. [Google Scholar] [CrossRef]
- Yin, K.; Xu, Y.; Li, X.; Jin, X. Sectoral relationship analysis on China’s marine-land economy based on a novel grey periodic relational model. J. Clean Prod. 2018, 197, 815–826. [Google Scholar] [CrossRef]
- Li, B.; Wu, Q.; Zhang, W.; Liu, Z. Water resources security evaluation model based on grey relational analysis and analytic network process: A case study of Guizhou Province. J. Water Process. Eng. 2020, 37, 101429. [Google Scholar] [CrossRef]
Figure 1.
Relationship diagram of the systems of environmental regulation, technological innovation, and green development.
Figure 1.
Relationship diagram of the systems of environmental regulation, technological innovation, and green development.

Figure 2.
Spatial distribution maps of the (a) environmental regulation evaluation index; (b) scientific and technological innovation evaluation index; (c) green development efficiency.
Figure 2.
Spatial distribution maps of the (a) environmental regulation evaluation index; (b) scientific and technological innovation evaluation index; (c) green development efficiency.


Figure 3.
Spatial distribution diagram of the coupling coordination degree.


Table 1.
Green development efficiency indicator system.
| Indicator Type | First Level Indicator | Secondary Indicators | Indicator Type | First Level Indicator | Secondary Indicators | |
|---|---|---|---|---|---|---|
| Investment index | Capital investment | Investment in fixed assets (100 million yuan) | Output indicators | Expected output | Economic level | Real GDP (100 million yuan) |
| Labor input | Number of employees at the end of the year (10,000 people) | Undesired output | Environmental pollution | Comprehensive pollution index (10,000 tons) | ||
| Energy input | Electricity consumption of the whole society (100 million kWh) | |||||
Table 2.
Environmental regulation, scientific and technological innovation index evaluation system, and weights.
Table 2.
Environmental regulation, scientific and technological innovation index evaluation system, and weights.
| System Layer | Criterion Layer | Index Layer | Index Layer | Weights |
|---|---|---|---|---|
| Environmental regulation system | Environmental regulation level | Park green area per capita (m2) | Positive | 0.0419 |
| Length of the urban drainage pipeline (km) | Positive | 0.0604 | ||
| Domestic waste treatment rate (%) | Positive | 0.0414 | ||
| Sewage treatment rate (%) | Positive | 0.0414 | ||
| Industrial solid waste utilization rate (%) | Positive | 0.0414 | ||
| Environmental regulatory pressure | Industrial sulfur dioxide emissions (tons) | Reverse | 0.0507 | |
| Industrial wastewater discharge (10,000 tons) | Reverse | 0.0434 | ||
| Industrial smoke (dust) emissions (tons) | Reverse | 0.2957 | ||
| General industrial solid waste generation (10,000 tons) | Reverse | 0.2227 | ||
| Environmental regulation investment | Per capita financial expenditure on energy conservation and environmental protection (yuan) | Positive | 0.1611 | |
| Technological innovation system | Technological innovation investment | R&D personnel investment per 10,000 people | Positive | 0.0899 |
| The ratio of R&D internal expenditure to GDP | Positive | 0.0792 | ||
| Per capita financial expenditure on science and technology (yuan) | Positive | 0.1197 | ||
| Education expenditure per capita (yuan) | Positive | 0.4646 | ||
| Number of ordinary colleges and universities (a) | Positive | 0.0811 | ||
| Scientific and technological innovation output | Number of patent applications per 10,000 people (pieces) | Positive | 0.0838 | |
| Number of patents granted per 10,000 people (pieces) | Positive | 0.0818 |
Table 3.
Evaluation criteria for coordination degree of green development, environmental regulation, and technological innovation coupling.
Table 3.
Evaluation criteria for coordination degree of green development, environmental regulation, and technological innovation coupling.
| Coordination Value D | Coordination Type | Coordination Level | Coordination Value D | Coordination Type | Coordination Level |
|---|---|---|---|---|---|
| 0.00–0.09 | Maladjustment | Extreme imbalance | 0.50–0.59 | Coordination | Barely coordinated |
| 0.10–0.19 | Severe imbalance | 0.60–0.69 | Primary coordination | ||
| 0.20–0.29 | Moderate Disorder | 0.70–0.79 | Intermediate coordination | ||
| 0.30–0.39 | Mild disorder | 0.80–0.89 | Well-coordinated | ||
| 0.40–0.49 | On the verge of dysregulation | 0.90–0.99 | Quality coordination |
Table 4.
Environmental regulation evaluation index, scientific and technological innovation evaluation index, and green development efficiency value in 17 cities of the Shandong Province.
Table 4.
Environmental regulation evaluation index, scientific and technological innovation evaluation index, and green development efficiency value in 17 cities of the Shandong Province.
| Region | Jinan City | Qingdao City | Zibo City | Zaozhuang City | Dongying City | Yantai City | Weifang City | Jining City | Tai’an City |
|---|---|---|---|---|---|---|---|---|---|
| Environmental regulation evaluation value | 0.6230 | 0.6765 | 0.3409 | 0.7288 | 0.7063 | 0.5757 | 0.4878 | 0.4574 | 0.7227 |
| Scientific and technological innovation evaluation value | 0.6620 | 0.9004 | 0.5113 | 0.1308 | 0.5148 | 0.4031 | 0.3807 | 0.2481 | 0.1538 |
| Green economy development efficiency | 0.7088 | 1.0000 | 0.5542 | 0.5252 | 1.0000 | 0.6280 | 0.3942 | 0.4472 | 0.4448 |
| Region | Weihai City | Rizhao City | Laiwu City | Linyi City | Dezhou City | Liaocheng City | Binzhou City | Heze City | Average |
| Environmental regulation evaluation value | 0.8206 | 0.6861 | 0.6616 | 0.3011 | 0.5728 | 0.5935 | 0.3651 | 0.5522 | 0.5807 |
| Scientific and technological innovation evaluation value | 0.7402 | 0.3300 | 0.3028 | 0.1484 | 0.1535 | 0.0931 | 0.2576 | 0.0020 | 0.3490 |
| Green economy development efficiency | 1.0000 | 0.2972 | 0.3262 | 0.3396 | 0.4088 | 0.3451 | 0.2558 | 0.3315 | 0.5298 |
Table 5.
Numerical values and grades of the coupling and coordination degree of environmental regulation systems, technological innovation systems, and green development systems in 17 cities of the Shandong Province.
Table 5.
Numerical values and grades of the coupling and coordination degree of environmental regulation systems, technological innovation systems, and green development systems in 17 cities of the Shandong Province.
| Region | Green Development Efficiency | Environmental Regulation Evaluation Index | Science and Technology Innovation Evaluation Index | Coupling | Coordination | Coordination Level |
|---|---|---|---|---|---|---|
| Jinan City | 0.7088 | 0.6230 | 0.6620 | 0.9986 | 0.8214 | Well-coordinated |
| Qingdao City | 1.0000 | 0.6765 | 0.9004 | 0.9869 | 0.9394 | Quality coordination |
| Zibo City | 0.5542 | 0.3409 | 0.5113 | 0.9788 | 0.6926 | Primary coordination |
| Zaozhaung City | 0.5252 | 0.7288 | 0.1308 | 0.7985 | 0.6175 | Primary coordination |
| Dongying City | 1.0000 | 0.7063 | 0.5148 | 0.9640 | 0.8811 | Well-coordinated |
| Yantai City | 0.6280 | 0.5757 | 0.4031 | 0.9825 | 0.7409 | Intermediate coordination |
| Weifang City | 0.3942 | 0.4878 | 0.3807 | 0.9939 | 0.6416 | Primary coordination |
| Jining City | 0.4472 | 0.4574 | 0.2481 | 0.9636 | 0.6208 | Primary coordination |
| Tai’an City | 0.4448 | 0.7227 | 0.1538 | 0.8333 | 0.6066 | Primary coordination |
| Weihai City | 1.0000 | 0.8206 | 0.7402 | 0.9921 | 0.9398 | Quality coordination |
| Rizhao City | 0.2972 | 0.6861 | 0.3300 | 0.9291 | 0.6117 | Primary coordination |
| Laiwu City | 0.3262 | 0.6616 | 0.3028 | 0.9363 | 0.6152 | Primary coordination |
| Linyi City | 0.3396 | 0.3011 | 0.1484 | 0.9412 | 0.5154 | Barely coordinated |
| Dezhou City | 0.4088 | 0.5728 | 0.1535 | 0.8722 | 0.5802 | Barely coordinated |
| Liaocheng City | 0.3451 | 0.5935 | 0.0931 | 0.7768 | 0.5171 | Barely coordinated |
| Binzhou City | 0.2558 | 0.3651 | 0.2576 | 0.9858 | 0.5287 | Barely coordinated |
| Heze City | 0.3315 | 0.5522 | 0.0020 | 0.2434 | 0.2722 | Moderate Disorder |
Table 6.
Classification of 17 cities of Shandong Province.
| City Type | Include City |
|---|---|
| Green economy lagging | Rizhao City, Binzhou City |
| Environmental regulations lagging | Jinan City, Qingdao City, Zibo City |
| Technology innovation lagging | Zaozhuang City, Dongying City, Yantai City, Weifang City, Jining City, Tai’an City, Weihai City, Laiwu City, Linyi City, Dezhou City, Liaocheng City, Heze City |
Table 7.
Correlation degree of the environmental regulation level index.
| Index | Industrial Smoke (Dust) Emissions | General Industrial Solid Waste Generation | Industrial Sulfur Dioxide Emissions | Per Capita Fiscal Expenditure for Energy Conservation and Environmental Protection | Industrial Wastewater Discharge |
|---|---|---|---|---|---|
| Correlation | 0.8448 | 0.8414 | 0.7899 | 0.7206 | 0.6487 |
Table 8.
Correlation degree of the science and technology innovation level index.
| Index | Education Expenditure per Capita | R&D Personnel Investment per 10,000 People | The Ratio of R&D Internal Expenditure to GDP | Science and Technology Expenditure per Capita | The Number of Ordinary Colleges and Universities |
|---|---|---|---|---|---|
| Correlation | 0.8079 | 0.7724 | 0.7434 | 0.7347 | 0.6335 |
Table 9.
Correlation degree of the green development efficiency.
| Index | GDP per Capita | Proportion of Foreign Direct Investment in GDP | Level of Urbanization | Social Fixed Investment per Capita | Per Capita Local Fiscal Expenditure | Proportion of Tertiary Industry | Number of College Students per 10,000 People |
|---|---|---|---|---|---|---|---|
| Correlation | 0.9657 | 0.9336 | 0.9154 | 0.9082 | 0.8884 | 0.8551 | 0.6667 |
Publisher’s Note: MDPI stays neutral with regard to jurisdictional claims in published maps and institutional affiliations. |
© 2022 by the authors. Licensee MDPI, Basel, Switzerland. This article is an open access article distributed under the terms and conditions of the Creative Commons Attribution (CC BY) license (https://creativecommons.org/licenses/by/4.0/).
Share and Cite
MDPI and ACS Style
Yin, K.; Zhang, R.; Jin, X.; Yu, L. Research and Optimization of the Coupling and Coordination of Environmental Regulation, Technological Innovation, and Green Development. Sustainability 2022, 14, 501. https://doi.org/10.3390/su14010501
AMA Style
Yin K, Zhang R, Jin X, Yu L. Research and Optimization of the Coupling and Coordination of Environmental Regulation, Technological Innovation, and Green Development. Sustainability. 2022; 14(1):501. https://doi.org/10.3390/su14010501
Chicago/Turabian StyleYin, Kedong, Runchuan Zhang, Xue Jin, and Li Yu. 2022. "Research and Optimization of the Coupling and Coordination of Environmental Regulation, Technological Innovation, and Green Development" Sustainability 14, no. 1: 501. https://doi.org/10.3390/su14010501
Note that from the first issue of 2016, this journal uses article numbers instead of page numbers. See further details here.