
The Landscape of Risk Perception Research: A Scientometric Analysis


1
Department of Industrial Engineering, Dalhousie University, Halifax, NS B3H 4R2, Canada
2
National Science Library, Chinese Academy of Sciences, Beijing 100190, China
3
State Key Laboratory of Explosion Science and Technology, Beijing Institute of Technology, Beijing 100081, China
4
College of Safety Science and Engineering, Liaoning Technical University, Huludao 125105, China
5
Safety and Security Science, Faculty of Technology, Policy and Management, Delft University of Technology, 2600 AA Delft, The Netherlands
6
Antwerp Research Group on Safety and Security (ARGoSS), Faculty of Applied Economics, University of Antwerp, 2000 Antwerp, Belgium
7
Centre for Economics and Corporate Sustainability (CEDON), KU Leuven, 1000 Brussels, Belgium
*
Author to whom correspondence should be addressed.
Sustainability 2021, 13(23), 13188; https://doi.org/10.3390/su132313188
Submission received: 1 November 2021
/
Revised: 22 November 2021
/
Accepted: 23 November 2021
/
Published: 29 November 2021
Abstract
:Risk perception is important in organizational and societal governance contexts. This article presents a high-level analysis of risk perception research using Web of Science core collection databases, scientometrics methods and visualization tools. The focus is on trends in outputs, geographical and temporal trends, and patterns in the associated scientific categories. Thematic clusters and temporal dynamics of focus topics are identified using keyword analysis. A co-citation analysis is performed to identify the evolution of research fronts and key documents. The results indicate that research output is growing fast, with most contributions originating from western countries. The domain is highly interdisciplinary, rooted in psychology and social sciences, but branching into domains related to environmental sciences, medicine, and engineering. Significant research themes focus on perceptions related to health, with a focus on cancer, human immunodeficiency virus, and epidemiology, natural hazards and major disasters, traffic accidents, technological and industrial risks, and customer trust. Risk perception research originated from consumer choice decisions, with subsequent research fronts focusing on understanding the risk perception concept, and on developing taxonomies and measurement methods. Applied research fronts focus on environmental hazards, traffic accidents, breast cancer and, more recently, e-commerce transactions and flood risk. Based on the results, various avenues for future research are described.
1. Introduction
Risk perception concerns the intuitive, commonsensical notions people form about risks. In contrast to being a result of analytic thought, rooted in logical connections and factual evidence, people form these perceptions based contextual cues, their personal experiences, social communication, and cultural traditions [1]. As such, risk perceptions are the result of an experiential system of thinking, which is affective and associative, and uses concrete images, metaphors, and narratives to quickly obtain a holistic notion about an issue. This experiential mode of thinking is oriented towards immediate decision making and action [2]. Judgments based on such perceptions are strongly influenced by various heuristics and biases, such as the availability, representativeness, affect and anchor and adjustment heuristic. Consequently, risk perceptions often do not align well with factual evidence about the likelihood or severity of the risks [1].
There has been a significant academic interest in the risk perception phenomenon. Early work focused on advancing the theoretical understanding of the phenomenon itself [3,4,5,6]. This s led to the understanding that risk perceptions are influenced by contextual factors such as an individual’s familiarity with the risk source, the (perceived) personal control over the phenomenon or activity, whether the risk is voluntarily accepted, or the trust in organizations controlling and managing the risk [1]. A very extensive body of more applied work has investigated public risk perceptions related to specific phenomena or activities, such as natural disasters [7,8], climate change [9,10], health and food safety [11,12], and road [13,14], maritime [15], and air transportation [16].
Other work has considered risk perception from risk management and governance perspectives. A key controversy in this debate has been whether risk managers should account for public perceptions, or if they should be exclusively guided by scientific or technical knowledge [17,18,19]. For instance, Pidgeon [20] and Cross [21] present a series of arguments for and against the consideration of public perceptions in risk management decision making. Building on extensive work, Renn et al. [22] propose a risk governance framework in which the role of risk perception depends on a meta-classification of the risk in terms of complexity, uncertainty, and ambiguity. In complex risk problems, risk perception is not explicitly accounted for, and decision making is made by domain experts from authorities, industry, or academia. However, understanding risk perception is seen as important for uncertain risk problems to develop appropriate risk communication strategies in a reflective stakeholder discourse, and essential for ambiguous risk problems to serve as a basis for a wider societal discourse.
Given the very extensive literature on risk perception, various review articles have been published, highlighting different aspects of the research domain. Several authors focus their reviews on perceptions about specific risks among certain populations or in a specific country. For instance, Larsman et al. [23] reviewed research on adolescents’ risk perceptions related to risk behavior with long-term health consequences. Ngo et al. [24] made a systematic review of the role of risk perception in attitudes to blood transfusion. Lee et al. [25] synthesized the literature on risk perception among women with high-risk pregnancies. Taylor et al. [26] reviewed research on perceptions of climate risk and adaptation in the United Kingdom. Other authors have reviewed methodological aspects of risk perception [27], or related risk perception to other safety principles, e.g., linking risk perception and safety culture in a disaster risk reduction context [28].
Notwithstanding the significant progress made in this domain of research and the value of presenting narrative reviews, overviews, and meta-syntheses of specific topics in the risk perception literature, there currently is no systematic, comprehensive, data-driven analysis of the complete risk perception research domain. Such a high-level analysis is, however, useful to obtain insights regarding issues such as the evolution of the research domain, including overall patterns and trends in scientific outputs, geographic and temporal distributions of research activity, and the prevalence of attention to risk perception in various scientific disciplines and fields. Furthermore, a high-level analysis can provide insights into significant research themes, and trends in topics which have received more recent attention. Finally, the delineation of clusters facilitates identification of key contributions within these, i.e., documents that have made the most significant impact within the research domain. Such systematized knowledge can be very helpful for scholars (especially early career researchers) in the area of risk perception to get an idea of the key literature to read. This can also serve educational purposes, by highlighting key themes and literature for course instructors or for self-guided learning purposes. Finally, it can be helpful for researchers to identify new research directions, e.g., by understanding what are hot topics.
While there are various types of narrative reviews [29], these are generally not useful for obtaining systematic high-level insights into very broad knowledge domains, due to the very large number of documents published within these. Scientometric analysis techniques represent an alternative approach to obtaining such broad insights as described above. These techniques use quantitative and statistical measures of reference and citation information of published literature to obtain insights into structural and narrative patterns and trends in a given research domain. These often apply visualization techniques to facilitate interpretation and knowledge creation [30]. Several scientometric analyses have been performed on various risk, safety, and health-related research areas, such as disaster risk [31], risk communication [32], safety culture [33], safety climate [34], safety and security [35], phytoremediation of heavy metals [36], technostress in the workplace [37], technology and occupational health [38], and global health [39]. Other analyses focus on identifying core safety journals [40] or on analyzing the contents of specific journals [41,42].
Considering the above, the aim of this article is to obtain systematic insights in the risk perception research domain using various scientometric analysis techniques and tools. Overall publication trends, patterns in geographical and temporal distributions of research activity and contributing scientific disciplines, clusters of research themes, trends in focus topics, and key documents within such clusters, are analyzed.
The remainder of this article is organized as follows. In Section 2, the data retrieval strategy and obtained dataset is described, and the applied scientometric methods are briefly outlined. The results of the analysis, providing insights in the above stated research objectives, are given in Section 3. A discussion is given in Section 4, while Section 5 concludes the article.
2. Research Process: Research Questions, Data, and Methods
2.1. Research Process and Research Questions
The detailed research process implemented in the current work is illustrated in Figure 1. There are four main steps: formulating questions, data retrieval, application of specific scientometric methods and tools, and presentation and interpretation of results.
The overall research aims described in the introduction are formulated here as the following research questions about the risk perception domain, in line with step one of Figure 1:
- RQ1.
- What are the overall publication trends in terms of research output?
- RQ2.
- What geographic and temporal patterns can be observed at the country level?
- RQ3.
- What scientific categories are strongly represented?
- RQ4.
- What thematic clusters can be identified based on the author keywords?
- RQ5.
- What is the temporal evolution of topics within these thematic clusters?
- RQ6.
- What are the research clusters based on document co-citation?
- RQ7.
- What are the key documents within the dominant research clusters?
The search strategy, data retrieval process, and resulting dataset are described in Section 2.2. The applied scientometric techniques and tools to answer the above research questions are briefly outlined in Section 2.3. The results and their interpretation are presented in Section 3.
2.2. Data Retrieval Strategy and Resulting Dataset
To obtain a high-quality dataset of articles in risk perception research, Web of Science Core Collections (WOSCC), the world’s largest and most comprehensive scientific database, was applied as in the second step of Figure 1. WOSCC is the most comprehensive across scientific disciplines, while having a very high quality of the data included in the database.
The following search strategy was applied in the WOSCC database on 27 November 2020.
Title = (“risk perception” or “perception of risk” or “perceived risk”).
Document type = (Article or Review).
Data retrieval date: 27 December 2019.
A title-based search strategy was applied because an exploratory search using the title, abstract, and keywords as search fields resulted in too many articles of low relevance to the targeted knowledge domain. Title-based search strategies are commonly used in analyses of wide research domains. Only original research articles and review articles are retained, because these documents contain the most significant scientific progress, or summarize knowledge on specific topics within the domain that can be very influential. The timespan covered in the search is from 1900 to 2019 (inclusive).
The resulting dataset contains 2759 articles, which can be considered as the core scientific body of knowledge on risk perception. Table 1 shows key descriptive information of this dataset obtained by the R package Bibliometrix [43]. The results indicate that risk perception research spans from 1964 to 2019, with 1184 different journals contributing to the domain’s research literature. A total of 8521 authors have contributed to the domain. With only 335 single-authored documents, by far the most articles are written by multiple authors. Correspondingly, a rather high collaboration index of 3.39 was found. The average number of citations per document is 27.54. This high number shows that risk perception research on average has a high impact in the academic literature.
2.3. Applied Scientometric Methods: Techniques and Tools
The third step in Figure 1 concerns the application of specific methods to obtain answers to the above formulated research questions. Scientometrics was first defined by Nalimov and Mul’chenko as the application of quantitative methods to research on the development of science as an informational process [44]. Scientometric methods analyze research documents in a quantitative manner and are often used alongside visualization techniques to enable an interpretation of the results [45]. An overview of common scientometric analysis techniques and mapping tools is given in [30]. Below, the scientometric methods applied to answer the research questions of Section 2.1 are briefly described and contextualized.
2.3.1. Scientific Outputs: RQ1 to RQ3
Research outputs are important scientometric indicators to reflect the research activity and performance from different perspectives. To answer RQ1, the annual number of risk perception articles was determined to indicate the temporal research activity, from which global trends are derived using regression analysis.
RQ2 was answered by determining the number of articles originating from the different countries/regions in the world. For this categorized dataset, further metrics were calculated to provide insights in the temporal activity of different geographical areas, and to assess how impactful research from different regions is. For this purpose, the average publication year and average number of citations per paper were determined for the articles of all considered countries/regions.
To answer RQ3, the journal categories of the articles according to WOSCC were mapped on the global science map overlay [46]. This map shows the different scientific disciplines in a clustered manner, where related disciplines are grouped closer together. Hence, this map acts as a high-level visual overview of the structure of the complete scientific body of knowledge. By mapping the journal categories associated with the risk perception research dataset, insights were obtained about which disciplines actively contribute to this domain of knowledge. The mapping was performed using VOSviewer, a visualization tool which implements the visualization of similarities approach [47].
2.3.2. Keyword-Based Thematic Clusters and Temporal Evolution: RQ4 and RQ5
Keywords supplied by authors of the risk perception publications can be regarded as the topics in focus in the articles. In the current research, the frequency of occurrence of author keywords each year, and the co-occurrence of keywords were analyzed. This provides insights in hot topics and thematic clusters within risk perception research.
In scientometrics research, co-word analysis was first introduced by Callon et al. [48] to map the dynamics of science [49]. Co-word analysis has since been combined with word frequency analysis. Thus, not only can the thematic structure of topics in a research domain be revealed, but also the temporal dynamics of topics within these thematic clusters [30].
In this work, co-keyword analysis was applied to analyze the relations between each keyword. These keyword networks were visualized using VOSviewer [47] and clustered into different groups based on the keywords co-occurrence strength. A statistical analysis of the average year of occurrence of frequently occurring keywords was used as an overlay of these thematic clusters to depict temporal evolutions in the academic focus on these topics.
2.3.3. Research Clusters and Key Documents: RQ6 and RQ7
In scientometrics research, cited references are considered to be indicative of the intellectual base of a certain domain [50]. This intellectual base can be obtained through a document co-citation analysis of the references of citing articles [51]. Document co-citation analysis was first proposed by Small [52] as a new method to measure the relationship between two documents. Two documents are co-cited if they appear together in the reference lists of a given article. Co-citation analysis rests on the premise that co-cited documents are associated with one another in some way. The co-citation information in a set of articles can be used to represent research clusters within a given domain, because articles focusing on similar themes will likely cite partially the same articles. The more frequently an article is cited within a given cluster, the more it can be regarded as a key scientific contribution to the development of that cluster [30]. Since document co-citation analysis has been introduced to the scientific community, it has been widely used to unravel the structure and intellectual basis of different research domains [53,54,55].
In this paper, document co-citation analysis was conducted using CiteSpace software (developed by Prof. Chaomei Chen from Drexel University) [56], which is regularly used alongside VOSviewer (developed by Nees Jan van Eck and Ludo Waltman from Leiden University) to obtain consolidated analyses of scientific domains of study [30,32], and was applied to generate the document co-citation network and to visualize clusters. CiteSpace software was also used to identify the key documents within the top five clusters, which were considered as the key intellectual basis of those clusters. The clusters were labeled based on the terms extracted from the titles of the citing paper with most references to the articles in the clusters. This was done using the Log-likelihood ratio (LLR). These dominant citing papers can be regarded as the research front of risk perception in that cluster [57]. The average publication year of the clusters was also determined to show the evolution of risk perception.
3. Results
In this Section, the results of the scientometric analyses are shown and interpreted. Section 3.1 focuses on the scientific outputs (RQ1 to RQ3), while Section 3.2 presents results about the keyword-based clusters and hot topics (RQ4 and RQ5). Section 3.3 presents the analyses for the research clusters and key documents based on co-citation analysis (RQ6 and RQ7).
3.1. Scientific Outputs
3.1.1. Annual Trends (RQ1)
The annual trend of the risk perception research domain is shown in Figure 2. According to the dataset obtained in Section 2.2, the first article on risk perception was published in 1964. It is entitled “Perceived risk and consumer decision-making—the case of telephone shopping”, authored by Claster D.S. in the Journal of Marketing Research. Thereafter, no article on risk perception was published until 1967.
The global trends of the annual number of publications and the cumulative number of publications shows exponential growth. After an initial period with a low number of publications from 1964 until ca. 1990, there was a steady increase from 1990 to ca. 2000. Since 2003, there has been a fast and significant growth which persisted until the end of the study period. In the period from 2003 to 2019 (17 years), 80.9% of the articles (2231 in total) were published, in contrast to the 19.1% (528 in total) in the period from 1964 to 2002 (34 years).
3.1.2. Geographic Distribution (RQ2)
Figure 3 shows the global geographic distribution of the risk perception research. It shows that there are 104 countries/regions from which the 2759 risk perception articles originate. The most productive countries/regions, defined here as those with more than 20 articles, are listed in Table 2. For these countries/regions, additional metrics are listed as well, in particular the average publication year and the average number of citations.
The bulk of the risk perception research originates from western countries, from North America, Europe, and Oceania. Eastern European, Central-Asian, and most African countries did not contribute to the research literature in the study period. Within the highly productive countries, the United States of America is by far the most productive country, with 1033 articles, and accounts for over one third of the articles. It is followed by the United Kingdom (291 articles), Australia (128 articles), Canada (123 articles), Germany (121 articles), and France (114 articles). The only significant exception is the People’s Republic of China, which is the only non-western country with a large productivity in risk perception research. With a total of 216 articles, it is ranked third in total research productivity.
Among these highly productive countries/regions, the People’s Republic of China, South Korea, Italy, Japan, Spain, and Mexico have more recently become active in the research domain. Sweden, the United States of America, and Switzerland were active earlier on. In terms of impact, research from Sweden, the United States of America, and Taiwan has been most impactful, with very high average citation rates of the articles. From the highly productive countries, research from Mexico, Japan, the People’s Republic of China and South Korea is, at the time of research, significantly less impactful. However, it should be borne in mind that these countries have more recently become active, and that their scientific impact may increase in the future.
3.1.3. Scientific Categories (RQ3)
Each journal from the Web of Science Core Collection is classified into different scientific categories, which provide insight into what scientific disciplines contribute to the research in the journals. Aggregation of these classifications over the complete dataset of the risk perception articles provides insights into the scientific categories concerned with this research domain.
Figure 4, created using VOSviewer [47], shows the distribution of categories of risk perception on the global science categories map presented in [58]. These global scientific categories are further grouped in five clusters, which provide further insights in the active scientific domains. These are: #1 ‘Biology & Medicine’, #2 ‘Chemistry & Physics’, #3 ‘Ecology and Environmental Science & Technology’, #4 ‘Engineering & Mathematics’, and #5 ‘Psychology & Social Sciences’. Table 3 contains the most frequently found scientific categories in risk perception research, defined here as categories associated with more than 50 articles. The table contains the average publication year and the average number of citations, which provide insights into the temporal trends and the scientific impact of these different categories. The clusters to which the scientific categories belong are also shown in the table.
According to these results, risk perception research primarily receives contributions from the ‘Psychology & Social sciences’ scientific domain (cluster #5). Within this, the scientific category ‘Public, environmental & occupational health’ has the highest activity, with 663 articles (24.03% of the total dataset) classified in this category. Within this cluster, it is followed by the category ‘Psychology, multidisciplinary’ (179, 6.49%), ‘Social sciences, interdisciplinary’ (161, 5.84%), and ‘Social sciences, mathematical models’ (122, 4.75%). The second most prevalent scientific domain is ‘Ecology and Environmental Science & Technology’ (cluster #3), in which the scientific categories ‘Environmental sciences’ (211, 7.65%), ‘Geosciences, multidisciplinary’ (83, 3.01%), and ‘Water resources’ (81, 2.94%) show the greatest activity. The third most active scientific domain is ‘Biology & Medicine’ (cluster #1), with the scientific categories ‘Oncology’ (93, 3.37%), ‘Medicine, general & internal’ (78, 2.83%), and ‘Infectious diseases’ (73, 2.65%) being the main contributors. The fourth most contributing scientific domain is ‘Engineering & Mathematics’ (cluster #4), in which ‘Mathematics, interdisciplinary applications’ (131, 4.75%), ‘Engineering, industrial’ (67, 2.43%), and ‘Operations Research & Management Science’ (62, 2.25%) are most significant. The cluster ‘Chemistry & Physics’ (cluster #2) is the least active clusters, with none of its scientific categories having more than 50 associated articles.
These results indicate that risk perception research is highly interdisciplinary, where the scientific basis has roots in psychology and social sciences, but with links to mathematics and domain-specific knowledge, mainly from medicine and environmental sciences. Focus is on the individuals’ perceptions and how these are mediated and gain relevance in social groups. To support analyses of these perceptions, mathematical models are applied. As objects of risk perceptions, i.e., the types of issues about which people’s perceptions are studied, medical and environmental topics are most prevalent, although there is also research on food safety, transportation, business, nuclear technology, and chemistry.
To support the statement that the research domain is highly interdisciplinary, the Stirling-Rao diversity index was calculated. This provides insight into the level of interdisciplinarity of a research domain by accounting for the distance between scientific categories by giving a greater weight to pairs of articles in more distant categories [59]. The risk perception research domain contains 179 different categories, resulting in an overall diversity index of 0.818. This confirms that the domain is highly interdisciplinary, where knowledge from different domains is integrated to create new research results.
Focusing again on Table 3, it is seen from the average publication year that the objects of risk perception research in earlier research focused on ‘Business’, ‘Economics’, ‘Oncology’, ‘Medicine, general & internal’, and ‘Ergonomics’. Thereafter, the focus shifted to ‘Substance abuse’, ‘Infectious diseases’, ‘Transportation’, ‘Nursing’, and ‘Environmental studies’. Most recently, risk perception research has shifted attention to ‘Geosciences, multidisciplinary’, ‘Water resources’, and ‘Meteorology & atmospheric sciences’. In terms of research impact, the scientific categories in risk perception research associated with the highest number of citations are ‘Multidisciplinary sciences’, ‘Social sciences, mathematical methods’, and ‘Mathematics, interdisciplinary applications’. This shows that impactful risk perception research relies heavily on the application of mathematical analysis to process population data on risk perceptions.
3.2. Thematic Clusters and Hot Topics (RQ4 and RQ5)
Keywords provide important information about articles, as they represent the core content and focus of the presented work. As outlined in Section 2.3.2, an analysis of the frequency of occurrence of keywords and their co-occurrence was used to determine clusters of high research activity. Additionally, insights in the temporal evolution of research focus topics were obtained.
Thematic clusters of author keywords are shown in Figure 5, and the temporal evolution of the keywords within these is shown in Figure 6. Both figures were obtained using VOSviewer [47]. Table 4 lists frequently occurring keywords (defined here as keywords occurring over 50 times), the cluster with which they are associated, and the average year in which they appear in the articles. In these figures, author keywords matching the search terms shown in Section 2.2 (‘risk perception’, ‘perception of risk’, and ‘perceived risk’) are excluded from these results because all articles in the dataset are associated with these.
These clusters provide insights in broad themes on which risk perception research focuses. Cluster #A (red in Figure 5) is related to ‘Medical issues and health’. Earlier work in this cluster focused on the susceptibility of women to cancers (breast and ovarian cancer), addressing family history and health beliefs, and prevention. More recent work in this thematic cluster focuses on anxiety, fear, exposure, and impacts, e.g., in terms of quality of life. Most recently, meta-analysis is an active research focus. Narratively, this cluster is strongly related to Cluster #1 ‘Biology & Medicine’ in the mapping of risk perception research on the global science map, see Section 3.1.3, especially with the scientific categories ‘Oncology’ and ‘Medicine, general & internal’.
Cluster #B (green in Figure 5) is associated with ‘Natural hazards and major disasters’. Early work in this cluster focused on information on hazards, probability, and uncertainty, in the context of communication needs and decision making. The topics in this research cluster appear to follow societal developments, events, and focus issues, with, e.g., terrorism, earthquakes, natural hazards, climate change, and flooding being topics of societal attention over the last decade. Referring to Section 3.1.3, this thematic cluster links well with Cluster #3 ‘Ecology and Environmental Science & Technology’ and in particular with the scientific categories ‘Environmental sciences’ and ‘Geosciences, multidisciplinary’.
Cluster #C (blue in Figure 5) focuses on ‘Traffic accidents’. The central topic in this cluster is behavior, with early attention given to unrealistic optimism and age. Afterwards, the attention shifted to alcohol, personality, gender differences, drug use, and cannabis. Throughout the cluster, the focus is on the younger age group in the general population of drivers, as indicated by keywords such as youth, students, adolescents, and parents. Considering the analysis of Section 3.1.3, this cluster is mostly associated with Cluster #5 ‘Psychology and Social sciences’, in particular the categories ‘Transportation’ and ‘Behavioral sciences’.
Cluster #D (yellow in Figure 5) addresses ‘Technological and industrial risks’. Central topics here are attitudes and beliefs, where social amplification of risk is linked to public perceptions. With a geographical focus primarily on the United States of America and, to a lesser extent, Japan, early focus domains are nuclear waste and environmental risks, with more recent attention to food safety and pollution. Compared to the results of Section 3.1.3, this cluster spans across Cluster #2 ‘Chemistry and Physics’, with categories ‘Nuclear science & technology’ and ‘Engineering, chemical’ and Cluster #1 ‘Biology & Medicine’ and with category ‘Food science & technology’.
Cluster #E (pink in Figure 5) concerns ‘Customer trust and acceptance’. Important keywords here are trust, quality, intentions, perspective, involvement, customer satisfaction, and loyalty. Recent work in this cluster appears to focus on information technology, purchase intentions, and online security. This cluster is mostly associated with Cluster #5 ‘Psychology and Social sciences’ of Section 3.1.3, with categories such as ‘Psychology, multidisciplinary’, ‘Psychology, applied’, and ‘Business’.
Cluster #F (cyan in Figure 5) focuses on ‘Epidemiology and public health’. Early keywords here are transmission, epidemic, influenza, population, and community, with an apparent large focus on Hong Kong, probably due to the outbreak of the severe acute respiratory syndrome (SARS) between 2002 to 2004. More recent keywords in this thematic cluster are surveillance, responses, vaccination, and vigilance. Referring to Section 3.1.3, this cluster is mostly associated with the science cluster #1 ‘Biology & Medicine’, and in particular the category ‘Infectious diseases’.
Finally, Cluster #G (light purple in Figure 5) is denoted ‘Human Immunodeficiency Virus’, after the central keyword hiv. Early keywords here are gay men and sexual behavior, later shifting to condom use, infection, education, and knowledge. Compared to Clusters #A to #F, it appears that this cluster has become less active in recent years. Considering the results of Section 3.1.3, this cluster is mostly associated with Cluster #1 ‘Biology & Medicine’.
3.3. Research Clusters and Key Documents (RQ6 and RQ7)
Referring to Section 2.3.3, CiteSpace [56] was applied in this Section to perform a co-citation analysis and to determine research clusters based on the co-citation information. The co-occurrence of certain references in a set of articles presents another approach to group research in clusters, providing insights into different patterns in the research domain. The highly cited documents in these clusters can be regarded as the intellectual basis of the subdomains of risk perception research, and were extracted from this network.
In total, 21 clusters were identified in risk perception research based on the network clustering method. The largest connected component of the reference co-citation network contained 10 of these 21 clusters and is shown in Figure 7. Modularity Q and silhouette metrics were applied to evaluate the quality of the clustering results. Modularity Q measures the extent to which a network can be divided into independent modules, with values ranging from 0 to 1. A higher modularity implies a well-structured network. The silhouette value of a cluster ranges from −1 to 1 and indicates the uncertainty which needs to be considered when interpreting the nature of the cluster. A value of 1 represents a perfect separation from other clusters [57,60]. For the presented analysis, the modularity Q is 0.7359, while the mean silhouette value is 0.7979. These numbers indicate that the resulting network clustering is of good quality.
To determine the basic content of references in each cluster, the Log-likelihood ratio (LLR) method was applied to extract noun phrase from the titles of the citing article in Figure 7. As mentioned in Section 2.3.3, the name of the clusters provides insight into the research front of the cited references, while the highly cited references can be regarded as the intellectual base of the matched cluster. In the figure, the node sizes are proportional to the number of citations of a publication, while the colors of the links between articles indicates the year when two documents were first cited together. The size of the cluster label is proportional to the number of cited publications in the cluster, while the color shade of the cluster indicates the average publication year of the references. The analysis results of the co-citation analysis for the five largest clusters are shown in Table 5. The top five highly cited references in the top five co-citation clusters are shown in Table 6.
The landscape and time evolution of the clusters shows that in the early years of risk perception research, the research front was associated with ‘η Consumer-choice decision’, with 1973 the average publication year of cited references. After a period of less research activity, this shifted in the 1990s to method-oriented research fronts associated with ‘ζ Taxonomic analysis’ and ‘κ Conjoint measurement’. More applied oriented research fronts associated with references from the 1990s focused on ‘γ Traffic accident’ and ‘δ Environmental hazard’. Around the year 2000, the research front focused on meta-analysis of risk perception ‘ε Cross-national comparison’, and in the later 2000s a methodological research front ‘α Emotion-based model’ emerged. In the early 2000s, the application-focused front on ‘θ Breast cancer’ is identified, with later topic-driven research fronts in the 2010s arising: first ‘ι e-commerce transaction’ and then ‘β Flood risk’.
Referring to Table 5 and Table 6, the largest cluster has 79 cited references and a silhouette value of 0.686, indicating it has a relatively large overlap with other clusters. The cluster is labeled as ‘α Emotion-based model’ based on the LLR. The most active citer to the cluster is Peters et al. [61], citing seven articles from the cluster. The work focuses on emotions, affect, worldviews, and risk perceptions in the generation of technological stigma. The work in this cluster draws heavily on work published in Risk Analysis, including the work by Slovic et al. [65] and Sjöberg [5].
The second largest cluster contains 77 references with a silhouette value of 0.899, indicating it is relatively separated from other clusters. Based on the LLR analysis, it is labeled ‘β Flood risk’, and represents the most recent research front. Its most active citer is Lawrence et al. [62], who cited eight references from the cluster. The cited references in this cluster are dominated by articles published in Risk Analysis, and focus on natural hazards [66], responses in multihazard environments [67], flood mitigation behavior [68], and protective action [69].
The third largest cluster spans 74 articles with a silhouette value of 0.837, indicating a relatively large overlap with other clusters. It is labeled ‘γ Traffic accident’ based on the LLR analysis. The most active citer to the cluster is DeJoy [63], who focused on optimism bias among young drivers in traffic accident risk perception. He cited 10 references from the cluster. The cited sources are mostly associated with Cluster #5 ‘Psychology & Social Sciences’ of the scientific documents of Section 3.1.3. Key journals here are Health Psychology and Journal of Health and Journal of Behavioral Medicine. Highly-cited references in this cluster focus on risk perceptions and risk behaviors [70], the process of precaution adoption [71], and optimism related to health problems [72]. Other highly cited references in this cluster address perceptions and behavior related to AIDS [73,74]. This cluster is interesting in that the research front is associated with traffic accidents, while the underlying intellectual basis originates from psychological and behavioral research and uses insights from medically focused research. This clearly shows that risk perception research is truly interdisciplinary, where knowledge from disparate domains is used to form hypotheses and serves as justification to develop new domains of scientific understanding.
The fourth largest cluster contains 59 members and a silhouette value of 0.795, indicating it rather strongly overlaps with other clusters. It is labeled as ‘δ Environmental hazard’ through the LLR analysis. The most active citer to the cluster is Burger and Gochfeld [64] (1991), who cited 12 references from the cluster. This article focuses on risk perceptions among fishermen concerning fishing for specific species in a so-called superfund site, which is a marine area suspected to be contaminated by mercury. The intellectual basis for this cluster originates from Risk Analysis and Science, with key references to highly-cited foundational papers focusing on the risk perception in the psychometric paradigm [6,75] and the social amplification of risk framework [76]. This research front is an example of how fundamental theories of risk perception are used as a basis for developing understanding of topic-specific risk perceptions, here focused on environmental hazards.
The fifth largest cluster contains 37 articles and has a silhouette value of 0.818, indicating a rather strong overlap with other clusters. Based on the LLR analysis, the cluster is labeled ‘ε Cross-national comparison’. The most active citer in this cluster is Sjöberg [18], who performed an empirical study of perceptions related to radiation and nuclear power hazards in Western Europe. He cited 13 references from this cluster, mostly from Risk Analysis. These include the work by Flynn et al., on the relation between induvial traits and environmental health risks [77], by Slovic on the issue of risk perception and trust in democratic societies [78], and by Marris et al., who performed a critical analysis of the psychometric paradigm to risk perception [79]. Based on the empirical results and insights in theoretical underpinnings of the risk perception concept, Sjöberg highlights deficiencies of the psychometric and cultural theory paradigms, suggesting an alternative explanatory model of the perceived risks of nuclear power in his study [6].
4. Discussion
4.1. Interpretation
As a basis for discussion, Table 7 summarizes the main findings of the analyses, answering the research questions listed in Section 2.1.
Analysis of the annual trend of the outputs in the risk perception research domain in Section 3.1.1 shows that the domain has witnessed fast-accelerating growth, especially over the last two decades. This indicates a growing interest in risk perception of a wide range of risk issues as a research topic. Nevertheless, this growth should be contextualized in a wider development in academic publishing, where publication rates have dramatically increased in the entire scientific enterprise [90]. Similar trends of a fast increase in publication outputs have been observed in other risk and safety related scientometric analyses [30]. Hence, it is not entirely clear if the increased output in risk perception is due to its increased importance in societal decision making, or due to internal dynamics of the academic enterprise.
In terms of the geographical distribution of the research outputs shown in Section 3.1.2, most of the risk perception research originates from western countries. The recent strong increased research output from the People’s Republic of China is an exception to this, and there are small numbers of research outputs distributed across the globe. Considering that risk perceptions are rooted in personal experiences, social communication, and cultural traditions [1], this focus on western societies may be a weakness. Considering the early recognition that risks are mediated in different ways across disparate cultural traditions [91,92], the relative dearth of risk perception research in nonwestern cultural traditions may imply that current theories and approaches are not well suited for understanding risk perceptions in cultures with fundamentally different social traditions, world views, or knowledge systems.
The analysis of scientific categories (Section 3.1.3) shows that risk perception is a highly interdisciplinary research domain. It is rooted strongly in the ‘Psychology & Social sciences’ scientific domain, with multidisciplinary-oriented scientific categories such as ‘Psychology, multidisciplinary’ and ‘Social sciences, interdisciplinary’ being strongly represented. Of the scientific clusters associated with phenomena or activities concerning which risk perceptions are studied, the dominant clusters are ‘Ecology and Environmental Science & Technology’ and ‘Biology & Medicine’, indicating that most risk perception research is associated with natural hazards, pollution, epidemics, health, and specific diseases.
In terms of the thematic clusters on which risk perception research has focused in the study period (Section 3.2), it appears that the domain orients itself largely towards issues of contemporary societal relevance. Medical and health issues are continued concerns, but the focus within those seems to shift. For instance, before 2010 there was a focus on the Human Immunodeficiency Virus, whereas cancer-related risk perceptions are continuously studied, and epidemics appear to get more focus following a major outbreak such as the SARS crisis in East Asia. Societally impactful events such as natural hazards and terrorism have gained significance during the last two decades, with the focus on extreme weather events such as flooding, climate change, and earthquakes. Developments in technology also appear to be a major driver for risk perception research with, for instance, the recent focus on online commerce, information technology, and security. Finally, traffic-related risk perceptions appear to be an ongoing focus area.
Considering the research fronts (Section 3.3), it is evident that risk perception originated from a practical need to understand customer perceptions. Thereafter, there has been a focus on theoretical and methodological progress, which appear to have been less active in more recent times. In contrast, more recent research fronts have been mostly on applied research issues, addressing perceptions related to particular issues of societal concern.
4.2. Future Research Directions
As observed in Section 4.1, risk perception research in is very focused on western societies. The need for future risk perception research on nonwestern societies and knowledge systems, and the importance of cross-cultural comparisons, is argued as well for other culturally mediated phenomena, such as safety culture [93]. Future research in this direction may lead to new conceptual and theoretical insights, advancing the fundaments of risk perception research. It can also be important in the context of contemporary developments and future risks. For instance, in the context of climate change and increased shipping activities in the Arctic, shipping risks represent uncertain and ambiguous risks in a risk governance context, in which risk perceptions are important to consider [94]. In the Arctic, indigenous communities with substantially different worldviews, relying on different knowledge systems, may form perceptions in a different manner and mediate them in other ways in their decision-making processes. Understanding this from a risk perception viewpoint may lead to better risk governance.
The severity of impact is commonly found to be the most important risk dimension for forming risk perceptions [1,18]. Given this, it is interesting to compare the dominant patterns in past risk perception research to the current major global risks. According to The Global Risks Report 2020 [95], the top 10 most impactful risks are as follows: (1) climate action failure, (2) weapons of mass destruction, (3) biodiversity loss, (4) extreme weather, (5) water crises, (6) information infrastructure breakdown, (7) natural disasters, (8) cyberattacks, (9) human-made environmental disasters, and (10) infectious diseases.
Of these, it is noteworthy that some risks which have been highlighted as serious global threats have not received as much scientific attention as others. For instance, while risk perceptions of nuclear waste were in focus, especially in the USA, in earlier research, themes around nuclear or biochemical weapons, or risks related to autonomous weapon systems, are not a large focus topic. Likewise, biodiversity loss is not detected as significant thematic clusters in the analysis of Section 3.2, although ‘Ecology and Environmental Science & Technology’ is a main scientific cluster within risk perception research. Nevertheless, biodiversity loss has been known to be very important global challenges for a long time [96]. It would be interesting in future research to understand why risk perception research has not much focused on biodiversity loss, and to perform more work on advancing the understanding of related topics.
Risk perceptions related to new technologies are likely to be an important area of future work. As seen in the results of Section 3.2 and Section 3.3, technological risks have been in focus for a long time. However, the technologies in focus have changed over time with, e.g., early focus on nuclear technology and waste, and more recently on information technology and online security. With the increased interconnectivity of technical systems, digitalization, and automation, and other future technology developments [97], new risks emerge. Some risk perception work in this direction has recently been undertaken related, for example, to cybersecurity risks [98] and risks of automated vehicles [99]. This may be a fruitful direction for future research, and also for maritime transportation, in the context of risk governance of future autonomous vessels [100].
Another direction for future scholarship is to perform further in-depth reviews of the risk perception literature, focusing on aspects arising from the current work. For instance, as observed in Figure 3, much of the risk perception literature originates from western countries. However, due to the limitations of the applied scientometric analysis methods, no insights were obtained into the specific topics, themes, or focus issues of each country. A narrative review could be performed to ascertain the patterns existing in the relation between countries and research topics. A further direction for narrative reviews could be a detailed analysis of (a subsection of) the literature in terms of societally relevant frameworks. For instance, it could be investigated how the risk perception literature relates to Sustainable Development Goals (SDGs) [101], or to the highest risks on a global scale [95], where these high-level frameworks could be taken as a basis for interpreting the risk perception literature. Acknowledging that understanding risk perceptions is important, especially for large-scale problems characterized by complexity, uncertainty, and ambiguity, such focused narrative reviews could contribute to responsible risk governance in support of sustainable development. Narrative reviews of the work in specific thematic keyword clusters identified in Section 3.2 would also be important to identify future research directions in these themes.
A final future research direction relates to the finding of Section 3.1.1. While risk perception research has seen a very significantly increased volume, it is not clear whether this is because of internal dynamics of academic publishing, or whether this is because risk perceptions research is more often used. Research on whether risk perception research is actually used in, for instance, patient communication in healthcare settings, or in societal risk governance and decision making, and how the results can be used effectively, could be worthwhile.
4.3. Limitations of the Work
As a final point of discussion, it is important to reflect on several limitations of the presented work. First, the analysis is based on the search strategy described in Section 2.2. Choices in this search strategy, such as the use of the WOSCC database, the title-based search, and the applied search terms, naturally affect what articles are found. Using other databases, such as Scopus or SciFinder, or adopting an abstract-focused search with other search terms, may lead to a somewhat different dataset. The language restriction to research published in English may also lead to some blind spots in the analysis. For instance, it is plausible that authors of some non-English speaking countries would prefer to publish in their native languages, which can bias the results of Figure 3 concerning the geographic distribution of the research activity. Differences in research traditions due, for example, to a preference of publishing in books rather than in journals, could also result in some biases in the results. Finally, the availability or scarcity of funding sources to perform work on risk perception may differ significantly between countries, which can also contribute to the publication patterns observed in Section 3.1.2.
A specific issue in the analyses of temporal evolutions of risk perception research such as those presented in Section 3.1.3 and Section 3.2, is that the average publication year is used as a metric. Averages may hide significant information about the shape of the underlying distributions, e.g., in cases where there is a large variance or skewness. Nevertheless, mean values are commonly adopted in scientometric research to obtain high-level insights into temporal trends, as they usually suffice to obtain insights in the narrative patterns of how a research domain evolves [30].
Another possible weakness of scientometric analyses is that they focus on total number of citations to determine impact, and to detect patterns. A first limitation of this approach is that there is a delay in the analyses, because it takes time before citations accumulate, so that significant contributions are distinguished from others. This can be observed, for instance, in Table 4, where the average citation rate of journals which only recently started to focus on risk perception research are generally comparatively low. Another analysis where this may affect the results somewhat is the temporal analysis of thematic clusters in Section 3.2, where more recent topics are generally less frequently cited. Second, the focus on citation metrics as a proxy for impact and significance of research contributions has been widely debated [102,103]. While citations are not necessarily indicative of research quality and are open to various types of manipulation [104], they do provide high-level insight into how a research field develops and what it concerns itself with. In this regard, it is important to note that a high number of citations to an article does not imply it is correct, significant, or impactful beyond its academic context. High citation metrics should, rather, be understood as simply having a large influence on the development of a research domain.
Finally, while scientometric analyses are useful to obtain high-level insights into structural developments and patterns in a research domain, the techniques are not very suitable to detect gaps in the research and cannot detect relatively recent developments. This is because they rely on citation information as explained above. Other reviews methods, such as critical reviews, meta-analyses, and systematic reviews, are more appropriate for obtaining qualitative in-depth insights [29]. As indicated in the introduction, several such narrative reviews have already been published about the subdomains of risk perception research. The current work should be seen as complementary to those, while giving rise to further avenues for reviews as discussed in Section 4.2.
5. Conclusions
In this article, a scientometric analysis of the risk perception research domain was performed, which spanned from 1964 to 2019. Using various scientometric methods and visualization tools, the focus was first on overall publication trends and geographical and temporal patterns in research productivity. It was found that research volume has seen an exponential increase, and since the early 2000s a very significant increase. The domain is very strongly dominated by research from western countries, with the United States of America by far the largest contributor. Recently, the People’s Republic of China has become very active, as one of the few non-western countries with a significant research output. The research impact varies significantly across countries, with Sweden and the United States of America having largest research impact.
An analysis of the scientific categories and journals as knowledge carriers shows that risk perception research is strongly rooted in ‘Psychology and Social sciences’, with various multidisciplinary scientific categories contributing to the domain. Risk perception is furthermore highly interdisciplinary. Mathematical methods are used to quantitatively analyze factors in risk perceptions, and the risk issues addressed span a variety of scientific domains, primarily from ‘Ecology and Environmental Science & Technology’ and ‘Biology and Medicine’, with the most significantly contributing scientific categories including ‘Environmental sciences’ and ‘Oncology’. Nevertheless, the analysis of scientific categories shows a very wide diversity in scientific categories corresponding to the diverse focus issues about which risk perceptions are studied.
The analysis of the thematic clusters shows that there are seven major themes on which risk perception research has focused. These concern ‘Medical issues and health’, ‘Natural hazards and major disasters’, ‘Traffic accidents’, ‘Technological and industrial risks’, ‘Customer trust and acceptance’, ‘Epidemiology and public health’, and ‘Human Immunodeficiency Virus’. The temporal evolution of topics within these shows that the research follows contemporary societal concerns, which can be expected to continue in the future. The themes addressed are largely in line with major global risks. Important risks which, somewhat surprisingly, have not received much attention include risks related to weapons of mass destruction and risks related to biodiversity loss.
Finally, a co-citation analysis revealed a temporal evolution of research fronts and associated key documents, providing insight into the evolution of important research contributions over time. This shows that an early focus in risk perception research was related to consumer choice decisions (which is also the topic of the very first article on risk perception). Thereafter, focus shifted towards understanding the risk phenomenon itself, with theory building and a focus on developing appropriate taxonomies and measurement methods. The results indicate that the emotion-based model is the latest significant theory-focused research front. Other research fronts are associated with application-specific and topic-specific risk issues. Here, an evolution can be seen from traffic accidents and environmental hazards to cross-national comparisons of radiation risks and breast cancer. Most recently, the research fronts have focused on risk perceptions related to e-commerce transactions and flood risk.
Based on the results, acknowledging the limitations of the presented work, several future research directions are given. These include the need to focus more on risk perceptions in nonwestern societies because, as a culturally mediated phenomenon, different theoretical approaches and knowledge may be needed. More focus could also be directed to large scale global risks such as loss of biodiversity, and emerging risks such as cybersecurity and risks associated with new technologies such as the increased automation in transportation contexts. Furthermore, research on the effective use of risk perception research outputs would be worthwhile. Finally, scientometric analysis provides additional pathways for in-depth narrative reviews, which would provide further detailed insights into patterns (e.g., specific focus themes in different countries, and publication trends in relation to the Sustainable Development Goals), and avenues for future scholarship.
Author Contributions
Conceptualization, F.G., J.L. and G.R.; methodology, J.L. and F.G.; software, J.L.; validation, F.G. and G.R.; formal analysis, J.L. and F.G.; investigation, F.G., J.L. and G.R.; resources, F.G. and J.L.; data curation, J.L. and F.G.; writing—original draft preparation, F.G. and J.L.; writing—review and editing, G.R.; visualization, J.L. and F.G.; project administration, F.G. and J.L.; funding acquisition, F.G. and J.L. All authors have read and agreed to the published version of the manuscript.
Funding
This study was supported by the Canada Research Chairs Program through a grant by the Natural Sciences and Engineering Research Council (NSERC). And also the National Natural Science Foundation of China (grant number 51874042 and 51904185).
Institutional Review Board Statement
Not applicable.
Informed Consent Statement
Not applicable.
Conflicts of Interest
The authors declare no conflict of interest.
References
- Aven, T.; Renn, O. Risk Management and Governance: Concepts, Guidelines and Applications; Springer: Berlin, Germany, 2010. [Google Scholar]
- Kahneman, D. Thinking, Fast and Slow; Farrar, Straus and Giroux: New York, NY, USA, 2013. [Google Scholar]
- Af Wåhlberg, A.E. The theoretical features of some current approaches to risk perception. J. Risk Res. 2001, 4, 237–250. [Google Scholar] [CrossRef]
- Rundmo, T. Associations between affect and risk perception. J. Risk Res. 2002, 5, 119–135. [Google Scholar] [CrossRef]
- Sjöberg, L. Factors in risk perception. Risk Anal. 2000, 20, 1–12. [Google Scholar] [CrossRef]
- Slovic, P. Perception of risk. Science 1987, 236, 280–285. [Google Scholar] [CrossRef] [PubMed]
- Antronico, L.; De Pascale, F.; Coscarelli, R.; Gullà, G. Landslide risk perception, social vulnerability and community resilience: The case study of Maierato (Calabria, Southern Italy). Int. J. Disaster Risk Reduct. 2020, 46, 101529. [Google Scholar] [CrossRef]
- Buylova, A.; Chen, C.; Cramer, L.A.; Wang, H.; Cox, D.T. Household risk perceptions and evacuation intentions in earthquake and tsunami in a cascadia subduction zone. Int. J. Disaster Risk Reduct. 2020, 44, 101442. [Google Scholar] [CrossRef]
- Echavarren, J.M.; Balžekienė, A.; Telešienė, A. Multilevel analysis of climate change risk perception in Europe: Natural hazards, political contexts and mediating individual effects. Saf. Sci. 2019, 120, 813–823. [Google Scholar] [CrossRef]
- Bradley, G.L.; Babutsidze, Z.; Chai, A.; Reser, J.P. The role of climate change risk perception, response efficacy, and psychological adaptation in pro-environmental behavior: A two nation study. J. Environ. Psychol. 2020, 68, 101410. [Google Scholar] [CrossRef]
- Nardi, V.A.M.; Teixeira, R.; Ladeira, W.J.; De Oliveira Santini, F. A meta-analytic review of food safety risk perception. Food Control 2020, 112, 107089. [Google Scholar] [CrossRef]
- Van Asselt, M.; Poortvliet, P.M.; Ekkel, E.D.; Kemp, B.; Stassen, E.N. Risk perceptions of public health and food safety hazards in poultry husbandry by citizens, poultry farmers and poultry veterinarians. Poult. Sci. 2018, 97, 607–619. [Google Scholar] [CrossRef]
- Da Silva, L.D.O.V.; De Camargo Braga, M.G. Violent events on the road: Risk perception of traffic-related and non traffic-related situations. Accid. Anal. Prev. 2018, 114, 55–61. [Google Scholar] [CrossRef]
- Von Stülpnagel, R.; Krukar, J. Risk perception during urban cycling: An assessment of crowdsourced and authoritative data. Accid. Anal. Prev. 2018, 121, 109–117. [Google Scholar] [CrossRef] [PubMed]
- Goerlandt, F.; Pulsifer, K. An exploratory investigation of public perceptions towards autonomous urban ferries. Saf. Sci. 2022, 145, 105496. [Google Scholar] [CrossRef]
- Cho, S.-H.; Ali, F.; Manhas, P.S. Examining the impact of risk perceptions on intentions to travel by air: A comparison of full-service carriers and low-cost carriers. J. Air Transp. Manag. 2018, 71, 20–27. [Google Scholar] [CrossRef]
- Renn, O. The role of risk perception for risk management. Reliab. Eng. Syst. Saf. 1998, 59, 49–62. [Google Scholar] [CrossRef]
- Sjöberg, L. Risk perception in Western Europe. Ambio 1999, 28, 543–549. [Google Scholar]
- Wolff, J. Risk, fear, blame, shame and the regulation of public safety. Econ. Philos. 2006, 22, 409–427. [Google Scholar] [CrossRef] [Green Version]
- Pidgeon, N. Risk assessment, risk values and the social science programme: Why we do need risk perception research. Reliab. Eng. Syst. Saf. 1998, 59, 5–15. [Google Scholar] [CrossRef]
- Cross, F.B. Facts and values in risk assessment. Reliab. Eng. Syst. Saf. 1998, 59, 27–40. [Google Scholar] [CrossRef]
- Renn, O.; Klinke, A.; Van Asselt, M. Coping with complexity, uncertainty and ambiguity in risk gov-ernance: A synthesis. Ambio 2011, 40, 231–246. [Google Scholar] [CrossRef]
- Larsman, P.; Eklöf, M.; Törner, M. Adolescents’ risk perceptions in relation to risk behavior with long-term health consequences; antecedents and outcomes: A literature review. Saf. Sci. 2012, 50, 1740–1748. [Google Scholar] [CrossRef]
- Ngo, L.T.; Bruhn, R.; Custer, B. Risk perception and its role in attitudes toward blood transfusion: A qualitative systematic review. Transfus. Med. Rev. 2013, 27, 119–128. [Google Scholar] [CrossRef] [PubMed]
- Lee, S.; Ayers, S.; Holden, D. A metasynthesis of risk perception in women with high risk pregnancies. Midwifery 2014, 30, 403–411. [Google Scholar] [CrossRef] [PubMed]
- Taylor, A.L.; Dessai, S.; De Bruin, W.B. Public perception of climate risk and adaptation in the UK: A review of the literature. Clim. Risk Manag. 2014, 4–5, 1–16. [Google Scholar] [CrossRef] [Green Version]
- Sridhar, S.; Régner, I.; Brouqui, P.; Gautret, P. Methodologies for measuring travelers’ risk perception of infectious diseases: A systematic review. Travel Med. Infect. Dis. 2016, 14, 360–372. [Google Scholar] [CrossRef]
- Marshall, T. Risk perception and safety culture: Tools for improving the implementation of disaster risk reduction strategies. Int. J. Disaster Risk Reduct. 2020, 47, 101557. [Google Scholar] [CrossRef]
- Grant, M.J.; Booth, A. A typology of reviews: An analysis of 14 review types and associated methodologies. Health Inf. Libr. J. 2009, 26, 91–108. [Google Scholar] [CrossRef]
- Li, J.; Goerlandt, F.G.R. An overview of scientometric mapping for the safety science community: Methods, tools, and processes. Saf. Sci. 2021, 134, 105093. [Google Scholar] [CrossRef]
- Gall, M.; Nguyen, K.H.; Cutter, S.L. Integrated research on disaster risk: Is it really integrated? Int. J. Disaster Risk Reduct. 2015, 12, 255–267. [Google Scholar] [CrossRef]
- Goerlandt, F.; Li, J.; Reniers, G. The landscape of risk communication research: A scientometric analysis. Int. J. Environ. Res. Public Health 2020, 17, 3255. [Google Scholar] [CrossRef]
- Van Nunen, K.; Li, J.; Reniers, G.; Ponnet, K. Bibliometric analysis of safety culture research. Saf. Sci. 2018, 108, 248–258. [Google Scholar] [CrossRef]
- Bamel, U.K.; Pandey, R.; Gupta, A. Safety climate: Systematic literature network analysis of 38 years (1980–2018) of research. Accid. Anal. Prev. 2020, 135, 105387. [Google Scholar] [CrossRef] [PubMed]
- Li, J.; Goerlandt, F.; van Nunen, K.; Reniers, G. Identifying common grounds for safety and security research: A comparative scientometric analysis focusing on development patterns, similarities, and differences. J. Integr. Secur. Saf. Sci. 2021, 1, 5–33. [Google Scholar]
- Li, C.; Ji, X.; Luo, X. Phytoremediation of heavy metal pollution: A bibliometric and scientometric analysis from 1989 to 2018. Int. J. Environ. Res. Public Health 2019, 16, 4755. [Google Scholar] [CrossRef] [Green Version]
- Bondanini, G.; Giorgi, G.; Ariza-Montes, A.; Vega-Muñoz, A.; Andreucci-Annunziata, P. Technostress dark side of technology in the workplace: A scientometric analysis. J. Integr. Secur. Saf. Sci. 2020, 17, 8013. [Google Scholar] [CrossRef]
- Vaquero-Álvarez, E.; Cubero-Atienza, A.; Ruiz-Martinez, P.; Vaquero-Abellán, M.; Redel-Macias, M.D.; Aparicio-Martínez, P. Bibliometric study of technology and occupational health in healthcare sector: A worldwide trend to the future. Int. J. Environ. Res. Public Health 2020, 17, 6732. [Google Scholar] [CrossRef]
- Wang, M.; Liu, P.; Zhang, R.; Li, Z.; Li, X. A scientometric analysis of global health research. Int. J. Environ. Res. Public Health 2020, 17, 2963. [Google Scholar] [CrossRef] [PubMed]
- Li, J.; Hale, A. Identification of, and knowledge communication among core safety science journals. Saf. Sci. 2015, 74, 70–78. [Google Scholar] [CrossRef]
- Merigó, J.M.; Miranda, J.; Modak, N.M.; Boustras, G.; De La Sotta, C. Forty years of safety science: A bibliometric overview. Saf. Sci. 2019, 115, 66–88. [Google Scholar] [CrossRef]
- Li, J.; Goerlandt, F.; Reniers, G. Mapping process safety: A retrospective scientometric analysis of three process safety related journals (1999–2018). J. Loss Prev. Process Ind. 2020, 65, 104141. [Google Scholar] [CrossRef]
- Aria, M.; Cuccurullo, C. Bibliometrix: An R-tool for comprehensive science mapping analysis. J. Informetr. 2017, 11, 959–975. [Google Scholar] [CrossRef]
- Nalimov, V.V.E.; Mul’Chenko, Z.M. Measurement of Science. Study of the Development of Science as an Information Process; Foreign Technology Div Wright-Patterson AFB: Dayton, OH, USA, 1971. [Google Scholar]
- Mingers, J.; Leydesdorff, L. A review of theory and practice in scientometrics. Eur. J. Oper. Res. 2015, 246, 1–19. [Google Scholar] [CrossRef] [Green Version]
- Carley, S.; Porter, A.L.; Rafols, I.; Leydesdorff, L. Visualization of disciplinary profiles: Enhanced science overlay maps. J. Data Inf. Sci. 2017, 2, 68–111. [Google Scholar] [CrossRef] [Green Version]
- Van Eck, N.J.; Waltman, L. Software survey: Vosviewer, a computer program for bibliometric mapping. Scientometrics 2010, 84, 523–538. [Google Scholar] [CrossRef] [PubMed] [Green Version]
- Callon, M.; Rip, A.; Law, J. (Eds.) Mapping the Dynamics of Science and Technology: Sociology of Science in the Real World; Springer: London, UK, 1986. [Google Scholar]
- He, Q. Knowledge discovery through co-word analysis. Libr. Trends 1999, 48, 133. [Google Scholar]
- Hammarfelt, B. Interdisciplinarity and the intellectual base of literature studies: Citation analysis of highly cited monographs. Scientometrics 2011, 86, 705–725. [Google Scholar] [CrossRef]
- Persson, O. The intellectual base and research fronts of JASIS 1986–1990. J. Am. Soc. Inf. Sci. 1994, 45, 31–38. [Google Scholar] [CrossRef]
- Small, H. Co-citation in the scientific literature: A new measure of the relationship between two documents. J. Am. Soc. Inf. Sci. 1973, 24, 265–269. [Google Scholar] [CrossRef]
- Culnan, M.J. Mapping the intellectual structure of mis, 1980–1985: A co-citation analysis. Mis Q. 1987, 11, 341–353. [Google Scholar] [CrossRef]
- García-Lillo, F.; Claver-Cortés, E.; Marco-Lajara, B.; Úbeda-García, M. Identifying the ‘knowledge base’ or ‘intellectual structure’ of research on international business, 2000–2015: A citation/co-citation analysis of jibs. Int. Bus. Rev. 2019, 28, 713–726. [Google Scholar] [CrossRef]
- Köseoglu, M.A.; Okumus, F.; Dogan, I.C.; Law, R. Intellectual structure of strategic management re-search in the hospitality management field: A co-citation analysis. Int. J. Hosp. Manag. 2019, 78, 234–250. [Google Scholar] [CrossRef]
- Chen, C. CiteSpace II: Detecting and visualizing emerging trends and transient patterns in scientific literature. J. Am. Soc. Inf. Sci. Technol. 2006, 57, 359–377. [Google Scholar] [CrossRef] [Green Version]
- Chen, C.; Ibekwe-Sanjuan, F.; Hou, J. The structure and dynamics of cocitation clusters: A multiple-perspective cocitation analysis. J. Am. Soc. Inf. Sci. Technol. 2010, 61, 1386–1409. [Google Scholar] [CrossRef] [Green Version]
- Leydesdorff, L.; Rafols, I.; Chen, C. Interactive overlays of journals and the measurement of interdisciplinarity on the basis of aggregated journal—Journal citations. J. Am. Soc. Inf. Sci. Technol. 2013, 64, 2573–2586. [Google Scholar] [CrossRef] [Green Version]
- Stirling, A. A general framework for analysing diversity in science, technology and society. J. R. Soc. Interface 2007, 4, 707–719. [Google Scholar] [CrossRef] [Green Version]
- Rousseeuw, P.J. Silhouettes: A graphical aid to the interpretation and validation of cluster analysis. J. Comput. Appl. Math. 1987, 20, 53–65. [Google Scholar] [CrossRef] [Green Version]
- Peters, E.M.; Burraston, B.; Mertz, C.K. An emotion-based model of risk perception and stigma susceptibility: Cognitive appraisals of emotion, affective reactivity, worldviews, and risk perceptions in the generation of technological stigma. Risk Anal. 2004, 24, 1349–1367. [Google Scholar] [CrossRef]
- Lawrence, J.; Quade, D.; Becker, J. Integrating the effects of flood experience on risk perception with responses to changing climate risk. Nat. Hazards 2014, 74, 1773–1794. [Google Scholar] [CrossRef]
- De Joy, D.M. The optimism bias and traffic accident risk perception. Accid. Anal. Prev. 1989, 21, 333–340. [Google Scholar] [CrossRef]
- Burger, J.; Gochfeld, M. Fishing a superfund site: Dissonance and risk perception of environmental hazards by fishermen in Puerto Rico. Risk Anal. 1991, 11, 269–277. [Google Scholar] [CrossRef]
- Slovic, P.; Finucane, M.L.; Peters, E.; Macgregor, D.G. Risk as analysis and risk as feelings: Some thoughts about affect, reason, risk, and rationality. Risk Anal. 2004, 24, 311–322. [Google Scholar] [CrossRef]
- Wachinger, G.; Renn, O.; Begg, C.; Kuhlicke, C. The risk perception paradox—implications for governance and communication of natural hazards. Risk Anal. 2013, 33, 1049–1065. [Google Scholar] [CrossRef]
- Lindell, M.K.; Hwang, S.N. Households’ perceived personal risk and responses in a multihazard environment. Risk Anal. 2008, 28, 539–556. [Google Scholar] [CrossRef] [PubMed]
- Bubeck, P.; Botzen, W.J.W.; Aerts, J.C.J.H. A review of risk perceptions and other factors that influence flood mitigation behavior. Risk Anal. 2012, 32, 1481–1495. [Google Scholar] [CrossRef] [Green Version]
- Lindell, M.K.; Perry, R.W. The protective action decision model: Theoretical modifications and additional evidence. Risk Anal. 2012, 32, 616–632. [Google Scholar] [CrossRef] [PubMed]
- Weinstein, N.D.; Nicolich, M. Correct and incorrect interpretations of correlations between risk perceptions and risk behaviors. Health Psychol. 1993, 12, 235–245. [Google Scholar] [CrossRef]
- Weinstein, N.D. The precaution adoption process. Health Psychol. 1988, 7, 355–386. [Google Scholar] [CrossRef] [PubMed]
- Weinstein, N.D. Unrealistic optimism about susceptibility to health problems: Conclusions from a com-munity-wide sample. J. Behav. Med. 1987, 10, 481–500. [Google Scholar] [CrossRef] [PubMed]
- Becker, M.H.; Joseph, J.G. AIDS and behavioral change to reduce risk: A review. Am. J. Public Health 1988, 78, 394–410. [Google Scholar] [CrossRef] [PubMed] [Green Version]
- Prohaska, T.R.; Albrecht, G.; Levy, J.A.; Sugrue, N.; Kim, J.-H. Determinants of self-perceived risk for aids. J. Health Soc. Behav. 1990, 31, 384–394. [Google Scholar] [CrossRef]
- Kraus, N.N.; Slovic, P. Taxonomic analysis of perceived risk: Modeling individual and group perceptions within homogeneous hazard domains. Risk Anal. 1988, 8, 435–455. [Google Scholar] [CrossRef]
- Kasperson, R.E.; Renn, O.; Slovic, P.; Brown, H.S.; Emel, J.; Goble, R.; Kasperson, J.X.; Ratick, S. The social amplification of risk: A conceptual framework. Risk Anal. 1988, 8, 177–187. [Google Scholar] [CrossRef] [Green Version]
- Flynn, J.; Slovic, P.; Mertz, C.K. Gender, race, and perception of environmental health risks. Risk Anal. 1994, 14, 1101–1108. [Google Scholar] [CrossRef] [PubMed] [Green Version]
- Slovic, P. Perceived risk, trust, and democracy. Risk Anal. 1993, 13, 675–682. [Google Scholar] [CrossRef] [Green Version]
- Marris, C.; Langford, I.; Saunderson, T.; O’riordan, T. Exploring the “psychometric paradigm”: Com-parisons between aggregate and individual analyses. Risk Anal. 1997, 17, 303–312. [Google Scholar] [CrossRef] [PubMed]
- Brewer, N.T.; Chapman, G.B.; Gibbons, F.X.; Gerrard, M.; Mccaul, K.D.; Weinstein, N.D. Meta-analysis of the relationship between risk perception and health behavior: The example of vaccination. Health Psychol. 2007, 26, 136–145. [Google Scholar] [CrossRef] [Green Version]
- Loewenstein, G.F.; Weber, E.U.; Hsee, C.K.; Welch, N. Risk as feelings. Psychol. Bull. 2001, 127, 267–286. [Google Scholar] [CrossRef]
- Slovic, P. The Perception of Risk; Routledge: London, UK, 2000. [Google Scholar]
- Hayes, A.F. Introduction to Mediation, Moderation, and Conditional Process Analysis: A Regression-Based Approach; The Guilford Press: New York, NY, USA, 2013; p. 732. [Google Scholar]
- Heimer, C.A. Social structure, psychology, and the estimation of risk. Ann. Rev. Sociol. 1988, 14, 491–517. [Google Scholar] [CrossRef]
- Weinstein, N.D. Why it won’t happen to me: Perceptions of risk factors and susceptibility. Health Psychol. 1984, 3, 431–457. [Google Scholar] [CrossRef]
- Covello, V.T.; Sandman, P.M.; Slovic, P. Risk Communication, Risk Statistics, and Risk Comparisons: A Manual for Plant Managers; Chemical Manufacturers Association: Washington, DC, USA, 1988. [Google Scholar]
- Kraus, N.; Malmfors, T.; Slovic, P. Intuitive toxicology: Expert and lay judgments of chemical risks. Risk Anal. 1992, 12, 215–232. [Google Scholar] [CrossRef] [Green Version]
- Slovic, P.; Krimsky, S.; Golding, D. Perception of risk: Reflections on the psychometric paradigm. In Social Theories of Risk; Krimsky, S., Golding, D., Eds.; Praeger: New York, NY, USA, 1992. [Google Scholar]
- Teigen, K.H.; Brun, W.; Slovic, P. Societal risks as seen by a norwegian public. J. Behav. Decis. Mak. 1988, 1, 111–130. [Google Scholar] [CrossRef]
- Ware, M.; Mabe, M. The STM report: An overview of scientific and scholarly journal publishing. In International Association of Scientific; Technical and Medical Publishers: The Hague, The Netherlands, 2015; p. 180. [Google Scholar]
- Douglas, M.; Wildavsky, A. Risk and Culture: An Essay on the Selection of Technological and Environ-Mental Dangers; University of California Press: Berkeley, CA, USA, 1982. [Google Scholar]
- Tansey, J.; O’riordan, T. Cultural theory and risk: A. review. Health Risk Soc. 1999, 1, 71–90. [Google Scholar] [CrossRef]
- Yorio, P.L.; Edwards, J.; Hoeneveld, D. Safety culture across cultures. Saf. Sci. 2019, 120, 402–410. [Google Scholar] [CrossRef] [PubMed]
- Goerlandt, F.; Pelot., R. An exploratory application of the international risk governance council risk governance framework to shipping risks in the Canadian Arctic. In Governance of Arctic Shipping: Rethinking Risk, Human Impacts and Regulation; Chircop, A., Goerlandt, F., Aporta, C., Pelot, R., Eds.; Springer Polar Series: London, UK, 2020; pp. 15–41. [Google Scholar]
- WEF. The Global Risks Report 2020; World Economic Forum: Geneva, Switzerland, 2020; p. 102. [Google Scholar]
- Cardinale, B.J.; Duffy, J.E.; Gonzalez, A.; Hooper, D.U.; Perrings, C.; Venail, P.; Narwani, A.; Mace, G.M.; Tilman, D.; Wardle, D.A. Biodiversity loss and its impact on humanity. Nature 2012, 486, 59–67. [Google Scholar] [CrossRef] [PubMed]
- DNV. Technology Outlook 2030; DNV GL Technical Report; DNV: Høvik, Norway, 2019. [Google Scholar]
- Van Schaik, P.; Renaud, K.; Wilson, C.; Jansen, J.; Onibokun, J. Risk as affect: The affect heuristic in cybersecurity. Comput. Secur. 2020, 90, 101651. [Google Scholar] [CrossRef]
- Moody, J.; Bailey, N.; Zhao, J. Public perceptions of autonomous vehicle safety: An international comparison. Saf. Sci. 2020, 121, 634–650. [Google Scholar] [CrossRef]
- Goerlandt, F. Maritime autonomous surface ships from a risk governance perspective: Interpretation and implications. Saf. Sci. 2020, 128, 104758. [Google Scholar] [CrossRef]
- UN. Transforming Our World: The 2030 Agenda for Sustainable Development. United Nations A/Res/70/1. p. 41. Available online: https://sdgs.un.org/2030agenda (accessed on 31 October 2021).
- Garfield, E. Is citation analysis a legitimate evaluation tool? Scientometrics 1979, 1, 359–375. [Google Scholar] [CrossRef]
- Lynch, K. Control by numbers: New managerialism and ranking in higher education. Critic. Stud. Educ. 2015, 56, 190–207. [Google Scholar] [CrossRef]
- Fong, E.A.; Wilhite, A.W. Authorship and citation manipulation in academic research. PLoS ONE 2017, 12, e0187394. [Google Scholar] [CrossRef] [Green Version]
Figure 1.
Research process applied in this study.

Figure 2.
Annual global productivity of risk perception research from 1967 to 2019.

Figure 3.
Geographical distribution of global risk perception research. (a) Geographical distribution of risk perception research risk globally. The high-resolution figure can be retrieved from https://figshare.com/s/886d17fc82037cee4d93 (accessed on 25 November 2021). (b) Geographical distribution of risk perception research in European countries. The high-resolution figure can be retrieved from https://figshare.com/s/85fa6ebbadbddb488f15 (accessed on 25 November 2021).

Figure 4.
Categories of risk perception research on the global science categories map [58]. Default parameters of VOSviewer were used to construct the categories map. A high-resolution version of the figure is available at https://figshare.com/s/410dac07d2655224e86a (accessed on 25 November 2021).
Figure 4.
Categories of risk perception research on the global science categories map [58]. Default parameters of VOSviewer were used to construct the categories map. A high-resolution version of the figure is available at https://figshare.com/s/410dac07d2655224e86a (accessed on 25 November 2021).

Figure 5.
Thematic clusters of risk perception research based on author keywords. The minimum number of occurrences of the keywords was set as 50, the cluster resolution was set at 1, and the minimum cluster size taken as 10. A high-resolution version of the figure can be retrieved from https://figshare.com/s/c2e624d549bfb8a084cf (accessed on 25 November 2021).

Figure 6.
Average publication year of author keywords in the thematic clusters of risk perception research. A high-resolution version of the figure can be retrieved from https://figshare.com/s/3995bf7901b6f3b2aad2 (accessed on 25 November 2021).
Figure 6.
Average publication year of author keywords in the thematic clusters of risk perception research. A high-resolution version of the figure can be retrieved from https://figshare.com/s/3995bf7901b6f3b2aad2 (accessed on 25 November 2021).

Figure 7.
Landscape of risk perception research: clusters and key documents. Constructed using CiteSpave version 5.5 R2. Timespan: 1964–2019, with slice length set at 5 and selection criterion as top 50 per slice. A high-resolution version of the figure can be obtained at https://figshare.com/s/4e23324dbeec0b872cc3 (accessed on 25 November 2021).


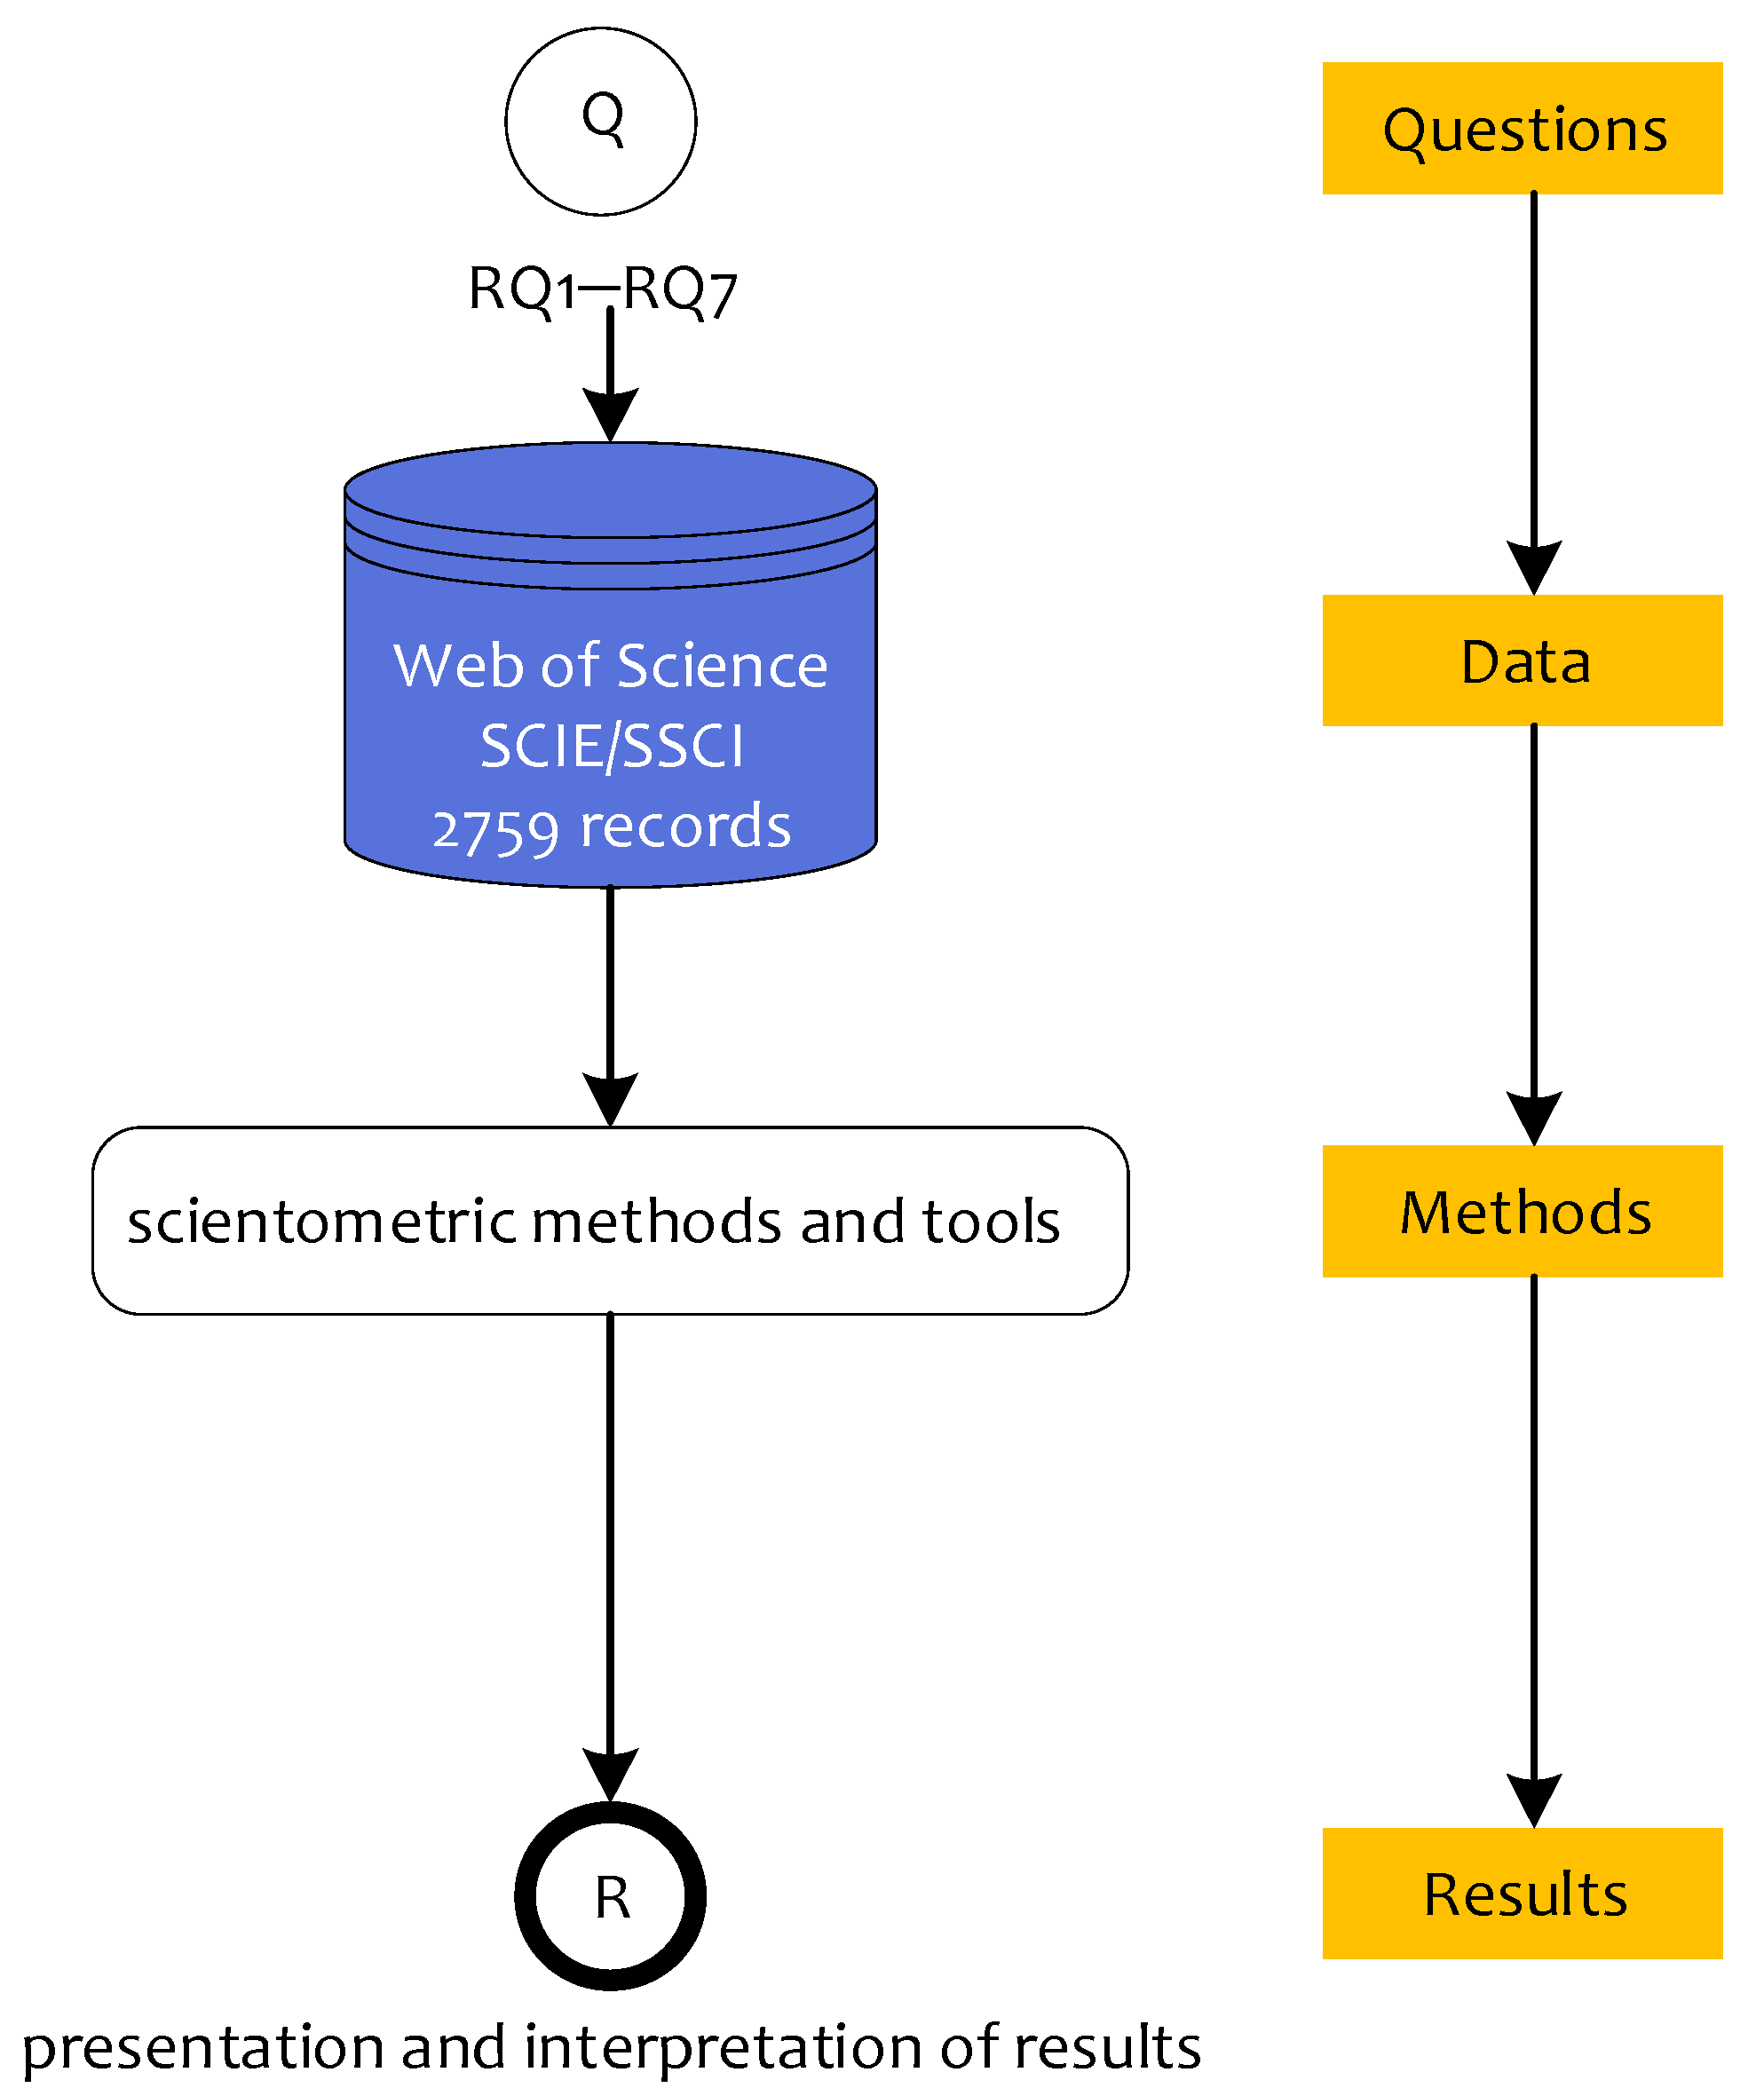
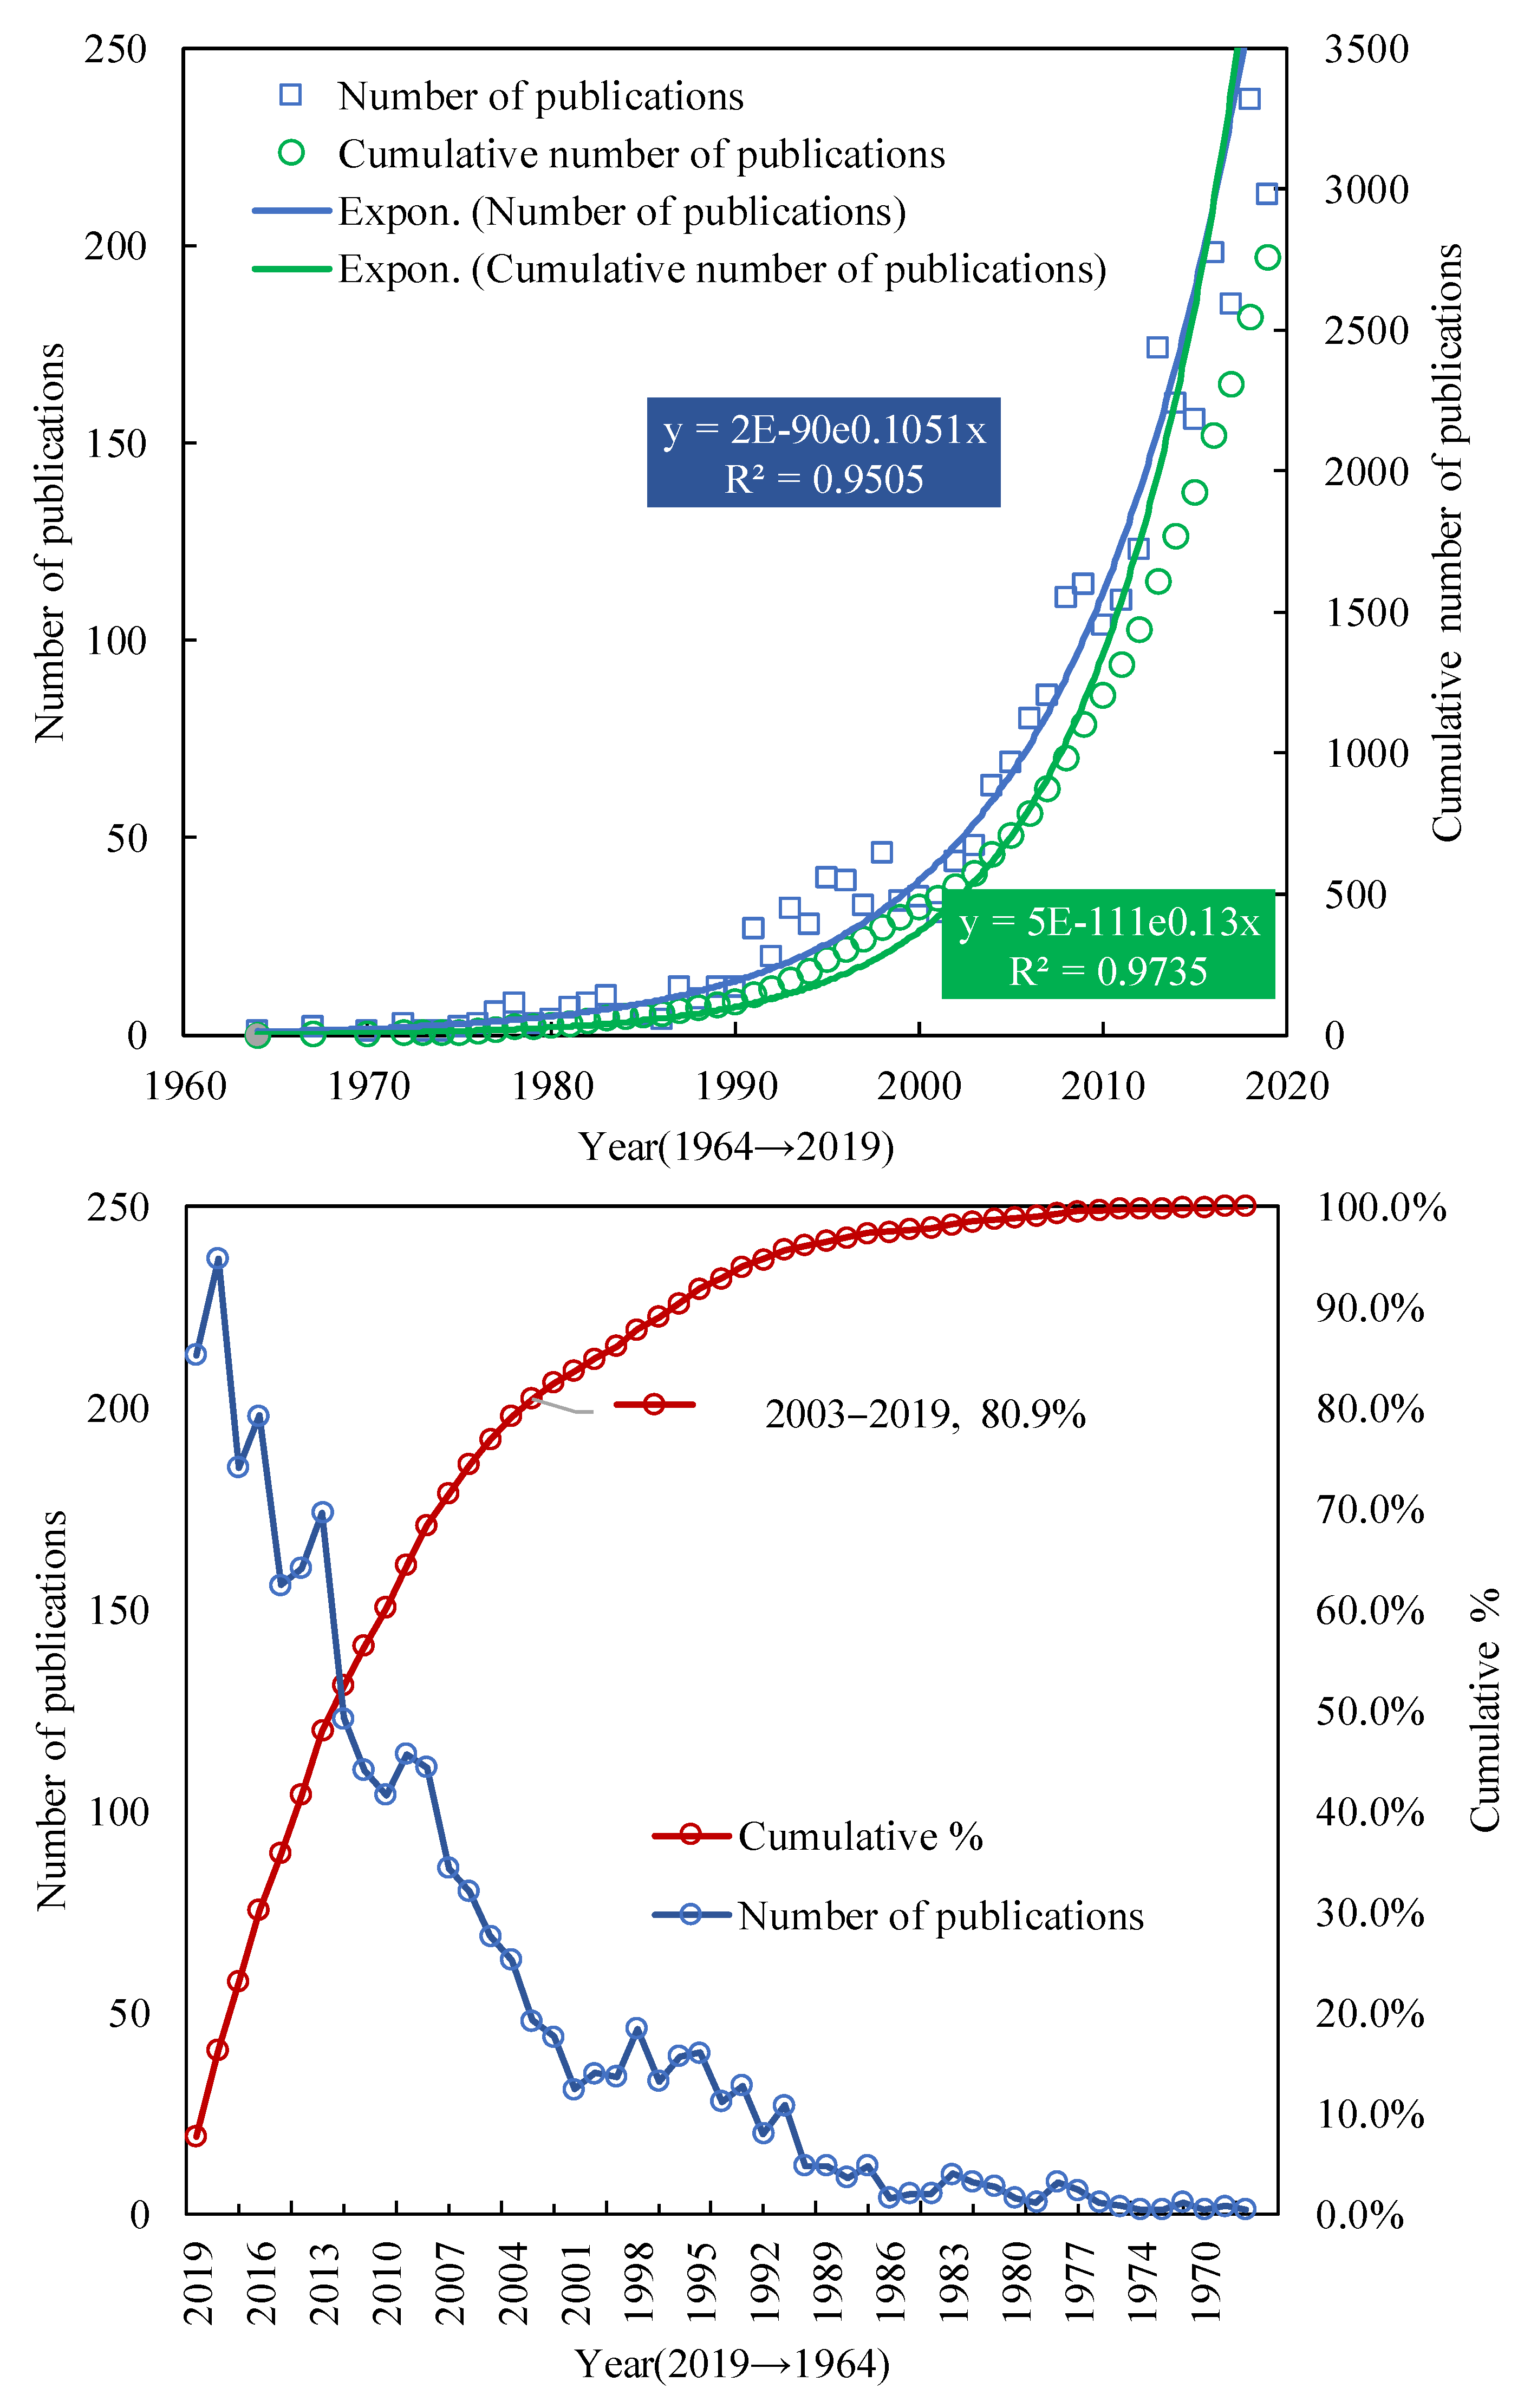
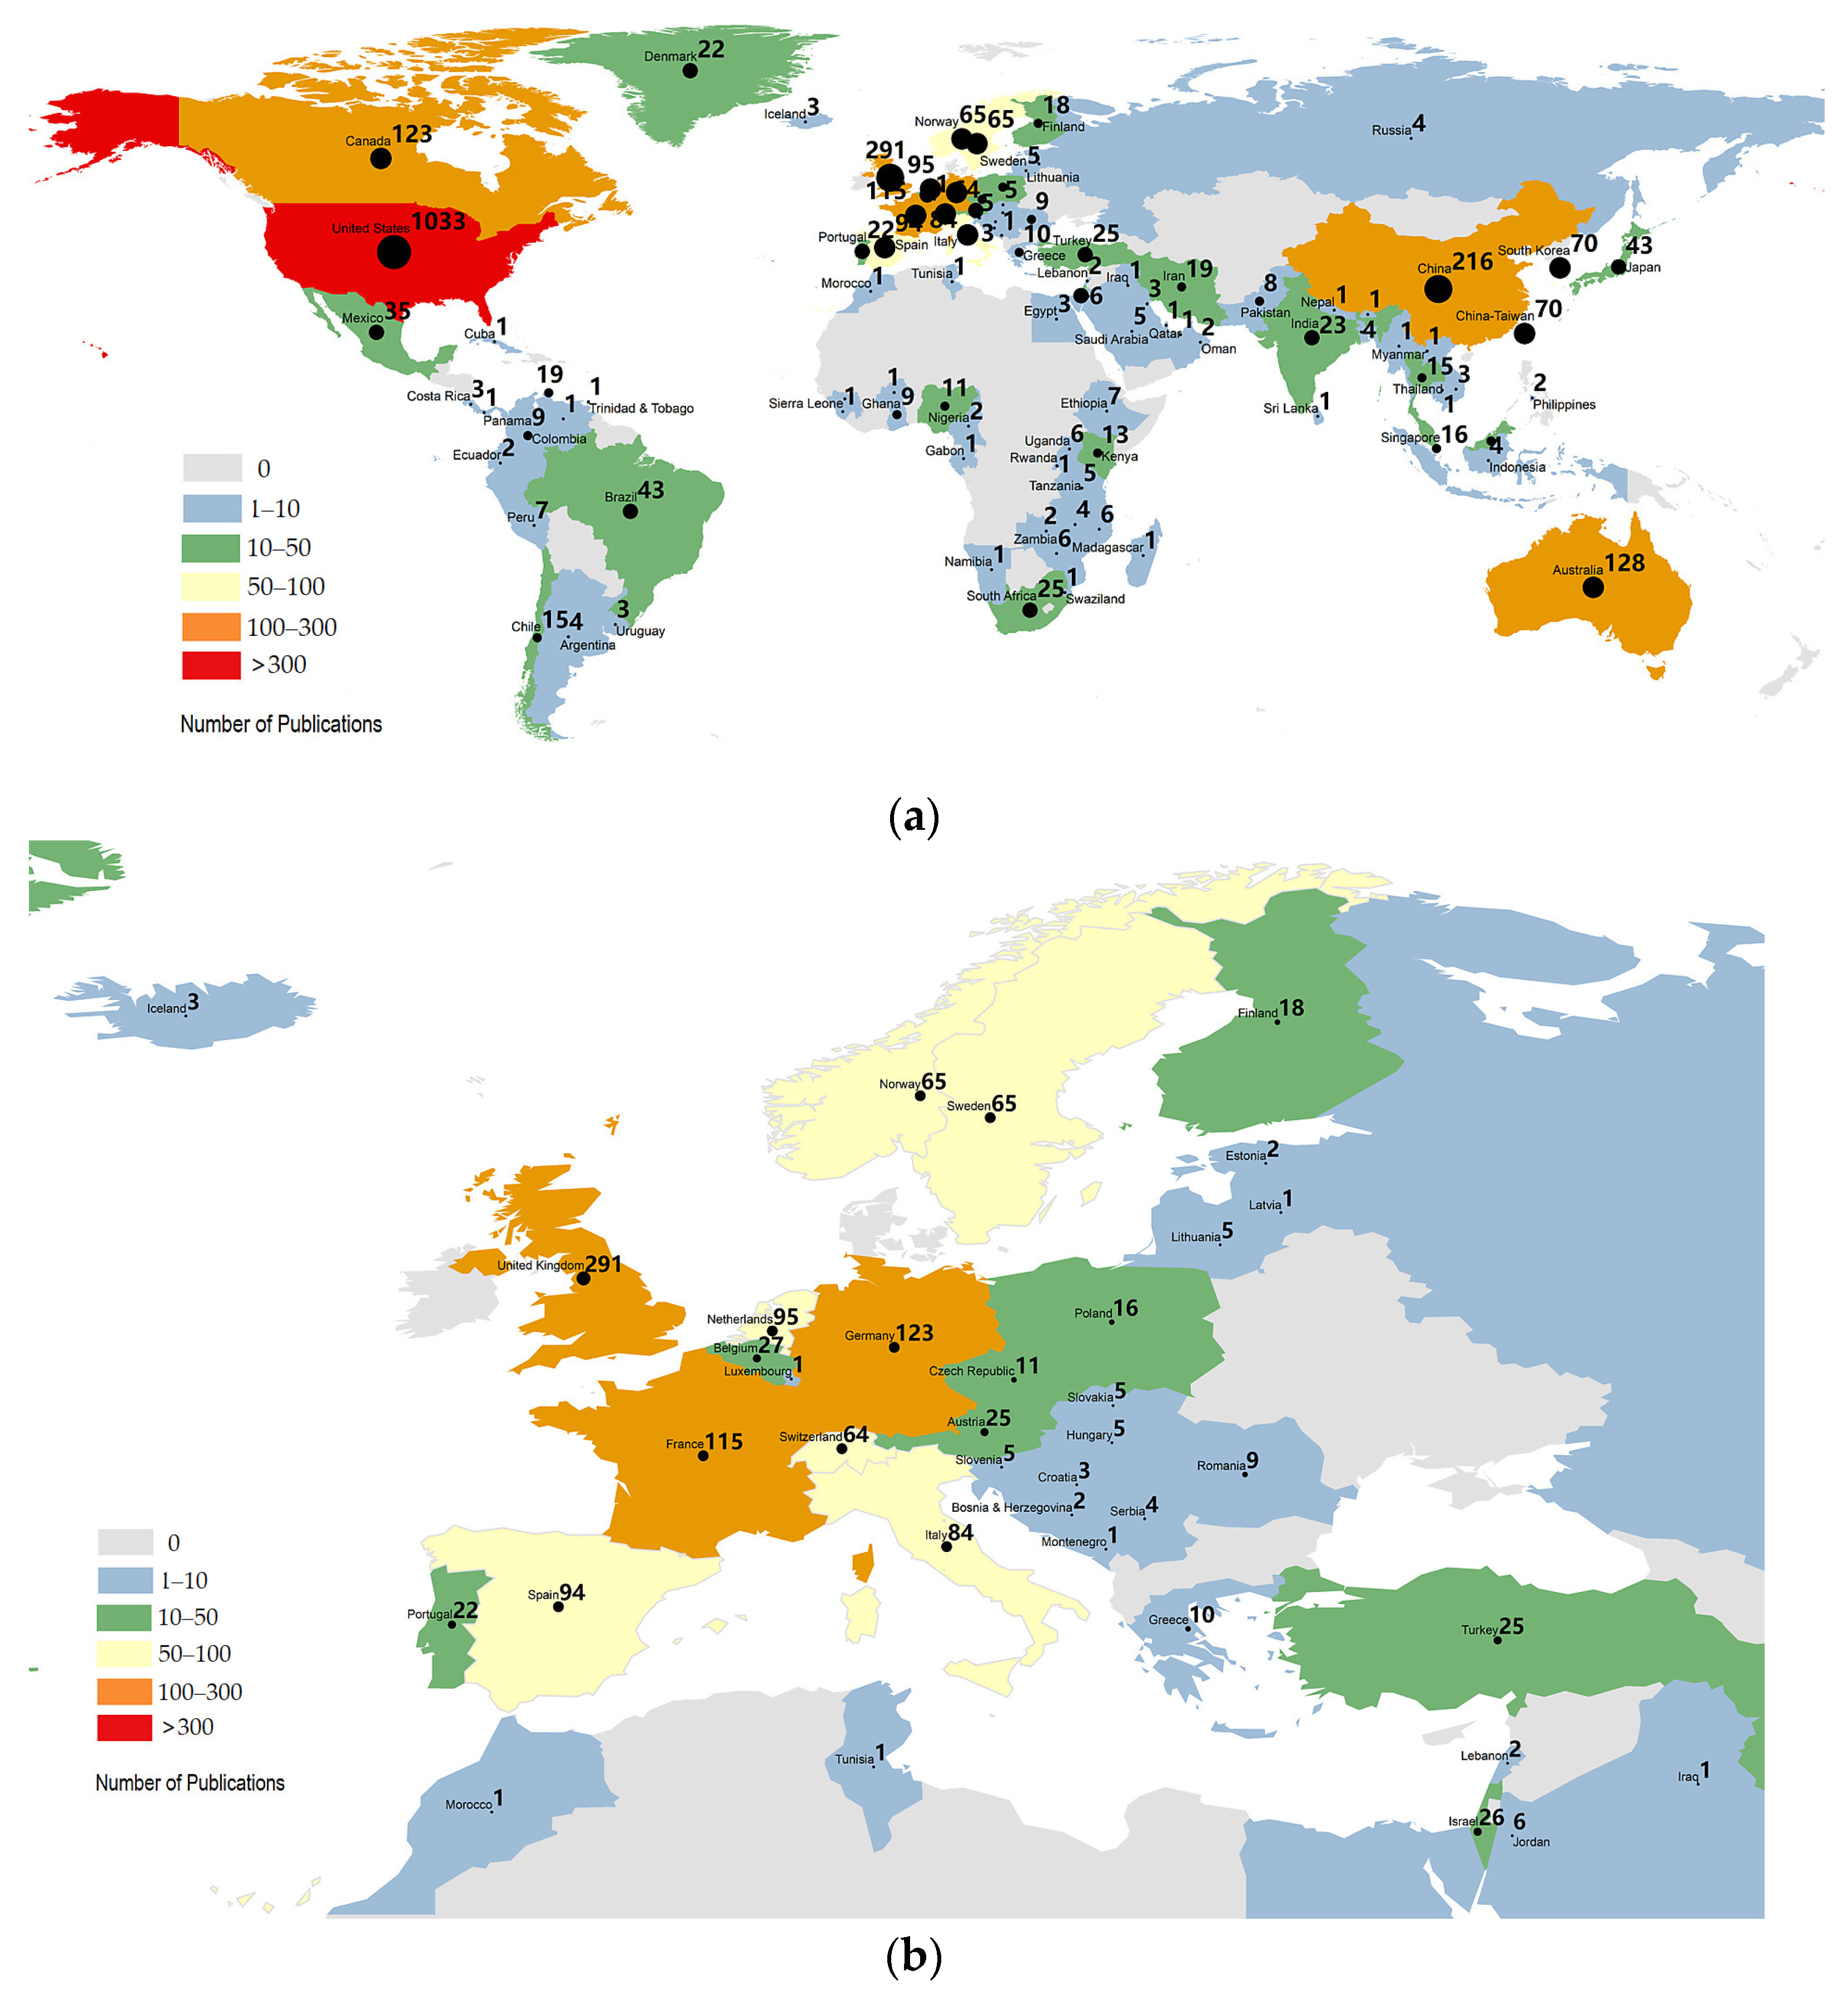
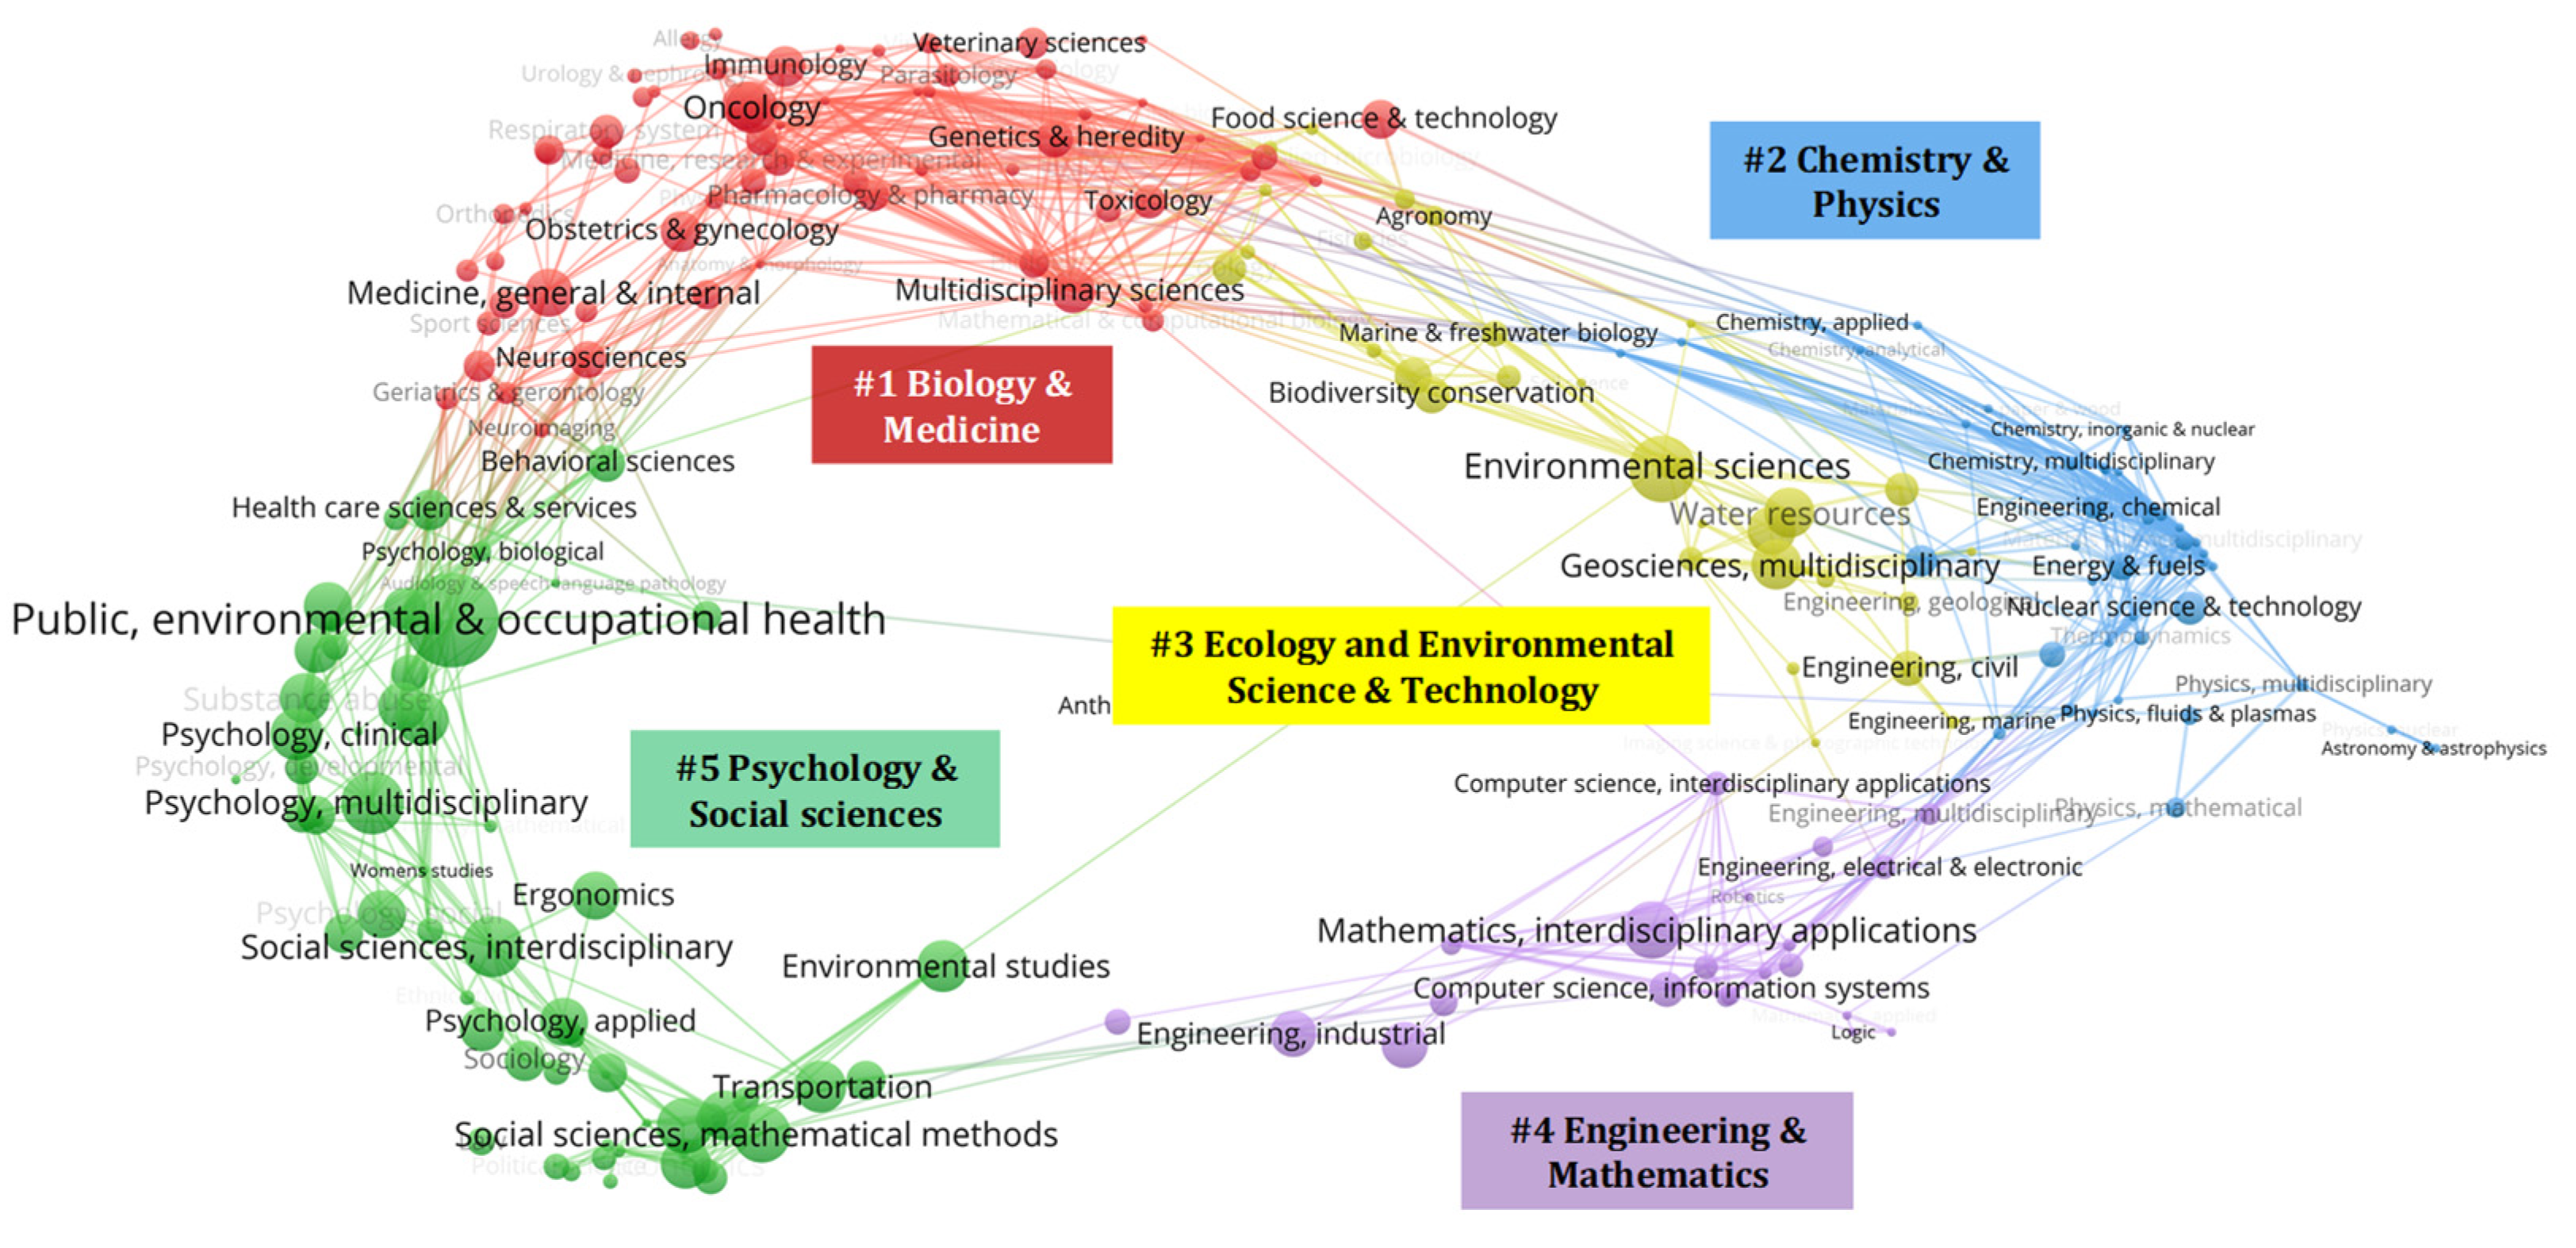
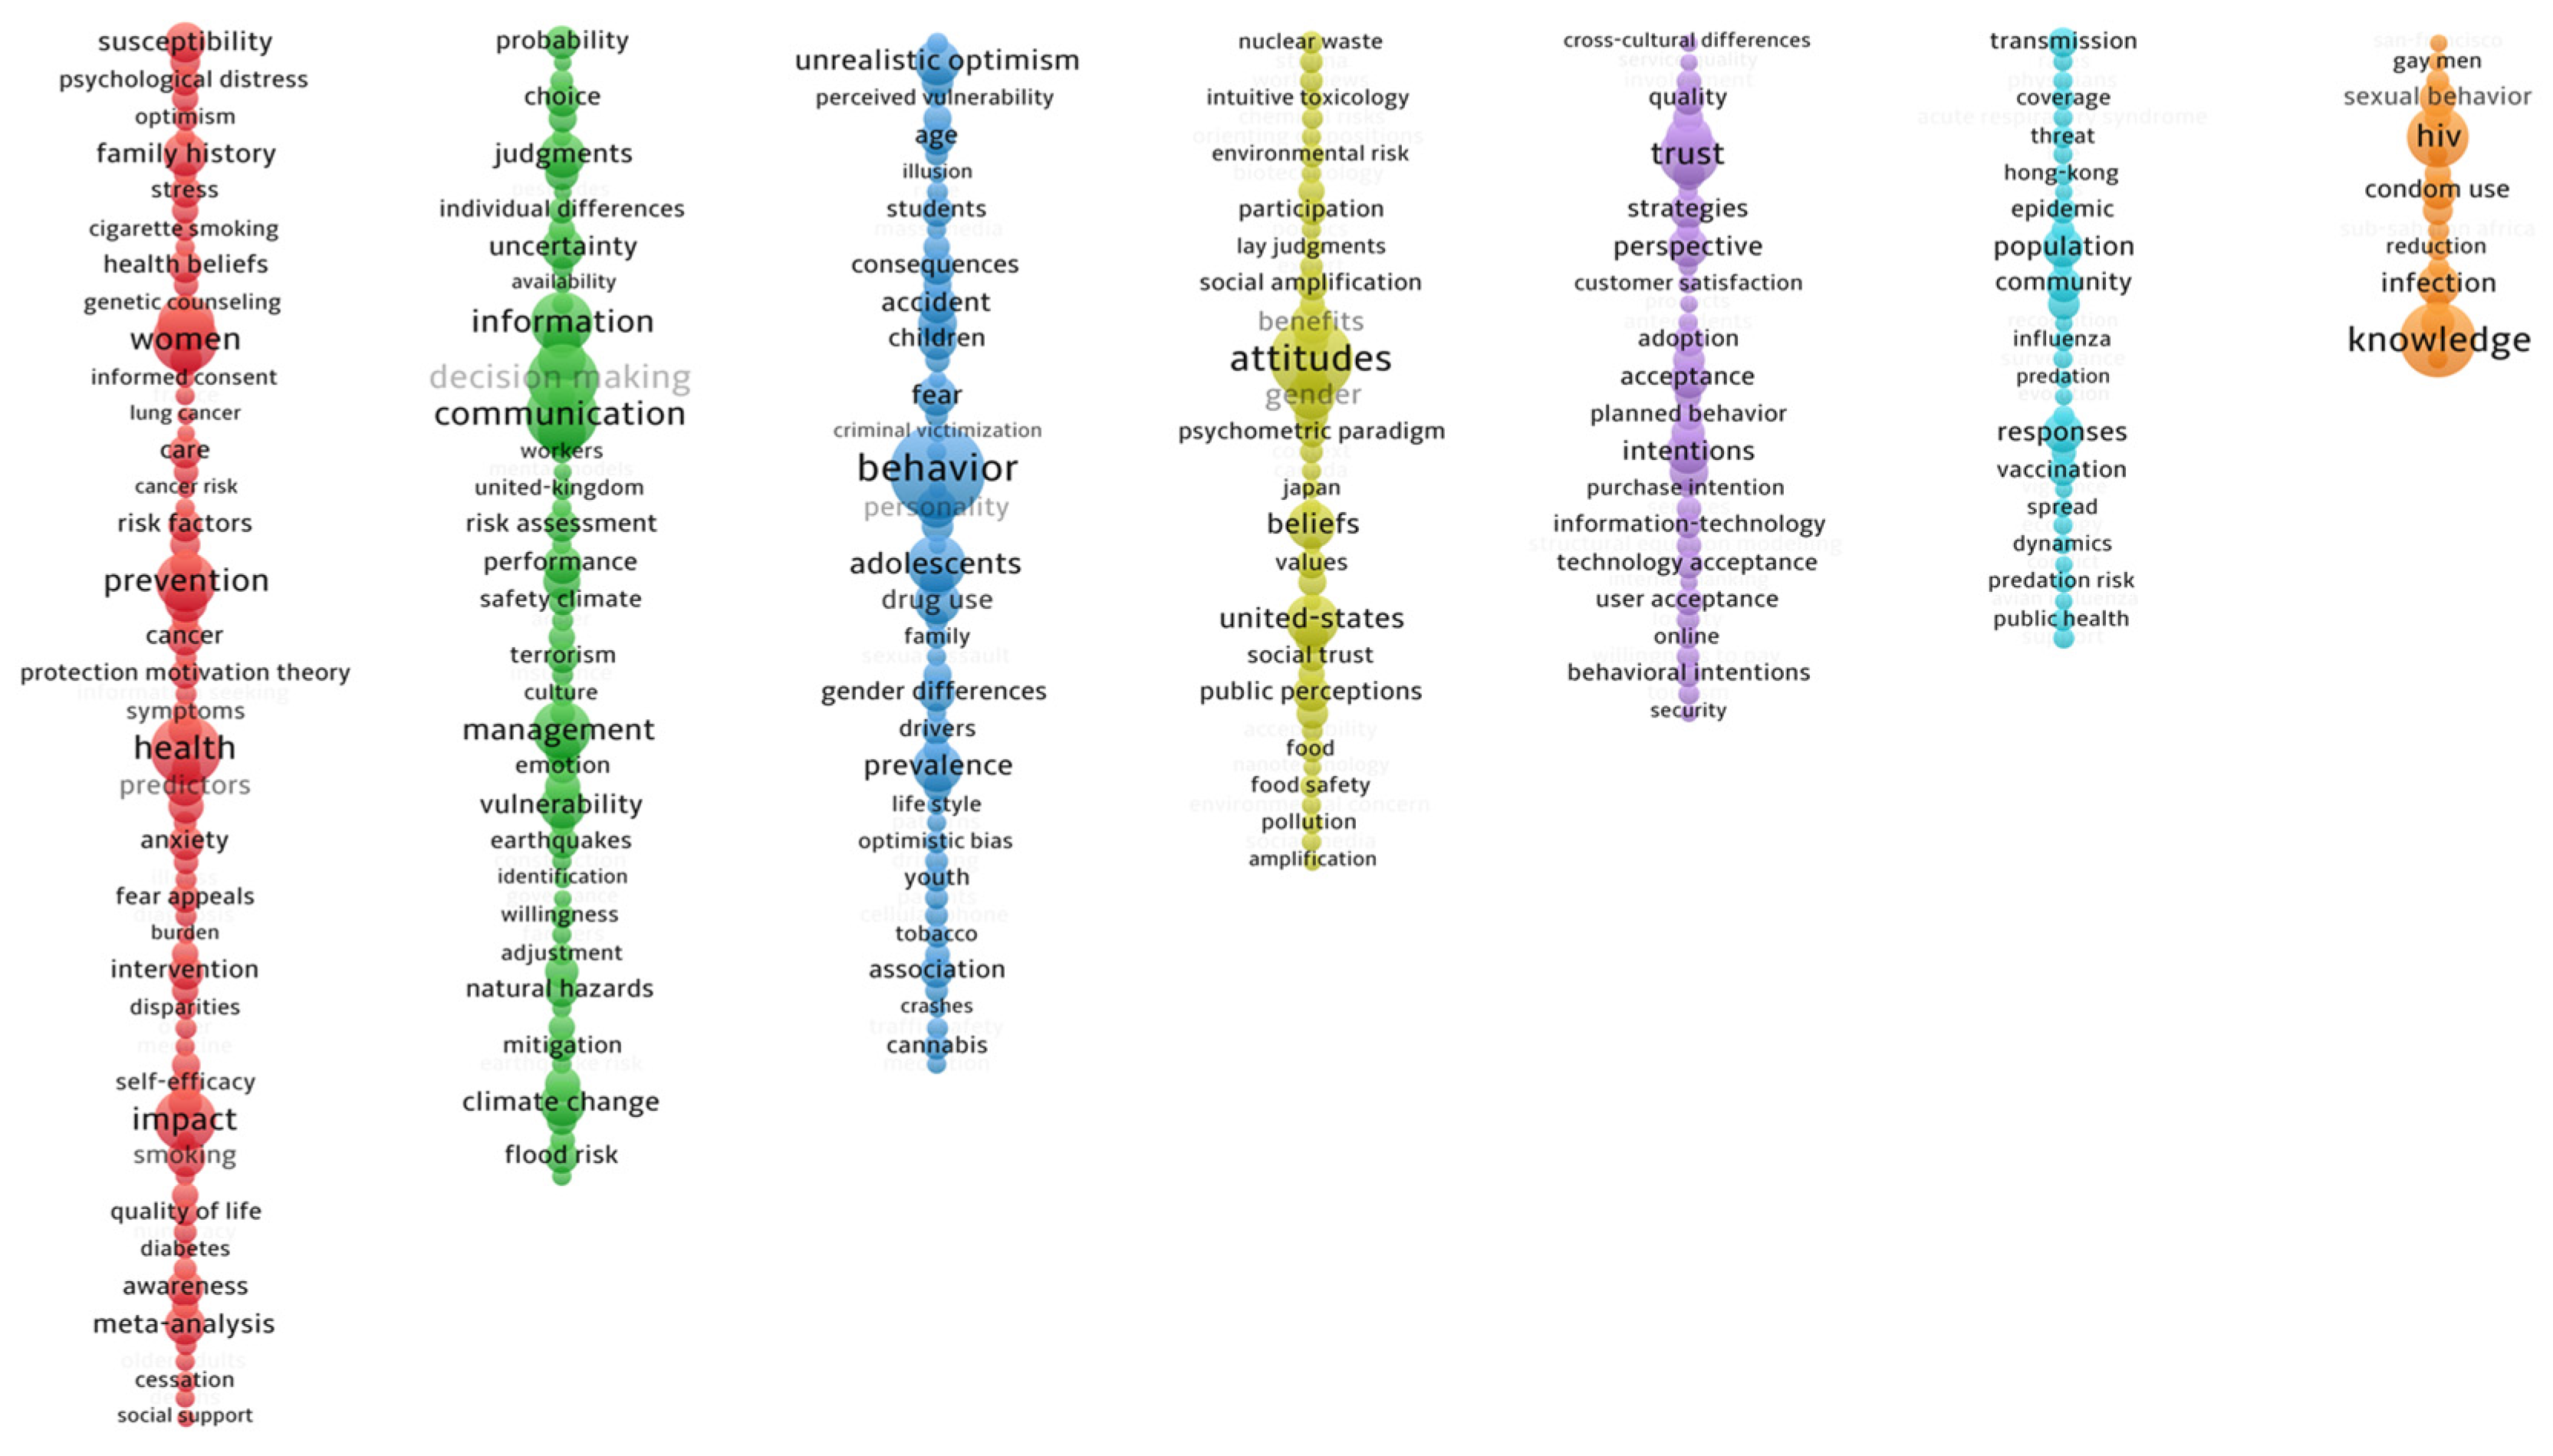
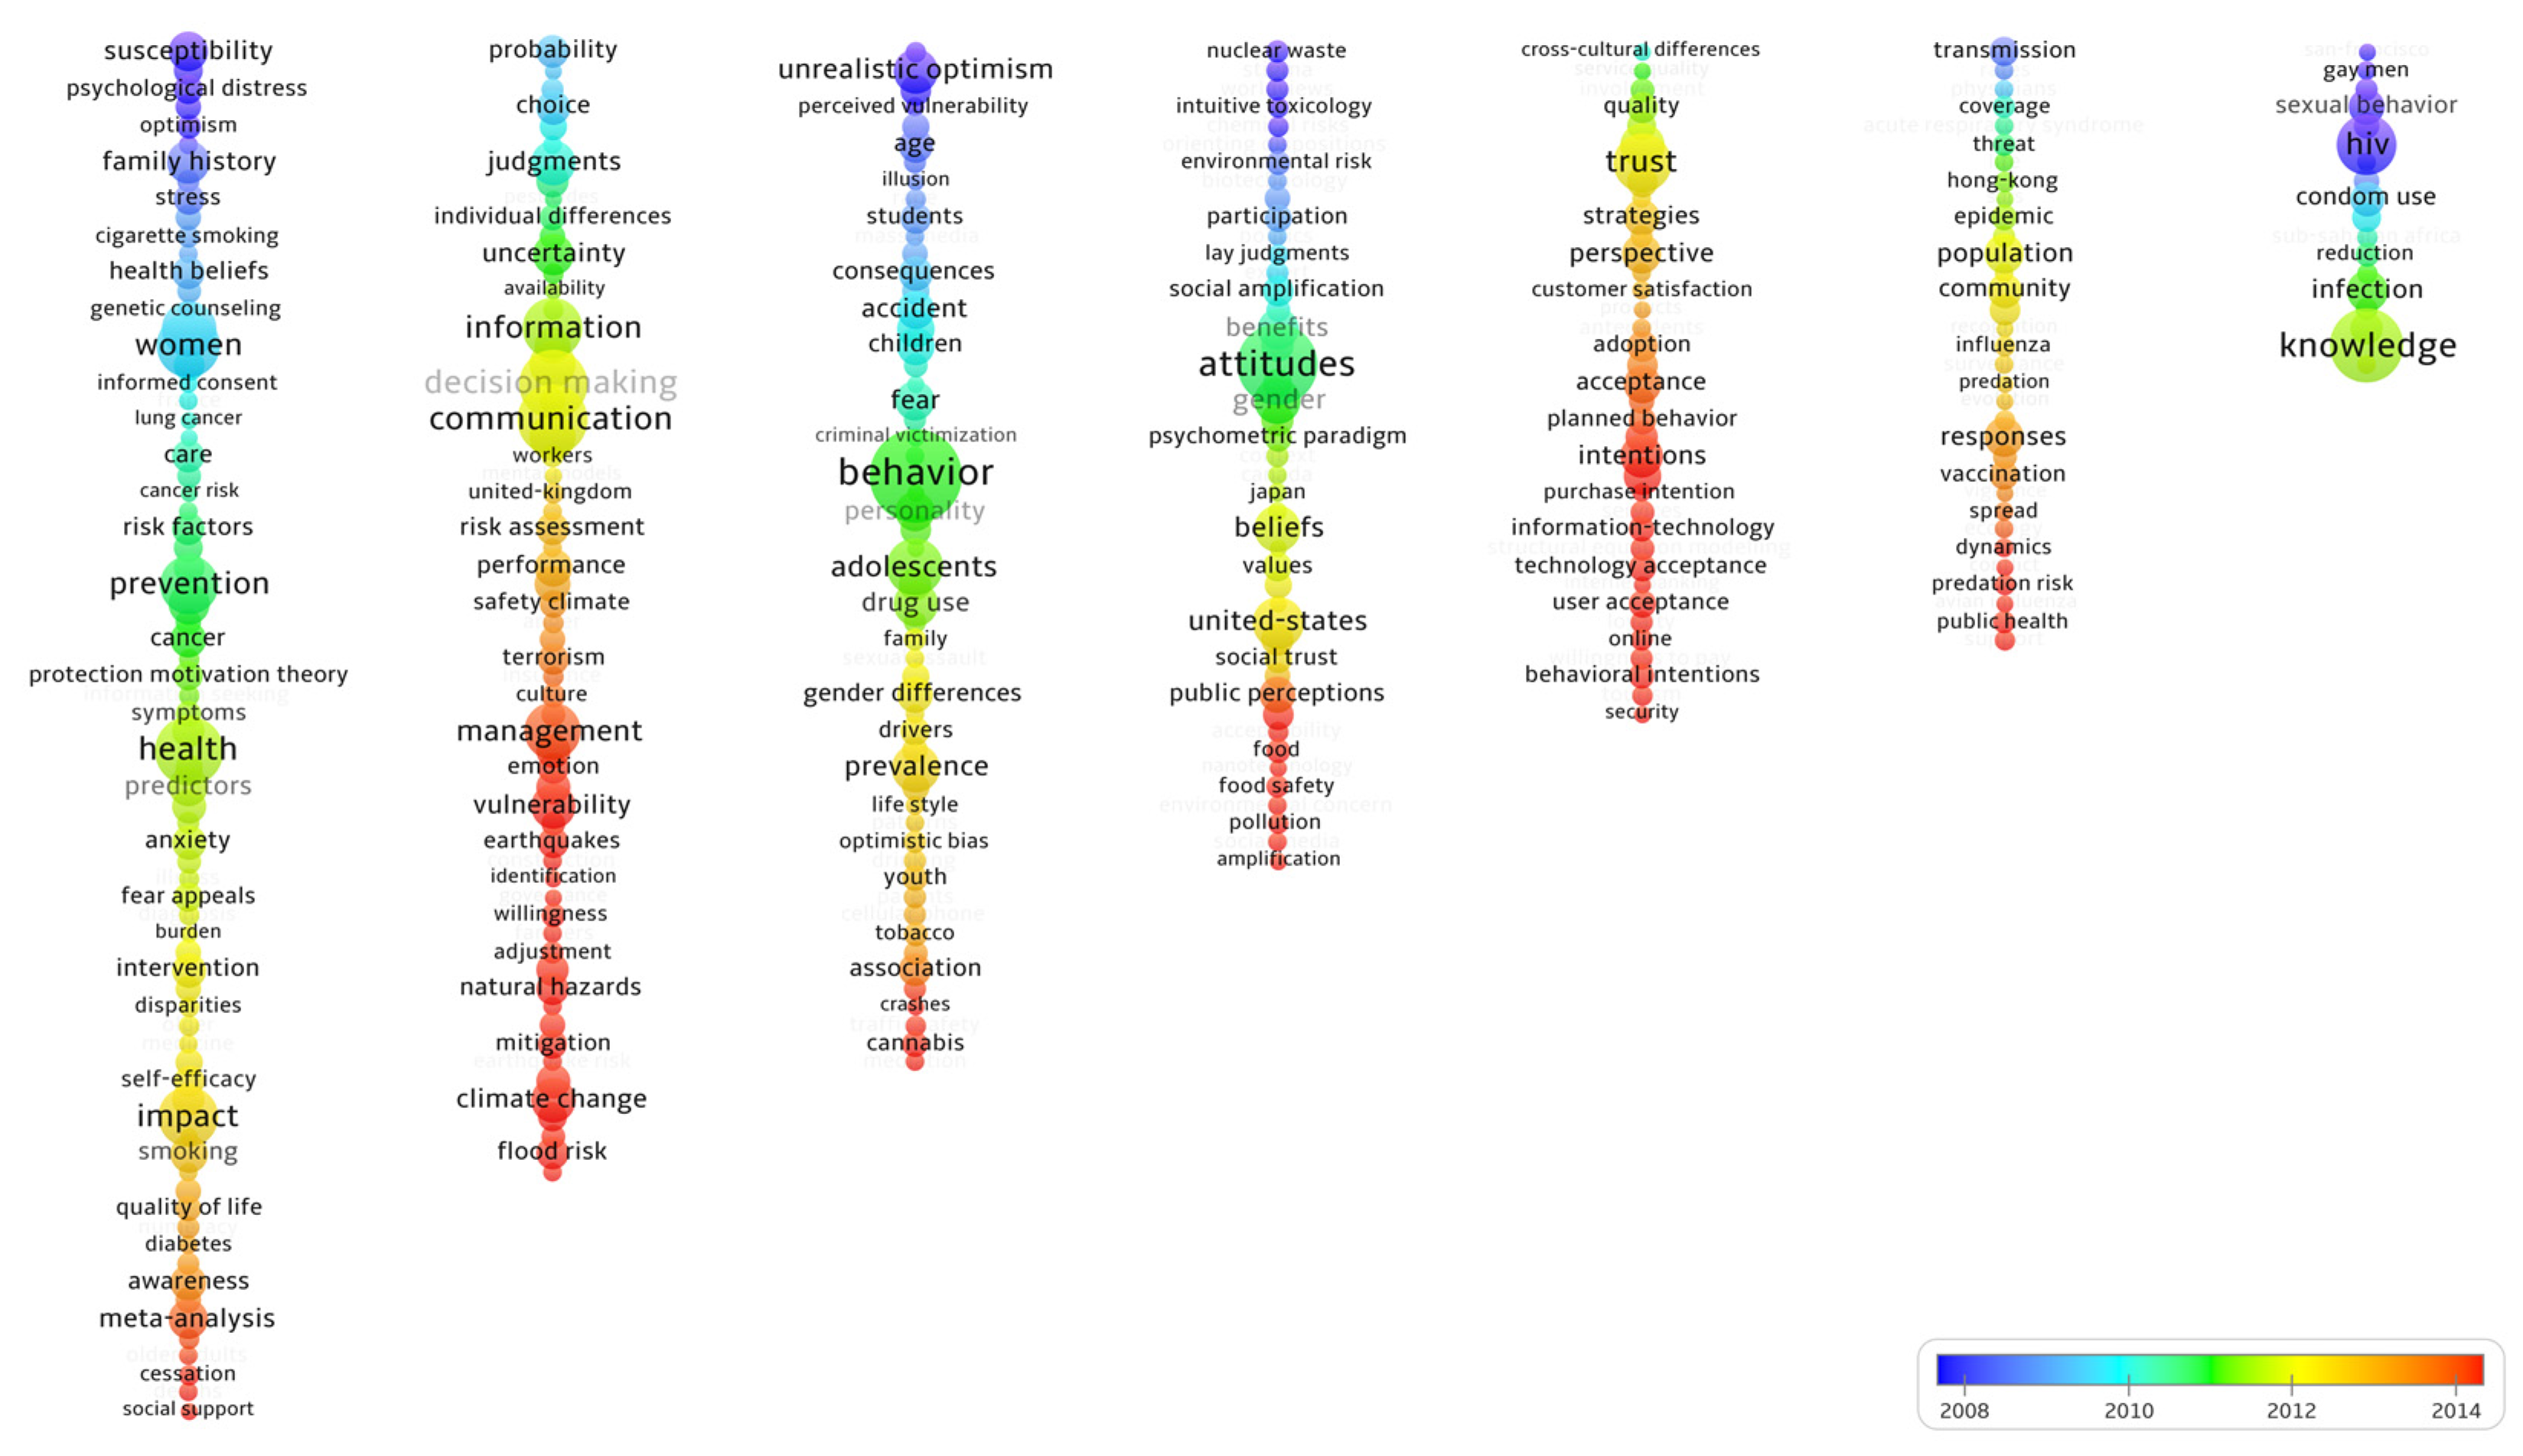
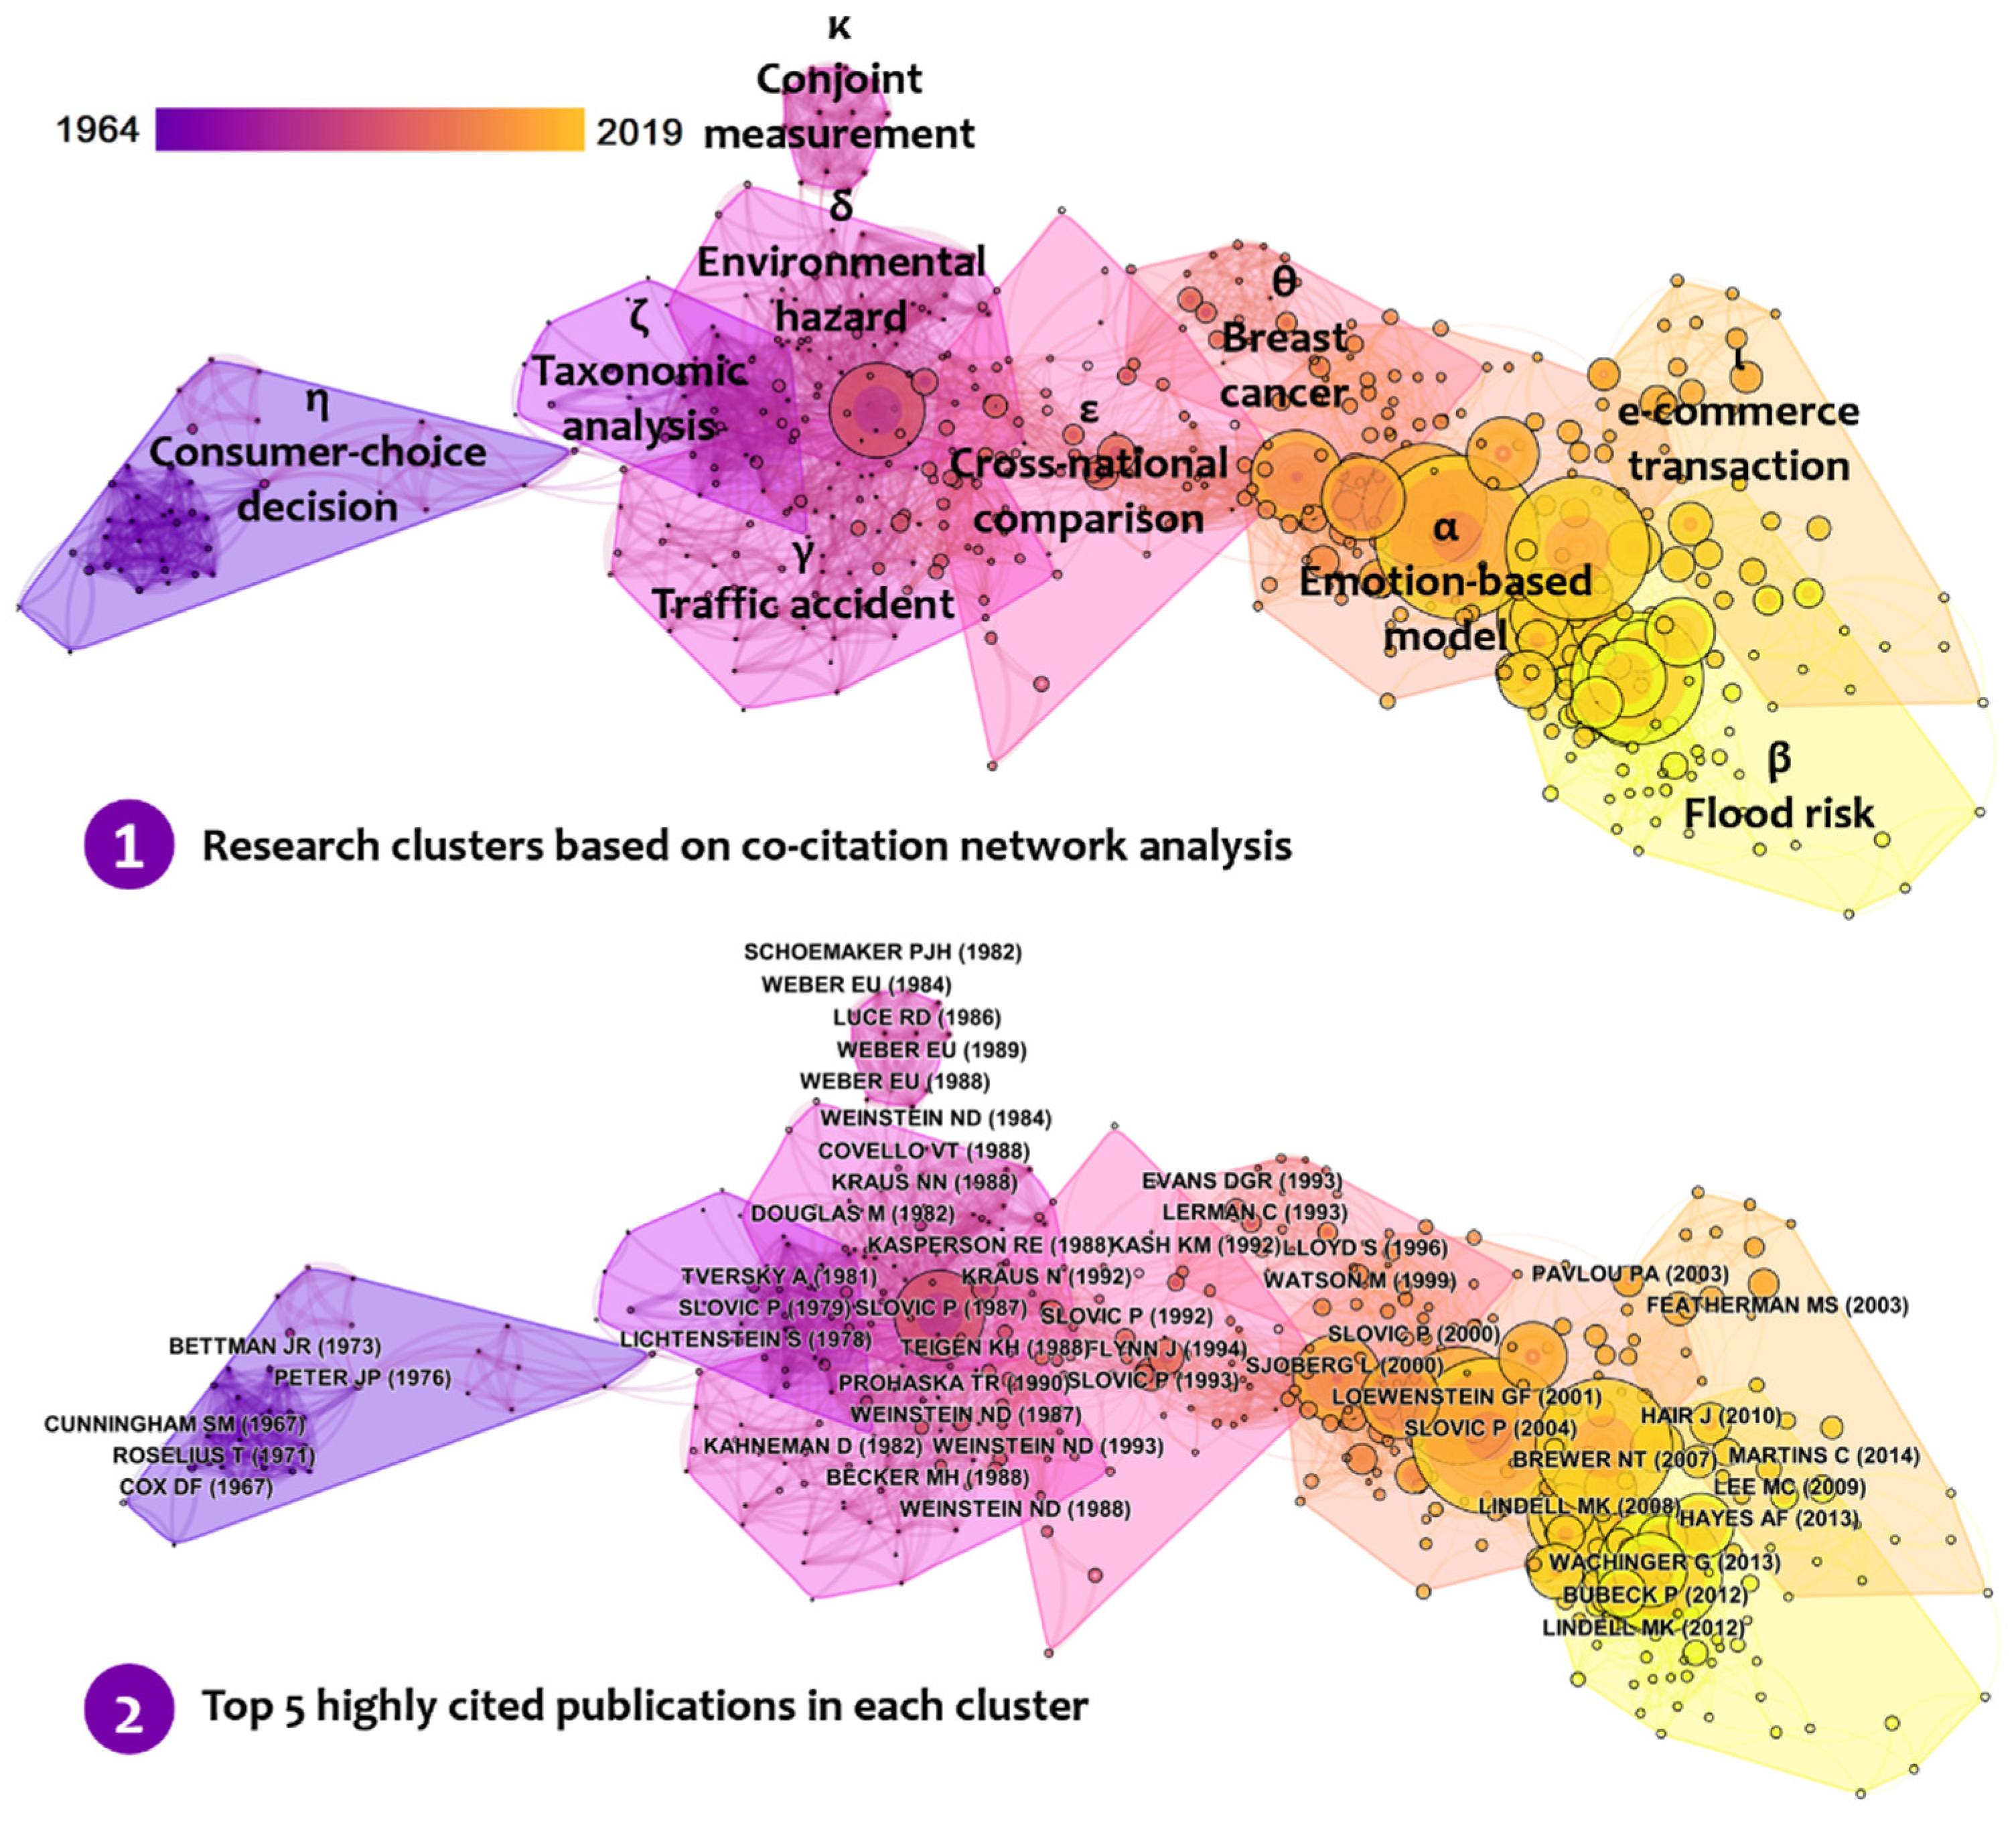
Table 1.
Descriptive information of the dataset on risk perception research.
| Description | Results |
|---|---|
| Number of documents | 2759 |
| Number of unique sources | 1184 |
| Number of unique ‘keywords plus’ | 4728 |
| Number of authors’ keywords | 5091 |
| Period covered | 1964–2019 |
| Average citations per document | 27.54 |
| Number of unique authors | 8521 |
| Number of author appearances | 10,133 |
| Number of authors of single-authored documents | 292 |
| Number of authors of multi-authored documents | 8229 |
| Number of single-authored documents | 335 |
| Average number of documents per author | 0.324 |
| Average number of authors per document | 3.09 |
| Average number of co-authors per document | 3.67 |
| Collaboration index | 3.39 |
| Number of journal articles | 2604 |
| Number of conference articles | 95 |
| Number of review articles | 60 |
Table 2.
Top 20 countries/regions in risk perception research: activity and research metrics.
| No. | Country/Region | Continent | NP | APY | AC |
|---|---|---|---|---|---|
| 1 | USA | N. America | 1033 | 2008.40 | 38.37 |
| 2 | UK | Europe | 291 | 2010.13 | 25.13 |
| 3 | China | Asia | 216 | 2015.56 | 8.96 |
| 4 | Australia | Oceania | 128 | 2012.32 | 23.96 |
| 5 | Canada | N. America | 123 | 2010.04 | 19.98 |
| 6 | Germany | Europe | 121 | 2012.12 | 20.07 |
| 7 | France | Europe | 114 | 2010.69 | 14.95 |
| 8 | The Netherlands | Europe | 95 | 2010.29 | 28.57 |
| 9 | Spain | Europe | 94 | 2013.13 | 12.68 |
| 10 | Italy | Europe | 84 | 2013.56 | 15.99 |
| 11 | South Korea | Asia | 70 | 2015.26 | 9.81 |
| 12 | Taiwan | Asia | 70 | 2012.57 | 34.44 |
| 13 | Norway | Europe | 65 | 2010.35 | 25.08 |
| 14 | Sweden | Europe | 65 | 2007.72 | 41.45 |
| 15 | Switzerland | Europe | 64 | 2009.92 | 27.00 |
| 16 | Brazil | S. America | 43 | 2011.74 | 10.74 |
| 17 | Japan | Asia | 43 | 2013.51 | 7.91 |
| 18 | Mexico | N. America | 35 | 2013.11 | 5.97 |
| 19 | Belgium | Europe | 27 | 2009.00 | 20.19 |
| 20 | Israel | Asia | 26 | 2011.92 | 18.96 |
Note: NP = number of publications; APY = average publication year; AC = average citations per article.
Table 3.
High productive categories in risk perception research (NP > 50).
| No. | Scientific Category | Cluster | NP | APY | AC |
|---|---|---|---|---|---|
| 1 | Public, Environmental & Occupational Health | 5 | 663 | 2008.46 | 29.97 |
| 2 | Environmental Sciences | 3 | 211 | 2011.98 | 18.78 |
| 3 | Psychology, Multidisciplinary | 5 | 179 | 2007.22 | 26.30 |
| 4 | Social Sciences, Interdisciplinary | 5 | 161 | 2010.31 | 25.82 |
| 5 | Mathematics, Interdisciplinary Applications | 4 | 131 | 2006.12 | 64.21 |
| 6 | Social Sciences, Mathematical Methods | 5 | 129 | 2005.78 | 65.64 |
| 7 | Business | 5 | 122 | 2004.26 | 60.03 |
| 8 | Environmental Studies | 5 | 99 | 2013.11 | 18.96 |
| 9 | Psychology, Clinical | 5 | 99 | 2009.47 | 33.18 |
| 10 | Transportation | 5 | 96 | 2010.82 | 24.81 |
| 11 | Oncology | 1 | 93 | 2007.56 | 31.05 |
| 12 | Social Sciences, Biomedical | 5 | 91 | 2007.15 | 34.43 |
| 13 | Economics | 5 | 88 | 2006.25 | 15.42 |
| 14 | Geosciences, Multidisciplinary | 3 | 83 | 2014.73 | 16.75 |
| 15 | Substance Abuse | 5 | 83 | 2010.39 | 15.41 |
| 16 | Management | 5 | 81 | 2007.98 | 36.56 |
| 17 | Water Resources | 3 | 81 | 2015.30 | 13.31 |
| 18 | Medicine, General & Internal | 1 | 78 | 2008.13 | 24.67 |
| 19 | Health Policy & Services | 5 | 77 | 2010.38 | 18.99 |
| 20 | Psychology, Applied | 5 | 76 | 2008.55 | 24.36 |
| 21 | Infectious Diseases | 1 | 73 | 2010.55 | 18.81 |
| 22 | Psychology, Social | 5 | 73 | 2005.37 | 37.07 |
| 23 | Meteorology & Atmospheric Sciences | 3 | 71 | 2015.44 | 27.79 |
| 24 | Ergonomics | 5 | 70 | 2007.91 | 43.10 |
| 25 | Nursing | 1 | 70 | 2011.43 | 13.24 |
| 26 | Engineering, Industrial | 4 | 67 | 2007.97 | 34.10 |
| 27 | Operations Research & Management Science | 4 | 62 | 2007.19 | 59.15 |
| 28 | Multidisciplinary Sciences | 1 | 60 | 2010.30 | 83.58 |
| 29 | Psychiatry | 5 | 59 | 2009.54 | 21.39 |
| 30 | Communication | 5 | 55 | 2012.56 | 20.13 |
| 31 | Psychology | 5 | 51 | 2006.22 | 45.45 |
Table 4.
Frequent keywords in risk perception research (≥50).
| No. | Keyword | Cluster | Occurrences | Avg. Pub. Year | No. | Keywords | Cluster | Occurrences | Avg. Pub. Year |
|---|---|---|---|---|---|---|---|---|---|
| 1 | meta-analysis | A | 63 | 2013.70 | 25 | prevalence | C | 93 | 2012.40 |
| 2 | awareness | A | 51 | 2013.25 | 26 | drug use | C | 80 | 2011.36 |
| 3 | smoking | A | 54 | 2012.61 | 27 | adolescents | C | 139 | 2011.28 |
| 4 | impact | A | 156 | 2012.40 | 28 | personality | C | 58 | 2011.16 |
| 5 | predictors | A | 58 | 2011.59 | 29 | behavior | C | 409 | 2011.02 |
| 6 | health | A | 208 | 2011.54 | 30 | fear | C | 62 | 2010.32 |
| 7 | exposure | A | 65 | 2010.85 | 31 | alcohol | C | 53 | 2010.08 |
| 8 | prevention | A | 149 | 2010.73 | 32 | children | C | 53 | 2010.08 |
| 9 | women | A | 179 | 2009.58 | 33 | accident | C | 57 | 2009.77 |
| 10 | breast cancer | A | 126 | 2009.52 | 34 | unrealistic optimism | C | 82 | 2006.93 |
| 11 | family history | A | 70 | 2008.59 | 35 | united states | D | 108 | 2012.22 |
| 12 | susceptibility | A | 61 | 2006.26 | 36 | beliefs | D | 89 | 2011.79 |
| 13 | climate change | B | 79 | 2015.80 | 37 | gender | D | 87 | 2011.00 |
| 14 | vulnerability | B | 76 | 2014.03 | 38 | attitudes | D | 298 | 2010.75 |
| 15 | management | B | 134 | 2013.76 | 39 | benefits | D | 64 | 2010.38 |
| 16 | performance | B | 54 | 2012.87 | 40 | e-commerce | E | 54 | 2014.04 |
| 17 | hazard | B | 85 | 2011.89 | 41 | intentions | E | 73 | 2013.90 |
| 18 | communication | B | 222 | 2011.87 | 42 | acceptance | E | 54 | 2013.57 |
| 19 | decision making | B | 205 | 2011.86 | 43 | perspective | E | 59 | 2012.81 |
| 20 | experience | B | 88 | 2011.82 | 44 | trust | E | 148 | 2012.13 |
| 21 | preferences | B | 51 | 2011.65 | 45 | determinants | E | 80 | 2011.75 |
| 22 | information | B | 156 | 2011.52 | 46 | responses | F | 58 | 2013.10 |
| 23 | uncertainty | B | 65 | 2011.09 | 47 | population | F | 61 | 2011.92 |
| 24 | judgments | B | 78 | 2010.17 | 48 | knowledge | G | 238 | 2011.49 |
| 49 | infection | G | 64 | 2011.14 | |||||
| 50 | hiv | G | 157 | 2007.99 | |||||
| 51 | sexual behavior | G | 50 | 2006.74 |
Table 5.
Top five largest clusters in risk perception based on co-citation analysis.
| ID | Size | Silhouette | Mean Year | LLR Title Terms | LLR Cited Sources | Selected Citing Paper |
|---|---|---|---|---|---|---|
| α | 79 | 0.686 | 2002 | Emotion-based model, technological Stigma; cognitive appraisal | Risk Analysis, Psychological Science, Health, Risk & Society | [61] |
| β | 77 | 0.899 | 2011 | Flood Risk, rural household, flood experience | Natural Hazards, Global Environmental Change, Journal of Environmental Management | [62] |
| γ | 74 | 0.837 | 1987 | Traffic accident, self-perceived risk, health-care workers reaction | American Journal of Public Health, Accident Analysis & Prevention, Risk Analysis | [63] |
| δ | 59 | 0.795 | 1986 | Environmental Hazard, superfund site, nuclear waste | Coastal Zone Management, Risk Analysis, Environmental Science & Technology | [64] |
| ε | 57 | 0.818 | 1993 | Cross-national comparison, Western Europe, different societal group | Risk Analysis, Journal of Cross-Cultural Psychology, RISK: Health, Safety & Environment | [19] |
Note: Size = number of publications in the cluster; mean year = the average publication year of the references in the cluster; LLR Title terms = terms in the title based on the Log-Likelihood Ratio; selected citing paper = papers which cited more papers from the cluster. The clusters of the document citation network are named based on the citing paper.
Table 6.
Top five highly cited references in the top five clusters according to Table 5.
Table 6.
Top five highly cited references in the top five clusters according to Table 5.
| Citations | Author | Year | Title | Source | Cluster | Reference |
|---|---|---|---|---|---|---|
| 68 | Slovic P | 2004 | Risk as Analysis and Risk as Feelings: Some Thoughts about Affect, Reason, Risk, and Rationality | Risk Analysis | α | [65] |
| 58 | Brewer NT | 2007 | Meta-analysis of the relationship between risk perception and health behavior: The example of vaccination | Health Psychology | α | [80] |
| 50 | Loewenstein GF | 2001 | Risk as feelings | Psychological Bulletin | α | [81] |
| 41 | Sjoberg L | 2000 | Factors in Risk Perception | Risk Analysis | α | [5] |
| 35 | Slovic P | 2000 | The Perception of Risk | Risk Analysis | α | [82] |
| 53 | Wachinger G | 2013 | The Risk Perception Paradox—Implications for Governance and Communication of Natural Hazards | Risk Analysis | β | [66] |
| 43 | Lindell MK | 2008 | Households’ Perceived Personal Risk and Responses in a Multihazard Environment | Risk Analysis | β | [67] |
| 32 | Bubeck P | 2012 | A Review of Risk Perceptions and Other Factors that Influence Flood Mitigation Behavior | Risk Analysis | β | [68] |
| 29 | Lindell MK | 2012 | The Protective Action Decision Model: Theoretical Modifications and Additional Evidence | Risk Analysis | β | [69] |
| 28 | Hayes AF | 2013 | Introduction to Mediation, Moderation, and Conditional Process Analysis: A Regression-based Approach | Risk Analysis | β | [83] |
| 12 | Weinstein ND | 1993 | Correct and incorrect interpretations of correlations between risk perceptions and risk behaviors | Health Psychology | γ | [70] |
| 12 | Weinstein ND | 1987 | Unrealistic optimism about susceptibility to health problems: Conclusions from a community-wide sample | Journal of Behavioral Medicine | γ | [72] |
| 10 | Becker MH | 1988 | AIDS and behavioral change to reduce risk: a review | American Journal of Public Health | γ | [73] |
| 10 | Prohaska TR | 1990 | Determinants of Self-Perceived Risk for AIDS | Journal of Health and Social Behavior | γ | [74] |
| 9 | Heimer CA | 1988 | Social structure, psychology, and the estimation of risk | Annual Review of Sociology | γ | [84] |
| 9 | Weinstein ND | 1988 | The precaution adoption process | Health Psychology | γ | [71] |
| 43 | Slovic P | 1987 | Perception of risk | Science | δ | [6] |
| 14 | Kasperson RE | 1988 | The Social Amplification of Risk: A Conceptual Framework | Risk Analysis | δ | [76] |
| 5 | Kraus NN | 1988 | Taxonomic Analysis of Perceived Risk: Modeling Individual and Group Perceptions Within Homogeneous Hazard Domains | Risk Analysis | δ | [75] |
| 4 | Weinstein ND | 1984 | Why it won’t happen to me: Perceptions of risk factors and susceptibility | Health Psychology | δ | [85] |
| 4 | Covello VT | 1988 | Risk Communication, Risk Statistics, and Risk Comparisons: A Manual for Plant Managers | Risk Analysis | δ | [86] |
| 20 | Flynn J | 1994 | Gender, Race, and Perception of Environmental Health Risks | Risk Analysis | ε | [77] |
| 18 | Slovic P | 1993 | Perceived Risk, Trust, and Democracy | Risk Analysis | ε | [78] |
| 16 | Kraus N | 1992 | Intuitive Toxicology: Expert and Lay Judgments of Chemical Risks | Risk Analysis | ε | [87] |
| 14 | Slovic P | 1992 | Perception of risk: Reflections on the psychometric paradigm | Social Theories of Risk | ε | [88] |
| 12 | Marris C | 1997 | Exploring the “Psychometric Paradigm”: Comparisons Between Aggregate and Individual Analyses | Risk Analysis | ε | [79] |
| 12 | Teigen KH | 1988 | Societal risks as seen by a Norwegian public | Journal of Behavioral Decision Making | ε | [89] |
Table 7.
Summary of the main findings in response to the research questions of Section 2.1.
Table 7.
Summary of the main findings in response to the research questions of Section 2.1.
| Question | Theme | Key Results |
|---|---|---|
| RQ1 | Publication trends | Low productivity between 1964 until ca. 1990, from then onwards exponential increase. |
| RQ2a | Geographic patterns | Publications originate mainly from western countries, with the USA, UK, Australia, Canada, and Germany leading contributors in terms of overall productivity. China is is the leading non-western country. |
| RQ2b | Temporal patterns | Sweden, USA, and Switzerland were dominant in earlier years of the research domain. China, South Korea, and Italy are more recently active. Research from Sweden and the USA are most highly impactful. |
| RQ3 | Scientific categories | Most research originates from the ‘Public, environmental & occupational health’, ‘Environmental sciences’, and ‘Psychology, multidisciplinary’ categories. |
| RQ4 | Thematic keyword clusters | Keywords are clustered in ‘Medical issues and health’, ‘Natural hazards and major disasters’, ‘Traffic accidents’, ‘Technological and industrial risks’, ‘Consumer trust and acceptance’, ‘Epidemiology and public health’, and ‘Human Immunodeficiency Virus’. |
| RQ5 | Temporal evolution of keywords | Across the thematic clusters, recent keywords are ‘climate change’, ‘e-commerce’, ‘vulnerability’, ‘intentions’, ‘management’, ‘acceptance’, ‘meta-analysis’, and ‘awareness’. |
| RQ6 | Co-citation clusters | The largest co-citation clusters are ‘Emotion-based model’, ‘Flood risk’, ‘Traffic accidents’, ‘Environmental hazard’, and ‘Cross-national comparison’, with ‘Flood risk’, and ‘e-commerce transaction’ the two most recent ones. |
| RQ7 | Key documents | The top five highly cited references in the largest co-citation clusters are listed in Table 6. |
Publisher’s Note: MDPI stays neutral with regard to jurisdictional claims in published maps and institutional affiliations. |
© 2021 by the authors. Licensee MDPI, Basel, Switzerland. This article is an open access article distributed under the terms and conditions of the Creative Commons Attribution (CC BY) license (https://creativecommons.org/licenses/by/4.0/).
Share and Cite
MDPI and ACS Style
Goerlandt, F.; Li, J.; Reniers, G. The Landscape of Risk Perception Research: A Scientometric Analysis. Sustainability 2021, 13, 13188. https://doi.org/10.3390/su132313188
AMA Style
Goerlandt F, Li J, Reniers G. The Landscape of Risk Perception Research: A Scientometric Analysis. Sustainability. 2021; 13(23):13188. https://doi.org/10.3390/su132313188
Chicago/Turabian StyleGoerlandt, Floris, Jie Li, and Genserik Reniers. 2021. "The Landscape of Risk Perception Research: A Scientometric Analysis" Sustainability 13, no. 23: 13188. https://doi.org/10.3390/su132313188
Note that from the first issue of 2016, this journal uses article numbers instead of page numbers. See further details here.