Article

Post-Treatment of Palm Oil Mill Effluent Using Immobilised Green Microalgae Chlorococcum oleofaciens

1
School of Industrial Technology, Universiti Sains Malaysia, Gelugor 11800, Malaysia
2
School of Biological Sciences, Universiti Sains Malaysia, Gelugor 11800, Malaysia
3
Chemistry Department, College of Science, King Saud University, Riyadh 11451, Saudi Arabia
4
Department of Biological and Chemical Engineering, Aarhus University, Nørrebrogade 44, 8000 Aarhus, Denmark
*
Authors to whom correspondence should be addressed.
Sustainability 2021, 13(21), 11562; https://doi.org/10.3390/su132111562
Submission received: 5 August 2021 / Revised: 17 October 2021 / Accepted: 18 October 2021 / Published: 20 October 2021

Abstract

:
Microalgae immobilisation can be a long-term solution for effective wastewater post-treatment. This study was conducted to evaluate the ability of immobilised Chlorococcum oleofaciens to remove contaminants from palm oil mill effluent (POME) until it complies with the POME discharge standard. First, the native dominating green microalga was isolated from a polishing POME treatment pond. Then, the microalgae cells were immobilised on sodium alginate beads and cultivated in a lab-scale-treated POME to treat it further. The immobilised microalgae cells demonstrated a high removal of total phosphorus, total nitrogen, ammonia nitrogen, and soluble chemical oxygen demand with 90.43%, 93.51%, 91.26%, and 50.72% of reduction, respectively. Furthermore, the growth rate of the microalgae fitted nicely with the Verhulst logistical model with r2 of more than 0.99, indicating the model’s suitability in modelling the growth. Thus, we concluded that the species can be used for post-treatment of effluents to remove TP, TN, and ammonia nitrogen from palm oil mills until it complies with the POME effluent discharge standard. However, during the process, degradation of the beads occurred and the COD value increased. Therefore, it is not suitable to be used for COD removal.

1. Introduction

The palm oil industry’s contribution to Malaysia’s economic growth and rapid development has widely been acknowledged. This industry is rapidly expanding, and Malaysia is the world’s second-largest palm oil producer. Unfortunately, the large amounts of byproducts generated during the oil extraction process have contributed to environmental pollution [1]. The wastewater generated by the palm oil extraction process is known as palm oil mill effluent (POME). Total solids (40,500 mg/L), oil and grease (4000 mg/L), chemical oxygen demand (50,000 mg/L), biological oxygen demand (BOD3) (25,000 mg/L), total nitrogen (TN) (1400 mg/L), and total phosphorus (TP) (150 mg/L) are all present in large concentrations [2]. According to the Malaysian Department of Environment, POME must follow regulatory requirements for BOD (20 mg/L), COD (1000 mg/L), total solid (1500 mg/L), suspended solid (400 mg/L), oil and grease (50 mg/L), and total nitrogen (50 mg/L) before being released into the environment [3]. However, some of these values are often exceeded in the POME discharged into the environment. For example, the COD of POME from Sembilan, Malaysia, was 3250 mg/L [4]. The non-compliance may well be why the discharge limit for COD and TSS was removed in 1982 [3]. Similarly, the COD of POME from Gampong Ujong Lamie, Acheh, Indonesia, was 4177 mg/L exceeding the country’s 350 mg/L regulatory discharge limit by more than tenfold [5]. Therefore, there is a need to treat the POME further before releasing it to the environment.
The ponding treatment system, which consists of anaerobic, aerobic, and facultative ponds, is widely used in POME treatment. Because of its ability to handle large quantities of POME with low operating costs, this treatment method is used by around 85% of palm oil mills in Malaysia [6]. However, this treatment system will lead to greenhouse gas emissions, especially the methane gas that causes global warming. In addition, the characteristics of the handled POME using this treatment method do not always follow the requirements of the Malaysian Department of Environment’s industrial discharge standard [7]. Therefore, there is a need to improvise the current treatment methods.
Many researchers have recently shifted their focus to wastewater reuse to protect the environment and produce renewable resources such as food, fuel, and feed. Microalgae are thought to be a promising post-treatment option for agro-industrial wastewater because of their ability to use nutrients for growth [8]. While doing so, they could reduce environmental pollution significantly [9]. Value-added compounds can also be extracted from the microalgae, but the extraction method is crucial to determine the quality of the compound [10].
POME has been reported in several studies to have the potential to promote the growth of microalgae because it contains sufficient nutrients, especially TN, TP, and other organic matters [11]. POME has been successfully used to cultivate Chlamydomonas sp. [11], Chlorella sorokiniana [12], Botryococcus brauni [13], and a mixed culture of microalgae [14]. However, Kayombo et al., in 2003, reported that a higher concentration of POME would inhibit microalgae growth due to its biotic and abiotic factors. In addition, the micro-size of microalgae cells adds to the treatment process’s difficulty. Therefore, before processed POME is discharged into waterways, microalgae must be harvested. Otherwise, eutrophication, another environmental problem, would occur [15]. One of the difficulties that many researchers face is the isolation or harvesting of microalgae from treated wastewater. Harvesting methods such as flocculation, centrifugation, and filtration have been successful at a laboratory scale, but they require expensive equipment [16]. Immobilisation creates a protective microenvironment for rapid cell development and enables easier harvesting compared to the free-living cells. Various microalgae cells have been successfully immobilised in natural polysaccharide gels or synthetic polymers, enhancing biomass stability and productivity. For example, calcium alginate is one of the most frequently used methods to trap microalgal cells because it does not need heating and is non-toxic [17]. In this research, a dominant native green microalga strain was isolated from a polishing pond of a POME treatment. The strain was used to further treat POME on a laboratory scale. The microalgae cells were immobilised with calcium alginate to study the effects of nutrient load and light penetration on microalgal growth and nutrient removal.

2. Materials and Methods

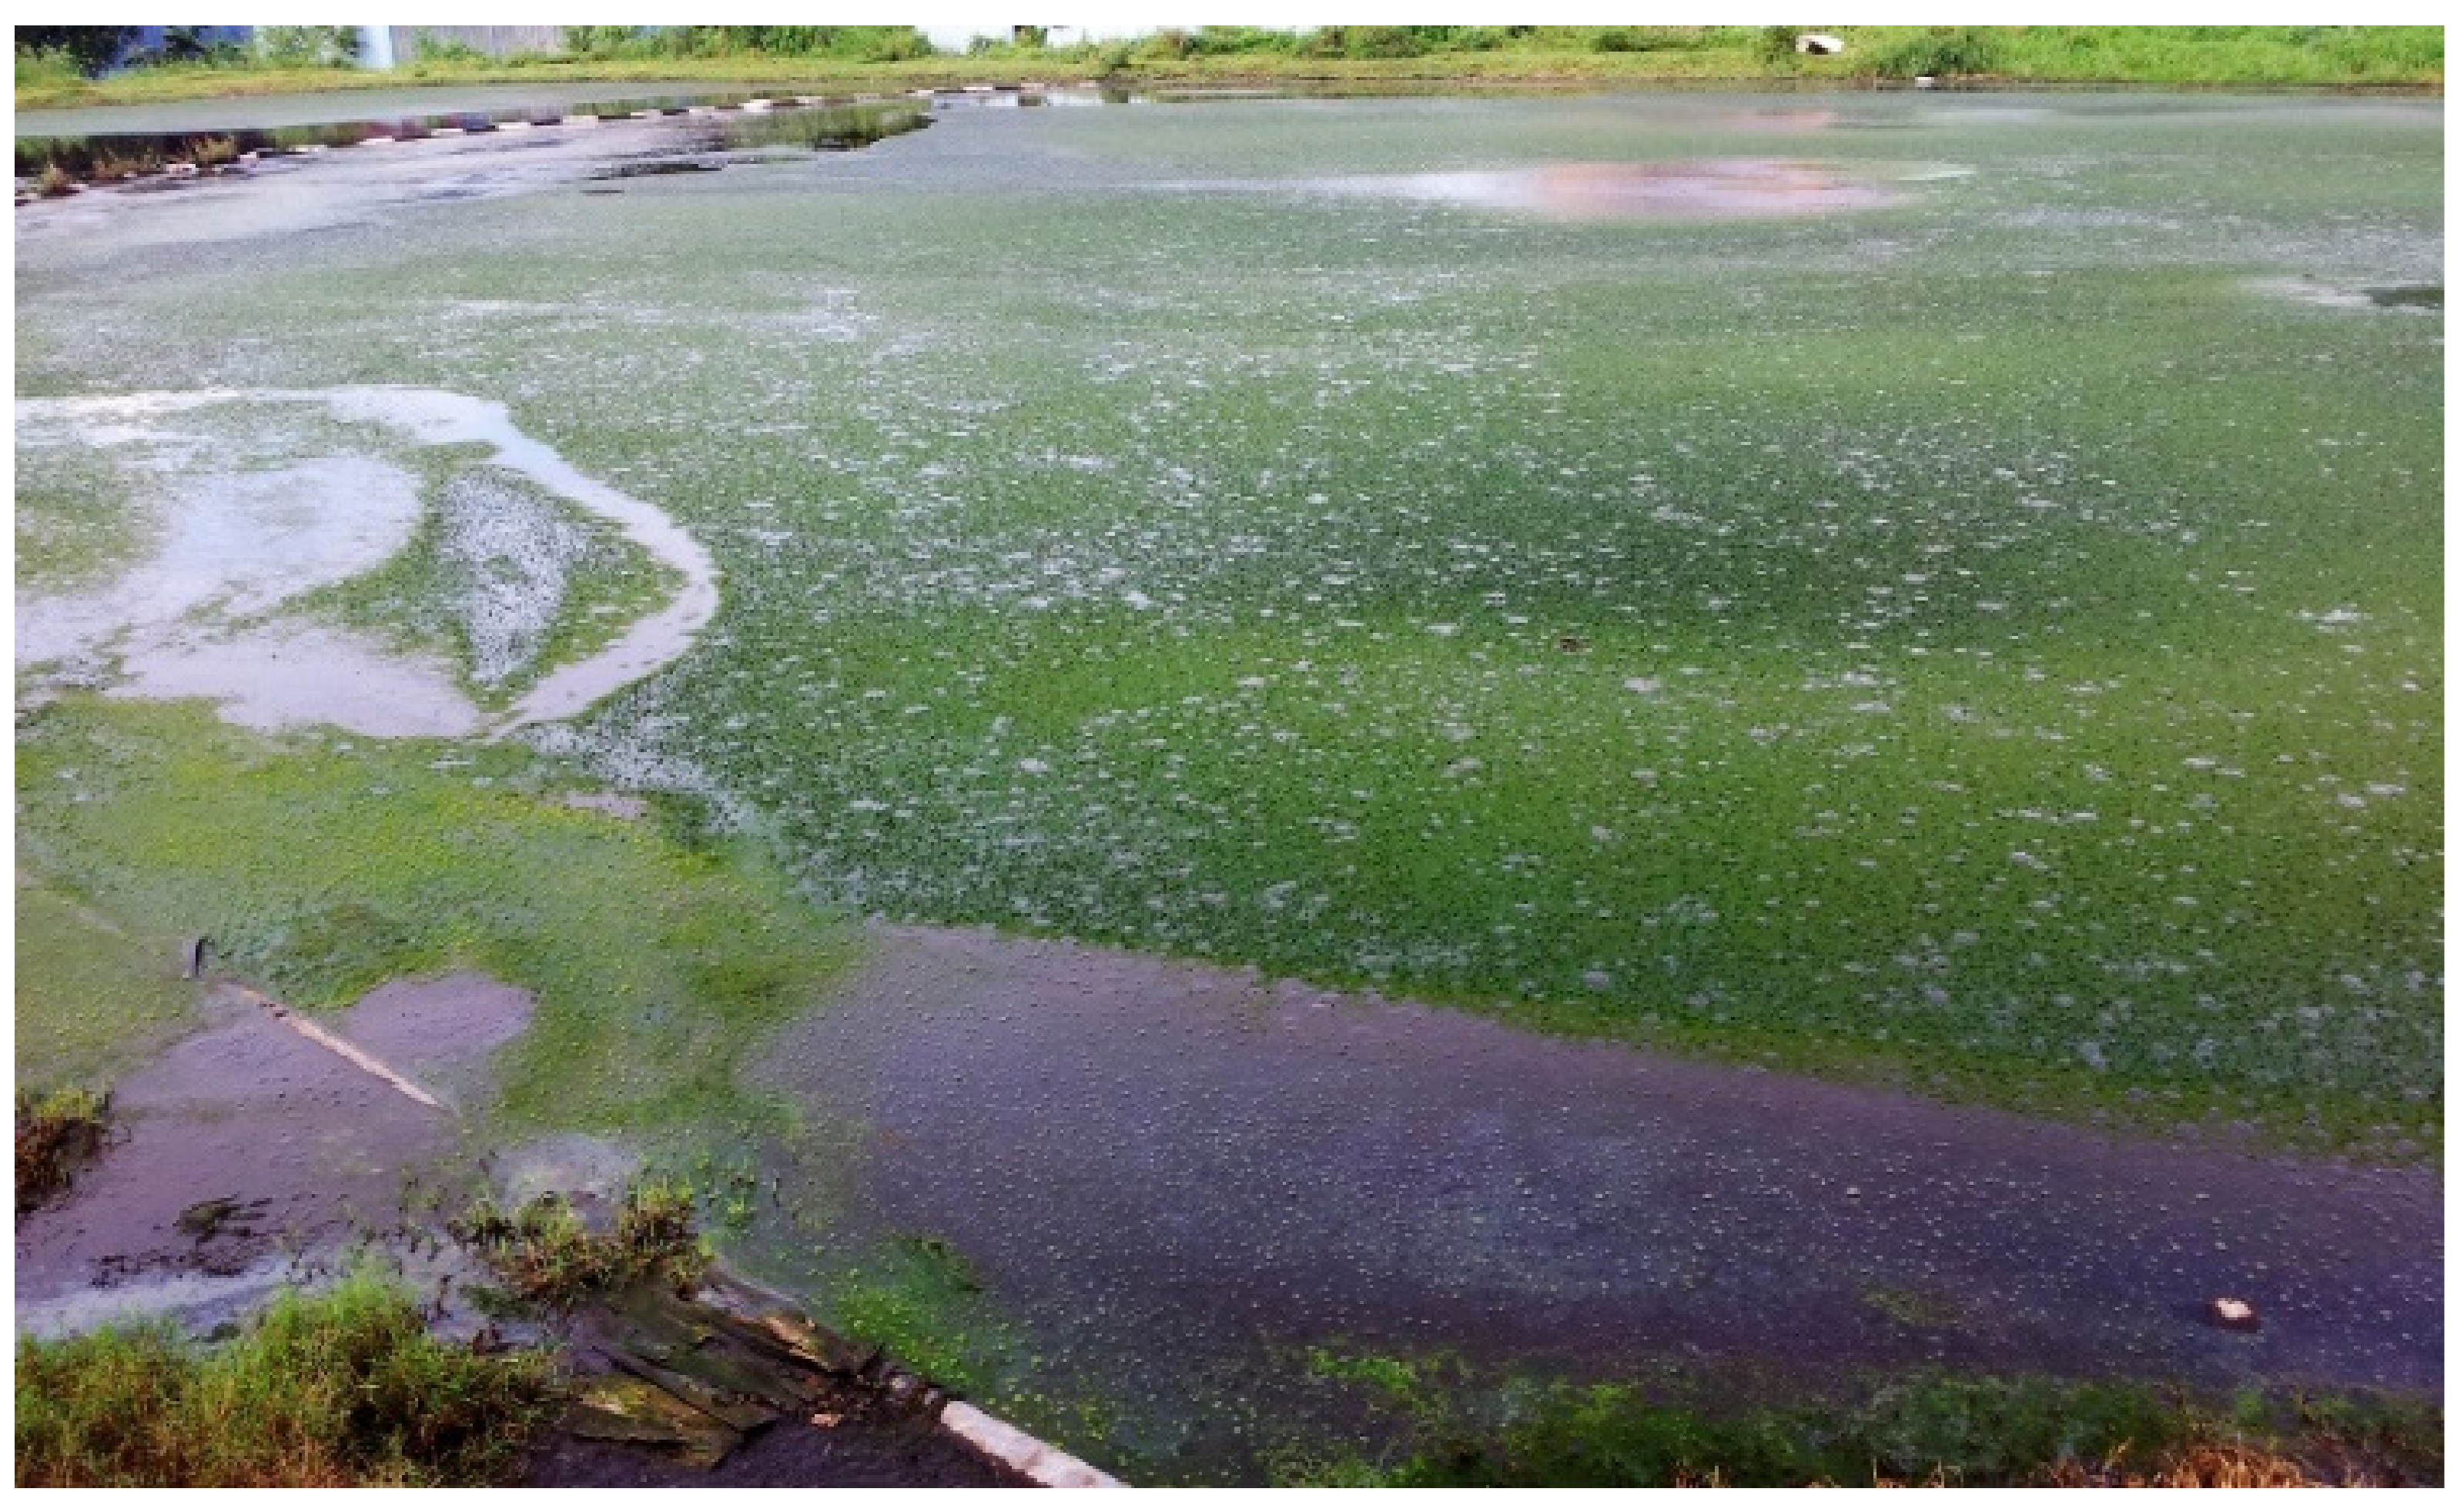
2.1. Sampling of POME

The raw POME samples were obtained from a palm oil mill holding tank at Nibong Tebal, Pulau Pinang, Malaysia (GPS coordinate: 5°12′33.7″ N, 100°29′01.1″ E), just before it was discharged into a cooling pond. Sample collection was conducted using high-density polyethylene (HDPE) containers with a capacity of 25 L. All POME samples were kept in a refrigerator at 4 °C to reduce microbial activities. The raw POME collected was pre-treated using two stages of lab-scale treatment: anaerobic and aerobic processes with 50 and 16 days hydraulic retention times (HRTs), respectively. In this analysis, the lab-scale-treated POME (LABT-POME) was used to ensure that the physiochemical characteristics of the POME sample did not change significantly during the experiment.

2.2. Algae Culture Media

Throughout the study, microalgae were grown and cultured using Bold’s Basal Medium (BBM). The BBM compositions are shown in Table 1.

2.3. Isolation and Cultivation of Green Microalgae

The native green microalgae were isolated from the POME treated in a palm oil mill ponding system (POMST-POME). The sampling site was a polishing pond, as illustrated in Figure 1. The POMST-POME sample was first examined using a Nikon Eclipse E200 light microscope to ensure the presence of microalgae. A total of 50 mL of POMST-POME was added into 250 mL Erlenmeyer flasks before 50 mL of sterilised liquid BBM was added to each flask. All samples were incubated for 14 days at 35 ± 3 °C with continuous agitation at 100 rpm and 32.4 ± 2.7 μmol.m−2s−1 illuminations. The visible green microalgae cells were withdrawn from each flask, diluted into different series dilutions, and then spread onto the BBM agar plates. These agar plate samples were cultivated under the same condition for another 14 days. Every agar plate with a single colony was examined under a light microscope before the colony was streaked onto a new agar plate for another 14 days of cultivation. This process was repeated several times until a single microalgae species was isolated. Then, the single species of green microalgae was transferred and grown into a liquid BBM at the same cultivation condition. The green microalgae were sub-cultured into a new fresh liquid BBM monthly to maintain the culture.

2.4. Morphological Identification of Microalgae

A light microscope with a magnification of 40× was used to examine the morphology of the isolated green microalgae. Cellular shape, scale, flagella, and other visible characteristics of green microalgae cells were reported and compared with the guidebook [18]. In addition, scanning electron microscopy (SEM) was performed to validate the microalgae cells’ three-dimensional shape and scale. Before being examined with SEM, the sample cells were dried and fixed using hexamethyldisilazane (HMDS).

Microalgae Sample Processing Using HMDS Method

Each 1 mL green microalgae cell was withdrawn from a stock culture and centrifuged at 4032 rcf for 15 min. The supernatant of each sample was discarded. The pellet cells were fixed with the McDowell–Trump reagent, prepared in 0.1 M of phosphate buffer, for 24 h. After 24 h, each sample was washed with 0.1 M of phosphate buffer twice by centrifuging and resuspension. The sample was then post-fixed in 1% of Osmium tetraoxide for 1 h. After that, each sample was washed with distilled water, centrifuged, and resuspended twice [19].
After the fixation process, all samples underwent a dehydration process by immersing each sample in ethanol at the concentrations of 50%, 75%, 95%, and 100%, respectively. Each dehydration process was carried out by centrifugation and resuspension of the samples. The reaction time for each procedure was 10 min. In the last step, each sample was immersed in hexamethyldisilazane (HMDS) for another 10 min. Finally, HMDS was decanted from the samples, and the samples were air-dried in a desiccator at ambient temperature for one day. Each of the sample cells was coated with gold and examined under SEM [19].

2.5. Molecular Identification of Algal Strain

One millilitre of green microalgae was taken from each stock culture and centrifuged for two minutes at 11,200 rcf. The supernatant of the green microalgae sample was discarded entirely, and the suspended biomass of the green microalgae was used in the molecular identification process. The genomic DNA from the green microalgae cultures was extracted using Plant DNA Extraction Kits (Vivantis Technologies, Malaysia). The procedures of the extraction works were conducted according to the manufacturer’s handbook. The target sequences from the extracted DNA samples were amplified by polymerase chain reaction (PCR). The target genes were amplified with different primers and PCR protocols, as listed in Table 2. The PCR was performed using an Eppendorf Mastercycler® ep, Germany. The sequencing of purified PCR product was carried out by the Centre for Chemical Biology, University Sains Malaysia. The Basic Local Alignment Search Tool (BLAST) was used to analyse the 18S rRNA sequences. The sequence similarities were compared to the available database from the National Center for Biological Information (NCBI).

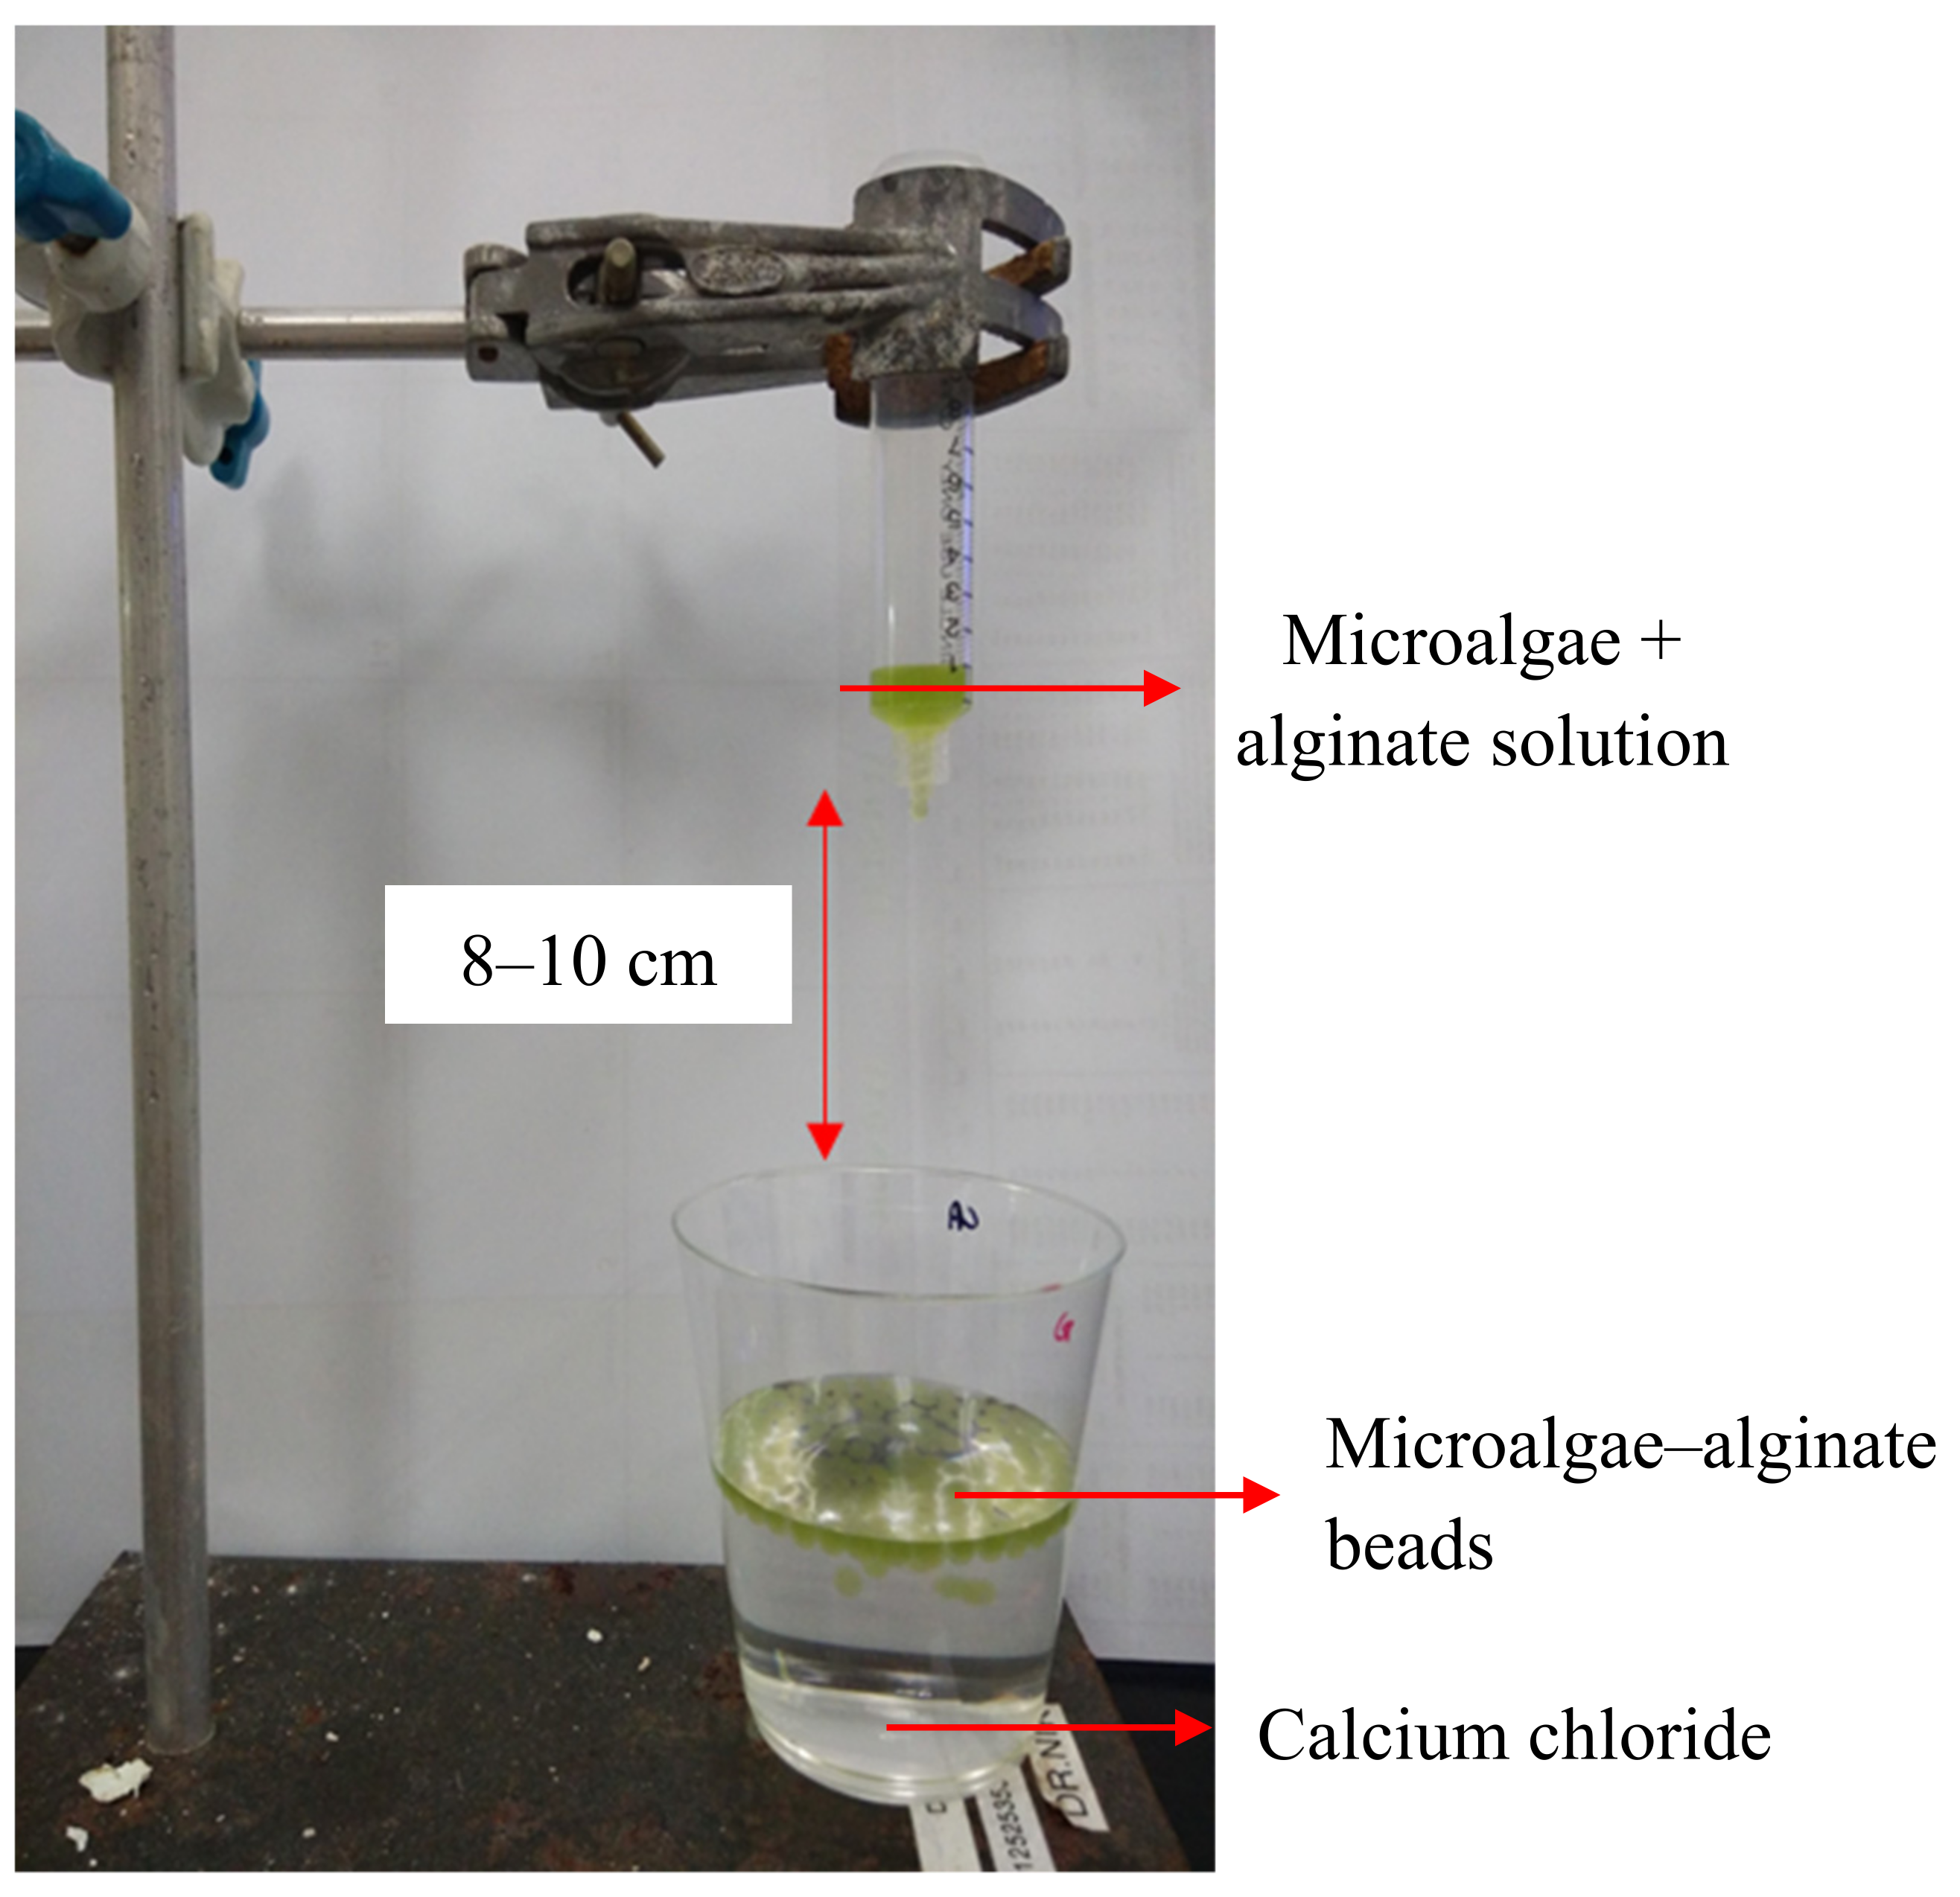
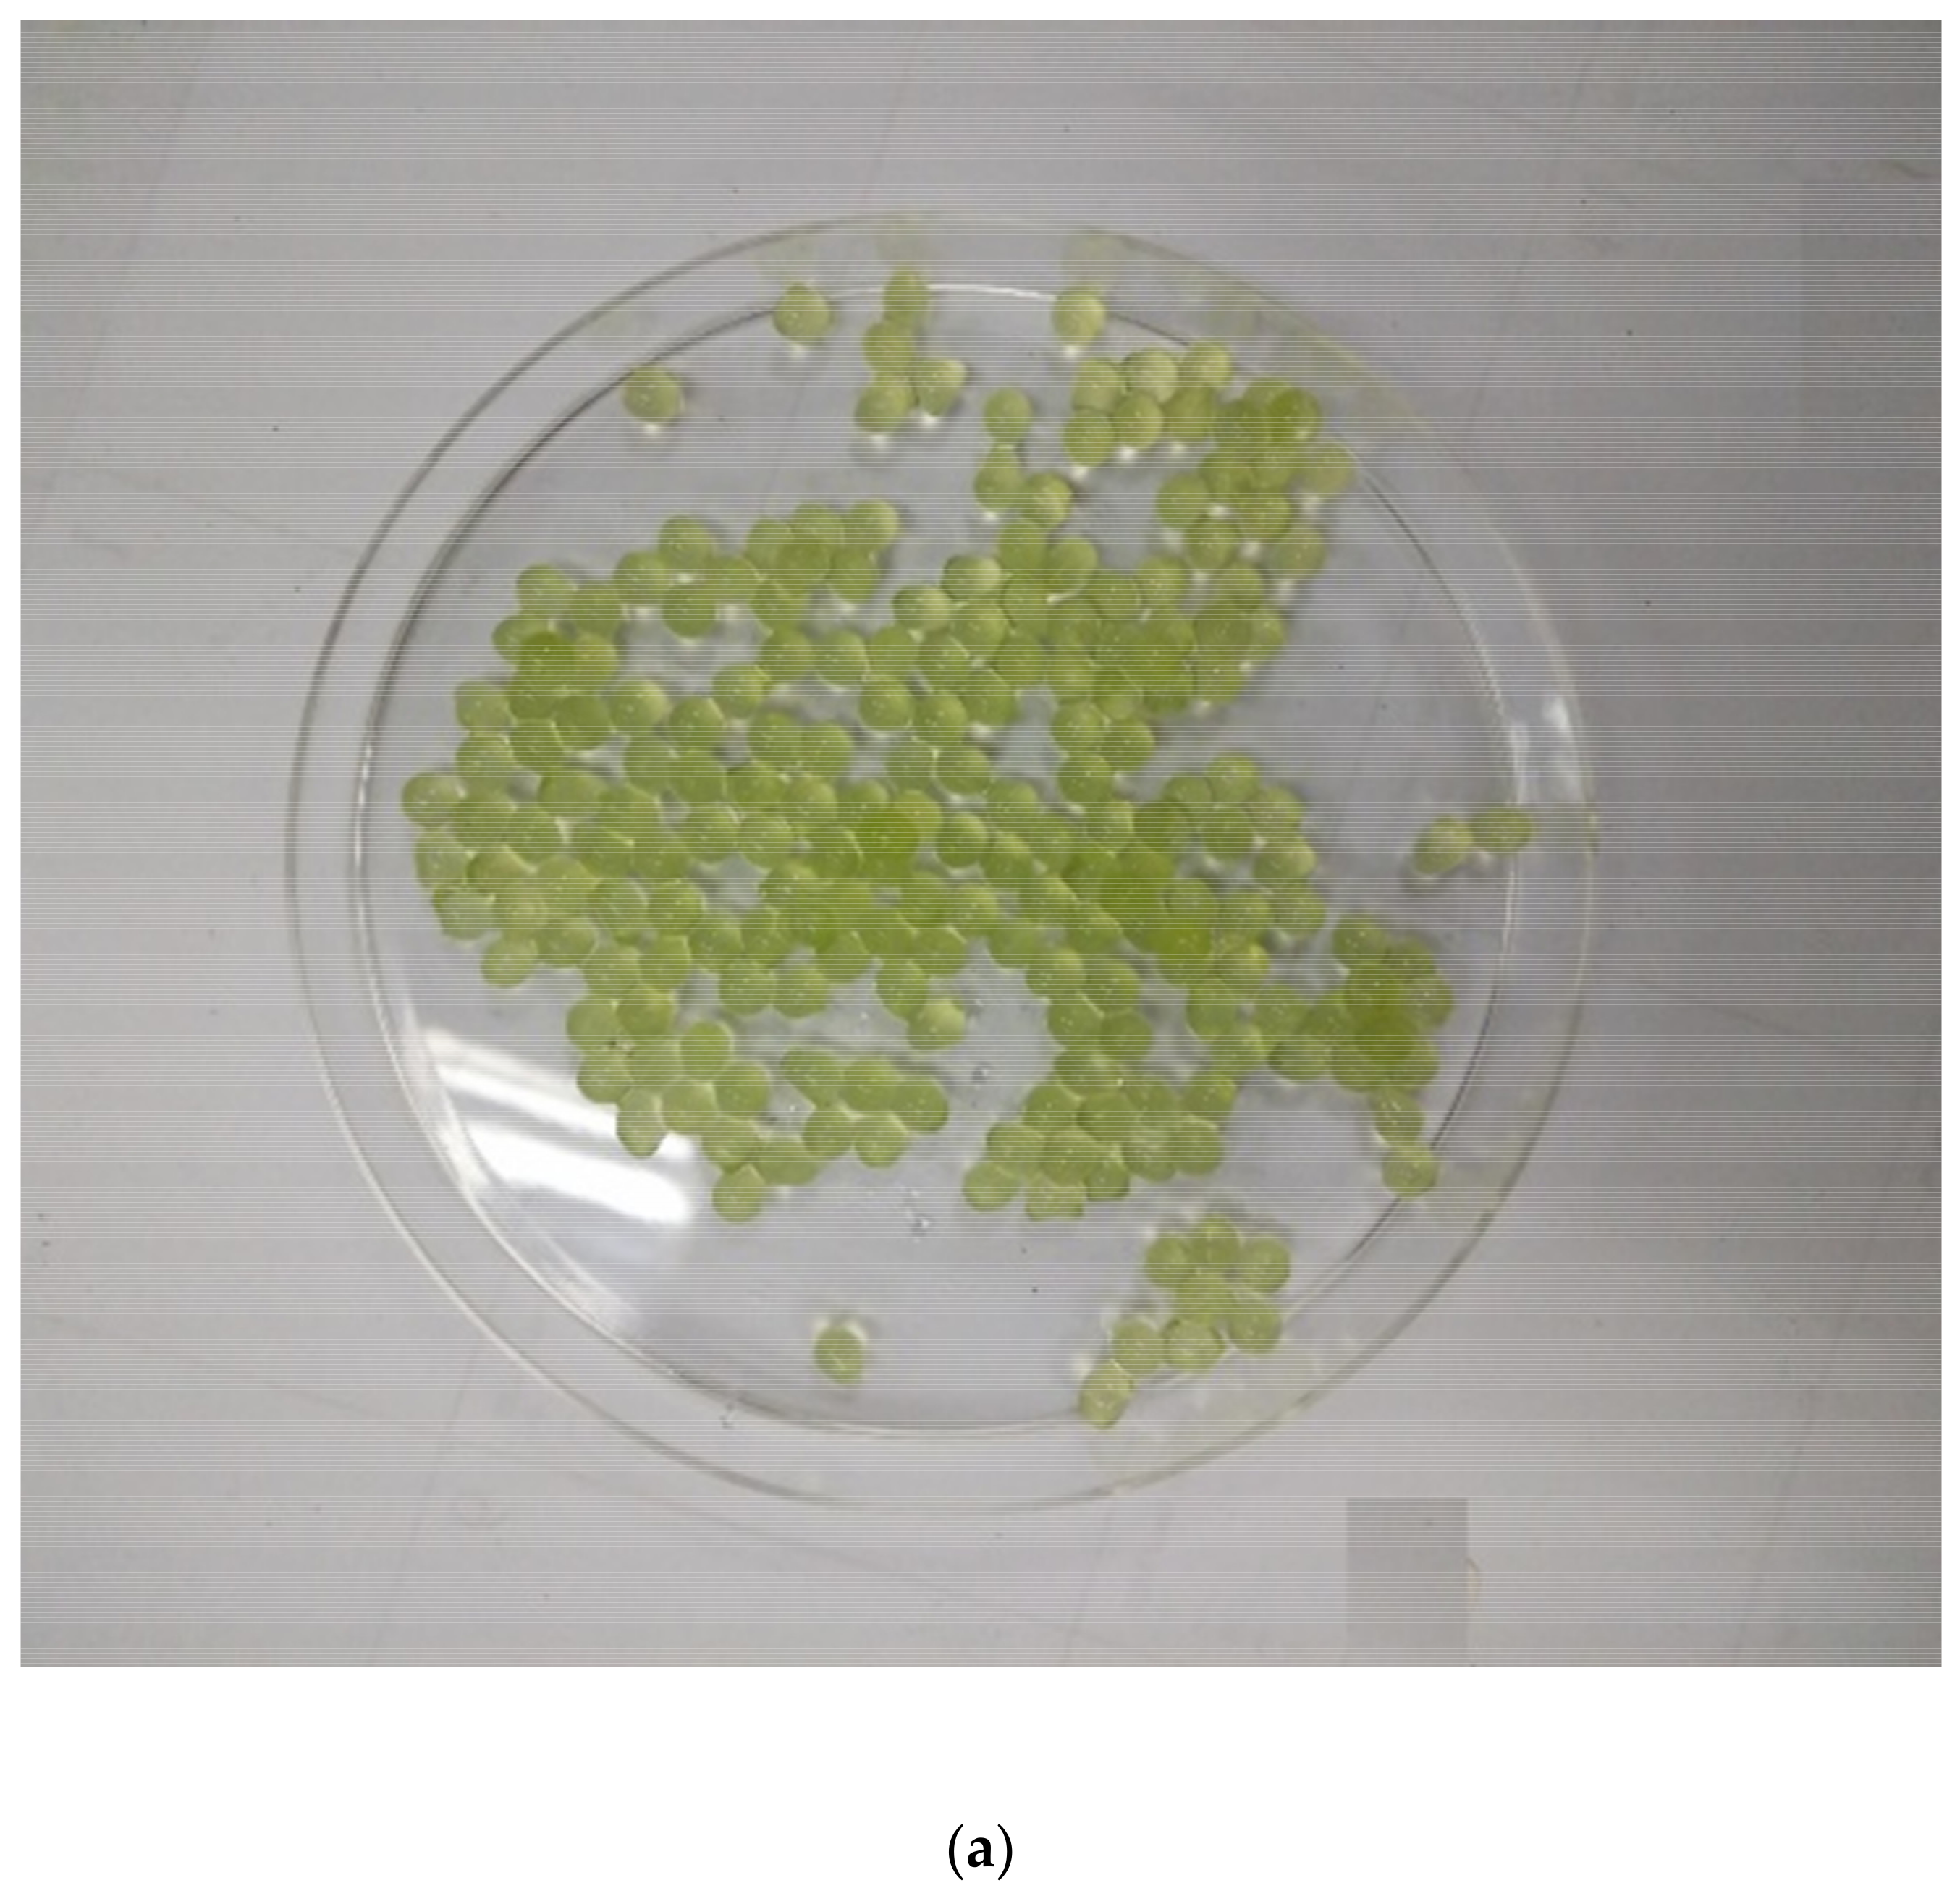
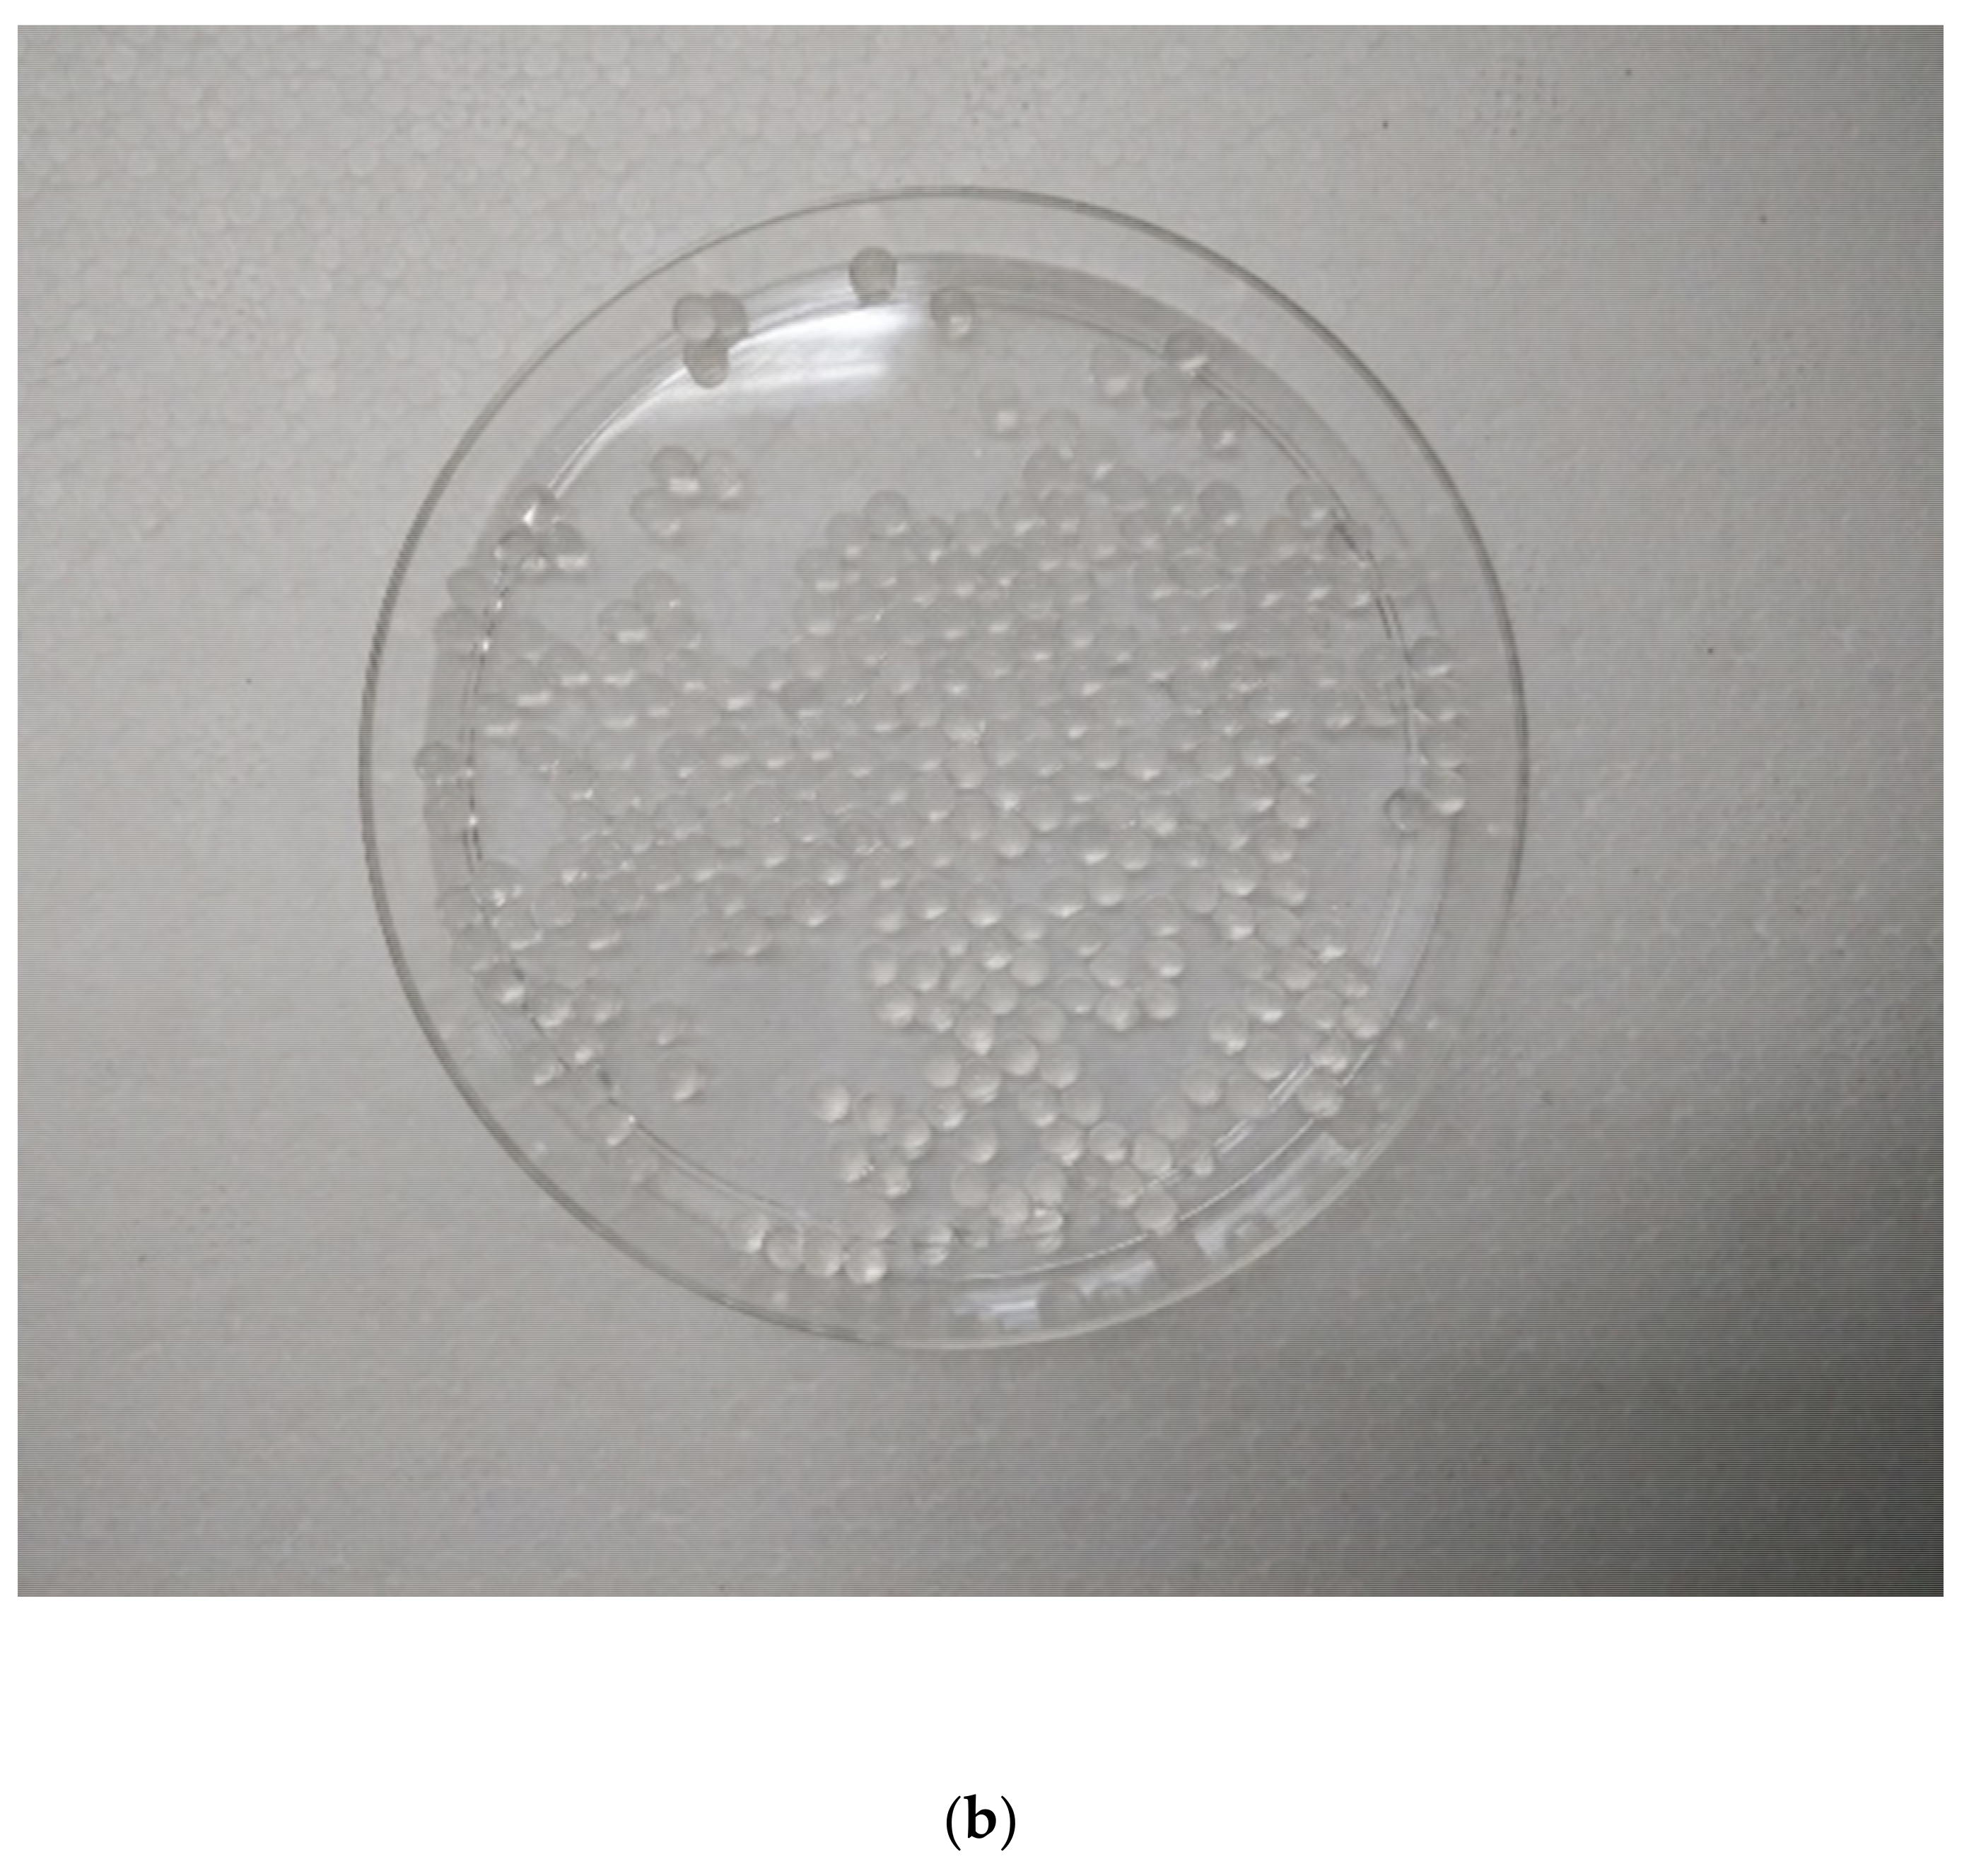
2.6. Green Microalgae–Alginate Beads Preparation

The procedure was adopted from Ruiz-Marin and Sánchez-Saavedra (2016) [21]. In brief, 10 mL of the microalgae cells was harvested by centrifugation at 11,200 rcf for 2 min. The pellets were resuspended in 10 mL of autoclaved sterilised water after the microalgae supernatant was discarded. A two-per-cent microalgae–alginate suspension mixture was prepared by mixing each microalgae strain with 10 mL of 4% sterile alginate solution in a 1:1 volume ratio. The mix was vigorously stirred to ensure the uniformity of the solution. As shown in Figure 2, the mixture was then moved into a 10 mL syringe and placed 8–10 cm above a beaker containing a 2% calcium chloride solution. The microalgae–alginate mix was dropped into a calcium chloride solution to form the microalgae–alginate beads immediately. The process created light green spherical beads (as shown in Figure 3a) with around 3 ± 0.5 mm diameter. The beads were left for four hours in the calcium chloride solution at room temperature to harden. Next, the microalgae–alginate beads were washed with a 0.85% sterile sodium chloride solution followed by autoclaved distilled water to remove any residuals. The same process was used to create blank alginate beads as control, but distilled water was used instead of condensed microalgae cells. Figure 3b shows the morphology of the blank beads.

2.7. Experimental Setup

The microalgae–alginate beads were prepared with the following microalgae–alginate to calcium chloride concentration ratios: 2:2, 2:4, 2:6, 4:2, 4:4, 4:6, 6:4, and 6:6. All of the beads were placed into Erlenmeyer flasks containing 150 mL of LABT-POME. The flasks were placed at (35 ± 3 °C) with 12 h of light and 12 h of darkness intervals. All samples were shaken on an orbital shaker model KJ-201B, Xiangtian China, with a speed of 100 rpm at 32.4 ± 2.7 μmol.m−2s−1 light intensity. After ten days, ten beads from each sample were removed to determine their hardness and diameter. A texture analyser (TA.XTPlus; U.S.A.) was used to calculate the beads’ hardness, while a digital calliper (TPI 3C350-NB; China) was used to determine their diameter. For the post-treatment LABT-POME study, the microalgae–alginate beads were prepared using the selected best pair of ratios (sodium alginate: calcium chloride). All of the microalgae–alginate beads were placed in a 250 mL Erlenmeyer flask containing 150 mL of LABT-POME. Three sets of control runs were conducted in this study: a blank control run (BLK-CTRL), autoclaved blank control (AUTOBLK-CTRL), and actual control (ACT-CTRL). BLK-CTRL was prepared with addition of blank beads into the LABT-POME sample. AUTOBLK-CTRL was prepared by mixing blank beads with a sterilised LABT-POME sample. ACT-CTRL was prepared by the addition of microalgae–alginate beads into a sterile LABT-POME sample. All samples were placed at 35 ± 3 °C with continuous agitation at 100 rpm and a light intensity of 32.4 ± 2.7 μmol.m−2s−1. For the growth study, ten beads from each sample flask were withdrawn every two days and re-dissolved for chlorophyll-a extraction (details are further discussed in Section 2.8.2). At the same time, 10 mL of LABT-POME was collected from each flask to test for reducing or removing TN, TP, ammonia nitrogen, and SCOD. The analysis of TN, TP, ammonia nitrogen, and SCOD was according to the HACH standard methods. All the experimental works were ended when the beads started to degrade. All the experimental runs were carried out in triplicates.

2.8. Analytical Methods

2.8.1. Measurement of Substrate Reduction

The percentage of substrate reduction was calculated using Equation (1) below,
p = S o S e S o × 100 %
where p is the percentage removal; So is the initial substrate concentration (mg/L); and Se is the concentration of substrate at equilibrium state (mg/L).

2.8.2. Chlorophyll-a Extraction and Quantification

Ten microalgae–alginate beads were collected from each sample every two days. To obtain cells trapped in the beads, they were dissolved in 10 mL of 0.1 M tri-sodium citrate dihydrate. The Chlorophyll-a was extracted from the microalgae cells. In brief, each flask had 1 mL of green microalgae pipetted into a 1.5 mL centrifuge tube. All sample cells were centrifuged at 11,200 rcf for 2 min. Next, each sample cell’s supernatant was discarded and resuspended in 1 mL of methanol. Then, all sample cells were vortexed for 5 s and held at 4 °C in the dark for an hour. The sample cells were then centrifuged for 2 min at 11,200 rcf. Finally, UV-spectrophotometer analysis was performed on the supernatant from each sample cell at 649 nm and 665 nm wavelengths. Equation (2) was used to calculate the chlorophyll-a concentration of green microalgae [22].
C h l . = 8.0962 A 652 + 16.169 A 665

2.8.3. Growth Rate Study

The doubling time of the green microalgae was calculated using Equation (3) [23,24]:
t d = ln 2 μ
where td is the doubling time of microalgae (d), and μ is the specific growth rate of microalgae (d−1).
The specific growth rate of the microalgae was determined using Equation (4) [22,23]:
μ = ln x 2 ln x 1 t 2 t 1
where μ is the specific growth rate (d−1); x1 and x2 are chlorophyll-a (μg/L); and t1 and t2 are the time within the exponential phase (d).

2.8.4. Growth Kinetic Study

Verhulst logistical model was used to determine the dynamic growth of microalgae in the present study [25]. The equation as below:
X = X o e μ t 1 ( X o X m ) ( 1 e μ t )
where X is the chlorophyll-a concentration of green microalgae in the time-course (g/L); Xo is the initial biomass concentration of green microalgae (g/L); Xm is the biomass concentration at equilibrium state (g/L); t is the time taken (d); and μ is the maximum specific growth rate of green microalgae (d−1).

2.8.5. Quantification of Substrate Consumption Rate

The substrate consumption rate of immobilised microalgae was calculated using Equation (6) [21]:
r = S o S i t i t o
where r is the consumption rate of substrate (mg/L.d); So is the initial concentration of substrate (mg/L); Si is the concentration of substrate at time ti (mg/L); and to and ti are the time within the exponential phase (d).

3. Results and Discussion

3.1. Identification of Green Microalgae

Table 3 shows the picture and morphological characteristics of the green microalgae. The microalgae cells were unicellular and green in colour. As a result, it is classified as a Chlorophyte [18]. Table 3 shows that the average size of microalgae cells is between 10 and 12 μm. The identities of the microalgae cells were suspected based on their visible characteristics, which are described in Table 3. The morphology and features of these microalgae led to Chlorococcum sp. as the potential genus. Table 4 lists the most related species for this green microalga using the DNA sequence in the NCBI method. As shown in Table 4, the 18rRNA result for this green microalgae showed 99–100% similarity. Therefore, due to morphology and molecular identification, the microalgal species is most likely C. oleofaciens.

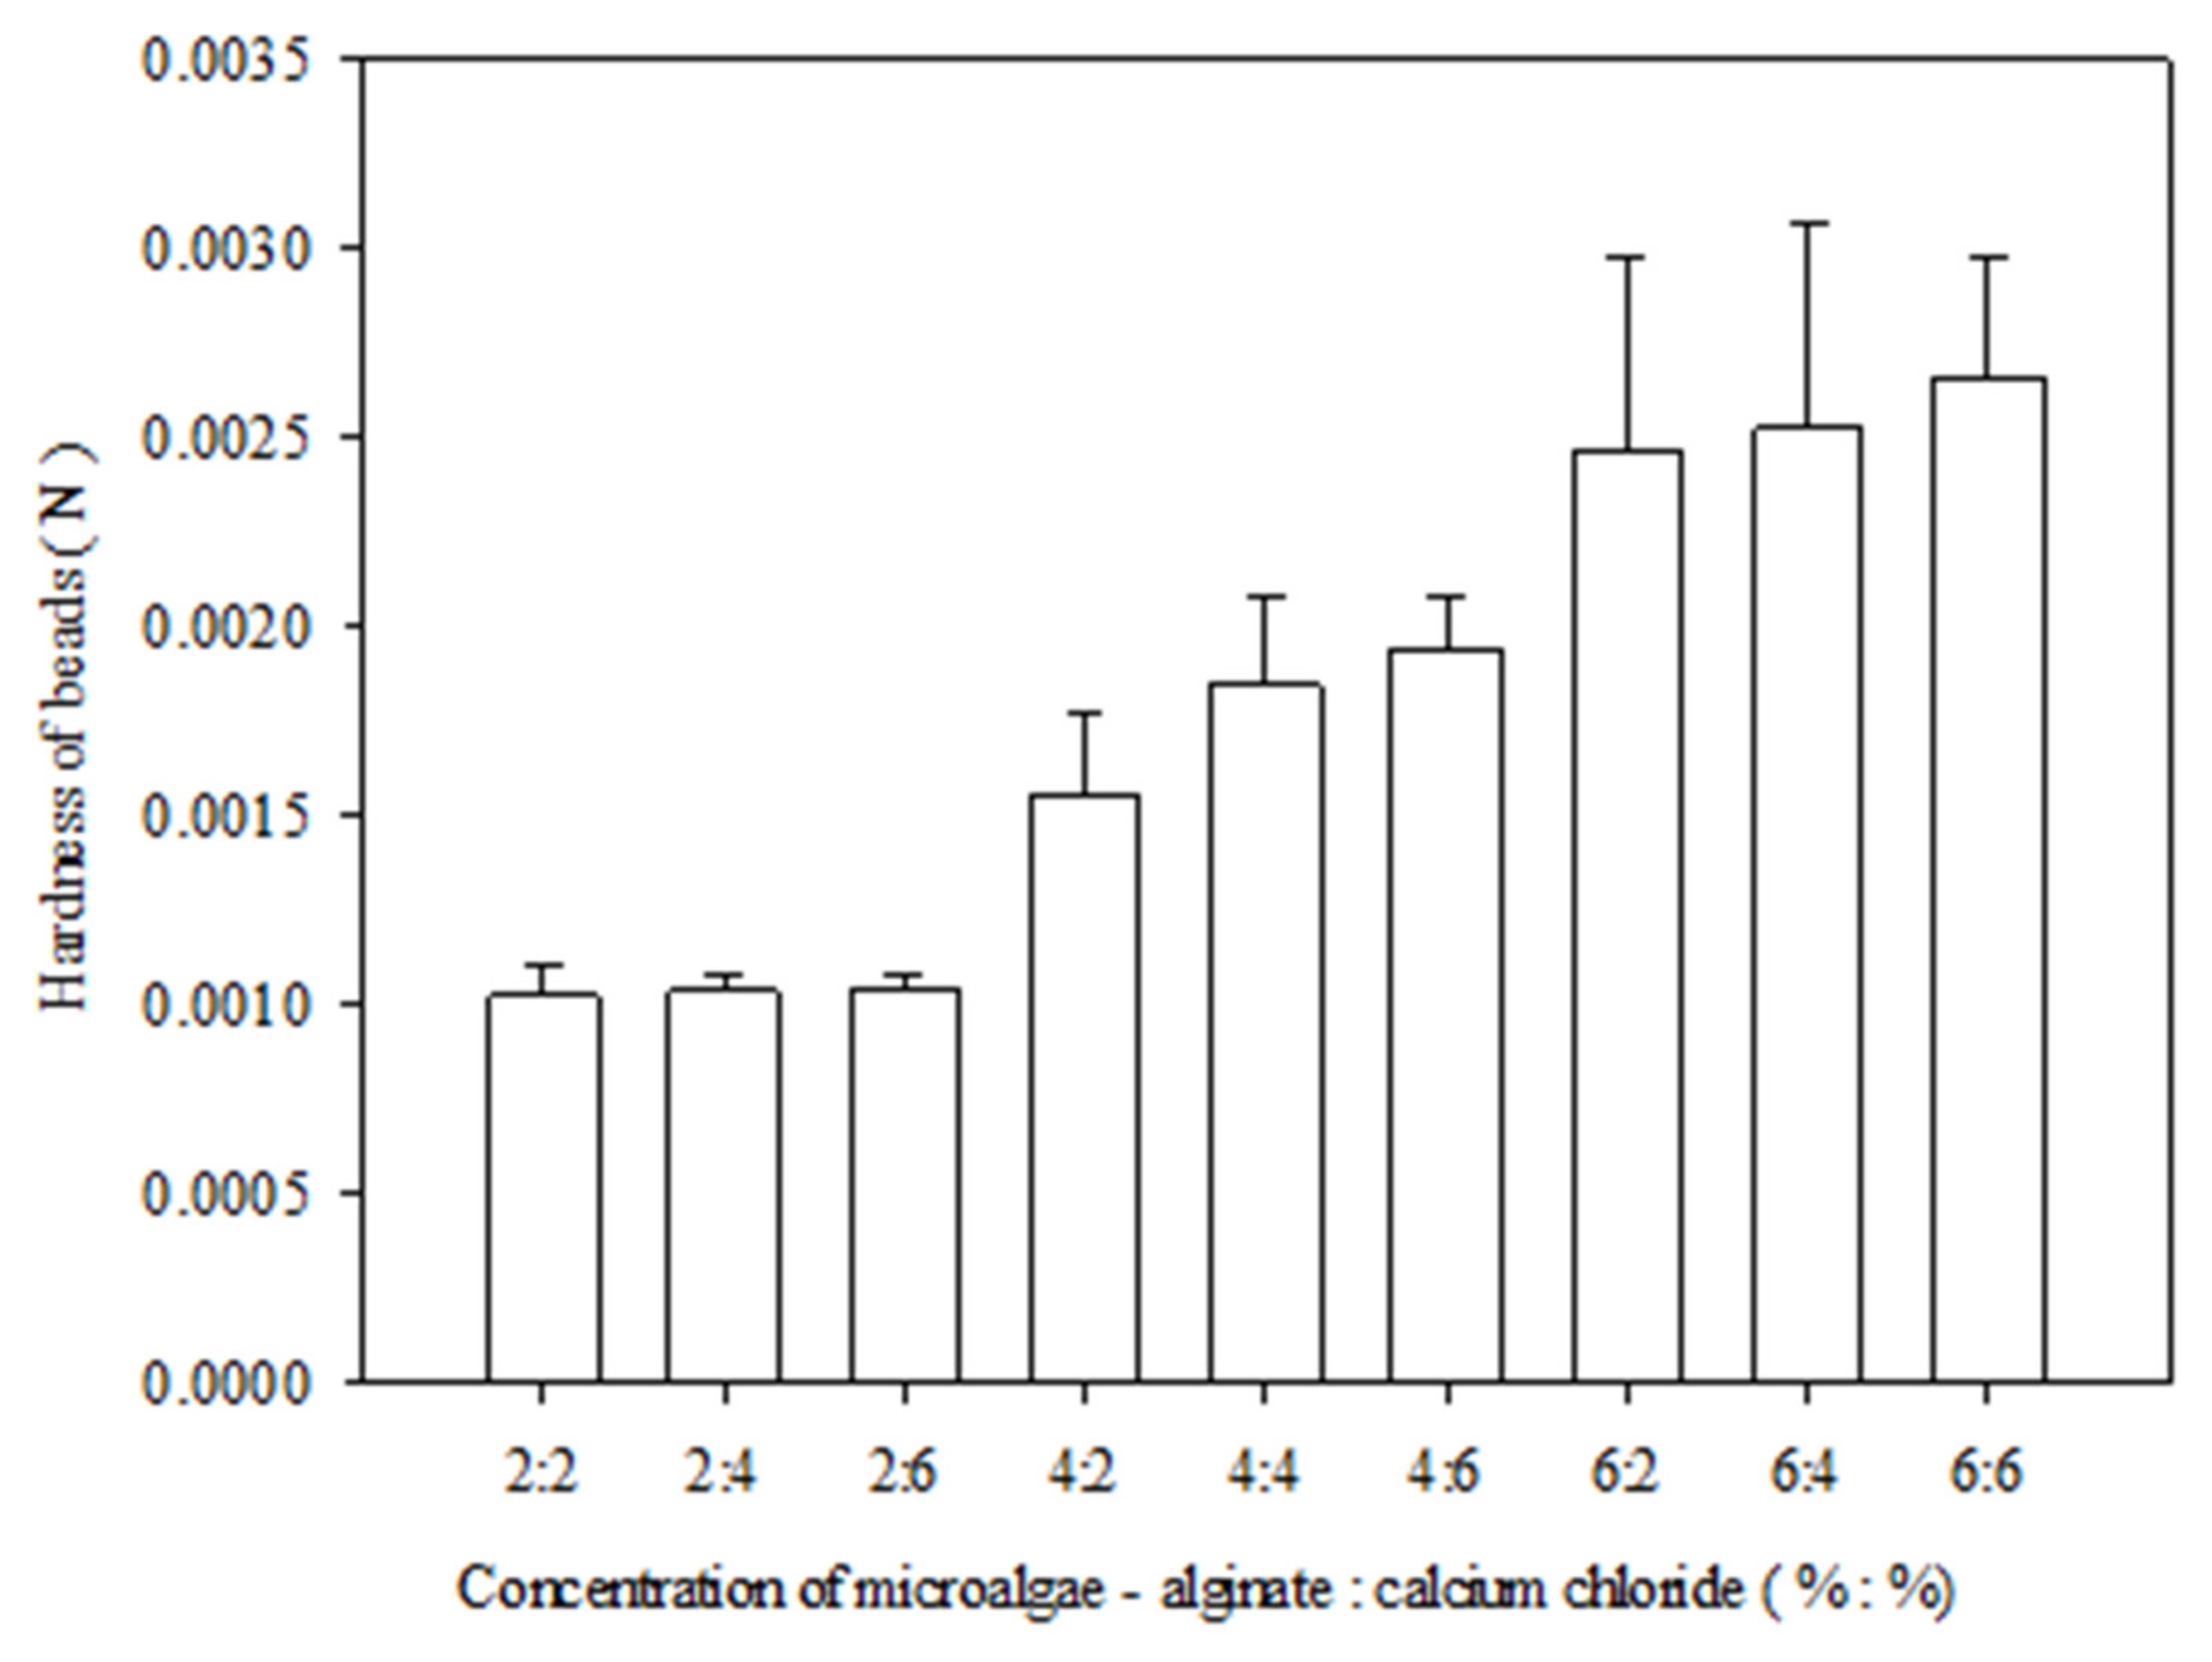
3.2. Selection of the Suitable Beads

The size of the microalgae–alginate beads shrank over time. As a result, some experimental work was conducted to increase the strength of the microalgae–alginate beads to achieve a longer-lasting duration of beads in the LABT-POME before conducting the immobilisation studies of C. oleofaciens for POME post-treatment. The beads were reinforced using three typical concentration ratios of calcium chloride (2%, 4%, and 6%) to microalgae–alginate (2%, 4%, and 6%). Figure 4 shows the hardness of the beads made at various percentages of calcium chloride to microalgae–alginate concentration ratios. All of the beads were inoculated for ten days in LABT-POME at the same time. Throughout the cultivation time, the growth of the strain and the bead degradation were measured. Table 5 summarises all of the data obtained.
Figure 4 shows the increased hardness of beads with the increase in the ratio of microalgae–alginate to calcium chloride. The 6:6 ratio produced the hardest beads, and the size diameter deteriorated the least throughout the cultivation period, as shown in Table 5. In addition, C. oleofaciens had a low chlorophyll-a concentration average (2.309 μg/mL). These data indicate that the strain did not develop well in the 6:6 ratios because the higher alginate concentration hindered nutrient transport from the LABT-POME into the beads. As a result, the species’ proliferation in the microalgae–alginate beads was slowed. The research work from Banerjee et al. (2019) supports this [26]. They reported that increasing alginate concentration would reduce the pore size of the alginate bead wall, leading to restrictive uptake of nutrients or other macro-molecules.
The immobilised cells had a high average of chlorophyll-a concentration. The bead size decreased by more than 65% for the ratio pairs of 2:2, 2:4, and 2:6 after ten days of cultivation in LABT-POME. This finding shows that the microalgae–alginate beads made using these ratios were inappropriate for LABT-POME treatment because they deteriorated quickly. As a result, the 4:4 ratio was chosen as the best ratio for preparing microalgae–alginate beads. Table 5 shows that after ten days of cultivation, the size of the beads decreased by approximately 10%, and the chlorophyll-a concentration average from immobilised C. oleofaciens increased to 4.978 μg/mL from 0.495 μg/mL. This result proved that C. oleofaciens could be grown in certain proportions in the beads. Hence, a ratio of 4:4 was selected for further study.

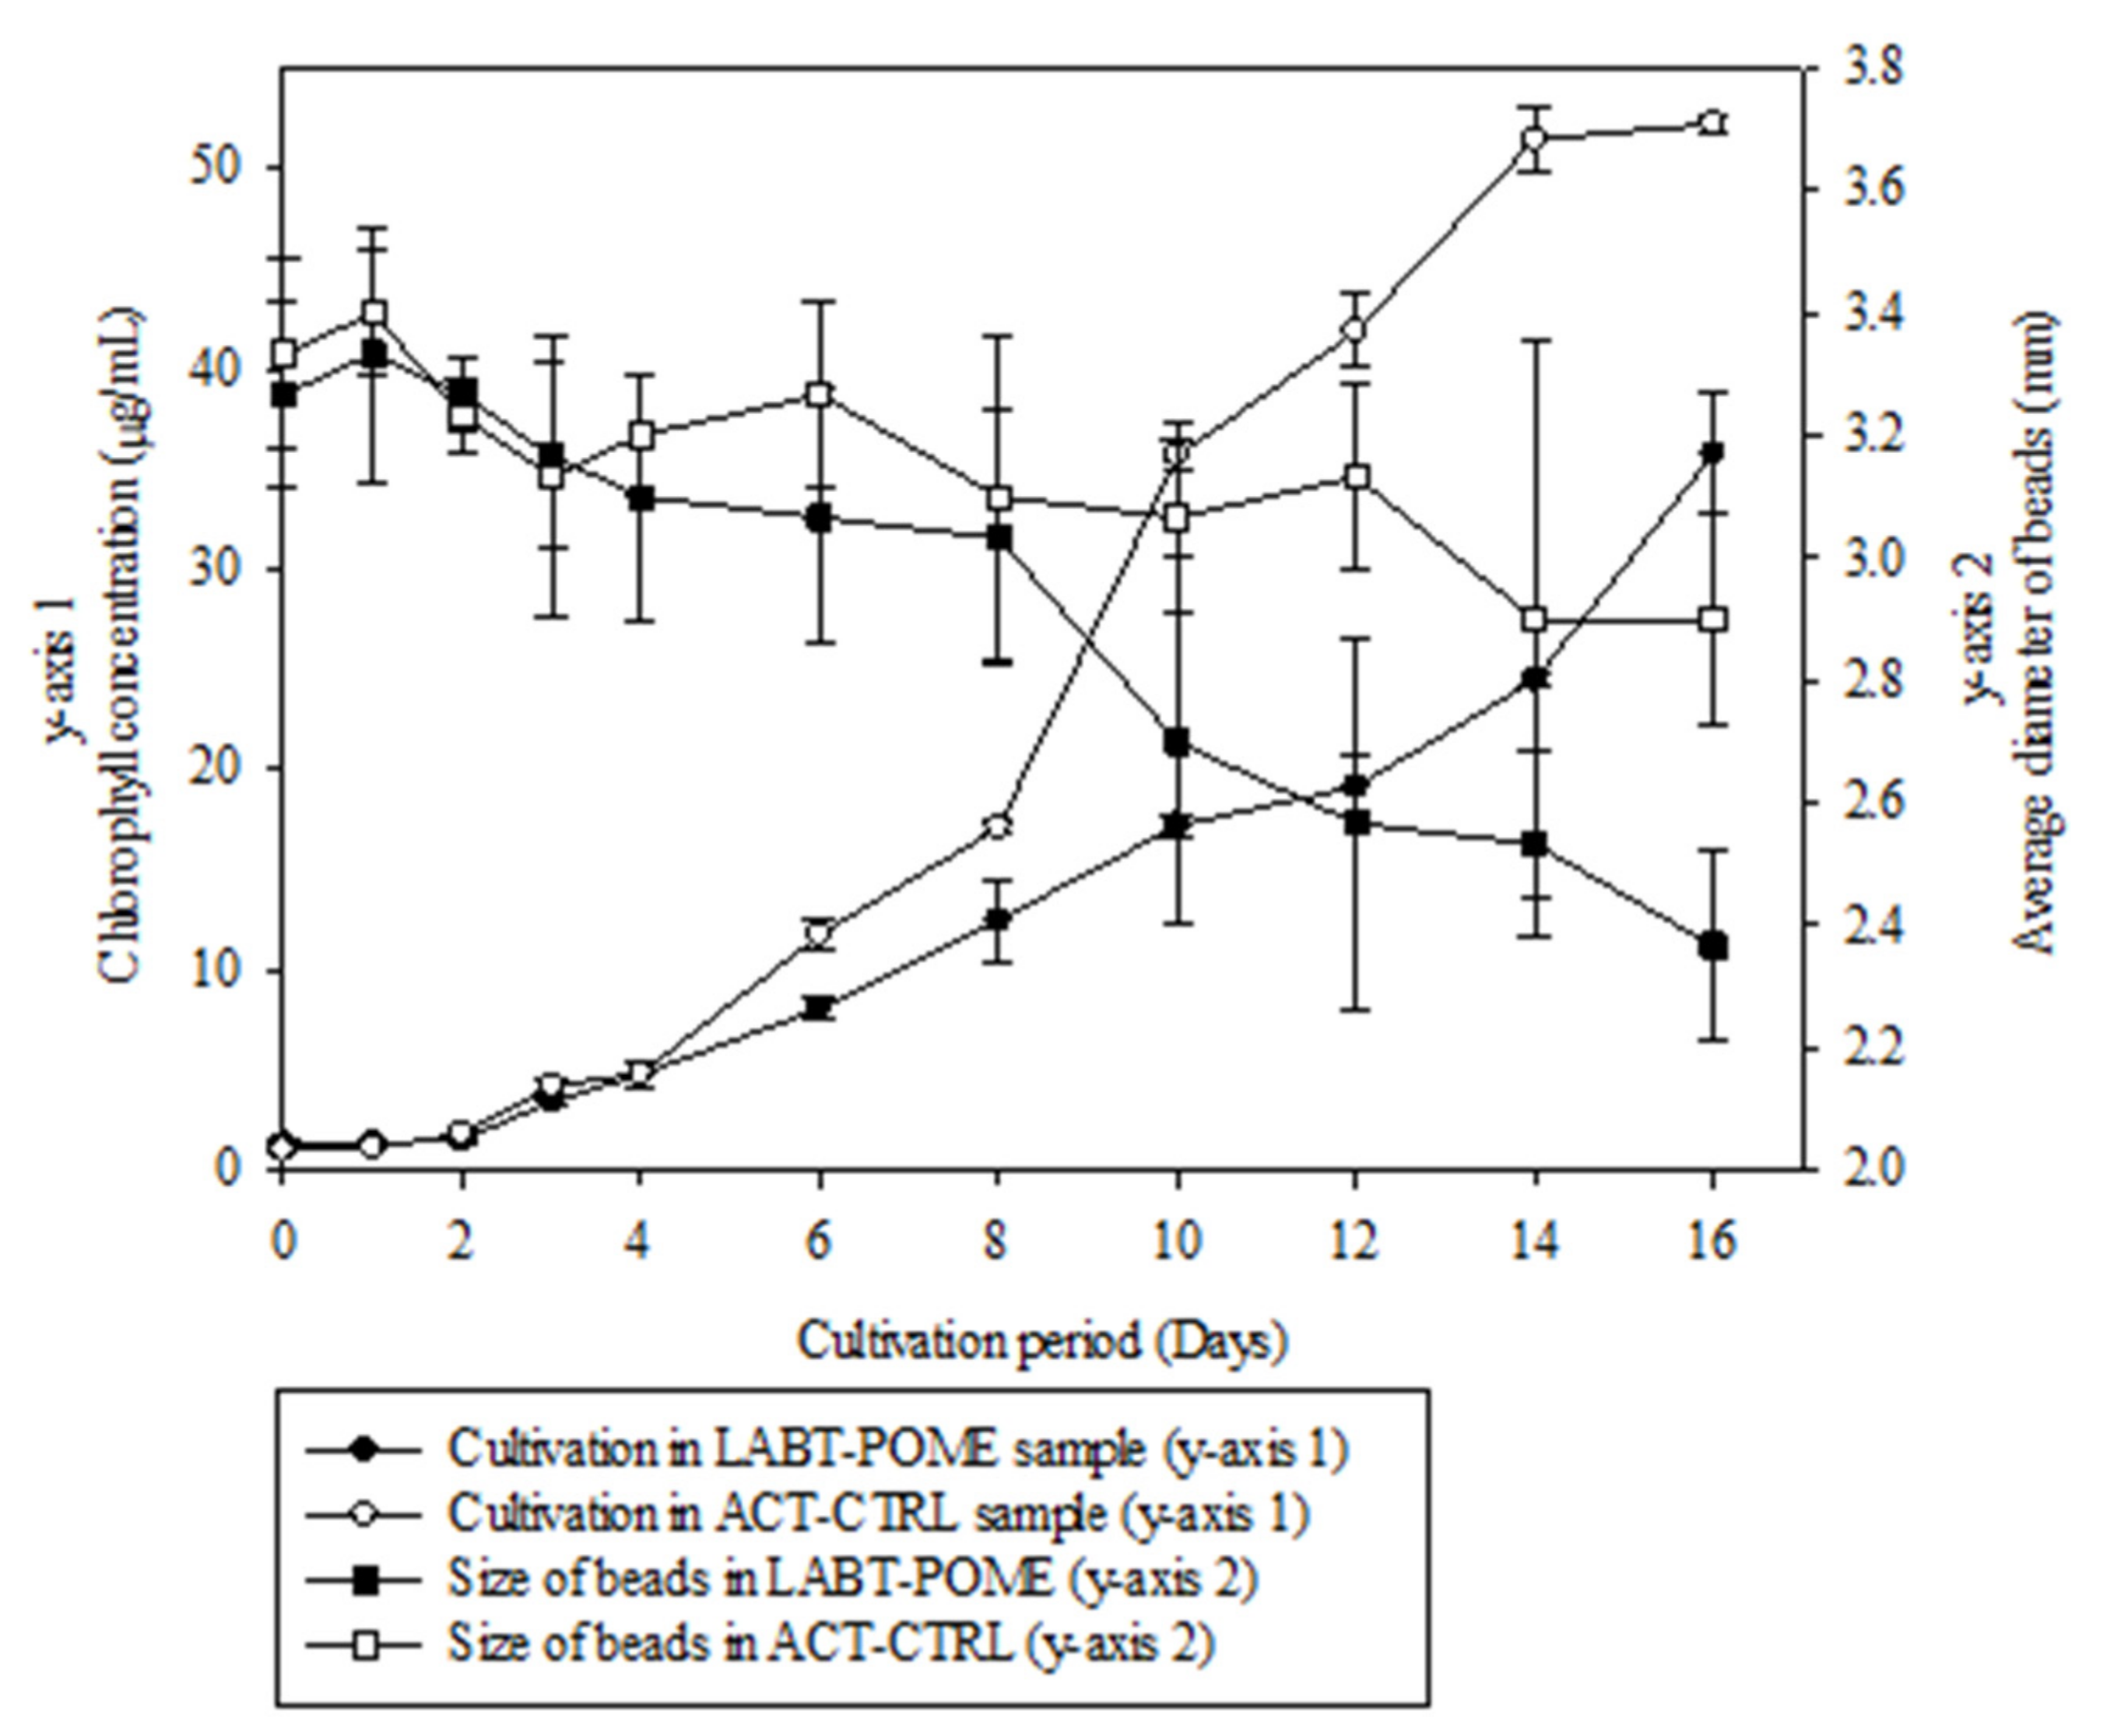
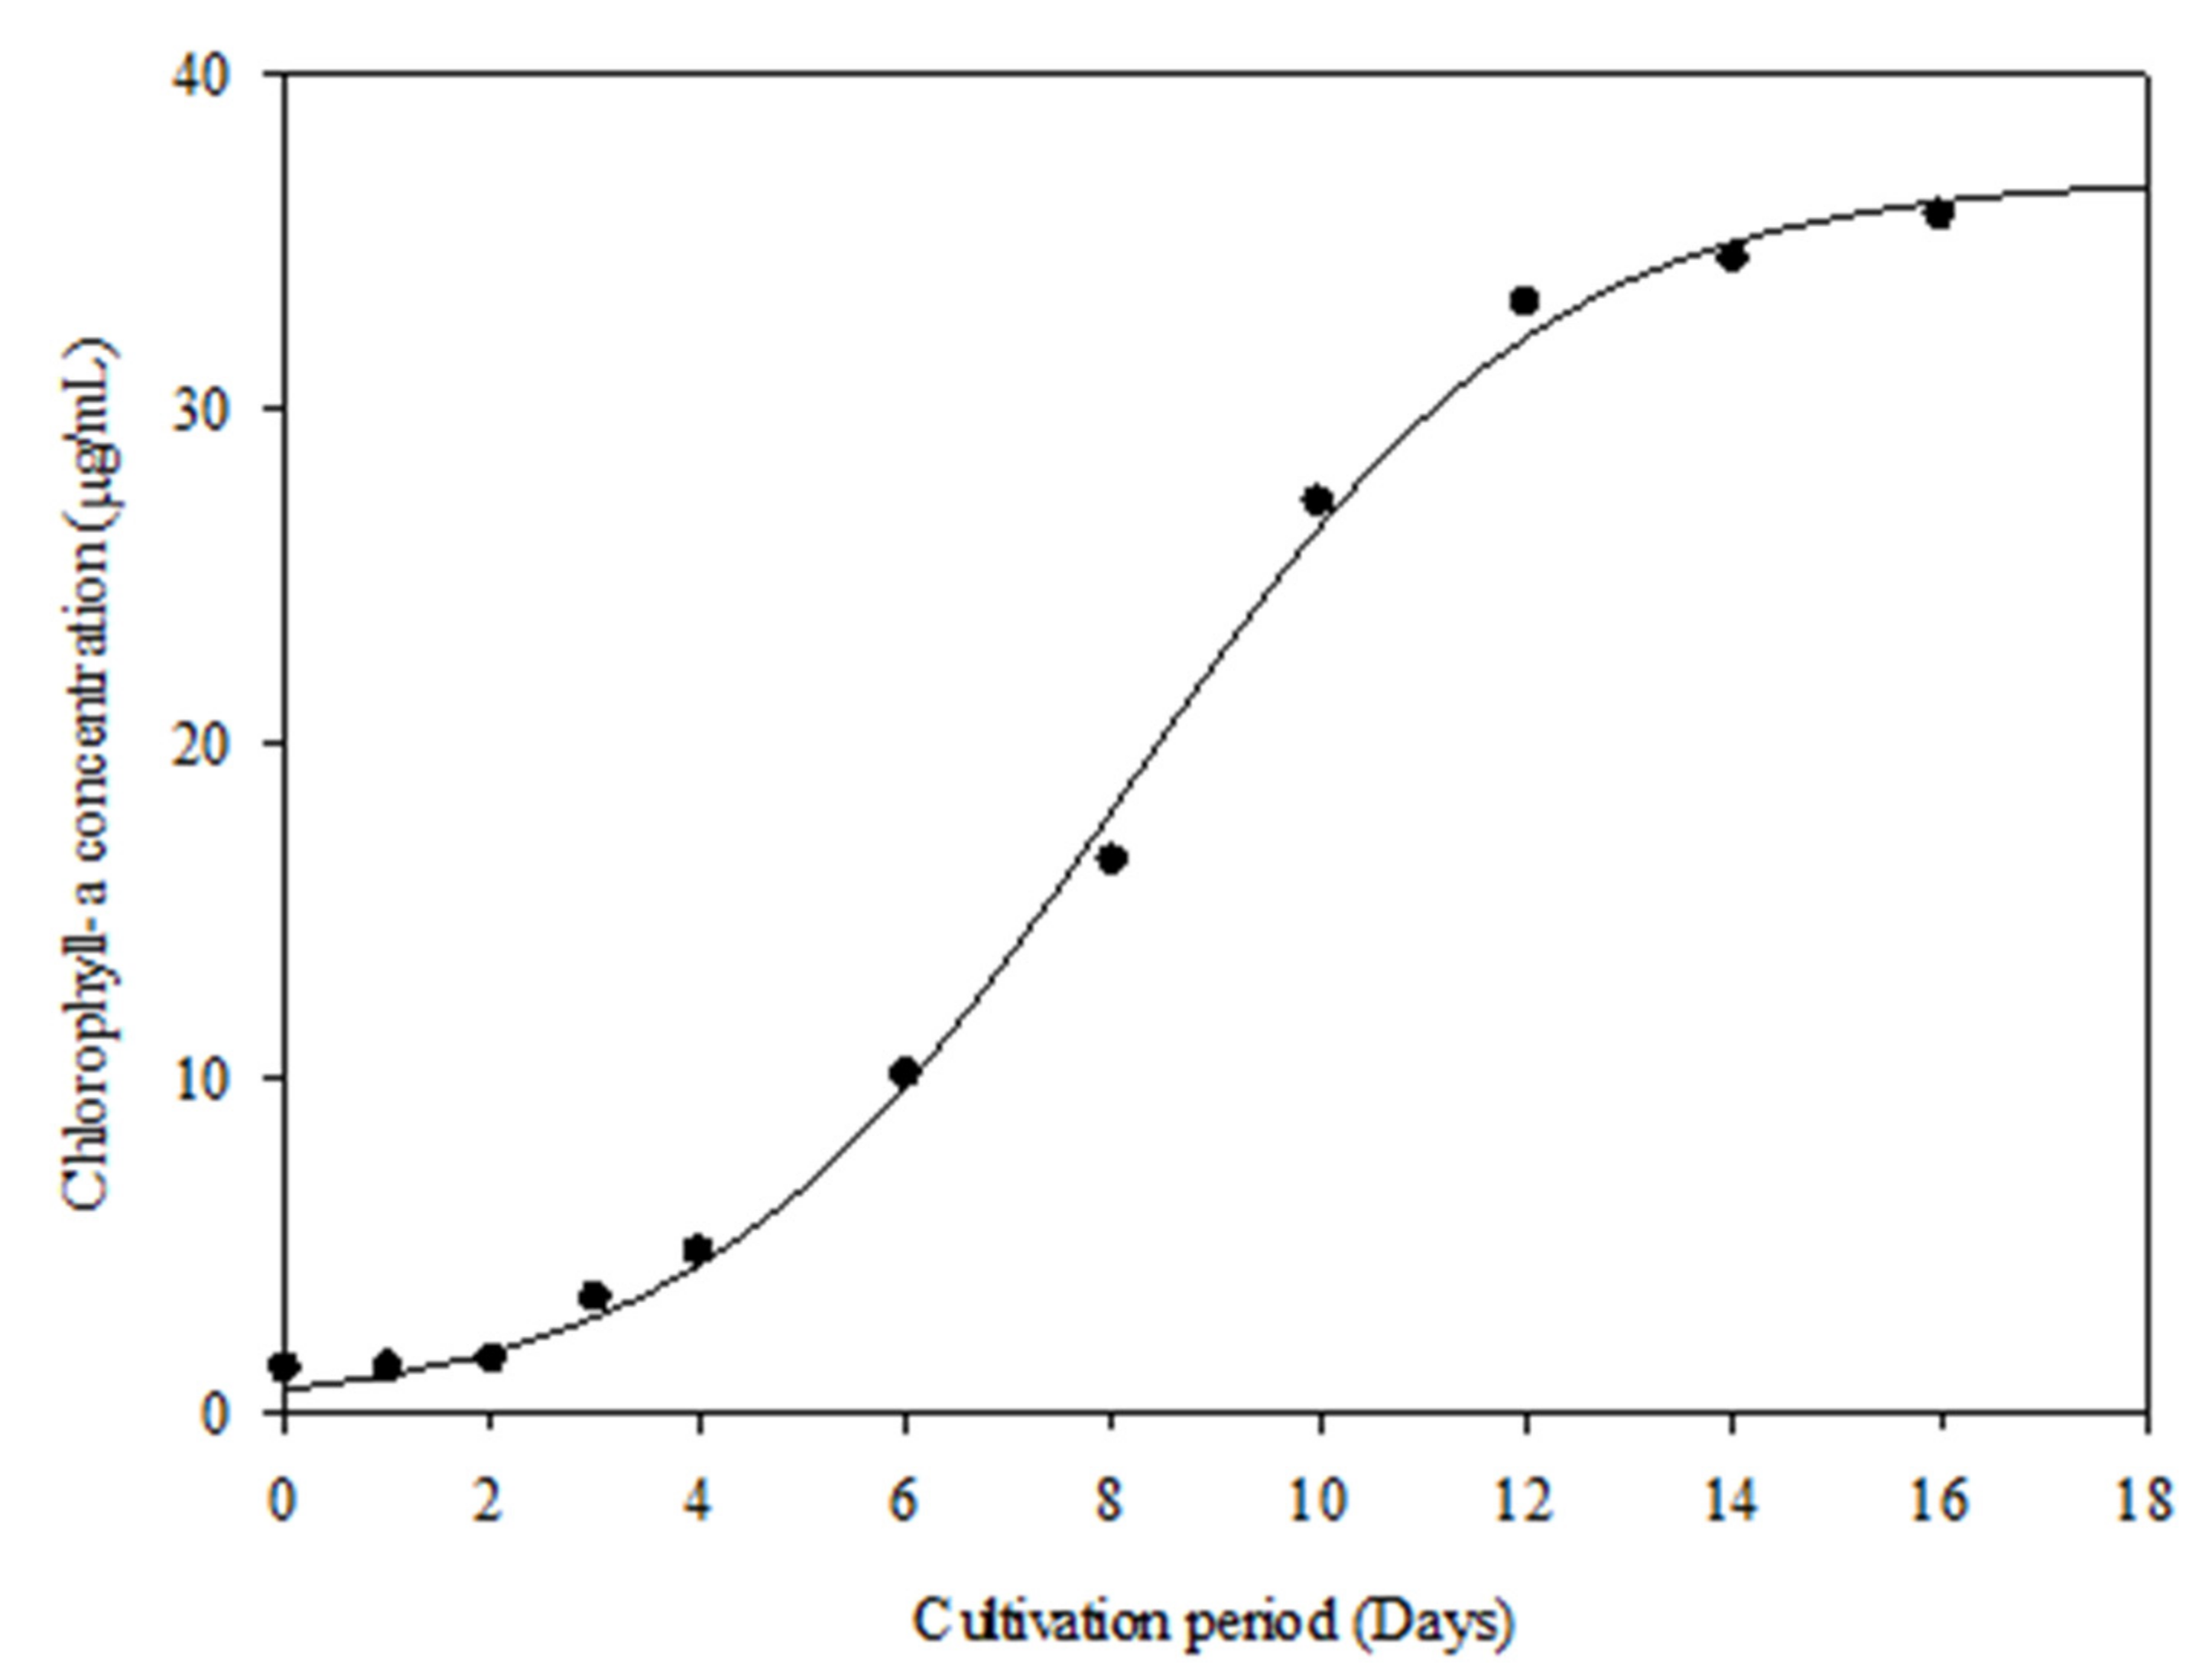
3.3. Growth Study of Immobilised C. oleofaciens in LABT-POME

Figure 5 shows the growth of immobilised C. oleofaciens over 16 days. When cultivating the immobilised stain in the LABT-POME sample, the lag phase took two days to develop. In the ACT-CTRL sample, the lag phase was developed on the first day. After the lag time, both the ACT-CTRL and LABT-POME growth curves of immobilised cell cultivation showed a sharp increase with no stationary phase. The size of microalgae–alginate beads decreases as the cultivation time increases. Due to this, this study only measured the growth of immobilised cells for up to 16 days. Consequently, stationary phases were absent from both growth curves (Figure 5). Over the 16 days, the size of microalgae–alginate beads in both the ACT-CTRL and LABT-POME samples was decreased by approximately 12% and 30%, respectively. The microalgae–alginate beads degraded due to the higher pH and TP content in LABT-POME. When cultivated in the LABT-POME study, the size of microalgae–alginate beads shrank the most. Since alginate is an organic compound, other microorganisms in the LABT-POME may be causing the beads to shrink [27]. On day 14, the deterioration of the beads caused the microalgae cell to leak from the beads, resulting in lower chlorophyll-a concentrations from immobilised cells cultivated in the LABT-POME sample (35.776 μg/mL) relative to the ACT-CTRL sample (51.435 μg/mL). This result demonstrates that immobilising microalgae can concentrate a significant amount of biomass that can be used as a byproduct. The research on the immobilisation of Synechococcus sp. produced similar results. Immobilised cells, which developed more biomass than free cell cultures, were immobilised in chitosan to protect the cell walls from NaOH toxicity [28]. Therefore, similar to the previous study, the cells grew faster when immobilised with alginate beads than free cell culture.

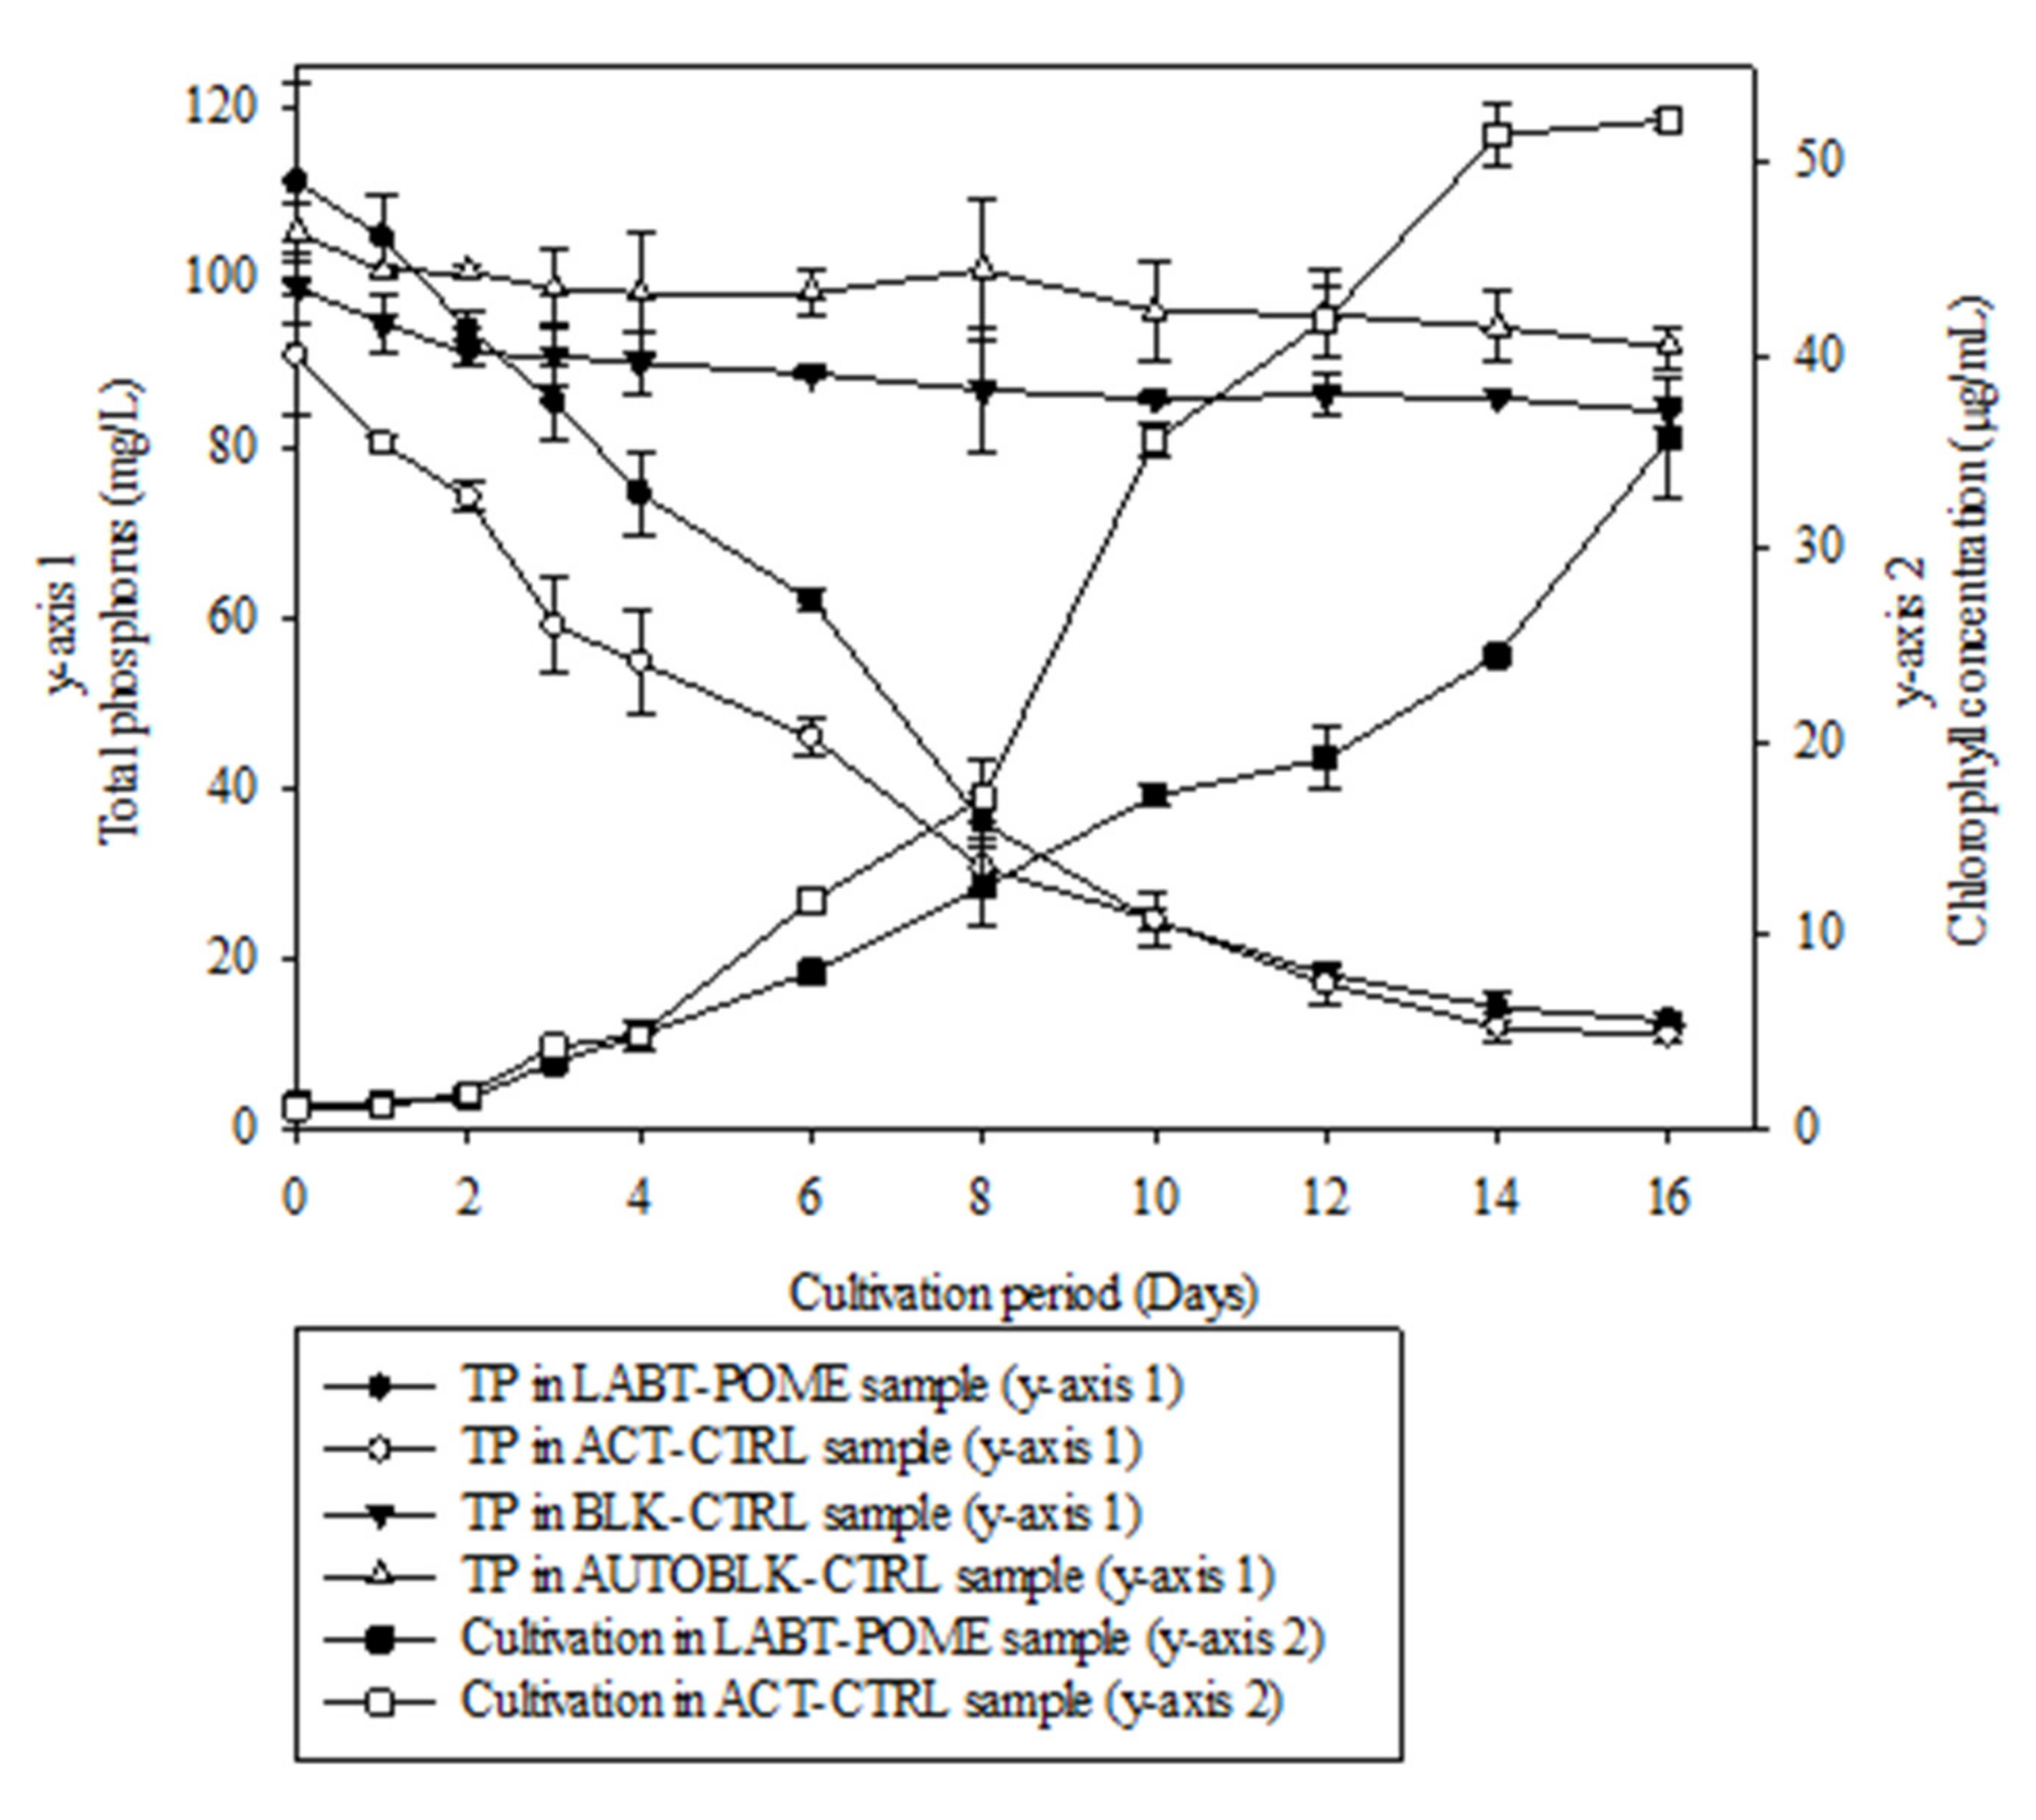
3.4. Removal of TP from LABT-POME

BLK-CTRL has existing POME bacteria, and the bacteria in AUTOBLK-CTRL were eliminated. The result of this study shows that nutrient removal was not affected by the presence of the bacteria. Figure 6 shows the absorption of TP by immobilised C. oleofaciens for 16 days. The TP removal curves for both the ACT-CTRL and LABT-POME samples decreased over the 16 days. The species took approximately eight days to eliminate more than 90% of TP from the LABT-POME in an immobilised state with an ingestion rate of 8.6950 mg/L.d. The higher TP concentration, on the other hand, can hinder the deterioration of the beads. The Na+ ions exchange ions with Ca2+ ions, loosening the structure of the beads. Calcium phosphate was then formed by the reaction of phosphate ions with Ca2+, which increased the turbidity of the LABT-POME [29]. As a result, the diameter of the beads shrank throughout the 16-day cultivation cycle. The removal of TP by free-living cells was more than 90% within 16 days of cultivation [30]. However, immobilised cells could remove more than 90% of TP from POME within just 6–8 days of cultivation. This result indicates that the efficiency of immobilised cells is higher than free-living cells. Therefore, the TP removal was probably done not only by algal cells but also by the beads. However, the removal of TP by beads was not evaluated.

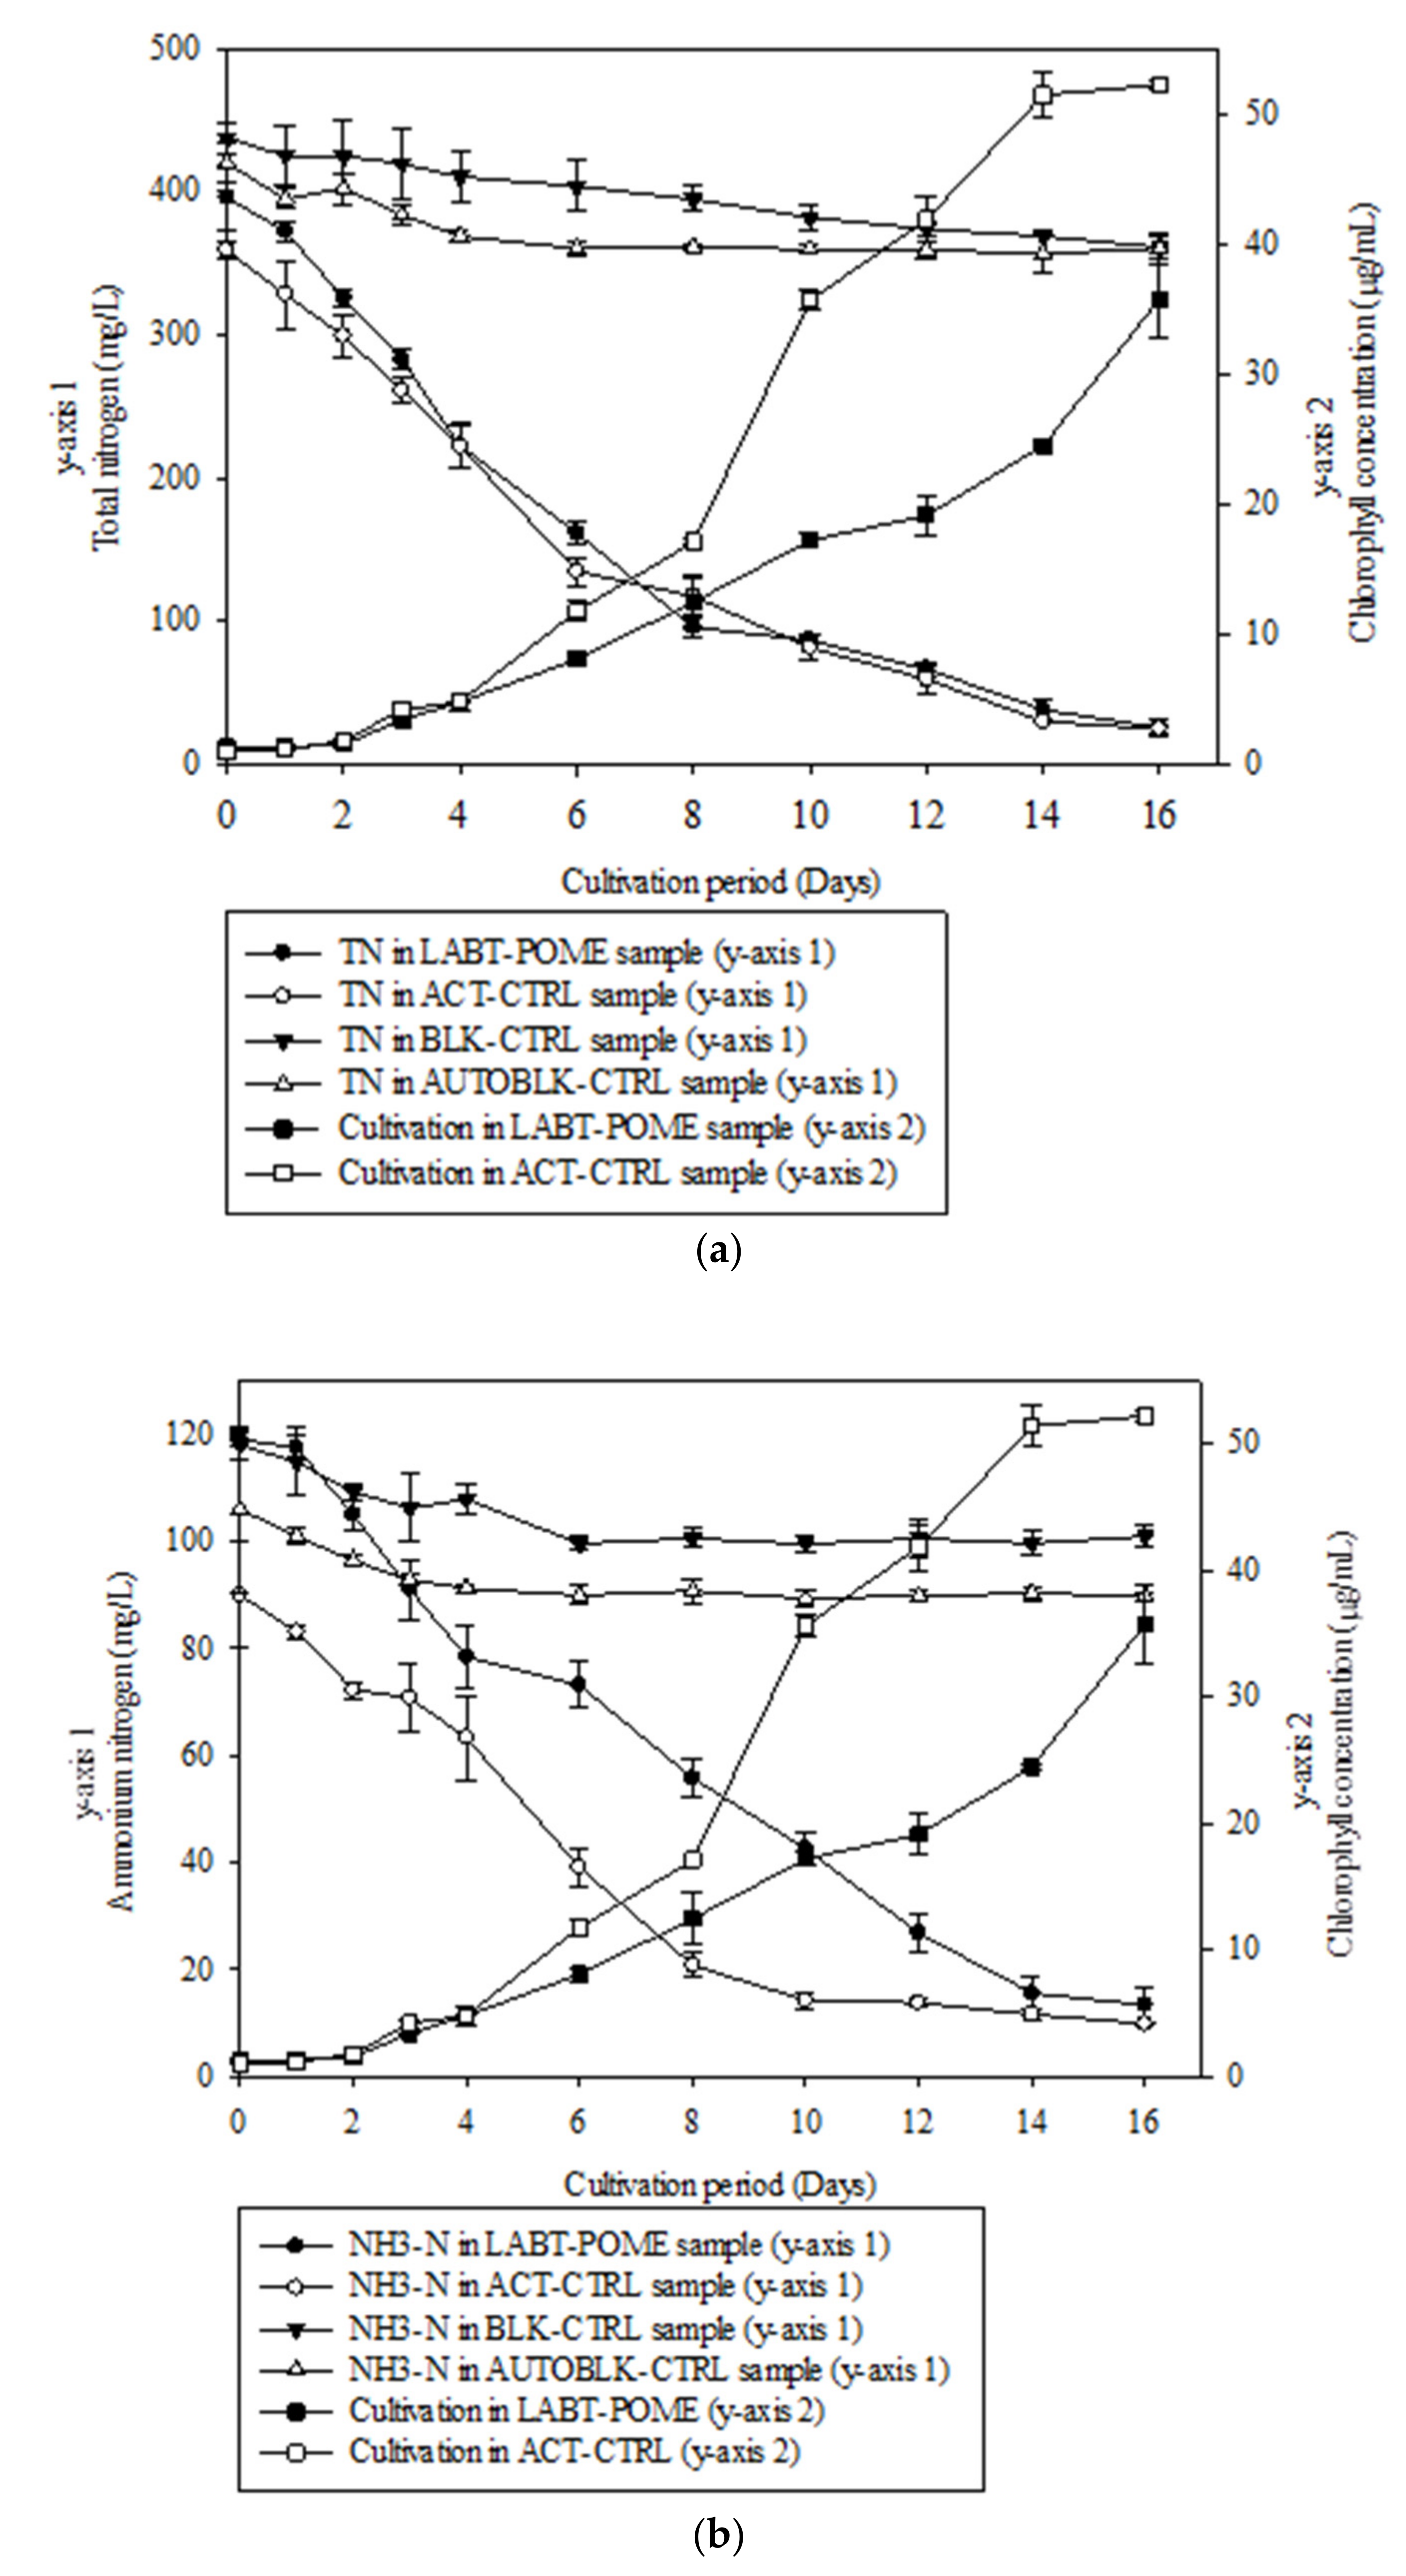
3.5. Removal of Ammonia Nitrogen and TN from LABT-POME

Figure 7a,b depict TN and ammonia nitrogen elimination from LABT-POME over 16 days using immobilised cells. In both the ACT-CTRL and LABT-POME samples, TN and ammonia nitrogen concentrations decreased over the 16-day cultivation period, as shown in Figure 7a,b. By referring to Figure 7a,b, the immobilised cells performed a high rate of removal TN (25.5536 mg/L.d) and ammonia nitrogen (7.3857 mg/L.d). A similar result was reported by Liu et al. (2012), which concluded that immobilised Chlorella sorokiniana GXNN 01 removed more nitrogen from synthetic wastewater than free-living cells under three different conditions: autotrophic, heterotrophic, and 23 microaerobic cultivation over six days [30]. Within 6–8 days of the cultivation date, the immobilised cells extracted over 95% of TN and ammonia nitrogen from ACT-CTRL and LABT-POME samples. However, the free-living cells took a longer time (about 16 days) to achieve more than 90% of TN and ammonia nitrogen removal [30]. This result shows that immobilised cells are more efficient than free-living cells. When cells are contained inside the alginate, it is shielded from being ingested by other microorganisms. Furthermore, since nutrients can diffuse into the beads for C. oleofaciens to absorb, the immobilisation produces a micro-environment for the species to develop [27]. Therefore, consistent with the previous study, the TN and ammonia nitrogen can be efficiently removed by microalgae immobilised with alginate.

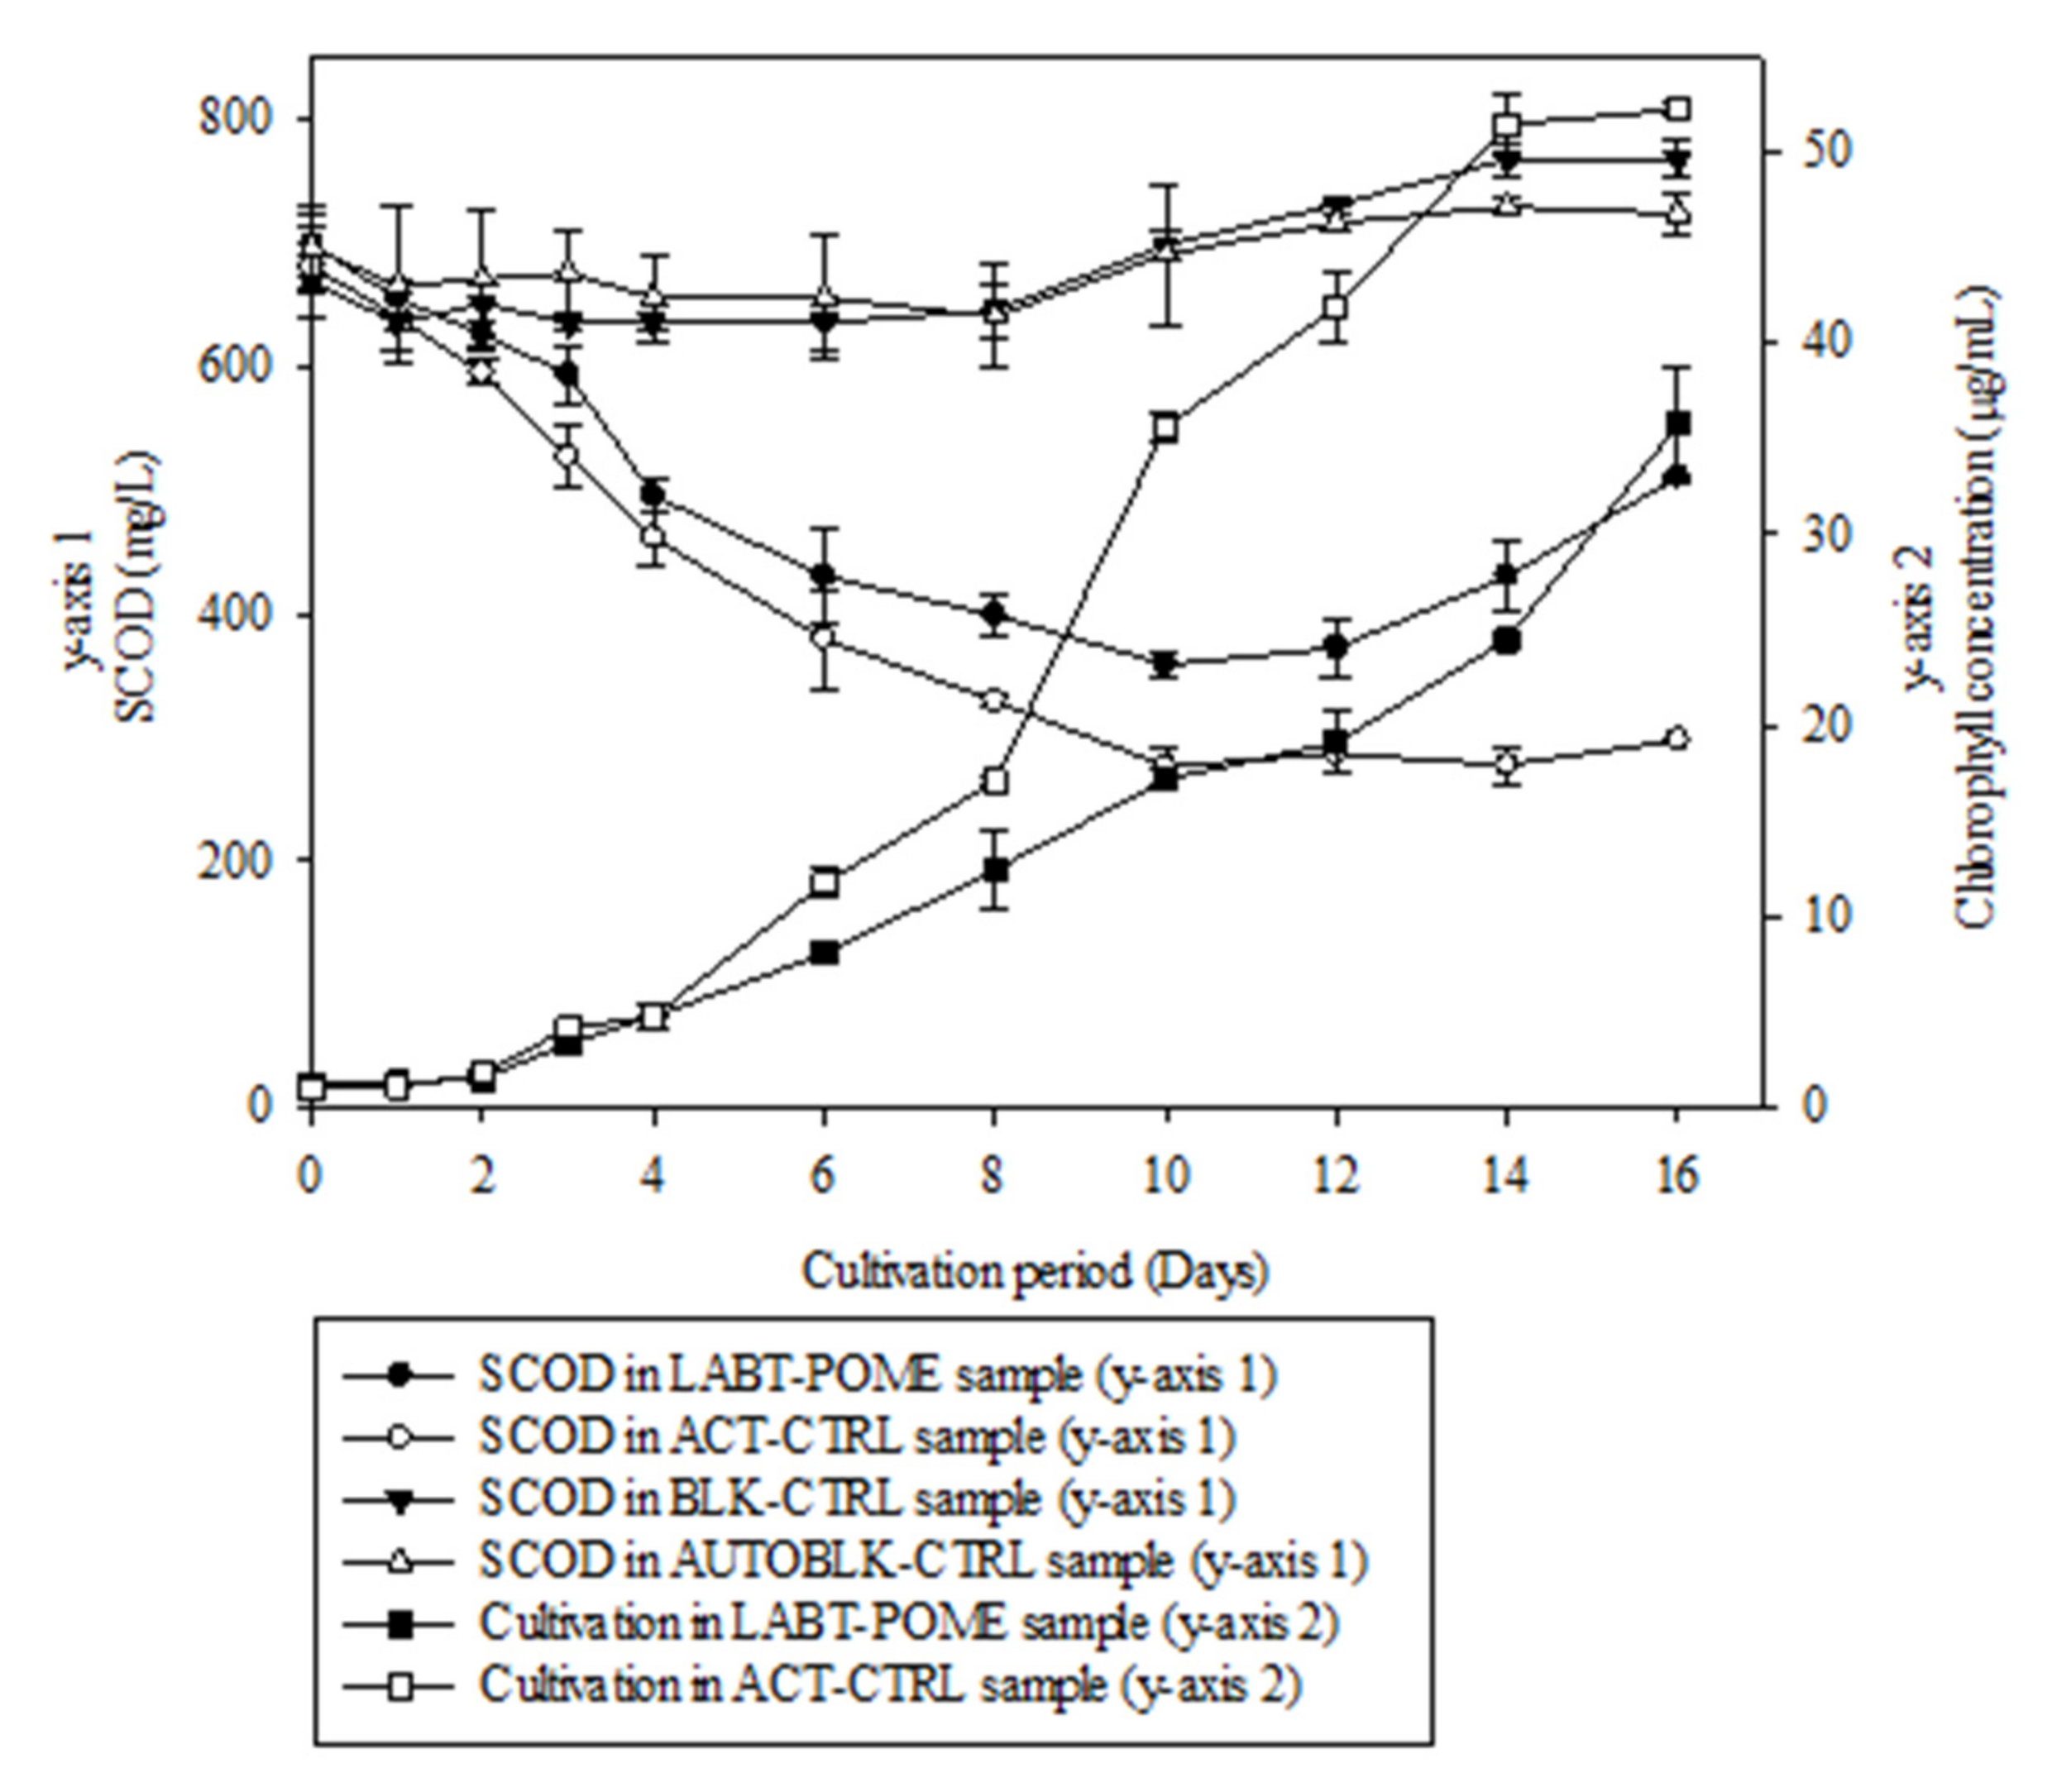
3.6. Reduction of Soluble COD (SCOD) from LABT-POME

Figure 8 shows the reduction of SCOD from LABT-POME over 16 days using immobilised cells. In the first ten days, the SCOD removal pattern is shown to be dramatically reduced. Within ten days of cultivation, immobilised cells were able to reduce SCOD by about 60%. Both the ACT-CTRL and LABT-POME samples had significantly higher SCOD concentrations after day 10. The breakdown of microalgae–alginate beads contributes to the rise in SCOD. After the degradation of the beads, some functional groups such as the carboxyl in alginate can contribute SCOD into the LABT-POME [29]. Hence, the SCOD curve showed a slight increase over the cultivation period. The 60% removal is lower than the 70% removal by Nannochloropsis sp. microalgae [4]. However, the POME used by Emparan et al., 2020, [4] was filtered or diluted. In contrast, the raw POME used in the present study was not diluted but pre-treated using two-stage, anaerobic and aerobic, lab-scale treatment. Therefore, considering the dilution factor, the total COD removal in this study was higher than that of Emparan et al., 2020, [4]. Therefore if this lab-scale treatment can be upscaled, it can be used to treat POME directly, without dilution.
The SigmaPlot®12.5 programme was used to adapt the growth data for immobilised cells to the Verhulst logistic model. The kinetic model coefficients are shown in Table 6. The data fitting curves to the Verhulst logistic model are shown in Figure 9. For growth in immobilised form, the p-value was less than 0.05. Both systems had an r2 of 0.99. As a result, the Verhulst logistic model was accurate in describing the growth of immobilised cells. Similar to Azlin Suhaida et al.’s (2018) research work, the microalgae growth was also well fitted with the Verhulst logistic model [31]. The growth rate of immobilised cells was 0.4867 d−1. The high growth rate of immobilised cells could be because cells are protected from being consumed by other microorganisms in POME. Therefore, the maximum chlorophyll-a concentration, Xm obtained from immobilised cells at the stationary state, was 36.9460 μg/mL.

4. Conclusions

The findings of this report suggest that immobilised C. oleofaciens showed good performance in reducing or extracting substrates (TN, ammonia nitrogen, TP, and SCOD) from POME samples. Furthermore, the growth of the immobilised cells was well suited by the Verhulst logistical model, with r2 values of >0.95, indicating the model’s suitability in modelling growth. One of the traditional methods for separating microalgae from treated wastewater used in this study was the immobilisation of microalgae. However, one of the key challenges in the post-treatment of POME in the industry is the deterioration of the beads. As a result, future research should look into the strength of the beads to find longer-lasting beads for POME phycoremediation.

Author Contributions

Conceptualisation, K.A.T., J.L., N.M., N.I. and W.M.W.O.; writing—original draft preparation, K.A.T.; writing—review and editing, J.L., M.A.K., M.S. and M.R.; supervision, J.L., N.M., N.I., W.M.W.O. and M.R.; funding acquisition, M.A.K., M.S. and M.R. All authors have read and agreed to the published version of the manuscript.

Funding

Moonis Ali Khan acknowledge the financial support through the Researchers Supporting Project number (RSP-2021/345), King Saud University, Riyadh, Saudi Arabia, and Japareng Lalung acknowledge the financial support from Universiti Sains Malaysia in the form of Research University Grant No. 1001/PTEKIND/811253. The APC was funded by Universiti Sains Malaysia, Malaysia.

Institutional Review Board Statement

Not applicable.

Informed Consent Statement

Not applicable.

Data Availability Statement

The data presented in this study are available on request from the corresponding author.

Acknowledgments

Moonis Ali Khan acknowledge the financial support through the Researchers Supporting Project number (RSP-2021/345), King Saud University, Riyadh, Saudi Arabia, and Japareng Lalung acknowledge the financial support from Universiti Sains Malaysia in the form of Research University Grant No. 1001/PTEKIND/811253.

Conflicts of Interest

The authors declare no conflict of interest.

References

  1. Parthasarathy, S.; Mohammed, R.R.; Fong, C.M.; Gomes, R.L.; Manickam, S. A novel hybrid approach of activated carbon and ultrasound cavitation for the intensification of palm oil mill effluent (POME) polishing. J. Clean. Prod. 2016, 112, 1218–1226. [Google Scholar] [CrossRef] [Green Version]
  2. Ahmad, A.; Buang, A.; Bhat, A.H. Renewable and sustainable bioenergy production from microalgal co-cultivation with palm oil mill effluent (POME): A review. Renew. Sustain. Energy Rev. 2016, 65, 214–234. [Google Scholar] [CrossRef]
  3. EQA. Environmental Quality Act (Prescribed Premises) (Crude Palm Oil) Regulations; Department of Environment: Putrajaya, Malaysia, 1974; Volume 93. [Google Scholar]
  4. Emparan, Q.; Jye, Y.S.; Danquah, M.K.; Harun, R. Cultivation of Nannochloropsis sp. microalgae in palm oil mill effluent (POME) media for phycoremediation and biomass production: Effect of microalgae cells with and without beads. J. Water Process. Eng. 2020, 33, 101043. [Google Scholar]
  5. Zulfahmi, I.; Ravika, N.; Feizia, H.; Lina, R.; Muliari, M.; Kizar, A.S.; Mohammad, M.R. Phytoremediation of Palm Oil Mill Effluent (POME) Using Water Spinach (Ipomoea Aquatica Forsk). Environ. Technol. Innov. 2021, 21, 101260. [Google Scholar] [CrossRef]
  6. Ahmad, A.; Krimly, M.Z. Palm oil mill effluent treatment process evaluation and fate of priority components in an open and closed digestion system. Curr. World Environ. 2014, 9, 321–330. [Google Scholar] [CrossRef] [Green Version]
  7. Wu, T.Y.; Mohammad, A.W.; Jahim, J.M.; Anuar, N. Pollution control technologies for the treatment of palm oil mill effluent (POME) through end-of-pipe processes. J. Environ. Manag. 2010, 91, 1467–1490. [Google Scholar] [CrossRef]
  8. Delrue, F.; Álvarez-Díaz, P.D.; Fon-Sing, S.; Fleury, G.; Sassi, J.-F. The Environmental Biorefinery: Using Microalgae to Remediate Wastewater, a Win-Win Paradigm. Energies 2016, 9, 132. [Google Scholar] [CrossRef]
  9. Goswami, R.K.; Mehariya, S.; Verma, P.; Lavecchia, R.; Zuorro, A. Microalgae-based biorefineries for sustainable resource recovery from wastewater. J. Water Process. Eng. 2021, 40, 101747. [Google Scholar] [CrossRef]
  10. Mehariya, S.; Fratini, F.; Lavecchia, R.; Zuorro, A. Green extraction of value-added compounds form microalgae: A short review on natural deep eutectic solvents (NaDES) and related pre-treatments. J. Environ. Chem. Eng. 2021, 9, 105989. [Google Scholar] [CrossRef]
  11. Ding, G.T.; Yaakob, Z.; Takkriff, M.S.; Salihon, J.; Rahaman, M.S.A. Biomass production and nutrients removal by a newly-isolated microalgal strain Chlamydomonas sp in palm oil mill effluent (POME). Int. J. Hydrogen Energy 2016, 41, 4888–4895. [Google Scholar] [CrossRef]
  12. Khalid, A.A.H.; Yaakob, Z.; Abdullah, S.R.S.; Takriff, M.S. Growth improvement and metabolic profiling of native and commercial Chlorella sorokiniana strains acclimatised in recycled agricultural wastewater. Bioresour. Technol. 2016, 247, 930–939. [Google Scholar] [CrossRef]
  13. Nur, M.M.A.; Setyoningrum, T.M.; Budiaman, I.G.S. Potency of Botryococcus braunii cultivated on palm oil mill effluent (POME) wastewater as the source of biofuel. Environ. Eng. Res. 2018, 22, 1–8. [Google Scholar]
  14. Babu, A.; Katam, K.; Gundupalli, M.P.; Bhattacharyya, D. Nutrient removal from wastewater using microalgae: A kinetic evaluation and lipid analysis. Water Environ. Res. 2018, 90, 520–529. [Google Scholar] [CrossRef]
  15. Kayombo, S.; Mbwette, T.S.A.; Katima, J.H.Y.; Jorgensen, S.E. Effects of substrate concentrations on the growth of heterotrophic bacteria and algae in secondary facultative ponds. Water Res. 2003, 37, 2937–2943. [Google Scholar] [CrossRef]
  16. Sanchez-Galvis, E.M.; Cardenas-Gutierrez, I.Y.; Contreras-Ropero, J.E.; Garcia-Martinez, J.B.; Barajas-Solano, A.F.; Zuorro, A. An innovative low-cost equipment for electro-concentration of microalgal biomass. Appl.Sci. 2020, 10, 4841. [Google Scholar] [CrossRef]
  17. Richmond, A. Handbook of Microalgal Culture: Biotechnology and Applied Phycology; John Wiley & Sons: Hoboken, NJ, USA, 2008. [Google Scholar]
  18. Bellinger, E.G.; Sigee, D.C. Freshwater Algae: Identification, Enumeration and Use as Bioindicators; John Wiley & Sons. Ltd.: Chichester, UK, 2015. [Google Scholar]
  19. Glauert, A.M. Fixation, Dehydration and Embedding of Biological Specimens. In Practical Methods in Electron Microscopy; Elsevier Science: Amsterdam, The Netherlands, 1984. [Google Scholar]
  20. Fiera, C. Detection of food in the gut content of Heteromurusnitidus (Hexapoda:Collembola) by DNA/PCR-based molecular analysis. North-West. J. Zool. 2014, 10, 67–73. [Google Scholar]
  21. Ruiz-Güereca, D.A.; Sánchez-Saavedra, M.d.P. Growth and phosphorus removal by Synechococcus elongatus co-immobilized in alginate beads with Azospirillum brasilense. J. Appl. Phycol. 2016, 28, 1501–1507. [Google Scholar] [CrossRef]
  22. Ritchie, R.J. Consistent Sets of Spectrophotometric Chlorophyll Equations for Acetone, Methanol and Ethanol Solvents. Photosynth. Res. 2006, 89, 27–41. [Google Scholar] [CrossRef] [PubMed]
  23. Delgadillo-Mirquez, L.; Lopes, F.; Taidi, B.; Pareau, D. Nitrogen and phosphate removal from wastewater with a mixed microalgae and bacteria culture. Biotechnol. Rep. 2016, 11, 18–26. [Google Scholar] [CrossRef]
  24. Ermis, H.; Altınbaş, M. Determination of biokinetic coefficients for nutrient removal from anaerobic liquid digestate by mixed microalgae. Environ. Boil. Fishes 2018, 31, 1773–1781. [Google Scholar] [CrossRef]
  25. Peleg, M.; Corradini, M.; Normand, M.D. The logistic (Verhulst) model for sigmoid microbial growth curves revisited. Food Res. Int. 2007, 40, 808–818. [Google Scholar] [CrossRef]
  26. Banerjee, S.; Balakdas Tiwade, P.; Sambhav, K.; Banerjee, C.; Kumar Bhaumik, S. Effect of alginate concentration in wastewater nutrient removal using alginate-immobilised microalgae beads: Uptake kinetics and adsorption studies. Biochem. Eng. J. 2019, 149, 1–12. [Google Scholar] [CrossRef]
  27. de-Bashan, L.E.; Bashan, Y. Immobilised microalgae for removing pollutants: Review of practical aspects. Bioresour. Technol. 2010, 101, 1611–1627. [Google Scholar] [CrossRef]
  28. Aguilar-May, B.; del Pilar Sánchez-Saavedra, M.; Lizardi, J.; Voltolina, D. Growth of Synechococcus sp. immobilised in chitosan with different times of contact with NaOH. J. Appl. Phycol. 2007, 19, 181–183. [Google Scholar]
  29. Bajpai, S.; Sharma, S. Investigation of swelling/degradation behaviour of alginate beads crosslinked with Ca2+ and Ba2+ ions. React. Funct. Polym. 2004, 59, 129–140. [Google Scholar] [CrossRef]
  30. Liu, K.; Li, J.; Qiao, H.; Lin, A.; Wang, G. Immobilisation of Chlorella sorokiniana GXNN 01 in alginate for removal of N and P from synthetic wastewater. Bioresour. Technol. 2012, 114, 26–32. [Google Scholar] [CrossRef] [PubMed]
  31. Azlin Suhaida, A.; Nurain Atikah Che, A.; Noor Illi Mohamad, P.; Amanatuzzakiah Abdul, H.; Faridah, Y.; Suzana, Y. Chlorella vulgaris logistic growth kinetics model in high concentrations of aqueous ammonia. IIUM Eng. J. 2018, 19, 1–9. [Google Scholar]
Figure 1. A polishing pond in a palm oil mill located in Nibong Tebal, Penang, from where the green microalgae were collected.
Sustainability 13 11562 g001
Figure 2. Experimental work for microalgae beads preparation.
Sustainability 13 11562 g002
Figure 3. The product of (a) microalgae–alginate beads and (b) blank alginate beads.
Sustainability 13 11562 g003aSustainability 13 11562 g003b
Figure 4. Hardness of microalgae–alginate beads prepared from different volume ratio pairs of microalgae–alginate to calcium chloride.
Sustainability 13 11562 g004
Figure 5. Average chlorophyll-a concentration of immobilised C. oleofaciens in LABT-POME.
Sustainability 13 11562 g005
Figure 6. Removal of total phosphorus from LABT-POME using immobilised C. oleofaciens.
Sustainability 13 11562 g006
Figure 7. Removal of (a) total nitrogen and (b) ammonia nitrogen from LABT-POME using immobilised C. oleofaciens.
Sustainability 13 11562 g007
Figure 8. Reduction of SCOD from LABT-POME using immobilised C. oleofaciens.
Sustainability 13 11562 g008
Figure 9. Fits of the normalised logistic model to the relative reproductive rates of immobilised C. oleofaciens.
Sustainability 13 11562 g009
Table 1. The Bold’s Basal Medium (BBM) composition.
Reagent Aper 400 mL
NaNO310.00 g
MgSO4.7H2O3.00 g
K2HPO44.00 g
NaCl1.00 g
KH2PO46.00 g
CaCl21.00 g
Microelement Stock Solution *Per 1 L
ZnSO48.82 g
MoO30.71 g
Co(NO3)2.6H2O0.49 g
MnCl21.44 g
CuSO4.5H2O1.57 g
Solution 1per 100 mL
H3BO41.14 g
Solution 2per 100 mL
EDTA.Na25.00 g
KOH3.10 g
Solution 3per 100 mL
FeSO4.7H2O4.98 g
HCl (Concentrated)1.00 mL
* autoclave to dissolve before storage.
Table 2. Primer combination, target gene, and PCR protocols used in the present study.
Target GenePrimer (5′ → 3)ProtocolReference
ChloroccocumForward primer
CLO-GEN-S3
(GCATGGAATMRCACGATAGGACTC)

Reverse primer
CLO-GEN-A4
(CGGCATCGTTTATGGTTGGTTGAGACTAC)
Initial: 15 min (95 °C)
Denaturation: 30 s (94 °C)
Annealing: 90 s (63 °C)
Extension: 90 s (72 °C)
Elongation: 10 min (72 °C)

Total runs: 35 cycles
[20]
Table 3. The morphological characteristics of the green microalgae species viewed under light and scanning electron microscopy.
Microscopic Image
(40× Magnification)
SEM ImageCell Size (μm)Visible CharacteristicsPossible Genus
Sustainability 13 11562 i001 Sustainability 13 11562 i00210–12green in colour, sphere-shaped cells, contain numerous sac-like organellesChlorococcum sp.
Table 4. The DNA sequence identification for the green microalgae species.
NCBI BLAST System ResultThe most Possible Species
Sustainability 13 11562 i003C. oleofaciens
Table 5. Comparison of the strength of microalgae–alginate beads and chlorophyll-a of C. oleofaciens before and after cultivation in LABT-POME.
Microalgae–Alginate:CaCl2
(% conc.:% conc.)
Initial Diameter of Beads (mm)Diameter of Beads after 10 Days (mm)Initial Chlorophyll-a (μg/mL)Chlorophyll-a after 10 Days (μg/mL)
2:23.5 ± 0.051.2 ± 0.030.5015.881
2:43.3 ± 0.051.8 ± 0.050.4935.679
2:63.5 ± 0.032.0 ± 0.070.5125.654
4:23.3 ± 0.052.5 ± 0.080.5025.021
4:43.4 ± 0.023.0 ± 0.060.4954.978
4:63.5 ± 0.023.1 ± 0.020.5224.889
6:23.3 ± 0.033.1 ± 0.090.5062.899
6:43.4 ± 0.043.3 ± 0.010.4832.333
6:63.5 ± 0.013.4 ± 0.010.5172.309
Table 6. Values of kinetic coefficients.
MicroalgaeXo (μg/mL)Xm (μg/mL)μ (d−1)r2p-Value
Immobilised C. oleofaciens0.703436.94600.48670.9887<0.0001
Publisher’s Note: MDPI stays neutral with regard to jurisdictional claims in published maps and institutional affiliations.

